Submitted:
01 April 2025
Posted:
01 April 2025
You are already at the latest version
Abstract
Medicinal plants hold great potential for the development of drugs to treat inflammatory diseases. Bixa orellana L, popularly known as “annatto” or “urucum”, stands out among various species. The Zebrafish (Danio rerio) is a small tropical freshwater fish which, due to its experimental attributes, has been highlighted as an experimental model in pharmacological and toxicological tests of new drugs. This study aims to evaluate the acute toxicological effects and anti-inflammatory activity of the injectable nanodispersion of Bixa orellana (NBO, Chronic In®) in zebrafish. The stability of the NBO was assessed with an average particle size ranging from 53.15 ± 0.64 nm to 59.90 ± 3.63 nm. The acute toxicity study used intraperitoneal doses of NBO ranging from 250 to 1500 mg/kg. The results showed significant toxic effects at doses of 750, 1000, and 1500 mg/kg with histopathological changes in the liver, kidneys, and intestine. The 50% lethal dose (LD50) calculation corresponded to 830.6 mg/kg. In silico tests suggest that the detected toxicity mechanism may be related to the inhibition of the cardiac potassium channel (hERG II) and/or the inhibition of the TNF tumor necrosis factor receptor-associated protein 1 (TRAP1). In the anti-inflammatory evaluation of NBO in a model of intraperitoneal edema induced by carrageenan in Zebrafish, a significant anti-inflammatory effect was observed at doses of 20 and 40 mg/kg (i.p), without significant histopathological alterations in the organs evaluated. In summary, NBO has an anti-inflammatory effect at low doses and demonstrated that doses of NBO ranging from 500 to 1500 mg/kg applied intraperitoneally were unsafe and showed toxic effects and lethality as the dose increased.
Keywords:
Bixa orellana
; Anatto
; Nanotechnology
; Zebrafish
1. Introduction
Inflammation is an organism’s defense mechanism that stimulates chemical mediators at the injury site. It is characterized by altered blood flow, vasodilatation, vascular permeability, and leukocyte recruitment, which result in clinical signs and symptoms such as pain, edema, hyperemia, and tissue dysfunction [1,2].
Medicinal plants hold significant potential for the development of medicines to treat inflammatory diseases. Among the various species, Bixa orellana L., commonly known as “urucum” or “annatto”, is a plant native to Brazil and certain regions of South and Central America [3,4]. Studies have proven its anti-inflammatory activity, and it has already been demonstrated that the presence of compounds such as bixin, tocotrienols, and geranylgeraniol contributes to its anti-inflammatory properties in the oil extracted from this species [5,6]. Tocotrienols are unsaturated forms of vitamin E and have potent anti-inflammatory and antioxidant activity [7].
The Zebrafish (Danio rerio) is a small tropical freshwater fish that, due to its experimental attributes, for example, small size, low cost, treatability, and genetics, has stood out as an experimental model in pharmacological and toxicological tests of new drugs [8,9]. This makes it suitable for validating new nanoformulated drugs from bioactive natural products with therapeutic potential [10].
Nanodispersions are pharmaceutical forms whose main characteristics are reduced particle size on nanometric scales, better bioavailability, decreased dose, and increased therapeutic effect. These characteristics favor their use as a treatment and reduce the possibility of causing toxicity [11].
Therefore, it is necessary to carry out studies that prove the pharmacological and toxicological activities of medicinal plants and their formulations so that it is possible to use their therapeutic properties. In this context, this study aimed to evaluate the acute toxicological and anti-inflammatory effects of the injectable nanodispersion of Bixa orellana oil (Chronic In®) in zebrafish (Danio rerio).
2. Materials and Methods
2.1. Bixa orellana Oil Obtainment and Chemical Analysis
B. orellana oil (Chronic®) was supplied by Ages Bioactive Compounds Co., batch 0012/2022. For the chemical analysis, δ-tocotrienol was dosed using a stock solution of δ-tocotrienol prepared in hexane (Sigma-Aldrich, MKCF5755, CG grade, Germany) at a concentration of 10 mg/mL. From this stock solution, other solutions were ready to build an analytical curve with concentrations of 2.5 mg/mL, 1.0 mg/mL, 0.5 mg/mL, 0.25 mg/mL, and 0.1 mg/mL. The analyses were performed using a gas chromatograph coupled to a mass spectrometer (GC-MS), following the methodology previously described by Rodrigues et al. [12].
2.2. Obtaining Polymeric Nanoparticles Containing Bixa orellana Oil
The nanoprecipitation method, adapted from Carvalho et al. [11], was used to synthesize a nanoparticulate polymeric system containing OPBO. For a final volume of 20 mL of nanodispersion (NBO), the following components were used: 1% purified Bixa orellana oil, 2% polyethylene glycol 4000 (PEG 4000), 2% Tween 80, 25% absolute ethanol, and 70% water for injections.
The organic phase was first prepared by solubilizing the OPBO and PEG 4000 in absolute ethanol. The mixture was stirred using a magnetic stirrer at 800 rpm for 20 minutes. The aqueous phase was prepared by solubilizing Tween 80 in water and stirring for 20 minutes. The organic phase was poured over the aqueous phase under agitation in a mechanical stirrer (Fisatom, SP, Brazil) for 20 minutes. After preparation, the nanodispersion obtained was filled into vials and subjected to characterization. The nanodispersion obtained was packaged into ampoules for injections and subjected to characterization.
2.3. Characterization of B. orellana Nanodispersion (NBO)
The nanodispersion was characterized on the day of preparation and after 7 and 30 days for stability purposes. The visual aspect, phase separation, and sedimentation were evaluated macroscopically. The particle size, polydispersity index, and Zeta potential were assessed in triplicate following the methodology described by Borges et al. [13] using Zeta-Sizer equipment (Malvern Pan-Analytics, England).
2.4. pkCSM: Predicting Small-Molecule Pharmacokinetic and Toxicity Properties
The pkCSM platform was utilized to evaluate the pharmacokinetic and physicochemical characteristics of the therapeutic compound δ-tocotrienol. The SMILES notation for δ-tocotrienol was obtained from the PubChem database and input into the pkCSM tool. Based on the compound’s molecular structure, this allowed for predicting various properties, including absorption, solubility, distribution, metabolism, excretion, and toxicity [14].
2.5. Molecular Docking
Protein receptors were obtained from the Protein Data Bank. Using Molegro software, the crystal structures of the target receptors were pre-processed by removing ions, water molecules, and existing ligands. The receptor molecules were then modified by adding hydrogen atoms through Autodock Vina and saved in pdbqt format. ChemDraw was utilized to minimize each compound and convert them into mol2 format, which was subsequently converted into pdb format using Molegro. The compounds were then converted into pdbqt format using AutoDock tools. Ligand-centered maps were generated with AutoGrid, using a grid size of 90 Å × 90 Å × 90 Å. All other parameters were set to their default values. AutoGrid and AutoDock Vina were employed to construct the grid maps, and Discovery Studio 4.5 software was utilized to analyze the 2D interactions between the compounds and target receptors [15,16]. This study evaluated the interaction of zebrafish TNF tumor necrosis factor receptor-associated protein 1 (TRAP1) (PDB ID: 6D14 at 2.50 Å resolution) with the ligand δ-tocotrienol.
2.6. Density Functional Theory (DFT) Computational Analysis
Density Functional Theory (DFT) calculations were performed using the B3LYP functional with the 6-311G(d,p) basis set. This approach was applied to study the properties of δ-tocotrienol. The B3LYP method is widely recognized for its cost-effectiveness and reliability in predicting the geometries of both natural and synthetic molecules in quantum chemistry. All computations were done using the GAUSSIAN 09W software package, and the optimized molecular structures were visualized with GaussView 6.0 [17].
2.7. Non-Covalent Interaction Analysis (NCI)
The natural bond orbital (NBO) calculations were performed at the same level of theory using the NBO program 3.1 embedded in Gaussian. A visual study of the non-covalent interaction (NCI) was achieved using a combination of Multiwfn, visual molecular dynamics (VMD), and Gnuplot programs [18].
2.8. Animals and Ethical Aspects
This study was submitted to the Animal Use Ethics Committee of the Federal University of Amapá (CEUA-UNIFAP) and was approved under Protocol No. 001/2023. The experiment used zebrafish, Danio rerio, of the Wild strain, six months old, measuring between 3.5-4.0 cm in length, weighing 400-600 mg, purchased from Aqua New Aquários e Peixes Co. ME (PE, Brazil), kept in the Zebrafish Platform of the Drug Research Laboratory at the Federal University of Amapá - UNIFAP, Amapá, Brazil. The animals were kept in water under controlled conditions of temperature, feeding, and light/dark cycle.
2.9. Acute Toxicity Study and Determination of LD50
To perform the acute toxicity tests, the animals were randomly divided into five experimental groups of eight animals and fasted for 24 hours before the treatments commenced. Subsequently, intraperitoneal doses of 250 mg/kg, 500 mg/kg, 750 mg/kg, 1000 mg/kg, and 1500 mg/kg of Bixa orellana Nanodispersion (Chronic In®) were administered. After administration, the animals were kept in isolated aquariums to observe behavioral parameters. To determine the 50% lethal dose (LD50), the number of deaths in each group was counted according to the dose administered, following the methodology described by Santos et al. [19].
2.10. Behavioral and Mortality Analysis
The behavior and mortality of the animals were evaluated according to the parameters described by Souza et al. (2016) at 1 hour, 3 hours, 9 hours, 24 hours, and 48 hours after treatment. Behavioral reactions were characterized in three stages: Stage I: 1) increase in swimming activity and 2) tail axis tremors; Stage II: 1) Circular swimming and 2) Posture loss; Stage III: 1) Motility loss; 2) Deposition at the bottom of the aquarium and 3) Death. Mortality was assessed continuously, and the fish were considered dead when the movement of the operculum and the response to mechanical stimulation could no longer be detected. After toxicity testing, all surviving fish were euthanized.
2.11. Edema Induction by Carrageenan and Experimental Design
Edema was induced in adult zebrafish following the method described by Borges et al. [13]. The animals were individually anesthetized with cooled water (8-10 °C) for approximately 3 minutes, then 20 μL of 1% kappa carrageenan solution (Sigma Co., Lot 16HO616) in PBS was applied intraperitoneally. All animals were weighed individually on an analytical scale before edema induction and 5 hours after carrageenan application to assess their final weight. Following euthanasia, a histopathological study was conducted.
The animals were randomly divided into six experimental groups (n = 12/group), treated intraperitoneally, and edema was induced 1 hour after treatment.
The following groups were chosen: CON Group - PBS solution (20 µl) and distilled water (20 µl); DCF Group - Injectable diclofenac 25 mg/kg; VEH Group - Nanodispersion vehicle 20 µl (2% polyethylene glycol 4000 (PEG 4000), 2% Tween 80, 25% absolute ethanol and 70% water for injections) (20 µl); NBO 10 Group - B. orellana nanodispersion 10 mg/kg; NBO 20 Group - B. orellana nanodispersion 20 mg/kg; NBO 40 Group - B. orellana nanodispersion 40 mg/kg.
2.12. Organ Preparation for Histopathological Analysis
After the tests, histopathological analysis was conducted on the animals’ organs for toxicity (liver, intestine, and kidneys) and edema (liver and kidneys). The animals were stored in labeled cassettes and immediately fixed in Bouin’s solution. Decalcification was then performed in a 7% EDTA solution for 48 hours. The material was dehydrated in increasing concentrations of ethyl alcohol, diaphanized in xylene, and embedded in paraffin (Inlab). Histological sections were then obtained at a thickness of 5 µm using a microtome (SLEE Medical) and stained with Hematoxylin and Eosin. The analysis was conducted under an optical microscope (Olympus BX41-Micronal Microscope) [20].
2.12.1. Evaluation of Histopathological Changes in the Toxicity Test
The histopathological alterations index (HAI) was determined by the extent of tissue alterations observed in the liver, intestine, and kidneys. The alterations can be classified into stages I, II, and III. The HAI value indicates whether the organ is healthy (0 to 10), has mild to moderate alterations (11 to 20), moderate to severe alterations (21 and 50), or contains irreversible alterations (> 100) [21,22]. Thus, the indices were calculated according to the following equation:
where: a: first stage alterations; b: second stage alterations; c: third stage alterations; na: number of alterations considered as the first stage; nb: number of alterations considered as the second stage; nc: number of alterations considered as the third stage; N: number of fishes analyzed per treatment.
2.12.2. Statistical Analysis
Data were expressed as the mean ± standard error of the mean for each experimental group. For statistical analysis of the results obtained, GraphPad Prism (version 7.0) was used. ANOVA (one-way) was applied, followed by the Tukey-Kramer test to compare the means between the treated animals and the control groups, with significant values set at p < 0.05.
3. Results
3.1. Characterization of the Nanoformulation Obtained from B. orellana Oil (NBO)
As analyzed by gas chromatography, the chromatogram (Figure 1) enabled the integration of the peak corresponding to δ-tocotrienol (C27H40O2), with a retention time of 28.6 minutes. The average concentration of δ-tocotrienol was 0.725 ± 0.062 mg/mL (72.0 ± 1.0%), calculated from the straight-line equation obtained for δ-tocotrienol at various concentrations. The result of the linearity coefficient (R²) was 0.9973, and the resulting straight-line equation was y = 8.30 × 10⁶ x - 2.818 × 10⁶.
The nanoprecipitation method, adapted from Carvalho et al. [11], was used to prepare a nanoparticulate formulation containing OPBO. In this method, no visual changes related to loss of stability were observed over the evaluation period. The formulation showed no phase separation or precipitation of components, demonstrating a visibly stable appearance, a slightly yellowish color, and a pH of 5.8.
In this study, the average size of the nanoparticles obtained was stable, 53.15 ± 0.64 nm, with a PDI of 0.574 ± 0.032 on the first day. On the 30th day, 59.90 ± 3.63 nm was observed with a PDI of 0.574 ± 0.032. Additionally, the nanoformulation exhibited a zeta potential of 19.86 ± 0.60 mV on day zero and 19.66 ± 1.45 mV on the 30th day of analysis (Table 1).
3.2. In Silico Analysis pkCSM, Molecular Docking and Functional Density Theory
Table 2 provides the ADMET and toxicity profile of δ-tocotrienol, highlighting its safety and pharmacokinetic attributes (Figure 2). The predicted lethal dose (LD50) for δ-tocotrienol is 500 mg/kg, classifying it under toxicity class 4, which indicates low acute toxicity. It does not exhibit AMES toxicity, implying it is non-mutagenic. The maximum tolerated dose for humans is predicted to be 0.538 mg/kg, demonstrating its relative safety. While it does not inhibit hERG I channel, it is a known inhibitor of hERG II channels, which could have implications for cardiac safety.
Table 4 and Figure 3 present the predicted molecular interactions between δ-tocotrienol and the target protein structure TRAP1. The interactions predominantly involved hydrophobic contacts, such as alkyl and π-alkyl interactions, which are crucial for stabilizing the binding of δ-tocotrienol within the protein’s active site. Alkyl interactions were observed with residues PRO361, PRO365, and ARG400, ranging from 3.14 Å to 4.60 Å. Specific contacts included δ-tocotrienol’s C21 interacting with PRO365 at a distance of 3.14 Å and C27 interacting with MET363 at a distance of 4.33 Å. These interactions highlight key hydrophobic engagements contributing to the compound’s binding affinity.
Additionally, π-alkyl interactions were identified with aromatic residues TYR459 and PHE462, as well as MET367, at distances ranging from 4.25 Å to 4.95 Å. Multiple π-alkyl contacts were observed between PHE462 and various regions of δ-tocotrienol, underlining the aromatic ring’s role in stabilizing the binding. These findings underline δ-tocotrienol’s potential for binding to TRAP1, driven by a combination of alkyl and π-alkyl interactions. This makes it a promising candidate for further therapeutic exploration targeting this protein.
The Density Functional Theory (DFT) analysis of δ-tocotrienol provides insight into its electronic properties, as summarized in Table 5. The energy of the highest occupied molecular orbital (EHOMO) is -0.1923 eV, indicating its ability to donate electrons. The lowest unoccupied molecular orbital energy (ELUMO) is 0.0051 eV, reflecting its potential to accept electrons. The energy gap (ΔE) between these orbitals is 0.1974 eV, indicating a balance between the molecule’s stability and reactivity (Figure 4).
3.3. Evaluation of Acute Toxicological Effects and LD50 in Zebrafish
In the acute toxicity test, the animals were administered different doses of the injectable nanodispersion of Bixa orellana oil (Chronic-In) via intraperitoneal injection. They showed behavioral alterations classified as Stages I, II, and III. The animals were then subjected to observational screening, resulting in alterations that began with an increase in the animal’s excitability, loss of posture, and deposition of the animal at the bottom of the aquarium, ultimately leading to death.
In the toxicity assessment (Table 5), it was observed that the 250 mg/kg NBO dose did not elicit any behavioral changes indicative of toxicity. The 500 mg/kg dose resulted in 2 deaths within 48 hours of treatment. In contrast, the animals treated with the 750 mg/kg dose exhibited stage II and III behaviors, as well as mortality, within less than 24 hours of administration. For the high dosages of 1000 and 1500 mg/kg of NBO, the evolution of all stages was noticeable in a short period and resulted in significant mortality within 3 hours of evaluation.
In the histopathological evaluation of the animals submitted to the toxicity test, the liver, kidneys, and intestines were analyzed (Figure 6). In the assessment of the liver, it was observed that with increasing doses, there was an increase in alterations, especially in the groups treated with doses of 750, 1000, and 1500 mg/kg, which showed significant nuclear degeneration, cytoplasmic degeneration, nuclear atrophy, and tissue necrosis. In the other organs, alterations were evident at doses above 750 mg/kg, such as in the photomicrographs of the kidneys, where leukocyte infiltration, tubular degeneration, and tissue necrosis were observed. Photomicrographs of the zebrafish intestine revealed alterations, including goblet cell hypertrophy, displacement of the lamina propria, and villous degeneration.
In the determination of the histological alteration index (Figure 7) of the liver, kidney, and intestine organs of zebrafish exposed to treatments with 250, 500, 750, 1000, and 1500 mg/kg of NBO (Chronic in®), a significant increase in histological damage (p < 0.01) was observed in the organs evaluated from the 750 mg/kg dose with an index of moderate alterations (11-20) in both the liver, kidneys and intestine. For the 1000 and 1500 mg/kg doses, mild to severe alterations were observed (21-50), with highly significant values (p < 0.001) concerning the groups with lower doses (250 and 500 mg/kg), indicating a correlation between the higher the dose and the greater the histopathological damage.
When determining the 50% lethal dose (LD50), the percentage of dead animals was evaluated in relation to the increasing doses of NBO (Figure 8). It was observed that deaths occurred as the administered dose increased. Thus, 100% lethality of the animals was observed in the group receiving a dose of 1500 mg/kg within a maximum of 1 hour. 1000, 750, and 500 mg/kg doses showed deaths between 3 and 48 hours, with a lethality rate of 75%, 37.5%, and 25%, respectively.
Based on the analysis of the data using linear regression (Figure 8) and obtaining the straight-line equation y = 0.08176x - 17.91, it was possible to determine the LD50, which has a value of 830.6 mg/kg, representing the dose that kills 50% of the animal population.
3.4. Anti-Inflammatory Activity of Bixa orellana Nanodispersion Oil
The inflammation study evaluated the evolution of edema (Figure 9 and Figure 10). In the negative control group treated with NBO vehicle (VEH), there was intense edema during the evaluation period. On the other hand, in the groups treated with doses of NBO, a significant reduction (p < 0.001) in edema was observed in the groups treated with 20 and 40 mg/kg, as well as in the group treated with diclofenac 25 mg/kg (DCF). In the control group treated with PBS solution, it was impossible to observe edema formation, as no carrageenan was administered, and the animals remained stable throughout treatment. Regarding the percentage of edema inhibition, it was observed that the DCF group showed the highest rate of inhibition, with 68.42 ± 6%. The groups treated with NBO at 20 and 40 mg/kg showed inhibition percentages of 59.0% and 58.5%, respectively. However, in the group treated with NBO at 10 mg/kg, no inhibition more significant than 10% was observed.
3.5. Histological Evaluation of the Organs of Animals Submitted to the Inflammation Test
In the histopathology evaluation of the animals submitted to the inflammation test, the liver and kidneys were analyzed to assess the possibility of tissue alterations. In the analysis of the liver (Figure 11), all the groups analyzed showed structural aspects within the normal range; no tissue conditions indicated toxicity or damage. Normal hepatocytes were observed, some with cytoplasmic vacuolization and increased hyperemia (blood vessels).
In evaluating the renal histopathology of the Zebrafish (Figure 12), the kidneys showed few alterations, with normal renal tubules, except for the VEH group, which exhibited intense leukocyte infiltration, tissue damage, and tubular degeneration. In the groups treated with NBO at 10 and 20 mg/kg, a slight leukocyte infiltrate was observed, with no tissue damage, except in the NBO 40 mg/kg group, which showed slight tubular damage and a leukocyte infiltrate.
4. Discussion
The present study demonstrates that the injectable nanodispersion of Bixa orellana oil (NBO) exhibits physicochemical characteristics consistent with pharmaceutical stability, notably a particle size below 60 nm, low polydispersity index, and stable zeta potential. These features align with findings by Carvalho et al. [23] and Mitchell et al. [24], who reported that nanosystems with reduced particle sizes (50–200 nm) exhibit enhanced stability, bioavailability, and reduced aggregation. The observed zeta potential values above +15 mV further support the colloidal stability of the nanodispersion, as previously indicated by Zielińska et al. [26].
The in silico pharmacokinetic and toxicity analyses of δ-tocotrienol, the major compound in NBO, revealed low acute and chronic toxicity, absence of hepatotoxicity and skin sensitization, and no AMES mutagenicity. However, the predicted inhibition of the hERG II channel raises a safety concern at high concentrations, consistent with literature that attributes potential cardiotoxicity to drugs interacting with the lipophilic hERG pore [30,31]. These results align with in vivo data demonstrating safety at lower doses and toxicity at higher concentrations.
In the acute toxicity assay, zebrafish administered with 750 mg/kg or higher doses of NBO exhibited severe behavioral alterations and histopathological lesions in the liver, kidneys, and intestines, culminating in a calculated LD50 of 830.6 mg/kg. These findings reflect organ-specific sensitivity to toxic agents, as described by Carvalho et al. [39], reinforcing the value of zebrafish as a reliable model for toxicological screening. The behavioral patterns observed—initial excitability followed by loss of posture and eventual immobility—are consistent with prior studies on zebrafish toxicity induced by phytotherapeutic compounds [19,20].
Histopathological evaluations confirmed a dose-dependent increase in tissue damage, particularly at doses of 750 mg/kg or higher. Hepatic lesions included nuclear and cytoplasmic degeneration, vascular congestion, and necrosis. Renal alterations, such as tubular degeneration and leukocyte infiltration, corroborated findings from Omar et al. [40] and Souza et al. [41], who highlighted these changes as markers of nephrotoxicity. Notably, intestinal damage, including goblet cell hypertrophy and villous degeneration, was also dose-dependent.
Interestingly, the predicted interaction between δ-tocotrienol and TRAP1, as evidenced by a moderate binding energy of -6.0 kcal/mol and an inhibition constant (Ki = 40.5 μM), suggests a possible mechanism of mitochondrial-mediated toxicity. TRAP1 is a mitochondrial heat shock protein (HSP) known for its anti-apoptotic and cytoprotective roles [35,36]. The inhibition of TRAP1, as demonstrated in studies on cancer models [37,38], can impair cellular stress responses and promote apoptosis, thereby supporting its involvement in the observed toxicity profile.
In contrast, the anti-inflammatory activity of NBO was significant at doses of 20 and 40 mg/kg, comparable to the reference drug diclofenac (25 mg/kg). This effect is consistent with earlier reports of tocotrienol-mediated downregulation of inflammatory pathways, including the inhibition of COX-2 and PLA2 [7,44,45]. Carrageenan-induced edema is mediated by pro-inflammatory mediators such as prostaglandins and histamine [41]; the inhibition of these pathways by NBO supports its therapeutic potential.
Histological analysis of liver and kidney tissues following anti-inflammatory assays confirmed the absence of significant tissue alterations at therapeutic doses. Only minor findings, such as discrete vacuolization and leukocyte infiltration, were observed, notably in the vehicle group. This supports the safety of NBO at effective anti-inflammatory concentrations.
Finally, prior studies using Bixa orellana extracts in rodents at doses of up to 4000 mg/kg have shown no acute toxicity or mortality [32,33,34], indicating a good safety margin for oral administration. However, the injectable route and nanoformulation may alter pharmacodynamics and bioavailability, which could explain the higher toxicity observed at elevated doses in the zebrafish model.
Altogether, the data supports the therapeutic potential of NBO as a low-dose anti-inflammatory agent while emphasizing the importance of dose optimization to avoid toxic effects. The zebrafish model, supported by in silico analyses, proved valuable for assessing both the efficacy and safety of this novel nanoformulation.
5. Conclusions
The results of this study demonstrate that the injectable nanodispersion of Bixa orellana (NBO) exhibits a significant anti-inflammatory effect in zebrafish, particularly at doses of 20 and 40 mg/kg, without causing relevant histopathological changes in the evaluated organs. On the other hand, doses above 500 mg/kg induced progressive acute toxicity, with behavioral alterations, histological damage in the kidneys, liver, and intestines, and a median lethal dose (LD50) estimated at 830.6 mg/kg.
In silico analyses, it suggests that the potential mechanism underlying NBO toxicity may involve the inhibition of the cardiac hERG II channel and TRAP1 protein, indicating a possible risk of adverse effects at higher doses. These findings reinforce the safety and efficacy of NBO at low doses as an anti-inflammatory agent while highlighting the pharmacological safety limits associated with its use in injectable formulations.
Therefore, this study contributes to the advancement of nanoformulated herbal medicines by providing relevant experimental evidence on the anti-inflammatory activity and toxicological profile of NBO, establishing a foundation for future preclinical and clinical studies aimed at its therapeutic application.
6. Patents
The work is part of patent BR 10 2023 006029 3 A2, “Composition, the process for obtaining polymeric nanoparticles containing Bixa orellana oil standardized in total tocotrienols, the process of the polar microparticulate system or natural microcluster, and its uses,” deposited at the National Institute of Industrial Property in Brazil.
Author Contributions
Investigation, L.P.G., N.N.D.C., H.d.O.C., B.V.M.F., V.M.V., G.d.C.F., and D.E.S.G.; formal analysis, T.M.L., and I.D.R.P.; data curation, H.R.d.S.; software, E.C.A.; conceptualization, supervision, project administration, and funding acquisition, J.C.T.C. All authors have read and agreed to the published version of the manuscript.
Funding
This project received funding from the Ages Bioactive Compounds Company via the Priority Bioeconomy Program (PPBio - Priority Project: No. 22/2024), a public policy of the Superintendence of the Manaus Free Trade Zone (Suframa) coordinated by the Institute for Conservation and Sustainable Development of the Amazon (Idesam).
Institutional Review Board Statement
The authors followed the legislation guidelines for animal experimentation established by the National Council for Animal Experimentation of Brazil (CONCEA). The Ethics Committee on the Use of Animals (CEUA) of the Federal University of Amapá-UNIFAP approved the project under Protocol No. 001/2023.
Informed Consent Statement
Not applicable.
Data Availability Statement
The original contributions presented in the study are included in the article; further inquiries can be directed to the corresponding author.
Acknowledgments
The CAPES funded this study—PROCAD AMAZONIA, CNPq—MAI-DAI Program, and INCT North-Northeast Network of Phytoproducts—CNPq. The Federal University of Amapá (Pro-Rectorate of Research and Postgraduate Studies), Publication Support Program.
Conflicts of Interest
The authors declare that they have no conflicts of interest.
Abbreviations
The following abbreviations are used in this manuscript:
| DFT | Density Functional Theory |
| GC-MS | Chromatograph coupled to mass spectrometry |
| HAI | Histopathological alterations index |
| LD50 | 50% lethal dose |
| NBO | Injectable nanodispersion of Bixa orellana |
| OPBO | Standardized oil of Bixa orellana |
| pkCSM | Predicting small-molecule pharmacokinetic and toxicity properties |
| TNF | Tumor necrosis factor |
| TRAP1 | TNF Receptor-Associated Protein 1 |
References
- Takeuchi, O.; Akira, S. Pattern recognition receptors and inflammation. Cell 2010, 140, 805–820. [Google Scholar] [CrossRef] [PubMed]
- Chen, L.; Deng, H.; Cui, H.; Fang, J.; Zuo, Z.; Deng, J.; Li, Y.; Wang, X.; Zhao, L. Inflammatory responses and inflammation-associated diseases in organs. Oncotarget 2017, 9, 7204–7218. [Google Scholar] [CrossRef] [PubMed]
- Elias, M.E.A.; Schroth, G.; Macêdo, J.L.V.; Mota, M.S.S.; D’Angelo, S.A. Nutrição mineral, crescimento e produtividade do urucum (Bixa orellana) em agrofloresta em um Ferralsol amazônico. Agricultura Experimental 2022, 38, 277–289. [Google Scholar] [CrossRef]
- Costa, C.K.; Silva, C.B.; Lordello, A.L.L.; Zanin, S.M.W.; Dias, J.F.G.; Miguel, M.D.; Miguel, O.G. Identificação de δ tocotrienol e de ácidos graxos no óleo fixo de urucum (Bixa orellana Linné). Revista Brasileira de Plantas Medicinais 2013, 15, 677–683. [Google Scholar] [CrossRef]
- Pacheco, S.D.G.; Gasparin, A.T.; Jesus, C.H.A.; Sotomaior, B.B.; Ventura, A.C.S.S.B.; Redivo, D.D.B.; Cabrini, D.A.; Gaspari Dias, J.F.; Miguel, M.D.; Miguel, O.G.; et al. Antinociceptive and anti-inflammatory effects of bixin, a carotenoid extracted from the seeds of Bixa orellana. Planta Medica 2019, 85, 1216–1224. [Google Scholar] [CrossRef]
- Ashraf, A.; Ijaz, M.U.; Muzammil, S.; Nazir, M.M.; Zafar, S.; Zihad, S.M.N.K.; Uddin, S.J.; Hasnain, M.S.; Nayak, A.K. The role of bixin as antioxidant, anti-inflammatory, anticancer, and skin protecting natural product extracted from Bixa orellana L. Fitoterapia 2023, 169, 105612. [Google Scholar] [CrossRef]
- Batista, M.A.; de Lima Teixeira Dos Santos, A.V.T.; do Nascimento, A.L.; Moreira, L.F.; Souza, I.R.S.; da Silva, H.R.; Pereira, A.C.M.; da Silva Hage-Melim, L.I.; Carvalho, J.C.T. Potential of the compounds from Bixa orellana Purified Annatto Oil and its granules (Chronic®) against dyslipidemia and inflammatory diseases: In silico studies with geranylgeraniol and tocotrienols. Molecules 2022, 27, 1584. [Google Scholar] [CrossRef] [PubMed]
- Sá Hyacienth, B.M.; Sánchez-Ortiz, B.L.; Picanço, K.R.T.; Pereira, A.C.M.; de Sá Hyacienth, D.C.; de Souza, G.C.; Rodrigues Sarquis, R.D.S.F.; Aduanga, G.M.G.; Navarrete, A.; Carvalho, J.C.T. Endopleura uchi (Huber) Cuatrec.: A medicinal plant for gynecological treatments—A reproductive toxicity assessment in zebrafish (Danio rerio). Journal of Ethnopharmacology 2020, 250, 112457. [Google Scholar] [CrossRef]
- Canedo, A.; de Jesus, L.W.O.; Bailão, E.F.L.C.; Rocha, T.L. Micronucleus test and nuclear abnormality assay in zebrafish (Danio rerio): past, present and future trends. Environment Pollution 2021, 290, 118019. [Google Scholar] [CrossRef]
- Li, Y.; Chen, T.; Miao, X.; Yi, X.; Wang, X.; Zhao, H.; Lee, S.M.; Zheng, Y. Zebrafish: A promising in vivo model for assessing the delivery of natural products, fluorescence dyes, and drugs across the blood-brain barrier. Pharmacological Research 2017, 125 Pt B, 246–257. [Google Scholar] [CrossRef]
- Carvalho, H.O.; Gonçalves, D.E.S.; Picanço, K.R.T.; de Lima Teixeira Dos Santos, A.V.T.; Lucia, M.; Hu, X.; Fernandes, C.P.; Ferreira, I.M. Actions of Cannabis sativa L. fixed oil and nano-emulsion on venom-induced inflammation of Bothrops moojeni snake in rats. Inflammopharmacology 2021, 29, 123–135. [Google Scholar] [CrossRef]
- Rodrigues, A.P.S.; da Silva Barbosa, R.; Pereira, A.C.M.; Batista, M.A.; Sales, P.F.; Ferreira, A.M.; Colares, N.N.D.; da Silva, H.R.; Soares, M.O.S.; da Silva Hage-Melim, L.I.; et al. Ormona® SI and Ormona® RC—New nutraceuticals with geranylgeraniol, tocotrienols, anthocyanins, and isoflavones—Decrease high-fat diet-induced dyslipidemia in Wistar rats. Nutraceuticals 2022, 2, 311–322. [Google Scholar] [CrossRef]
- Borges, R.S.; Lima, E.S.; Keita, H.; Ferreira, I.M.; Fernandes, C.P.; Cruz, R.A.S.; Carvalho, J.C.T.; Duarte, J.L.; Moyado, J.V.; Ortiz, B.L.S.; Hage-Melim, L.I.; et al. Anti-inflammatory and antialgic actions of a nanoemulsion of Rosmarinus officinalis L. essential oil and a molecular docking study of its major chemical constituents. Inflammopharmacology 2017, 26, 183–195. [Google Scholar] [CrossRef]
- Pires, D.E.; Blundell, T.L.; Ascher, D.B. pkCSM: predicting small-molecule pharmacokinetic and toxicity properties using graph-based signatures. Journal of medicinal chemistry 2015, 58, 4066–4072. [Google Scholar] [CrossRef] [PubMed]
- Trott, O.; Olson, A.J. AutoDock Vina: Improving the speed and accuracy of docking with a new scoring function, efficient optimization, and multithreading. Journal of Computational Chemistry 2010, 31, 455–461. [Google Scholar] [CrossRef] [PubMed]
- Biovia, D.S. Discovery Studio Modeling Environment; Dassault Systemes: San Diego, CA, USA, 2015. [Google Scholar]
- Abdel El-wahab, H.A.; Hamdy, A.K.; Schulzke, C.; Aboul-Fadl, T.; Qayed, W.S. Crystal structure and quantum chemical calculations of (E) 1-benzyl-3-((4-methoxyphenyl) imino)-5-methylindolin-2-one. Journal of Heterocyclic Chemistry 2021, 58, 1601–1609. [Google Scholar] [CrossRef]
- Racine, J. gnuplot 4.0: A portable interactive plotting utility. 2006. [Google Scholar]
- Santos, I.V.F.; Souza, G.C.; Santana, G.R.; et al. Histopathology in zebrafish (Danio rerio) to evaluate the toxicity of medicine: An anti-inflammatory phytomedicine with janaguba milk (Himatanthus drasticus Plumel). Histopathology—An Update. InTech 2018. [Google Scholar] [CrossRef]
- Souza, G.C.; Duarte, J.L.; Fernandes, C.P.; Moyado, J.A.V.M.; Navarrete, A.; Carvalho, J.C.T. Obtainment and study of the toxicity of perillyl alcohol nanoemulsion on zebrafish (Danio rerio). Journal of Nanomedicine Research 2016, 4, 18–20. [Google Scholar] [CrossRef]
- Carvalho, J.C.T.; Keita, H.; Santana, G.R.; de Souza, G.C.; Dos Santos, I.V.F.; Amado, J.R.R.; Kourouma, A.; Prada, A.L.; de Oliveira Carvalho, H.; Silva, M.L. Effects of Bothrops alternatus venom in zebrafish: A histopathological study. Inflammopharmacology 2018, 26, 273–284. [Google Scholar] [CrossRef]
- Souza, G.C.; Dias Ribeiro da Silva, I.; Duarte Viana, M.; Costa de Melo, N.; Sánchez-Ortiz, B.L.; Maia Rebelo de Oliveira, M.; Ramos Barbosa, W.L.; Maciel Ferreira, I.; Tavares Carvalho, J.C. Acute toxicity of the hydroethanolic extract of the flowers of Acmella oleracea L. in zebrafish (Danio rerio): Behavioral and histopathological studies. Pharmaceuticals 2019, 12, 173. [Google Scholar] [CrossRef]
- Carvalho, H.O.; dos Santos, I.V.F.; da Rocha, C.F.; et, al. Effect of the treatment of Copaifera duckei oleoresin (copaiba) in streptozotocin-induced diabetic rats. Rev. Bras. Farmacogn. 2018, 28, 724–731. [Google Scholar] [CrossRef]
- Mitchell, M.J.; Billingsley, M.M.; Haley, R.M.; et al. Engineering precision nanoparticles for drug delivery. Nature Reviews Drug Discovery 2021, 20, 101–124. [Google Scholar] [CrossRef] [PubMed]
- Maia Filho, M.; de Macedo, K.G.; Ramos, A.L.; de Faria, F.S.E.D.V.; Rodriguez, A.F.R. Preparação e caracterização de nanoemulsão dos óleos de Euterpe precatória Mart. e Bertholletia excelsa Bonp. DELOS: Desarrollo Local Sostenible 2023, 16, 1847–1860. [Google Scholar] [CrossRef]
- Zielińska, A.; et al. Loading, release profile and accelerated stability assessment of monoterpenes-loaded solid lipid nanoparticles (SLN). Pharmaceutical Development and Technology 2020, 25, 832–844. [Google Scholar] [CrossRef] [PubMed]
- Aggarwal, B.B.; Sundaram, C.; Prasad, S.; Kannappan, R. Tocotrienols, the vitamin E of the 21st century: its potential against cancer and other chronic diseases. Biochem Pharmacol. 2010, 80, 1613–31. [Google Scholar] [CrossRef]
- Khan, M.S.; Khan, M.K.; Siddiqui, M.H.; Arif, J.M. An in vivo and in silico approach to elucidate the tocotrienol-mediated fortification against infection and inflammation induced alterations in antioxidant defense system. Eur Rev Med Pharmacol Sci. 2011, 15, 916–930. [Google Scholar]
- Compadre, C.M.; Singh, A.; Thakkar, S.; Zheng, G.; Breen, P.J.; Ghosh, S.; Kiaei, M.; Boerma, M.; Varughese, K.I.; Hauer-Jensen, M. Molecular dynamics guided design of tocoflexol: a new radioprotectant tocotrienol with enhanced bioavailability. Drug Dev Res. 2014, 75, 10–22. [Google Scholar] [CrossRef]
- Garrido, A.; Lepailleur, A.; Mignani, S.M.; Dallemagne, P.; Rochais, C. hERG toxicity assessment: Useful guidelines for drug design. European journal of medicinal chemistry 2020, 195, 112290. [Google Scholar] [CrossRef]
- Al Rawashdeh, S.; Chandrasekaran, S.; Barakat, K.H. Structural analysis of hERG channel blockers and the implications for drug design. Journal of Molecular Graphics and Modelling 2023, 120, 108405. [Google Scholar] [CrossRef]
- Shilpi, J.A.; Taufiq-Ur-Rahman, M.; Uddin, S.J.; Alam, M.S.; Sadhu, S.K.; Seidel, V. Preliminary pharmacological screening of Bixa orellana L. leaves. Journal of Ethnopharmacology 2006, 108, 264–271. [Google Scholar] [CrossRef]
- Pereira, A.C.M.; de Oliveira Carvalho, H.; Gonçalves, D.E.S.; Picanço, K.R.T.; de Lima Teixeira Dos Santos, A.V.T.; da Silva, H.R.; Braga, F.S.; Bezerra, R.M.; de Sousa Nunes, A.; Nazima, M.T.S.T.; et al. Co-treatment of purified annatto oil (Bixa orellana L.) and its granules (Chronic®) improves the blood lipid profile and bone protective effects of testosterone in the orchiectomy-induced osteoporosis in Wistar rats. Molecules 2021, 26, 4720. [Google Scholar] [CrossRef]
- Tonny, T.S.; Sarkar, A.P.; Nahar, K.; Jahan, S.; Afroze, I.; Sarkar, B.K.; Roy, M.S. Evaluation of antidiabetic and antioxidant potential of methanolic extract of Bixa orellana seeds. Biomedicine and Pharmacology Journal 2024, 17, 1–12. [Google Scholar] [CrossRef]
- Lins, J.A.P.N.; Kirschnik, P.G.; Queiroz, V.D.S.; Cirio, S.M. Uso de peixes como biomarcadores para monitoramento ambiental aquático. Revista Acadêmica: Ciência Animal 2010, 8, 469. [Google Scholar] [CrossRef]
- Zuo, W.F.; Pang, Q.; Zhu, X.; et, al. Heat shock proteins as hallmarks of cancer: insights from molecular mechanisms to therapeutic strategies. J Hematol Oncol 2024, 17, 81. [Google Scholar] [CrossRef]
- Yoon, N.G.; Lee, H.; Kim, S.Y.; Hu, S.; Kim, D.; Yang, S.; Kang, B.H. Mitoquinone inactivates mitochondrial chaperone TRAP1 by blocking the client binding site. Journal of the American Chemical Society 2021, 143, 19684–19696. [Google Scholar] [CrossRef] [PubMed]
- Kang, S.; Kang, B.H. Structure, function, and inhibitors of the mitochondrial chaperone TRAP1. Journal of Medicinal Chemistry 2022, 65, 16155–16172. [Google Scholar] [CrossRef] [PubMed]
- Carvalho, H.O.; Sauma, A.L.R.; do Nascimento, A.L.; de Lima Teixeira, A.V.T.; Gonçalves, D.E.S.; Gomes, L.; Da Costa Furtado, G.; Da Silva, H.R.; De Souza, G.C.; Pereira, A.C.M.; et al. Intramuscular compatibility of an injectable anti-inflammatory nanodispersion from a standardized Bixa orellana oil (Chronic®): a toxicological study in Wistar rats. Inflammopharmacology 2023, 31, 1–10. [Google Scholar] [CrossRef]
- Omar, W.A.; Saleh, Y.S.; Marie, M.A.S. Integrating multiple fish biomarkers and risk assessment as indicators of metal pollution along the Red Sea coast of Hodeida, Yemen Republic. Ecotoxicology and Environmental Safety 2014, 110, 221–231. [Google Scholar] [CrossRef]
- Souza KBRde Casais-e-Silva, L.L.; Aguiar, M.C. O modelo de dor inflamatória induzida pela carragenina como estratégia para avaliar a ação de drogas sobre a dor miofascial. Revista De Ciências Médicas E Biológicas 2020, 19, 507–513. [Google Scholar] [CrossRef]
- Quitian-Useche, Y.F.; Sánchez-Ortiz, B.L.; Borges, S.F.; Ramos, B.; de Souza, G.C.; Batista, M.A.; da Silva Hage Melim, L.I.; Ferreira, I.M.; Carvalho, J.C.T.; Borges, R.S. Fatty ethanolamide of Bertholletia excelsa triglycerides (Brazil nuts): Anti-inflammatory action and acute toxicity evaluation in zebrafish (Danio rerio). Inflammopharmacology 2021, 29, 1519–1537. [Google Scholar] [CrossRef]
- Tonny, T.S.; Afroze, I.; Shifa, S.; Sultana, S. In vitro preliminary phytochemical screening, acute toxicity test and anti-diarrheal activity of methanolic Bixa orellana seed extracts by castor oil induced and magnesium sulfate induced diarrhea models. Journal of Pharmaceutical Research International 2023, 35, 1–7. [Google Scholar] [CrossRef]
- Jian, G.Q. Natural forms of vitamin E: Metabolism, antioxidant, and anti-inflammatory activities and their role in disease prevention and therapy. Free Radical Biology and Medicine 2014, 72, 76–90. [Google Scholar] [CrossRef] [PubMed]
- Chin, K.Y.; Tay, S.S. A review on the relationship between tocotrienol and Alzheimer disease. Nutrients 2018, 10, 881. [Google Scholar] [CrossRef] [PubMed]
- Geller, M.; Krymchantowski, A.V.; Steinbruch, M.; Cunha, K.S.; Ribeiro, M.G.; Oliveira, L.; Ozeri, D.; Daher, J.P.L. Use of diclofenac in clinical practice: review of the therapeutic evidence and pharmacologic actions. Rev. Soc. Bras. Clín. Méd. 2012, 10, 1–6. [Google Scholar]
- Almazroo, O.A.; Miah, M.K.; Venkataramanan, R. Drug Metabolism in the Liver. Clin Liver Dis 2017, 21, 1–20. [Google Scholar] [CrossRef]
- Hyacienth, B.M.S.; Sánchez-Ortiz, B.L.; Picanço, K.R.T.; Pereira, A.C.M.; de Sá Hyacienth, D.C.; de Souza, G.C.; Rodrigues Sarquis, R.D.S.F.; Aduanga, G.M.G.; Navarrete, A.; Carvalho, J.C.T. Endopleura uchi (Huber) Cuatrec.: A medicinal plant for gynecological treatments - A reproductive toxicity assessment in zebrafish (Danio rerio). Journal of Ethnopharmacology 2020, 250, 112457. [Google Scholar] [CrossRef]
Figure 1.
(A) Chromatographic profile of OPBO with the main peak corresponding to δ-tocotrienol (C27H40O2) at a retention time of 28.6 min. (B) Fragmentation spectrum corresponding to δ-tocotrienol with a molecular ion of 309 m/z.
Figure 1.
(A) Chromatographic profile of OPBO with the main peak corresponding to δ-tocotrienol (C27H40O2) at a retention time of 28.6 min. (B) Fragmentation spectrum corresponding to δ-tocotrienol with a molecular ion of 309 m/z.
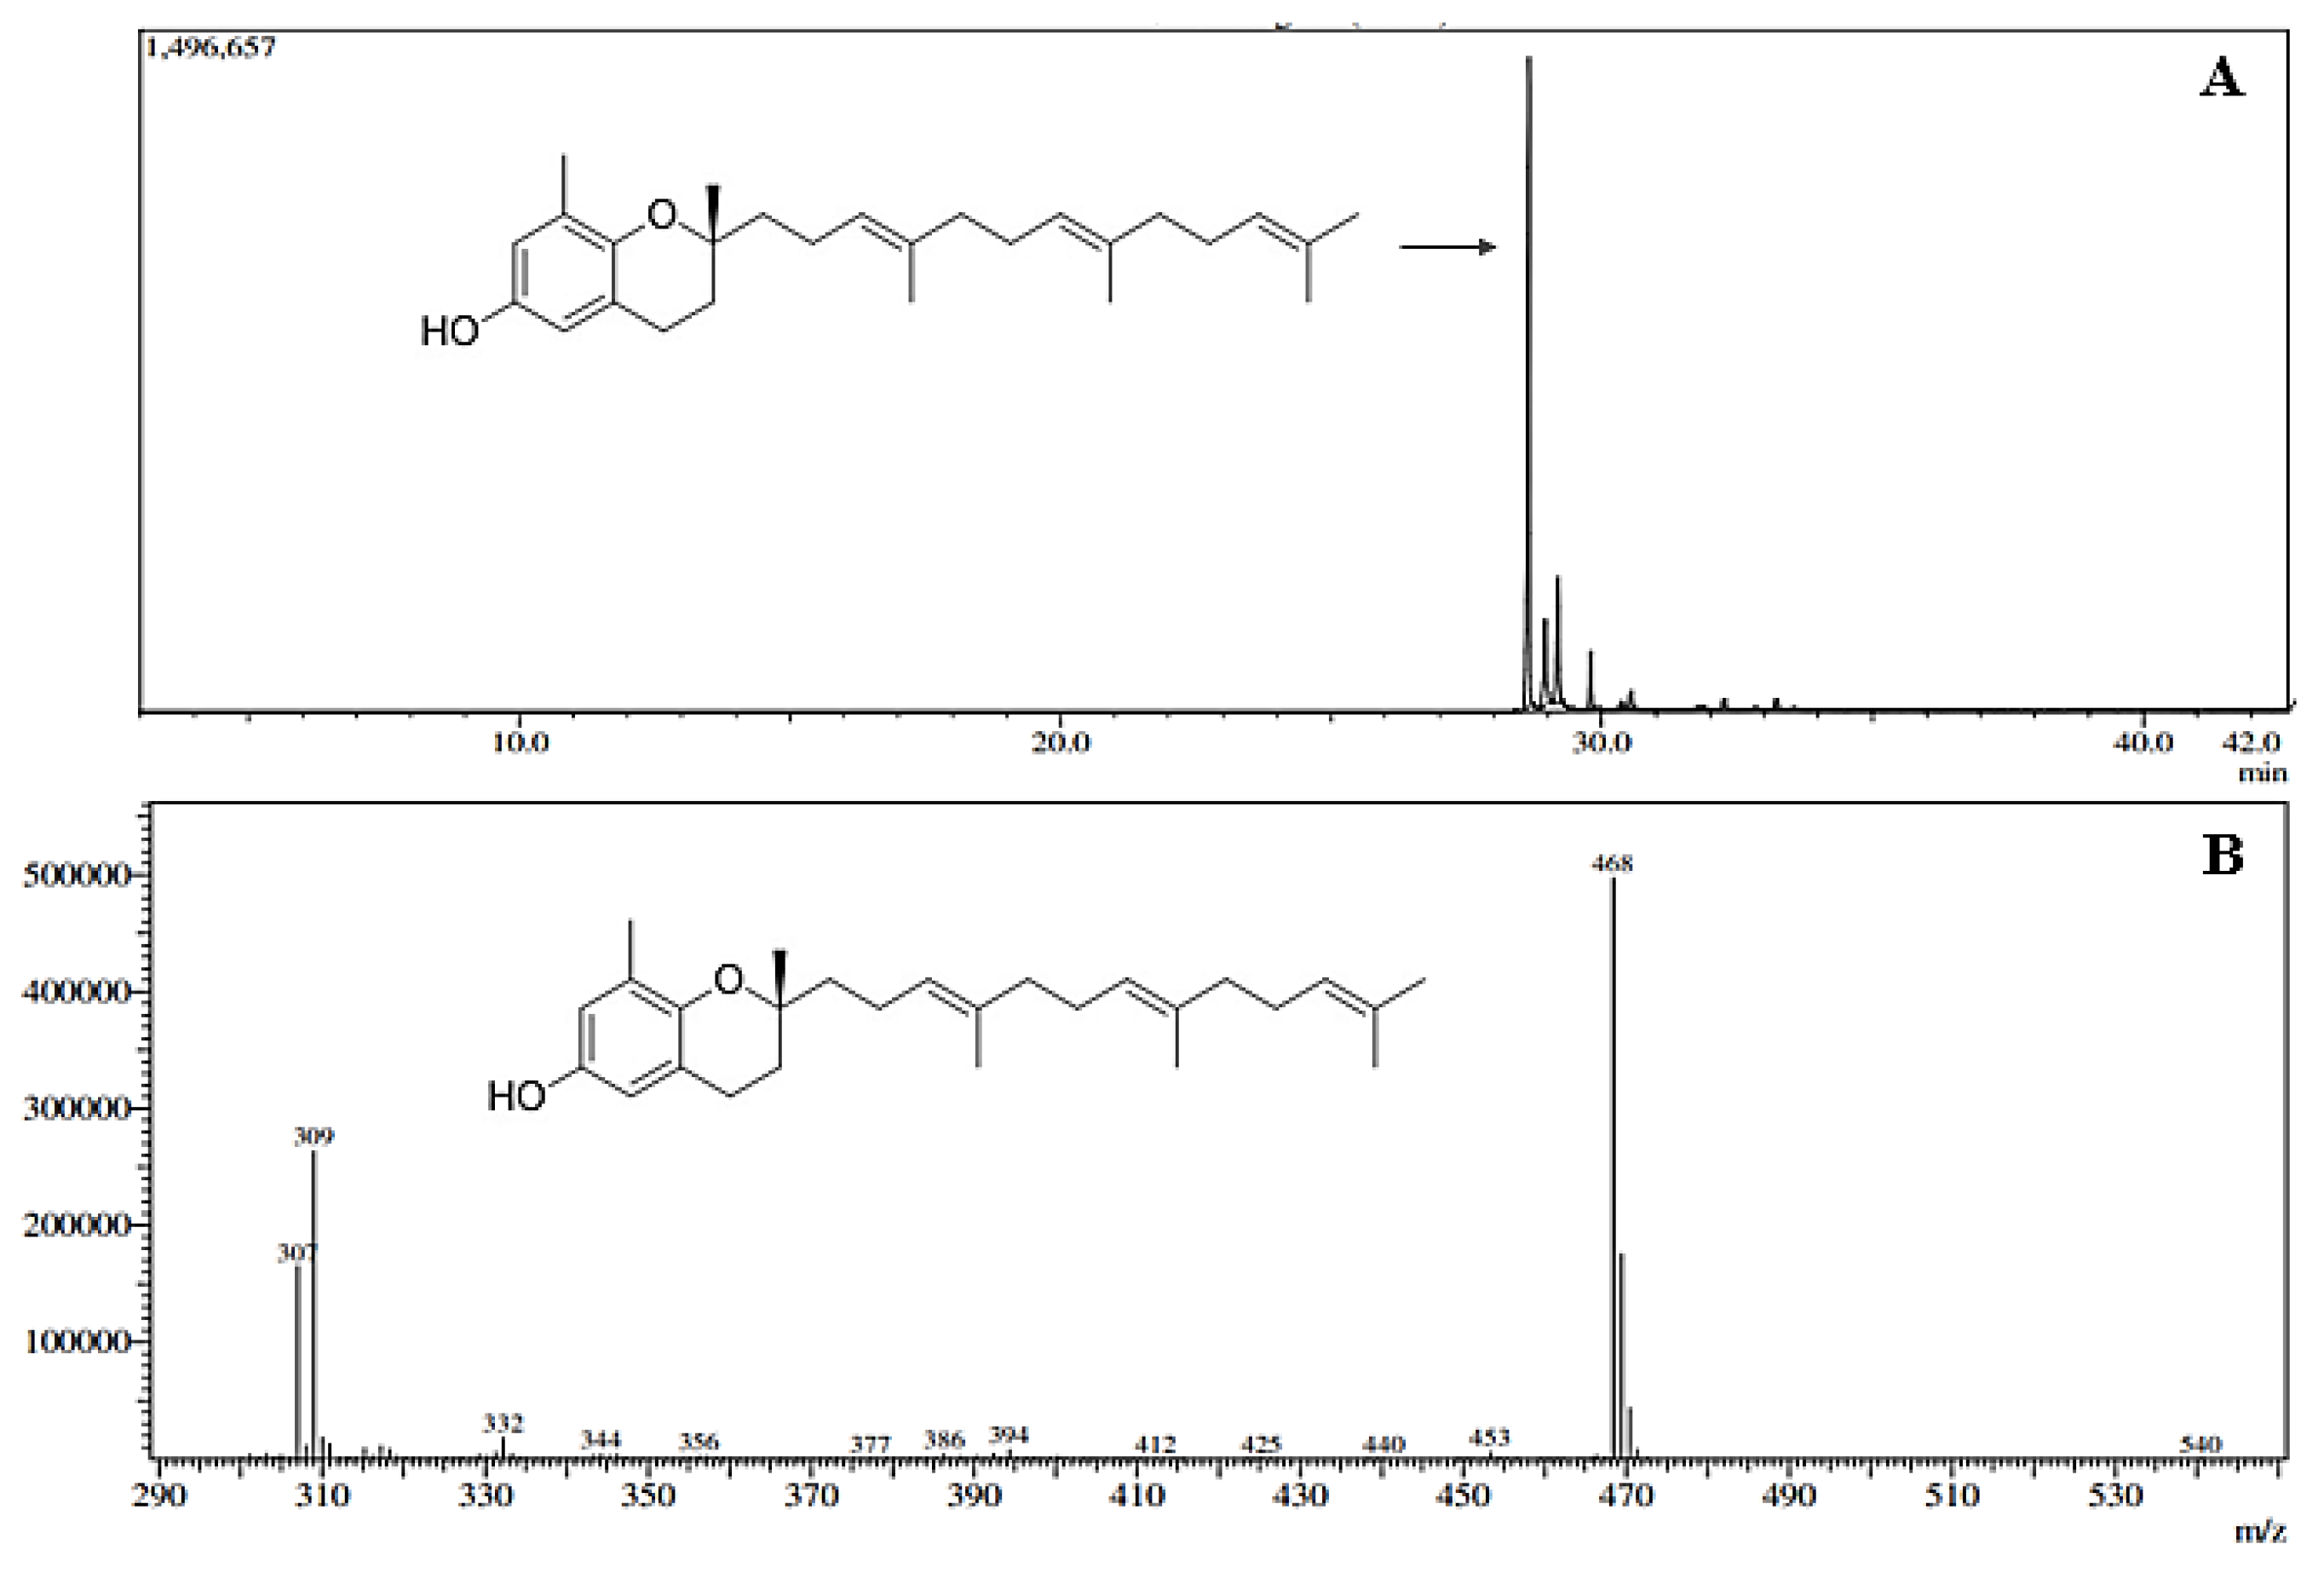
Figure 2.
Comparison of molecular weight and dose-dependent profiles of δ-tocotrienol.
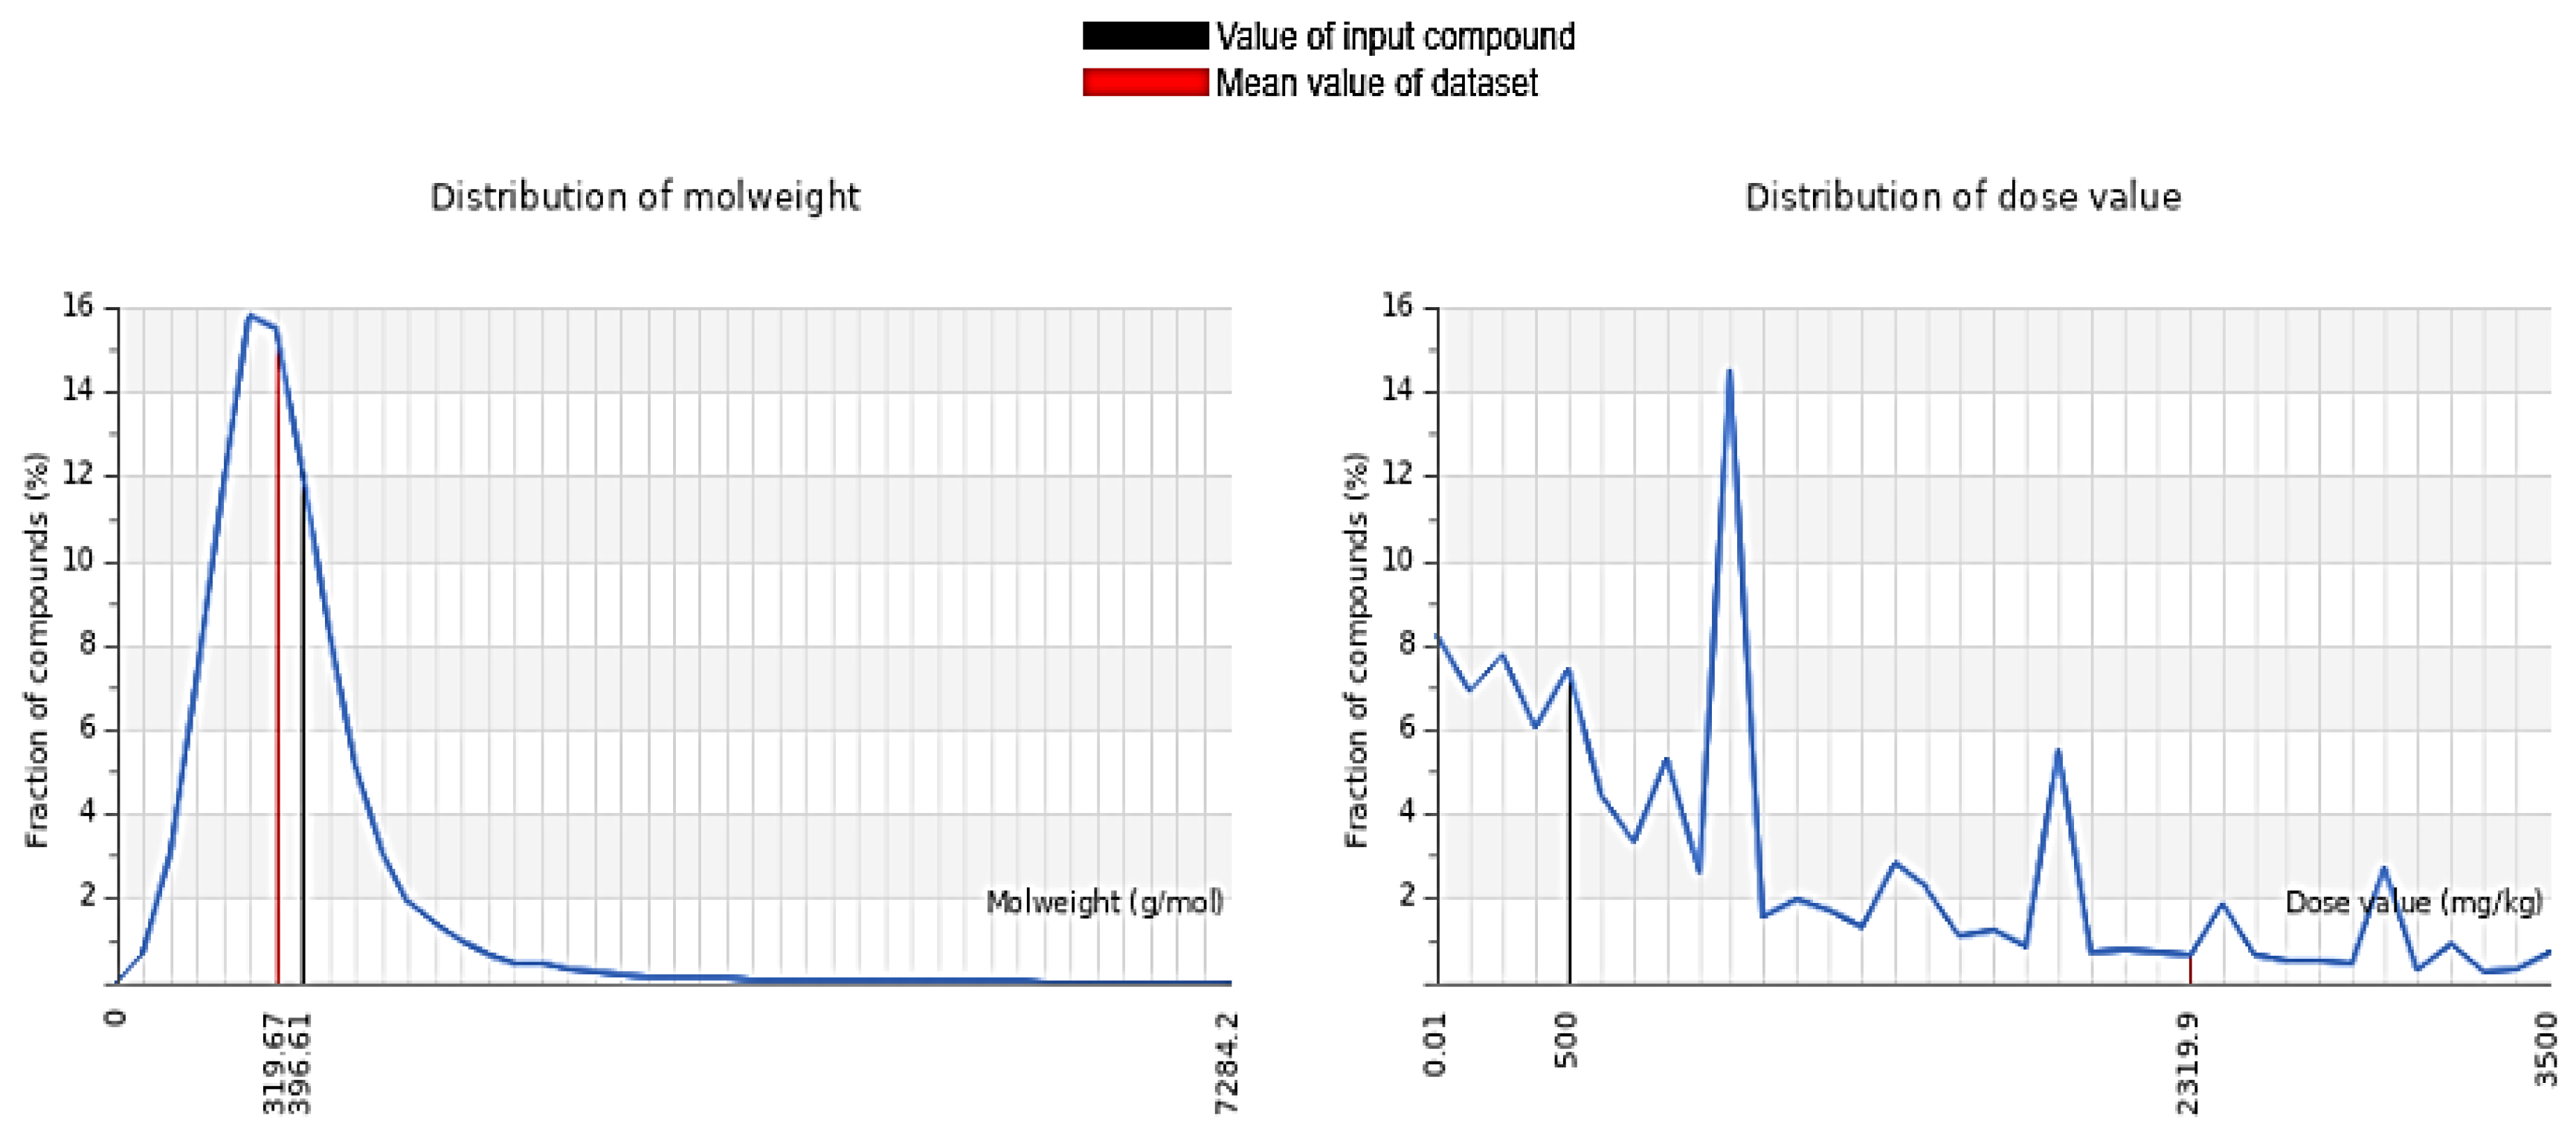
Figure 3.
Interactions of δ-tocotrienol with target TRAP1: A) Aromatic surface representation B) H-Bond distribution, C) 2D ligand interaction, D) 3D representation of docked poses.
Figure 3.
Interactions of δ-tocotrienol with target TRAP1: A) Aromatic surface representation B) H-Bond distribution, C) 2D ligand interaction, D) 3D representation of docked poses.
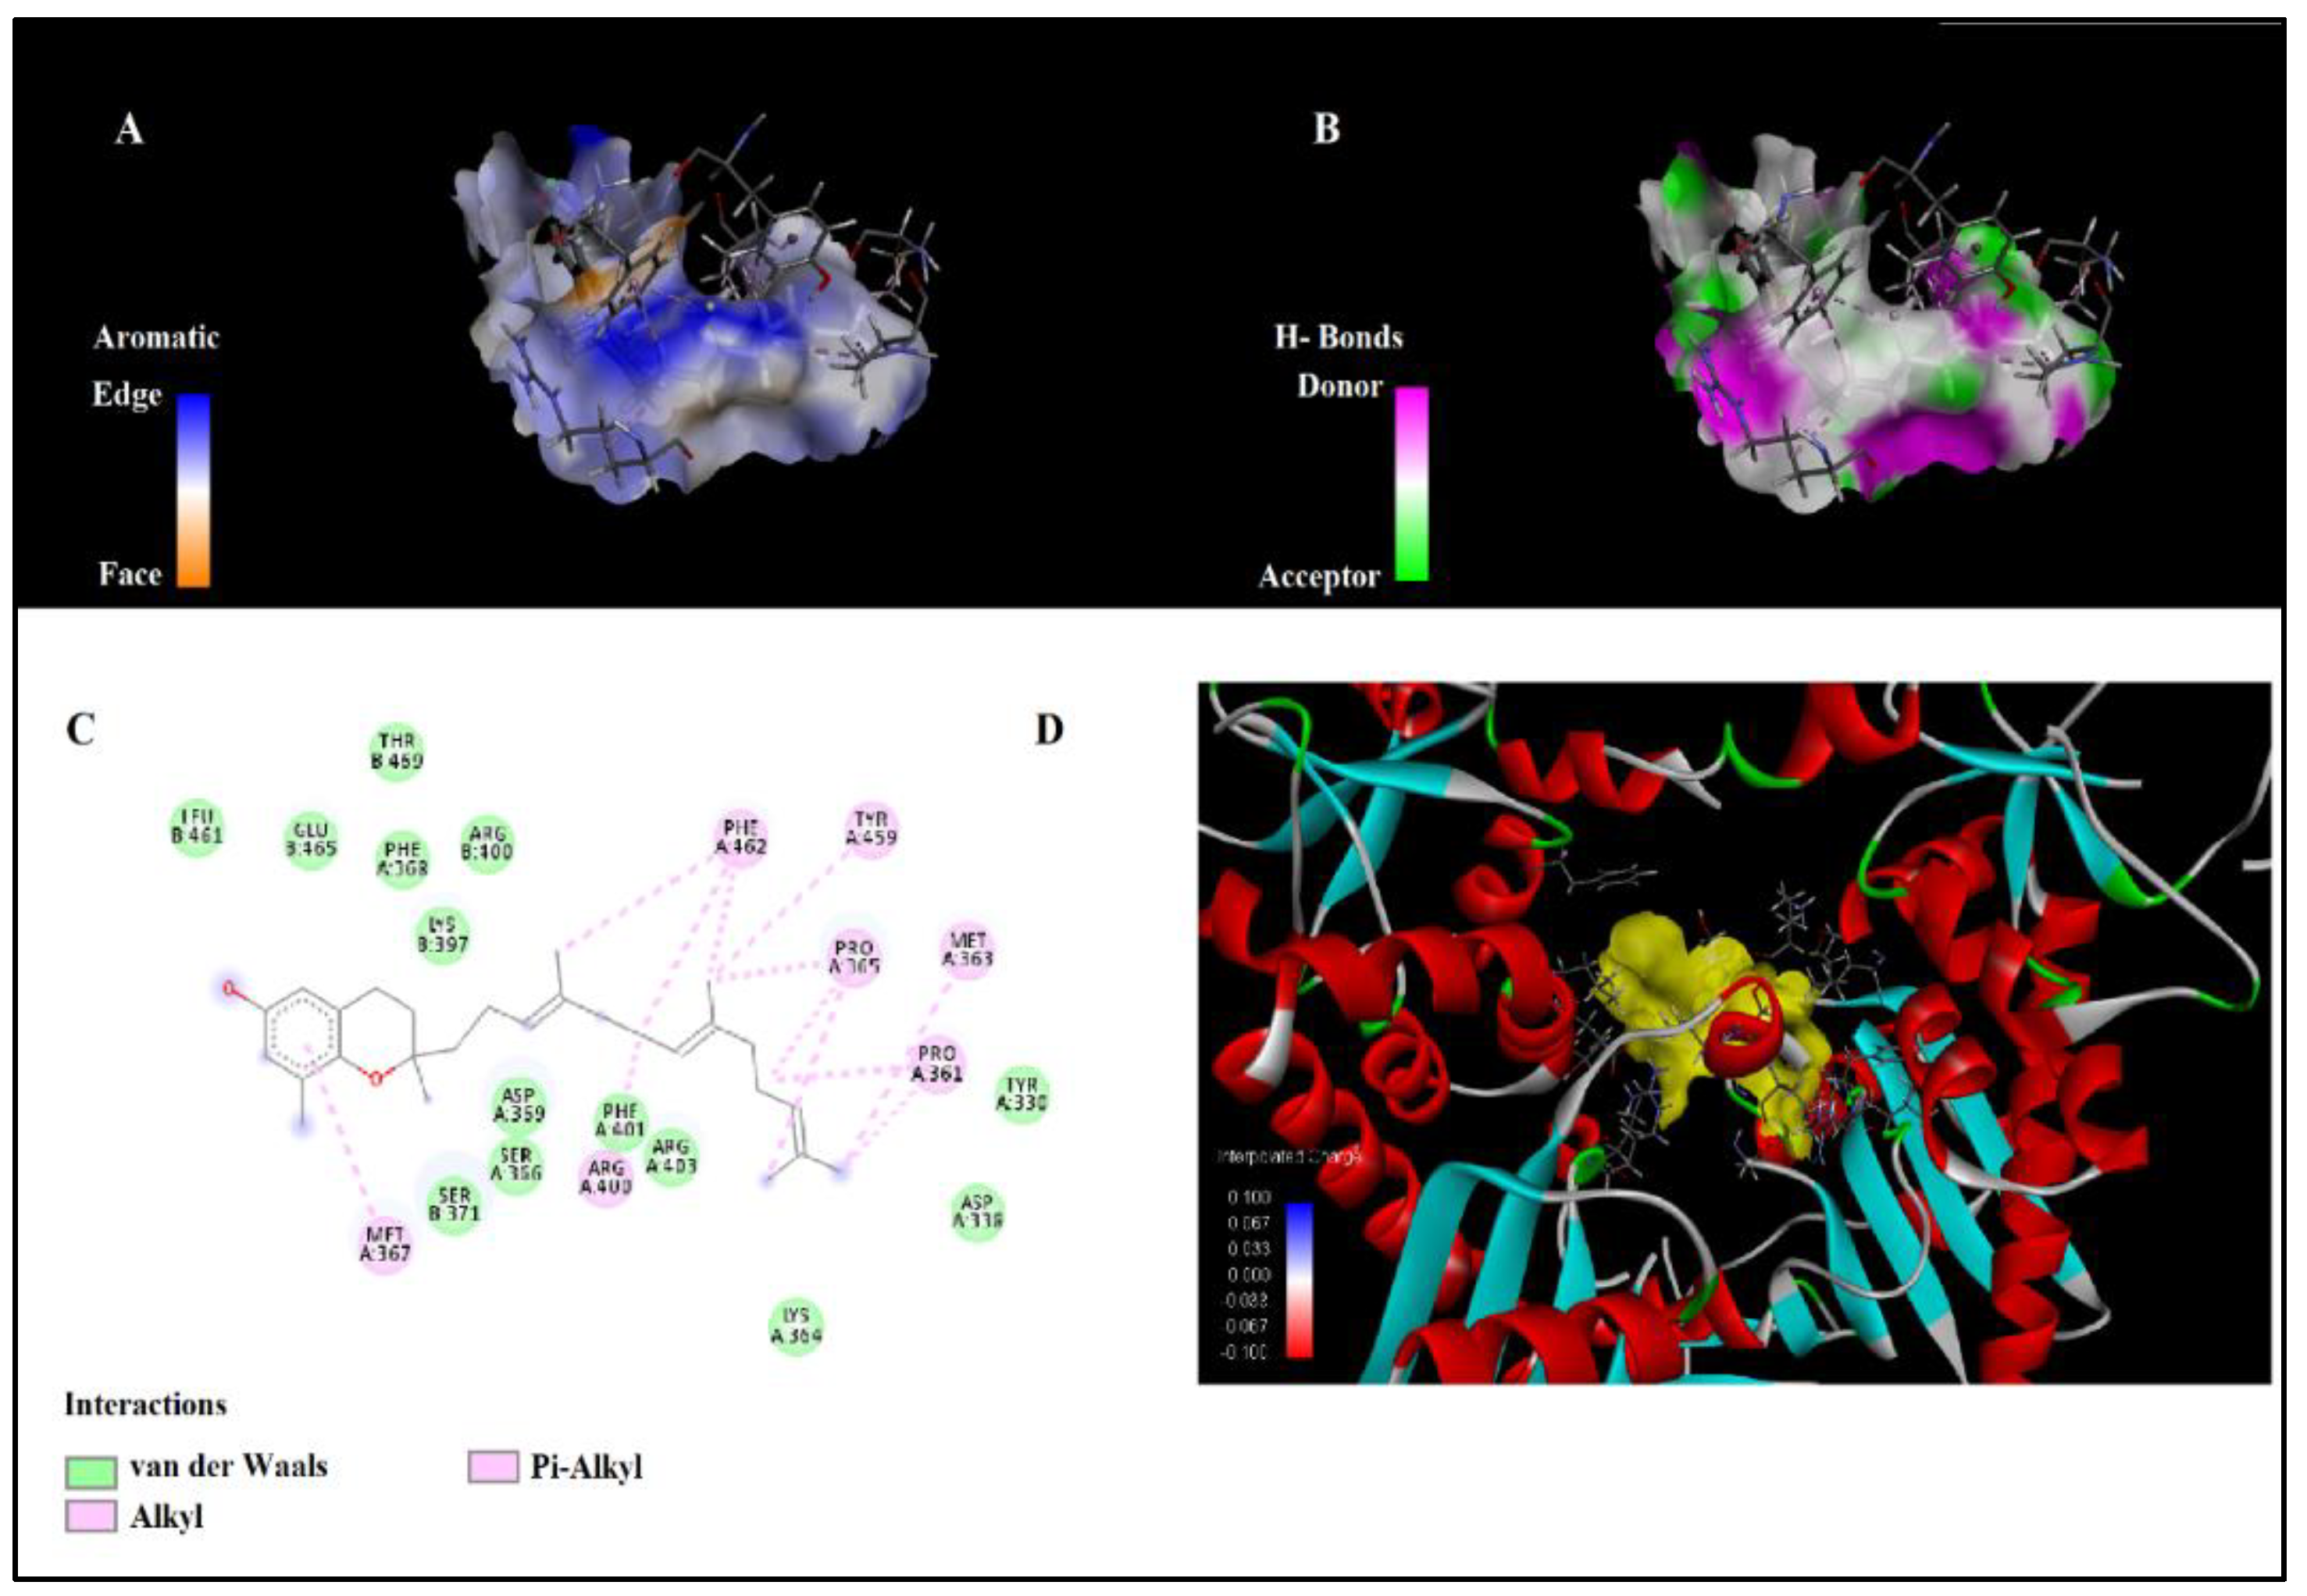
Figure 4.
HOMO-LUMO images of δ-tocotrienol.
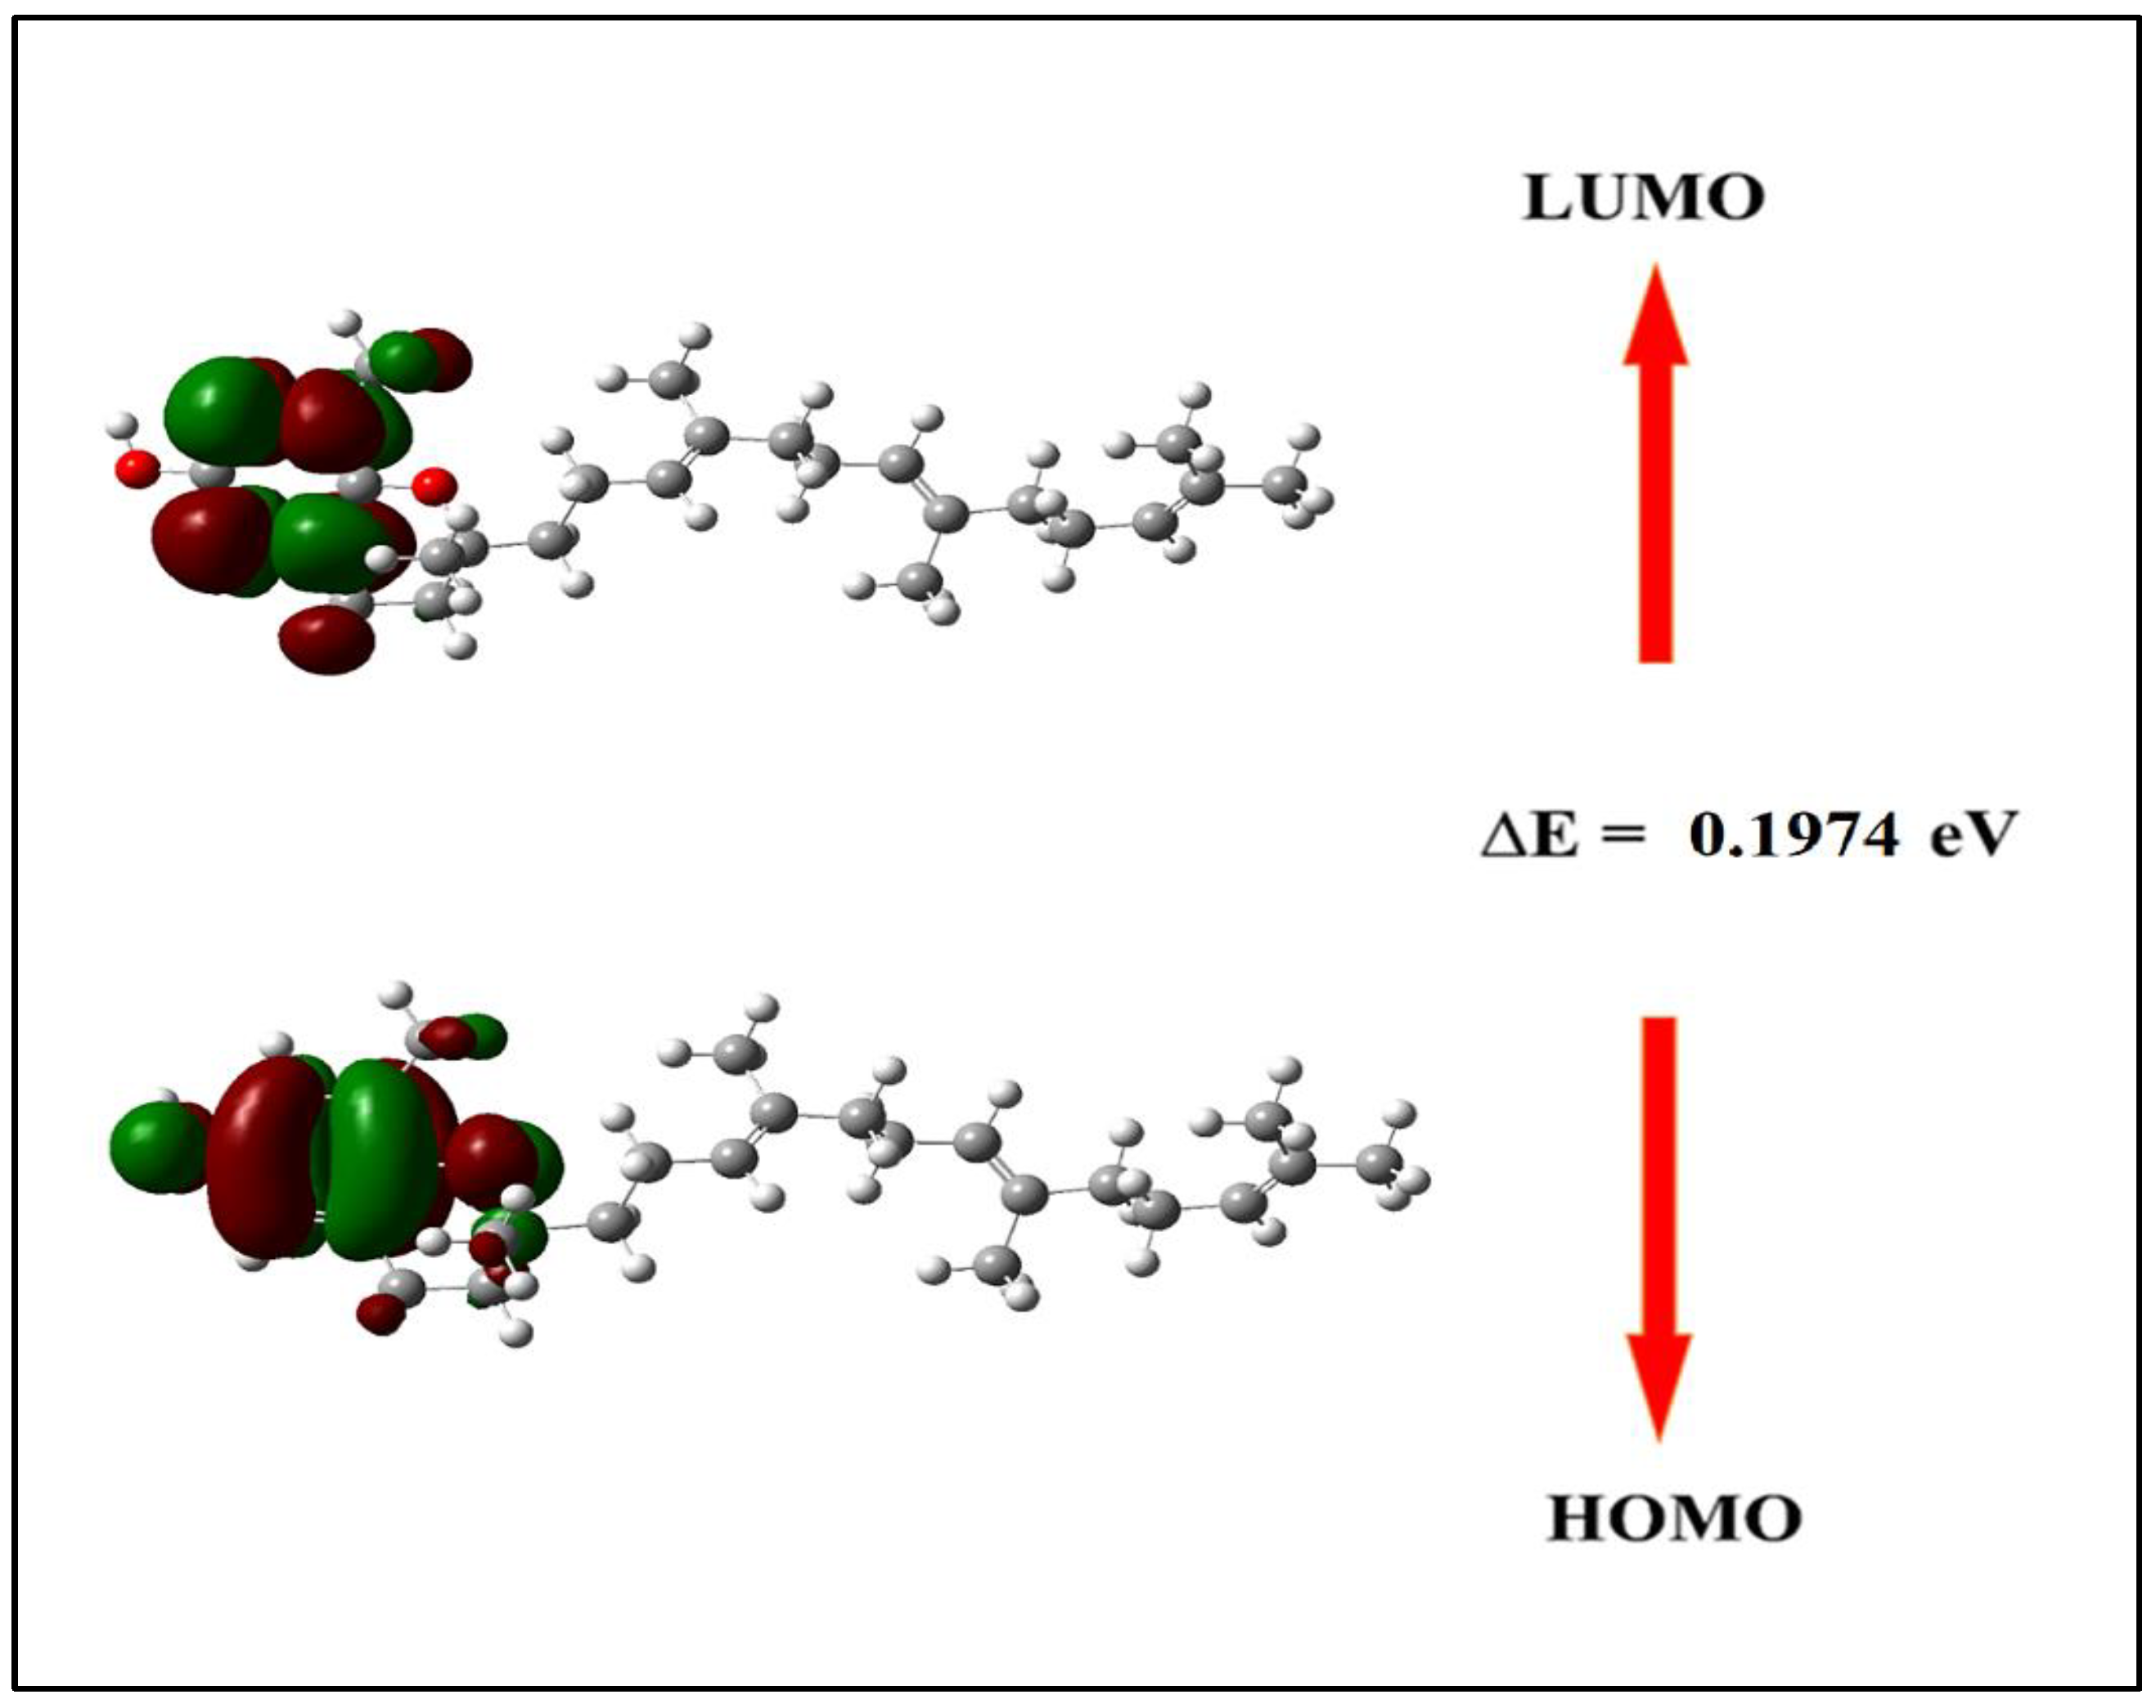
Figure 5.
A) Reduced density gradient colored map B) RDG plot of δ-tocotrienol molecule.
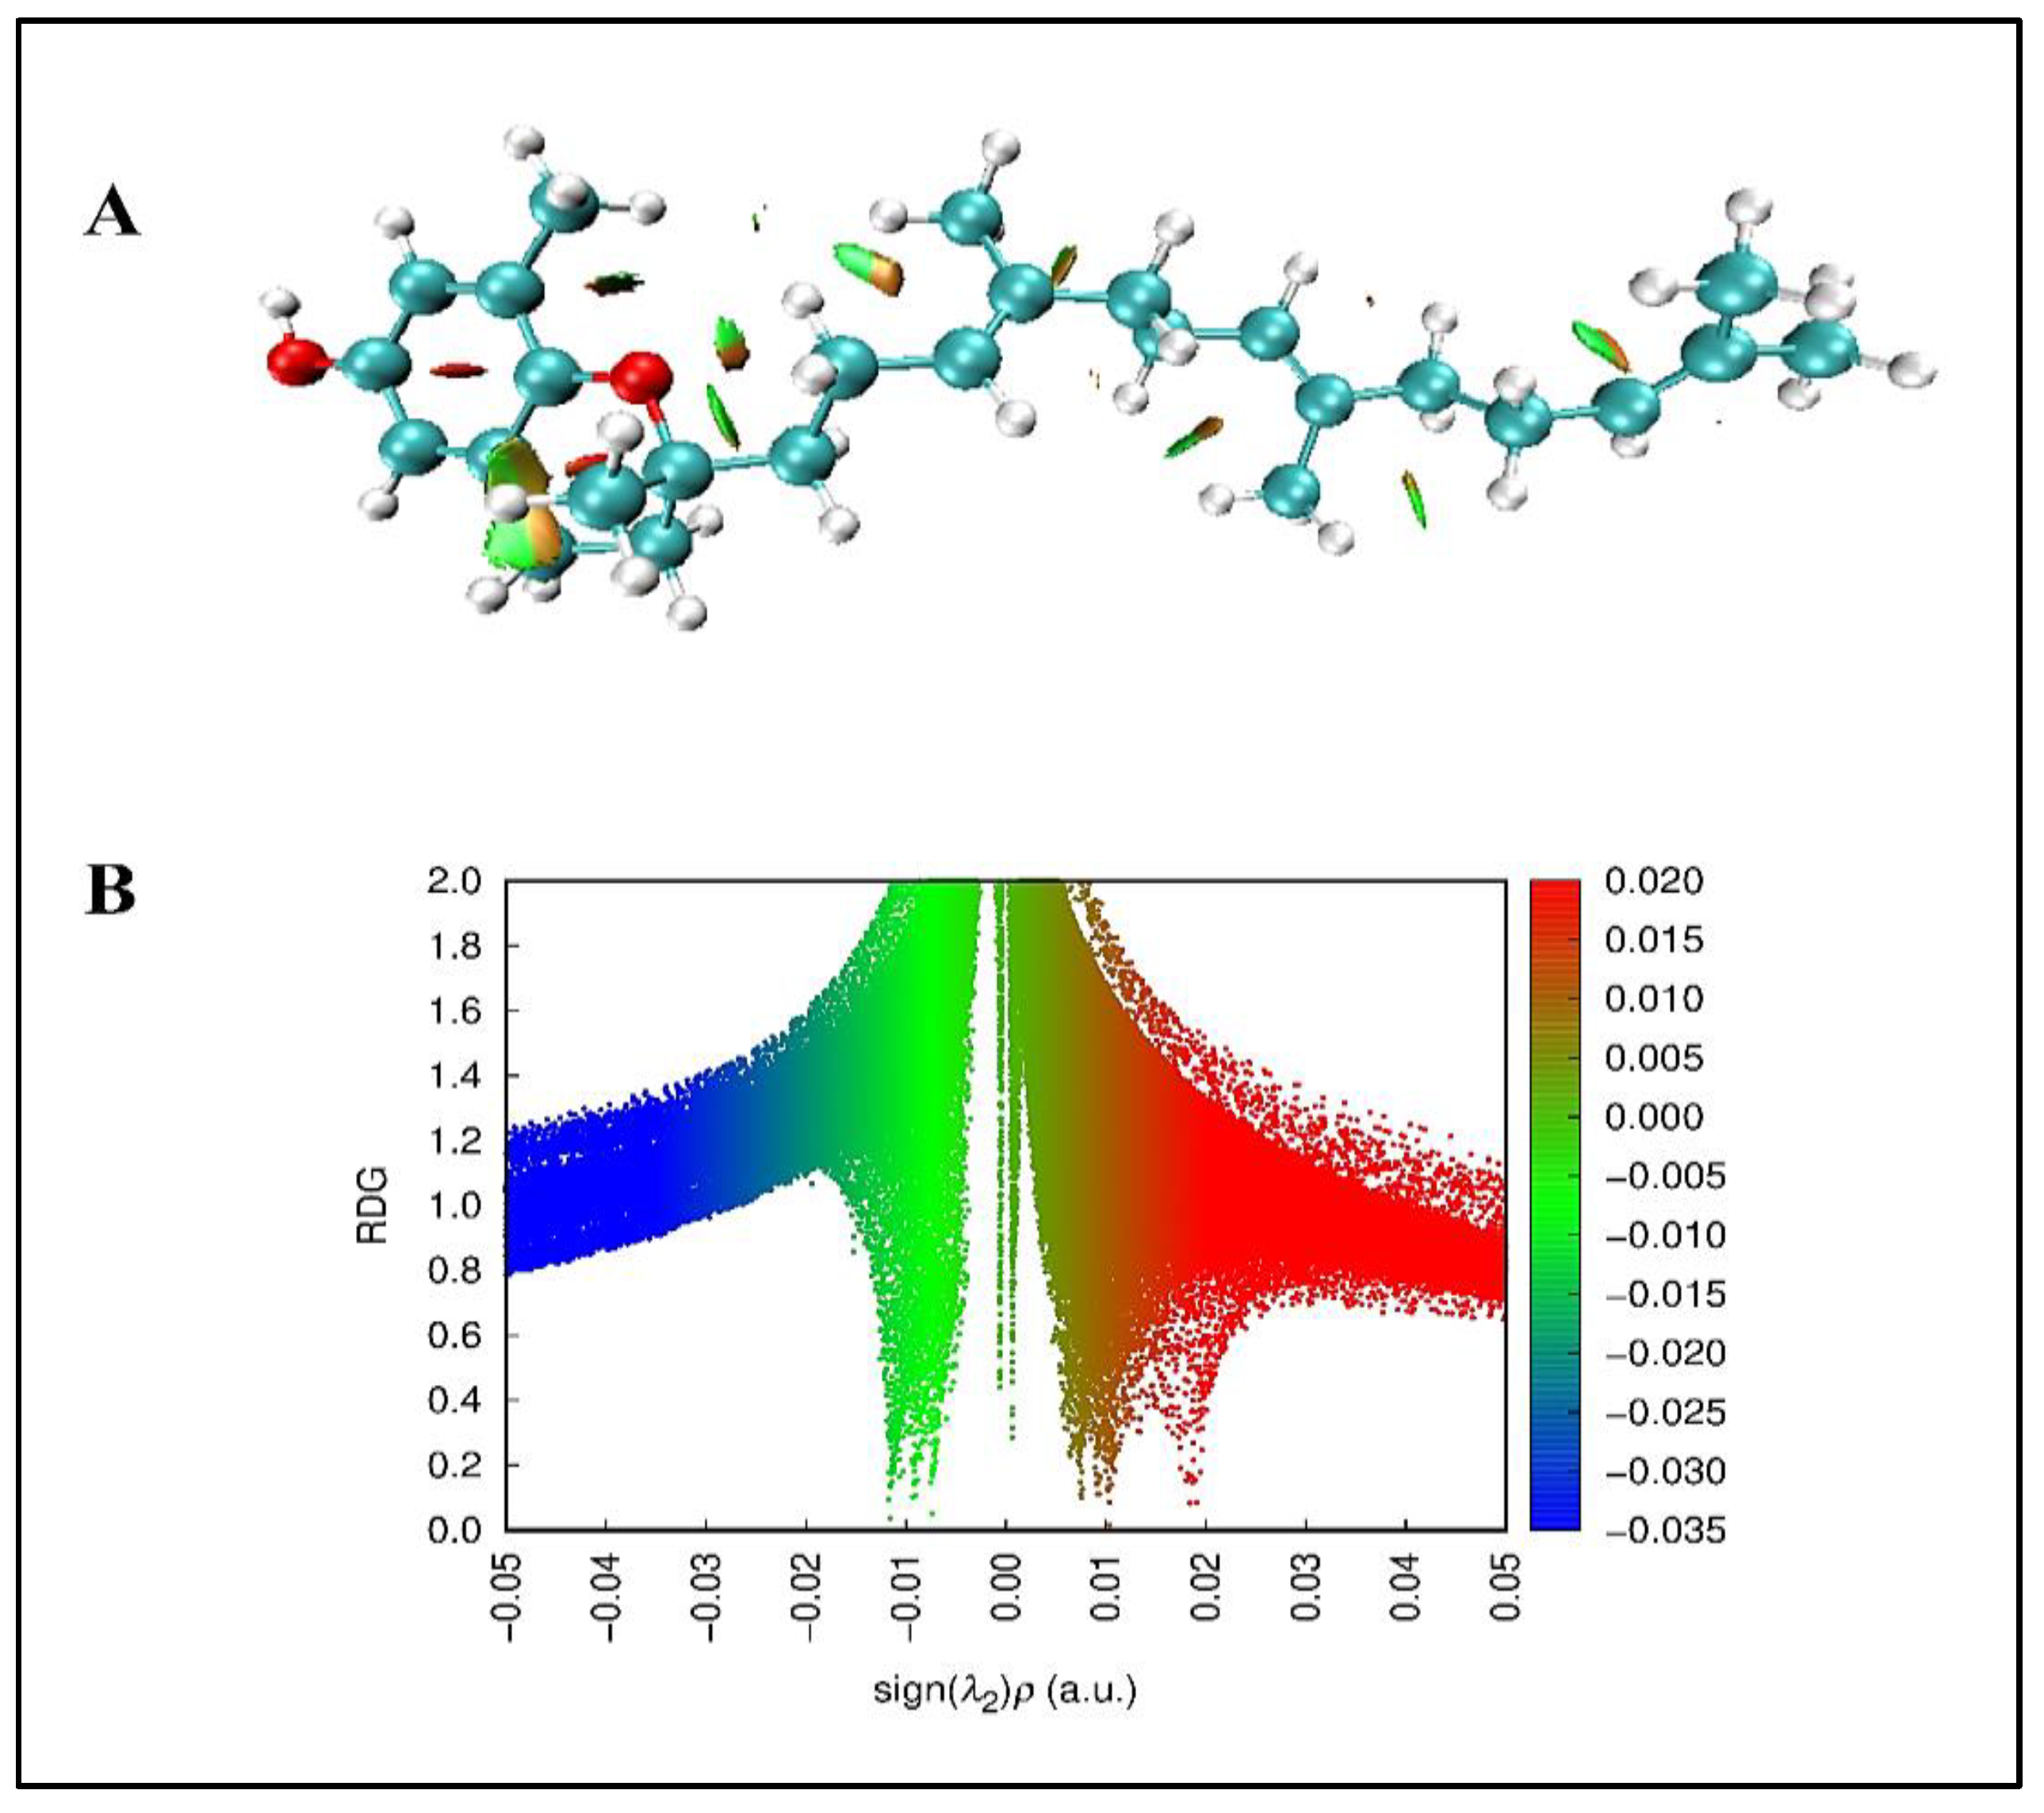
Figure 6.
A - Photomicrographs of zebrafish liver in longitudinal sections of the groups (750, 1000, 1500 mg/kg). Dn (nuclear degeneration); Dc (cytoplasmic degeneration); Vc (cytoplasmic vacuolization); Hv (hypervascularization); AtN (nuclear atrophy); NcT (tissue necrosis). B - Photomicrographs of zebrafish kidneys in longitudinal sections of the groups (750, 1000, 1500 mg/kg). ILe (leukocyte infiltrate); DgT (tubular degeneration); NcT (tissue necrosis). C - Photomicrographs of zebrafish intestines in longitudinal sections from the 750, 1000, and 1500 mg/kg groups. The intestinal tissue shows villi (V), goblet cells (GC), muscle layer (CM), goblet cell hypertrophy (HtGC), and displacement of the lamina propria (DLP). DgV (villous degeneration).
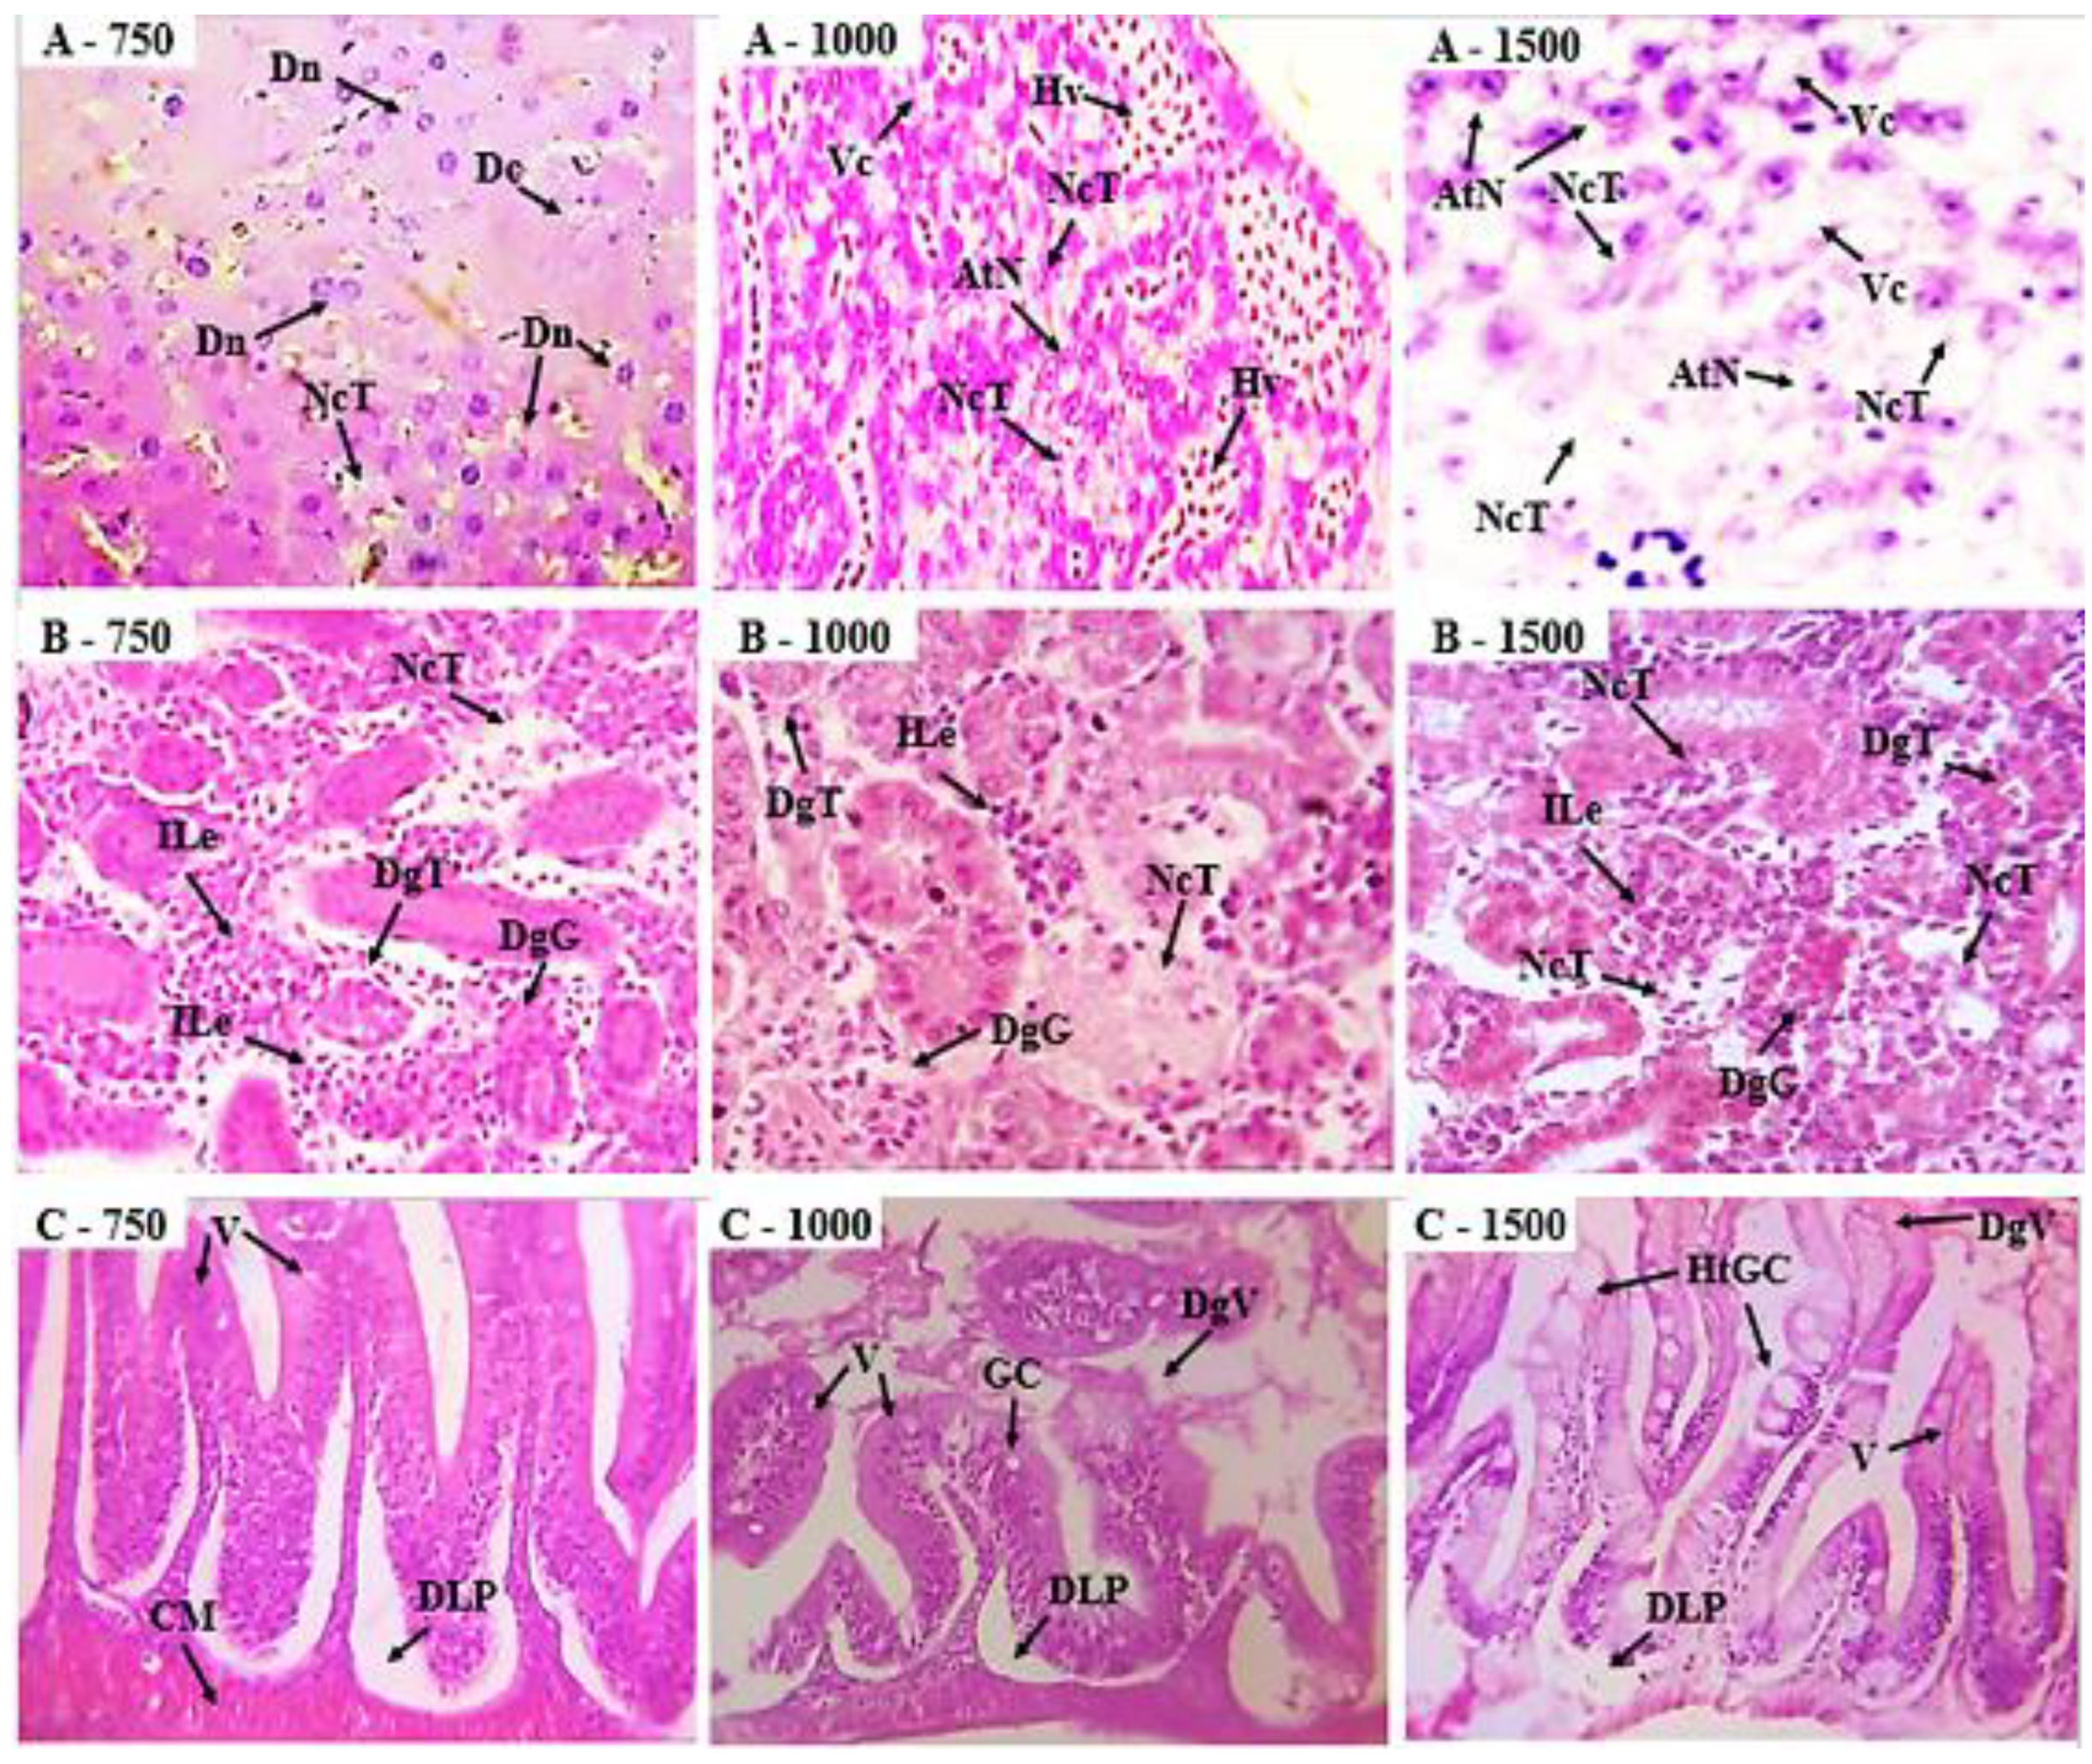
Figure 7.
Index of histological changes in the liver, kidneys, and intestines of zebrafish exposed to treatments with 250, 500, 750, 1000, and 1500 mg/kg NBO (Chronic in). The values represent the mean and standard deviation. ** (p < 0.01) and *** (p < 0.001) represent statistically significant results.

Figure 8.
A. Shows the absolute number and percentage of deaths in the groups treated with different doses of B. orellana nanodispersion. B. Lethality curve according to the administered dose and straight-line equation y = 0.08176x-17.91. A lethal dose of 50% (LD50) of 830.6 mg/kg was calculated.
Figure 8.
A. Shows the absolute number and percentage of deaths in the groups treated with different doses of B. orellana nanodispersion. B. Lethality curve according to the administered dose and straight-line equation y = 0.08176x-17.91. A lethal dose of 50% (LD50) of 830.6 mg/kg was calculated.
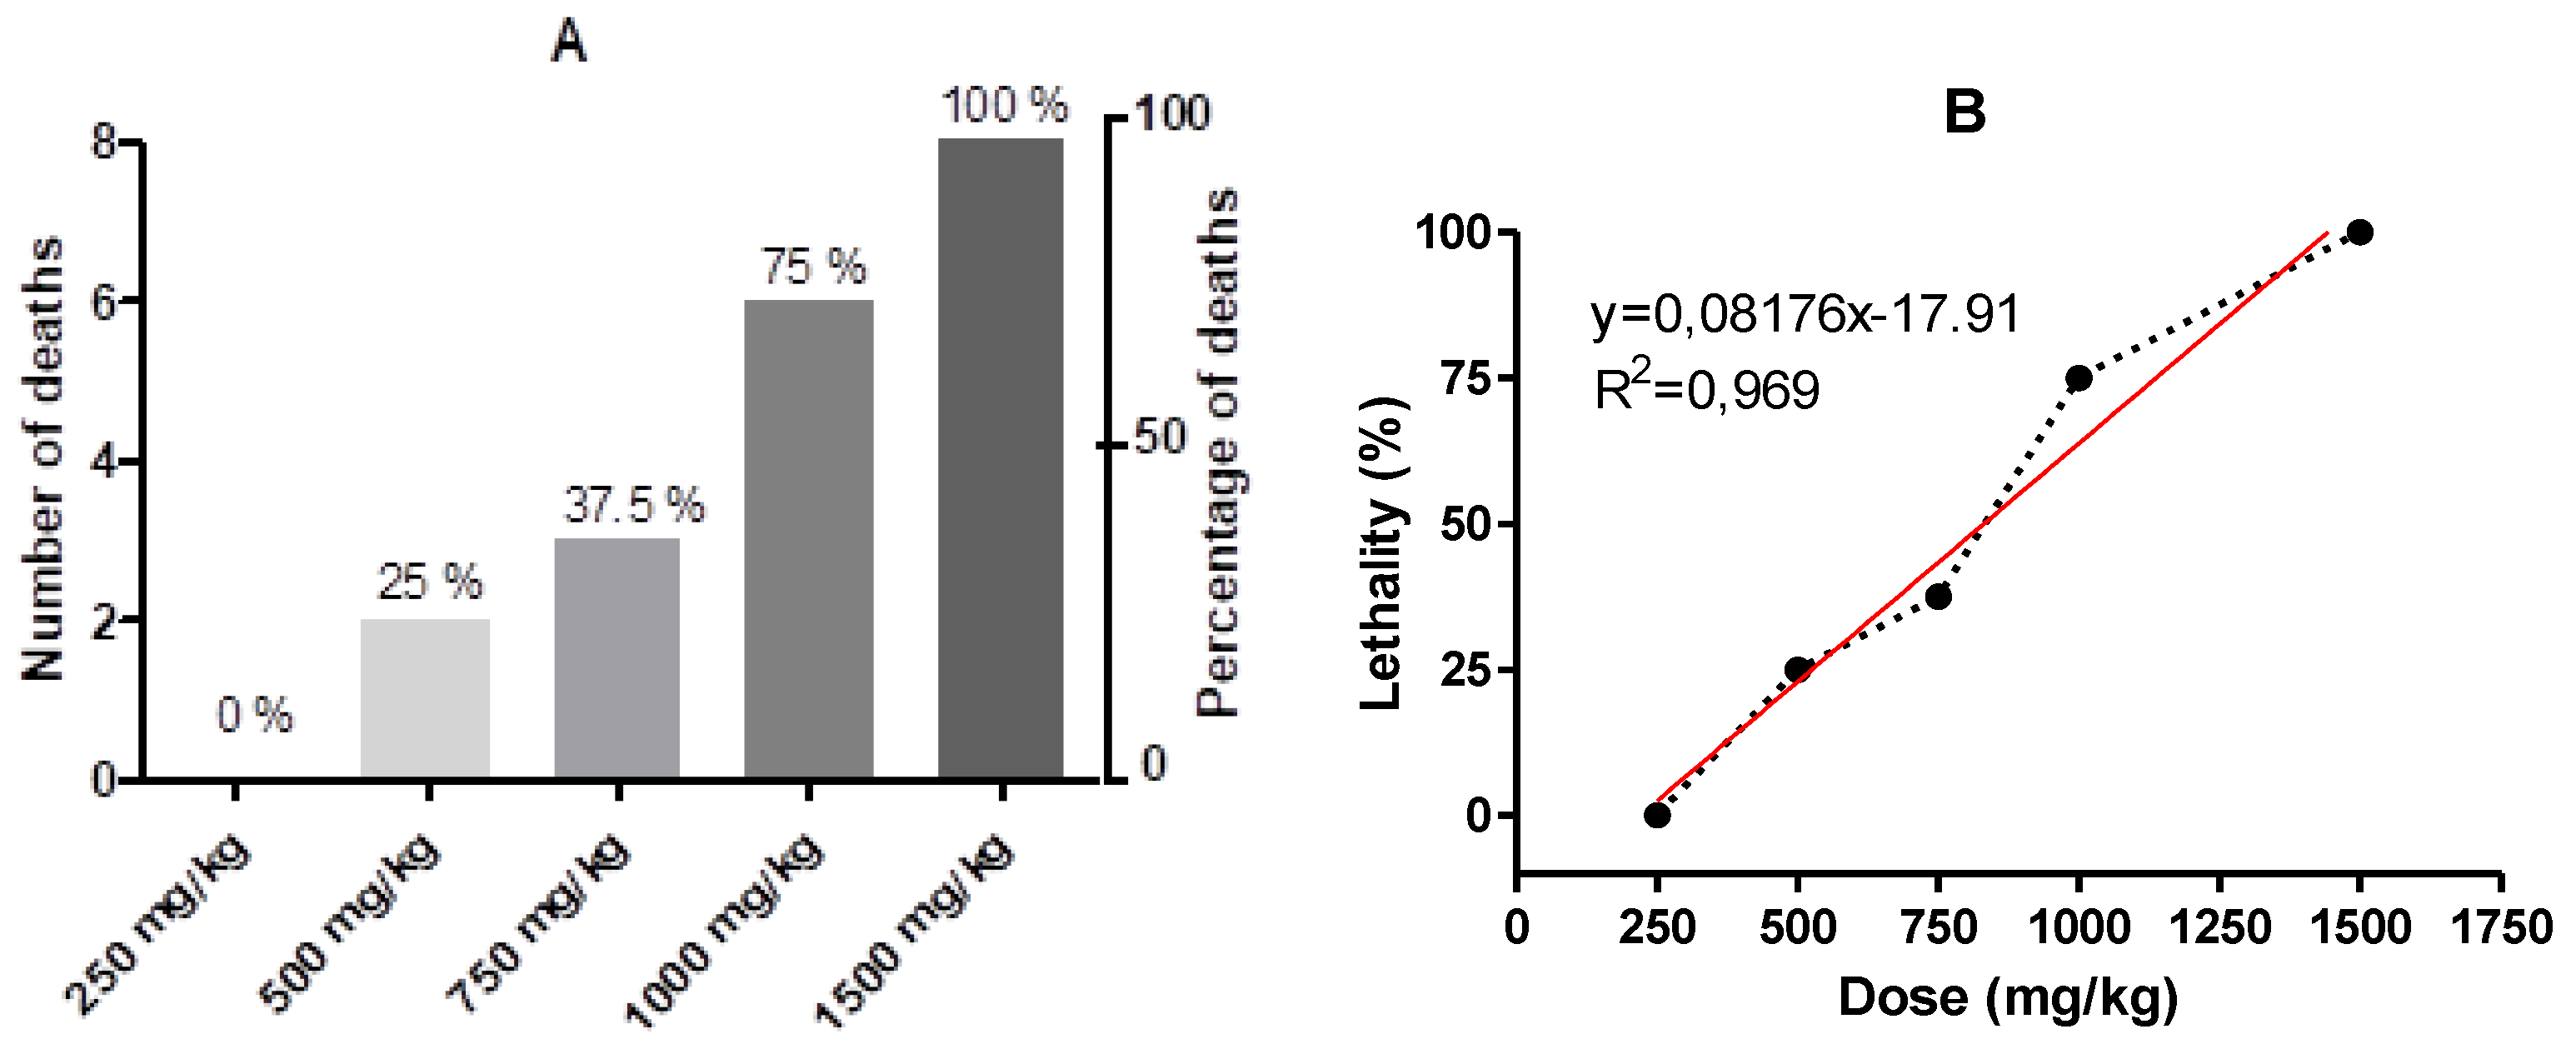
Figure 9.
Treatment effects on edema formation in zebrafish after 5h of treatment. (PBS), DCF (Diclofenac 25 mg/kg), VEH (Nanodispersion vehicle), NBO10 (NBO 10 mg/kg), NBO 20 (NBO 20 mg/kg) and NBO 40 (40 mg/kg).
Figure 9.
Treatment effects on edema formation in zebrafish after 5h of treatment. (PBS), DCF (Diclofenac 25 mg/kg), VEH (Nanodispersion vehicle), NBO10 (NBO 10 mg/kg), NBO 20 (NBO 20 mg/kg) and NBO 40 (40 mg/kg).
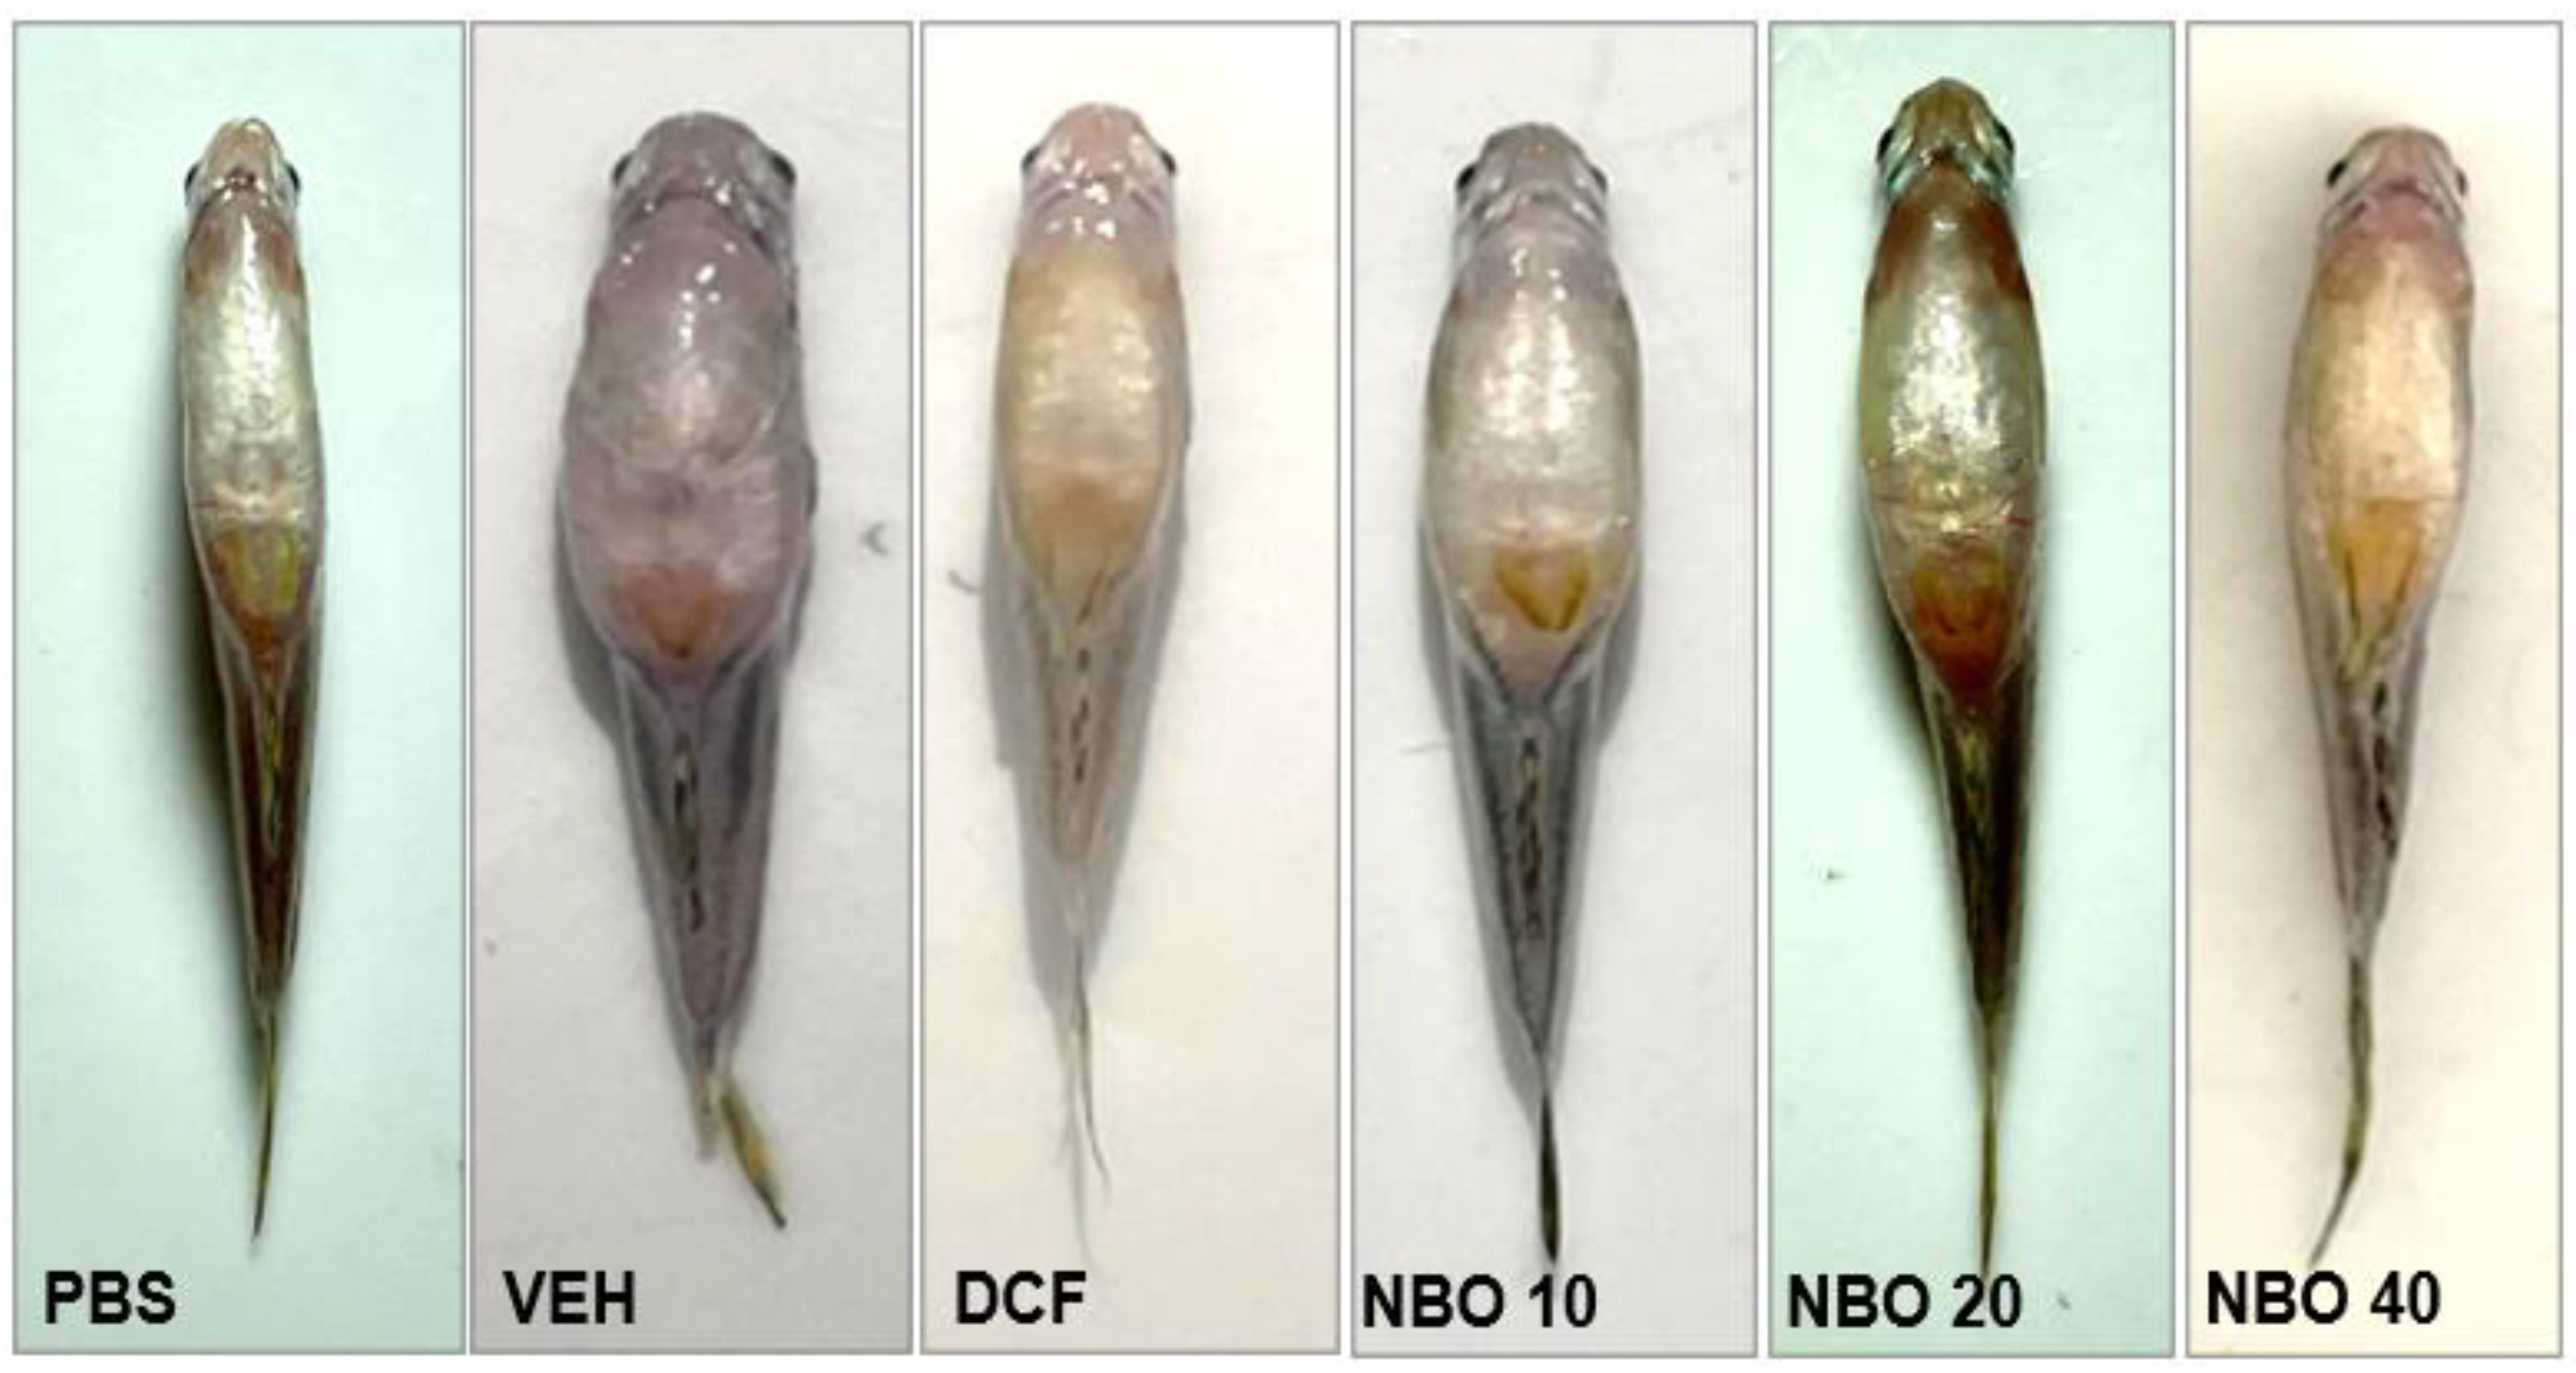
Figure 10.
Treatment effect on intraperitoneal edema induced by carrageenan. (A) Evolution of edema over time. (B) The area under the curve of the results. (C) Percentage of edema inhibition. Groups (PBS), DCF (Diclofenac 25 mg/kg), and NBO doses of 10, 20, and 40 mg/kg. *** (p < 0.001) represents statistically significant results compared to the NBO vehicle group.
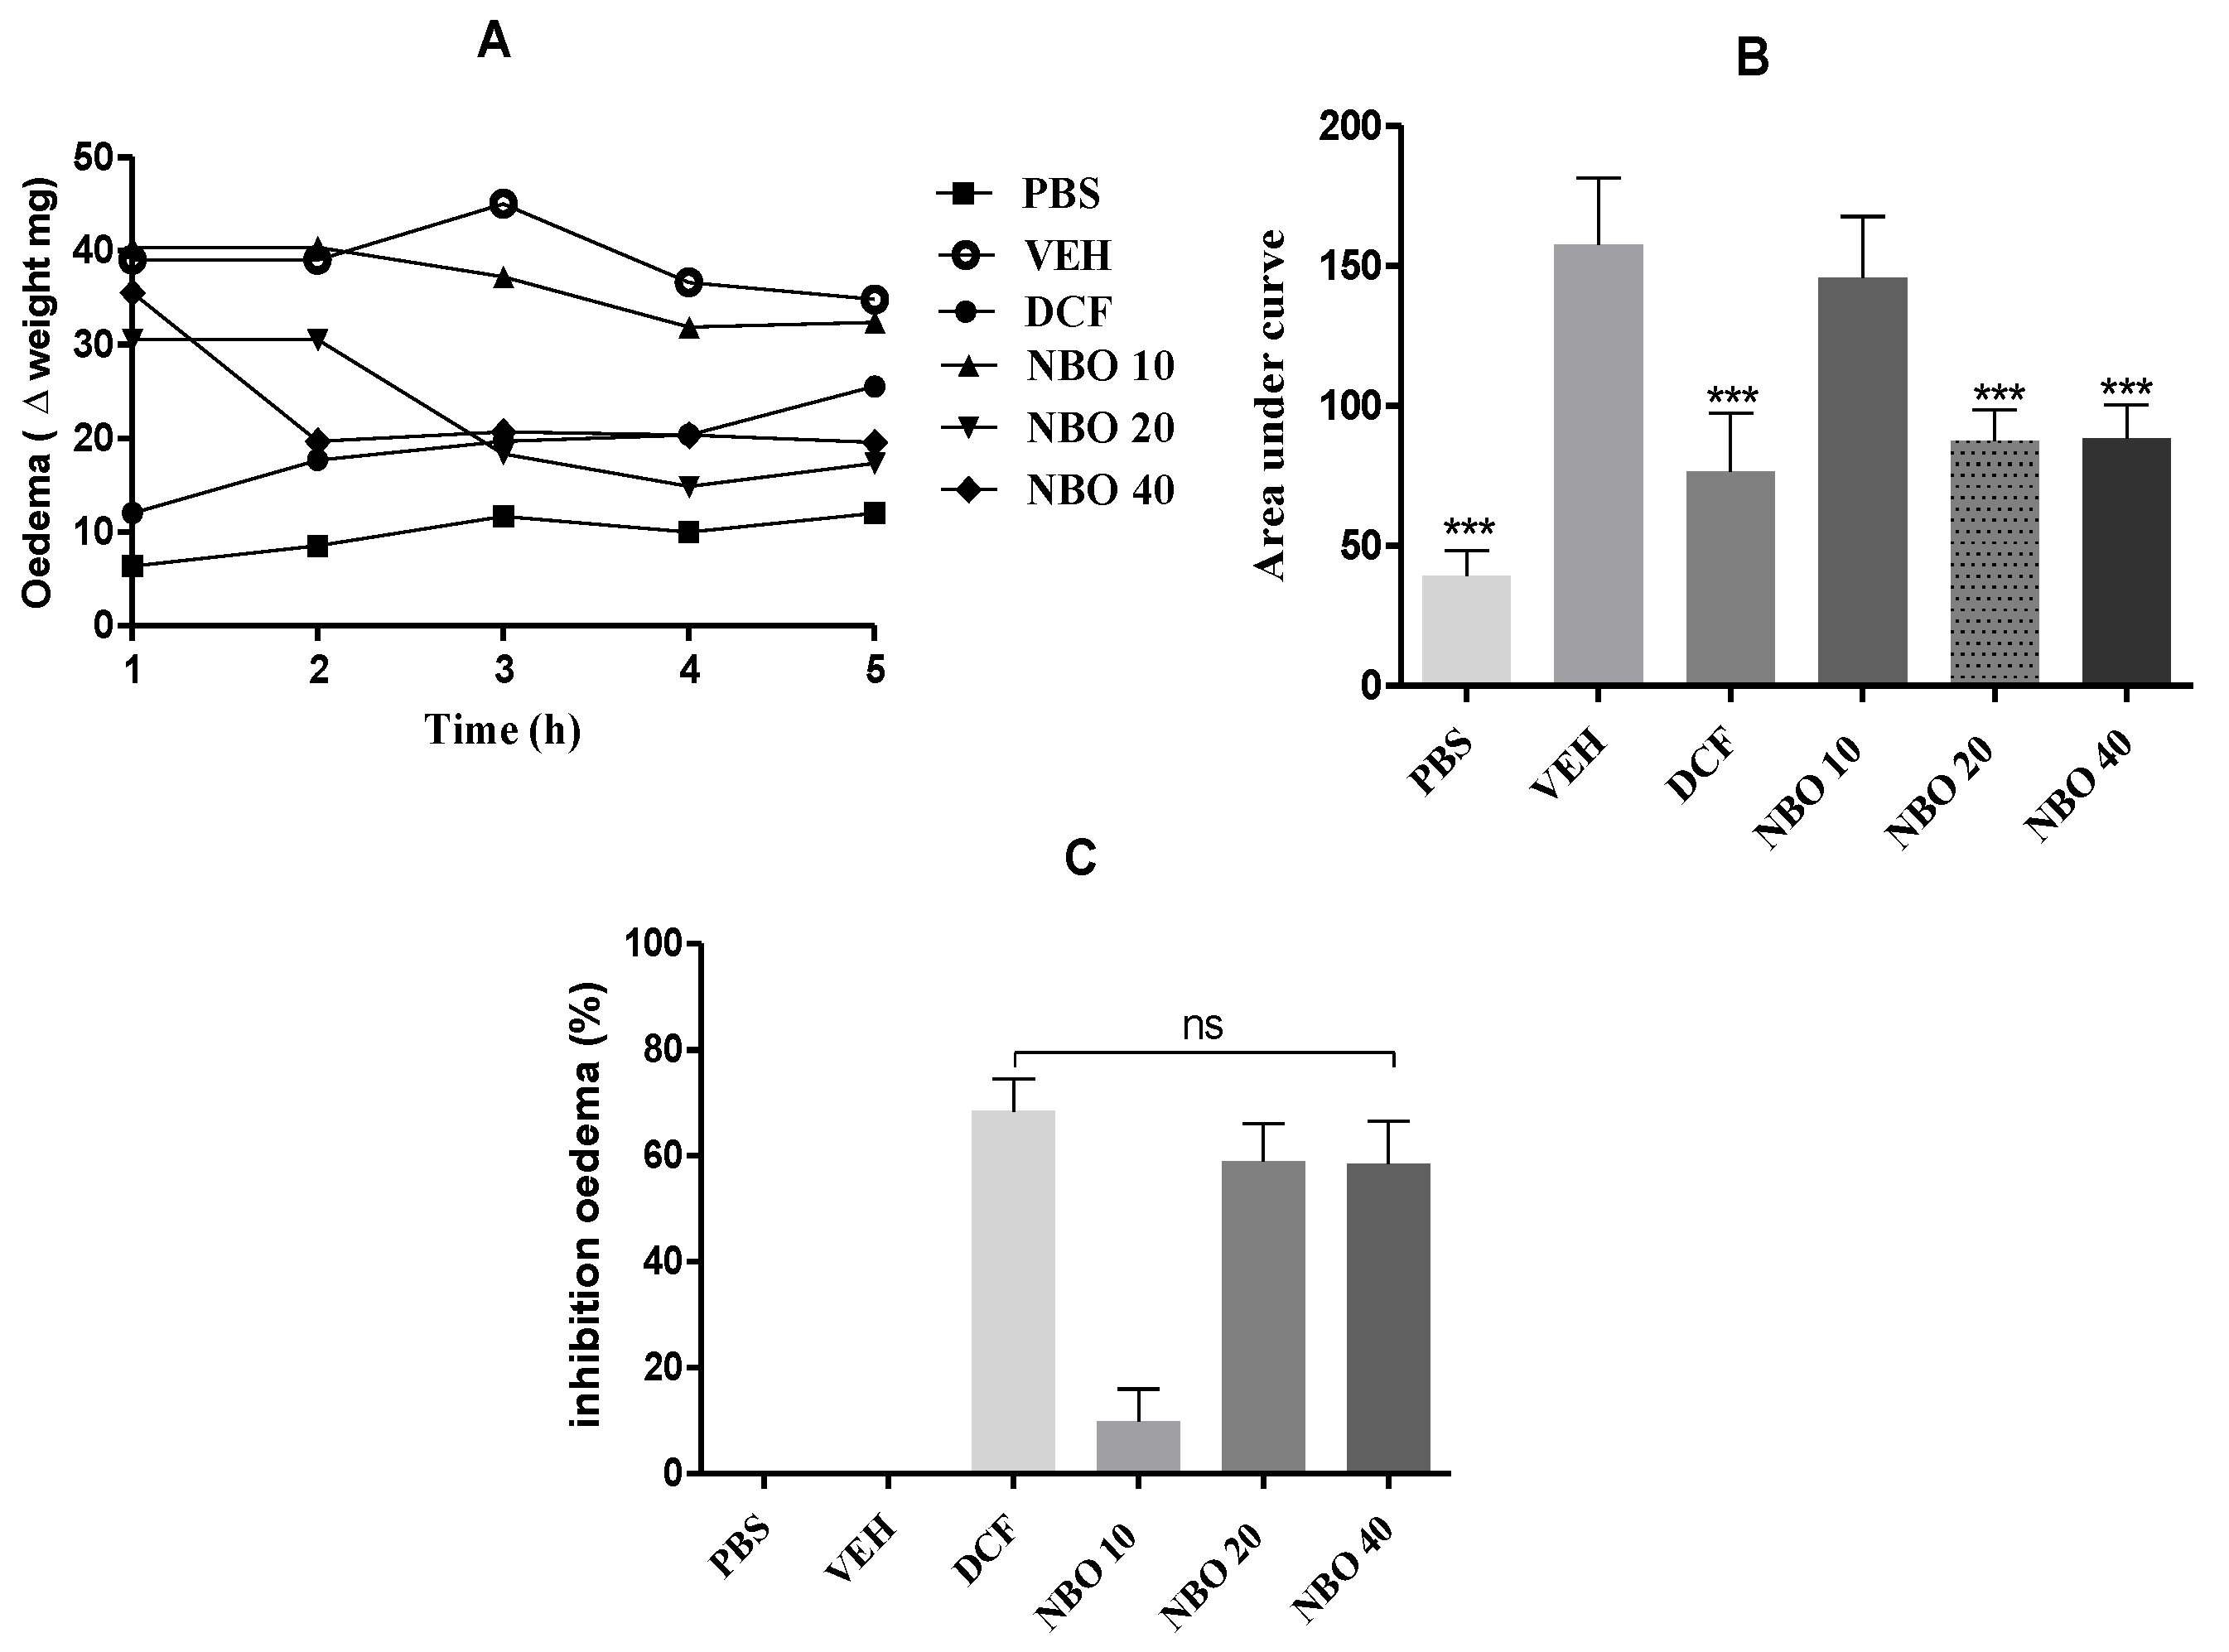
Figure 11.
Photomicrographs of zebrafish liver in longitudinal sections from the groups (PBS), DCF (Diclofenac 25 mg/kg), VEH (Nanodispersion Negative Control), NBO 10 (NBO 10 mg/kg), NBO 20 (NBO 20 mg/kg) and NBO 40 (NBO 40 mg/kg). Hp (normal hepatocytes; VC (cytoplasmic vacuolization); Vs (blood vessel).
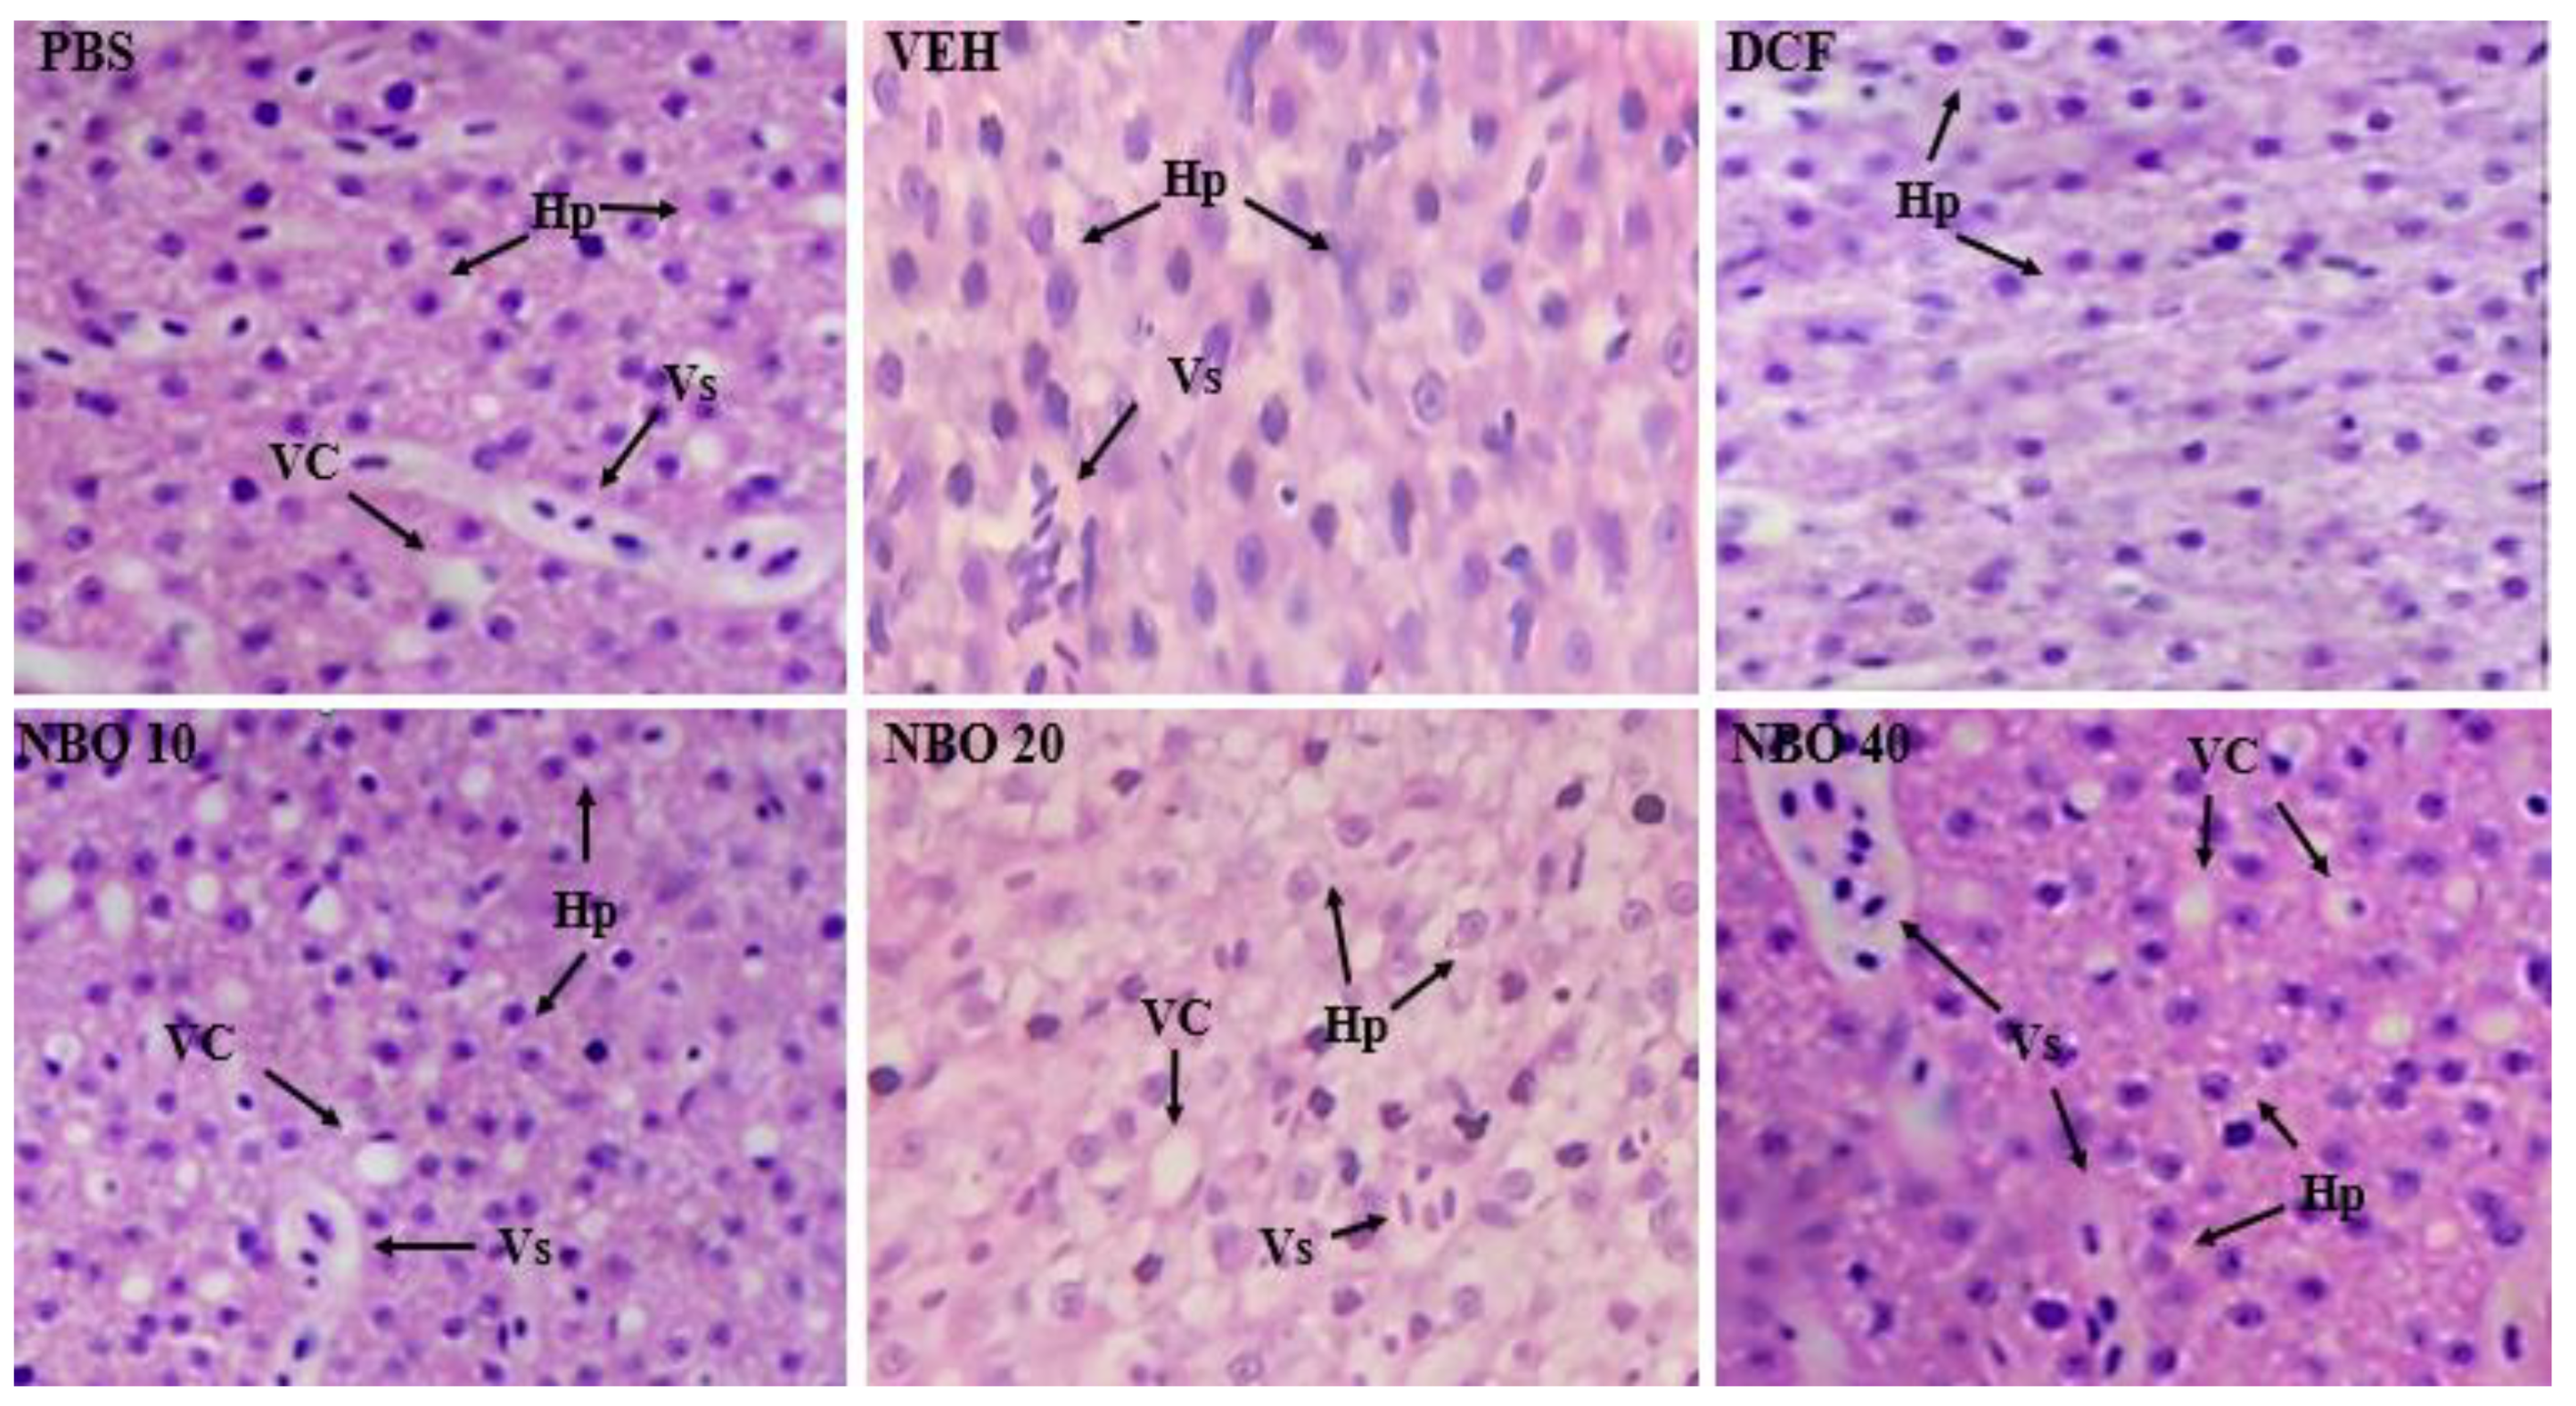
Figure 12.
Photomicrographs of zebrafish kidneys in longitudinal sections from the groups (PBS), DCF (Diclofenac 25 mg/kg), VEH (Nanodispersion Negative Control), NBO 10 (NBO 10 mg/kg), NBO 20 (NBO 20 mg/kg) and NBO 40 (NBO 40 mg/kg). TR (renal tubules) ILE (leukocyte infiltrate); DgT (mild tubular degeneration).
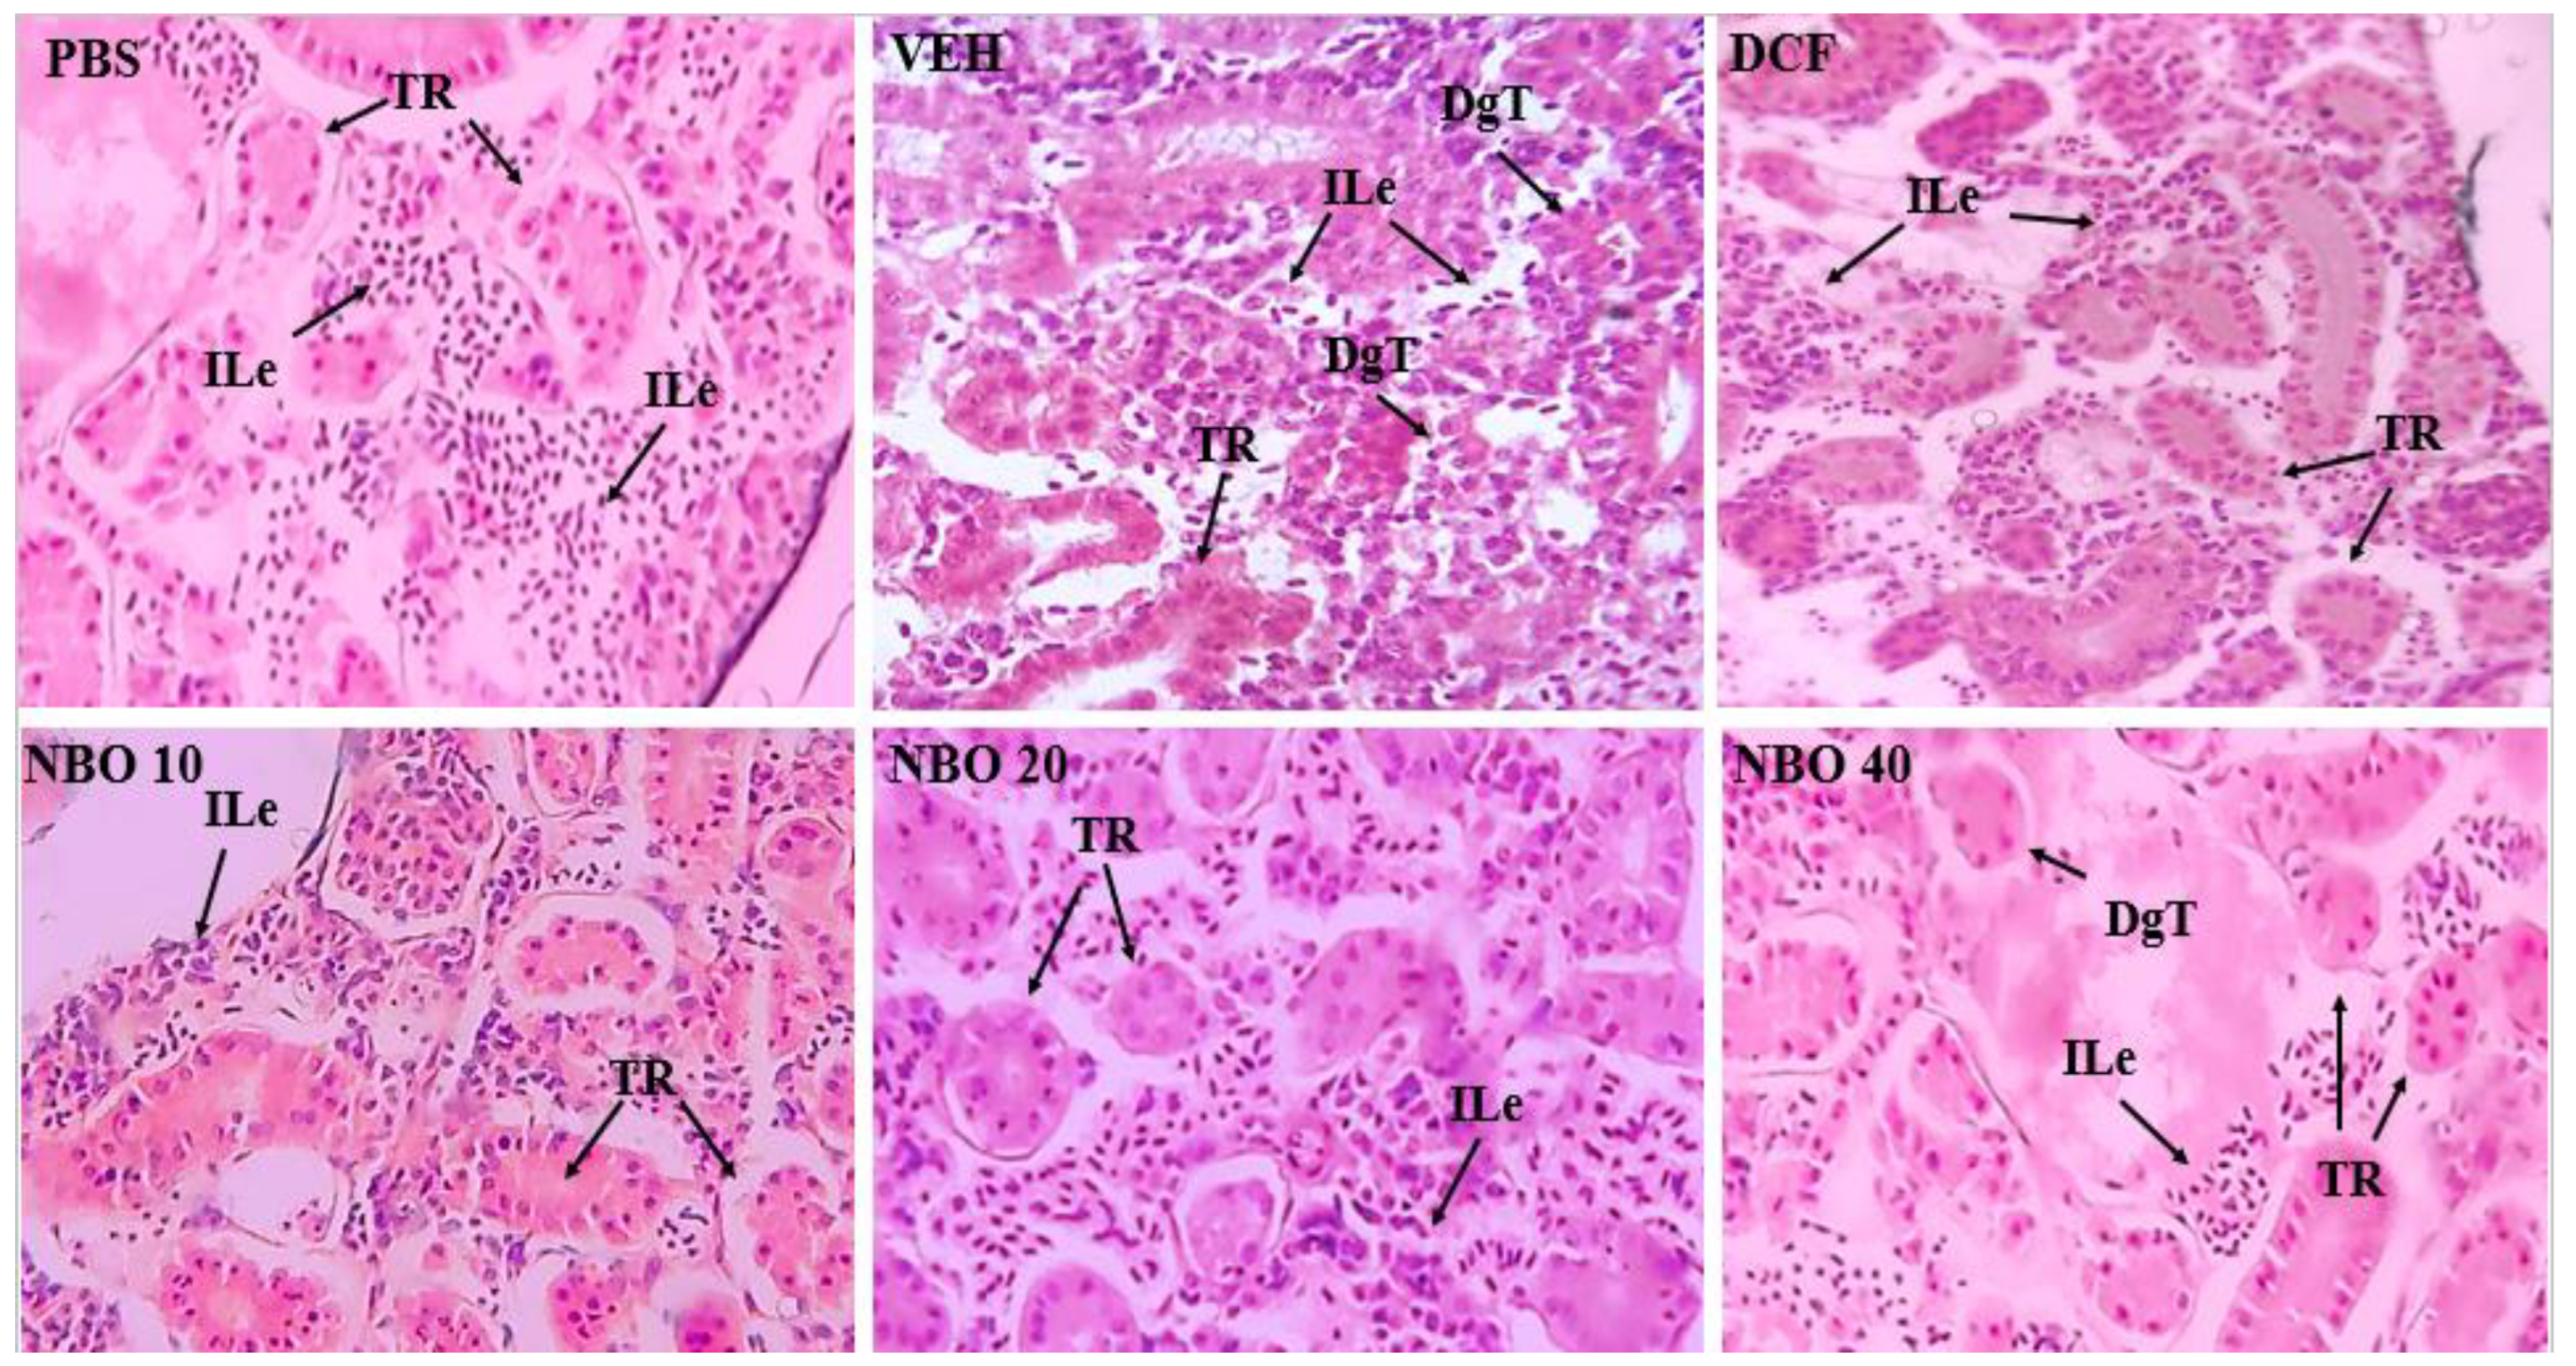

Table 1.
Analysis of the Zeta potential (mV), average size (nm), and polydispersity index (PDI) of the nanodispersion (NBO).
Table 1.
Analysis of the Zeta potential (mV), average size (nm), and polydispersity index (PDI) of the nanodispersion (NBO).
| Zeta Potential (mV) | Average Size (nm) | PDI | |
|---|---|---|---|
| Day 0 | 19.86±0.60 | 53.15±0.64 | 0.533±0.008 |
| Day 7 | 15.26±0.32 | 58.06±0.76 | 0.594±0.007 |
| Day 30 | 19.66±1.45 | 59.90±3.63 | 0.594±0.014 |
Analyzed at 0, 7, and 30 days after obtaining the NBO, showing the average and standard deviation (n = 3).
Table 2.
ADMET and toxicity profile δ-tocotrienol.
| Properties | δ-tocotrienol |
|---|---|
| Predicted LD50 (mg/kg) | 500 |
| Predicted Toxicity Class | 4 |
| AMES toxicity | No |
| Max. tolerated dose (human) | 0.538 |
| hERG I inhibitor | No |
| hERG II inhibitor | Yes |
| Oral Rat Acute Toxicity (LD50) (mol/kg) | 2.047 |
| Oral Rat Chronic Toxicity (LOAEL) (log mg/kg, bw/day) | 2.810 |
| Hepatotoxicity | No |
| Skin Sensitisation | No |
| T. Pyriformis toxicity (log ug/L) | 1.931 |
| Minnow toxicity (log mM) | -2.229 |
Table 3.
Results of binding interactions of the compounds with target TRAP1.
| δ-tocotrienol | |
|---|---|
| Binding Energy (kcal/mol) | -6.0 |
| Ligand efficiency | -0.210 |
| Estimated Inhibition constant {(Ki) (μM)} | 40.5 |
Table 4.
Predicted interactions of docked conformations of δ-tocotrienol against structure of TRAP1.
Table 4.
Predicted interactions of docked conformations of δ-tocotrienol against structure of TRAP1.
| Amino Acid | Interacting | Distance (Å) |
|---|---|---|
| A:PRO361 - :[001 | Alkyl | 4.02 |
| A:PRO365 - :[001 | Alkyl | 3.86 |
| A:ARG400 - :[001 | Alkyl | 4.60 |
| :[001:C21 - A:PRO365 | Alkyl | 3.14 |
| :[001:C26 - A:PRO365 | Alkyl | 4.11 |
| :[001:C27 - A:PRO361 | Alkyl | 4.19 |
| :[001:C27 - A:MET363 | Alkyl | 4.33 |
| A:TYR459 - :[001:C21 | Pi-Alkyl | 4.74 |
| A:PHE462 - :[001:C16 | Pi-Alkyl | 4.61 |
| A:PHE462 - :[001 | Pi-Alkyl | 4.95 |
| A:PHE462 - :[001:C21 | Pi-Alkyl | 4.25 |
| :[001 - A:MET367 | Pi-Alkyl | 4.78 |
Table 5.
Key parameters in density functional theory analysis and their values.
| Parameters(eV) | δ-tocotrienol |
|---|---|
| EHOMO (eV) | -0.1923 |
| ELUMO (eV) | 0.0051 |
| ΔE(LUMO-HOMO) (eV) | 0.1974 |
| Ionization Energy I = -E(HOMO)(eV) | 0.1923 |
| Electron Affinity A = -E(LUMO) (eV) | -0.0051 |
| Electronegativity index χ = (I + A)/2 (eV) | 0.0936 |
| Chemical potential μ = - χ | -0.0936 |
| Chemical Hardness η = (I - A)/2 (eV) | 0.0987 |
| Softness 1/η eV−1 | 10.13 |
| Electrophilicity index ω = μ2/2 η | 0.0444 |
Table 6.
Behavioral alterations were evaluated in the toxicity test of different concentrations of NBO - Bixa orellana nanodispersion oil (Chronic in®) in zebrafish.
Table 6.
Behavioral alterations were evaluated in the toxicity test of different concentrations of NBO - Bixa orellana nanodispersion oil (Chronic in®) in zebrafish.
| GROUPS (N=8) | ||||||
|---|---|---|---|---|---|---|
| Time | Stages | NBO 250 mg | NBO 500 mg | NBO 750mg | NBO 1000 mg | NBO1500 mg |
| I | 1 (8) | 1 (8) | 1 and 2 (8) | 1 (8) | 1 (8) | |
| 1h | II | 1 (8) | 1 (8) | 1 and 2 (8) | 1 and 2 (8) | 1 and 2 (8) |
| III | 1 and 2 (8) | 1, and e 3 (8) | ||||
| I | 1 (7) | 1 (8) | ||||
| 3h | II | 1 (5) | 1 (5) | 1 and 2 (8) | 1 and 2 (8) | |
| III | 1 | 1 and 2 (8) | 1, 2 and 3 (6) | |||
| I | 1 (5) | 1 (6) | ||||
| 9h | II | 1 (3) | 1 (5) | 1 and 2 (8) | ||
| III | 1 and 2 (8) | |||||
| I | ||||||
| 24h | II | 1 (6) | 2 (8) | |||
| III | 1, 2 and 3 (3) | |||||
| I | 1 (3) | 1 (8) | ||||
| 48h | II | 1 and 2 (3) | ||||
| III | 3 (2) | |||||
Stage I: 1) increased swimming activity and 2) tremors in the tail axis; Stage II: 1) Circular swimming and 2) Posture loss; Stage III: 1) Motility loss; 2) Deposition of the animal at the bottom of the aquarium and 3) Death. (n) Number of animals with alterations.
Disclaimer/Publisher’s Note: The statements, opinions and data contained in all publications are solely those of the individual author(s) and contributor(s) and not of MDPI and/or the editor(s). MDPI and/or the editor(s) disclaim responsibility for any injury to people or property resulting from any ideas, methods, instructions or products referred to in the content. |
© 2025 by the authors. Licensee MDPI, Basel, Switzerland. This article is an open access article distributed under the terms and conditions of the Creative Commons Attribution (CC BY) license (http://creativecommons.org/licenses/by/4.0/).
Copyright: This open access article is published under a Creative Commons CC BY 4.0 license, which permit the free download, distribution, and reuse, provided that the author and preprint are cited in any reuse.


