
Submitted:
01 April 2025
Posted:
01 April 2025
You are already at the latest version
Abstract
Virtual Reality (VR) has existed in the realm of education for over half a century, however it has never achieved widespread adoption. This was traditionally attributed to costs and usability problems associated with the technologies, but a new generation of consumer VR headsets has helped mitigate these issues to a large degree. Arguably the greater barrier is now the overhead involved in creating educational VR content, the process of which has remained largely unchanged. In this paper we investigate the use of 360∘ video as an alternative way of producing educational VR content with a much lower barrier to entry. We report on the differences in user experience between 360∘ and standard desktop video. We also compare the short and long term learning retention of tertiary students who viewed the same video recordings, but watched them in either 360∘ or standard video formats. Our results indicate that students retain an equal amount of information from either video format but perceive 360∘ video to be more enjoyable and engaging, and would prefer to use it as a supplementary material in their coursework.
Keywords:
360 degree video
; education
; evaluation
; virtual reality
; information retention
1. Introduction
In the past two decades numerous studies have demonstrated the benefits of Virtual reality (VR) over multiple levels of education [1,2] and in many application domains [3,4].
The term VR encompasses the array of software and hardware that creates a digital representation of a 3D object or environment, with which a user can interact and feel a sense of immersion. Immersion is one of the primary motivations for educators employing VR, because a sense of immersion in students can foster engagement with learning content [5,6,7].
The definition of immersion is widely debated. In this paper we use an integrative definition from Mütterlein, describing immersion as “the subjective experience of feeling totally involved in and absorbed by the activities conducted in a place or environment, even when one is physically situated in another” [8]. This activity-centric definition allows immersion to be differentiated from the related concept of presence, which describes ‘how realistically participants respond to the environment, as well as their subjective sense of being in the place depicted by the Virtual Environment’ [9]. A heightened sense of presence in a virtual environment is associated with increased immersion in the learning activities performed there [4].
VR has encompassed experiences on many different devices with different levels of immersion and interactivity, from low–immersion, 2D computer screens; to fully–immersive, VR head-mounted displays (HMDs). However, there has been a recent surge in consumer interest in VR and the concurrent release of a new generation of affordable HMDs and peripherals, greatly reducing the barrier of entry to immersive VR [10,11,12,13]. This has transformed the landscape of research into VR and seen educational literature focus on immersive VR as a newly accessible option.
Immersive VR provides a complete simulation of a new reality by tracking the user’s position and creating multiple sensory outputs through a VR HMD [14]. It has been successfully applied to education in many fields, including engineering [15], architecture [16], medicine [17], history [18], and music [19]. Educators using immersive VR often rely on constructivist pedagogy, because the medium facilitates the experiential and environment-driven learning at the centre of this methodology [20,21]. Studies have consistently found positive learner attitudes towards immersive VR [22], and it has been shown to improve time on task [23], motivation [6], and knowledge acquisition [24].
Despite these findings, immersive VR has failed to achieve widespread adoption in education. Traditionally this failure was attributed to the high cost and questionable usability of the technology [2,3,20,25]. With modern VR systems available, this hesitance now arguably comes from educators weighing two other factors: whether there is evidence that VR has enough of an impact on students’ learning to justify costs; and whether they can guarantee the availability of VR content in the long term [22].
Currently, if educators wish to create their own VR content, they either have to learn how to program 3D graphical applications themselves, or hire content developers to create it for them [26,27]. Novel technologies such as neural radiance field [28] and photogrammetry [29] have made it easier to create customized 3D content, but content creation is still a major barrier towards a wider use of VR in education.
In an attempt to address these barriers to VR adoption, we investigated 360° video as an alternative type of educational VR content. 360° video, when viewed inside an HMD, can be considered a subset of immersive VR [30,31]. It provides a movable, user-centric viewpoint inside an immersive, digitally projected environment. However, it is limited in that the user cannot directly interact with or navigate through the environment.
360° video is much easier to create than interactive VR. Spherical cameras that capture 360° video have followed a similar trajectory to VR HMDs, with a recent generation of consumer–focused models greatly reducing the cost barrier [32,33]. In response to this, popular video sharing platforms YouTube and Facebook added support for 360° video in 2015, and later Vimeo in 2017 [34]. Once captured, 360° video can be edited using traditional video editing software in the same file formats as standard videos [35,36]. This means that 360° video is cheaper to make than immersive VR, more easily sharable, and requires less upskilling of current content creators. Recent research has looked into making 360° video more useful by proposing more powerful editing algorithms [37] and mixing it with other media [38,39].
Research into educational 360° video is a relatively new, but it has already been applied to many fields, including medicine [40,41], language [30], sports [42], business [43], collaborative design [44], education and training [45,46,47,48], sustainability [49], and marine biology [50]. The literature suggests many of the same benefits as immersive VR, such as enjoyment, motivation, and improved learning outcomes cite, though more research is needed in this area [34,51,52].
Many of these studies were applied to domains that the researchers believed would particularly benefit from 360° video [30,42]. The evaluated videos were often hard to compare to standard videos because they were embellished with features that do not translate between the mediums [40,50]. Additionally, the studies directly comparing 360° video to standard video only evaluated learning through immediate knowledge tests [40,42,43].
In this paper we describe a randomized, crossover study in which we sought to compare the effects of 360° video and standard video. Twelve videos were recorded and then produced in both 360° and standard video formats.
To minimise the effect of domain and prior knowledge, the content presented was believable but fictitious. To ensure a comparable learning experience from the same video presented in either video format, we placed certain restrictions on the production of the 360° videos, which incidentally lead to parallel production processes between the two video types. And to measure learning outcomes that had not yet been investigated, we included long-term retention and special cases for active and passive visual recollection in our study design.
Participants were divided into two groups, each experiencing six of the videos in one format, followed by the other six in the other format. After watching the videos they were asked to complete both a User Evaluation and a Short-term Retention Test. Six weeks later, participants were asked to complete a follow–up Long-term Retention Test.
This paper reports on both the results of the User Evaluation, and the comparative short and long term learning outcomes of participants who viewed the same video in 360° and standard formats. This is, to the best of our knowledge, the first time long–term learning retention has been investigated for 360° video.
1.1. Research Questions
- RQ1:
- What differences in user experience exist when presenting educational content in 360° video on a virtual reality head-mounted display, compared to standard video on a desktop PC?
- RQ2:
- What differences in short and long term learning retention exist when presenting educational content in 360° video on a virtual reality head-mounted display, compared to standard video on a desktop PC?
2. Materials and Methods
This is a randomized, crossover study intended to compare the learning experience of 360° video, viewed on a VR HMD, to standard video, viewed on a desktop PC. The study was spread over a six-week period and collected results about the user experience and short and long term learning retention of participants.
2.1. Participants
In total 20 tertiary students participated in the study, 16 of which were undergraduate and 4 postgraduate. Of these students, 18 were male and 2 were female. The mean age of participants was 25, however the ages of the participants varied greatly (standard deviation=9.02, minimum age=18, maximum=55). No participants dropped out of the study, and all successfully completed all activities.
2.2. Educational Content
There were two primary considerations when designing the educational content used during this study. Firstly, we wanted to limit the effect that application domain may have on learning outcomes of students. Participants may have prior knowledge in different domain areas, affecting the study, and we wanted to confirm that the benefits of 360° video were not constrained to especially well-suited subjects. Secondly, we needed to create videos covering the exact same learning content in 360° and standard formats.
As a result of these considerations we created a series of 12 short lectures in both video formats, filmed at 12 visually distinctive locations (e.g., a forest, a lecture theatre, a playground, inside a car). In 10 of these locations, a teacher would present a series of facts about that particular location, sometimes referring to visible features around them. The other two locations will be discussed in Section 2.3, Special Case Videos.
To address the effect of domain and prior knowledge, the location names and information presented in the videos were designed to be believable, but were actually fictitious. For example, in the Whiterock Bush video recording, participants were informed that the area had been the site of `the frequent illegal dumping of rubbish’. Whiterock Bush is not a real location, nor is the presented fact true. Participants were not informed that the information was fictitious until after the study was complete, as that knowledge could have an effect on learning outcomes.
Ensuring the two video formats provided the same information placed two limitations on video development. Firstly, as extra information is visible when viewing a 360° video, we needed to ensure learning did not rely on content outside of the frame captured in the standard video. Secondly, the quality of accessible 360° cameras varies considerably, and while the pixel resolution is high compared to standard video, it is stretched over the full sphere when viewed. This is compounded by re-projection through VR HMDs of varying resolutions, leading to 360° video experiences often being low quality with poor text legibility. It is for this reason we chose to use verbally-delivered lectures in visually distinct locations as the educational content.
We also decided to reduce the resolution of the standard videos to match that of the 360° videos. Although current technology results in a difference in resolution between typical 360° and standard desktop video, we anticipate that in the future the gap will close and the experience of resolution in each technology will be more similar. We adjusted the resolution to ensure our results are more robust to changes in technology and not significantly influenced by the current technology limits.
2.3. Special Case Videos
There were 3 additional factors of interest we wanted to measure, for which we designed 2 special case videos, and modified one of the location-based lectures.
Firstly, as arguably the most common setting for tertiary educational videos, we included a lecture theatre as one of the locations. Rather than presenting facts about the location in this recording, we instead performed a traditional lecture where information was presented both verbally and via an overhead projector. This was done to evaluate whether increasing the feeling of presence in a lecture theatre would affect learning outcomes.
We were also interested in whether viewing a video in 360° would affect the active and passive recollection of visual information. To investigate active visual recollection, we included a recording located inside of a car. Participants were not presented with any facts, but were instead asked to memorize as much detail as they could about the interior of the vehicle. They were later tested on this information.
To investigate passive visual recollection, a bright red ribbon was tied around a tree in one of the existing locations. The ribbon was clearly visible in the recordings, however the ribbon was never explicitly mentioned by the speaker at this location. Participants were later asked to recall where they had seen this ribbon among 3 visually similar locations.
2.4. Technologies
The 360° videos were captured using a Ricoh Theta S spherical camera, and were displayed on a Samsung Gear VR HMD (used in conjunction with a Samsung Galaxy Note 5).
The standard videos were obtained using the free and open-source OBS Studio to take screen recordings of the 360° videos, running on the free Ricoh Theta desktop video player software. They were recorded at 60fps and adjusted to 1920x1080 resolution, to match the 360° video resolution. Standard videos were played on a 23” PC monitor with a resolution of 1920x1080.
In most of the standard videos, all necessary information was contained withing the intial field of view. However, in some locations small rotations of the camera were needed to include other details. These rotations were integrated into the standard video recordings, not controlled by or performed in front of the participants.
In total 24 video clips were created, both the 360° and standard versions of each location and lecture. For a detailed description of the content creation process, as well as the issues we encountered see [53].
2.5. Study Design
Participants were randomly divided into Groups 1 & 2. Both groups were shown all 12 recordings, however Group 1 was shown locations 1–6 in 360° video on a VR HMD, and locations 7–12 in a standard video on a desktop PC. Group 2 was shown the opposite videos on the HMD and PC (see Table 1). This is a randomized, crossover design for the user experience of the video formats, with both groups experiencing both treatments, then comparing them through a User Evaluation.
This study is additionally a randomized design for learning outcomes between the video formats, achieved by comparing the test scores of participants experiencing the same recordings in different formats. These scores were obtained from both a Short Term Retention Test and Long Term Retention Test.
The groups compared in this second design are not Groups 1 & 2, but rather the pseudo-groups HMD and PC. This is because the scores associated with experiencing 360° video will include question scores from both Groups 1 and 2, depending on the recording being assessed by each individual question. In fact, all participants conditionally appear in both pseudo-groups, since all participants experience both 360° and standard videos.
2.6. Assessment Instruments
Three assessment instruments were used in this study: a User Evaluation, a Short Term Retention Test, and a Long Term Retention Test.
The User Evaluation was 12 questions long, comprising 4 Likert Scale questions, 1 short answer question, and 7 open-ended questions. In all questions participants were asked to compare 360° and standard video experiences, except the final question, which directly asked participants for their opinion on 360° video as an educational tool.
The User Evaluation included questions about participants’ senses of enjoyment, immersion, and engagement while watching the different video formats. These are some of the demonstrated benefits of immersive VR, and we wanted to validate that they were evident in 360° video as well.
The Short Term Retention Test was 20 questions long, comprising 14 multiple choice questions and 6 short answer questions about the content of the video recordings. This test also included questions about the active and passive visual recollection from the special case videos.
The Long Term Retention Test was 21 questions long, comprising 15 multiple choice questions and 6 short answer questions. It is identical to the Short Term Retention Test except for 4 questions, which are slight simplifications of 3 of the original questions. 2 of these let the participants recall information from an image instead of a location name, and 1 short answer question asking for two pieces of information was split into both a short answer and multiple choice question.
The Short and Long Term Retention Tests were divided into 2 sections, Content Retention and Location Recognition. Questions about Content Retention focused on the recall of the information participants were taught during the lectures, while the Location Recognition questions targeted visual information about the recording locations. The questions were designed to be unambiguous and binary in nature, allowing for a rigid marking rubric.
2.7. Study Procedure
Participants were first asked to fill out a Demographic Questionnaire. This questionnaire collected basic information, including the participants’ age, area of study, experience with VR HMDs, and whether they had any issues affecting their vision (so the HMD could be adjusted accordingly).
Next participants were asked to put on the HMD, and instructed to complete both a pre-installed Oculus Tutorial as well as watch a 2 minute long introductory lecture in the HMD. This was to familiarize the participants with 360° video.
After the familiarization protocols, participants were asked to watch the first set of videos on either the HMD or the PC, depending on the group they had been assigned to (see Table 1). These video sets were each comprised of 6 location recordings stitched together, forming one continuous recording approximately 5 minutes long.
Participants were then asked to perform an unrelated reading task for 3 minutes, designed to act as a distractor between the 2 video sessions. After the distractor task, they were shown the second set of videos in the other video format.
When they had finished viewing the video content, participants were asked to complete both the User Evaluation and Short Term Retention Test. 6 weeks later, participants were asked to complete the online Long Term Retention Test.
3. Results
This section is split into three primary subsections. Section 3.1 discusses the results of the score-based questions in the User Evaluation, before Section 3.2 reports on our thematic analysis of the open-ended responses. Section 3.3 then outlines our statistical analysis of the results of the Short and Long-term Retention Tests.
3.1. Quantitative User Evaluation
The User Evaluation was a combination of Likert Scale, short answer, and open-ended questions. It was completed by all participants after they had finished viewing both video formats.
This section reports the quantitative results from the 4 Likert Scale and 1 short answer question, discussed in two groups: Subjective Experiences and Study Habits.
3.1.1. Subjective Experiences
In the first 3 Likert Scale questions, participants were asked to rate the degree to which they felt enjoyment, immersion, and engagement while watching the two different video formats. These questions used a 5-point Likert scale, from -2 (Strongly Disagree) to 2 (Strongly Agree), with 0 corresponding to Neutral.
Immersion was described to participants as the degree to which they forgot about their surroundings and ’lost themselves’ in the experience. Engagement was described as the degree to which a learning experience holds their attention and makes them actively focus on their learning.
Table 2 presents the means and medians of the responses to these 3 questions, which range between -2 and 2. It also presents the results of Wilcoxon signed rank tests between the scores for 360° video and standard video, and the Cohen’s d effect sizes where the tests were considered significant at the threshold. Cohen’s d values of 0.20, 0.50 and 0.80 correspond to small, medium and large effect sizes respectively. Wilcoxon tests were used because Likert responses are ordinal, the sample size is small (n = 20), and each group of scores heavily defied a Shapiro-Wilk test for normality.
Based on these analyses, we found statistically significant results across all 3 questions, with participants expressing strong preference towards 360° video over desktop video in all factors.
As Figure 1 shows, participants rated their sense of Enjoyment much more highly for 360° video than standard video. The majority of respondents, 12 of 20, responded neutrally to standard video, with only 5 responding positively. Conversely, 18 participants responded positively to 360° video, with 11 of them saying they “Strongly Agree” that they enjoyed the experience. This is strong evidence that the students enjoyed the 360° versions of the videos more than the standard versions, with a large effect size in our sample.
Figure 2 shows the results of the participants rating their sense of immersion during the 360° or standard videos. Of these 3 subjective Likert questions, this one had the smallest p-value and largest effect size, suggesting that the participants felt much more strongly immersed in the 360° video than the standard one. 19 of 20 participants responded positively to this question regarding 360° video, while 12 responded negatively regarding desktop video.
Regarding engagement, the responses were again much more in favor of the 360° video approach, with 16 of 20 participants rating their engagement level positively, compared to just 5 rating positively for standard video.
Unlike the previous 2 questions however, 2 participants responded negatively regarding their feeling of engagement with the 360° content. While the p-value was significant and the effect size large, this question had the smallest difference between groups of these 3 subjective Likert questions. Potential reasons for this will be expanded on in the discussion, after evidence about attention and distraction is presented in Section 3.2.1.2 of the thematic analysis.
3.1.2. Study Habits
The next two questions concerned the potential study habits of participants using the two video formats. Participants were asked how long they believed they could comfortably study by watching 360° video on a VR HMD, or by watching standard video on a desktop PC. They were then asked how likely they would be to use educational materials of a similar nature to those they had been shown, as a supplementary (but optional) material for their own courses. These were a short answer and a 5-point Likert scale question, respectively.
The differences between the responses to the two video formats were analysed using Wilcoxon signed rank tests, and the effect sizes estimated by Cohen’s d when the result was significant. The results are given in Table 3 and illustrated in Figure 4.
These responses indicate that participants believed they could study using the different video formats for very similar amounts of time. The mean reported time for standard video was 87.1 minutes, with 79.4 minutes for the 360° (). A Wilcoxon signed rank test on the reported times found , showing no significant difference between these times.
Assuming that they had equal and easy access to a desktop PC and a VR HMD, participants showed a statistically significant preference to the idea of using 360° video as supplementary content to their own courses. Most participants answered that they were Likely or Very Likely to use both 360° video and Standard formats, but this number was larger for 360° and weighted towards Very Likely.
3.2. Thematic Analysis
This section outlines the results of our thematic analysis of the open-ended responses to the User Evaluation. The evaluation included 6 questions in which participants were asked to comment on both the standard and 360° video experiences, and a final question in which they were asked their opinion on 360° video as an overall tool for education.
Participants were asked about their senses of immersion and engagement, their level of distraction, their preference of format for lecture recordings, and any issues that were caused by video and screen quality, motion sickness, or other factors.
Qualitative responses were examined for key themes, patterns and outliers based on the Coding in Detail approach outlined by Bazeley and Jackson [54]. NVivo was used for the coding process, and as a result we created 29 codes organized into 4 primary themes: engagement, immersion, learning and technology limitations. These codes were applied a total of 268 times to the data.
To test the validity of this coding scheme, two reviewers independently coded a subset of the data. Cohen’s Kappa was then calculated, resulting in a coefficient of suggesting a high degree of inter-rater agreement.
The 4 primary themes relate to the questions asked, but codes for each theme were spread among responses for every question. The following sections will discuss the findings in each theme, with notable sub-themes presented in subsections where appropriate.
3.2.1. Engagement
Of the 4 primary themes we identified during our analysis, engagement was the most prevalent. Participant responses were coded 117 times as relating to engagement, accounting for 43% of the total coded data.
Responses in this category can be grouped into two major sub–themes: enthusiasm and enjoyment, which follows expected trends based on the quantitative results above; and attention, which revealed substantially more mixed opinions and interesting insights about the video formats. These sub–themes are discussed in further detail in the following two sub–sections.
Enthusiasm and Enjoyment
Mirroring the quantitative results from Section 3.1.1, participants expressed much more enthusiasm and enjoyment regarding learning in 360° video. 12 of 20 participants described it as `enjoyable’ or `fun’, while 4 participants explicitly described the standard video as `boring’.
The major factor to which participants attributed their enjoyment in 360° video was the interactive, immersive environment. One participant said that `the experience of being able to look around and follow visual cues was engaging’, while another described 360° video as `Dynamic’ compared to the `Stagnant’ standard video. This idea of passivity in the standard video was mentioned by another participant, who stated that `It was quite boring to just stare dully at the screen, and try to just take in all the information’.
Another factor that 3 participants mentioned was the novelty of experiencing 360° video. Only 7 of the 20 participants claim to have used a VR HMD for more than an hour in the demographic questionnaire, and many of the others reported an increased sense of curiosity and interest in the immersive environment. Novelty will be discussed in Section 4 as it is likely to impact enjoyment, and also affected the leniency reported in Section 3.2.4.3 below.
Overall, these responses clearly show that participants enjoyed the 360° video format more, but whether this translated into engagement with the learning content itself will be discussed further after more evidence is provided.
Attention
While participants rated the overall engagement of 360° video more highly than standard video, in asking specifically about distractions we were able to find more nuance in this response.
Surprisingly, 11 of the 20 participants claimed to be more distracted in 360° video. Only 5 felt more distracted watching standard video, while 4 claimed no difference or did not compare the formats directly. The interesting factors here, however, are the vastly differing reasons students felt distracted.
Participants who felt more distracted in standard video often cited boredom, repetitive content, and a lack of focus or attention. They also mention distractions from the real world, and that 360° video has an advantage because `it hides distractions in the surroundings.’
For the larger group who felt more distracted in 360° video, the major reason was the extra information available in the surrounding environment. One participant reported they `can’t focus on the speaker because [they’re] curious with the surrounding things’, while another said that 360° video `was very immersive... But I don’t know how much the distraction of looking around was combating the usefulness of it.’ Another participant claimed they `enjoyed being able to look at random things while listening’, but did concede they `got distracted more with this.’
5 participants additionally reported accidental encounters with the real environment as a distraction in 360° video. For example, 2 of these participants specifically mention bumping their foot against the wall while wearing the HMD.
Interpreted together, the responses regarding distraction highlight the distinctions between the two video formats. Watching a standard video is a less engaging activity, but the limited information can help students identify what to focus on for their learning. 360° video is much more fun and engaging, but the immersive environment can pull attention away from the learning content if it is not directly relevant. This is a key finding that will be expanded on further in Section 3.2.3.1 and Section 4.
3.2.2. Immersion
A sense of Immersion was commonly mentioned by the participants, with responses coded to this theme 57 times (accounting for 21% of the coded data). 16 of the 20 participants described experiencing immersion in the 360° video, whereas only 1 of the participants described finding the desktop video (`somewhat’) immersive.
The responses regarding immersion were frequently strongly emotive in nature, with participants using superlatives including `surreal’, `incredible’ and `powerful’ to describe their experiences. As noted in Section 3.2.1.1, immersion in the environment was often given as the reason a participant enjoyed 360° video more than standard video.
Immersion is a primary motivation for using 360° video, so these results are encouraging but not surprising. However, the sources of immersion are useful to understand so that they can be taken advantage of.
Two distinct groupings emerged from this theme: immersion through a heightened sense of presence and realism in the environment; and immersion from a sense of intimacy and closeness to the presenter.
Presence
A feeling of presence in the 360° video was explicitly mentioned by 7 participants, while it was not applied to standard video at all.
One participant wrote `I can feel the surround[ings] with me, just like I am there’, while another said they `Forgot [they were] actually still in a room for a moment...’. A couple of participants related very powerful feelings of presence, one stating `I felt as if I was a new person and I’m in a different world.’
2 participants described the lack of presence in standard video, with one saying it `felt more like looking through someone’s perspective’. Another participant, when comparing the video formats, said of standard video `I imagine I was there, imagining what was there, in contrast to feeling `like I am there’ in 360° video.
A sense of presence can be reinforced by a sense of realism in a virtual environment, and the realism of the 360° video was mentioned by 3 participants. One said `it allows me to step into the content and explore...so it feels like the experience is more real’, and another described 360° video as `a more “real” experience’ than standard video.
The sense of presence potentially afforded by 360° video is a major motivation for its use over standard video, which is reinforced here by our study results.
Intimacy
Another way in which participants experienced immersion in 360° video was through an increased sense of intimacy with the speaker. 3 participants mentioned this directly.
One of the participants listed as a benefit of 360° video: `I found the headset gave me a greater sense of interaction with the presenter, I could understand him a bit more’. Another wrote as a criticism of standard video, `The experience was almost less personal than in VR, so I felt like I could pay less attention to the facts’. This feeling of obligation to the presenter was echoed by a third participant, who wrote `I feel like I have to pay more attention because the person speaking feels more like a real person’.
3.2.3. Learning
This theme encapsulated any discussion about how the video formats may impact learning outcomes, or the learning content of the videos themselves. This was the least common theme, and was only coded 28 times during the analysis (approximately 10% of the coded data).
3 participants said they felt 360° video helped with their learning outcomes, one stating `it seemed like [my] brain learnt by itself as I do not need to concentrate too much’. The other 2 directly mentioned it helping with memory retention, one postulating that `perhaps it also engages spatial processing in the brain more which creates more robust memories’. The other attributed the better retention to novelty and immersion, saying they `felt HMD is the more memorable experience hence [they] would be able to remember and recall more things’.
However, most responses under this theme were about which types of learning content are appropriate for standard and 360° video.
Content
Generally, responses about content suggested that effectiveness of 360° video would depend on the content being taught and how it was presented.
When asked about their preference of video format to watch lecture recordings, 9 participants said they would prefer 360° video, 8 would prefer standard video, and 2 said it would depend on the content of the lecture.
When participants preferred 360° video for lecture recordings, they cited increased immersion and novelty as the reason. One participant even claimed they would use 360° video until their novelty wore off, and likely switch to standard video after that.
The reasons participants would prefer using standard video for lecture recordings included that they can more easily take notes, they would be less likely to encounter distractions, and that a lecture recording is not appropriate content for 360° video. Integrating these last two reasons, one participant wrote `If it’s a lecture recording; there’s no need to be aware of my surroundings - it’d only be an unnecessary distraction’. Another wrote quite directly `The content of the lectures doesn’t get improved by HMD. A lecture is a lecture!’
The topic of content-appropriateness was again mentioned by several participants when giving their opinion of 360° video as an educational tool. In one participant’s words: `For material which benefits from being in the environment, it’s a much more enjoyable way to learn it. For material which has no benefit from being in the environment (e.g., a traditional lecture), the desktop is more comfortable to use.’
A couple of participants linked this idea back to distractions, one saying `the content should be related to the spherical video, otherwise it’s too easy to get distracted.’ This was echoed almost verbatim by another participant, who responded `immersing students in a subject is how you best learn. If you could immerse a student and make sure the distractions are informational, you have a very powerful tool.’
The presentation of learning content is closely tied to the themes of attention and distraction reported above. The implications of these findings will be explored in the discussion.
3.2.4. Technology Limitations
The final theme in our thematic analysis encompasses any issues relating to the technologies themselves. Responses were coded as relating to this theme 85 times (approximately 31% of the coded data), and came largely from questions on the User Evaluation about screen and video quality, motion sickness, and other issues encountered by participants.
The nature of the issues discussed varied considerably, however they can be classified as relating to either the comfort of the participants, or issues with the viewing experience and video quality. The other interesting sub–theme to emerge here is leniency; multiple participants exhibited forgiveness towards technical issues with 360° video. These three sub–themes are discussed below in the final sections of this thematic analysis.
Comfort
Problems with the physical comfort of the HMD were among the most common issues with 360° video, being mentioned by 8 of the participants. Of these, 2 described experiencing a sense of disorientation when removing the HMD, while another expressed difficulty swivelling the computer chair while watching 360° video. The remaining 5 participants all mentioned that the HMD was heavy, with several stating that it was uncomfortable on their neck.
Surprisingly, and despite being explicitly asked about it, only 1 participant reported any motion sickness while wearing the HMD.
The final issue of comfort while viewing 360° video was not physical, but was instead the fact that students cannot take notes while wearing a VR HMD. This was explicitly mentioned by 3 of the participants, 2 of whom provided it as their justification for why they believed that 360° video may not be an effective tool for education overall.
Viewing Experience
An equal number of participants reported issues with the quality of the 360° video and the standard video. 6 participants mentioned their learning was impacted by video or screen quality in each format.
This is surprising because the videos were of the same resolution, but the 360° video is spread over the full visual range of the viewer, generally decreasing perceived quality. We anticipated more issues with 360° video than standard video, but 2 participants even stated they believed the 360° video had a higher resolution than the standard video. This shows a level of leniency that the participants had towards 360° video, which will be noted in the next section.
3 participants encountered a specific issue with the viewing quality in 360° video: the Screen Door Effect. These participants described being able to identify individual pixels, with one writing `Because the pixels were visible, my immersion and attention were both negatively affected’. This was the only viewing quality issue ascribed to the screen itself, instead of the resolution of the video.
Leniency
In reviewing responses about the limitations of 360° video, and interesting trend emerged of participants expressing leniency towards these limitations. This forgiveness was expressed by 6 of the participants, and usually came in the form of a criticism followed immediately by a justification as to why it was unimportant.
For example, when asked if video quality affected their 360° experience one participant wrote: `Yes! But overall the experience felt quite real so the low quality was a compromise’. Another similarly responded `Yes, resolution could have been better, but I think that being able to interact with the environment lessened the impact of this’.
This leniency could have a couple of causes, including novelty and social desirability bias, which will be expanded on during the discussion in Section 4.
3.3. Learning Retention
The second major section of results involves learning retention. Learning retention was measured through the Short Term Retention Test, taken by participants directly after watching the videos, and the Long Term Retention Test, taken 6 weeks later. The tests were comprised of multiple choice and short answer questions separated into two sections: Content Retention and Location Recognition.
Test scores for short and long term retention were analysed by comparing the scores between participants that experienced the same recording in 360° and standard video. This involved comparing the pseudo–groups HMD and PC, which conditionally contained all participants, but for questions about different locations. For example, for questions pertaining to the James Cook Domain recording, scores from Group 2 were considered HMD because they experienced it in 360° video, while scores from Group 1 were considered PC. For questions about the Rawene Nature Reserve recording, scores from Group 1 were considered HMD, and scores from Group 2 were PC.
This setup effectively splits the sample into two groups, each with n = 10. The reduced sample size means that statistical comparisons are less powerful than would be desired, but they can still indicate if an effect may be present and could warrant further investigation. None of the score distributions for HMD and PC in either test was significantly different to normal, according to Shapiro-Wilk tests, so they were compared using two-tailed two-sample Student’s t-tests assuming unequal variances. These results are reported in Section 3.3.1 and Section 3.3.2.
The Short and Long Term Retention Tests also included questions about the Special Case videos, which sought to test active and passive visual recollection and recollection from a lecture theatre environment. These questions were part of the Content Retention section of the tests, and are analysed individually in Section 3.3.4 below.
3.3.1. Short Term Retention
The Short Term Retention Test was scored out of 32 total marks. 27 marks were available for Content Retention, and 5 for Location Recognition.
From Table 4 we can see that total mean marks of both the HMD and PC group are very similar, at 21.65 and 21.45 respectively. These means are 67.65% and 67.03% of the available marks.
The overall t-test found , suggesting that there is no statistically significant difference in the learning outcomes of the two groups.
While the HMD group did appear to perform better in the Location Recognition questions, a second t-test run on just these results found , indicating that the difference was not statistically significant.
3.3.2. Long Term Retention
The Long Term Retention Test was scored out of 33 marks, with 27 available for Content Rentention, and 6 for Location Recognition.
From Table 5 we can see that again, while the HMD group performed better on average than the PC group, the difference in learning outcomes was not statistically significant. The HMD group achieved on average 15.25 (46.21%), while the PC group averaged 14.7 (44.55%), and the t–test found .
As the HMD group appeared to perform better on the Location Recognition questions, a second t-test was run these results for the 2 groups. However, the result was not significant at the threshold, with .
3.3.3. Question Performance
Interestingly, from Table 6 we can see that the HMD group performed better on more than twice as many questions as the PC group in both the Short and Long Term Retention Tests. We investigated the probability of this occurring by chance using a binomial test, assuming equal probability that either group would outperform the other on a question. The cumulative probability that the HMD group performed better on 24 questions across the two tests is , under the null hypothesis that video format had no effect.
While this value is not significant at the threshold, this is an indication that a study with more power has the potential to detect an effect on learning, or that the impact of video format may vary considerably between types of question.
3.3.4. Special Case Questions
As outlined in Section 2.3, participants were tested for 3 special interest cases: recollection from a lecture theatre, and active and passive visual recollection. Content from the lecture theatre video accounted for 4 marks in both the Short and Long Term Retention Tests, and 1 mark was assigned to each of the visual recollection cases. The results of these questions are in Table 7, along with students t–test results comparing the performance between the HMD and PC groups.
From Table 7 we can see that the HMD group performed better on all of the cases across both tests, with the exception of long-term retention of the passive visual information, for which the 2 groups performed equally. Though this may suggest a trend, t-tests again failed to find any of the differences on the individual factors significant.
4. Discussion
RQ1. What differences in the user experience exist when presenting educational content in 360° video on a virtual reality head-mounted display, compared to standard video on a desktop PC?
The results of our User Evaluation analysis highlighted many of the key differences between using standard and 360° video.
In terms of general preference, participants were found to enjoy 360° video more, feel more engaged by it, and would prefer to use it as a supplementary material to their learning, provided they could access it as easily as standard video. This was largely attributed to the increased sense of immersion and interaction in the environment in 360° video, amplified by feelings of presence and realism. These results are consistent with existing research around immersive VR and validate our motivations for using 360° video as a learning tool.
Looking further into the thematic analysis, we see a more complex relationship between immersion and engagement in the two video formats. While 360° video was more engaging, participants commonly reported being more distracted while using it, primarily by the interesting, immersive environment itself. The extra visual information pulled attention away from the speaker in the video who was delivering learning content verbally.
This illuminated a distinction in attention and focus between the video formats. Participants watching standard video were more likely to get bored, and be distracted by elements of the real world. However, they paid more attention to the core learning elements of the video. Viewers of 360° video were more engaged, but that did not translate directly to engagement with the learning content itself.
While a couple of participants took this as evidence that standard video was the better teaching tool, more noted the potential strength of harnessing distractions in 360° video. They noted that if the learning content is reinforced by the visual environment, instead of being distracted by it, 360° video has the potential to create greater engagement with learning content than standard video.
This related directly to another major emergent theme: content–appropriateness. Participants identified that 360° video would be more suited to topics that relied on visual and environmental information, instead of those that are taught verbally or through text.
Our study design should be taken into account when discussing distractions and content–appropriateness. We included videos that were visual–information heavy (e.g., memorising details inside a car), and verbal–information heavy (e.g., a traditional lecture recording), incidentally allowing participants to compare the two kinds of content. We also tried to create as comparable an experience as possible between video formats, by restricting the learning content in the 360° videos to a frame that could also be captured as standard video. This meant most of the environmental information in the 360° videos was not part of the learning by design, which would have increased the effect of distractions.
Interestingly, the sub–theme of intimacy suggested that 360° video may have an advantage with some verbal content. Some participants felt an increased sense of connection to the speaker due to the presence and realism of the video format, which translated into a sense of obligation to listen to them. This kind of authentic connection can be particularly useful in situations like language learning [30].
Enhanced intimacy could even be harnessed to create better learning resources for students from cultural backgrounds that emphasise the relationship between student and teacher as a part of learning. For instance, Reynolds suggests that for students of Pacific Island background, `teu le va [the nurturing and valuing of a relationship] between a teacher and student is crucial because a student’s identification with a subject can come through a positive connection with a teacher’ [55]. With the increasing prevalence of digital learning resources, consciously maintaining an element of human intimacy as part of their design will benefit some students.
The final major difference between the video formats to mention here is usability. Watching 360° video was reportedly less comfortable, with a few participants noting the weight of the HMD or a sense of disorientation from using it. Participants also noted that you cannot take written or typed notes while in immersive VR. Overall, however, these limitations did appear not offset the benefits of 360° video, as participants also claimed they could study from both formats for similar amounts of time, and would prefer to use 360° video to do so.
RQ2. What differences in short and long term learning retention exist when presenting educational content in 360° video on a virtual reality head-mounted display, compared to standard video on a desktop PC?
Overall, our analysis of the results of the Short and Long Term Retention Tests found no statistically significant differences in learning retention between the HMD and PC pseudo–groups. This is true of the overall scores, the separate scores for the content retention and location recognition subsections of the tests, and the scores associated with the three special case videos.
This means that 360° video was as effective as standard video in conveying learning content, even with the limitations we placed on production. There were no major differences in short and long term retention in the context of this study.
It should be noted that the small effective sample size (n = 10) limited the statistical power of this study. When looking at the results in aggregate, the HMD group outperformed the PC group in every measure except two (short-term content retention and long-term passive visual recollection), and scored better in over twice as many total questions. As mentioned, none of these results were statistically significant at the threshold, but there is an indication that a study with greater strength may be able to detect an effect.
5. Limitations
Novelty is a commonly observed confounding effect in studies involving new learning technologies [56,57], including immersive VR [22]. It can lead to increased motivation or perceived usability of a technology, which may translate into increased attention and engagement in learning activities [7]. The responses to the user evaluation showed evidence of the novelty effect among participants, which should be taken into account with these results. The novelty effect also manifested itself as leniency towards issues with 360° video.
Connected to this novelty is the potential for anchoring bias in our study results. Participants will have likely watched many standard videos in the past, giving them high quality reference points or `anchors’ against which to evaluate the study videos. However, they are much less likely to have encountered 360° videos before, and therefore may not have any expectations of quality in that format. The anchoring effect can lead to more severe criticisms of experiences that can be compared, and more lenient evaluations of novel experiences [58].
Another factor that could generate leniency is social desirability bias. This is where survey responses are informed by a participant’s desire to project a favourable image to others [59,60]. In this study participants may have been less critical of 360° video, aware that we (the researchers) were studying the format, and mistakenly believing we may perceive them undesirably for answering negatively.
As noted previously, the other major limitation of this study is the small sample size. This caused our statistical analysis to have limited power to detect differences in learning outcomes between the HMD and PC groups. Future studies comparing 360° and standard video will need larger sample sizes to conclusively comment on any effects on learning retention.
6. Conclusions
In this paper we discussed the results of a study looking into the differences in user experience and short and long term learning retention in tertiary students viewing educational videos in both 360° and standard desktop formats. We found that participants retained the same amount of learning from both types of video, and engaged with and enjoyed 360° video more. We also found that participants believed they could study using either format for a similar amount of time, and would generally prefer to use 360° video as supplementary materials to their coursework, provided it was accessible.
To create a more comparable experience between the 360° and standard videos used in this study, we placed restrictions on the production of the 360° videos. That means these results were obtained using 360° videos produced in an accessible way, parallel to standard video production. This indicates that 360° video is a viable way for institutions to continue generating value from an investment in immersive VR technology, without having to upskill their current learning content creators or pay for expensive bespoke VR development.
Our user responses also produced the insight that though this would be effective, 360° video has much greater potential for learning engagement if additional effort is put into incorporating the learning content into the surrounding environment. Our results suggest that at its most accessible level, 360° video is equally effective and more engaging than standard video. However, it is a different medium with a different user experience, creating engagement and enjoyment through a sense of immersion in the wider environment. To unlock the potential of 360° video for education this environment should be harnessed to reinforce learning objectives.
Author Contributions
Conceptualization, S.K., A.L., B.W., B.P. and S.D.; methodology, S.K., A.L., B.W., B.P. and S.D.; software, S.K.; validation, S.K., A.L., B.W., B.P. and S.D.; formal analysis, S.K.; investigation, S.K.; resources, S.K.; data curation, S.K.; writing—original draft preparation, S.K.; writing—review and editing, S.K., A.L., B.W., B.P. and S.D.; supervision, A.L., B.W., and B.P.; All authors have read and agreed to the published version of the manuscript.
Institutional Review Board Statement
The users study was approved by the University of Auckland Human Participants Ethics Committee, reference number UAHPEC016696.
Informed Consent Statement
Informed consent was obtained from all subjects involved in the study.
Data Availability Statement
Data is unavailable due to privacy or ethical restrictions.
Acknowledgments
The authors of the paper would like to acknowledge and thank our user study participants for their interest, effort and contribution.
Conflicts of Interest
The authors declare no conflicts of interest.
References
- Merchant, Z.; Goetz, E.T.; Cifuentes, L.; Keeney-Kennicutt, W.; Davis, T.J. Effectiveness of virtual reality-based instruction on students’ learning outcomes in K-12 and higher education: A meta-analysis. Comput. Educ. 2014, 70, 29–40. [Google Scholar] [CrossRef]
- Kavanagh, S.; Luxton-Reilly, A.; Wünsche, B.; Plimmer, B. A systematic review of Virtual Reality in education. Themes Sci. Technol. Educ. 2017, 10, 85–119. [Google Scholar]
- Mikropoulos, T.A.; Natsis, A. Educational virtual environments: A ten-year review of empirical research (1999–2009). Comput. Educ. 2011, 56, 769–780. [Google Scholar] [CrossRef]
- Radianti, J.; Majchrzak, T.A.; Fromm, J.; Wohlgenannt, I. A systematic review of immersive virtual reality applications for higher education: Design elements, lessons learned, and research agenda. Comput. Educ. 2020, 147. [Google Scholar] [CrossRef]
- Freina, L.; Ott, M. A Literature Review on Immersive Virtual Reality in Education: State of the Art and Perspectives. In Proceedings of the The Int. Scientific Conf. eLearning and Software for Education, Bucharest, Romania, 2015; Vol. 1, pp. 133–141. [Google Scholar]
- Loup, G.; Serna, A.; Iksal, S.; George, S. Immersion and Persistence: Improving Learners’ Engagement in Authentic Learning Situations. In Proceedings of the European Conf. Technology Enhanced Learning, Lyon, France, 2016; Vol. 9891. [Google Scholar]
- Huang, W.; Roscoe, R.D.; Johnson-Glenberg, M.C.; Craig, S.D. Motivation, engagement, and performance across multiple virtual reality sessions and levels of immersion. J. Comput. Assist. Learn. 2021, 37, 745–758. [Google Scholar] [CrossRef]
- Mütterlein, J. The Three Pillars of Virtual Reality? Investigating the Roles of Immersion, Presence, and Interactivity. In Proceedings of the 51st Hawaii Int. Conf. System Sciences (HICSS), Hawai’i Island, Hawaii, 2018. [Google Scholar] [CrossRef]
- North, M.M.; North, S.M. A Comparative Study of Sense of Presence of Traditional Virtual Reality and Immersive Environments. Australas. J. Inf. Syst. 2016, 20. [Google Scholar] [CrossRef]
- Purchese, R. Oculus answers the big Rift questions, 2014.
- Sony Corporation of America: PlayStation®VR Launches October 2016 Available Globally At 44,980 Yen, $399 USD, €399 And £349, 2016.
- Newsroom, H. Vive Now Shipping Immediately From HTC, 2016.
- Samsung Gear VR - The Official Samsung Galaxy Site, 2020.
- Cipresso, P.; Giglioli, I.A.C.; Raya, M.A.; Riva, G. The Past, Present, and Future of Virtual and Augmented Reality Research: A Network and Cluster Analysis of the Literature. Frontiers Psychol. 2018, 9, 2086. [Google Scholar] [CrossRef]
- Wang, P.; Wu, P.; Wang, J.; Chi, H.L.; Wang, X. A Critical Review of the Use of Virtual Reality in Construction Engineering Education and Training. Int. J. Environ. Res. Public Health 2018, 15, 1204. [Google Scholar] [CrossRef]
- Bashabsheh, A.K.; Alzoubi, H.H.; Ali, M.Z. The application of virtual reality technology in architectural pedagogy for building constructions. Alexandria Eng. J. 2019, 58, 713–723. [Google Scholar] [CrossRef]
- Lerner, D.; Mohr, S.; Schild, J.; Göring, M.; Luiz, T. An Immersive Multi-User Virtual Reality for Emergency Simulation Training: Usability Study. JMIR Serious Games 2020, 8, e18822. [Google Scholar] [CrossRef]
- Egea-Vivancos, A.; Arias-Ferrer, L. Principles for the design of a history and heritage game based on the evaluation of immersive virtual reality video games. E-Learn. Digit. Media 2021, 18, 383–402. [Google Scholar] [CrossRef]
- Innocenti, E.D.; Geronazzo, M.; Vescovi, D.; Nordahl, R.; Serafin, S.; Ludovico, L.A.; Avanzini, F. Mobile virtual reality for musical genre learning in primary education. Comput. Educ. 2019, 139, 102–117. [Google Scholar] [CrossRef]
- Huang, H.M.; Rauch, U.; Liaw, S.S. Investigating learners’ attitudes toward virtual reality learning environments: Based on a constructivist approach. Comput. Educ. 2010, 55, 1171–1182. [Google Scholar] [CrossRef]
- Sharma, S.; Agada, R.; Ruffin, J. Virtual reality classroom as an constructivist approach. In Proceedings of the 2013 Proc. IEEE Southeastcon, Jacksonville, FL, USA, 2013; pp. 1–5. [Google Scholar] [CrossRef]
- Jensen, L.; Konradsen, F. A review of the use of virtual reality head-mounted displays in education and training. Educ. Inf. Technol. 2018, 23, 1515–1529. [Google Scholar] [CrossRef]
- Alhalabi, W. Virtual reality systems enhance students’ achievements in engineering education. Behav. Inf. Technol. 2016, 35, 919–925. [Google Scholar] [CrossRef]
- Allcoat, D.; von Mühlenen, A. Learning in virtual reality: Effects on performance, emotion and engagement. Res. Learn. Technol. 2018, 26. [Google Scholar] [CrossRef]
- Budziszewski, P. A Low Cost Virtual Reality System for Rehabilitation of Upper Limb. In Proceedings of the 5th Int. Conf. Virtual, Augmented and Mixed Reality, held as part of HCI Int. 2013; Shumaker, R., Ed., Berlin, Heidelberg, 2013; Lecture Notes in Computer Science.
- Allison, D.; Hodges, L.F. Virtual reality for education? In Proceedings of the Proc. ACM Symp. Virtual reality software and technology, Seoul, Korea, 2000; pp. 160–165. [Google Scholar] [CrossRef]
- Wiecha, J.; Heyden, R.; Sternthal, E.; Merialdi, M. Learning in a virtual world: experience with using second life for medical education. J. Med. Internet Res. 2010, 12, e1. [Google Scholar] [CrossRef]
- Mirocha, L. Novel Approaches in Game Engine-Based Content Creation: Unveiling the Potential of Neural Radiance Fields and 3D Gaussian Splatting. In Proceedings of the SIGGRAPH Asia 2024 Courses, New York, NY, USA, 2024. SA Courses ’24. [Google Scholar] [CrossRef]
- Cheng, D.; Ch’ng, E. Harnessing Collective Differences in Crowdsourcing Behaviour for Mass Photogrammetry of 3D Cultural Heritage. J. Comput. Cult. Herit. 2023, 16. [Google Scholar] [CrossRef]
- Chen, M.R.A.; Hwang, G.J. Effects of experiencing authentic contexts on English speaking performances, anxiety and motivation of EFL students with different cognitive styles. Interactive Learn. Environ. 2020, 0, 1–21. [Google Scholar] [CrossRef]
- Concannon, B.J.; Esmail, S.; Roduta Roberts, M. Head-Mounted Display Virtual Reality in Post-secondary Education and Skill Training. Front. Educ. 2019, 4, 80. [Google Scholar] [CrossRef]
- Shadiev, R.; Wang, X.; Wu, T.T.; Huang, Y.M. Review of Research on Technology-Supported Cross-Cultural Learning. Sustainability 2021, 13, 1402. [Google Scholar] [CrossRef]
- Fraustino, J.D.; Lee, J.Y.; Lee, S.Y.; Ahn, H. Effects of 360° video on attitudes toward disaster communication: Mediating and moderating roles of spatial presence and prior disaster media involvement. Public Relations Rev. 2018, 44, 331–341. [Google Scholar] [CrossRef]
- Snelson, C.; Hsu, Y.C. Educational 360-Degree Videos in Virtual Reality: a Scoping Review of the Emerging Research. TechTrends 2020, 64, 404–412. [Google Scholar] [CrossRef]
- Support, A. Editing VR in Adobe Premiere Pro, 2021.
- Apple Inc. Final Cut Pro User Guide, 2021.
- De Castro Araújo, G.; Domingues Garcia, H.; Farias, M.C.; Prakash, R.; Carvalho, M.M. A 360-degree Video Player for Dynamic Video Editing Applications. ACM Trans. Multimedia Comput. Commun. Appl. 2025. Just Accepted. [CrossRef]
- Li, L.; Carnell, S.; Harris, K.; Walters, L.; Reiners, D.; Cruz-Neira, C. LIFT - A System to Create Mixed 360° Video and 3D Content for Live Immersive Virtual Field Trip. In Proceedings of the Proceedings of the 2023 ACM International Conference on Interactive Media Experiences, New York, NY, USA, 2023; IMX ’23, p. 83–93. [CrossRef]
- Huang, X.; Yin, M.; Xia, Z.; Xiao, R. VirtualNexus: Enhancing 360-Degree Video AR/VR Collaboration with Environment Cutouts and Virtual Replicas. In Proceedings of the Proceedings of the 37th Annual ACM Symposium on User Interface Software and Technology, New York, NY, USA, 2024; UIST ’24. [CrossRef]
- Harrington, C.M.; Kavanagh, D.O.; Wright Ballester, G.; Wright Ballester, A.; Dicker, P.; Traynor, O.; Hill, A.; Tierney, S. 360° Operative Videos: A Randomised Cross-Over Study Evaluating Attentiveness and Information Retention. J. Surgical Edu. 2018, 75, 993–1000. [Google Scholar] [CrossRef]
- Zulkiewicz, B.A.; Boudewyns, V.; Gupta, C.; Kirschenbaum, A.; Lewis, M.A. Using 360-Degree Video as a Research Stimulus in Digital Health Studies: Lessons Learned. JMIR Serious Games 2020, 8, e15422. [Google Scholar] [CrossRef]
- Kittel, A.; Larkin, P.; Elsworthy, N.; Spittle, M. Using 360° virtual reality as a decision-making assessment tool in sport. J. Sci. Med. Sport 2019, 22, 1049–1053. [Google Scholar] [CrossRef]
- Lee, S.H.M.; Sergueeva, K.; Catangui, M.; Kandaurova, M. Assessing Google Cardboard virtual reality as a content delivery system in business classrooms. J. Educ. Bus. 2017, 92, 153–160. [Google Scholar] [CrossRef]
- Meijer, W.; Bourgeois, J.; van der Vegte, W.F.; Kortuem, G. Sphere Window: Challenges and Opportunities of 360° Video in Collaborative Design Workshops. In Proceedings of the Proceedings of the 13th Nordic Conference on Human-Computer Interaction, New York, NY, USA, 2024; NordiCHI ’24. [CrossRef]
- Xhako, A.; Zidianakis, E.; Kontaki, E.; Manoli, K.; Ntoa, S.; Partarakis, N.; Stephanidis, C. Gamified experiences using 360° photography: A methodology for creating gamified learning experiences in 360° virtual environments. In Proceedings of the Proceedings of the 16th International Conference on PErvasive Technologies Related to Assistive Environments, New York, NY, USA, 2023; PETRA ’23, p. 53–61. [CrossRef]
- Orduna, M.; Perez, P.; Koniuch, K.; Gonzalez-Sosa, E.; Villegas, A. Testing 360-Degree Video Communication in a Debate Training between Teens: An Exploratory Field Study. In Proceedings of the Proceedings of the 30th ACM Symposium on Virtual Reality Software and Technology, New York, NY, USA, 2024; VRST ’24. [CrossRef]
- Ngelambong, A.; Mohd Rizalpahlavy, M.I.D.; Che Ahmat, N.H.; Kibat, S.A.; Nurlaela, L. Demystifying the Potential of 360-Degree Video Technology Application in Hospitality and Tourism Online Education. In Proceedings of the Proceedings of the 2024 8th International Conference on Education and Multimedia Technology, New York, NY, USA, 2024; ICEMT ’24, p. 224–229. [CrossRef]
- Rosendahl, P.; Wagner, I. 360° videos in education – A systematic literature review on application areas and future potentials. Education and Information Technologies 2023, 29, 1319–1355. [Google Scholar] [CrossRef]
- Muntean, R. Addressing Sustainability Through 360° Video Design & Research. In Proceedings of the Companion Publication of the 2023 ACM Designing Interactive Systems Conference, New York, NY, USA, 2023; DIS ’23 Companion, p. 41–44. [CrossRef]
- Choi, K.; Yoon, Y.J.; Song, O.Y.; Choi, S.M. Interactive and Immersive Learning Using 360° Virtual Reality Contents on Mobile Platforms. Mobile Inf. Syst. 2018, 2018, e2306031. [Google Scholar] [CrossRef]
- Shadiev, R.; Yang, L.; Huang, Y.M. A review of research on 360-degree video and its applications to education. J. Res. Technol. Educ. 2021, 0, 1–16. [Google Scholar] [CrossRef]
- Schroeder, N.L.; Siegle, R.F.; Craig, S.D. A meta-analysis on learning from 360° video. Computers & Education 2023, 206, 104901. [Google Scholar] [CrossRef]
- Kavanagh, S.; Luxton-Reilly, A.; Wüensche, B.; Plimmer, B. Creating 360 degree educational video: a case study. In Proceedings of the Proc. 28th Australian Conf. Computer-Human Interaction, ACM, Launceston, Tas, Australia, 2016; pp. 34–39. [Google Scholar] [CrossRef]
- Bazeley, P.; Jackson, K., Qualitative data analysis with NVivo; Sage Publications Limited, 2013; pp. 72–80.
- Reynolds, M. Relating to Va: Re-viewing the concept of relationships in Pasifika education in Aotearoa New Zealand. AlterNative: Int. J. Indig. Peoples 2016, 12, 190–202. [Google Scholar] [CrossRef]
- Tsay, C.H.H.; Kofinas, A.; Trivedi, S.K. Novelty Effect and Student Engagement in a Technology-mediated Gamified Learning System. Acad. Manage. Proc. 2018, 2018, 13030. [Google Scholar] [CrossRef]
- Koch, M.; von Luck, K.; Schwarzer, J.; Draheim, S. The Novelty Effect in Large Display Deployments – Experiences and Lessons-Learned for Evaluating Prototypes. In Proceedings of the Proc. 16th Eur. Conf. Comput.-Supported Cooperative Work-Exploratory Papers. EUSSET, 2018, Vol. 2, pp. 1–19.
- Teovanović, P. Individual Differences in Anchoring Effect: Evidence for the Role of Insufficient Adjustment. Eur. J. Psychol. 2019, 15, 8–24. [Google Scholar] [CrossRef]
- Fisher, R.J. Social Desirability Bias and the Validity of Indirect Questioning. J. Consum. Res. 1993, 20, 303–315. [Google Scholar] [CrossRef]
- Larson, R.B. Controlling social desirability bias. Int. J. Mark. Res. 2019, 61, 534–547. [Google Scholar] [CrossRef]
Figure 1.
Participants’ rating of Enjoyment of Standard and 360° video formats. These box-plots show the median and inter-quartile ranges of the scores, which are from a total range of -2 to 2.
Figure 1.
Participants’ rating of Enjoyment of Standard and 360° video formats. These box-plots show the median and inter-quartile ranges of the scores, which are from a total range of -2 to 2.
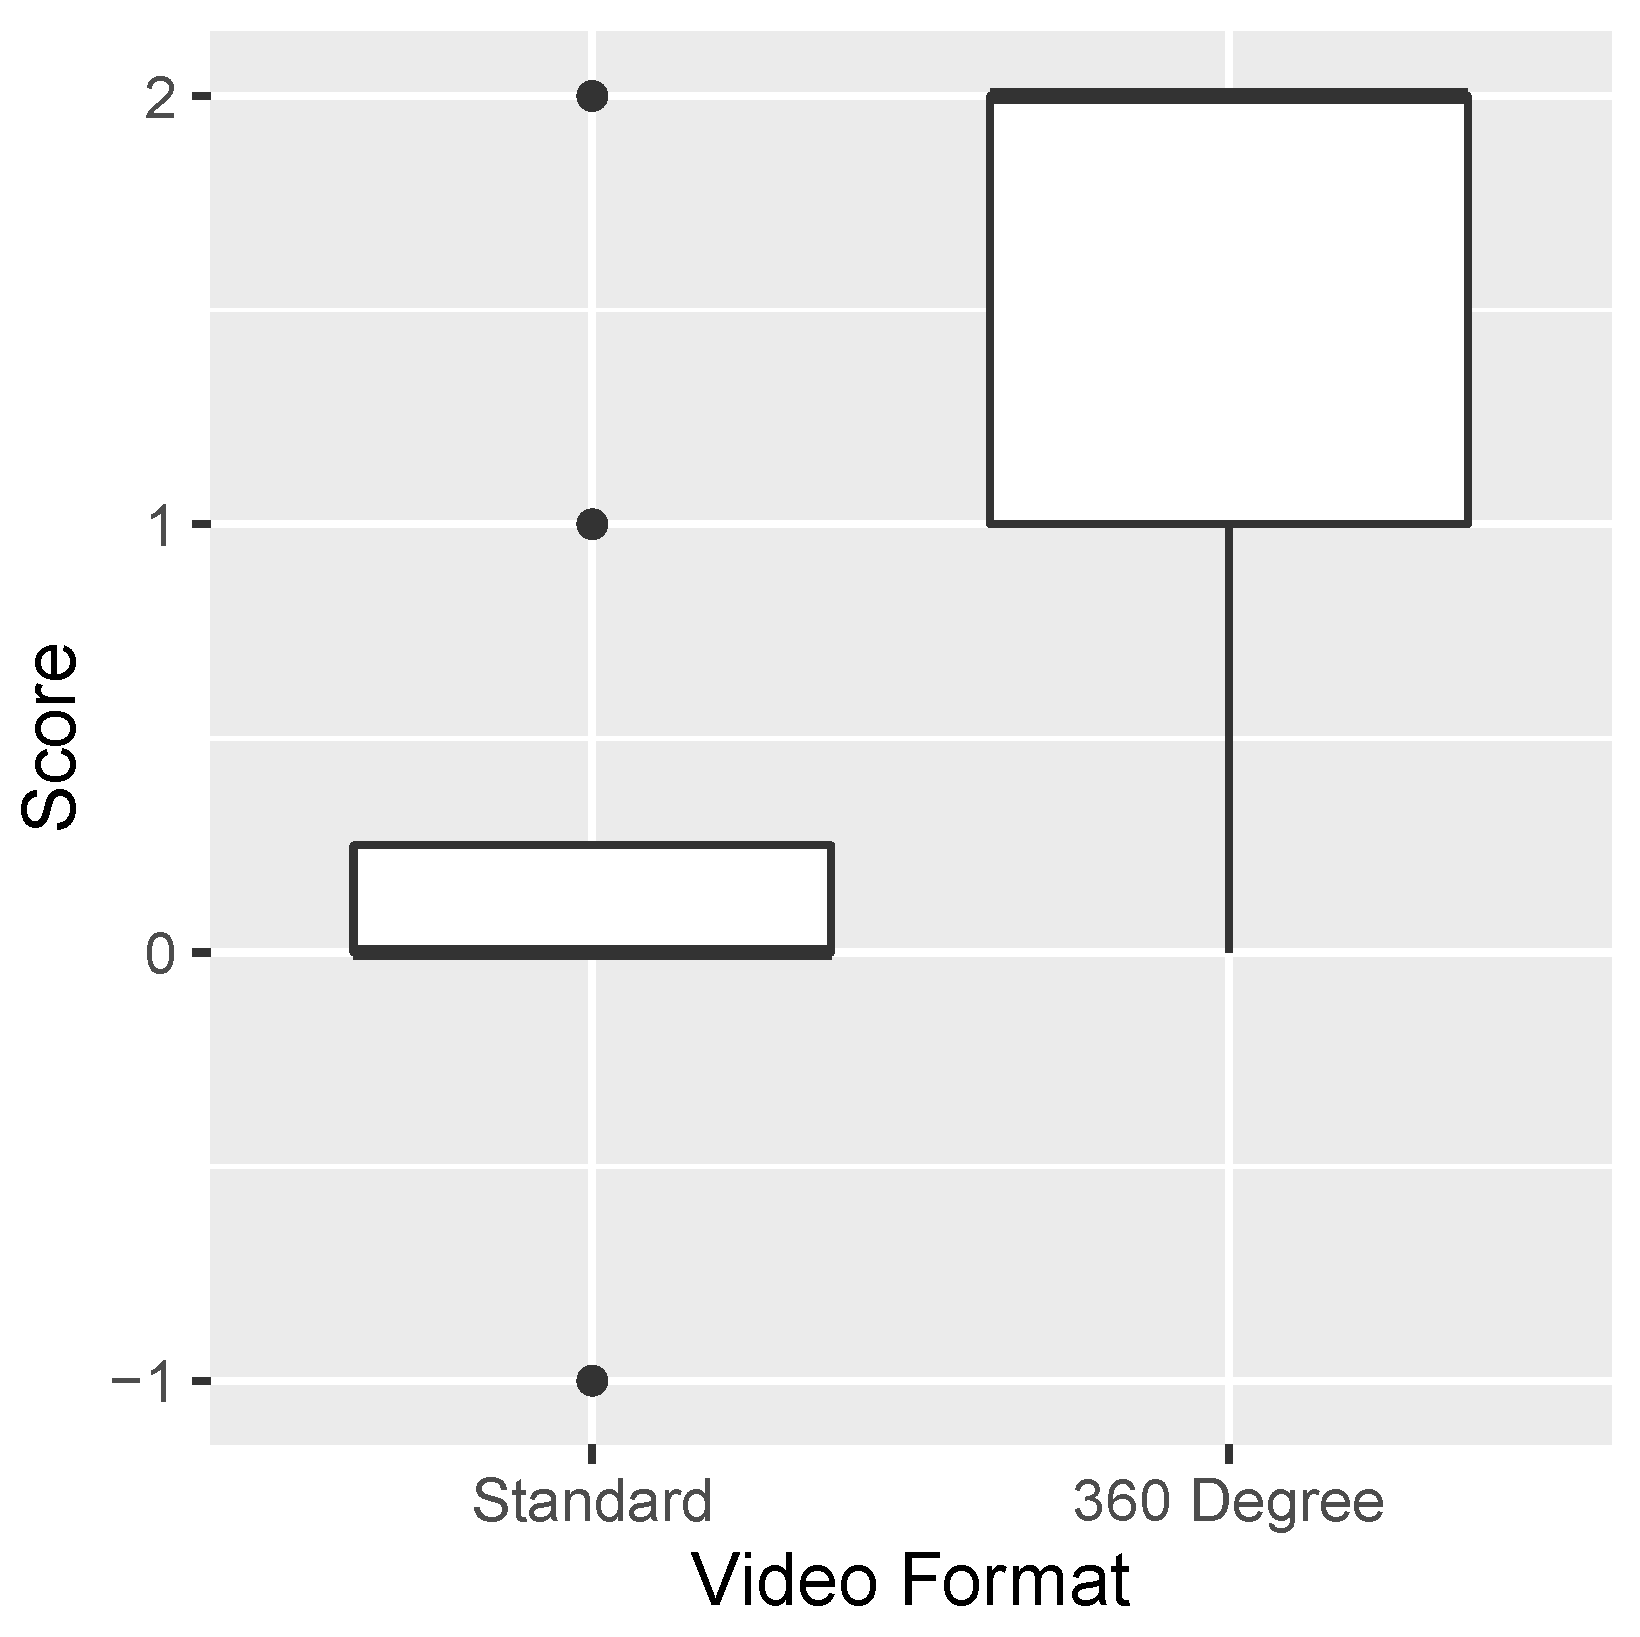
Figure 2.
Participants’ rating of Immersion in Standard and 360° video formats. These box-plots show the median and inter-quartile ranges of the scores, which are from a total range of -2 to 2.
Figure 2.
Participants’ rating of Immersion in Standard and 360° video formats. These box-plots show the median and inter-quartile ranges of the scores, which are from a total range of -2 to 2.
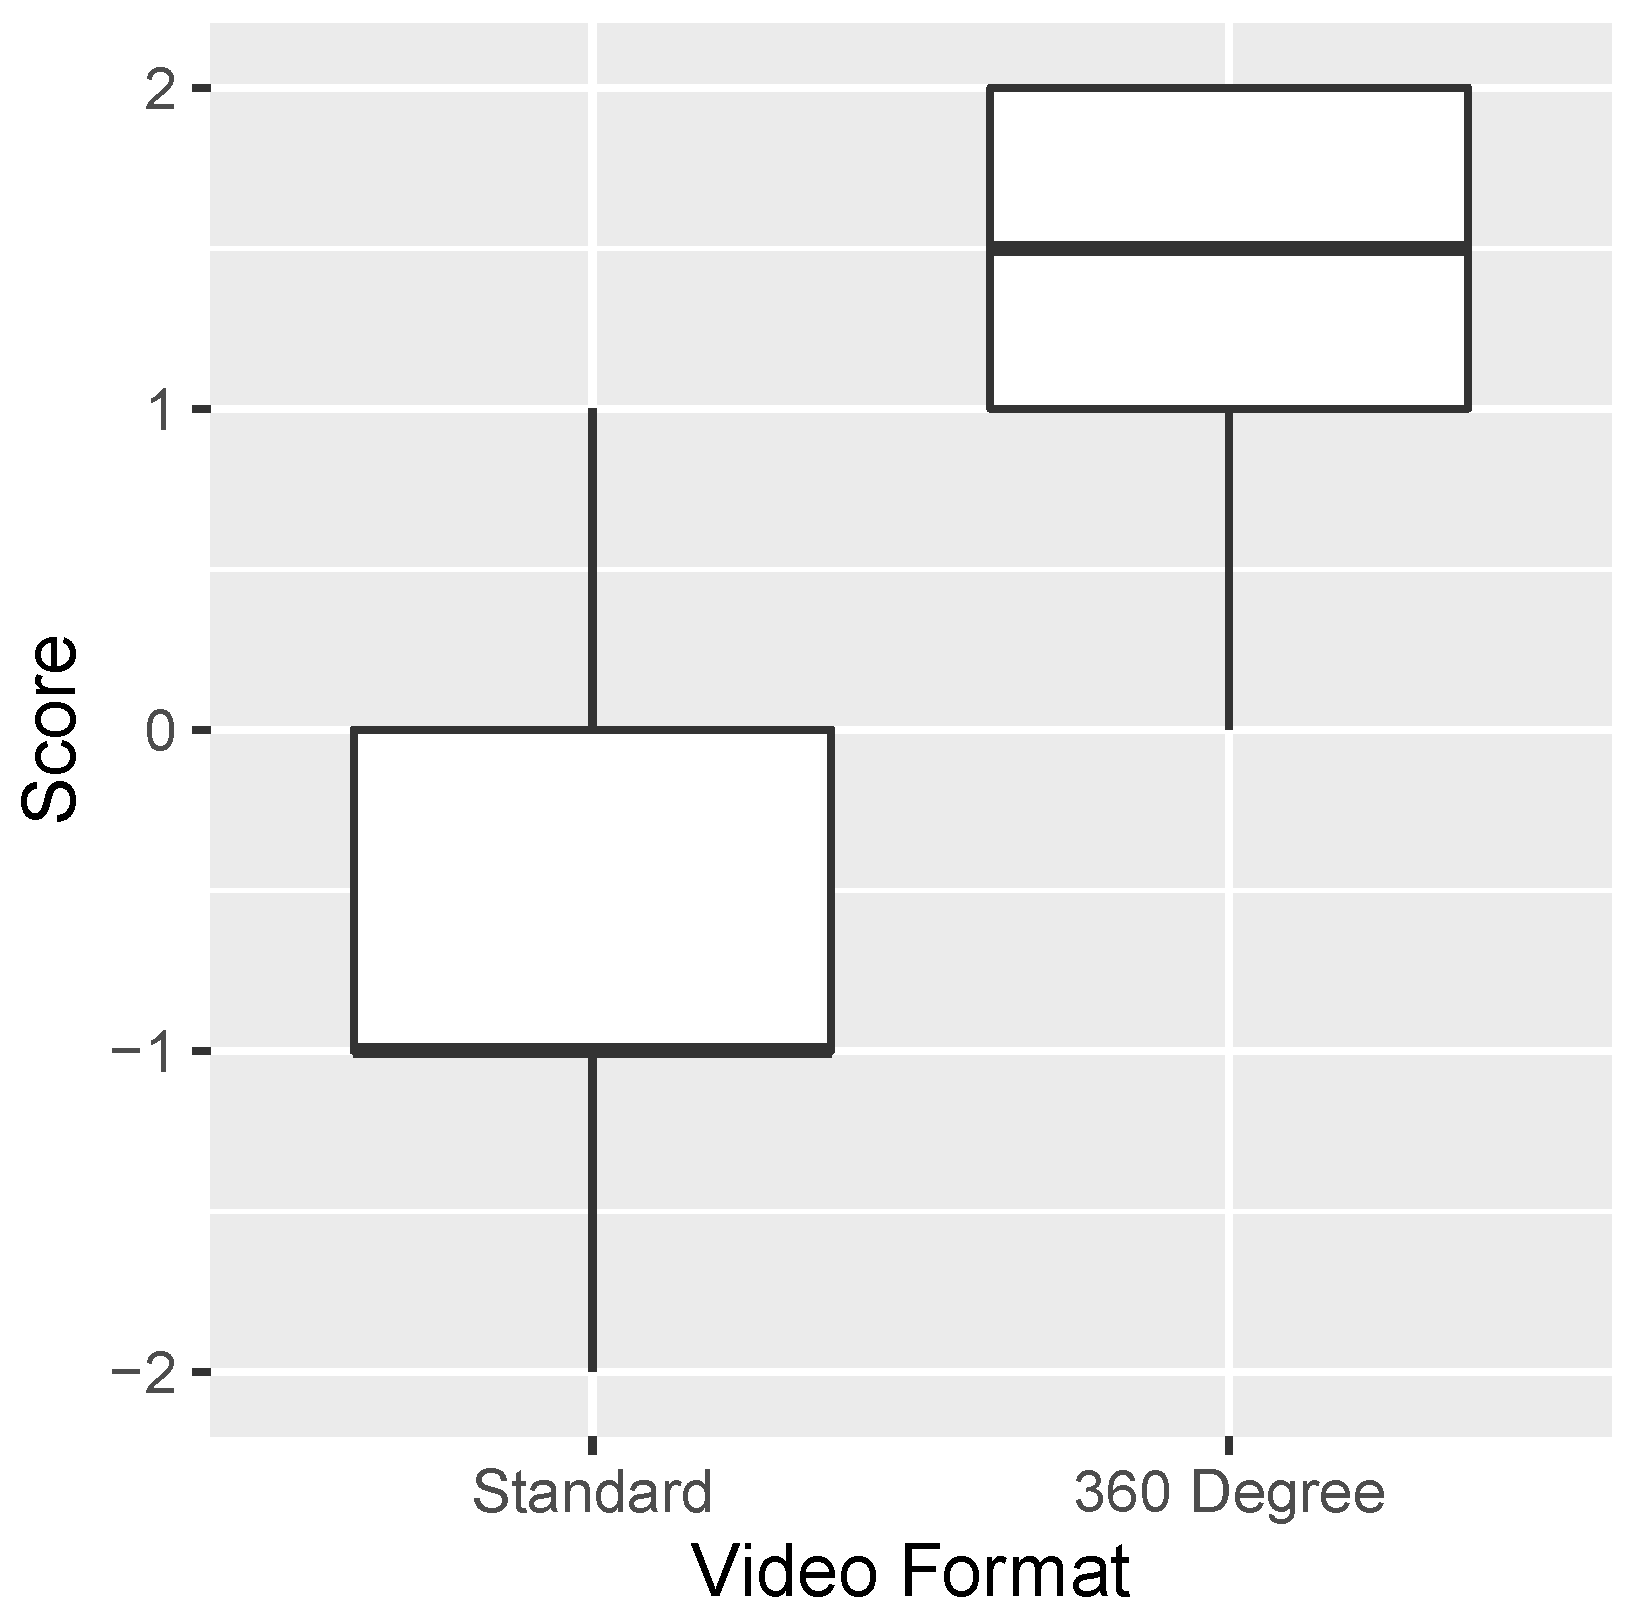
Figure 3.
Participants’ rating of Engagement with Standard and 360° video formats. These box-plots show the median and inter-quartile ranges of the scores, which are from a total range of -2 to 2.
Figure 3.
Participants’ rating of Engagement with Standard and 360° video formats. These box-plots show the median and inter-quartile ranges of the scores, which are from a total range of -2 to 2.
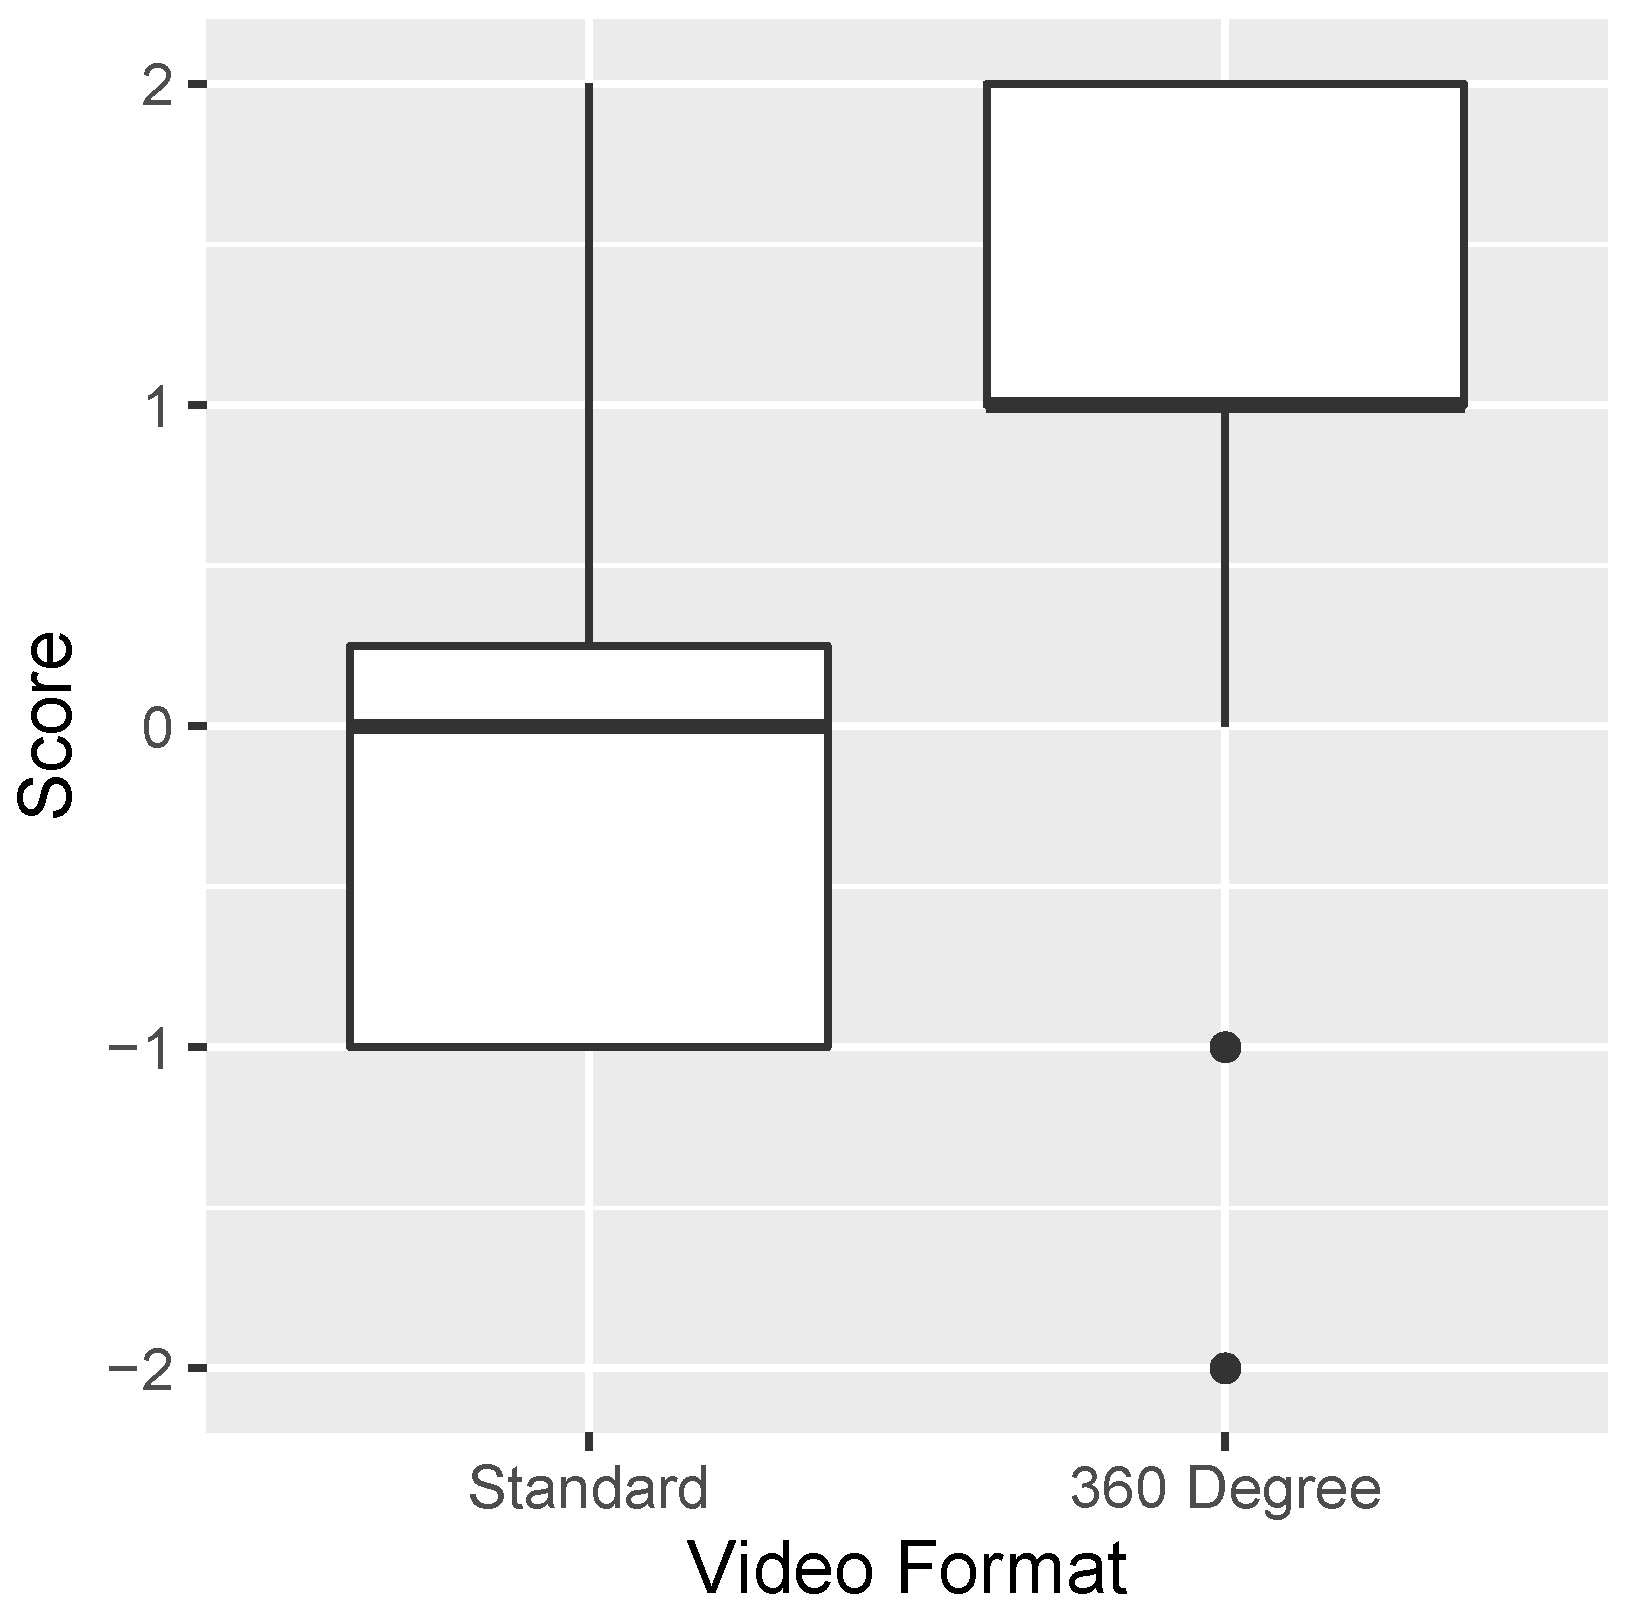
Figure 4.
Potential Study Habits of Students regarding Standard and 360° Video. a) Maximum reported potential Study Times using Standard and 360° video. b) Likelihood of using Supplementary Materials in Standard and 360° video formats.
Figure 4.
Potential Study Habits of Students regarding Standard and 360° Video. a) Maximum reported potential Study Times using Standard and 360° video. b) Likelihood of using Supplementary Materials in Standard and 360° video formats.
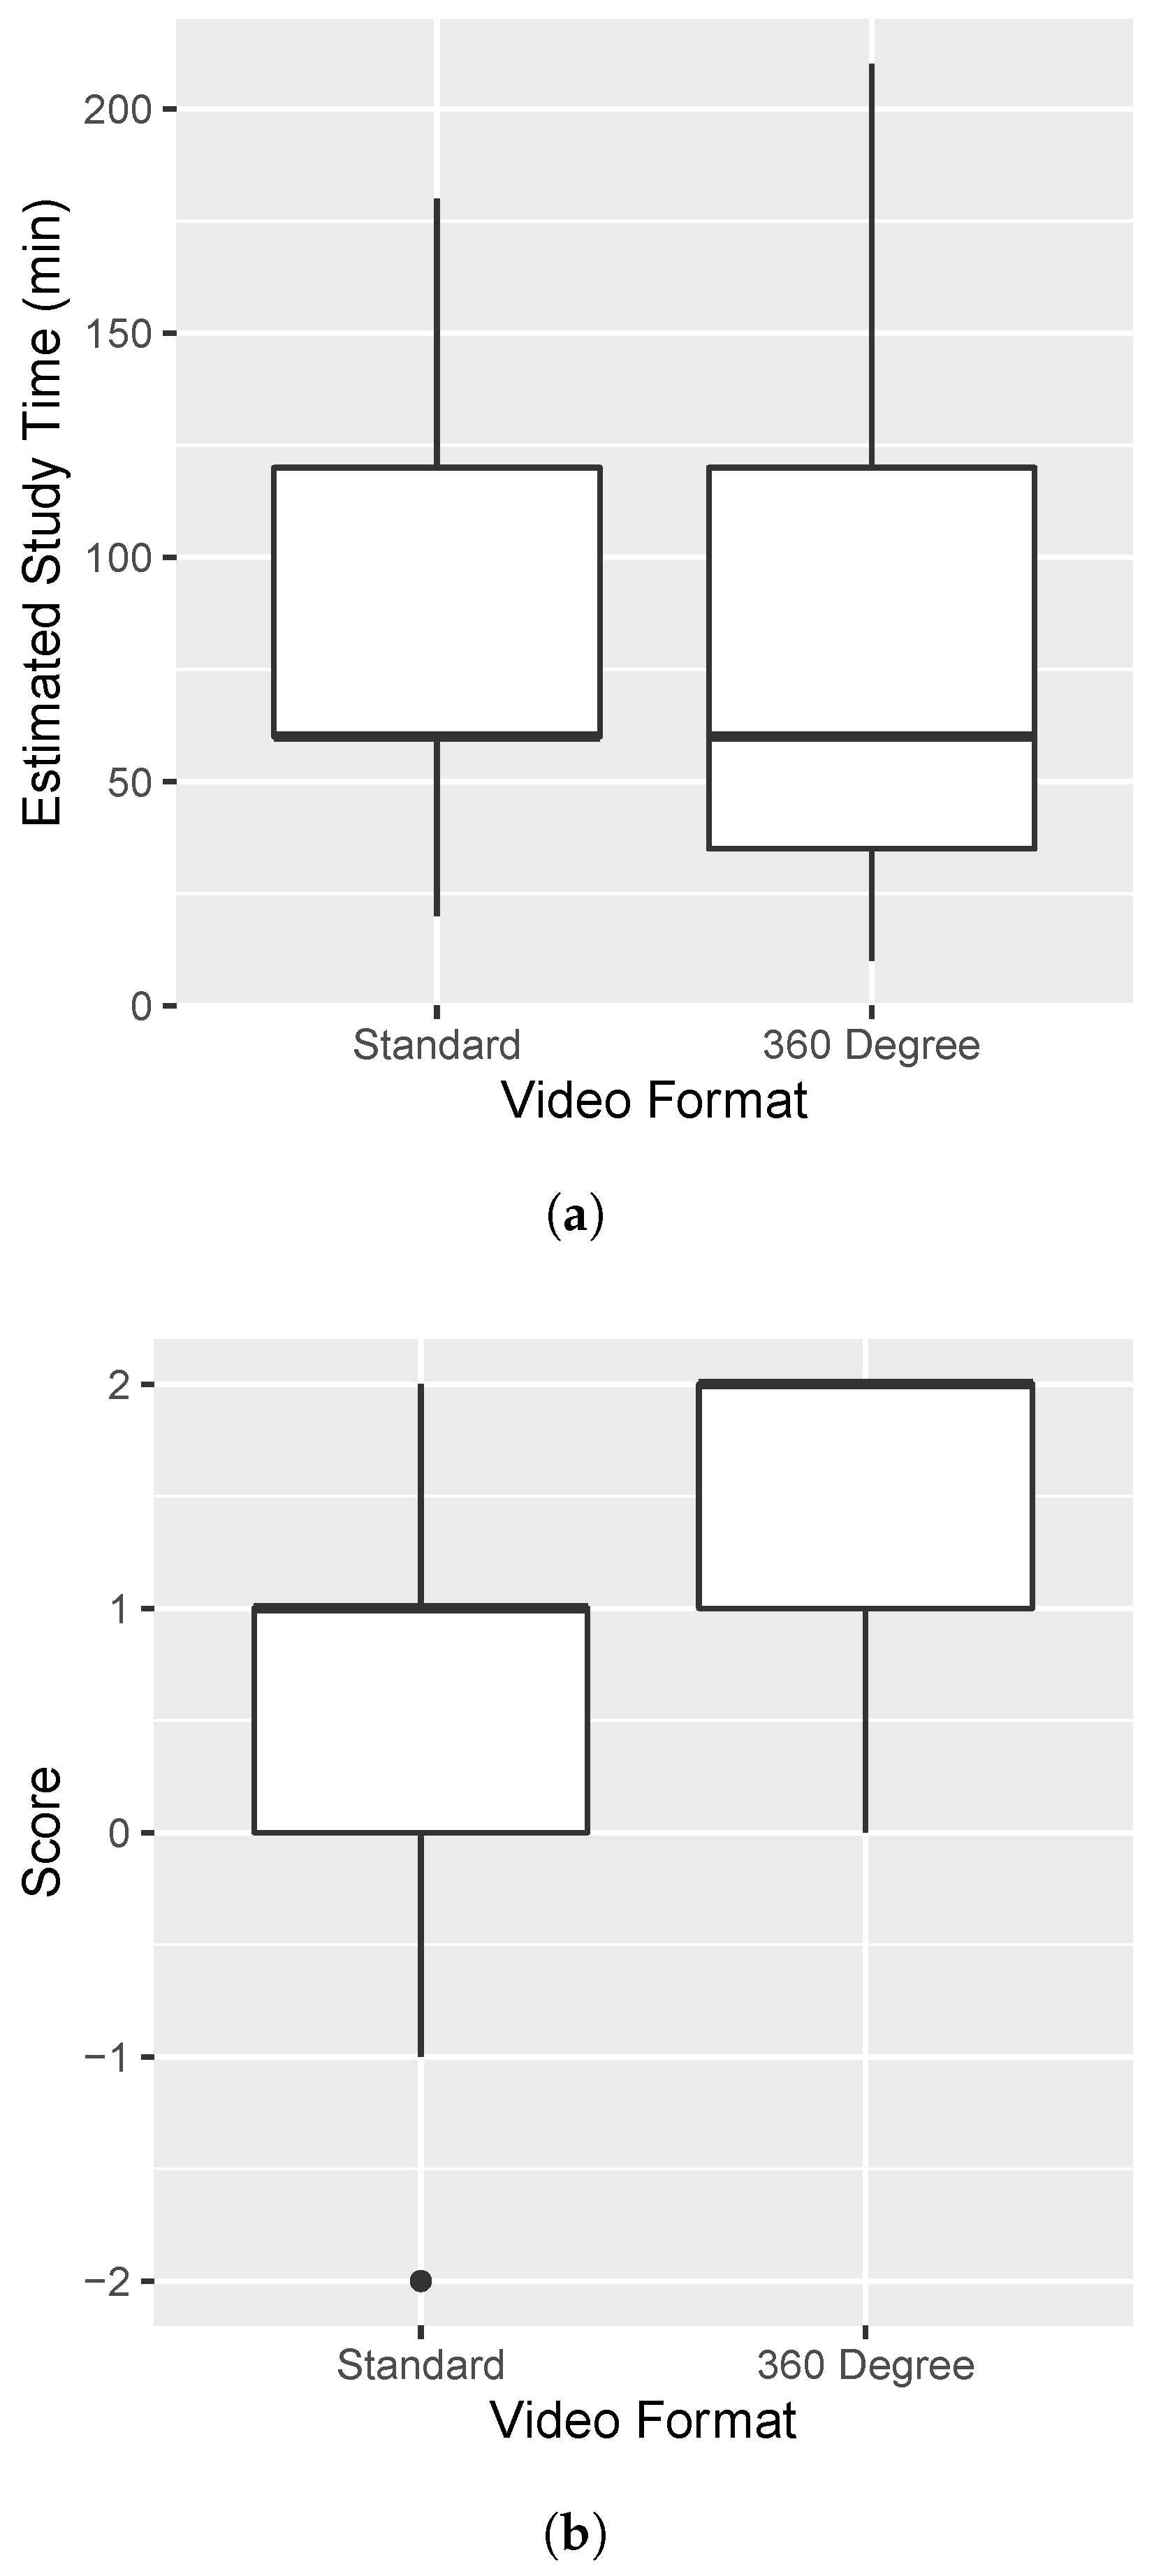

Table 1.
Distribution of the 24 video recordings among the 2 groups.
| Group 1 | |
|---|---|
| Desktop Recordings | 360° Recordings |
| (Shown First) | |
| Cook Street Bus Stop | Rawene Nature Reserve |
| James Cook Domain | Inside a Car |
| Woodward Building | Ponga Falls |
| Swanson Park | Park View Road |
| Willis Lake | Playground |
| Lecture Theatre | Whiterock Bush |
| Group 2 | |
| 360° Recordings | Desktop Recordings |
| (Shown First) | |
| Cook Street Bus Stop | Rawene Nature Reserve |
| James Cook Domain | Inside a Car |
| Woodward Building | Ponga Falls |
| Swanson Park | Park View Road |
| Willis Lake | Playground |
| Lecture Theatre | Whiterock Bush |
Table 2.
Comparative Enjoyment, Immersion, and Engagement of 360° and Standard video formats. Mean and Median are in the range of -2 to 2, and Mean is given with a 95% confidence interval.
Table 2.
Comparative Enjoyment, Immersion, and Engagement of 360° and Standard video formats. Mean and Median are in the range of -2 to 2, and Mean is given with a 95% confidence interval.
| Enjoyment | |||||
|---|---|---|---|---|---|
| Format | Mean | Median | V-stat | p-value | Effect Size |
| Standard | 0.25 ∓ 0.43 | 0.0 | 4.5 | 5.3e-4 | 1.62 |
| 360° | 1.50 ∓ 0.28 | 2.0 | |||
| Immersion | |||||
| Format | Mean | Median | V-stat | p-value | Effect Size |
| Standard | -0.65 ∓ 0.46 | -1.0 | 0.0 | 7.9e-5 | 2.56 |
| 360° | 1.45 ∓ 0.28 | 1.5 | |||
| Engagement | |||||
| Format | Mean | Median | V-stat | p-value | Effect Size |
| Standard | 0.00 ∓ 0.40 | 0.0 | 11.0 | 0.0026 | 0.99 |
| 360° | 0.95 ∓ 0.49 | 1.0 | |||
Table 3.
Study Habits of Participants using Standard and 360° Video, comparing length of time they believed they could study and their likelihood to use either video type as a supplementary learning material. Mean and Median of Supplementary Use are in the range of -2 to 2, and Mean is given with a 95% confidence interval.
| Study Times | |||||
|---|---|---|---|---|---|
| Format | Mean (min) | Median | V-stat | p-value | Effect Size |
| Standard | 87.1 ∓ 21.9 | - | 62.5 | 0.91 | - |
| 360° | 79.5 ∓ 27.9 | - | |||
| Supplementary Use | |||||
| Standard | 0.55 ∓ 0.42 | 1.0 | 14.0 | 0.003 | 0.99 |
| 360° | 1.40 ∓ 0.38 | 2.0 | |||
Table 4.
Results of the Short-term Retention Test, comparing the learning outcomes of the HMD and PC groups. Mean scores for each group and test section are given with a 95% confidence interval.
Table 4.
Results of the Short-term Retention Test, comparing the learning outcomes of the HMD and PC groups. Mean scores for each group and test section are given with a 95% confidence interval.
| Group | Content Retention | Location Recognition | ||
|---|---|---|---|---|
| HMD | 18.35 ∓ 1.57 | 3.3 ∓ 0.59 | ||
| PC | 18.75 ∓ 1.87 | 2.7 ∓ 0.56 | ||
| Group | Total Score | t-stat | df | p-value |
| HMD | 21.65 ∓ 2.00 | 0.504 | 19 | 0.6174 |
| PC | 21.45 ∓ 2.30 | |||
Table 5.
Results of the Long-term Retention Test, comparing the learning outcomes of the HMD and PC groups. Mean scores for each group and test section are given with a 95% confidence interval.
Table 5.
Results of the Long-term Retention Test, comparing the learning outcomes of the HMD and PC groups. Mean scores for each group and test section are given with a 95% confidence interval.
| Group | Content Retention | Location Recognition | ||
|---|---|---|---|---|
| HMD | 12.15 ∓ 1.29 | 3.1 ∓ 0.49 | ||
| PC | 12.1 ∓ 1.11 | 2.6 ∓ 0.23 | ||
| Group | Total Score | t-stat | df | p-value |
| HMD | 15.25 ∓ 1.64 | 0.550 | 19 | 0.5854 |
| PC | 14.7 ∓ 1.16 | |||
Table 6.
Comparative performance on questions between the HMD and PC groups across the Short and Long Term Retention Tests.
Table 6.
Comparative performance on questions between the HMD and PC groups across the Short and Long Term Retention Tests.
| Group Performance | Short Term | Long term | Total |
|---|---|---|---|
| HMD performed better | 12 | 12 | 24 |
| PC performed better | 5 | 6 | 11 |
| Groups performed equally | 3 | 3 | 6 |
Table 7.
Results of the Special Case questions, comparing between the HMD and PC groups across the Short and Long Term Retention Tests. Mean scores for each group and case are given with a 95% confidence interval.
Table 7.
Results of the Special Case questions, comparing between the HMD and PC groups across the Short and Long Term Retention Tests. Mean scores for each group and case are given with a 95% confidence interval.
| Short Term Retention Test | ||||
|---|---|---|---|---|
| Case | HMD | PC | t-statistic | p-value |
| Lecture Theatre | 4.0 ∓ 0.47 | 3.9 ∓ 0.45 | 0.156 | 0.8767 |
| Active Recollection | 0.8 ∓ 0.19 | 0.7 ∓ 0.22 | 0.493 | 0.6278 |
| Passive Recollection | 0.1 ∓ 0.14 | 0 ∓ 0 | 1 | 0.3434 |
| Long Term Retention Test | ||||
| Case | HMD | PC | t-statistic | p-value |
| Lecture Theatre | 2.5 ∓ 0.53 | 1.9 ∓ 0.43 | 0.895 | 0.3768 |
| Active Recollection | 0.6 ∓ 0.23 | 0.3 ∓ 0.22 | 1.342 | 0.1964 |
| Passive Recollection | 0.5 ∓ 0.23 | 0.5 ∓ 0.23 | 0 | 1 |
Disclaimer/Publisher’s Note: The statements, opinions and data contained in all publications are solely those of the individual author(s) and contributor(s) and not of MDPI and/or the editor(s). MDPI and/or the editor(s) disclaim responsibility for any injury to people or property resulting from any ideas, methods, instructions or products referred to in the content. |
© 2025 by the authors. Licensee MDPI, Basel, Switzerland. This article is an open access article distributed under the terms and conditions of the Creative Commons Attribution (CC BY) license (http://creativecommons.org/licenses/by/4.0/).
Copyright: This open access article is published under a Creative Commons CC BY 4.0 license, which permit the free download, distribution, and reuse, provided that the author and preprint are cited in any reuse.


