Submitted:
01 April 2025
Posted:
01 April 2025
You are already at the latest version
Abstract
Background/Objectives: Early screening of at-risk patients by detecting pulmonary nodules before they deteriorate is critical for timely intervention and treatment. Furthermore, accurately classifying nodule types on computed tomography (CT) images helps in planning appropriate follow-up and treatment strategies. Methods: We collected CT data from 238 patients through a medical data collection agency in the United States, where two radiologists annotated 1,904 pulmonary nodules. After excluding part-solid and segmentation-failed nodules, a total of 1,888 nodules were included. Of these, 1,416 nodules were used for training and 472 for internal validation. External validation was conducted on two independent public datasets: LUNA (n=1,122) and ISBI (n=220). Using segmentation masks automatically generated by a deep learning-based segmentation model, radiomic features were extracted and used to train an AI-based model for classifying solid and ground-glass nodules. Results: The proposed model achieved strong performance across both internal and external validation datasets. The area under the receiver operating characteristic curve (AUC) was 0.976 (95% confidence interval [CI]: 0.962–0.990) on the internal validation set. On external datasets, the model achieved an AUC of 0.962 (95% CI: 0.945–0.979) on LUNA and 0.951 (95% CI: 0.925–0.976) on ISBI, demonstrating high generalizability across different cohorts. Feature-level analysis showed that higher-percentile voxel intensities, especially from axial slices, contributed most to classification. Conclusions: This study presents a classification model that distinguishes between solid and ground-glass nodules with high performance on both internal and external datasets, supporting its potential utility in early lung cancer screening and personalized follow-up strategies.
Keywords:
Pulmonary Nodule
; Machine Learning
; Classification
; Computer Aided Diagnosis
; Computed Tomography
1. Introduction
Lung cancer remains one of the leading causes of cancer-related mortality worldwide [1]. Despite advancements in treatment, the overall five-year survival rate remains low, at approximately 10–15% [2]. Therefore, early screening of at-risk individuals through the detection of pulmonary nodules before clinical deterioration is critical for timely intervention and improved outcomes [3].
To standardize lung cancer screening and enhance patient care, the American College of Radiology introduced the Lung Imaging Reporting and Data System (Lung-RADS) guidelines [4]. Since its initial release in 2014, Lung-RADS has undergone several updates—version 1.0 in 2014, version 1.1 in 2019, and version 1.2 in 2022 [5]. Across all versions, accurate classification of nodule types—specifically solid nodules and ground-glass nodules (GGNs)—on computed tomography (CT) images remains essential. For instance, according to Lung-RADS v1.2, a solid nodule is scored as category 3 (probably benign) if it measures 6 to 8 mm at baseline or 4 to 6 mm if newly detected. In contrast, a GGN receives a score of 3 if it measures 30 mm or larger, regardless of whether it is baseline or new.
Recent advances in deep learning have driven progress in computer-aided detection (CADe) and diagnosis (CADx) systems for lung cancer [6,7,8,9,10]. However, these models typically require considerable computational resources, such as high-performance GPUs, which may limit their deployment in resource-constrained settings. Moreover, while model interpretation techniques—such as class activation maps (CAMs)—have been developed for deep learning models, they remain limited in effectively visualizing classification results for small structures like pulmonary nodules [11,12]. Even when a CAM highlights a region corresponding to a nodule, it is often difficult to intuitively understand why that area was activated or which specific characteristics influenced the model’s decision.
Some studies have attempted to quantify the solid component in pulmonary nodules using threshold-based Hounsfield unit (HU) cutoffs. For example, Lee et al. [13] considered HU values above -400 to represent solid components, while Matsuguma et al. [14] and Ko et al. [15] used thresholds of -160 HU and -188 HU, respectively. Although such approaches offer computational simplicity, they lack standardization and may yield suboptimal performance due to their reliance on a single threshold.
Radiomics has emerged as a promising alternative, attracting increasing interest in various areas of medical imaging [16,17,18]. Compared to deep learning or threshold-based methods, radiomics offers advantages such as interpretable feature sets and reduced computational burden. Because the models are built using quantifiable and human-understandable features, the resulting outputs are easier to interpret and explain. This makes radiomics particularly suitable for lung cancer screening, where interpretability and efficiency are essential.
Therefore, the aim of this study was to develop and validate an explainable, radiomics-based CADx system using machine learning (ML) models to classify pulmonary nodule types, with an emphasis on clinical interpretability and computational efficiency.
2. Materials and Methods
2.1. Study Design and Ethical Approval
Segmed fully de-identified and curated datasets are used in this project. Please check www.segmed.ai for more information. Re-use of health data for research is exempt from Institutional Review Board (IRB) evaluation in the United States (US) if the data is de-identified and the subject identity is protected. This exemption is based on Category 4 of the U.S. Department of Health and Human Services (HHS) regulations at 45 CFR part 46, Subpart A. Subpart A - Basic HHS Policy for Protection of Human Research Subjects; (4) Research involving the collection or study of existing data, documents, records, pathological specimens, or diagnostic specimens, if these sources are publicly available or if the information is recorded by the investigator in such a manner that subjects cannot be identified, directly or through identifiers linked to the subjects. Therefore, this study does not require IRB approval. As this study used de-identified data and was conducted under the exemption criteria specified by the U.S. Department of Health and Human Services at 45 CFR part 46, Subpart A, the need for informed consent was waived and deemed unnecessary according to national regulations.
2.2. Patient Population
In this retrospective study, we collected data for the training and internal validation sets from 238 patients through a medical data collection agency in the United States. Due to data anonymization, clinical variables such as age and gender were unavailable. Two radiologists identified a total of 1,904 nodules by consensus. Part-solid nodules were excluded due to their insufficient number in the dataset. After excluding 11 part-solid nodules and 8 segmentation-failed nodules, 1,885 nodules remained. These were randomly split at the nodule level into 75% for training and 25% for internal validation, resulting in 1,416 nodules (1,277 solid, 139 ground-glass) for training and 472 nodules (426 solid, 46 ground-glass) for internal validation.
For external validation, we used two public datasets. From the LUng Nodule Analysis 2016 (LUNA) dataset [19,20], 1,186 nodules were initially considered, and 64 part-solid nodules were excluded, resulting in 1,122 nodules (957 solid, 165 ground-glass). From the International Symposium on Biomedical Imaging 2018 (ISBI) dataset [21], 246 nodules were available, and 26 part-solid nodules were excluded, yielding 220 nodules (151 solid, 69 ground-glass). A summary of the data distribution and exclusion criteria is shown in Figure 1.
2.3. CT Acquisition Parameters
A total of 238 chest CT scans used for the internal training and validation sets were acquired in axial orientation through a medical data collection agency in the United States. The scans were obtained with the following CT protocols: tube voltage of 80–130 kVp, tube current of 28–706 mA, slice thickness of 1.0 mm, and in-plane pixel size of 0.53–0.98 mm.
2.4. Image Preprocessing
VUNO Med-LungCT AI was utilized to automatically obtain nodule segmentation masks to extract radiomic features. Cases without output masks were considered failures and excluded from the analysis.
2.5. Radiomics Analysis
Radiomic features were extracted from resampled CT images with a voxel size of 0.67×0.67×1.00 mm³. Volume and first-order features were used due to their relevance to nodule characteristics and stability [17,22]. Consequently, the 22 features used were as follows: 1) volume, 2) energy, 3) total energy, 4) entropy, 5) uniformity, 6) minimum, 7) maximum, 8) percentile_10, 9) percentile_25, 10) percentile_50 (same as median), 11) percentile_75, 12) percentile_90, 13) interquartile range, 14) range, 15) mean, 16) variance, 17) mean absolute deviation, 18) robust mean absolute deviation, 19) root mean squared, 20) standard deviation, 21) skewness, and 22) kurtosis. Additionally, features were extracted from a single slice with the largest nodule area in the axial, sagittal, and coronal views, respectively. Consequently, a total of 66 features (22 features from each of the three views) were used for model development. For example, percentile_90 refers to the value of HU that represents the top 10% of the voxel intensities within the nodule mask [23].
2.6. Nodule Type Classification Model
The Random Forest (RF) was used to develop an AI-based nodule type classification model [24]. To enhance the robustness of the radiomic features, all the features were normalized with z-scores and clipped from -3 to 3 using the mean and standard deviation of each feature in the training set. The RF parameters were as follows: n_estimators=1000, class_weight=“balanced”, min_samples_split=5. We further analyzed which of the 66 features mainly contributed to nodule type classification based on the feature importance derived from the RF model. Feature importance in an RF model is calculated by measuring the increase in the prediction error of the model when the values of a particular feature are randomly permuted.
2.7. Statistical Analysis
The following software was used: 1) data pre-processing and RF model construction: Python and Python’s sklearn.ensemble.RandomForestClassifier, 2) nodule segmentation: VUNO Med–LungCT AI, and 3) statistical analysis: R version 4.3.2. The cut-off threshold for classification was determined based on the internal validation set. Specifically, we selected the threshold at which the accuracy for solid nodules exceeded 90.0%, resulting in a probability threshold of 0.828.
3. Results
3.1. Quantitative Analysis
In the internal validation set, the classification of 472 nodules yielded an area under the receiver operating characteristic (ROC) curve (AUC) of 0.976 (95% confidence interval [CI]: 0.962–0.990). The accuracies were 91.5% (390 out of 426) for solid nodules and 93.5% (43 out of 46) for GGNs, resulting in an overall accuracy of 91.7% (433 out of 472).
In the LUNA16 external validation set (1,122 nodules), the AUC was 0.962 (95% CI: 0.945–0.979), with accuracies of 96.8% (926 out of 957) for solid nodules and 81.8% (135 out of 165) for GGNs, resulting in an overall accuracy of 94.6% (1,061 out of 1,122). In the ISBI external validation set (220 nodules), the AUC was 0.951 (95% CI: 0.925–0.976), with accuracies of 88.7% (134 out of 151) for solid nodules and 85.5% (59 out of 69) for GGNs, yielding an overall accuracy of 87.7% (193 out of 220).
3.2. Model Interpretation and Explanation
The RF model was trained using a total of 66 features. We visualized the top 33 features with the highest importance in Figure 3a, and the bottom 33 features with the lowest importance in Figure 3b.
Radiomic features were extracted from a single slice with the largest area in the axial, coronal, and sagittal views, respectively. As shown in Figure 3a, features extracted from the axial slice were more important than those from the sagittal and coronal views. Of the top 33 features (i.e., the top 50%), 16 originated from the axial view. Among the top 10 features, percentile_90, percentile_75, and mean from each of the three views were included, indicating that higher intensity characteristics are the most critical for classifying nodule types. These features capture the upper range of HU values within the segmented nodules.
Conversely, percentile_10 features, which reflect lower HU values within the segmented nodules, were all grouped within the bottom 50% in importance, as shown in Figure 3b. Furthermore, these lower-ranked features were mostly uniformly distributed with importance values below 0.01 and provided limited interpretative insights.
In summary, although features from all three views were used equally during training, those from the axial view contributed more significantly to the classification. Additionally, features representing higher voxel values—such as the 90th percentile, 75th percentile, and mean—were more important than those capturing lower values. Figure 4 illustrates an example of a decision tree from the trained RF model, providing an interpretable view of how features contribute to classification at the individual tree level.
3.3. Qualitative Analysis
Figure 5 illustrates example images along with their prediction scores and the top five features ranked by importance. The segmentation masks were obtained using VUNO Med–LungCT AI. The bar graphs do not represent the raw feature values but instead show z-score–normalized values for visualization. As shown in Figure 4, when the model output approaches 0, the top five feature values tend to be lower; conversely, as the output nears 1, the values increase. This reflects that the features primarily represent the 50th, 75th, and 90th percentile voxel intensities within the nodule. The model employs a decision threshold of 0.828. Notably, the closest GGN (prediction score: 0.74) and solid nodule (prediction score: 0.84) fall near this threshold, making it ambiguous to definitively classify them into one of the two types.
4. Discussion
This study demonstrates the effectiveness of a fast, explainable, and computationally efficient AI-based CADx system for classifying pulmonary nodule types—an essential task in clinical decision-making and alignment with global guidelines [5]. By leveraging radiomic features and an RF classifier, our model achieved robust performance in distinguishing between solid and GGNs.
Our findings highlight three major contributions. First, we validated the model not only on institutionally collected data but also on two independent public datasets—LUNA and ISBI. Despite differences in patient populations and imaging sources, the model maintained high classification performance across these external cohorts, demonstrating its robustness and generalizability. Second, by combining handcrafted radiomic features with a RF classifier, we achieved high classification performance with low computational complexity. Unlike deep learning models that typically require graphic processing unit (GPU) acceleration, our system runs efficiently on central processing units (CPUs), making it accessible in resource-limited settings. Third, the use of explainable AI (XAI) enables transparent interpretation of model behavior, allowing clinicians to identify which features contribute most to classification decisions—an advantage rarely found in traditional deep learning models.
From a clinical perspective, accurate classification of nodule types is essential for risk stratification and individualized patient management [5]. Solid nodules are more likely to be malignant and often warrant closer surveillance or early intervention [25]. In contrast, GGNs tend to represent less aggressive pathology but require long-term monitoring for potential progression. As Lung-RADS guidelines recommend different follow-up strategies based on nodule type and size, precise classification directly impacts clinical workflows and patient outcomes.
Although classification models often suffer from performance degradation when applied to unseen external datasets, our CADx system maintained its predictive performance across multiple external cohorts. This robustness highlights the potential of our model for broad clinical applicability without the need for extensive site-specific retraining, particularly given its use of multi-view and high-dimensional radiomic features.
Interpretability is another key advantage of our approach. While deep learning methods often operate as black boxes, our RF model allows for clear identification of influential features. Prior XAI techniques, such as CAMs, typically indicate spatial regions of interest but do not clarify what feature types of drive predictions [11,12,26]. In contrast, our model highlights specific, mathematically defined radiomic features that directly inform the decision-making process. This transparency can enhance clinical trust and adoption.
Our feature importance analysis revealed that features derived from the axial view, particularly those reflecting higher HU values—such as the 90th, 75th percentiles, and mean—were most influential in distinguishing nodule types. These findings provide insight into the imaging characteristics that drive classification and could guide future development of CADx tools and manual assessment strategies.
Despite these strengths, our study has limitations. First, part-solid nodules and segmentation-failed cases were excluded, which could limit generalizability. Second, although model inference is CPU-compatible, segmentation still benefits from GPU acceleration. Third, the current study assumes prior nodule detection, and future work should evaluate performance in a fully integrated detection-to-classification pipeline.
In conclusion, we developed an explainable, radiomics-based CADx system that effectively classifies pulmonary nodule types with high performance and generalizability. Validation on two independent public datasets confirmed its robustness across cohorts, supporting its applicability in real-world clinical settings. Future research should explore its extension to more complex nodule subtypes, such as part-solid and cystic nodules, in alignment with evolving Lung-RADS guidelines.
Author Contributions
Conceptualization, D.P.; methodology, D.P.; software, D.P. and C.P.; validation, D.P. and J-H.K.; formal analysis, D.P.; investigation, D.P.; resources, D.P.; data curation, D.P. , J-H.K., and C.P.; writing—original draft preparation, D.P.; writing—review and editing, D.P.; visualization, D.P. and C.P.; supervision, D.P.; project administration, D.P.; funding acquisition, D.P. All authors have read and agreed to the published version of the manuscript.
Funding
This research was supported by Korea Health Industry Development Institute (KHIDI) funded by the Ministry of Health and Welfare (MOHW), Republic of Korea (No. HI22C041600).
Institutional Review Board Statement
Segmed fully de-identified and curated datasets are used in this project. Please check www.segmed.ai for more information. Re-use of health data for research is exempt from Institutional Review Board (IRB) evaluation in the United States (US) if the data is de-identified and the subject identity is protected. This exemption is based on Category 4 of the U.S. Department of Health and Human Services (HHS) regulations at 45 CFR part 46, Subpart A. Subpart A - Basic HHS Policy for Protection of Human Research Subjects; (4) Research involving the collection or study of existing data, documents, records, pathological specimens, or diagnostic specimens, if these sources are publicly available or if the information is recorded by the investigator in such a manner that subjects cannot be identified, directly or through identifiers linked to the subjects. Therefore, this study does not require IRB approval. As this study used de-identified data and was conducted under the exemption criteria specified by the U.S. Department of Health and Human Services at 45 CFR part 46, Subpart A, the need for informed consent was waived and deemed unnecessary according to national regulations.
Informed Consent Statement
Not Applicable.
Data Availability Statement
Data are contained within the article.
Acknowledgments
During the preparation of this work, the author(s) used ChatGPT-4o to improve readability. After using this tool/service, the author(s) reviewed and edited the content as needed and take(s) full responsibility for the content of the publication.
Conflicts of Interest
D.P., J-H.K., and C.P. were employed by VUNO Inc.
Abbreviations
The following abbreviations are used in this manuscript:
| Lung-RADS | Lung Imaging Reporting and Data System |
| GGN | Ground-Glass Nodule |
| CT | Computed Tomography |
| CADe | Computer-Aided Detection |
| CADx | Computer-Aided Diagnosis |
| CAM | Class Activation Map |
| HU | Hounsfield Unit |
| ML | Machine Learning |
| LUNA | LUng Nodule Analysis 2016 |
| ISBI | International Symposium on Biomedical Imaging 2018 |
| RF | Random Forest |
| ROC | Receiver Operating Characteristic |
| AUC | Area Under the receiver operating characteristic Curve |
| CI | Confidence Interval |
| XAI | Explainable AI |
| GPU | Graphic Processing Unit |
| CPU | Central Processing Units |
References
- Siegel, R.L.; Miller, K.D.; Jemal, A. Cancer Statistics, 2019. CA Cancer J Clin 2019, 69, 7–34. [Google Scholar] [CrossRef] [PubMed]
- Siegel, R.; Ma, J.; Zou, Z.; Jemal, A. Cancer Statistics, 2014. CA Cancer J Clin 2014, 64, 9–29. [Google Scholar] [CrossRef] [PubMed]
- Zarinshenas, R.; Amini, A.; Mambetsariev, I.; Abuali, T.; Fricke, J.; Ladbury, C.; Salgia, R. Assessment of Barriers and Challenges to Screening, Diagnosis, and Biomarker Testing in Early-Stage Lung Cancer. Cancers (Basel) 2023, 15, 1595. [Google Scholar] [CrossRef] [PubMed]
- American College of Radiology. Lung CT Screening Reporting and Data System (Lung-RADS). Available at: Https://Www.Acr.Org/Clinical-Resources/Clinical-Tools-and-Reference/Reporting-and-Data-Systems/Lung-RADS. Accessed 31 March 2025.
- Christensen, J.; Prosper, A.E.; Wu, C.C.; Chung, J.; Lee, E.; Elicker, B.; Hunsaker, A.R.; Petranovic, M.; Sandler, K.L.; Stiles, B.; et al. ACR Lung-RADS V2022: Assessment Categories and Management Recommendations. Journal of the American College of Radiology 2024, 21, 473–488. [Google Scholar] [CrossRef]
- Park, D.; Jang, R.; Chung, M.J.; An, H.J.; Bak, S.; Choi, E.; Hwang, D. Development and Validation of a Hybrid Deep Learning–Machine Learning Approach for Severity Assessment of COVID-19 and Other Pneumonias. Sci Rep 2023, 13, 13420. [Google Scholar] [CrossRef]
- Thanoon, M.A.; Zulkifley, M.A.; Mohd Zainuri, M.A.A.; Abdani, S.R. A Review of Deep Learning Techniques for Lung Cancer Screening and Diagnosis Based on CT Images. Diagnostics 2023, 13, 2617. [Google Scholar] [CrossRef]
- Park, S.; Lee, S.M.; Kim, W.; Park, H.; Jung, K.-H.; Do, K.-H.; Seo, J.B. Computer-Aided Detection of Subsolid Nodules at Chest CT: Improved Performance with Deep Learning–Based CT Section Thickness Reduction. Radiology 2021, 299, 211–219. [Google Scholar] [CrossRef]
- Choi, E.; Park, D.; Son, G.; Bak, S.; Eo, T.; Youn, D.; Hwang, D. Weakly Supervised Deep Learning for Diagnosis of Multiple Vertebral Compression Fractures in CT. Eur Radiol 2023, 34, 3750–3760. [Google Scholar] [CrossRef]
- Byeon, Y.; Kim, H.; Kim, K.; Park, D.; Choi, E.; Hwang, D. M3F: Multi-Field-of-View Feature Fusion Network for Aortic Vessel Tree Segmentation in CT Angiography. In; 2024; pp. 1–12.
- Bolei Zhou, A.K.A.L.A.O.A.T. Learning Deep Features for Discriminative Localization. In Proceedings of the Proceedings of the IEEE Conference on Computer Vision and Pattern Recognition (CVPR); 2016; pp. 2921–2929.
- Liu, Y.; Hsu, H.Y.; Lin, T.; Peng, B.; Saqi, A.; Salvatore, M.M.; Jambawalikar, S. Lung Nodule Malignancy Classification with Associated Pulmonary Fibrosis Using 3D Attention-Gated Convolutional Network with CT Scans. J Transl Med 2024, 22, 51. [Google Scholar] [CrossRef]
- Lee, J.H.; Kim, T.H.; Lee, S.; Han, K.; Byun, M.K.; Chang, Y.S.; Kim, H.J.; Lee, G.D.; Park, C.H. High versus Low Attenuation Thresholds to Determine the Solid Component of Ground-Glass Opacity Nodules. PLoS One 2018, 13, e0205490. [Google Scholar] [CrossRef]
- MATSUGUMA, H.; NAKAHARA, R.; ANRAKU, M.; KONDO, T.; TSUURA, Y.; KAMIYAMA, Y.; MORI, K.; YOKOI, K. Objective Definition and Measurement Method of Ground-Glass Opacity for Planning Limited Resection in Patients with Clinical Stage IA Adenocarcinoma of the Lung1. European Journal of Cardio-Thoracic Surgery 2004, 25, 1102–1106. [Google Scholar] [CrossRef] [PubMed]
- Ko, J.P.; Suh, J.; Ibidapo, O.; Escalon, J.G.; Li, J.; Pass, H.; Naidich, D.P.; Crawford, B.; Tsai, E.B.; Koo, C.W.; et al. Lung Adenocarcinoma: Correlation of Quantitative CT Findings with Pathologic Findings. Radiology 2016, 280, 931–939. [Google Scholar] [CrossRef] [PubMed]
- Gillies, R.J.; Kinahan, P.E.; Hricak, H. Radiomics: Images Are More than Pictures, They Are Data. Radiology 2016, 278, 563–577. [Google Scholar] [CrossRef]
- Park, D.; Oh, D.; Lee, M.; Lee, S.Y.; Shin, K.M.; Jun, J.S.; Hwang, D. Importance of CT Image Normalization in Radiomics Analysis: Prediction of 3-Year Recurrence-Free Survival in Non-Small Cell Lung Cancer. Eur Radiol 2022, 32, 8716–8725. [Google Scholar] [CrossRef]
- Aerts, H.J.W.L.; Velazquez, E.R.; Leijenaar, R.T.H.; Parmar, C.; Grossmann, P.; Carvalho, S.; Bussink, J.; Monshouwer, R.; Haibe-Kains, B.; Rietveld, D.; et al. Decoding Tumour Phenotype by Noninvasive Imaging Using a Quantitative Radiomics Approach. Nat Commun 2014, 5, 4006. [Google Scholar] [CrossRef] [PubMed]
- Armato, S.G.; McLennan, G.; Bidaut, L.; McNitt-Gray, M.F.; Meyer, C.R.; Reeves, A.P.; Zhao, B.; Aberle, D.R.; Henschke, C.I.; Hoffman, E.A.; et al. The Lung Image Database Consortium (LIDC) and Image Database Resource Initiative (IDRI): A Completed Reference Database of Lung Nodules on CT Scans. Med Phys 2011, 38, 915–931. [Google Scholar] [CrossRef]
- Setio, A.A.A.; Traverso, A.; de Bel, T.; Berens, M.S.N.; Bogaard, C. van den; Cerello, P.; Chen, H.; Dou, Q.; Fantacci, M.E.; Geurts, B.; et al. Validation, Comparison, and Combination of Algorithms for Automatic Detection of Pulmonary Nodules in Computed Tomography Images: The LUNA16 Challenge. Med Image Anal 2017, 42, 1–13. [Google Scholar] [CrossRef]
- Balagurunathan, Y.; Beers, A.; Mcnitt-Gray, M.; Hadjiiski, L.; Napel, S.; Goldgof, D.; Perez, G.; Arbelaez, P.; Mehrtash, A.; Kapur, T.; et al. Lung Nodule Malignancy Prediction in Sequential CT Scans: Summary of ISBI 2018 Challenge. IEEE Trans Med Imaging 2021, 40, 3748–3761. [Google Scholar] [CrossRef]
- van Griethuysen, J.J.M.; Fedorov, A.; Parmar, C.; Hosny, A.; Aucoin, N.; Narayan, V.; Beets-Tan, R.G.H.; Fillion-Robin, J.-C.; Pieper, S.; Aerts, H.J.W.L. Computational Radiomics System to Decode the Radiographic Phenotype. Cancer Res 2017, 77, e104–e107. [Google Scholar] [CrossRef]
- Zwanenburg, A.; Leger, S.; Vallières, M.; Löck, S. Image Biomarker Standardisation Initiative. 2016. [CrossRef]
- Breiman, L. Random Forests. Mach Learn 2001, 45, 5–32. [Google Scholar] [CrossRef]
- McWilliams, A.; Tammemagi, M.C.; Mayo, J.R.; Roberts, H.; Liu, G.; Soghrati, K.; Yasufuku, K.; Martel, S.; Laberge, F.; Gingras, M.; et al. Probability of Cancer in Pulmonary Nodules Detected on First Screening CT. New England Journal of Medicine 2013, 369, 910–919. [Google Scholar] [CrossRef] [PubMed]
- Jeong Ryong Lee, S.K.I.P.T.E.D.H. Relevance-CAM: Your Model Already Knows Where To Look. In Proceedings of the Proceedings of the IEEE/CVF Conference on Computer Vision and Pattern Recognition (CVPR); 2021; pp. 14944–14953.
Figure 1.
Data flow diagrams. GGN, ground-glass nodule.
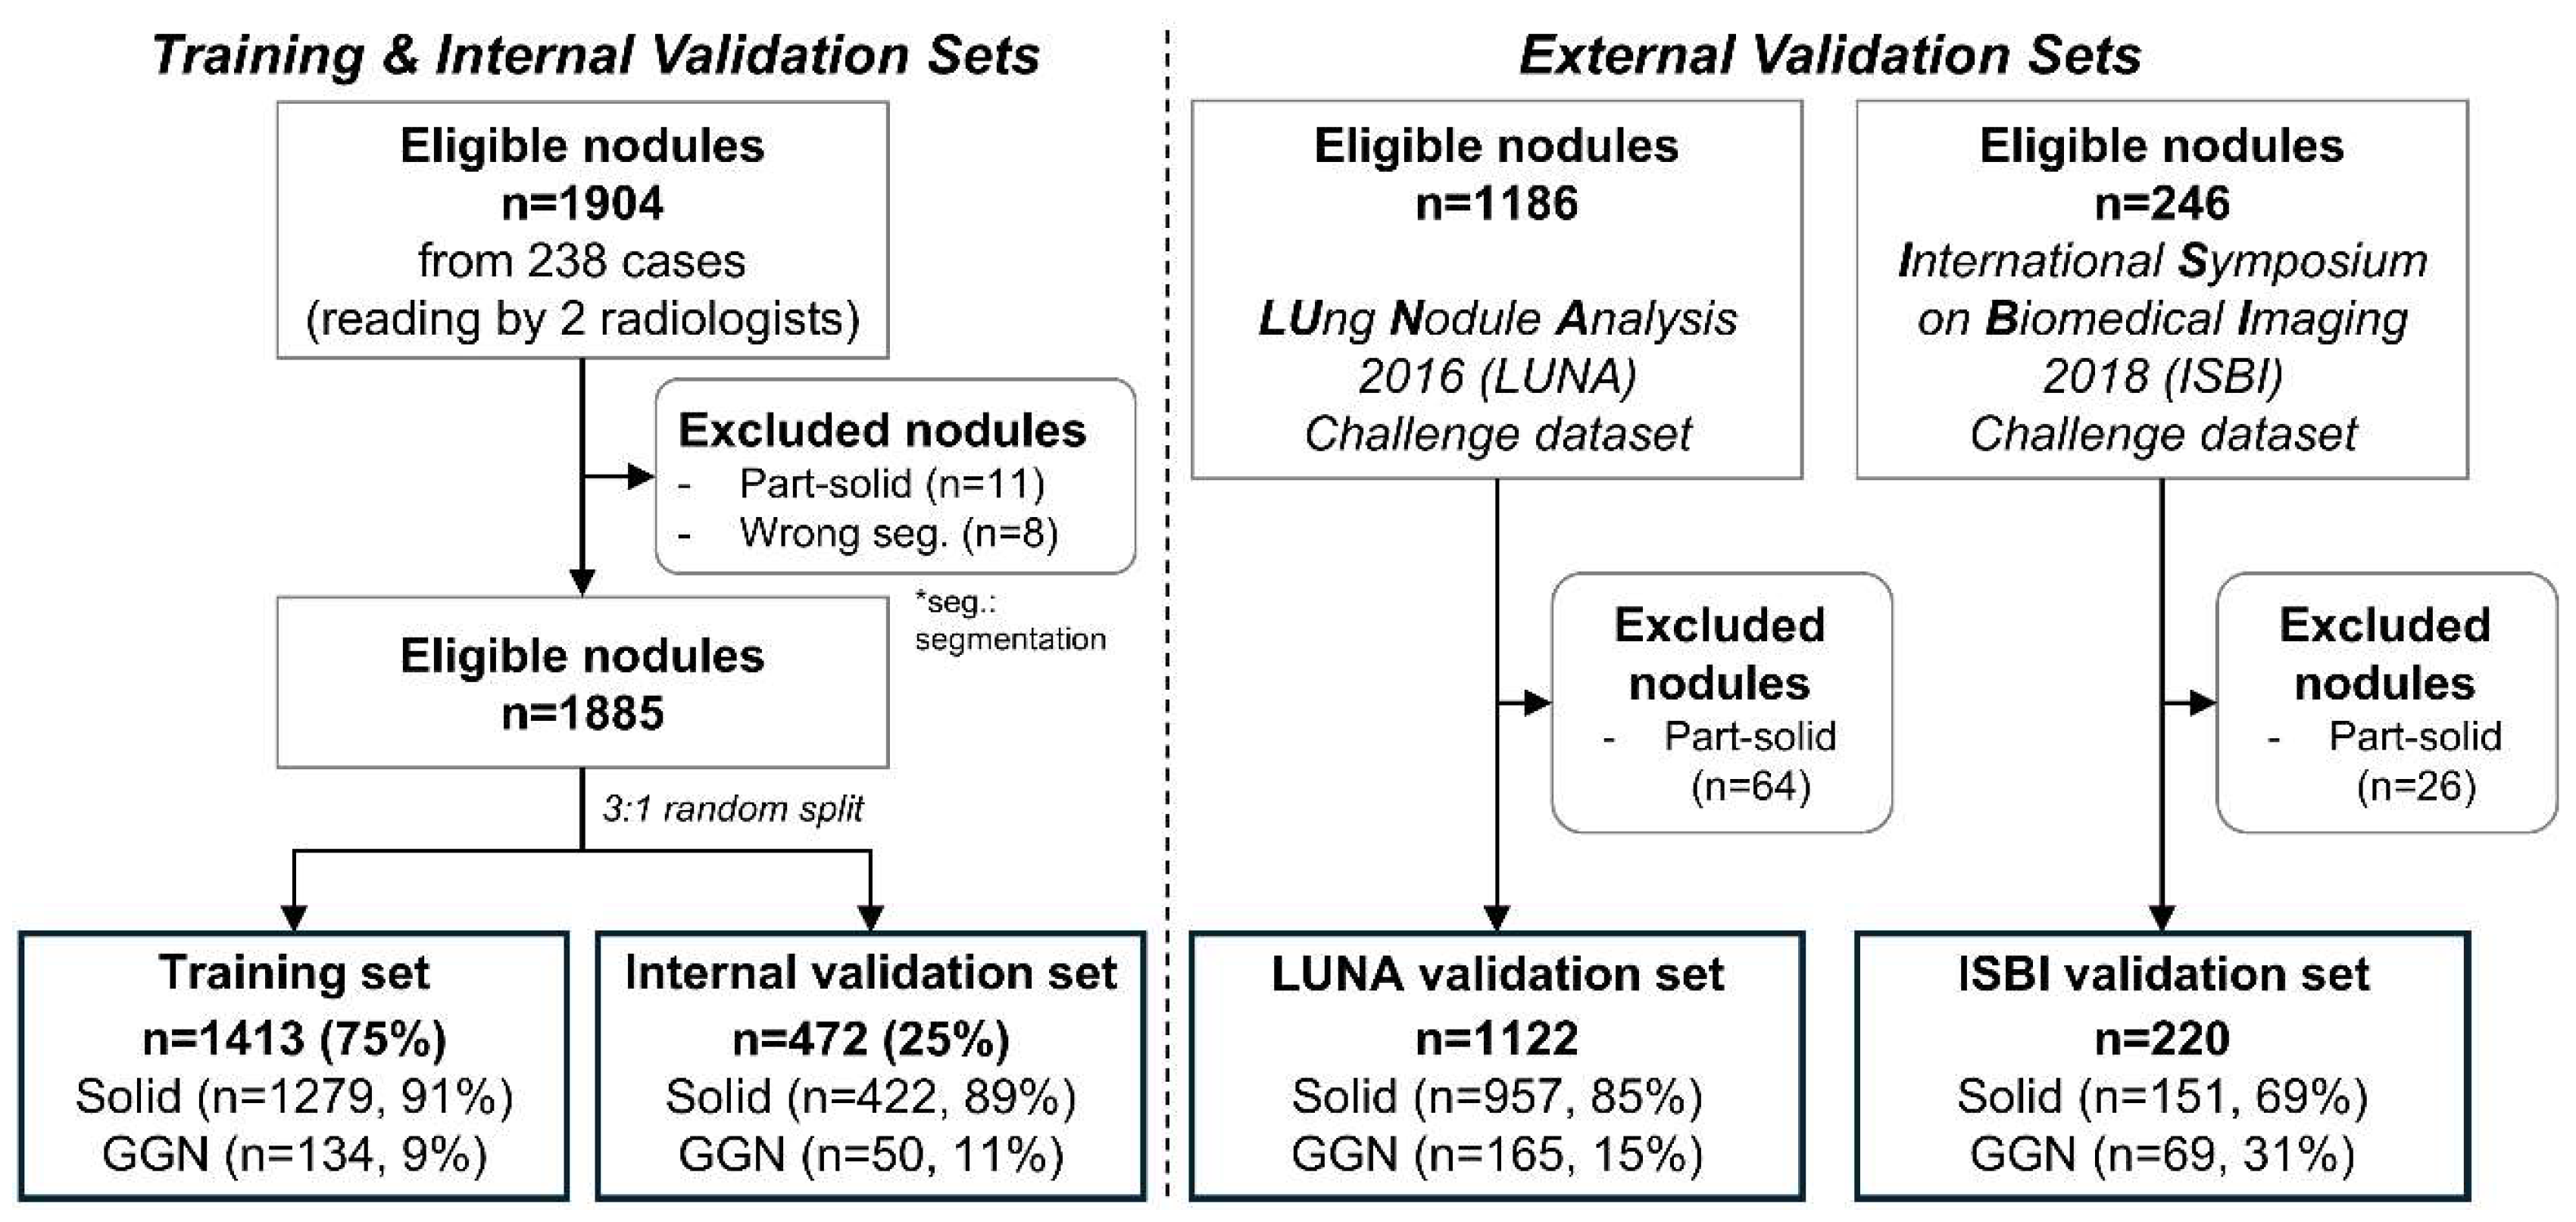
Figure 2.
Experimental results. (a) Receiver operating characteristics (ROC) curves, (b) Confusion matrices.
Figure 2.
Experimental results. (a) Receiver operating characteristics (ROC) curves, (b) Confusion matrices.
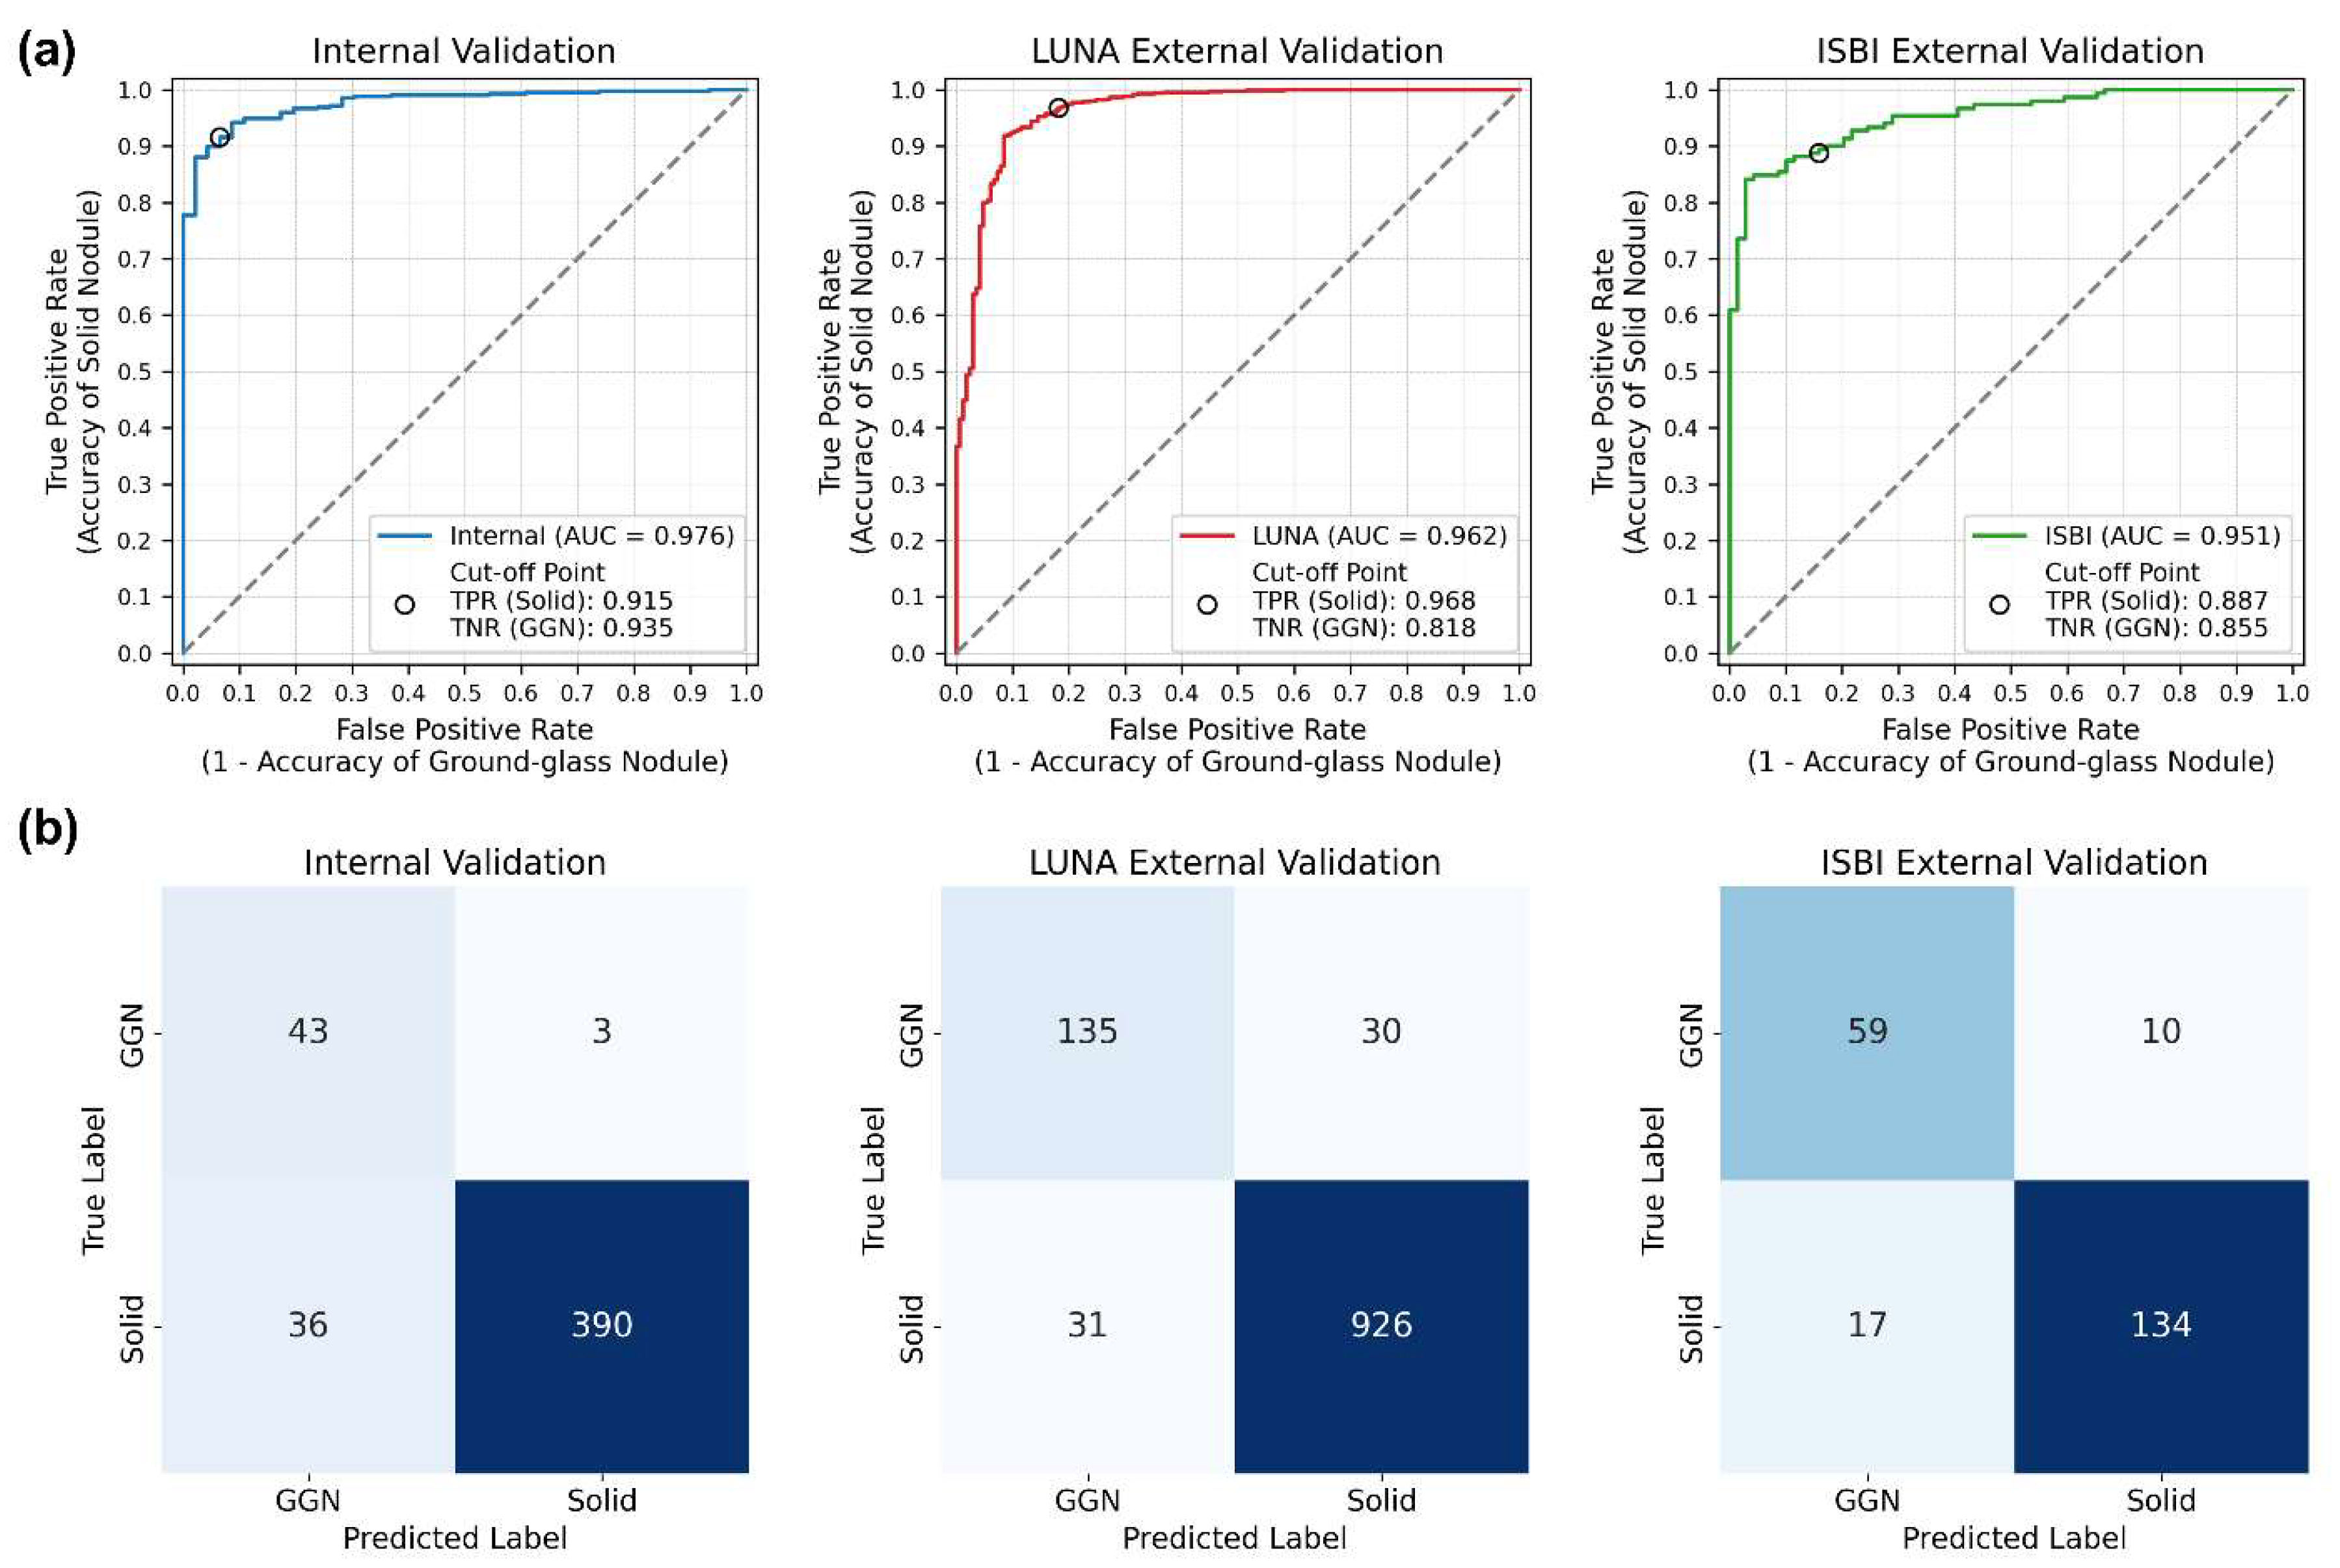
Figure 3.
Feature importance of the proposed model. (a) Top 50% (33 out of 66) features, (b) Bottom 50% (33 out of 66) features.
Figure 3.
Feature importance of the proposed model. (a) Top 50% (33 out of 66) features, (b) Bottom 50% (33 out of 66) features.
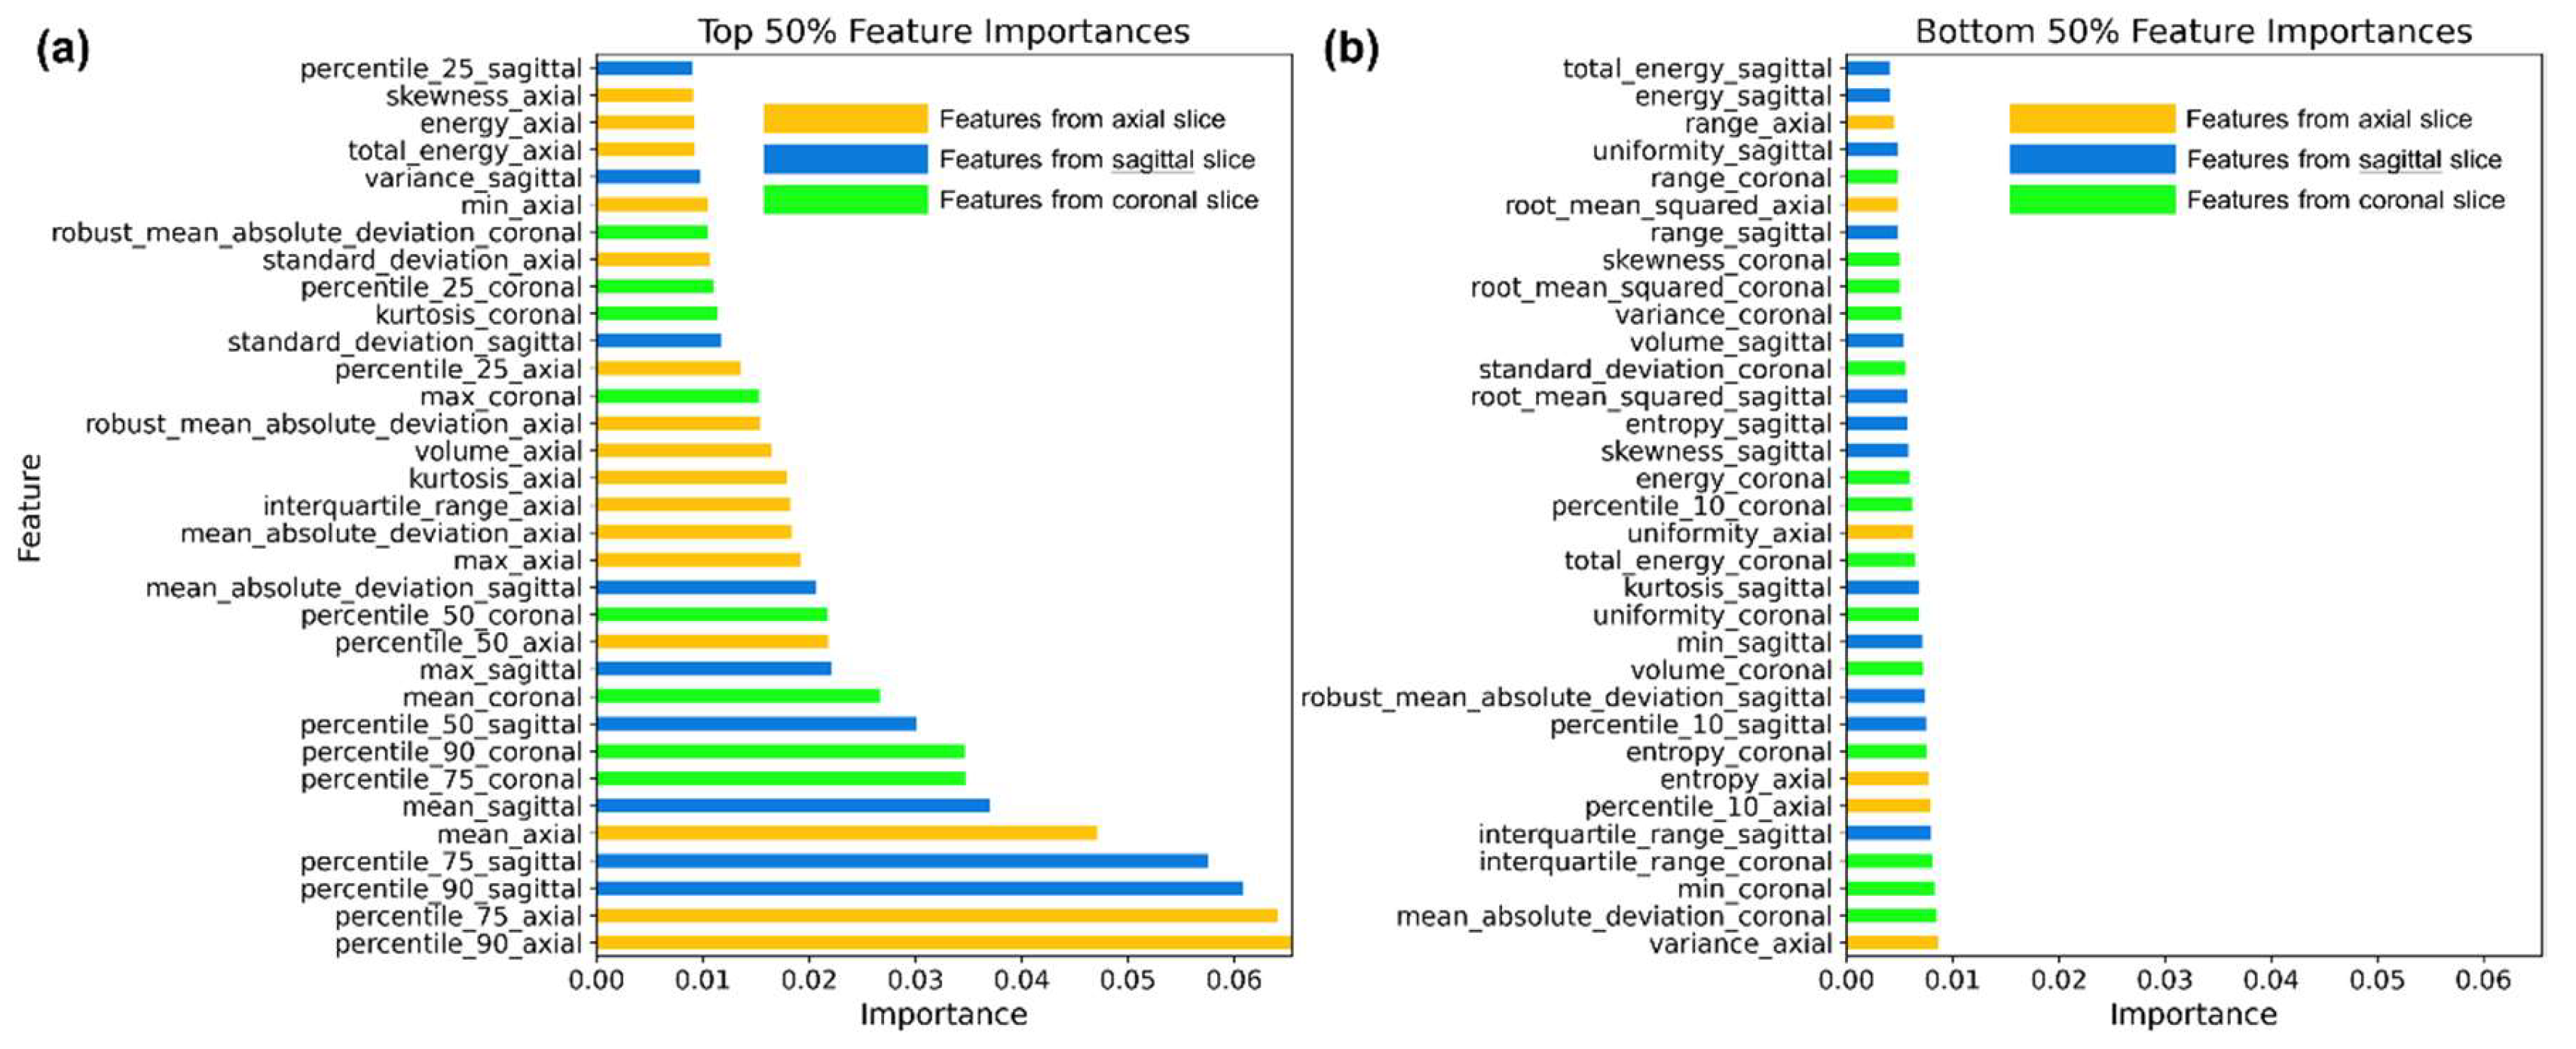
Figure 4.
Overview of the trained Random Forest model.
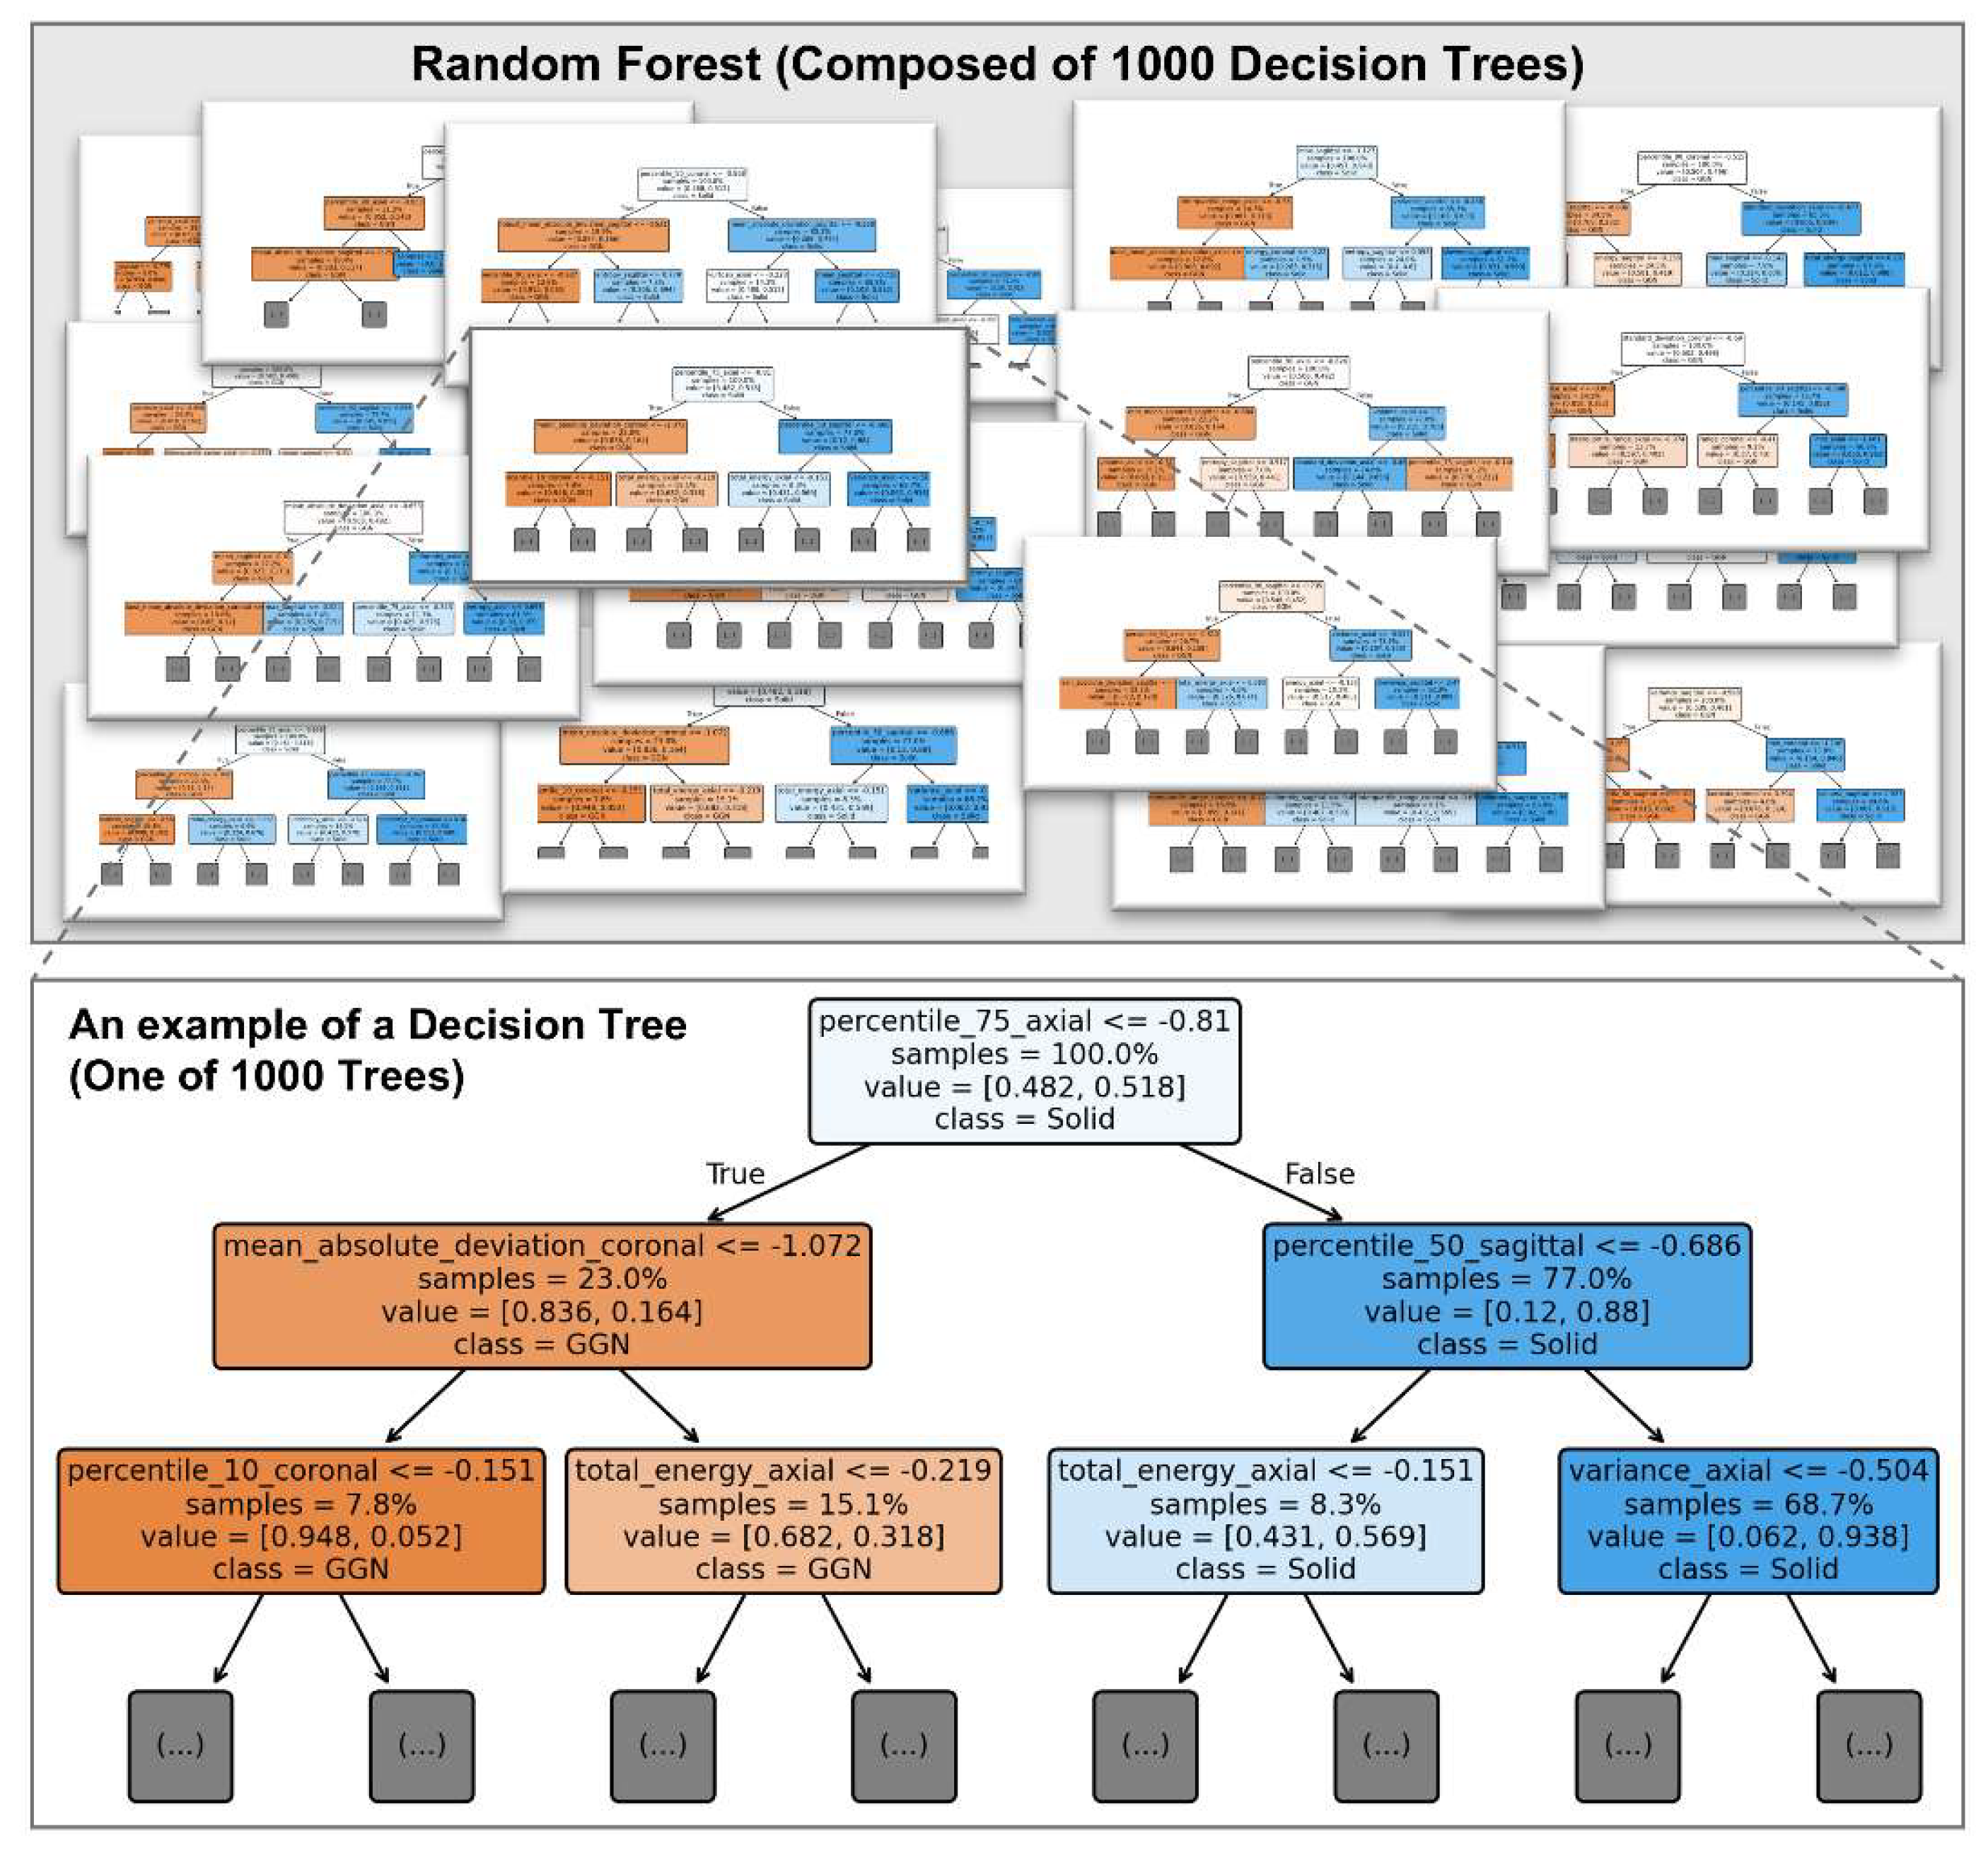
Figure 5.
Representative example images according to the prediction scores. Outputs closer to the left indicate probabilities near 0 (probably GGN), while outputs closer to the right indicate probabilities near 1 (probably solid nodule). The model’s cut-off is 0.781, with the five rightmost images predicted as solid nodules. The bar graphs show the z-score normalized values of the five features with the highest feature importance.
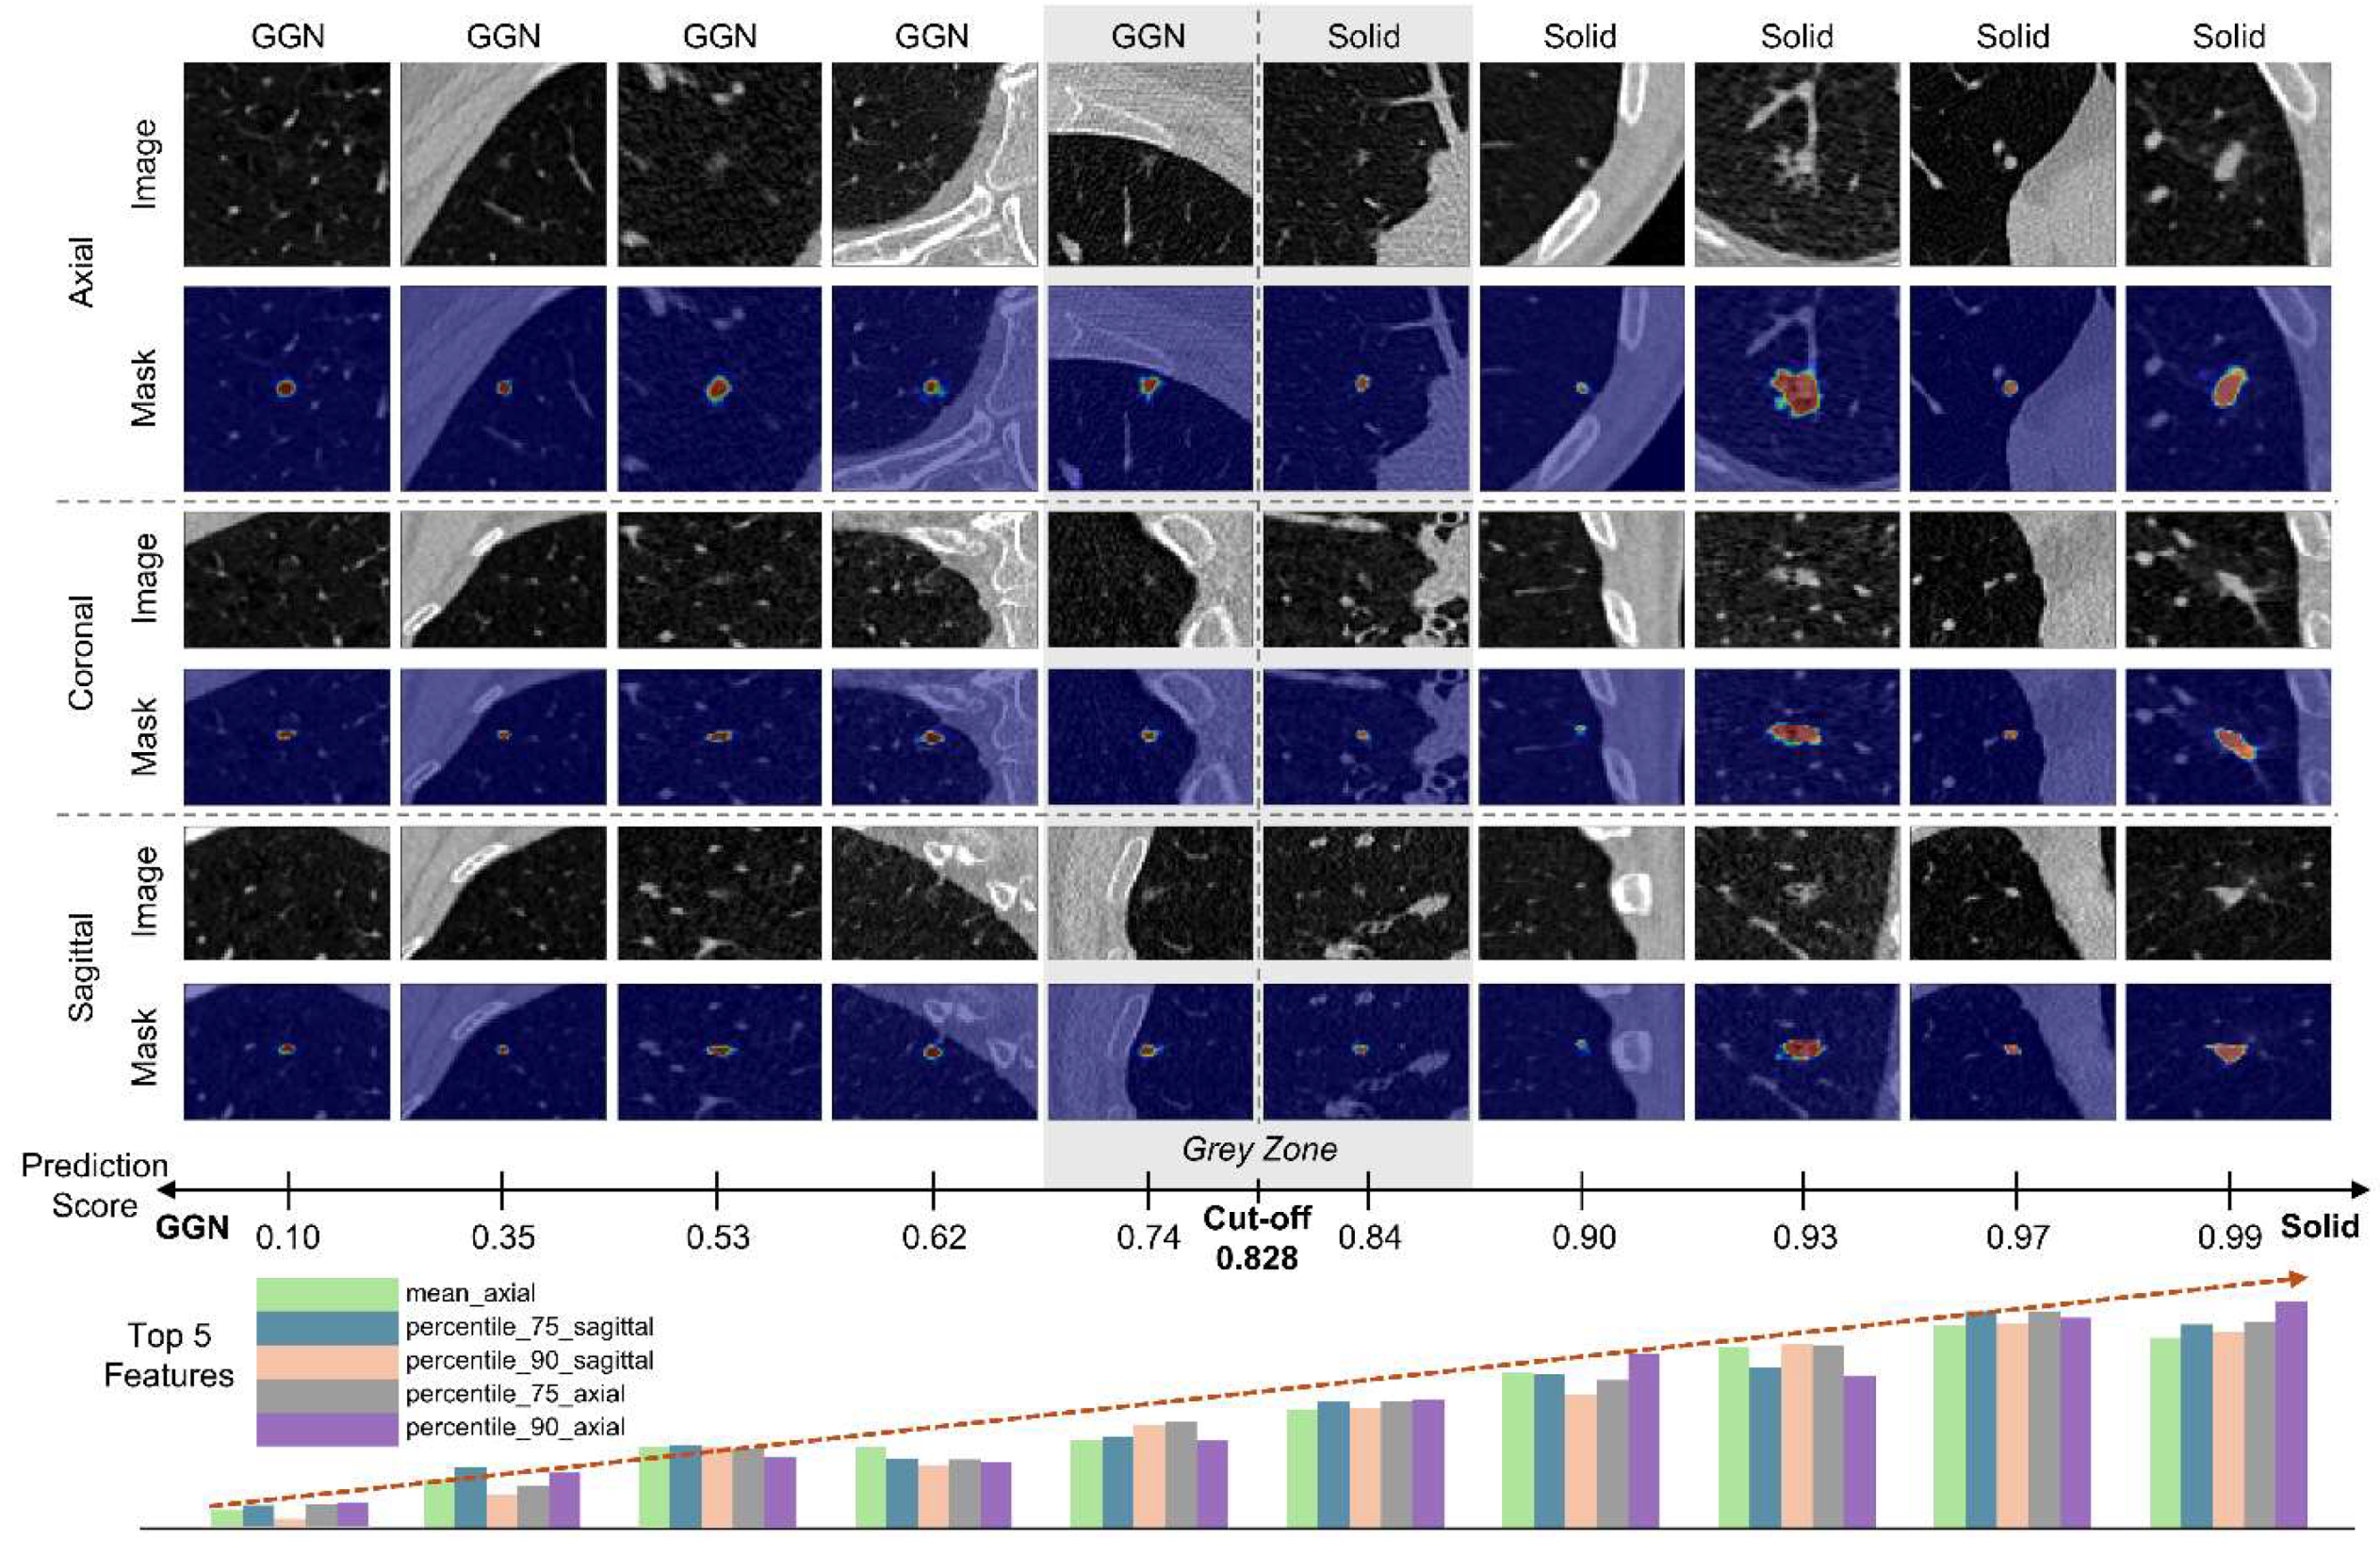

Table 1.
Pulmonary nodule type classification performance of the proposed model on internal and external validation sets.
Table 1.
Pulmonary nodule type classification performance of the proposed model on internal and external validation sets.
| Metrics | Internal Validation |
External Validation | |
|---|---|---|---|
| LUNA | ISBI | ||
| AUC | 0.976 (0.962–0.990) | 0.962 (0.945–0.979) | 0.951 (0.925–0.976) |
| Accuracy | 0.917 (0.894–0.941) | 0.946 (0.930–0.958) | 0.877 (0.827–0.918) |
| Sensitivity | 0.915 (0.885–0.940) | 0.968 (0.954–0.978) | 0.887 (0.826–0.933) |
| Specificity | 0.935 (0.821–0.986) | 0.818 (0.751–0.874) | 0.855 (0.750–0.928) |
| NPV | 0.544 (0.428–0.657) | 0.813 (0.746–0.869) | 0.776 (0.666–0.864) |
| PPV | 0.992 (0.978–0.998) | 0.969 (0.956–0.979) | 0.931 (0.876–0.966) |
| F1-score | 0.952 (0.938–0.967) | 0.968 (0.960–0.976) | 0.908 (0.871–0.940) |
AUC, Area Under the Receiver Operating Characteristic Curve; NPV, Negative Predictive Value; PPV, Positive Predictive Value. Values are reported as point estimates with 95% confidence intervals in parentheses. LUNA, LUng Nodule Analysis 2016; ISBI, International Symposium on Biomedical Imaging 2018.
Disclaimer/Publisher’s Note: The statements, opinions and data contained in all publications are solely those of the individual author(s) and contributor(s) and not of MDPI and/or the editor(s). MDPI and/or the editor(s) disclaim responsibility for any injury to people or property resulting from any ideas, methods, instructions or products referred to in the content. |
© 2025 by the authors. Licensee MDPI, Basel, Switzerland. This article is an open access article distributed under the terms and conditions of the Creative Commons Attribution (CC BY) license (http://creativecommons.org/licenses/by/4.0/).
Copyright: This open access article is published under a Creative Commons CC BY 4.0 license, which permit the free download, distribution, and reuse, provided that the author and preprint are cited in any reuse.


