
Submitted:
27 March 2025
Posted:
31 March 2025
You are already at the latest version
Abstract
Antibiotics are commonly used to aid in the remission of gastrointestinal diseases, but usage may lead to prolonged dysbiosis. The objective of this study was to evaluate the effects of metronidazole on fecal microbiota, fecal metabolites, and serum bile acids and uremic toxins of healthy adult cats. Twelve healthy adult cats (4.7±0.4 yr) received metronidazole (20 mg/kg BW PO BID) for 14 days (day 0–14) and were monitored during a 28-day recovery period (day 15–42). Fecal and blood samples were collected at baseline (day 0), after metronidazole (day 14), and weekly during recovery (days 21, 28, 35, and 42). Fecal samples were analyzed for microbiota and bacterial metabolites. Serum samples were analyzed for bile acids and uremic toxins. Metronidazole increased dysbiosis index and fecal lactate concentrations (P<0.0001), and decreased fecal propionate, butyrate, and secondary bile acid concentrations (P<0.0001) for up to 28 days. Prolonged dysbiosis and Peptacetobacter (Clostridium) hiranonis reductions were observed in 10/12 (83%) cats. Serum uremic toxins were also reduced (P<0.0001) after metronidazole administration. The observed changes after metronidazole administration illustrate how changes in the gut microbiome alter microbial metabolism and its relation to host dysmetabolism. In conclusion, metronidazole is a potent antibiotic with persistent effects observed in the microbiome and metabolome, even up to one month after administration.
Keywords:
antibiotic
; fecal lactate
; feline nutrition
; feline microbiome
; uremic toxins
1. Introduction
The gastrointestinal (GI) microbiome is a large, diverse, and complex community of microorganisms, known to play significant roles in both health and disease, affecting host metabolism, immune function and physiology (i.e., gut structure) [1]. As with any ecosystem, the balance of these communities depends on several factors including the host’s age, diet, environment, and health status and changes when exposed to different stimuli. The maintenance of a stable community is vital to host health and depends on the level of microbiome resistance (ability to withstand adversity in a challenge) and resilience (pace of return to initial composition) [2]. Dysbiosis often refers to the changes observed in response to a challenge (i.e., immune stressor, medication), traditionally observed through a reduction of overall microbial diversity, in combination with a loss of beneficial bacteria and increase in pathobionts, and overall functional alterations of the microbiota community [3,4,5].
Chronic enteropathies (CE) can be characterized by persistently chronic (≥ 3 weeks) GI signs of disease (i.e., weight loss, vomiting, diarrhea, lethargy, anorexia) but its diagnosis is reliant on an elimination of extraintestinal factors as causes of disease [5,6,7,8]. As clinical signs alone cannot diagnose CE, analysis of microbial abundances, microbial metabolites, and/or intestinal markers may be used to aid in disease diagnosis and provide further insight into pathogenesis. Quantifying these analytes and biomarkers, and understanding their importance to host health, may assist in the management of clinical diseases.
The most common strategies for remission of CE include dietary interventions, steroids/immunosuppressive drugs, antibiotics or, in more recent years, fecal microbial transplants. Antibiotics can be useful in the treatment of infections, as they can be efficacious in reducing microbial load. However, the overuse and misuse of antibiotics can lead to the development of antimicrobial resistance, potentially leading to a larger threat to global health in humans and companion animals [9,10]. Despite being a common treatment, a few studies have demonstrated that post-antibiotic dysbiosis can occur and result in negative side effects relating to the GI tract and central nervous system [11,12,13,14]. Although limited research in cats exists, it has been shown that antibiotic administration results in dysbiosis and consequent effects on GI health (i.e., hyporexia, vomiting, diarrhea) [15,16,17].
Metronidazole is a potent bactericidal antibiotic with high efficacy in treating giardia and severe GI infections in dogs, demonstrating that it can reduce microbial abundance and affect microbial metabolism as quantified by fecal microbial-derived metabolites [e.g., bile acids (BA)] [14]. Primary BA are synthesized by the host (conjugated with taurine or glycine) and used to aid in lipid digestion, with the majority being reabsorbed and recycled. Any that escape reabsorption are exposed to colonic microbes with the ability to biotransform primary BA into secondary BA. Previously reported in dogs and cats, a higher primary BA concentration is common in animals with CE or after treatment with antibiotics [18,19,20,21,22,23]. In more recent years, Peptacetobacter (previously Clostridium) hiranonis, has been shown to be the predominate species with the ability to convert primary BA into secondary BA in dogs and cats via 7α-dehydroxylation enzymes produced by the baiCD gene [14,24,25]. The abundance of P. hiranonis is strongly correlated with fecal secondary BA concentrations, with a reduction observed in dogs following metronidazole administration [26]. Therefore, reduced P. hiranonis results in an imbalanced BA profile, which is commonly observed in chronic GI disease or with antibiotic administration [1,21,22,23,27,28].
Additionally, serum BA and uremic toxins [indoxyl sulfate (IS), p-cresol sulfate (PCS)] may serve as potential biomarkers of GI dysfunction; however, there is limited research on their concentrations in antibiotic-treated cats or their health implications. Beginning as products of amino acid metabolism by bacteria, indole and p-cresol are absorbed and transported to the liver, where they are converted by sulfotransferases into IS and PCS before being excreted via urine. In cats with chronic kidney disease, uremic toxins accumulate and can lead to disease progression, induce inflammation, damage nephrons, and promote renal fibrosis, further exacerbating kidney malfunction [29]. As antibiotics are known to disrupt microbial metabolism, measuring these metabolites in the serum of animals may provide insight into systemic effects of antibiotics and secondary metabolites as relating to GI functionality and integrity.
Overall, limited research is available on the effects of metronidazole on the fecal microbiota and metabolite profiles of cats. With previous research demonstrating prolonged consequences with antibiotic use, the objectives of this study were to evaluate the effects of metronidazole on the fecal microbiota and bacterial metabolites, as well as characterize the serum BA profile and uremic toxin concentrations of healthy adult cats. Based on past research, we hypothesized that metronidazole would drastically alter the fecal microbiota and fecal metabolite profiles, and influence serum metabolite concentrations.
2. Materials and Methods
2.1. Animals, Diet, and Experimental Design
All animal procedures were approved by the University of Illinois Institutional Animal Care and Use Committee prior to experimentation (IACUC #22028). Twelve healthy adult domestic shorthair cats (mean age = 4.7 ± 0.4 yr; mean body weight = 4.3 ± 0.8 kg) were used. All cats were housed in an environmentally-controlled facility at the University of Illinois Urbana-Champaign. Cats were group-housed, except for feeding times when all cats were individually housed to measure food offered and refused to calculate intake.
Cats had free access to fresh water at all times and were fed twice daily (8 am; 3 pm) at a rate to maintain body weight throughout the study. Cats were fed a standardized diet of Purina Cat Chow (Nestlé Purina PetCare Company, St. Louis, MO), which is formulated to meet all nutrient recommendations provided by the Association of American Feed Control Officials [30] for adult cats at maintenance. Food offered and refused was measured each day to calculate intake and any observations of vomiting or negative reactions were recorded.
The experimental timeline is presented in Supplementary Figure S1. The study was 42 days in length, with all cats consuming the basal diet for the duration. The study started with a 14-day baseline phase where all cats were adapted to the diet. After baseline (day 0), cats received metronidazole (Metronidazole Compounded Oil Liquid Chicken Flavored; Chewy, Inc.; Boston, MA) at a dosage of 20 mg/kg orally twice daily (at meal times) for 14 days. Cats were fed the basal diet for another 28 days to monitor recovery. Cats were weighed and body condition scores were assessed using a 9-point scale [31] once a week prior to the morning feeding throughout the study.
2.2. Blood and Fecal Sample Collections and Analyses
At days 0, 14, 21, 28, 35, and 42, overnight fasted blood samples were collected via jugular venipuncture. To collect blood, cats were sedated for at least 30 minutes with an intramuscular injection mix of Dexdomitor (dexmedetomidine; 0.02 mg/kg BW; Zoetis, Parsippany-Troy Hills, NJ) and Torbugesic (butorphanol tartrate; 0.4 mg/kg BW; Zoetis), and reversed using Antisedan (atipamezole hydrochloride; 0.2 mg/kg BW; Zoetis). Blood was collected into serum tubes containing a clot activator and gel for serum separation (BD Vacutainer SST Tubes #367986, Becton Dickinson, Franklin Lakes, NJ) for serum metabolite concentrations. Blood for serum isolation was centrifuged 1,800 × g at 4°C for 10 minutes (Beckman CS-6R Centrifuge; Beckman Coulter Inc., Brea, CA).
On days 0, 14, 21, 28, 35, and 42, fresh fecal samples were collected for the analysis of fecal score, pH, dry matter (DM) percentage, microbiota populations, and BA (conjugated and unconjugated forms), short-chain fatty acid (SCFA), branched-chain fatty acid (BCFA), phenol, indole, ammonia, and lactate concentrations. Fecal scores were recorded based on the following scale: 1 = hard, dry pellets, small hard mass; 2 = hard, formed, dry stool, remains firm and soft; 3 = soft, formed, and moist stool, retains shape; 4 = soft, unformed stool, assumes the shape of container; and 5 = watery, liquid that can be poured.
Fecal pH was measured immediately using an AP10 pH meter (Denver Instrument, Bohemia, NY) with a Beckman Electrode (Beckman Instruments Inc., Fullerton, CA). After pH was measured, an aliquot was collected for DM determination in accordance to the Association of Official Analytical Chemists (AOAC) [32] using a 105°C oven. Two aliquots for phenol and indole measurement were frozen at -20°C until analysis. An aliquot collected for SCFA, BCFA, and ammonia analyses was diluted in a 1:1 ratio (w/v) of feces: 2 N HCl and frozen at −20°C until analysis. Other aliquots were collected into sterile cryogenic vials (Corning Inc., Corning, NY), immediately frozen in dry ice, and stored at −80°C until analysis for microbiota and BA.
Frozen fecal and serum samples were shipped on dry ice to the Texas A&M University Gastrointestinal Laboratory where they underwent further analysis.
2.2.1. Serum Uremic Toxin Analysis
A liquid chromatography–tandem mass spectrometry (LC–MS/MS) assay was developed for measurement of serum uremic toxins based on previously published methods with modifications [33]. The assay was analytically validated for use in dog and cat serum according to the FDA guidelines for bioanalytical method validation. Excess serum samples from dogs and cats submitted for routine diagnostic evaluation were used for the purposes of validation. Standard and internal standard stock solutions were prepared at 1 mg/mL methanol and stored at −20°C. A working solution of internal standards (312.5 ng/mL acetonitrile; 13C6- indoxyl sulfate and d7-p-cresol sulfate) was prepared fresh from stocks and stored at 4°C. Calibration curves consisted of 16 concentrations (1.22–40,000 ng/mL) and were prepared fresh by dilution of stocks into water.
Serum was extracted via the addition of 200 µL internal standard working solution to 100 µL serum. Samples were vortexed briefly and centrifuges at 16,000 x g for 5 minutes at 4°C. Samples were then diluted 1:1 in a new tube by the addition of 200 µL of 0.1% formic acid in water to 200 µL supernatant. Samples were then transferred to glass autosampler vial inserts and 5 µL injected for analysis.
The LC–MS/MS instrument consisted of an Infinity II Multisampler (maintained at 6°C) and a 1260 binary pump coupled to a 6470B triple quadrupole mass spectrometer with a jet stream electrospray ion source (Agilent Technologies, Santa Clara, CA).
Mobile phase A was 0.1% formic acid in water and mobile phase B was 0.1% formic acid in acetonitrile. The flow was set to 0.4 mL/min and column temperature was maintained at 40°C. The analytical column was an Agilent InifinityLab Poroshell 120 Phenyl Hexyl 2.1 x 100 mm, 2.7 µm column. The mobile phase gradient started with 10% B and ramped to 32.5 % B from 0 to 3 minutes. The column was washed of high retaining compounds with 99% B from 3.1 to 4.7 minutes, and then re-equilibrated with 10% B from 4.8 to 6.2 minutes. The multiwash parameters and injection sequence added approximately 1 minute to the run time leading to an approximate time of 7.2 minutes from injection to injection. Only a portion of the sample (from 1 to 3 minutes) was sent to the MS with the remainder diverted to waste.
The analytes were measured in negative mode with dynamic multiple reaction monitoring. Precursor and product ions and fragment voltage and collision energies for each analyte are listed in Supplemental File S1. The drying gas temperature was set to 250°C and flow at 9 L/min. The nebulizer was set to 40 psi and sheath gas temperature and flow to 350°C and 11 L/min, respectively. Capillary and nozzle voltages were 4,000 and 1,500 V. Data was processed in MassHunter Quant Analysis Software v.10.0 (Agilent Technologies, Santa Clara, CA).
2.2.2. Fecal SCFA, BCFA, Ammonia, Phenol, and Indole Analyses
Samples used for SCFA and BCFA analysis were determined by gas chromatography according to Erwin et al. [34] using a gas chromatograph (Hewlett-Packard 5890A series II, Palo Alto, CA) coupled to a flame ionization detector. The gas chromatograph was fitted with a glass column (180 cm x 4 mm i.d.) packed with 10% SP-1200/1% H3PO4 on 80/100+ mesh Chromosorb WAW (Supelco Inc., Bellefonte, PA). Nitrogen was the carrier gas with a flow rate of 75 mL/min. Oven, detector, and injector temperatures were 125, 175, and 180°C, respectively. Fecal ammonia concentrations were determined according to the method of Chaney and Marbach [35]. Fecal phenol (phenol, 4-methylphenol, 4-ethylphenol) and indole (indole, 7-methylindole, 3-methylindole, 2,3-dimethylindole) concentrations were determined using gas chromatography according to the methods described by Flickinger et al. [36].
2.2.3. Fecal Lactate Analysis
The fecal D-, L-, and total lactate concentrations were measured by utilizing the protocol described by Blake et al. [18]. Briefly, an aliquot of 120–130 mg feces was mixed with 750 μL of 0.1 M triethanolamine buffer (pH 9.15) and thoroughly vortexed. The mixture was then centrifuged at 13,000 × g for 5 minutes at 4°C. Following this, 495 μL of the supernatant was deproteinized with 10 μL of 6 M trichloroacetic acid, vortexed again, and kept on ice for 20 minutes. The sample was further centrifuged at 4,500 × g for 20 minutes at 4°C. Subsequently, 400 μL of the supernatant was diluted with 1,600 μL of 0.1 M triethanolamine buffer (pH 9.15) to neutralize the pH (adjusted between 7 and 10). The processed fecal extract was then analyzed using a D-/L-Lactate Enzymatic Kit (R-Biopharm Inc., Darmstadt, Germany) in a 96-well plate format, following a modified version of the manufacturer’s protocol.
2.2.4. Fecal and Serum BA Analyses
Bie acids were measured using an in-house validated LC-MS/MS method. Briefly, an aliquot of 100 mg feces was extracted with the addition of 300 µL methanol and 40 µL internal standard working solution (d4-glycocholic acid and d4-glycolithocholic acid). Samples were placed on a bead beater for 2 minutes and then centrifuged at 16,000 x g for 10 minutes at 4°C. Supernatant was transferred to a new tube and centrifuged again at 10,000 x g for 5 minutes at 4°C. Supernatant was then transferred to an autosampler vial and 3 µL injected onto an LC-MS/MS. A diluted sample was also injected after combining 5 µL of the supernatant and 295 µL methanol. Concentrations were calculated from the diluted sample for high concentration BA and from the undiluted sample for low concentration BA.
Serum BA analysis was performed with a modified sample preparation protocol that was developed and cross validated for this study. Briefly, 200 µL serum was combined with 560 µL methanol and 40 µL internal standard mixture in methanol (d4-glycocholic acid and d4-glycolithocholic acid) vortexed and centrifuged at 16,000 x g for 10 minutes at 4°C. Supernatant was transferred to a glass tube and dried under a continuous stream of nitrogen on a heating block set to 65°C for approximately 20 minutes or until dry. Samples were reconstituted in 75 µL methanol, transferred to autosampler vials and 5 µL injected.
2.2.5. Quantitative Polymerase Chain Reaction (qPCR) and Dysbiosis Index (DI) Analysis
qPCR analysis of select bacterial taxa was performed with specific primers targeting Bacteroides, Blautia, Bifidobacterium, P. hiranonis, Escherichia coli, Faecalibacterium, Fusobacterium, Streptococcus, Turicibacter, and universal bacteria as described in Sung et al. [5]. Briefly, the conditions for qPCR were as follows: initial denaturation at 98°C for 2 minutes, then 35 cycles with denaturation at 98°C for 3 seconds, and annealing for 3 seconds. Melt curve analysis was performed to validate the specific generation of the qPCR product using these conditions: 60°C to 90°C with an increase of 0.5°C for 5 seconds. Each reaction was run in duplicate. The qPCR data were expressed as the log amount of DNA (fg) for each bacterial group per 10 ng of isolated total DNA as reported previously [37,38]. The degree of dysbiosis is represented as a single numerical value that measures the closeness of a taxa compared to the mean abundances derived from healthy and diseased populations and is calculated by a Euclidean distance model, as detailed in Sung et al. [5]. Using this DI system, a score less than zero is considered healthy and “normal”, while any score greater than 1 denotes dysbiosis. A DI of 0–1 represents an equivocal outcome.
2.3. Statistical Analysis
Data were analyzed using GraphPad Prism 10.4 (GraphPad Software Inc., San Diego, CA) and are displayed in figures. If normality standard under the Gaussian distribution or Shapiro-Wilk test statistic were met, the repeated measures one-way ANOVA model was used to compare time points. All means were compared to day 0 with significance denoted as the following: (*: P<0.05; **: P<0.01; ***: P<0.001; ****: P<0.0001). If data did not meet normality assumptions, the Freidman test was utilized. Simple linear regression was performed to assess the relationship between Bifidobacterium or pH and fecal D-, L-, and total lactate, with 95% confidence intervals shown. Statistical significance was set at P<0.05 and trends were reported if P<0.10.
3. Results
3.1. Fecal Characteristics
Metronidazole significantly altered fecal scores and DM percentages (P<0.001; Figure 1). An increase in the fecal scores (looser stools) was observed following antibiotic administration (day 14) and continued to be increased one week post-metronidazole administration (day 21). However, fecal scores decreased and were not significantly different from baseline after two weeks of recovery, although some individual cats still had increased fecal scores at day 42 of the study. Fecal DM percentage, which is attributed to moisture content in the sample, agreed with the observed differences in fecal scores. After antibiotic administration (day 14), fecal DM was reduced (P<0.0001) and continued to have significantly higher moisture in the feces two weeks post-metronidazole administration (day 28; P<0.05). Fecal pH tended to differ over time, with lower measures immediately following metronidazole (P=0.0853).
3.2. Fecal SCFA, Phenol, Indole, BCFA and Ammonia Concentrations
Effects of metronidazole administration on fecal SCFA concentrations are presented in Figure 2. Fecal acetate concentrations tended to increase (P=0.0897), fecal propionate and butyrate concentrations decreased (P<0.0001), and fecal total SCFA concentrations tended to decrease (P=0.0846) following antibiotic administration. Fecal propionate concentrations did not recover to initial concentrations for the duration of the study (day 42). Fecal butyrate concentrations were lower up to 7 days following cessation (day 21) but did return to initial concentrations by day 28.
Fecal phenol, indole, BCFA, and ammonia concentrations are presented in Supplementary Figures S2 and S3. Fecal phenol concentrations were not affected by metronidazole; however, indole (P=0.0006) and total phenol and indole (P<0.0001) concentrations were reduced with antibiotics, returning to baseline measures by 7 days post-metronidazole. Total BCFA concentrations were reduced (P<0.05) following metronidazole and recovered quickly following cessation, with isovalerate and valerate recovering by day 28. Fecal isobutyrate concentrations tended to increase (P=0.0606) after metronidazole cessation. Ammonia concentrations were not affected by metronidazole but were higher (P<0.05) than baseline on days 28, 35 and 42.
Fecal SCFA molar ratios are reported in Figure 3. Acetate had the highest molar ratio, followed by propionate, and then butyrate. Compared to day 0, the acetate molar ratio was highest after metronidazole (day 14). Propionate and butyrate molar ratios followed inverse patterns, with propionate and butyrate ratios being lowest after metronidazole administration (day 14) and increasing during recovery.
3.3. Fecal Lactate Concentrations
Metronidazole increased (P<0.001) the concentrations of fecal lactate and is presented in Figure 4. D-lactate concentrations increased immediately after metronidazole and remained elevated until day 21 (P<0.01). Similarly, L-lactate remained increased (P<0.0001) until day 21 but was not different from day 0 for the remainder of the recovery period. Total lactate concentrations increased but returned to baseline concentrations after day 21.
Correlation analysis was performed to assess relationships of Bifidobacterium to both lactate isoforms and total lactate concentrations and is presented in Supplementary Figure S4. Positive correlations were observed between Bifidobacterium and D-lactate (P<0.0001; r2=0.4004) as well as L-lactate (P<0.0001; r2=0.3863). Additionally, total lactate was positively correlated with Bifidobacterium abundance (P<0.0001; r2=0.4043). Further correlation analysis was performed to compare pH measures to total lactate concentrations and is presented in Supplementary Figure S5. Weak negative correlations were observed between pH and lactate concentrations (P<0.05) for D-lactate (r2=0.1035), L-lactate (r2=0.0923), and total lactate (r2=0.0992).
3.4. Fecal BA concentrations
Metronidazole administration drastically altered fecal BA concentrations, affecting the conversion of primary BA to secondary BA as well as total BA concentrations (Figure 5; Supplementary Figures S6–S10; Supplementary Table S1). At baseline collections, concentrations of total primary BA (sum of conjugated and unconjugated forms of cholic acid and chenodeoxycholic acid) were lowest; however, after metronidazole administration, these concentrations increased (P<0.0001) and remained elevated until day 28 (P<0.05). Concentrations were not different after day 28 but were variable among individual cats. Fecal total secondary BA concentrations (sum of conjugated and unconjugated forms of deoxycholic acid and lithocholic acid) were reduced as a result of metronidazole administration. With the exception of two animals, cats had minimal secondary BA concentrations and were unable to return to baseline measures by the end of the study. Lastly, fecal total BA concentrations followed similar patterns as primary BA, with a reduction (P<0.01) and inability to recover after 28 days post-metronidazole. Individual fecal BA concentrations are presented in Supplementary Figures S6–S10.
Fecal unconjugated secondary BA (DCA and LCA) as a percentage of total unconjugated BA (DCA, LCA, CA, and CDCA) are presented in Supplementary Figure S11. At baseline, the fecal BA pool was predominantly unconjugated secondary BA, DCA and LCA. Immediately following metronidazole administration, the proportion of unconjugated BA that were secondary BA drastically decreased in conjunction with the rise of CA and CDCA concentrations. While there was no statistical difference by day 35, only two cats recovered the proportion of secondary BA to pre-antibiotic ranges.
3.5. Fecal DI and Bacterial Abundance
DI was increased (P<0.0001) following the administration of metronidazole, with the highest values being on day 14, with continued elevations remaining throughout the study (Figure 6). At baseline, 3 of the 12 cats had DI values suggesting mild dysbiosis; however, antibiotics increased DI values in all cats and remained high for several days. Despite the 28-day antibiotic cessation, several cats remained dysbiotic (10 of 12 cats) until the end of the study.
Of the 9 fecal bacterial taxa that are components of the DI calculation, five demonstrated various recovery patterns and abundances when evaluated against reference intervals (Figure 6). Fecal Bifidobacterium abundance increased following metronidazole administration (day 14; P<0.0001) and remained elevated through day 35. Metronidazole administration (day 14) reduced (P<0.01) the abundance of fecal P. hiranonis, with 10 of 12 cats being affected after four-weeks (day 42) post-metronidazole. One cat maintained P. hiranonis abundance within the reference interval for the duration of the study, with a second cat spontaneously recovering P. hiranonis abundance 21 days after cessation of metronidazole.
Fecal E. coli abundance was increased (P<0.0001) following metronidazole administration, with increased abundances at days 14 and 21 (P<0.0001). Fecal E. coli abundance returned to baseline levels for the remaining time points. All cats immediately following metronidazole (day 14) had above-reference abundances, with prolonged elevation observed in 50% (6/12) of cats after one-week (day 21) and 16.7% (2/12) of cats after one-month (day 42) post-metronidazole.
Fecal Faecalibacterium abundance was reduced (P<0.0001) following metronidazole administration (day 14) and remained low through day 21 (P<0.01), with 8 of 12 cats being below the reference interval. However, fecal Faecalibacterium abundance recovered in all cats by day 35.
Fecal Streptococcus abundance decreased following metronidazole administration (day 14; P<0.001) but quickly returned to baseline levels. The remaining bacterial taxa measured (Bacteroides, Blautia, Fusobacterium, and Turicibacter) are presented in Supplementary Figure S12. While a few differences (P<0.05) were observed, all of these taxa remained within established reference intervals throughout the study.
3.6. Serum Metabolites
3.6.1. Serum uremic toxin concentrations
The assay for measurement of IS and PCS in canine and feline serum was shown to be accurate and precise (CV% < 12%), sensitive, selective, stable, free of matrix effect, and not affected by lipemia in canine samples. Results of analytical validation are presented in Supplemental File S1. The working range of the assay was 1–40,000 ng/mL.
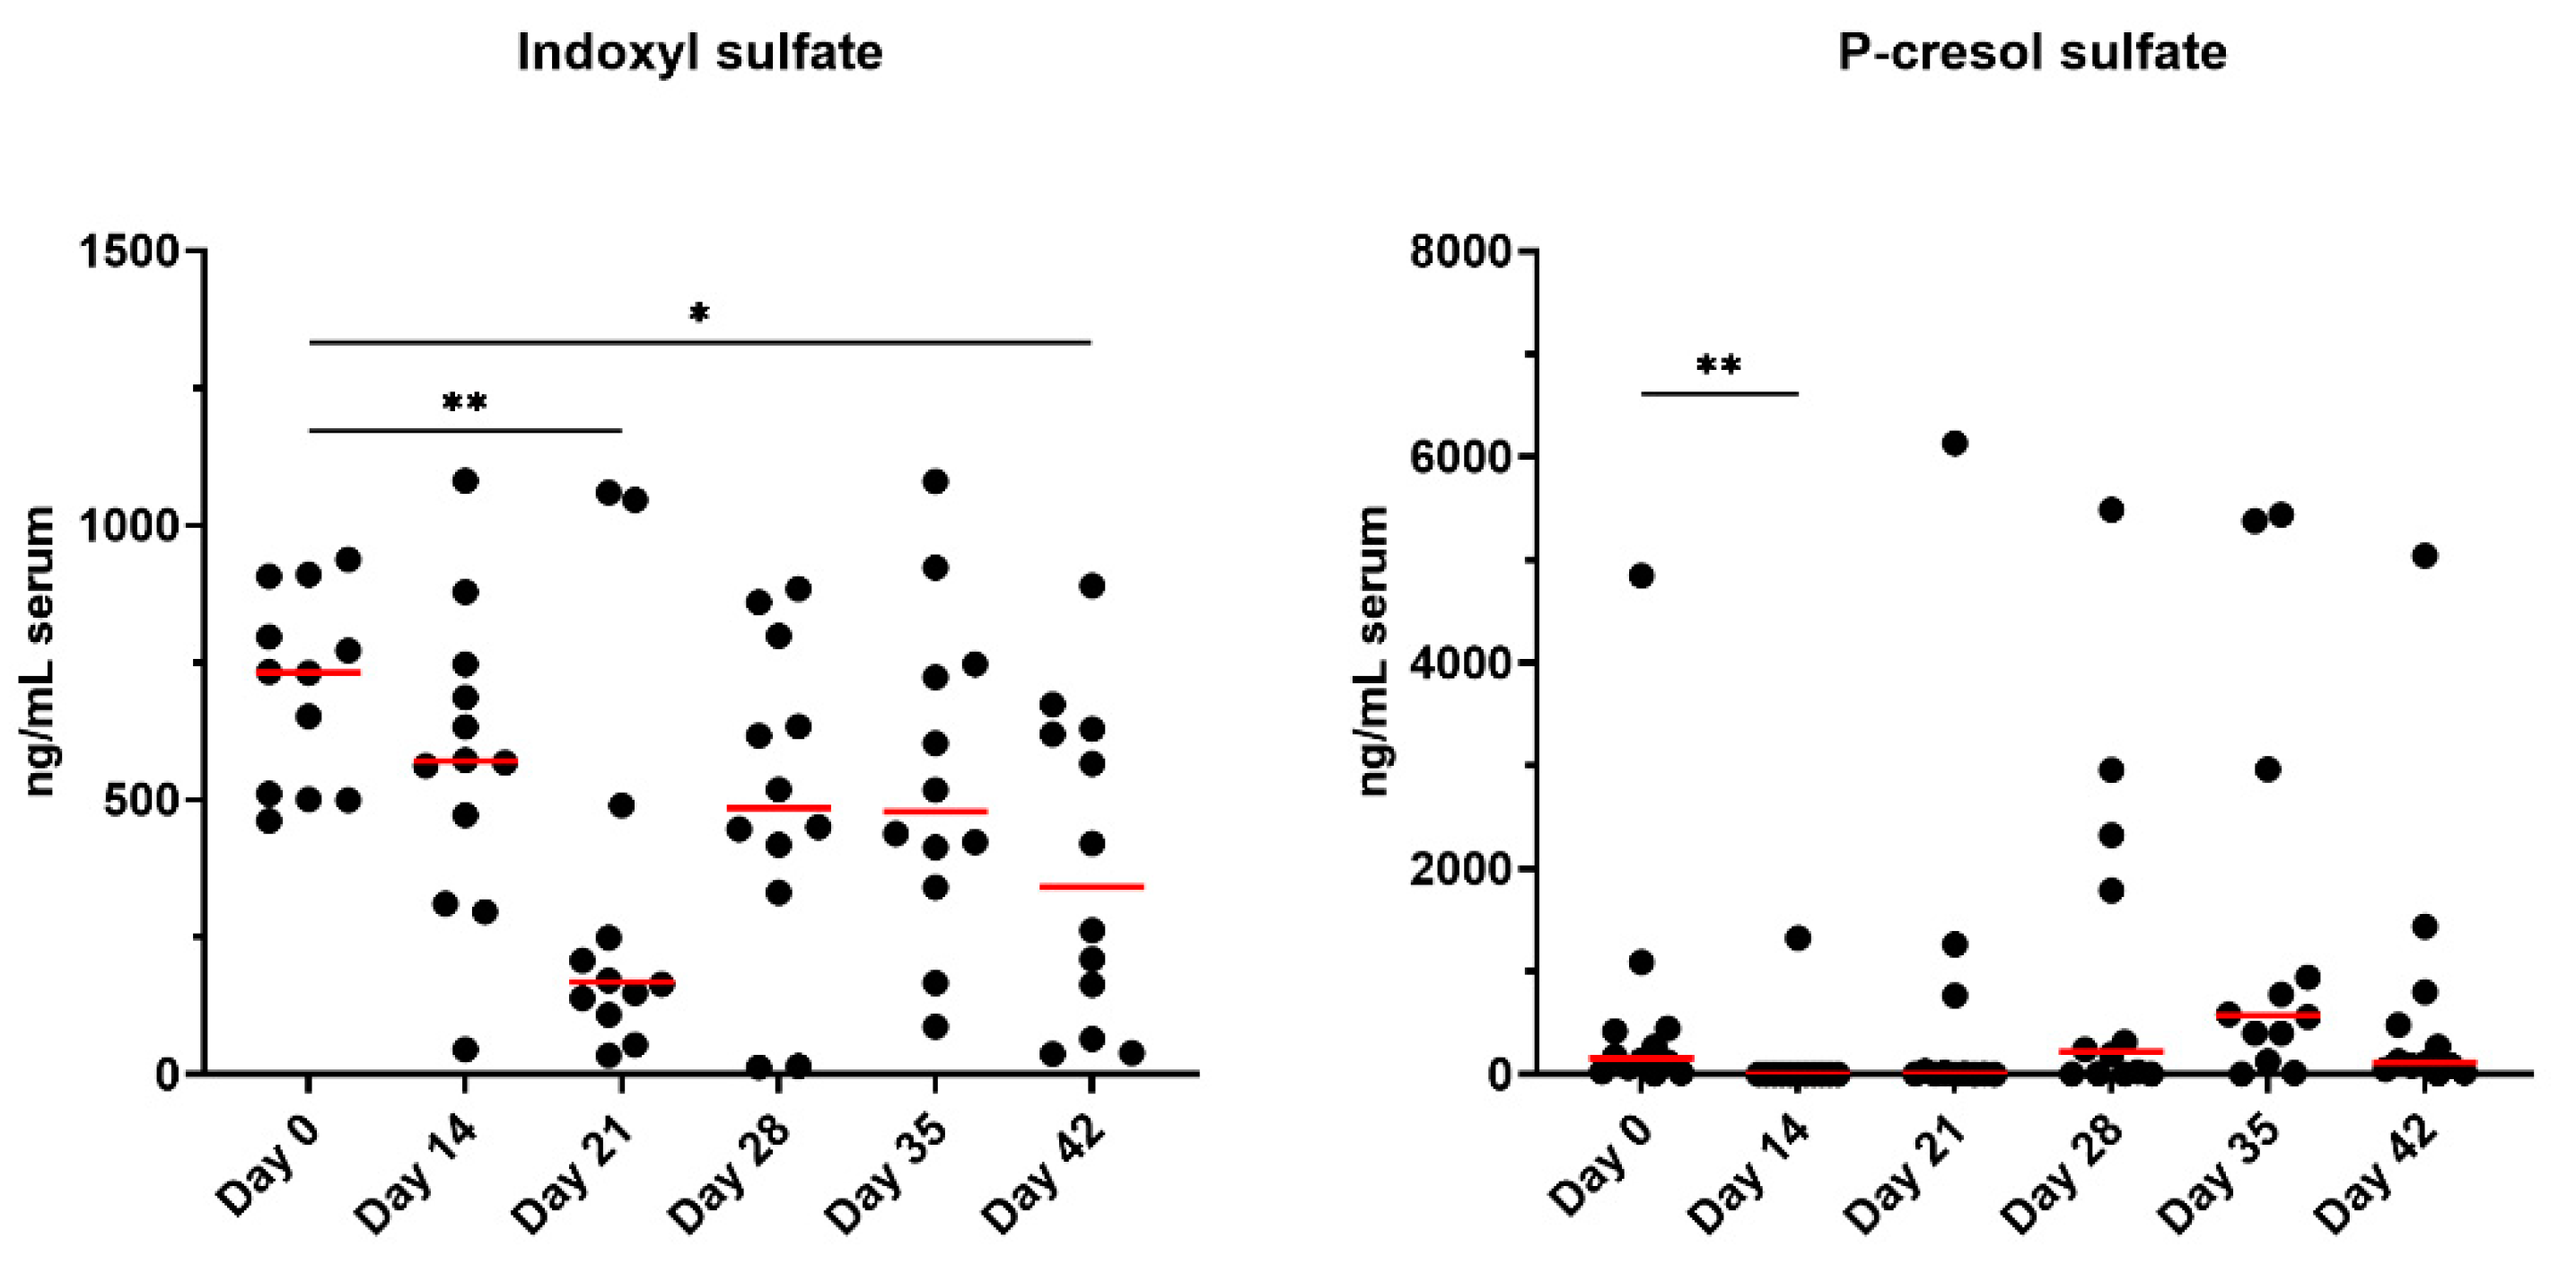
Concentrations of serum uremic toxins, IS and PCS, are presented in Figure 7. Serum IS concentrations were lower at day 21 (P<0.01) and day 42 (P<0.05) than at baseline. Serum PS concentrations were reduced after metronidazole administration (P<0.01) but were not different from baseline for all other timepoints.
3.6.2. Serum BA Concentrations
Results of cross validation of canine and feline serum BA assay are presented in Supplemental File S2. Serum unconjugated secondary BA percentages are presented in Supplementary Figure S13. Similar to patterns observed in fecal BA percentages, the fecal BA pool was composed of predominantly secondary BA at baseline. Following metronidazole administration, unconjugated primary BA increased (P<0.0001) and therefore the proportion of secondary BA as a percent of the unconjugated BA pool decreased (P<0.0001). This BA shift remained through day 35. By day 42, unconjugated BA percentages were not significantly different from baseline but were still lower than starting values in 11 out of 12 cats. Specific serum unconjugated and conjugated BA concentrations are presented in Supplementary Figures S14–S18. Supplementary Figure S19 includes highlights featuring one individual cat (Cat 1 = green) who retained normal DI and BA conversion, that also had normal serum secondary BA concentrations, likely attributed to the sustained P. hiranonis abundance.
4. Discussion
The objective of this study was to evaluate the effects of metronidazole administration on the fecal microbiota, fecal metabolites, and serum BA and uremic toxins of healthy adult cats. Metronidazole was administered at a dose similar to what is prescribed in an outpatient setting for cats with giardia. Metronidazole caused dysbiosis and significantly impacted stool quality, moisture content, and metabolite concentrations. Metronidazole induced prolonged dysbiosis and disrupted microbial metabolism in the majority of animals, even when monitored up to 28 days following cessation.
Diarrhea is not a commonly reported side effect of metronidazole administration in cats but the usage of antibiotics has previously been reported to loosen stools of animals undergoing treatment [21,22,23], and metronidazole is commonly prescribed to treat acute diarrhea in cats. In the current study, stools were loosened during and 7 days after metronidazole administration. Additionally, 50% (6/12) of cats had persistent looser stools and less than ideal fecal scores (≥3.5) by the end of the study. Fecal scores varied greatly by animal, demonstrating highly individualized responses. Concurrently, fecal DM percentages were reduced (higher stool moisture) and fecal pH was numerically lower, indicating physiological changes induced in the GI tract. The GI tract environment (i.e., oxygen concentrations, pH measurements) varies and can influence the presence and abundance of microbes present. An alteration in pH stability may influence bacterial growth of pH-sensitive bacteria (e.g., low pH inhibits growth of Streptococcus and Veillonella) or cause metabolic disruption and production of SCFA [39]. Additionally, lactic acid bacteria thrive in more acidic conditions and may explain the sustained increase observed in Bifidobacterium abundances in the present study. While Bifidobacterium remained within the reference interval for the entirety of the study, it is known to increase following metronidazole treatment and in a chronic GI disease state, thereby potentiating overgrowth of other lactic acid bacteria (i.e., Lactobacillus, Streptococcus) [18,22,27]. The pH of a fecal sample may provide insight into microbial activity (i.e., fermentation, BA transformations) and has been shown to reduce in cats treated with metronidazole [22]; however, fecal pH does not represent the full microbial activity occurring in more proximal areas of the GI and can be a limitation for interpretation.
Metronidazole altered the overall microbiota composition, including an increased DI and changes to several bacterial taxa. Increased DI is commonly reported following antibiotic treatment and in cases of chronic GI diseases [5,20,23,24,25,40]. Changes in microbial profiles may be initiated or altered by several factors (i.e., diet change, environmental stressors, medications) but the extent of these changes differs, with antibiotics and chronic intestinal disease typically leading to more severe dysbiosis. Continued dysbiosis was observed in 83% (10/12) of cats in the current study. Following metronidazole administration, the bacterial community failed to return to baseline composition and may be potentially a risk factor for long-term health consequences [41]. The present study did not permit continued sampling further than 4 weeks to monitor follow-up of these animals and is considered to be a limitation to this research. Based on the results presented here, antibiotic-treated cats should be monitored for a longer time period in future studies.
The SCFA producers, Blautia, Faecalibacterium, and Turicibacter, were reduced after metronidazole administration [1,27,42]. Reductions were not observed beyond a two-week recovery period. Several cats fell below the reference range for Faecalibacterium immediately after metronidazole (10/12) and one-week post-cessation (8/12). These bacterial taxa are important for host health, as they utilize any undigested food products from the host, producing SCFA that can serve as an energy source for the host colonocytes as well as reducing luminal pH to discourage pathogenic bacterial growth and increasing intestinal barrier integrity by stimulating goblet cells, increasing tight junction proteins and antimicrobial peptide expression [43,44,45]. However, luminal pH was not measured in the present study. Total SCFA concentrations tended to be reduced, and propionate and butyrate concentrations were reduced with metronidazole, demonstrating an impairment in the fermentation pattern, consistent with a previous in vitro fermentation study evaluating fiber fermentation patterns in dogs treated with metronidazole [46]. When evaluated as ratios, there were higher concentrations of acetate (90.4%) compared to propionate (7.4%) and butyrate (2.2%), immediately following metronidazole. Only with time did these ratios improve as fermentation capability was restored with microbial recovery (i.e., Faecalibacterium, Blautia, Bacteroides), ending with 64.5% (acetate), 22.6% (propionate), and 12.7% (butyrate) ratios. As a potential treatment plan in cases of CE, dietary intervention by inclusion of functional ingredients, such as dietary fiber, may aid in microbial recovery and restoration of SCFA production.
While the major byproducts of carbohydrate fermentation (i.e., SCFA) were measured, lactate is another byproduct produced by anaerobic bacteria but is produced in lower levels in comparison. In cases of over-production or rapid fermentation, lactate can lower the pH and sustain the growth of other lactic acid bacteria (i.e., Bifidobacterium), as previously mentioned [18,27]. Some species of bacteria are able to metabolize lactate and can be present as one of two isomers (L-lactate or D-lactate). The D-isomer is considered to be a neurotoxin in high and sustained concentrations if it enters into systemic circulation [47]. Concentrations in the present study were not sustained beyond day 21 but strong correlations were associated with D-lactate and Bifidobacterium abundances. E. coli and Streptococcus are associated with overgrowth in dysbiosis, and known to increase after antibiotic treatment [14,22,48]. Furthermore, E. coli is known as a potentially pro-inflammatory pathobiont. Interestingly, Streptococcus in the present study demonstrated the opposite effect and decreased after metronidazole administration, but recovered after metronidazole was ceased. While it was not explored in the present study, this result was not anticipated.
Bacteroides, Bifidobacterium, and Peptacetobacter (Clostridium) genera are among the many commensal bacteria with the ability to deconjugate BA via a bile salt hydrolase enzyme as the first step to allow for further secondary BA production and therefore, are paramount in microbial metabolism [49,50,51]. Data previously reported in mammals after using broad-spectrum antibiotics (metronidazole, vancomycin) demonstrated an increase in conjugated BA, likely attributed to the reduction of the commensal bacteria with hydrolase activity [52]. In the present study, the majority of the secondary BA were present in unconjugated forms in the serum samples following metronidazole and remained consistent for the study duration. The 7α-dehydroxylation process converts primary BA CA and CDCA into their secondary BA forms DCA and LCA, respectively. P. hiranonis is the main species capable of performing this transformation in dogs and cats via 7α-dehydroxylation enzymes produced by the bai gene [26]. This species was largely absent in several cats during recovery and only achieved normal abundances in 16% (2/12) of cats by the end of the recovery period. Despite all cats falling within the established reference interval at day 0, this taxa failed to recover in the majority of cats. The abundance of secondary BA was significantly reduced with metronidazole, further demonstrating the vital role of P. hiranonis in BA biotransformation.
In this study, only two cats had normal P. hiranonis and BA conversion at the end of the recovery period. Highlighted in Supplementary Figure S19, Cat 1 (green) appeared to be fully resistant to metronidazole administration as this individual retained P. hiranonis and normal BA conversions for the entire study period, and Cat 2 (red) showed recovery after three weeks at day 35. Serum BA in Cat 1 also were the highest compared to others immediately following metronidazole. All remaining cats were unable to recover to initial measures, demonstrating persistent effects of metronidazole. Additionally, Cat 1 had the lowest concentrations of lactate for all time points, except at baseline, and remained largely unaffected compared to others, as the DI remained normal, indicating less severe shifts in the overall microbiome composition. This could suggest that individual strains of P. hiranonis may be resistant to metronidazole effects.
Initially studied in humans, intestinal dysbiosis in patients with chronic kidney disease was associated with increased production of uremic toxins and was recently reported to be similar in cats [29,53]. PS was not reported to be different but increased IS was observed in cats with advancing kidney disease and muscle atrophy [29,53]. In the present study, both uremic toxins were reduced with metronidazole; however, only PS was immediately influenced by metronidazole and IS reductions were not observed until day 21 and day 42. While the animals used in this study were clinically healthy, the impairment of uremic toxin production demonstrates that metronidazole has more systemic effects beyond microbial alterations than typically reported.
There are a couple of limitations to address in the present study. First, the animals used were clinically healthy and had no reported history of antibiotics. While it is beneficial to understand the effects of metronidazole in healthy animals, patterns observed in clinically diseased animals may be different, thereby limiting the application of this data to chronic disease and microbial alterations. Second, the time allotted for monitoring may have been too short to observe a complete recovery of parameters, including DI, P. hiranonis, and BA metabolism. By the end of the study, these measures had not fully recovered and longer duration studies are needed to ascertain how much time is needed to achieve recovery without medical intervention (i.e., fecal microbial transplants). Future studies addressing these limitations would likely provide additional insight into further recommendations regarding metronidazole administration.
5. Conclusions
In summary, metronidazole is a powerful antibiotic inducing several negative side effects and potentially leading to prolonged dysbiosis and dysmetabolism of the microbiome and metabolome in healthy adult cats. Measures collected from fecal and serum samples have allowed for a further understanding of the relationship between the host metabolism and microbiome, shedding light into how these interactions may influence the host health. From this research, we concluded that the usage of metronidazole should strongly be considered prior to administration as it may lead to long-term health consequences, especially when prescribed at a high dosage (20 mg/kg body weight).
Supplementary Materials
The following supporting information can be downloaded at the website of this paper posted on Preprints.org. The following supporting information is available for download: Supplemental File S1 (uremic toxin validation report); Supplemental File S2 (cross validation of canine and feline serum BA assay); Supplementary File S3 (Supplementary Figures S1–S19; Supplementary Tables S1 and S2).
Author Contributions
Conceptualization, S.E.M. and K.S.S.; methodology, A.B.B., K.S.S.; formal analysis, S.E.M.; investigation, S.E.M.; resources, J.S.S., and K.S.S.; data curation, S.E.M. and A.B.B.; writing—original draft preparation, S.E.M.; writing—review and editing, S.E.M., T.S., W.H., A.B.B., J.C., J.S.S., and K.S.S.; visualization, S.E.M. and T.S.; supervision, J.S.S., and K.S.S. All authors have read and agreed to the published version of the manuscript.
Funding
The microbiome research was supported in part by the Purina PetCare Research Excellence Fund at The Gastrointestinal Laboratory at Texas A&M University.
Institutional Review Board Statement
The animal study protocol was approved by the Institutional Review Board of University of Illinois Institutional Animal Care and Use Committee (protocol #22028; date of approval: 03/04/2022).
Informed Consent Statement
Not applicable.
Data Availability Statement
All data is available at reasonable request to authors.
Acknowledgments
Sincere gratitude is expressed for the additional help with animal handling and sample collections provided by undergraduate and graduate students in the University of Illinois Urbana-Champaign Comparative Nutrition and Nutrigenomics lab. Additional gratitude is given to the Texas A&M University Gastrointestinal Laboratory for their insight and technical contributions to this research.
Conflicts of Interest
TS ,WH, ABB, JC, and JSS are employees of the Gastrointestinal Laboratory at Texas A&M which provides assays for intestinal function and microbiota analysis on a fee-for-service basis. Remaining authors declare no conflicts of interest.
Abbreviations
The following abbreviations are used in this manuscript:
| GI | Gastrointestinal |
| CE | Chronic enteropathies |
| BA | Bile acids |
| SCFA | Short-chain fatty acids |
| IS | Indoxyl sulfate |
| PCS | P-cresol sulfate |
| qPCR | Quantitative polymerase reaction |
| DM | Dry matter |
| BCFA | Branched-chain fatty acids |
| DI | Dysbiosis index |
References
- Guard, B.C.; Barr, J.W.; Lavanya, R.; Klemashevich, C.; Jayaraman, A.; Steiner, J.M.; Vanamala, J.; Suchodolski, J.S. Characterization of microbial dysbiosis and metabolomics changes in dogs with acute diarrhea. PLoS ONE 2015, 10, e0127259. [CrossRef]
- Shade, A.; Peter, H.; Allison, S.D.; Baho, D.L.; Berga, M.; Bürgmann, H.; Huber, D.H.; Langenheder, S.; Lennon, J.T.; Martiny, J.B.H.; Matulich, K.L.; Schmidt, T.M.; Handelsman, J. Fundamentals of microbial community resistance and resilience. Front Microbiol 2012, 3, 417. [CrossRef]
- Marsilio, S.; Pilla, R.; Sarawichitr, B.; Chow, B.; Hill, S.L.; Ackermann, M.R.; Estep, J.S.; Lidbury, J.A.; Steiner, J.M.; Suchodolski, J.S. Characterization of the fecal microbiome in cats with inflammatory bowel disease or alimentary small cell lymphoma. Nature 2019, 9, 19208. [CrossRef]
- Humphreys, C. Textbook of Natural Medicine, 5th ed.; Churchill Livingstone: London, United Kingdom, 2020; pp.166-177. [CrossRef]
- Sung C.-H.; Marsilio, S.; Chow, B.; Zornow, K.A.; Slovak, J.E.; Pilla, R.; Lidbury, J.A.; Steiner, J.M.; Park, S.Y.; Hong, M.-P.; Hill, S.L.; Suchodolski. J.S. A dysbiosis index to evaluate healthy cats and cats with chronic enteropathies. J Feline Med Surg 2022, 24, e1-e12. [CrossRef]
- Dandrieux, J.R.S.; Mansfield, C.S. Chronic Enteropathy in Canines: Prevalence, Impact and Management Strategies. Vet Med 2019, 10, 203-214. [CrossRef]
- Makielski, K.; Cullen, J.; O’Connor, A.; Jergens, A.E. Narrative review of therapies for chronic enteropathies in dogs and cats. J Vet Intern Med 2019, 33, 11-22.
- Allenspach, K.; Mochel, J.P. Current diagnostics for chronic enteropathies in dogs. Vet Clin Pathol 2022, 50, 18-28. [CrossRef]
- Holmes, A.H.; Moore, L.S.P.; Sundsfjord, A.; Steinbakk, M.; Regmi, S.; Karkey, A.; Guerin, P.J.; Piddock, L.J.V. Understanding the mechanisms and drivers of antimicrobial resistance. Lancet 2016, 387, 176-187. [CrossRef]
- Antimicrobial Resistance Collaborators. Global burden of bacterial antimicrobial resistance in 2019: a systematic analysis. Lancet 2022, 399, 629-655. [CrossRef]
- Suchodolski J.S.; Camacho, J.; Steiner, J.M. Analysis of bacterial diversity in the canine duodenum, jejunum, ileum, and colon by comparative 16S rRNA gene analysis. FEMS Microbiol Ecol 2009, 66, 567-578. [CrossRef]
- Tauro, A.; Beltran, E.; Cherubini, G.B.; Coelho, A.T.; Wessmann, A.; Driver, C.J.; Rusbridge, C.J. Metronidazole-induced neurotoxicity in 26 dogs. Aust Vet J 2018, 96,495-501. [CrossRef]
- Manchester A.C.; Webb, C.B.; Blake, A.B.; Sarwar, F.; Lidbury, J.A.; Steiner, J.M.; Suchodolski, J.S. Long-term impact of tylosin on fecal microbiota and fecal bile acids of healthy dogs. J Vet Intern Med 2019, 33, 2605-2617. [CrossRef]
- Pilla, R.; Gaschen, F.P.; Barr, J.W.; Olson, E.; Honneffer, J.; Guard, G.C.; Blake, A.B.; Villanueva, D.; Khattab, M.R.; AlShawaqfeh, M.K.; Lidbury, J.A.; Steiner, J.M.; Suchodolski, J.S. Effects of metronidazole on the fecal microbiome and metabolome in healthy dogs. J Vet Intern Med 2020, 34, 1853-1866. [CrossRef]
- Whittemore, J.C.; Stokes, J.E.; Laia, N.L.; Price, J.M.; Suchodolski, J.S. Short and long-term effects of a synbiotic on clinical signs, the fecal microbiome, and metabolomic profiles in healthy research cats receiving clindamycin: A randomized, controlled trial. PeerJ 2018, 6, e5130. [CrossRef]
- Bollig, E.R.; Granick, J.L.; Webb, T.L.; Ward, C.; Beaudoin, A.L. A quarterly survey of antibiotic prescribing in small animal and equine practices—Minnesota and North Dakota, 2020. Zoonoses Public Health 2022, 69, 864–874. [CrossRef]
- Beaudoin, A.L.; Bollig, E.R.; Burgess, B.A.; Cohn, L.A.; Cole, S.D.; Dear, J.D.; Fellman, C.L.; Frey, E.; Goggs, R.; Johnson, A.; Kreuder, A.J.; KuKanich, K.S.; LeCuyer, T.E.; Menard, J.; Reagan, K.L.; Sykes, J.E.; Veir, J.K.; Viviano, K.; Wayne, A.; Granick, J.L. Prevalence of antibiotic use for dogs and cats in United States veterinary teaching hospitals, August 2020. J Vet Intern Med 2023, 37, 1864-1875. [CrossRef]
- Blake, A.B.; Guard, B.C.; Honneffer, J.B.; Lidbury, J.A.; Steiner, J.M.; Suchodolski, J.S. Altered microbiota, fecal lactate, and fecal bile acids in dogs with gastrointestinal disease. PLoS One 2019, 14, e0224454. [CrossRef]
- Guard, B.C.; Honneffer, J.B.; Jergens, A.E.; Jonika, M.M.; Toresson, L.; Lawrence, Y.A.; Webb, C.B.; Hill, S.; Lidbury, J.A.; Steiner, J.M.; Suchodolski, J.S. Longitudinal assessment of microbial dysbiosis, fecal unconjugated bile acid concentrations, and disease activity in dogs with steroid-responsive chronic inflammatory enteropathy. J Vet Intern Med 2019, 33, 1295-1305.
- Chaitman, J.; Ziese, A.; Pilla, R.; Minamoto, Y.; Blake, A.B.; Guard, B.C.; Isaiah, A.; Lidbury, J.A.; Steiner, J.M.; Unterer, S.; Suchodolski, J.S. Fecal microbial and metabolic profiles in dogs receiving either fecal microbiota transplantation or oral metronidazole. Front Vet Sci 2020, 7, 192. [CrossRef]
- Belchik, S.E.; Oba, P.M.; Wyss, R.; Asare, P.T.; Vidal, S.; Miao, Y.; Adesokan, Y.; Suchodolski, J.S.; Swanson, K.S. Effects of a milk oligosaccharide biosimilar on fecal characteristics, microbiota, and bile acid, calprotectin, and immunoglobulin concentrations of healthy adult dogs treated with metronidazole. J Anim Sci 2023, 101, skad011. [CrossRef]
- Belchik, S.E.; Oba, P.M.; Lin, C.-Y.; Swanson, K.S. Effects of a veterinary gastrointestinal diet on fecal characteristics, metabolites, and microbiota concentrations of adult cats treated with metronidazole. J Anim Sci 2024, 102, skae274. [CrossRef]
- Belchik, S.E.; Oba, P.M.; Lin, C.-Y.; Swanson, K.S. Effects of a veterinary gastrointestinal low-fat diet on fecal characteristics, metabolites, and microbiota concentrations of adult dogs treated with metronidazole. J Anim Sci 2024, 102, skae297. [CrossRef]
- Giaretta, P.R.; Rech, R.R.; Guard, B.C.; Blake, A.B.; Blick, A.K.; Steiner, J.M.; Lidbury, J.A.; Cook, A.K.; Hanifeh, M.; Spillmann, T.; Kilpinen, S.; Syrjä, P.; Suchodolski, J.S. Comparison of intestinal expression of the apical sodium-dependent bile acid transporter between dogs with and without chronic inflammatory enteropathy. J Vet Intern Med 2018, 32, 1918-1926. [CrossRef]
- Sung, C.-H.; Pilla, R.; Marsilio, S.; Chow, B.; Zornow, K.A.; Slovak, J.E.; Lidbury, J.A.; Steiner, J.M.; Hill, S.L.; Suchodolski, J.S. Fecal Concentrations of Long-Chain Fatty Acids, Sterols, and Unconjugated Bile Acids in Cats with Chronic Enteropathy. Animals 2023, 13, 2753. [CrossRef]
- Correa Lopes, B.; Chen, C.-C.; Sung, C.-H.; Ishii, P.E.; Medina, L.F.D.C.; Gaschen, F.P.; Suchodolski, J.S.; Pilla, R. Correlation between Peptacetobacter hiranonis, the baiCD Gene, and Secondary Bile Acids in Dogs. Animals 2024, 14, 216. [CrossRef]
- Pilla, R.; Suchodolski, J.S. The role of the canine gut microbiome and metabolome in health and gastrointestinal disease. Front Vet Sci 2020, 6, 498. [CrossRef]
- Félix, A.P.; Souza, C.M.M.; Gisele de Oliveira, S. Biomarkers of gastrointestinal functionality in dogs: A systematic review and meta-analysis. Anim Feed Sci Technol 2022, 283, 115183. [CrossRef]
- Summers, S.C.; Quimby, J.M.; Isaiah, A.; Suchodolski, J.S.; Lunghofer, P.L.; Gustafson, D.L. The fecal microbiome and serum concentrations of indoxyl sulfate and p-cresol sulfate in cats with chronic kidney disease. J Vet Intern Med 2018, 33, 662-669. [CrossRef]
- Association of American Feed Control Officials (AAFCO). Official Publication 2022; Association of American Feed Control Officials: Oxford, IN, USA, 2022.
- Laflamme, D.P. Development and validation of a body condition score system for dogs: a clinical tool. Canine Pract 1997, 22, 10-15.
- Association of Official Analytical Chemists (AOAC). Official methods of analysis, 17th ed.; Gaithersburg, MD, USA, 2006.
- Lin, C.-N.; Wu, I-W.; Huang, Y.-F.; Peng, S.-Y.; Huang, Y.-C.; Ning, H.-C. Measuring serum total and free indoxyl sulfate and p-cresyl sulfate in chronic kidney disease using UPLC-MS/MS. J Food Drug Anal 2019, 27:502-509. [CrossRef]
- Erwin, E.S.; Marco, G.J.; Emery, E.M. Volatile fatty acid analyses of blood and rumen fluid by gas chromatography. J Dairy Sci 1961, 44, 1768-1771. [CrossRef]
- Chaney, A. L.; Marbach, E.P. Modified reagents for determination of urea and ammonia. Clin Chem 1962, 8:130–132. [CrossRef]
- Flickinger, E.A.; Schreijen, E.; Patil, A.R.; Hussein, H.S.; Grieshop, C.M.; Merchen, N.R.; Fahey Jr, G.C. Nutrient digestibilities, microbial populations, and protein catabolites as affected by fructan supplementation of dog diets. J Anim Sci 2003, 81:2008–2018. [CrossRef]
- Suchodolski, J.S.; Markel, M.E.; Garcia-Mazcorro, J.F.; Unterer, S.; Heilmann, R.M.; Dowd, S.E.; Kachroo, P.; Ivanov, I.; Minamoto, Y.; Dillman, E.M.; Steiner, J.M.; Cook, A.K.; Torreson, L. The fecal microbiome in dogs with acute diarrhea and idiopathic inflammatory bowel disease. PLoS ONE 2012, 7, e51907. [CrossRef]
- Panasevich, M.R.; Kerr, K.R.; Dilger, R.N.; Fahey Jr, G.C.; Guérin-Deremaux, L.; Lynch, G.L.; Wils, D.; Suchodolski, J.S.; Steiner, J.M.; Dowd, S.E.; Swanson, K.S. Modulation of the faecal microbiome of healthy adult dogs by inclusion of potato fibre in the diet. Brit J Nutr 2015, 113, 125–133. [CrossRef]
- Ilhan, Z.E.; Marcus, A.K.; Kang, D.-W.; Rittmann, B.E.; Krajmalnik-Brown, R. pH-Mediated Microbial and Metabolic Interactions in Fecal Enrichment Cultures. mSphere 2017, 2, e00047-17. [CrossRef]
- AlShawaqfeh, M.K.; Wajid, B.; Minamoto, Y.; Markel, M.; Lidbury, J.A.; Steiner, J.M.; Serpedin, E.; Suchodolski, J.S. A dysbiosis index to assess microbial changes in fecal samples of dogs with chronic inflammatory enteropathy. FEMS Microbiol Ecol 2017, 93, fix136. [CrossRef]
- Silverman, M.A.; Konnikova, L.; Gerber, J.S. Impact of antibiotics on necrotizing enterocolitis and antibiotic-associated diarrhea. Gastroenterol Clin North Am 2017, 46, 61-76. [CrossRef]
- Vourakis, M.; Mayer, G.; Rousseau, G. The role of gut microbiota on cholesterol metabolism in atherosclerosis. Int J Mol Sci 2021, 22, 80774. [CrossRef]
- Donohue, D.R.; Garge, N.; Zhang, X.; O’Connell, T.M.; Bunger, M.K.; Bultman, S.J. The microbiome and butyrate regulate energy metabolism and autophagy in the mammalian colon. Cell 2011, 13, 517-526. [CrossRef]
- Rivière, A.; Selak, M.; Lantin, D.; Leroy, F.; De Vuyst, L. Bifidobacteria and butyrate-producing colon bacteria: Importance and strategies for their stimulation in the human gut. Front Microbiol 2016, 7, 979. [CrossRef]
- Parada Venegas, D.; De la Fuente, M.K.; Lanskron, G.; González, M.J.; Quera, R.; Dijkstra, G.; Harmsen, H.J.M.; Faber, K.N.; Hermoso, M.A. Short chain fatty acids (SCFAs)-mediated gut epithelial and immune regulation and its relevance for inflammatory bowel diseases. Front Immunol 2019, 10, 277. [CrossRef]
- Belchik, S.E.; Oba, P.M.; Geary, E.L.; Bauer, L.; Dilger, R.N.; Swanson, K.S. 292 In vitro fermentation characteristics of dietary fibers using fecal inocula from dogs treated with metronidazole. J Anim Sci 2024, 102(Supp3), 112-113. [CrossRef]
- Louis, P.; Duncan, S.H.; Sheridan, P.O.; Walker, A.W.; Flint, H.J. Microbial lactate utilisation and the stability of the gut microbiome. Gut Microbiome (Camb) 2022, 3, e3. [CrossRef]
- Marclay, M.; Dwyer, E.; Suchodolski, J.S.; Lidbury, J.A.; Steiner, J.M.; Gaschen, F.P. Recovery of Fecal Microbiome and Bile Acids in Healthy Dogs after Tylosin Administration with and without Fecal Microbiota Transplantation. Vet Sci 2024, 9, 324. [CrossRef]
- Song, Z.; Cai, Y.; Lao, X.; Wang, X.; Lin, C.; Cui, Y.; Kalavagunta, P.K.; Liao, J.; Jin, L.; Shang, J.; Li, J. Taxonomic profiling and populational patterns of bacterial bile salt hydrolase (BSH) genes based on worldwide human gut microbiome. Microbiome 2019, 7, 9. [CrossRef]
- Cai, J.; Rimal, B.; Jiang, C.; Chiang, J.L.; Patterson, A.D. Bile acid metabolism and signaling, the microbiota, and metabolic disease. Pharmacol Ther 2022, 237, 108238. [CrossRef]
- Ridlon, J.M; Gaskins, H.R. Another renaissance for bile acid gastrointestinal microbiology. Nat Rev Gastroenterol Hepatol 2024, 21, 348-364. [CrossRef]
- Abt, M.C.; McKenney, P.T., Pamer, E.G. Clostridium difficile colitis: pathogenesis and host defence. Nat Rev Microbiol 2016, 14, 609-620. [CrossRef]
- Summers, S.; Quimby, J.M.; Phillips, R.K.; Stockman, J.; Isaiah, A.; Lidbury, J.A.; Steiner, J.M.; Suchodolski, J. Preliminary evaluation of fecal fatty acid concentrations in cats with chronic kidney disease and correlation with indoxyl sulfate and p-cresol sulfate. J Vet Intern Med 2019, 34, 206-215. [CrossRef]
Figure 1.
Fecal scores, DM percentages, and pH of fresh fecal samples collected from healthy adult cats before metronidazole (day 0), after metronidazole administration (day 14), and during recovery (day 15-42). The mean of each time point was compared to day 0, with red lines representing medians. Ideal fecal scores are considered to be between 2.5 and 3.0.
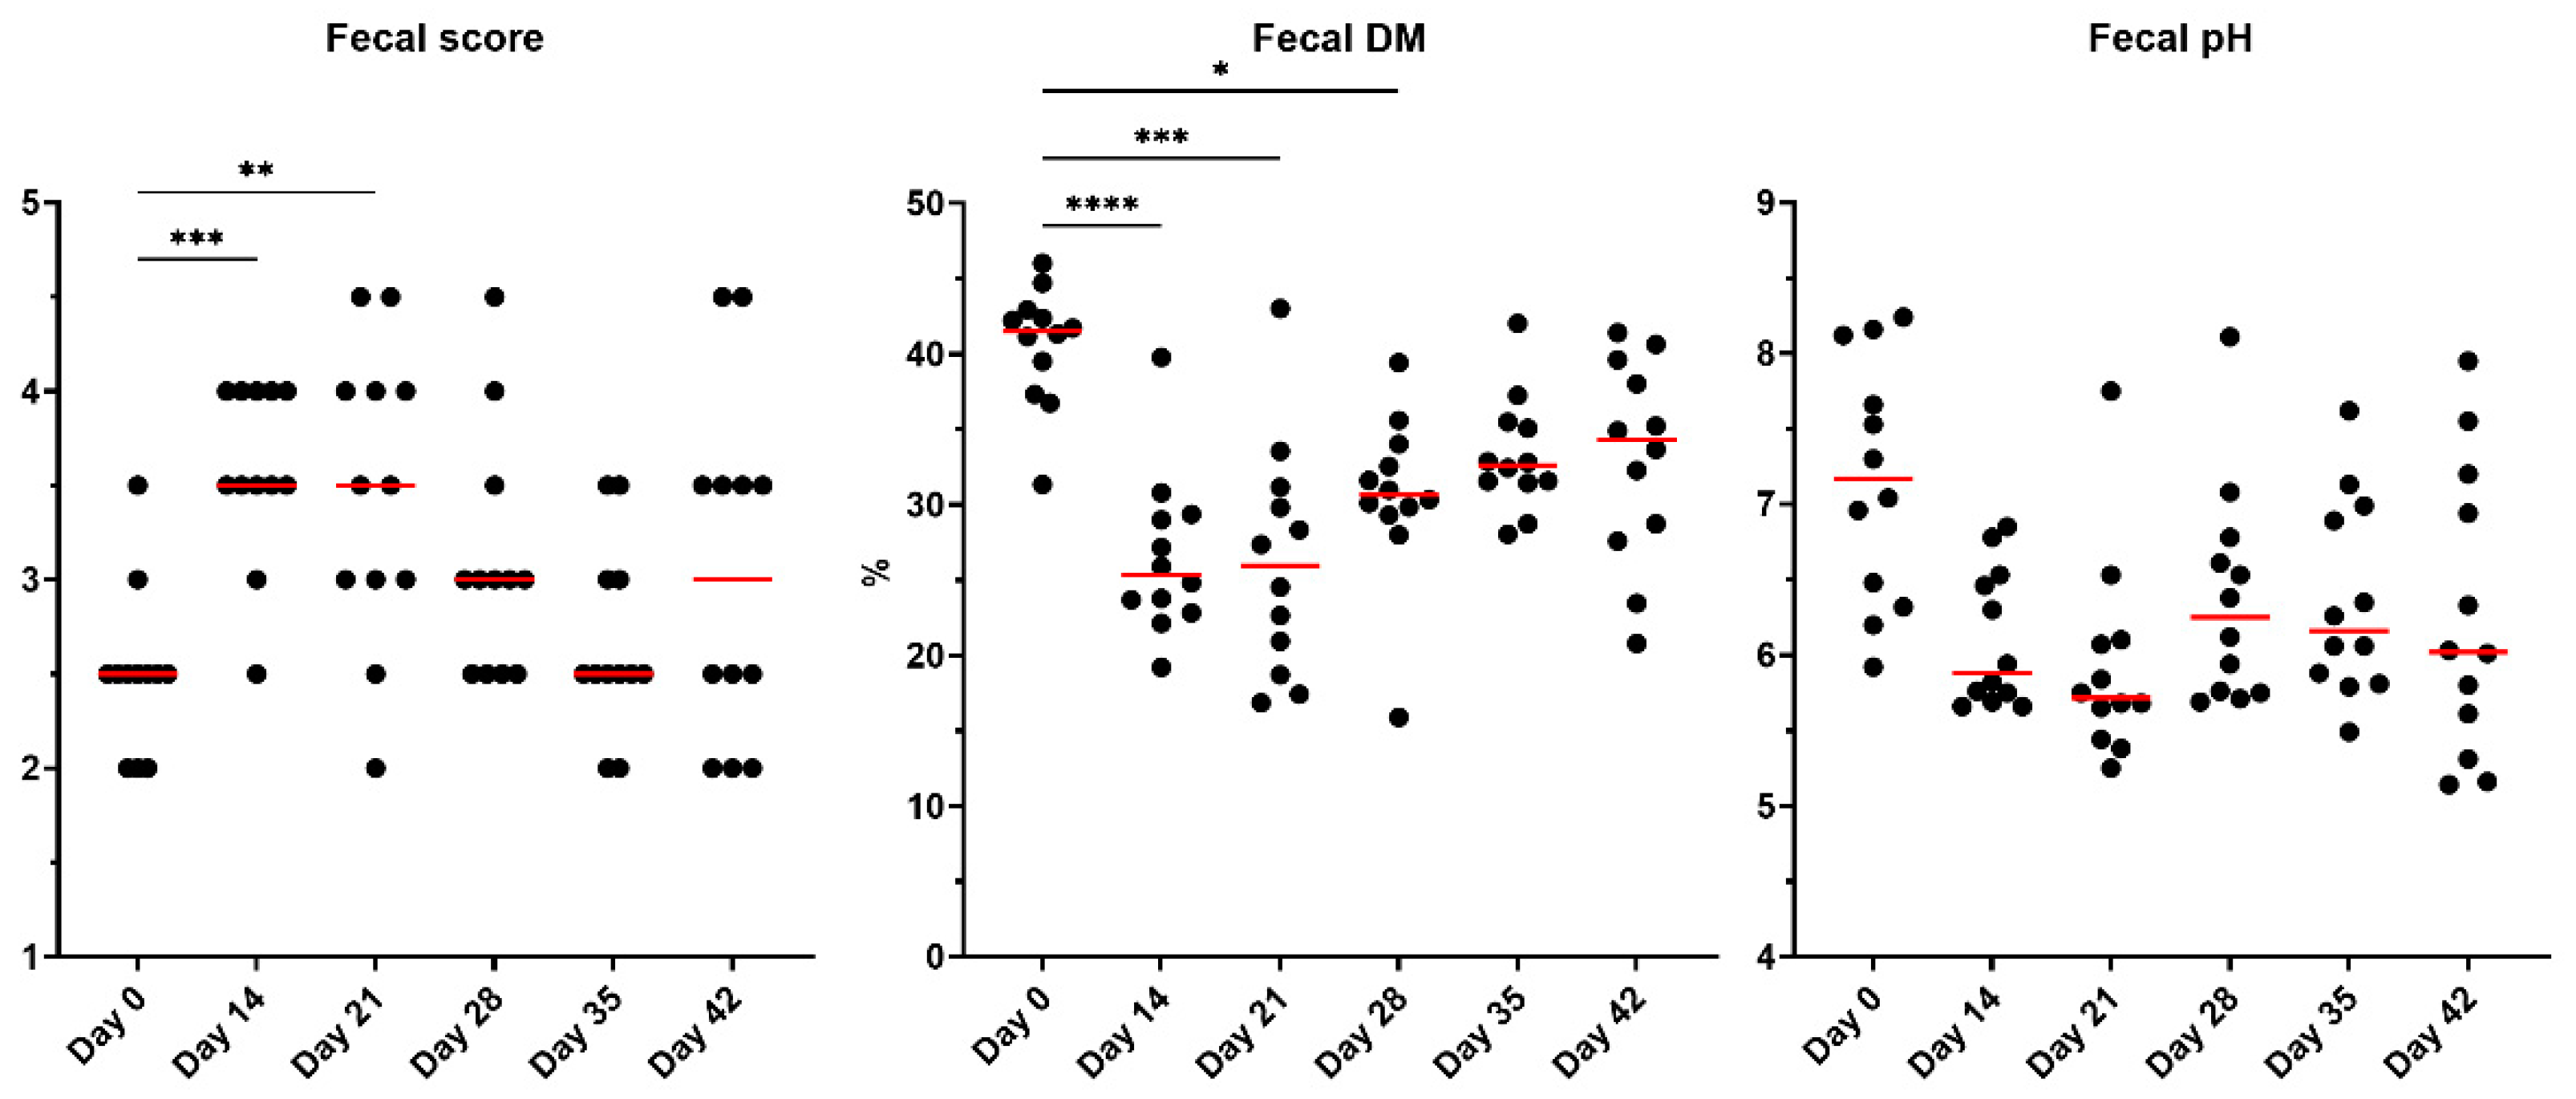
Figure 2.
Fecal SCFA concentrations of fresh fecal samples collected from healthy adult cats before metronidazole (day 0), after metronidazole administration (day 14), and during recovery (day 15-42). The mean of each time point was compared to day 0, with red lines representing medians.
Figure 2.
Fecal SCFA concentrations of fresh fecal samples collected from healthy adult cats before metronidazole (day 0), after metronidazole administration (day 14), and during recovery (day 15-42). The mean of each time point was compared to day 0, with red lines representing medians.
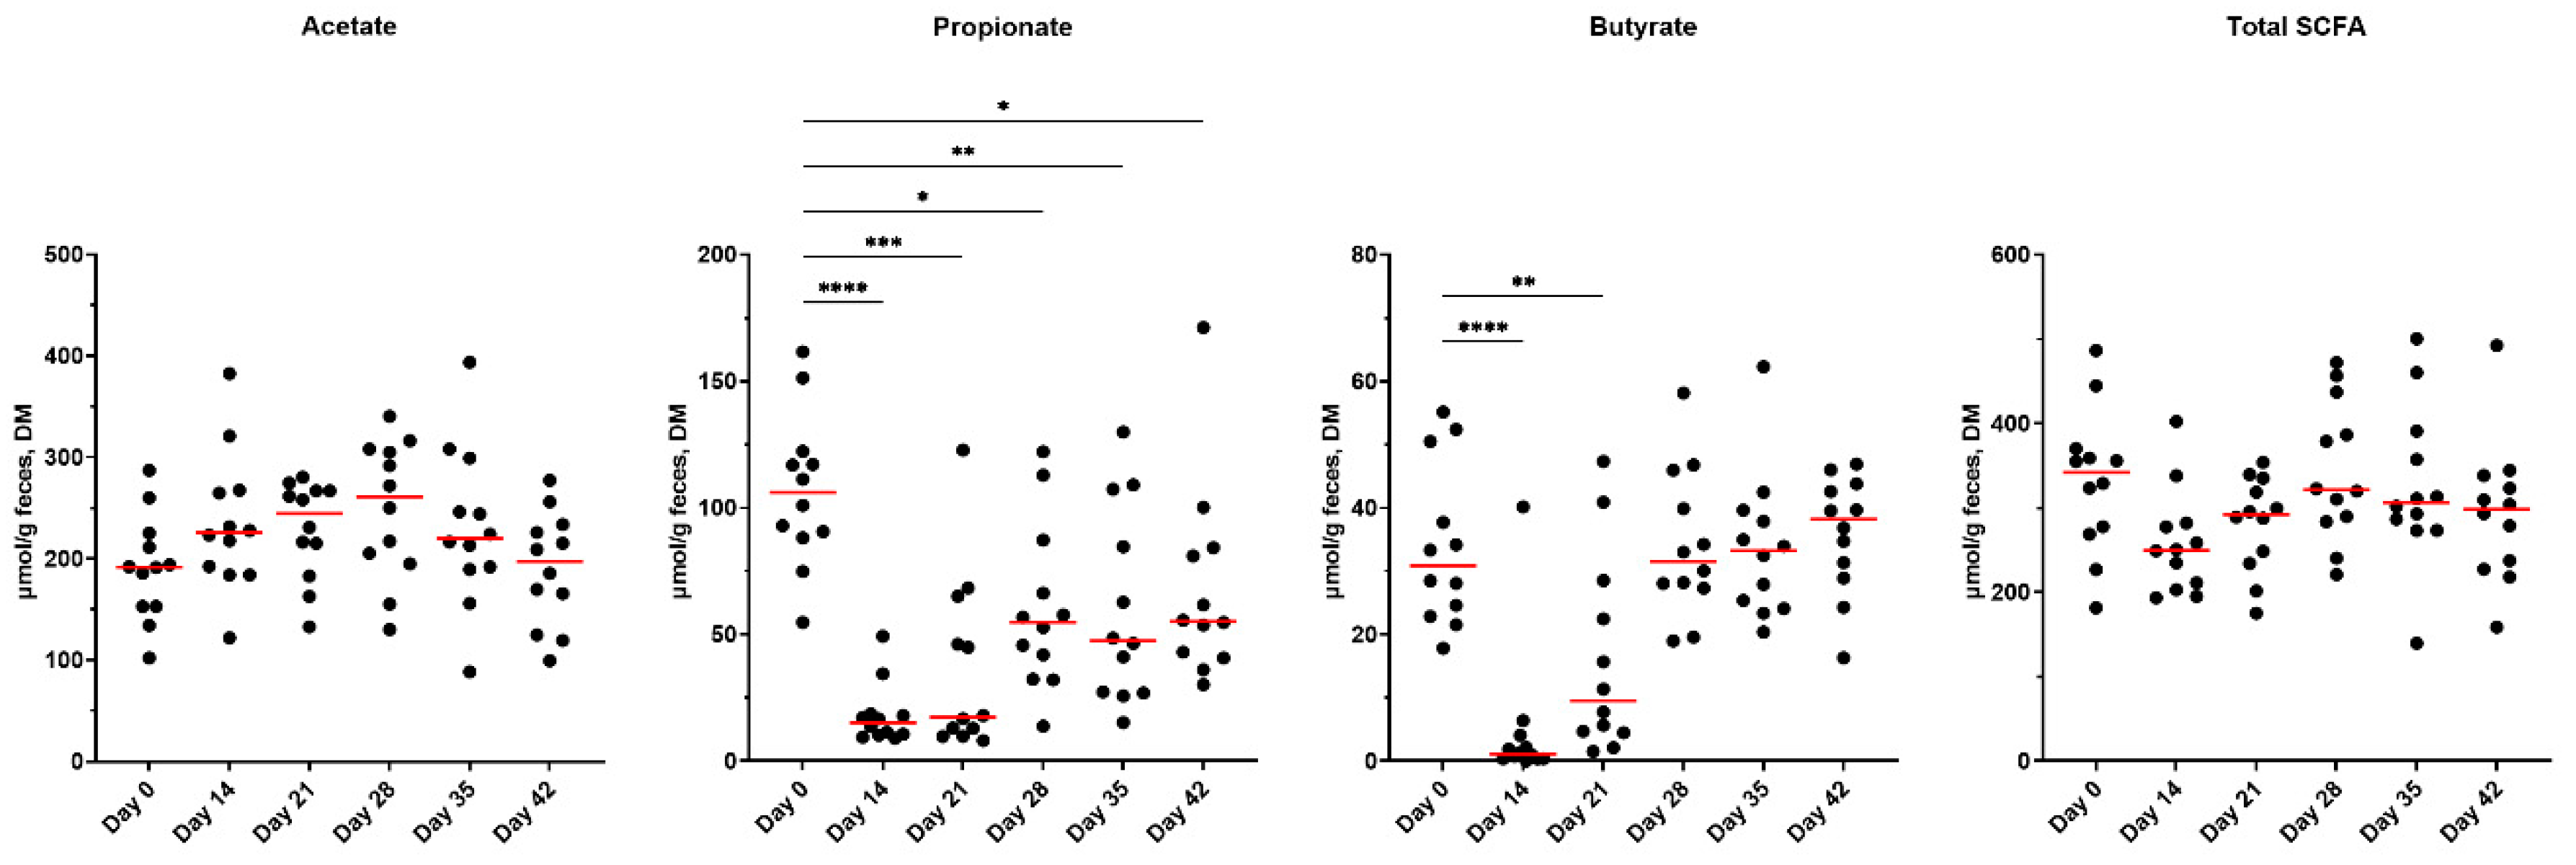
Figure 3.
Overall SCFA percentages presented in fresh fecal samples collected from healthy adult cats before metronidazole (day 0), after metronidazole administration (day 14), and during recovery (day 15-42). Ratios drastically varied across time points, with samples collected immediately after metronidazole having the highest acetate proportions (day 14), propionate was greatest prior to antibiotics, whereas butyrate proportions were highest at the end of the study.
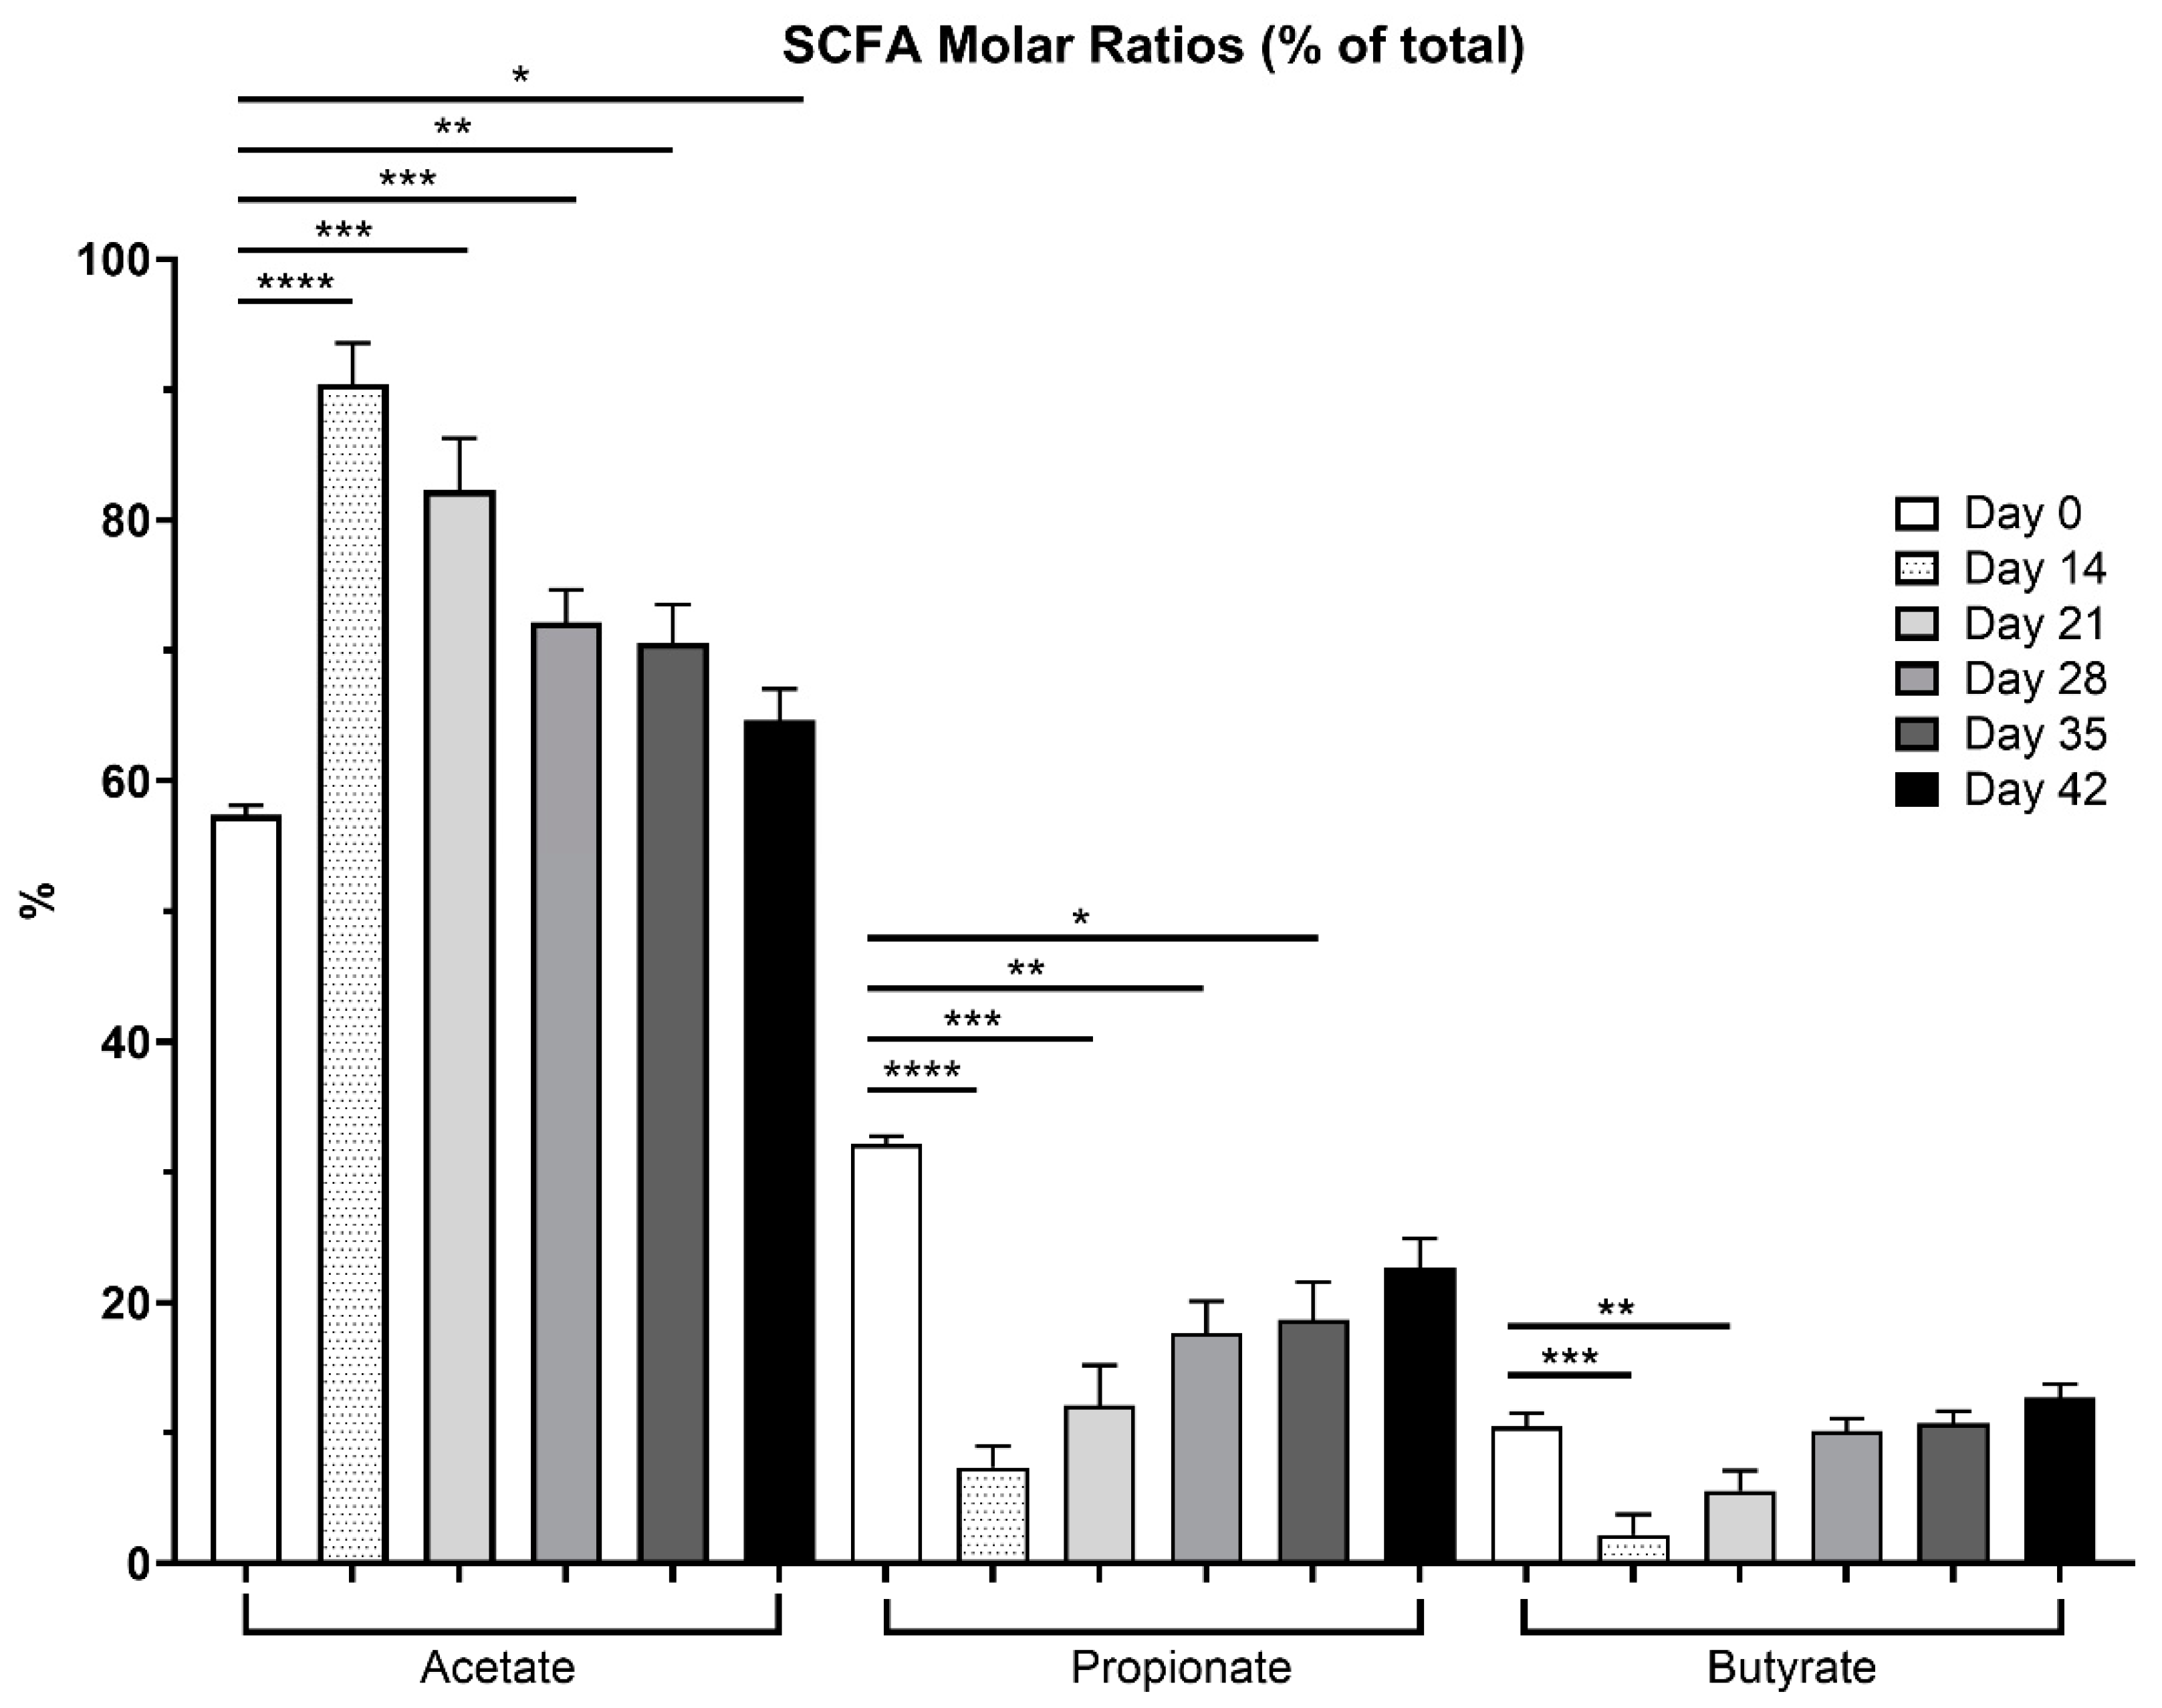
Figure 4.
Fecal lactate concentrations of fresh fecal samples collected from healthy adult cats before metronidazole (day 0), after metronidazole administration (day 14), and during recovery (day 15-42). The mean of each time point was compared to day 0, with red lines representing medians.
Figure 4.
Fecal lactate concentrations of fresh fecal samples collected from healthy adult cats before metronidazole (day 0), after metronidazole administration (day 14), and during recovery (day 15-42). The mean of each time point was compared to day 0, with red lines representing medians.
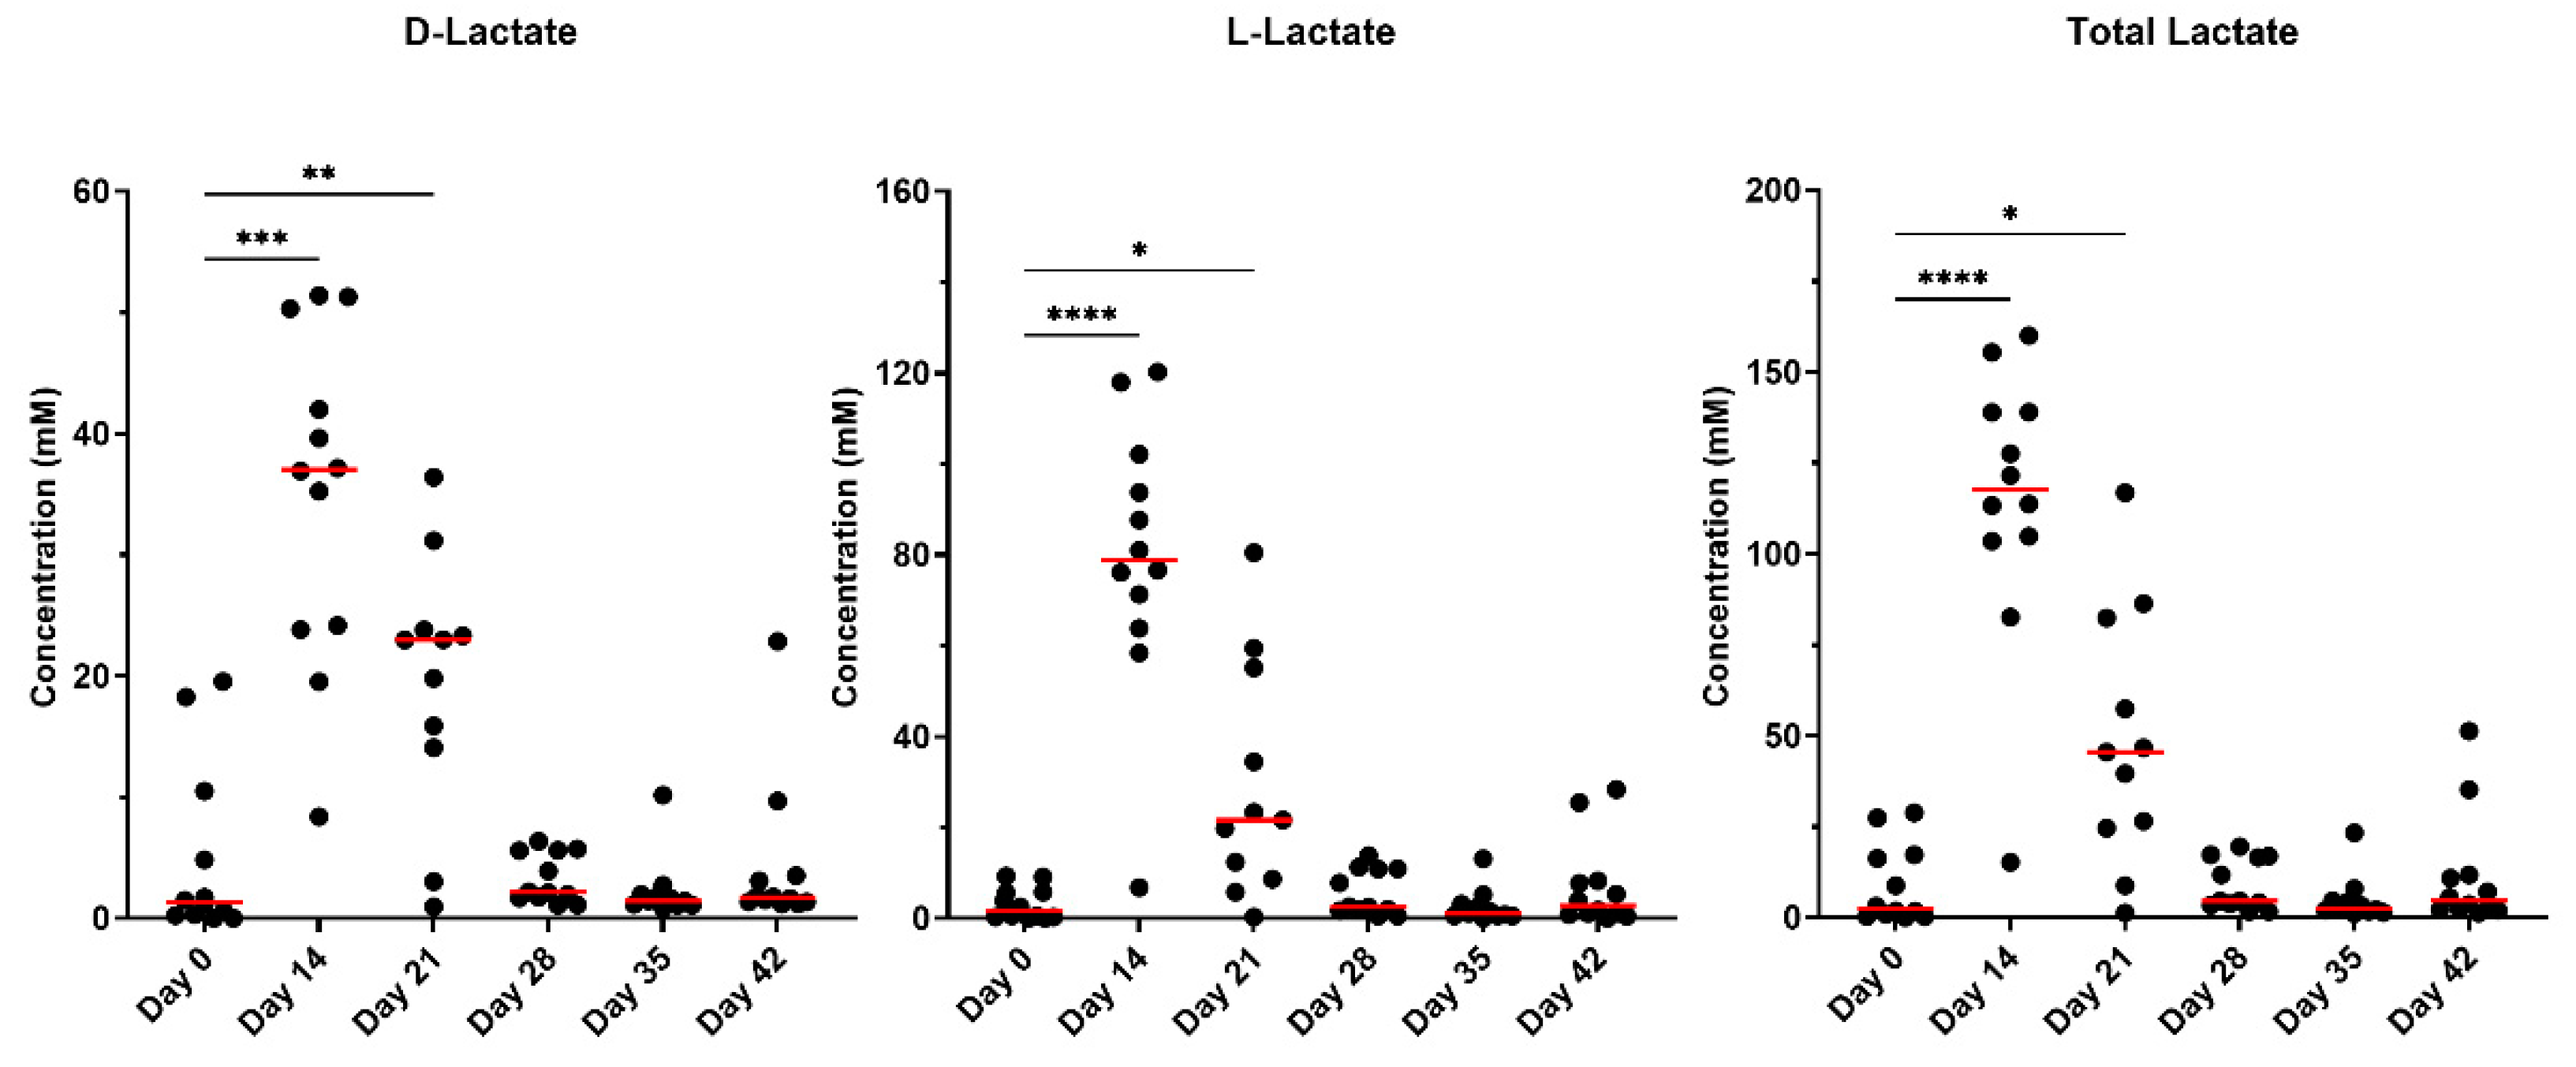
Figure 5.
Fecal BA concentrations (unconjugated and conjugated forms) of fresh fecal samples collected from healthy adult cats before metronidazole (day 0), after metronidazole administration (day 14), and during recovery (day 15-42). The mean of each time point was compared to day 0, with red lines representing medians.
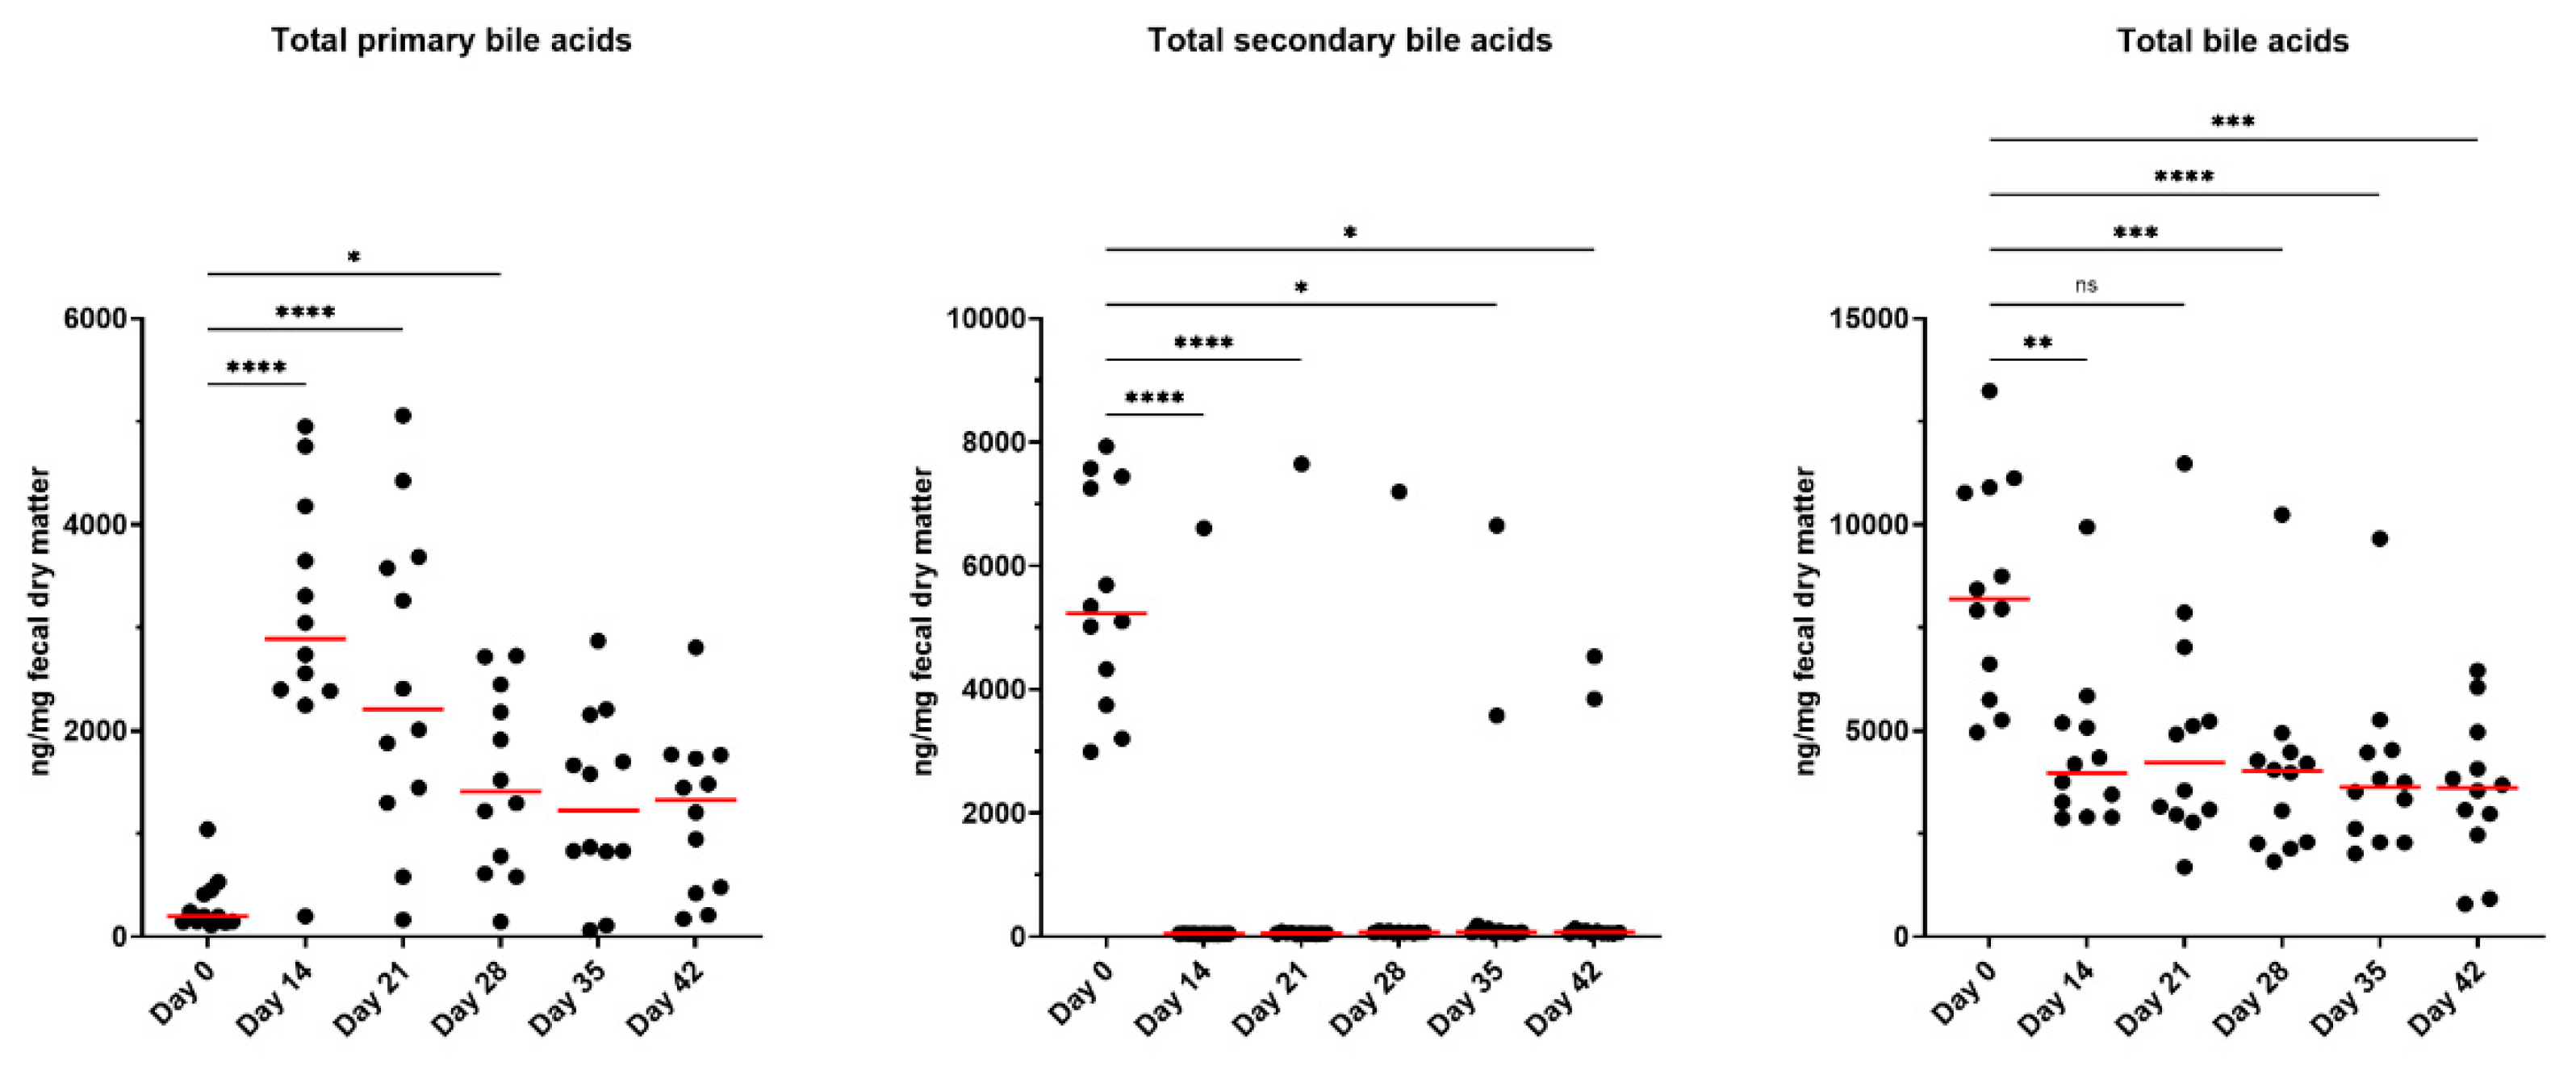
Figure 6.
Dysbiosis index and fecal microbiota abundances of healthy adult cats before metronidazole (day 0), after metronidazole administration (day 14), and during recovery (day 15-42). The mean of each time point was compared with day 0, with red lines representing medians. Reference intervals for cats are highlighted in grey. A dysbiosis index score less than zero (grey area) is considered healthy and “normal,” whereas a score >1 (pink) denotes extreme dysbiosis. A dysbiosis index from zero to one (yellow) is indicative of a mild to moderate shift in the overall diversity.
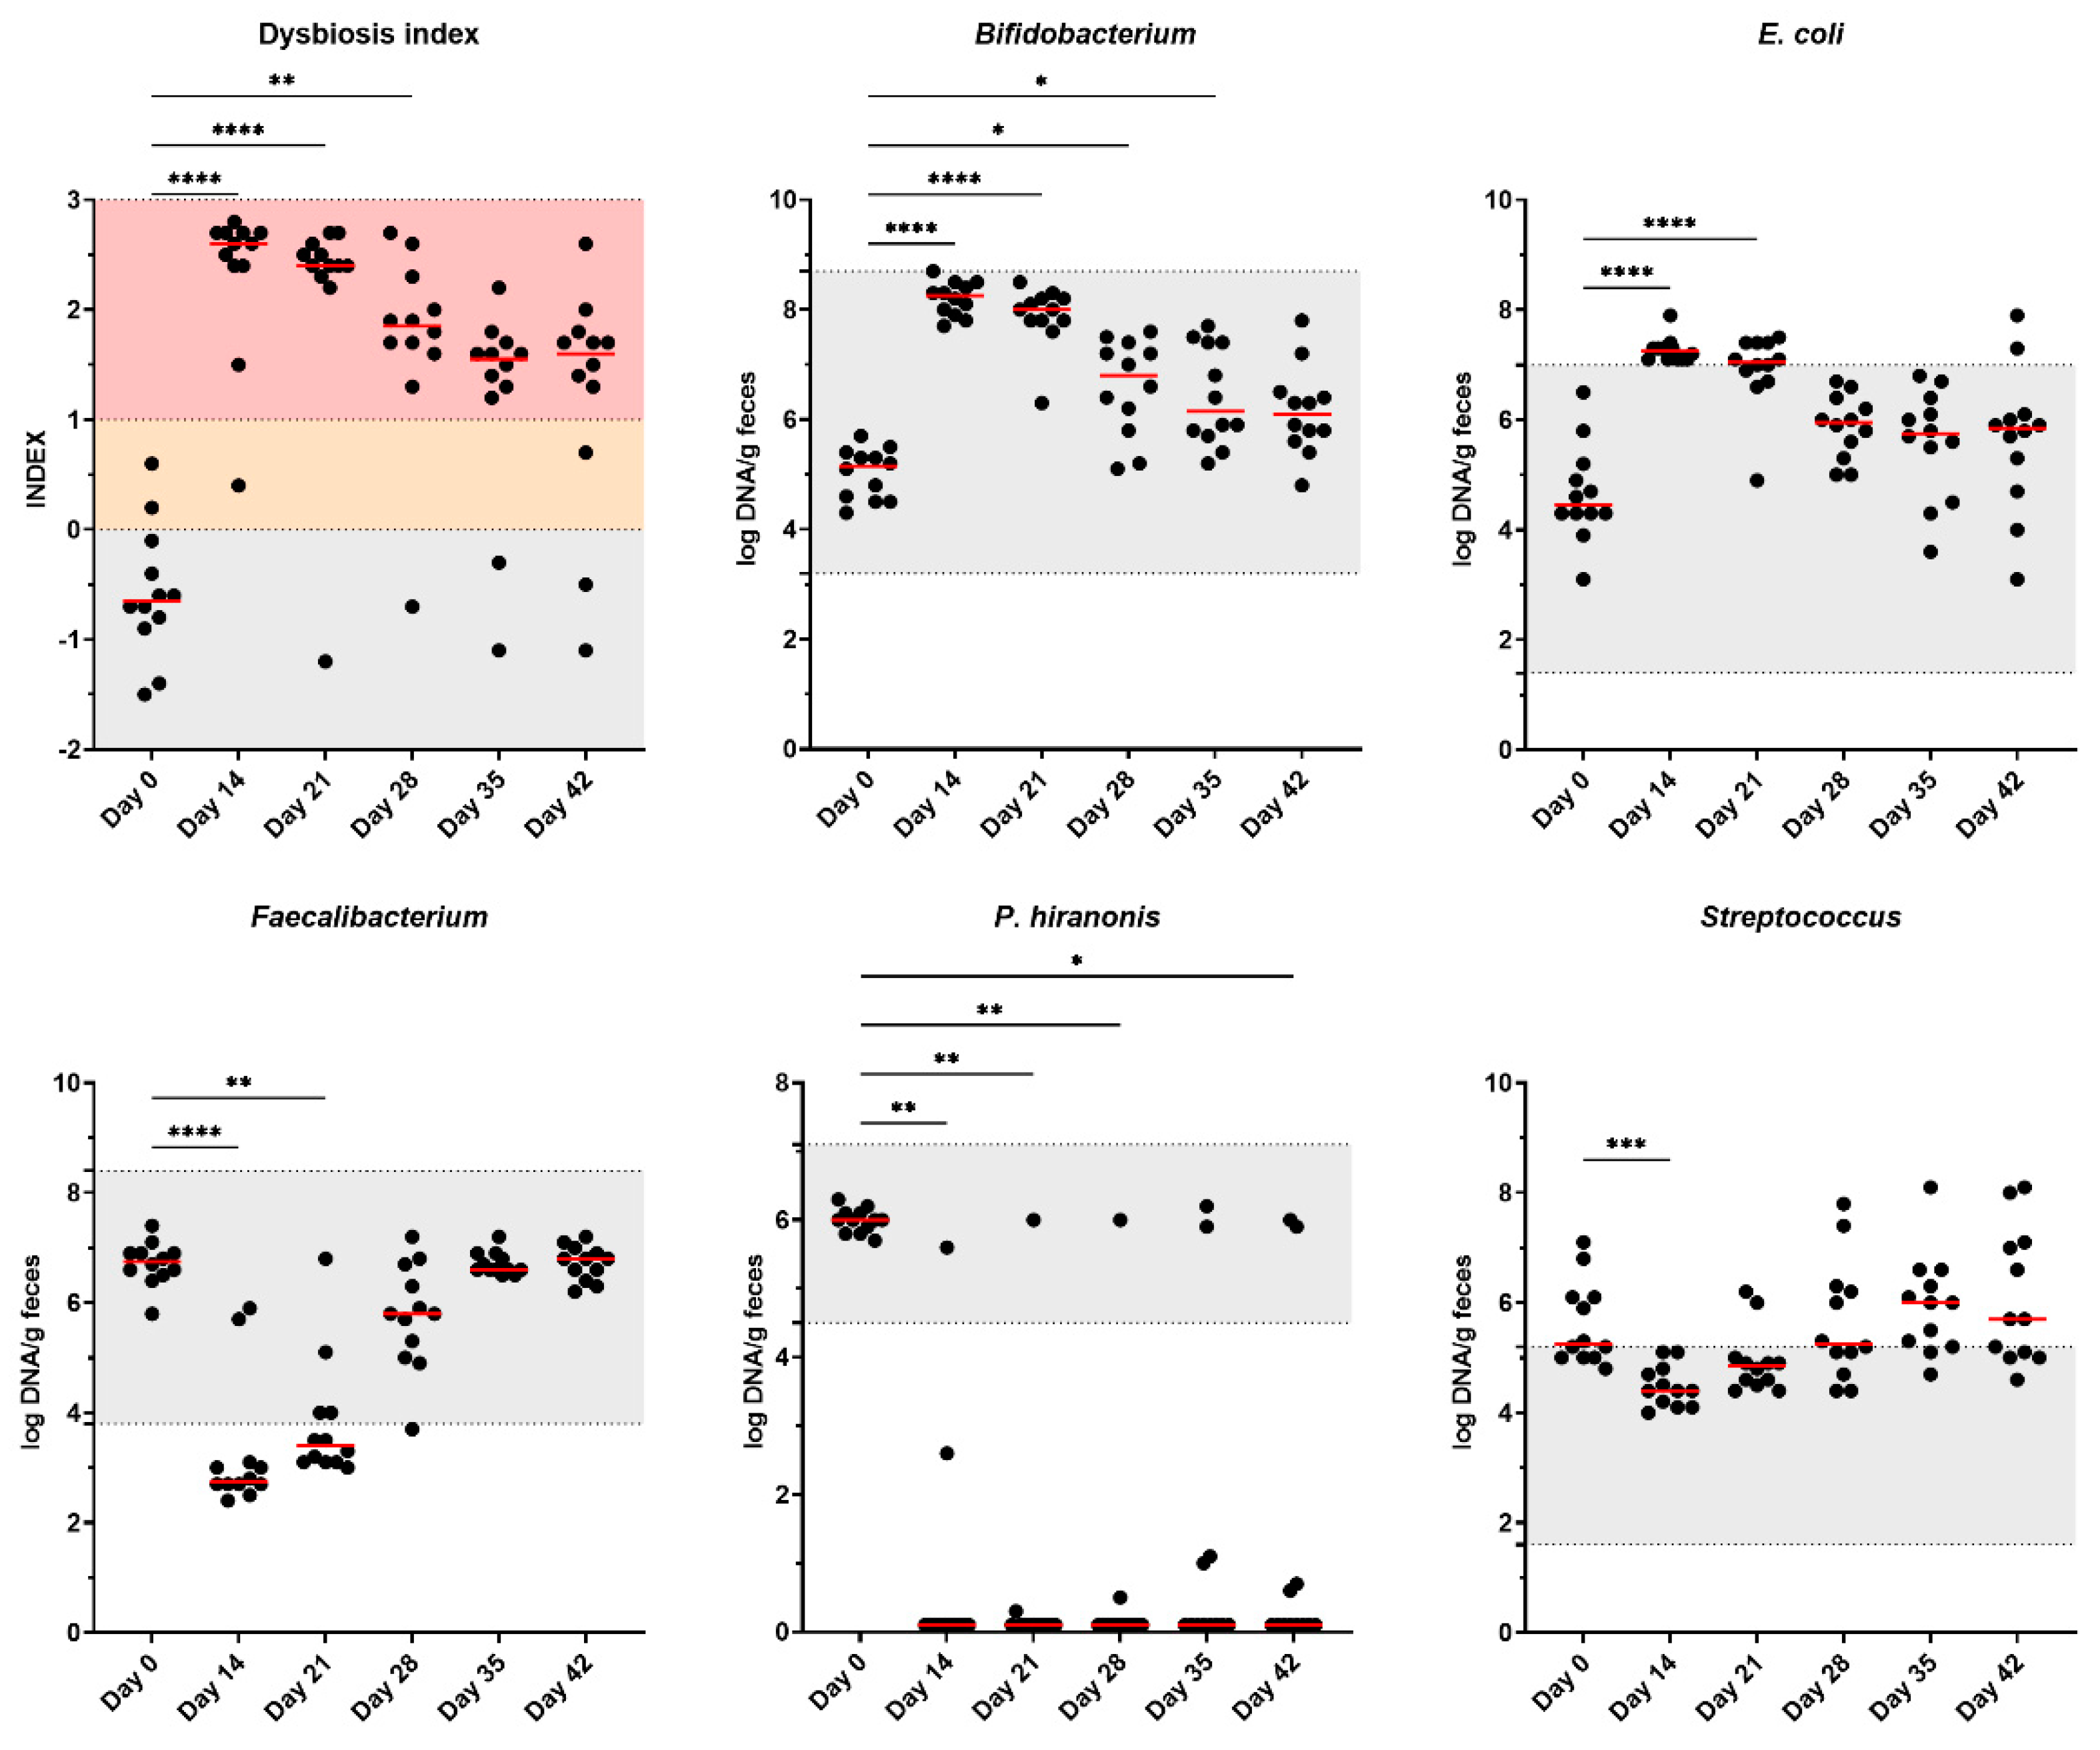
Figure 7.
Serum indoxyl sulfate (IS) and p-cresol sulfate (PCS) concentrations of healthy adult cats before metronidazole (day 0), after metronidazole administration (day 14), and during recovery (day 15-42). The mean of each time point was compared to day 0, with red lines representing medians.
Figure 7.
Serum indoxyl sulfate (IS) and p-cresol sulfate (PCS) concentrations of healthy adult cats before metronidazole (day 0), after metronidazole administration (day 14), and during recovery (day 15-42). The mean of each time point was compared to day 0, with red lines representing medians.
Disclaimer/Publisher’s Note: The statements, opinions and data contained in all publications are solely those of the individual author(s) and contributor(s) and not of MDPI and/or the editor(s). MDPI and/or the editor(s) disclaim responsibility for any injury to people or property resulting from any ideas, methods, instructions or products referred to in the content. |
© 2025 by the authors. Licensee MDPI, Basel, Switzerland. This article is an open access article distributed under the terms and conditions of the Creative Commons Attribution (CC BY) license (http://creativecommons.org/licenses/by/4.0/).
Copyright: This open access article is published under a Creative Commons CC BY 4.0 license, which permit the free download, distribution, and reuse, provided that the author and preprint are cited in any reuse.


