

Submitted:
26 March 2025
Posted:
27 March 2025
You are already at the latest version
Abstract
Background: The brain tumour classification of WHO in 2016 introduced molecular characterization of samples with histopathology, and that was further elaborated in 2021. Detecting the characteristic state of the tumour to promote prognostic outcome is now a key interest area of present cancer research. This work aims to explore such important aspects from the low-grade post-operative CNS tumour samples.
Methods: Post-ablative samples of low-grade CNS tumours were collected from hospital with patient metadata, identified and graded histopathologically. They were characterized with selective protein expressions indicating hallmark characters of cancer like proliferation denoted by Ki67 and PI index, metastatic potency by MMP2, neovasculogenic ability by VEGFR2 and epigenetic alterations by DNMT1 and macrophage infestation by silver-gold staining, CD11b and Iba1 using immunohistochemistry (IHC), immunofluorescence (IF) microscopy and flowcytometry.
Results: In low-grade diffuse astrocytoma and myxopapillary ependymoma, survival and recurrence are finely tuned with an inverse relationship of proliferation and invasion with neovascularization eliciting a multivariate prognostic cue. Matrix degrading tendency found higher in less-proliferative ependymoma, indicating proliferation-invasion dichotomy. Global epigenetic changes denoted by DNMT1 found prominent in low-grade astrocytoma, higher infiltrated CD11b+ macrophages appeared in meningioma, whereas low-grade astrocytoma showed increased Iba1+ microglia.
Conclusion: The study showed that even low-grade CNS tumours can elicit hallmark characteristics of cancer and distinctive features among astrocytoma, ependymoma and meningioma along with information on tumour associated macrophages using a cocktail of common markers Ki67 and PI indexing, MMP2, VEGFR2 CD11b/Iba1 and DNMT1 expressions with profound prognostic importance.
Keywords:
CNS tumours
; astrocytoma
; ependymoma
; meningioma
; proliferation
; invasion
; vasculogenesis
1. Introduction
The central nervous system tumours, primary in origin, represents broad categories of malignancies and found in 5 to 10 per 100,000 population in India. It comprises of 2-2.5% of total malignancy cases, but with significant morbidity and mortality [1]. One of the first ever cross-sectional studies among 39,509 cancer patient records in Kolkata across several hospital and institutes it was found that 2.4% were primary CNS tumours and about 60% of which were fallen into the category of glioma followed by meningioma, medulloblastoma, PNET and others [2]. Another prospective study showed 38.7% were astrocytoma of which 59.6% were of higher grades [3]. Similarly, Gauhati Medical College histological reports showed 30% of the cases were glioblastoma multiforme (GBM) followed by 30% of astrocytoma grade II and III in last few years [4]. Incidences were found more common in male population with predominant occurrence of CNS tumours around 40-60 years, when two decades of observation previously pointed out an increasing trend of CNS tumours in the Indian population, and prognostic outcomes are not much optimistic despite recent advancements due to relative high incidences of glioma in the population [1,2,5]. Central Brain Tumour Registry of the United States (CBTRUS) also showed malignant brain tumour incidence was higher in males with relative increase of overall survival in last years, however, elderly population with GBM burden showed marginal improvement [6].
As evident, mid-age population in India are much susceptible to CNS tumours of glial origin with a relatively poor prognostic outcome that depends on early diagnosis and treatment modules. In north-eastern India, early diagnosis primarily depends on radiological and histological identifications, of which, post-ablative histology-based diagnosis has been considered as deterministic. Due to the high margin of discrepancies in radiological identification and lack of non-invasive means to diagnose brain tumour, definitive therapeutic interventions remained elusive [7]. Another major consideration to determine the nature of malignancies is their molecular characteristics which regulate the atrocity of the tumour, hence highly important for prognosis [8]. Such considerations readily brought prominent changes in the ‘Blue Book’ of WHO for brain tumour classifications in consecutive 4th and 5th editions. In 2016, WHO first introduced molecular characteristics for brain tumour classification with histological evidences, which was further enhanced in 2021 with much higher emphasis on molecular characterization [9,10].
The importance of such changes is gaining evidences when we find that how tumour samples are showing molecular features in a type/grade specific or non-specific way. Additionally, we emphasize on cellular characterization of the samples. In the present work, we will show that how tissue organization and molecular features of one non-malignant and two malignant varieties of conventionally lower histological grades of CNS tumour samples revealed their features and shared additional information with high prognostic values fortifying the importance of cellular and molecular characterizations.
2. Methodology
2.1. Tumour Samples, Histology and Other Metadata
Post-operative tissues of CNS tumours were collected from Bangur Institute of Neurosciences (BIN) of IPGME&R, Kolkata, India in 10% buffered formalin solution and 4% para-foamldehyde (MERCK, India) solution and in serum free Dulbecco’s Modified Eagle Medium (DMEM) (Gibco Invitrogen, USA) separately for different usages. Processed fixed tissues with alcoholic dehydration, embedding, microtome sectioning of 10 µm (WESWOX, India) fixed in glass slides, de-paraffinized and dehydrated in alcohol, stained with haematoxylin and eosin (Merck, India), observed under bright field microscope (Nikon, TS100F Eclipse, Nikon Corp. Japan) and photographed with CCD camera (DS-Fi2-U3, Nikon Corp., Japan). Tumour types and grading were done by collaborative pathological expert based on histological features. Total 10 samples were selected from post-operative patient samples. MRI with T1 & T2 weighted contrast enhanced images and N-acetylaspartate (NAA) peak and choline/creatine ratios were accounted from MR spectroscopy.
2.2. Silver/Gold (S/G) Staining of Paraffin Embedded Tissue
Silver staining and gold toning was done in paraffin embedded tissue samples, sectioned (10μm) and fixed, deparaffinized and stained with freshly prepared ammoniacal Silver Carbonate (Ag2CO3), rinsed in 10% formalin followed by toning in Gold Chloride (HAuCl4) and fixed in sodium thiosulphate (MERCK, India). Slides were observed in the previously mentioned microscopic system and documented with NIS Element-BR Software (Nikon Corp., Japan) to detect electron dense macrophage/microglia.
2.3. Tissue Preparation for Immune-Fluorescence Microscopy
The tissues were fixed in 4% paraformaldehyde (MERCK, India), washed, kept in PBS at 4°C, sectioned (10µm) and stained separately with primary conjugated Glial Fibrillary Acidic Protein (GFAP)-AlexaFluor 488 mAb (BD Pharmingen, USA), CD11b-FITC mAb (BioLegend, USA), Iba1 mAb (Abcam, USA) with PE-conjugated 20 anti-mouse human cross-reactive polyclonal Ab (Abcam, USA), primary conjugated Ki67-FITC Ab (Novus Biologicals, USA) and primary non-conjugated VEGFR2 mAb (Santacruz, USA) with TRITC conjugated 20 Ab (Abcam, USA), primary non-conjugated MMP2 mAb (Novus Biologicals, USA) with FITC conjugated 20 Ab (Abcam, USA). In all cases we used 1:500 primary non-conjugated and 1:1000 primary or secondary conjugated antibody dilution in dark humid chamber incubation. 5% Fetal Bovine Serum (FBS) (GIBCO, USA) in PBS with 0.25% Tween-20 (MERCK, India) used as blocking-permealizing solution. Slides observed in previously mentioned microscope using EpiFL-B2A for Alexa Fluor® 488/FITC and EpiFL-G2A for PE/TRITC (Nikon Corp., Japan), photo captured and processed in previously mentioned CCD camera and software.
2.4. Immunohistochemistry with Counter-Staining
Tissue slides were kept at 54ºC overnight, hydrated, PBS washed and blocked by 3% BSA (LOBA, India), overnight incubated with 10 non-conjugated Ki67 mAb and DNMT1 mAb(Santacruz, USA) (1:200), washed and treated with HRP-conjugated 20 (1:500) Ab (Abcam, USA) followed by 3,3-Diaminobenzidine (DAB) (SRL, India) in buffered (1M TRIS, pH 7.4) H2O2 and 0.5% cupric sulphate in dark for 20 minutes, counter-stained with hematoxylin (Merck, India) and upgradation of alcohol ended to air drying, mounting and visualizing in same microscopic system.
2.5. Cell Isolation, Culture and Immunophenotyping
Aseptically collected freshly ablated samples in serum free DMEM at 4-6ºC were minced and treated with 0.25% Trypsin-EDTA (Sigma Aldrich, USA) followed by addition of FBS (MP Biomedicals, USA), passed through 70 µm nylon filter (HiMedia, India). Filtrate was centrifuged and suspended in DMEM. Cells counted and plated in 60 mm culture-dish (Greiner, Germany) with 2x10⁶ seeding density in 10% FBS-DMEM, 2% antibiotic-antimycotic solution (HiMedia, India) under 37ºC-5% CO2 humidified incubator (New Brunswick, Eppendorf, UK) for 2 days, removed by Accutase (Sigma-Aldrich, USA), washed, fixed by 4% paraformaldehyde. Then pellets were treated with permeabilizing blocking buffer (5% FBS in PBS + 0.5% Tween-20), washed, incubated with 10 MMP2 mAb (Novus Biologicals, USA) at 1:500 with PE-conjugated 20 Ab (Abcam, USA) at 1:700 and 10 conjugated Ki67-FITC (Novus Biologicals) at 1:700 dilution. After incubating pellets were washed reading taken in BD-FACS Verse and analysed with Verse-Suit 1.0 (BD Biosciences, USA).
2.6. Cell Cycle Analysis from Paraffin Fixed Tissue
The samples were prepared from 40 µm tissue ribbons of paraffinized tumour tissue blocks, treated with xylene (MERCK, India), centrifuged pellet collected, underwent descending alcoholic gradation and successive PBS washes, citrate buffer added for antigen retrieval and incubated, then digested in 0.25% trypsin-EDTA, washed in PBS and passed through 70 µm nylon mesh (Jordanova et. al., 2003). Collected filtrate was centrifuged, re-suspended in PBS, 1 mg/ml RNaseA (Invitrogen, USA) added and kept in 37ºC, then Propidium Iodide (PI) (Life technologies, USA) of 0.5mg/ml added, incubated and prepared for readings in BD Accuri C5 (BD Biosciences, USA) and analysed.
2.7. Statistical Analysis
For each sample, experiments were repeated thrice and ‘marginal three sample rank sum statistics’ were used for nonparametric small sample test where multivariate and univariate analysis were done in ‘R Statistical Software’, version 3.5.0 and level of significance considered at p-value 0.05 or less.
3. Results
3.1. Histopathological Findings and MRI Metadata
Histological findings determined grade-II diffuse astrocytoma (n=3), grade-I intradural fibrous meningioma (n=4) and grade-I spinal myxopapillary ependymoma (n=3). At 10X magnification, lobulated island like pattern in ependymoma with hyalinised fibrovascular core and perivascular pseudorosettes (Figure 1 a2) identified; while typical ‘whorling’ in meningioma caused due to their inter-crossing fascicles (Figure 1 b2) of fibroblastic nature; and increased number of glial cells with distinct fibrillary network background indicated diffused fibrillary astrocytoma (Figure 1 c2). At 40X magnification, nuclear atypia and pleomorphism could be seen in all (Figure 1 a3, Figure 1 b3 and Figure 1 c3 respectively) which was highest in astrocytoma. Increased diffuse blood vasculatures were predominant in astrocytoma (Figure 1 c3) followed by lobular specific blood islands in ependymoma and overall moderate pattern of sprouted blood vasculature in meningioma (Figure 1 a3, Figure 1 b3 respectively). Dystrophic micro-calcification was maximum within the lobules of ependymoma (Figure 1 a3). Moderate diffused pattern of micro-calcification was seen in astrocytoma whereas mild calcification found in meningioma (Figure 1 c3 and Figure 1 b3 respectively) indicating least amount of tissue necrosis.
The MRI study of meningioma (Figure 1 b1) showed large extra-axial mass (at mid line basifrontal region) with marked enhancement in post contrast, iso to hypointense in T1 and iso to mildly hyperintese in T2 with mild midline shift and pressure effect while MR spectroscopy gave increased choline peak and mostly reduced NAA peak. The Figure 1 a1 depicted an extra cranial/dural myxopapillary spinal ependymoma furnishing heterogeneous lesion (involving spinal canal and extending from L1 till L5 with effective loss of lumbar curvature) which was overall iso to hyperintense in T2. Increased choline peak and greatly reduced NAA peak has been noted in MR spectroscopy. Figure 1 c1 of intracranial WHO grade II diffuse astrocytoma revealed ill-marginated altered signal intensity (at left temporo-parietal region) showing hypo-intensity in T1 and direct hyperintensity in T2 with distinct mass effect and midline shift followed by highly elevated choline peak and low NAA peak in MR spectroscopy.
3.2. GFAP Showed Distinct Variability in Glial Cell Population
Immunohistochemical investigation with GFAP showed low-grade astrocytoma (Figure 2 a3) involved large number of astrocytes denoting hyper-cellularity. Ependymoma showed much lower GFAP positive cells (Figure 2 a1). Meningioma showed scant astroglial expression (Figure 2 a2) due to its origin from GFAP negative meningio-epithelial cells.
3.3. Ki67 and Propedium Iodide (PI) Displayed Graded Variation of Proliferation
In immunohistochemical investigations, astrocytoma showed highest level of expression of Ki67-HRP (Figure 2 b3) while lower expressions were shown in ependymoma (Figure 2 b1) and meningioma (Figure 2 b2). The Ki67 positive cells were with index value lied around 0.4±0.05 in ependymoma, 1.3±0.12 in meningioma and 1.9±0.26 in astrocytoma. Cell cycle analysis in flowcytometry showed highest S+G2M in astrocytoma (21.20%±0.02) (Figure 2 e) followed by meningioma (12.80%±0.02) (Figure 2 d) and ependymoma (8.30%±0.02) (Figure 2 c). IF-IHC with Ki67-FITC also showed similar proliferative nature with prominently higher expression in low-grade astrocytoma (Figure 2 f3) and much less in meningioma and ependymoma (Figure 2 f1, Figure 2 f2). Both experimental values were shown graphically (Figure 2 g) as comparative cellular proliferation and in Ki67 indexing p-value lied equal to 0.05 marking significant differences in proliferative nature among these three where astrocytoma showed highest proliferative potential followed by meningioma.
3.4. Expression of Total MMP2 Indicated Variable Invasive Property
Immunohistochemistry with MMP2-FITC in ependymoma (Figure 3 a1) showed regionally visible intense clustered expression compared to low scattered expression in meningioma (Figure 3 a2) and diffused orientation of moderate level expression in astrocytoma (Figure 3 a3). In flowcytometry, the median fluorescence (MF) of MMP2-PE was highest in ependymoma (Figure 3 b1), astrocytoma came second with nearly one-fourth decreased expression (Figure 3 b3) where meningioma with one-fifth level of decreased expression (Figure 3 b2). These MF values were indexed (MFI) as percentile increase and plotted graphically where the magnitudes of differences were prominent among these three types (Figure 3 c) (p-value ~ 0.03).
3.5. VEGFR2 and DNMT1 Showed Neo-Vasculogenesis and Epigenetic Modification Patterns
Immunohistochemistry of samples when observed for VEGFR2 expression under immunofluorescence microscopy, in Figure 3 d1, clustered red patches indicated adequate aberrant level of angiogenic receptor expression in ependymoma. Meningioma (Figure 3 d2) showed overall diffused and low VEGFR2 expression, but astrocytoma (Figure 3 d3) showed maximum visual expression with scattered spots indicating its higher potential of neo-vasculogenesis. IHC of fixed tumour tissues with DNMT1 (dark brown spots) showed scarce DNMT1 expression in ependymoma (Figure 3 e1), small patches in meningioma (Figure 3 e2) and visually high expression in astrocytoma (Figure 3 e3) indicative of most epigenetic alterations.
3.6. S/G Staining with CD11b and Iba1 Expression Showed the Association of Macrophage/Microglia Within Tumour Types
Silver-Gold (S/G) staining of electron dense immune cells in tumour tissues at 10X magnification revealed similar kind of expression in ependymoma (Figure 4 a1) and astrocytoma (Figure 4 c1), but with steep increase in meningioma (Figure 4 b1). 40X magnification revealed dark black silver impregnated cellular structures. These S/G positive cells were 58±13.9 in meningioma (Figure 4 b2), 31±11 in ependymoma (Figure 4 b2) and lowest 18±2.5 in astrocytoma (Figure 4 c2). IF-IHC with CD11b yielded mean fluorescence intensity highest (26.7±4.9) in meningioma (Figure 4 a3), moderate (9.9±5.1) in ependymoma (Figure 4 b3) and lowest (6.6±1) (Figure 4 c3) in astrocytoma. Iba1 gave mean fluorescence intensity of 18±4.8 in astrocytoma (Figure 4 c4), 18.9±3.8 in meningioma (Figure 4 b4) and 10.3±1.6 in ependymoma (Figure 4 a4). These data were put forwarded as graphical representation (Figure 4 d) with p-value 0.02 revealing that fibrous meningioma predominantly infested with tumour associated macrophage cells, but astrocytoma showed predominant presence of Iba1+ microglial cells.
4. Discussion
Investigations on low grade CNS tumours and their molecular characteristics from the real patient samples are relatively very rare in comparison to the higher-grade CNS tumours and most likely in gliomas [1,11]. This is partially because, detection and diagnosis of lower grade of CNS tumours are less due to ignorable clinical manifestations in many cases, and they are mostly remediable and assumed to be less challenging, hence less worthy to report. However, in many occasions such tumours showed unexpected complications and poor prognostic outcomes [12,13,14]. To investigate the matter, we worked on some low-grade primary CNS tumour samples, namely, grade I meningioma and ependymoma and grade II diffused astrocytoma, collected from the specialized government aided hospital of Kolkata, the largest metropolis of eastern India. Some specific data on the cellular potential and their organization of the tumour tissue were found which, in different aspects, likely to have significant impacts on prognosis.
It was found that neoplastic growth in grade II astrocytoma, as found in immunohistochemical or flowcytometric observations for GFAP and Ki67 expression analysis and indexing, were strongly correlated with proliferation and patient’s median survival [15]. Another study showed statistically significant correlations among these two in a demographic study in South Indian population [16]. Representing 15% of all the spinal cord tumours, myxopapillary ependymoma is usually considered to be mostly of benign type also giving much lower Ki67 index in our study (Figure 2). However, we found both the cellular and tissue level expression of MMP2 is surprisingly highest in it (Figure 3), inversely proportional to the least proliferative index calculated. The invasive capability of the CNS tumour is the other side of the coin related to its spreading, recurrence and survival, where MMPs are highly involved in extracellular-matrix (ECM) degradation, invasion and successive metastasis. Increased levels of MMP2 and MMP14 in WHO grade I to III ependymoma were found to be correlated with its invasive nature and poor patient survival [17]. Further, we have tried to match VEGFR2 level as angiogenic marker among these CNS tumours. The patchy expression of VEGFR2 (Figure 3) in ependymoma might be indicative of the effect of sporadic angiogenic switching in places in gross total resection (GTR) of myxopapillary ependymoma though having lowest proliferative index. This process is associated with cascade action of different growth factors like EGF, PDGF, TGF and modelation of TIMP expression controlled by the presence of tumour cells, fibroblasts, invading macrophage and immune cells, which control the MMP level and VEGFR expression [18,19,20].
Our previous work showed gradual increase of brain macrophage/microglia from grade II to grade IV astrocytoma governing total churning of ECM, claiming utmost morbidity [21]. In present study, maximum number of electron dense S/G positive microglia/macrophage has been found in meningioma compared to astrocytoma and ependymoma and it also supported by the IHC analysis with CD11b and Iba1 (Figure 4 b2 – Figure 4 b4). It was earlier reported that, the extradural nature and position of the meningioma as being originated from arachnoidal layers of the meninges, without any hindrance from blood-brain-barrier (BBB) and over-expressing monocyte-chemoattractant-protein-1 (MCP-1), large number of infiltrating monocytic lineage cells (tumour-associated-macrophage or TAM) and CD8+ T-lymphocytes (tumour infiltrating lymphocytes or TIL) get accumulated in meningioma, often showing peri-tumoural oedema. However, low number of CD11b+ cells found in low-grade astrocytoma indicated the resistance of BBB until that stage and less availability of MCP, where higher number of resident Iba1+ microglia was prominent there (Figure 4 and Table 1) [22,23]. The presence and organisation of resident or invaded macrophages in the CNS tumours are the crucial pathophysiological determinant [24] and variable presence of them in these tumour types might be the key component of prognostic outcome. In another aspect of the present study, IHC of three low-grade CNS tumours with DNMT1 portrayed visually maximum expression in grade II astrocytoma (Figure 3 e) followed by ependymoma. The non-glial low-grade meningioma showed an overall intermediate DNMT1 expression here. In our previous study an increasing amount of epigenetic perturbation with increased grades of glioma was generally observed, though a detailed study on epigenetic alterations of post-operative patient samples encompassing different CNS tumours is still to be explored in details to fetch some prognostic benefits [25,26].
In brief, present study on these low-grade CNS tumour samples from a hospital population established grossly a non-linear and heterospecific biological connotation (Table 1). In low-grade diffuse astrocytoma and myxopapillary ependymoma, survival and recurrence are finely tuned with an inverse relationship of proliferation and invasion with neovascularization eliciting a multivariate prognostic cue. Matrix degrading tendency found higher in less-proliferative ependymoma, which may be explained in correlation with proliferation-invasion dichotomy. Global epigenetic changes denoted by DNMT1 found prominent in low-grade astrocytoma than others. Higher infiltrated CD11b+ macrophages appeared in meningioma for its positional predisposition, whereas low-grade astrocytoma showed increased Iba1+ microglia which may potentiate M2 phenotype mediated invasive aggression in higher grade transformation. The study showed that only some selective markers like Ki67/PI, MMPs, V/EGFRs, CD11b/Iba1 and similar markers are capable of extracting the hallmark features of cancer like proliferation, invasion and metastasise, neo-vascularization, epigenetic state, existence and extent of macrophage and microglia in tumour tissue.
5. Conclusion
Only histopathological findings are not sufficient to determine the treatment modalities, but prognostic success is hidden into the revelation of the functional potential of the cells and their interactive outcome. Therefore, primary level molecular characterizations along with estimation of tissue or invading macrophages may become handy to fetch the information of hallmark characteristics of tumour including proliferation, invasion, metastasis, neo-vasculogenic potency and status of infiltrated macrophages etc [27]. So, understanding the cellular and molecular characteristics is crucial with normal histopathology and employ proper treatment regime. Such findings are signifying the importance of not only the molecular and genetic characterizations of the tumours, which are already accepted and prioritized [10,28,29]; but also, the cellular organizations and modifications should be carefully scrutinized because the cellular composition within the CNS tumour is a highly influential factor to alter the process of tumour progression and spreading. Here common markers and histochemical processes are found enough to extract some crucial hallmark features from low-grade CNS tumours. For the better prognosis of ailing patients with CNS tumours with better survival period and well-being, such modifications of diagnostic approach are required to be adapted early.
Authors’ Contribution
KG performed experiments and investigation, primary data curation and analysis and writing original draft. PB provided resources, supervision, validation, review and editing. AG made conceptualization, funding acquisition, project administration, resources, supervision, investigation, validation, writing-reviewing and editing.
Ethical Approval
We worked with the post-operative human tumour samples vide Human Ethical Clearance Memo No: Inst/IEC/553 dated 15.01.2014 from Institutional Ethical Committee (IEC) at Institute of Post Graduate Medical Education and Research (IPGME&R), Kolkata, West Bengal, India with our collaborating physicians and medical practitioners as mentioned in acknowledgement section.
Grant Information
This work was supported by the Council of Scientific and Industrial Research (CSIR), Government of India for financial aid vide Project No. 37(1587)/13/EMR-II and partially supported by Indian Council of Medical Research (ICMR) project grant (61/8/2011-BMS) to Dr. Anirban Ghosh as Principal Investigator (PI).
Availability of Data and Materials
All the materials are owned by the authors and will be available from the first and corresponding authors on reasonable request.
Acknowledgments
Authors are acknowledging Prof. S.N. Ghosh at Neurosurgery unit, Bangur Institute of Neurosciences (BIN), Institute of Post Graduate Medical Education and Research (IPGME&R), Kolkata for post-operative tumour samples, and Prof. Uttara Chatterjee of Pathology Department of IPGME&R for identification and grading of tumour samples.
Competing Interest
There is no competing interest among authors.
References
- Dasgupta A, Gupta T, Jalali R. Indian data on central nervous tumors: A summary of published work. South Asian J Cancer. 2016;5:147-53. [CrossRef]
- Ghosh A, Sarkar S, Begum Z et al. The first cross sectional survey on intracranial malignancy in Kolkata, India: Reflection of the state of the art in southern West Bengal. Asian Pac J Cancer Prev. 2004;5:259-267.
- Jalali R, Datta D. Prospective analysis of incidence of central nervous tumors presenting in a tertiary cancer hospital from India. J Neurooncol. 2008;87:111-4. [CrossRef]
- Paul M, Goswami S, Raj G, Bora G. Clinico-epidemiological Profile of Primary Brain Tumours in North-Eastern Region of India: A Retrospective Single Institution Study. Asian Pac J Cancer Care. 2023;8(2):333-336. [CrossRef]
- Yeole BB. Trends in the Brain Cancer Incidence in India. Asian Pacific J Cancer Prev. 2008;9:267-270.
- Miller KD, Ostrom QT, Kruchko C et al. Brain and other central nervous system tumor statistics, 2021. CA Cancer J Clin. 2021;71:381-406. [CrossRef]
- Gao H, Jiang X. Progress on the diagnosis and evaluation of brain tumors. Cancer Imaging. 2013;13(4):466-481. [CrossRef]
- Park SH, Won J, Kim SI et al. Molecular Testing of Brain Tumor. J Pathol Transl Med. 2017;51(3):205-223. [CrossRef]
- Louis DN, Perry A, Reifenberger G et al. World Health Organization classification of tumours of the central nervous system: a summary. Acta Neuropathol. 2016;131:803-820. [CrossRef]
- Louis DN, Perry A, Wesseling P. The 2021 WHO Classification of Tumors of the Central Nervous System: a summary. Neuro-Oncol. 2021;23(8):1231-1251. [CrossRef]
- Bready D, Placantonakis DG. Molecular pathogenesis of low-grade glioma. Neurosurg Clin N Am. 2019;30(1):17-25. [CrossRef]
- Yrysov K, Arstanbekov N, Mamytov M. Postoperative complications in patients with intracranial meningiomas who underwent surgery. Biomedicine. 2023;43(3):1023-1026. [CrossRef]
- Chang JH, Chang JW, Choi JY, Park YG, Chung SS. Complications after gamma knife radiosurgery for benign meningiomas. J Neurol Neurosurg Psychiatry. 2003;74:226–230. [CrossRef]
- Bertrand KC, Kliom P. Recent Advancements in Ependymoma: Challenges and Therapeutic Opportunities. Pediatr Neurosurg. 2023;58,307–312.
- Thotakura M, Tirumalasetti N, Krishna R. Role of Ki-67 labeling index as an adjunct to the histopathological diagnosis and grading of astrocytomas. J Can Res Ther. 2014;10:641-645. [CrossRef]
- Shivaprasad NV, Satish S, Ravishankar S, Vimalambike MG. Ki-67 immunostaining in astrocytomas: Association with histopathological grade – A South Indian study. J Neurosci Rural Pract. 2016;7:510-514. [CrossRef]
- Akyurek S, Chang EL, Yu TK et al. Spinal myxopapillary ependymoma outcomes in patients treated with surgery and radiotherapy at MD Anderson Cancer Center. J Neuro Oncol. 2006;80:177-183. [CrossRef]
- Huang H, Held-Feindt J, Buhl R, Mehdorn HM, Mentlein R. Expression of VEGF and its receptors in different brain tumours. Neurol Res. 2005;27:371-377. [CrossRef]
- Snuderl M, Chi SN, DeSantis SM et al. Prognostic value of tumour microinvasion and metalloproteinases expression in intracranial paediatric ependymomas. J Neuropath Exp Neurol. 2008;67:911-920.
- Chen X, Li C, Che X, Chen H, Liu Z. Spinal myxopapillary ependymomas: a retrospective clinical and immunohistochemical study. Acta Neurochir. 2016;158:101-107. [CrossRef]
- Ghosh K, Ghosh S, Chatterjee U, Chaudhuri S, Ghosh A. Microglial contribution to glioma progression: An immunohistochemical study in Eastern India. Asian Pac J Cancer Prev, 2016;17:2767-2773.
- Sato K, Kuratsu JI, Takeshima H, Yoshimura T, Ushio Y. Expression of monocyte chemoattractant protein-1 in meningioma. J Neurosurg. 1995;82:874-878. [CrossRef]
- Kvisten M, Mikkelsen VE, Stensjøen AL et al. Microglia and macrophages in human glioblastomas: A morphological and immunohistochemical study. Mol Clin Oncol. 2019;11:31-36. [CrossRef]
- Gutmann DH, Kettenmann H. Microglia/Brain Macrophages as Central Drivers of Brain Tumour Pathobiology. Neuron. 2019;104(3):442-449. [CrossRef]
- Dubuc AM, Mack S, Unterberger A, Northcott PA, Taylor MD. The epigenetics of brain tumours. Methods Mol Biol. 2012;863:139-53.
- Ghosh K, Ghosh S, Chatterjee U, Bhattacharjee P, Ghosh A. Dichotomy in growth and invasion from low- to high-grade glioma cellular variants. Cell Mol Neurobiol. 2022;42:2219-2234. [CrossRef]
- Hanahan D, Weinberg RA. Hallmarks of Cancer: The Next Generation. Cell. 2011;144:646-74.
- Wang H, Diaz AK, Shaw TI. Deep multiomics profiling of brain tumours identifies signaling networks downstream of cancer driver genes. Nat Commun. 2019;10:3718. [CrossRef]
- Ghosh A, Chaudhuri S. Tissue-free non-invasive diagnostic methodology for brain tumour: Present scenario and future direction. Biomedicine. 2024;44(1):39-45. [CrossRef]
Figure 1.
T1 and T2 weighted MR images of (a1) low-grade spinal myxopapillary ependymoma; (b1) low-grade meningioma and (c1) low-grade astrocytoma. Histopathological features using H/E staining of low-grade spinal myxopapillary ependymoma (a2 in 100X magnification; a3 in 400X magnification), low-grade fibroblastic meningioma (b2 in 100X magnification; b3 in 400X magnification), low-grade diffuse astrocytoma (c2 in 100X magnification; c3 in 400X magnification).
Figure 1.
T1 and T2 weighted MR images of (a1) low-grade spinal myxopapillary ependymoma; (b1) low-grade meningioma and (c1) low-grade astrocytoma. Histopathological features using H/E staining of low-grade spinal myxopapillary ependymoma (a2 in 100X magnification; a3 in 400X magnification), low-grade fibroblastic meningioma (b2 in 100X magnification; b3 in 400X magnification), low-grade diffuse astrocytoma (c2 in 100X magnification; c3 in 400X magnification).
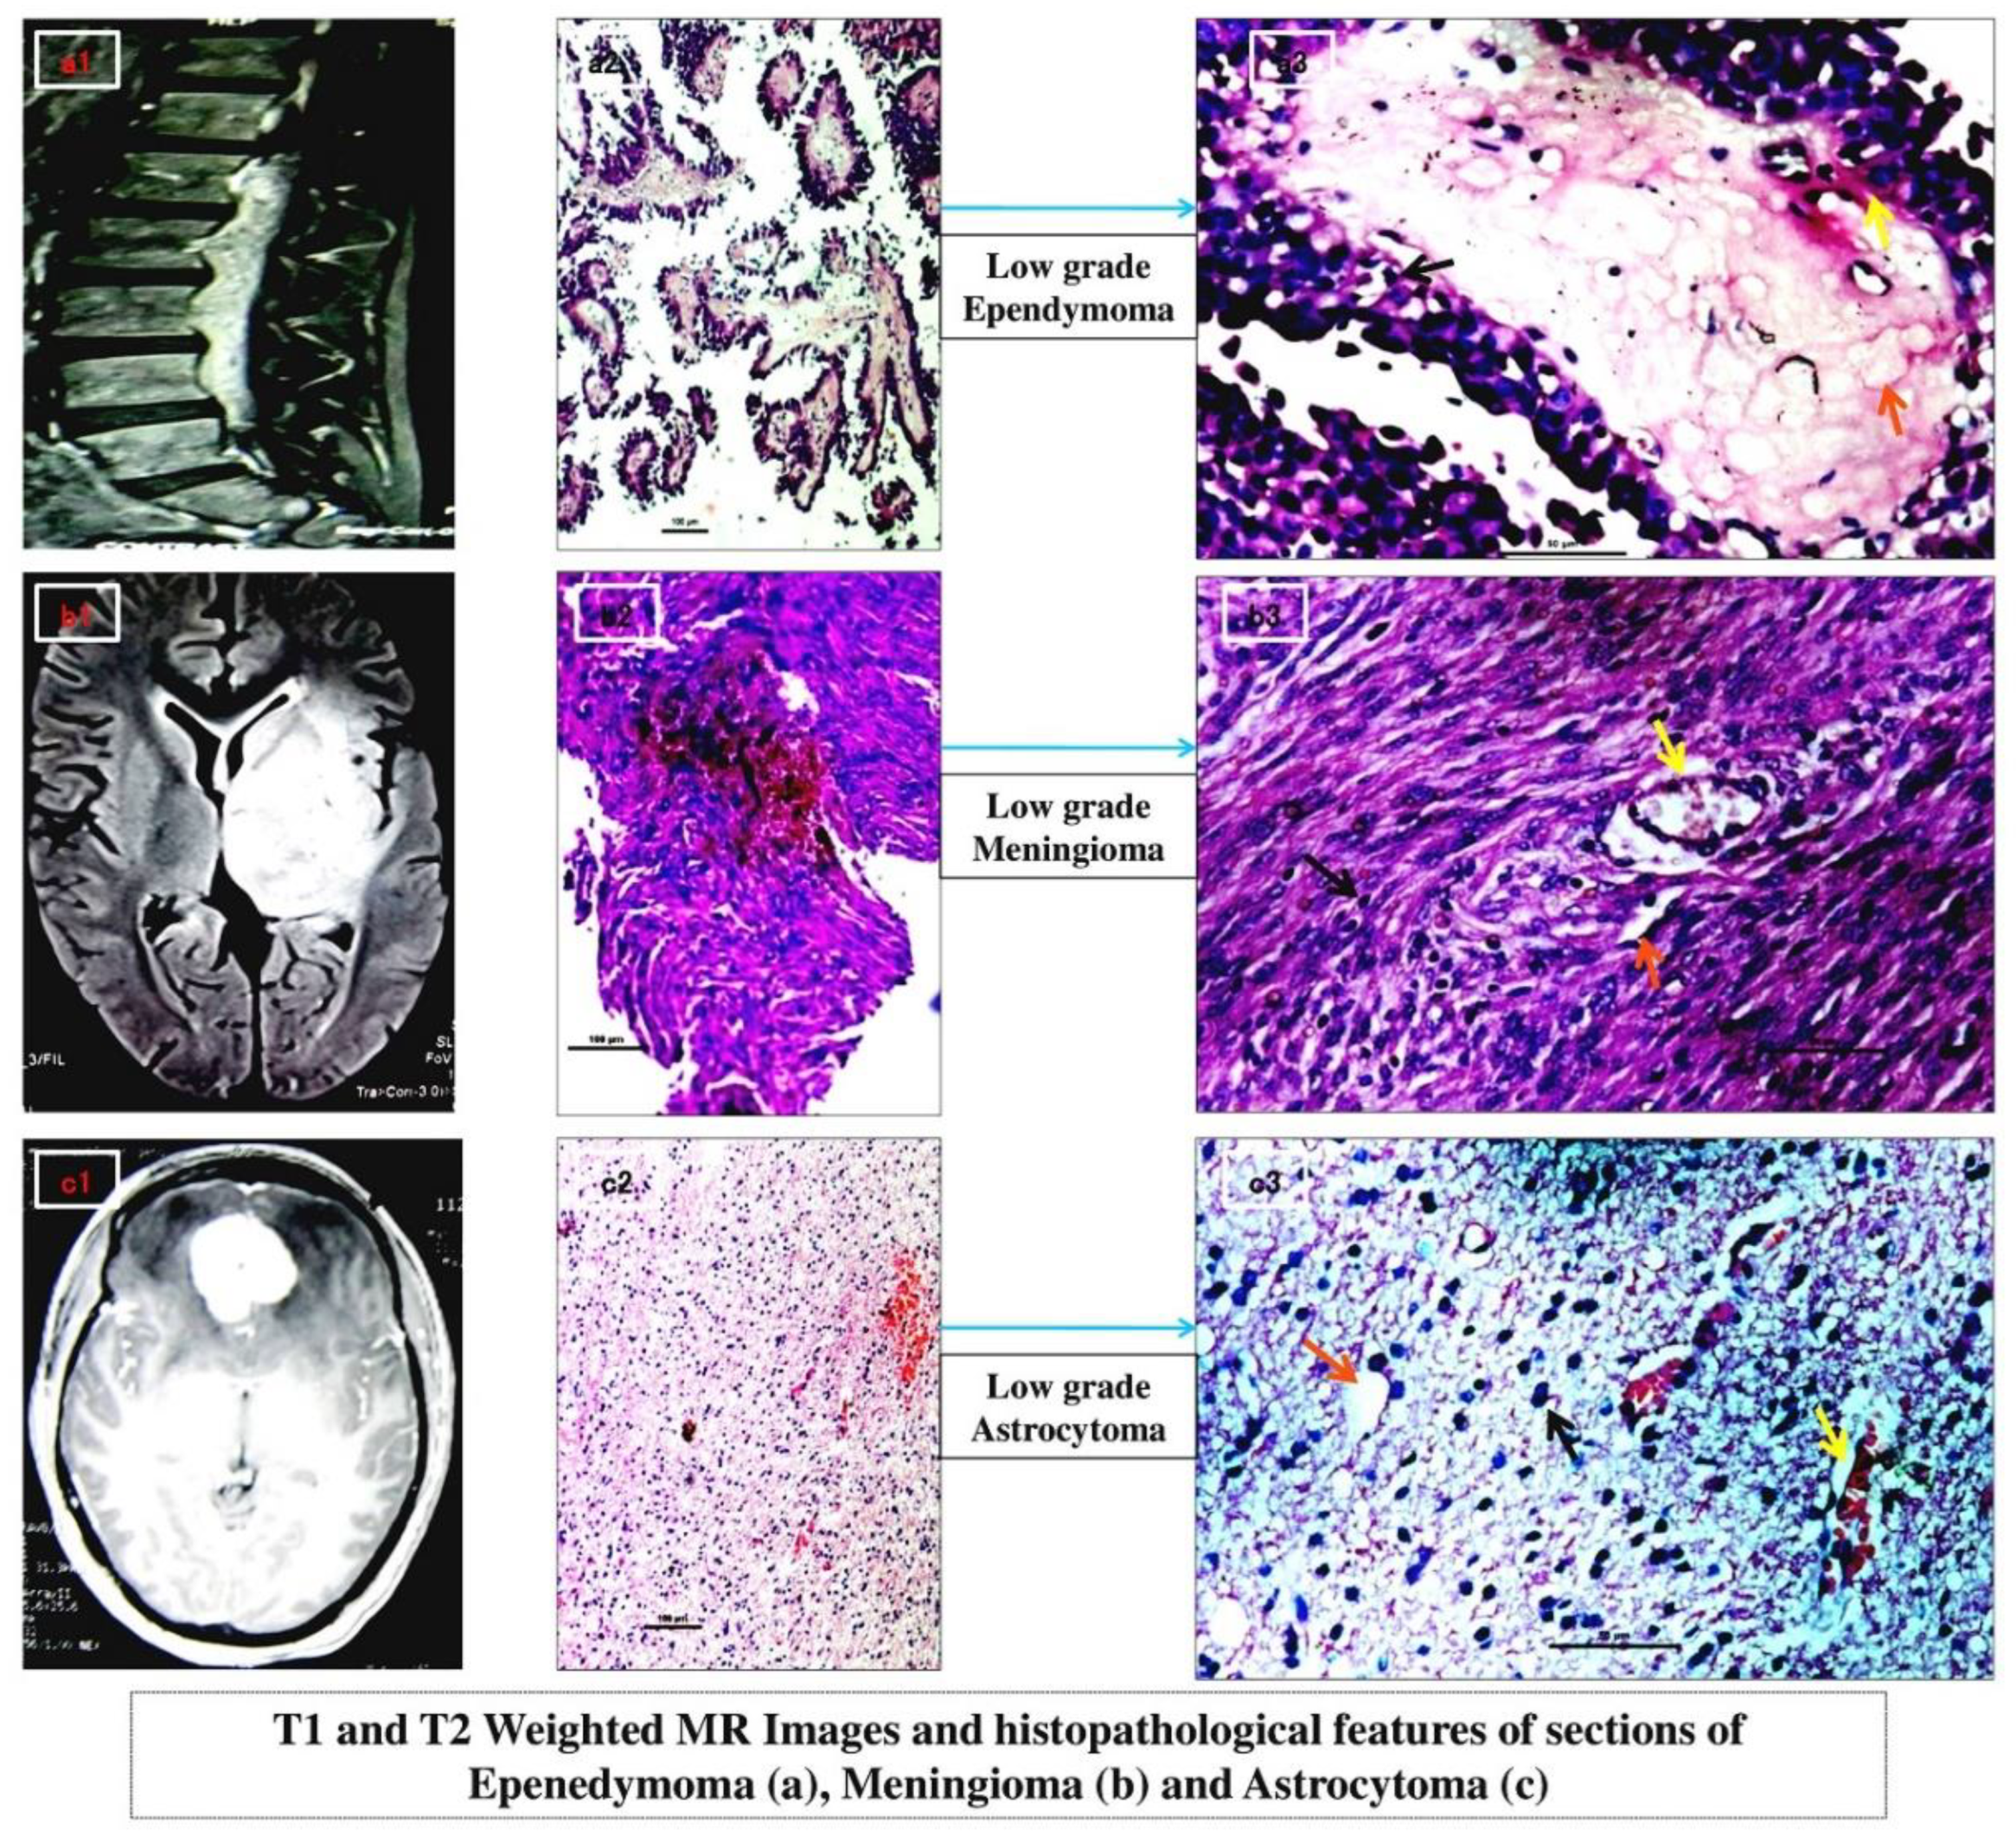
Figure 2.
Comparative attribute of glial cell proliferation by IHC for GFAP of low-grade spinal myxopapillary ependymoma (a1); low-grade meningioma (a2) and low-grade astrocytoma (a3) in 100X magnification. IHC with Ki67 of low-grade ependymoma (b1), low-grade meningioma (b2) and low-grade astrocytoma (b3) in 400X magnification. Cell cycle analysis with PI of low-grade ependymoma (c1; c2), low-grade meningioma (d1; d2) and low-grade astrocytoma (e1; e2). Tissues IHC with Ki67 for low-grade ependymoma (g1), low-grade meningioma (g2) and low-grade astrocytoma (g3) in 100X magnification respectively. Comparative graphical representation of PI cell-cycle and Ki67 tissue IHC index values in ependymoma, meningioma & astrocytoma respectively (f) showing proliferative attributes.
Figure 2.
Comparative attribute of glial cell proliferation by IHC for GFAP of low-grade spinal myxopapillary ependymoma (a1); low-grade meningioma (a2) and low-grade astrocytoma (a3) in 100X magnification. IHC with Ki67 of low-grade ependymoma (b1), low-grade meningioma (b2) and low-grade astrocytoma (b3) in 400X magnification. Cell cycle analysis with PI of low-grade ependymoma (c1; c2), low-grade meningioma (d1; d2) and low-grade astrocytoma (e1; e2). Tissues IHC with Ki67 for low-grade ependymoma (g1), low-grade meningioma (g2) and low-grade astrocytoma (g3) in 100X magnification respectively. Comparative graphical representation of PI cell-cycle and Ki67 tissue IHC index values in ependymoma, meningioma & astrocytoma respectively (f) showing proliferative attributes.
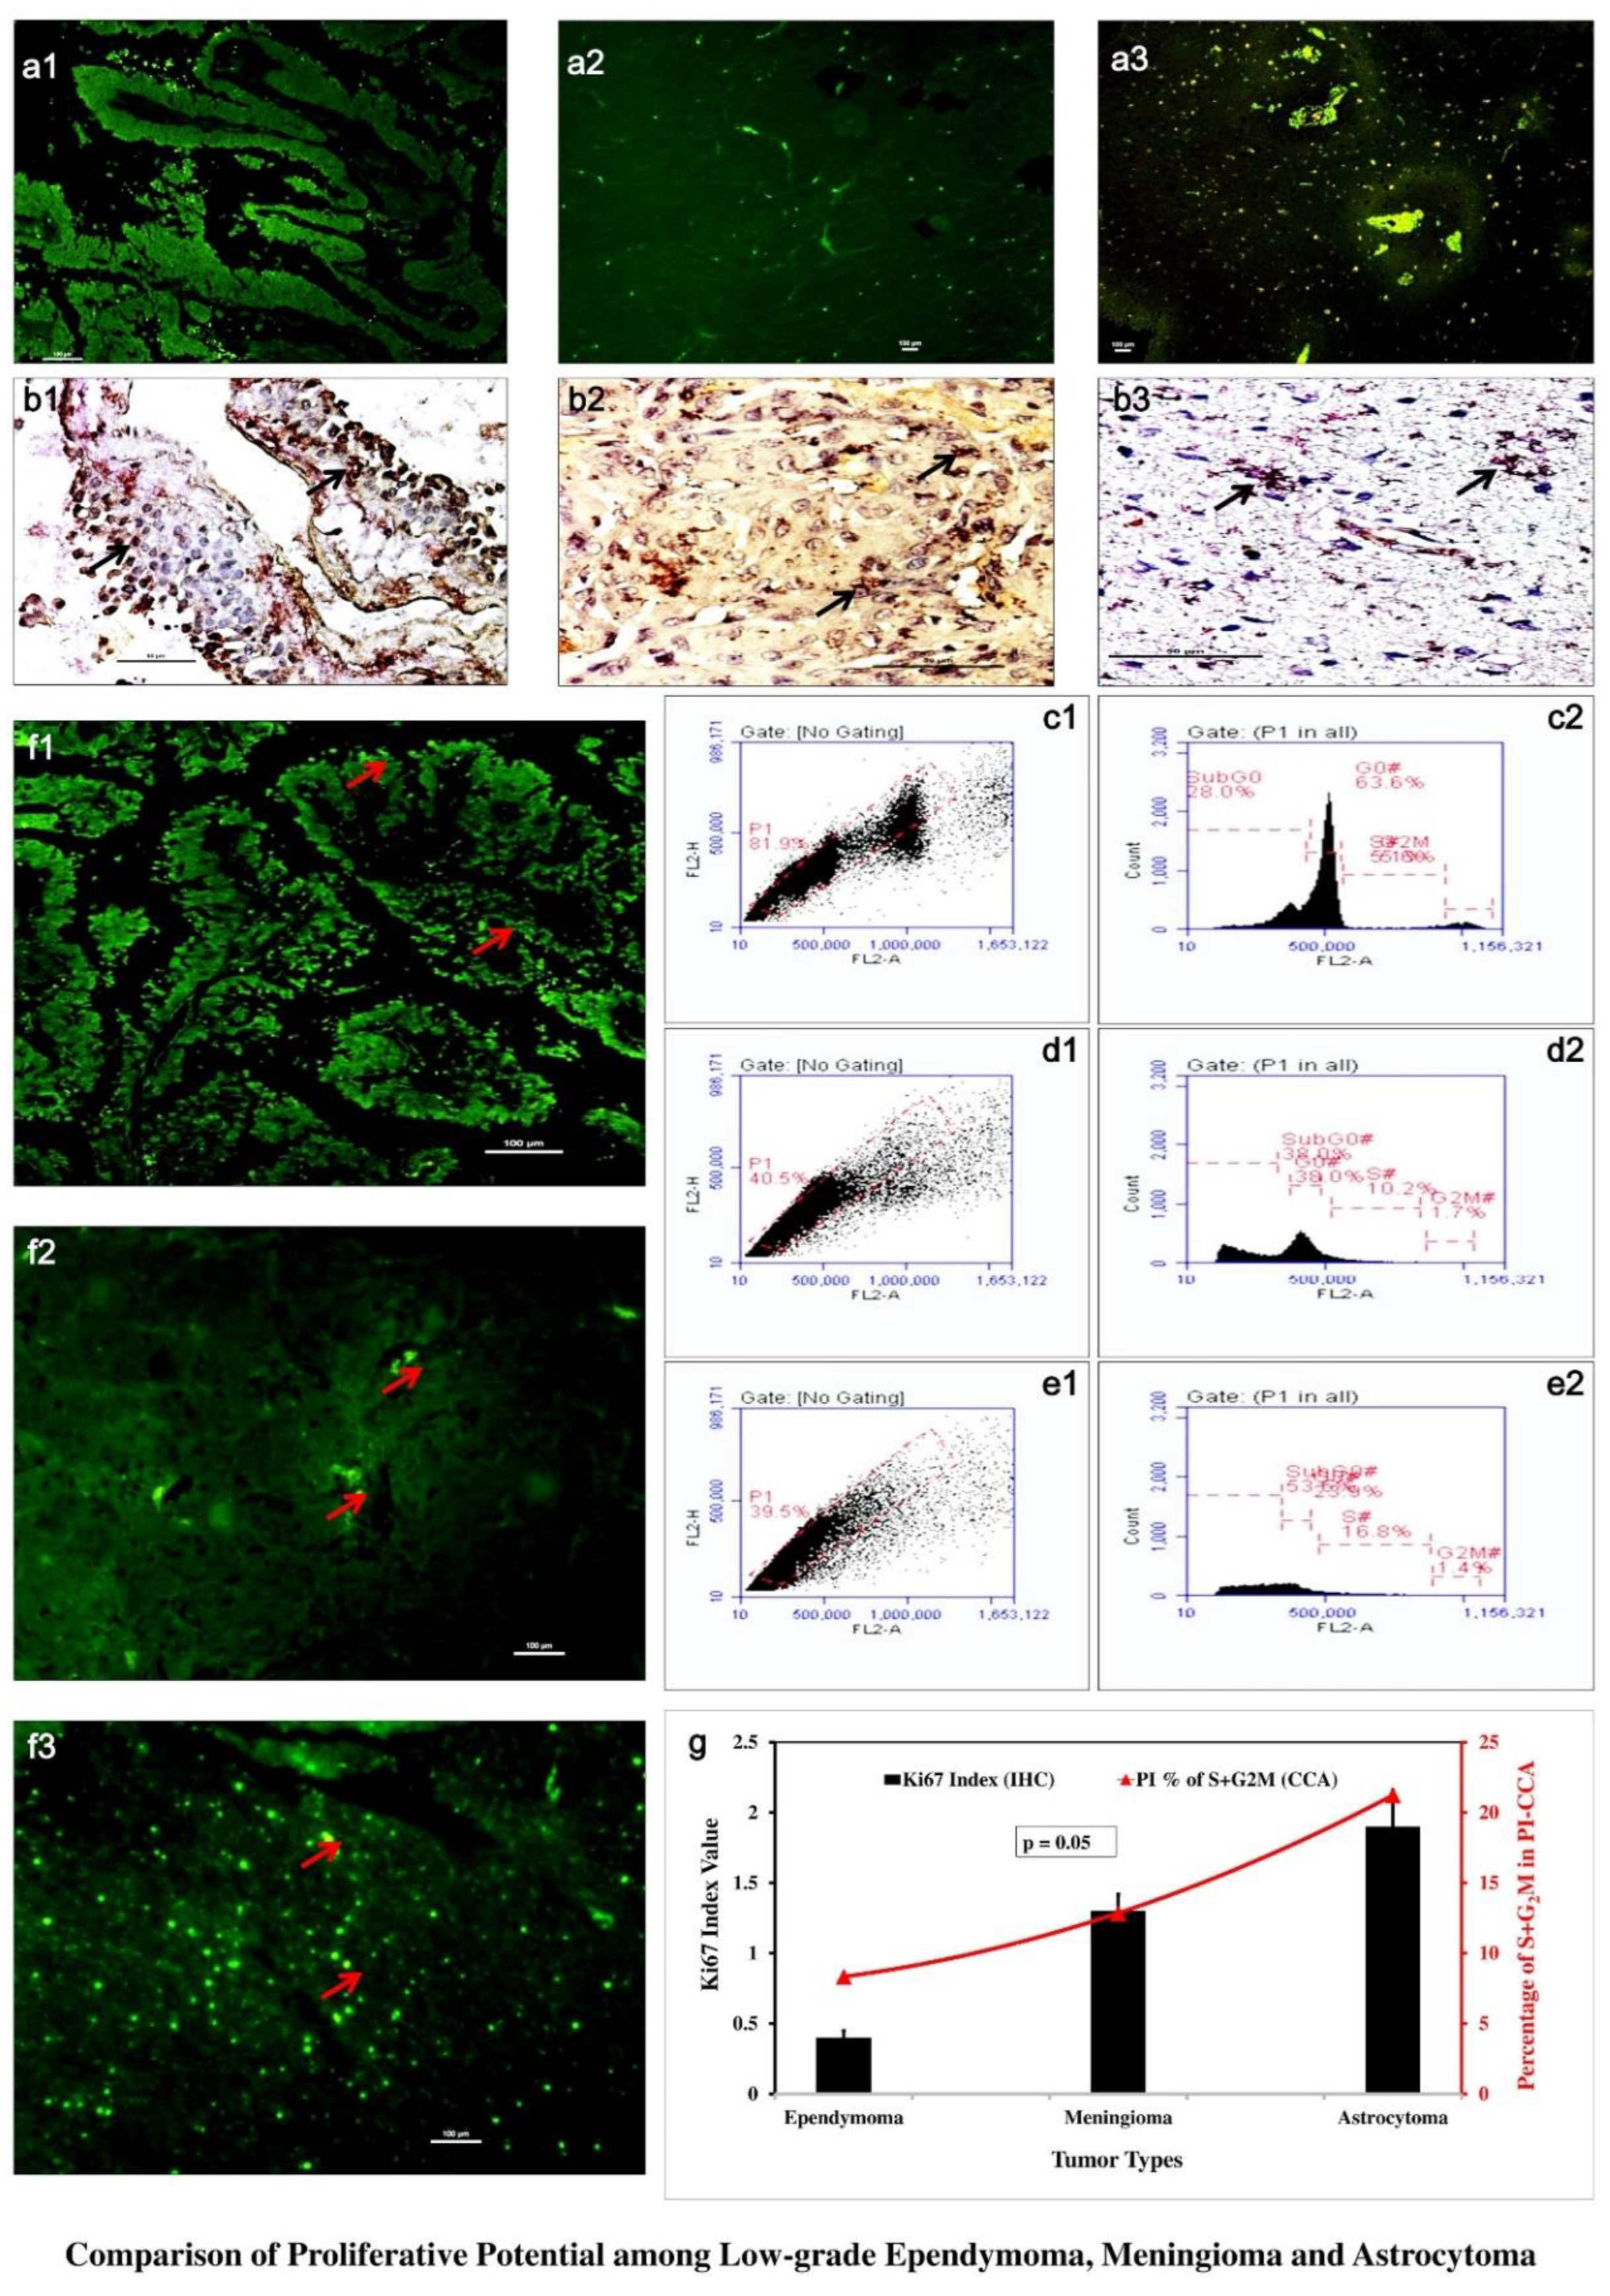
Figure 3.
IHC with total MMP2 in low-grade ependymoma (a1), low-grade meningioma (a2) and low-grade astrocytoma respectively (a3) in 100X magnification. Histogram of MMP2 expression from cultured cells in flow cytometry in low-grade ependymoma (b1), low-grade meningioma (b2) and low-grade astrocytoma (b3) (positive shifts were shown in blue). Graphical comparison of Median Fluorescence Intensity (MFI) of MMP2 in cultured cell among the three types of tumors (c). Comparison of neovascularization attributes among ependymoma (d1), meningioma (d2) and astrocytoma (d3) in 100X magnification in tissue IHC for VEGFR2. Comparison of epigenetic alterations using DNMT1 in IHC for ependymoma (e1), meningioma (e2) and astrocytoma (e3) respectively in 400X magnification.
Figure 3.
IHC with total MMP2 in low-grade ependymoma (a1), low-grade meningioma (a2) and low-grade astrocytoma respectively (a3) in 100X magnification. Histogram of MMP2 expression from cultured cells in flow cytometry in low-grade ependymoma (b1), low-grade meningioma (b2) and low-grade astrocytoma (b3) (positive shifts were shown in blue). Graphical comparison of Median Fluorescence Intensity (MFI) of MMP2 in cultured cell among the three types of tumors (c). Comparison of neovascularization attributes among ependymoma (d1), meningioma (d2) and astrocytoma (d3) in 100X magnification in tissue IHC for VEGFR2. Comparison of epigenetic alterations using DNMT1 in IHC for ependymoma (e1), meningioma (e2) and astrocytoma (e3) respectively in 400X magnification.
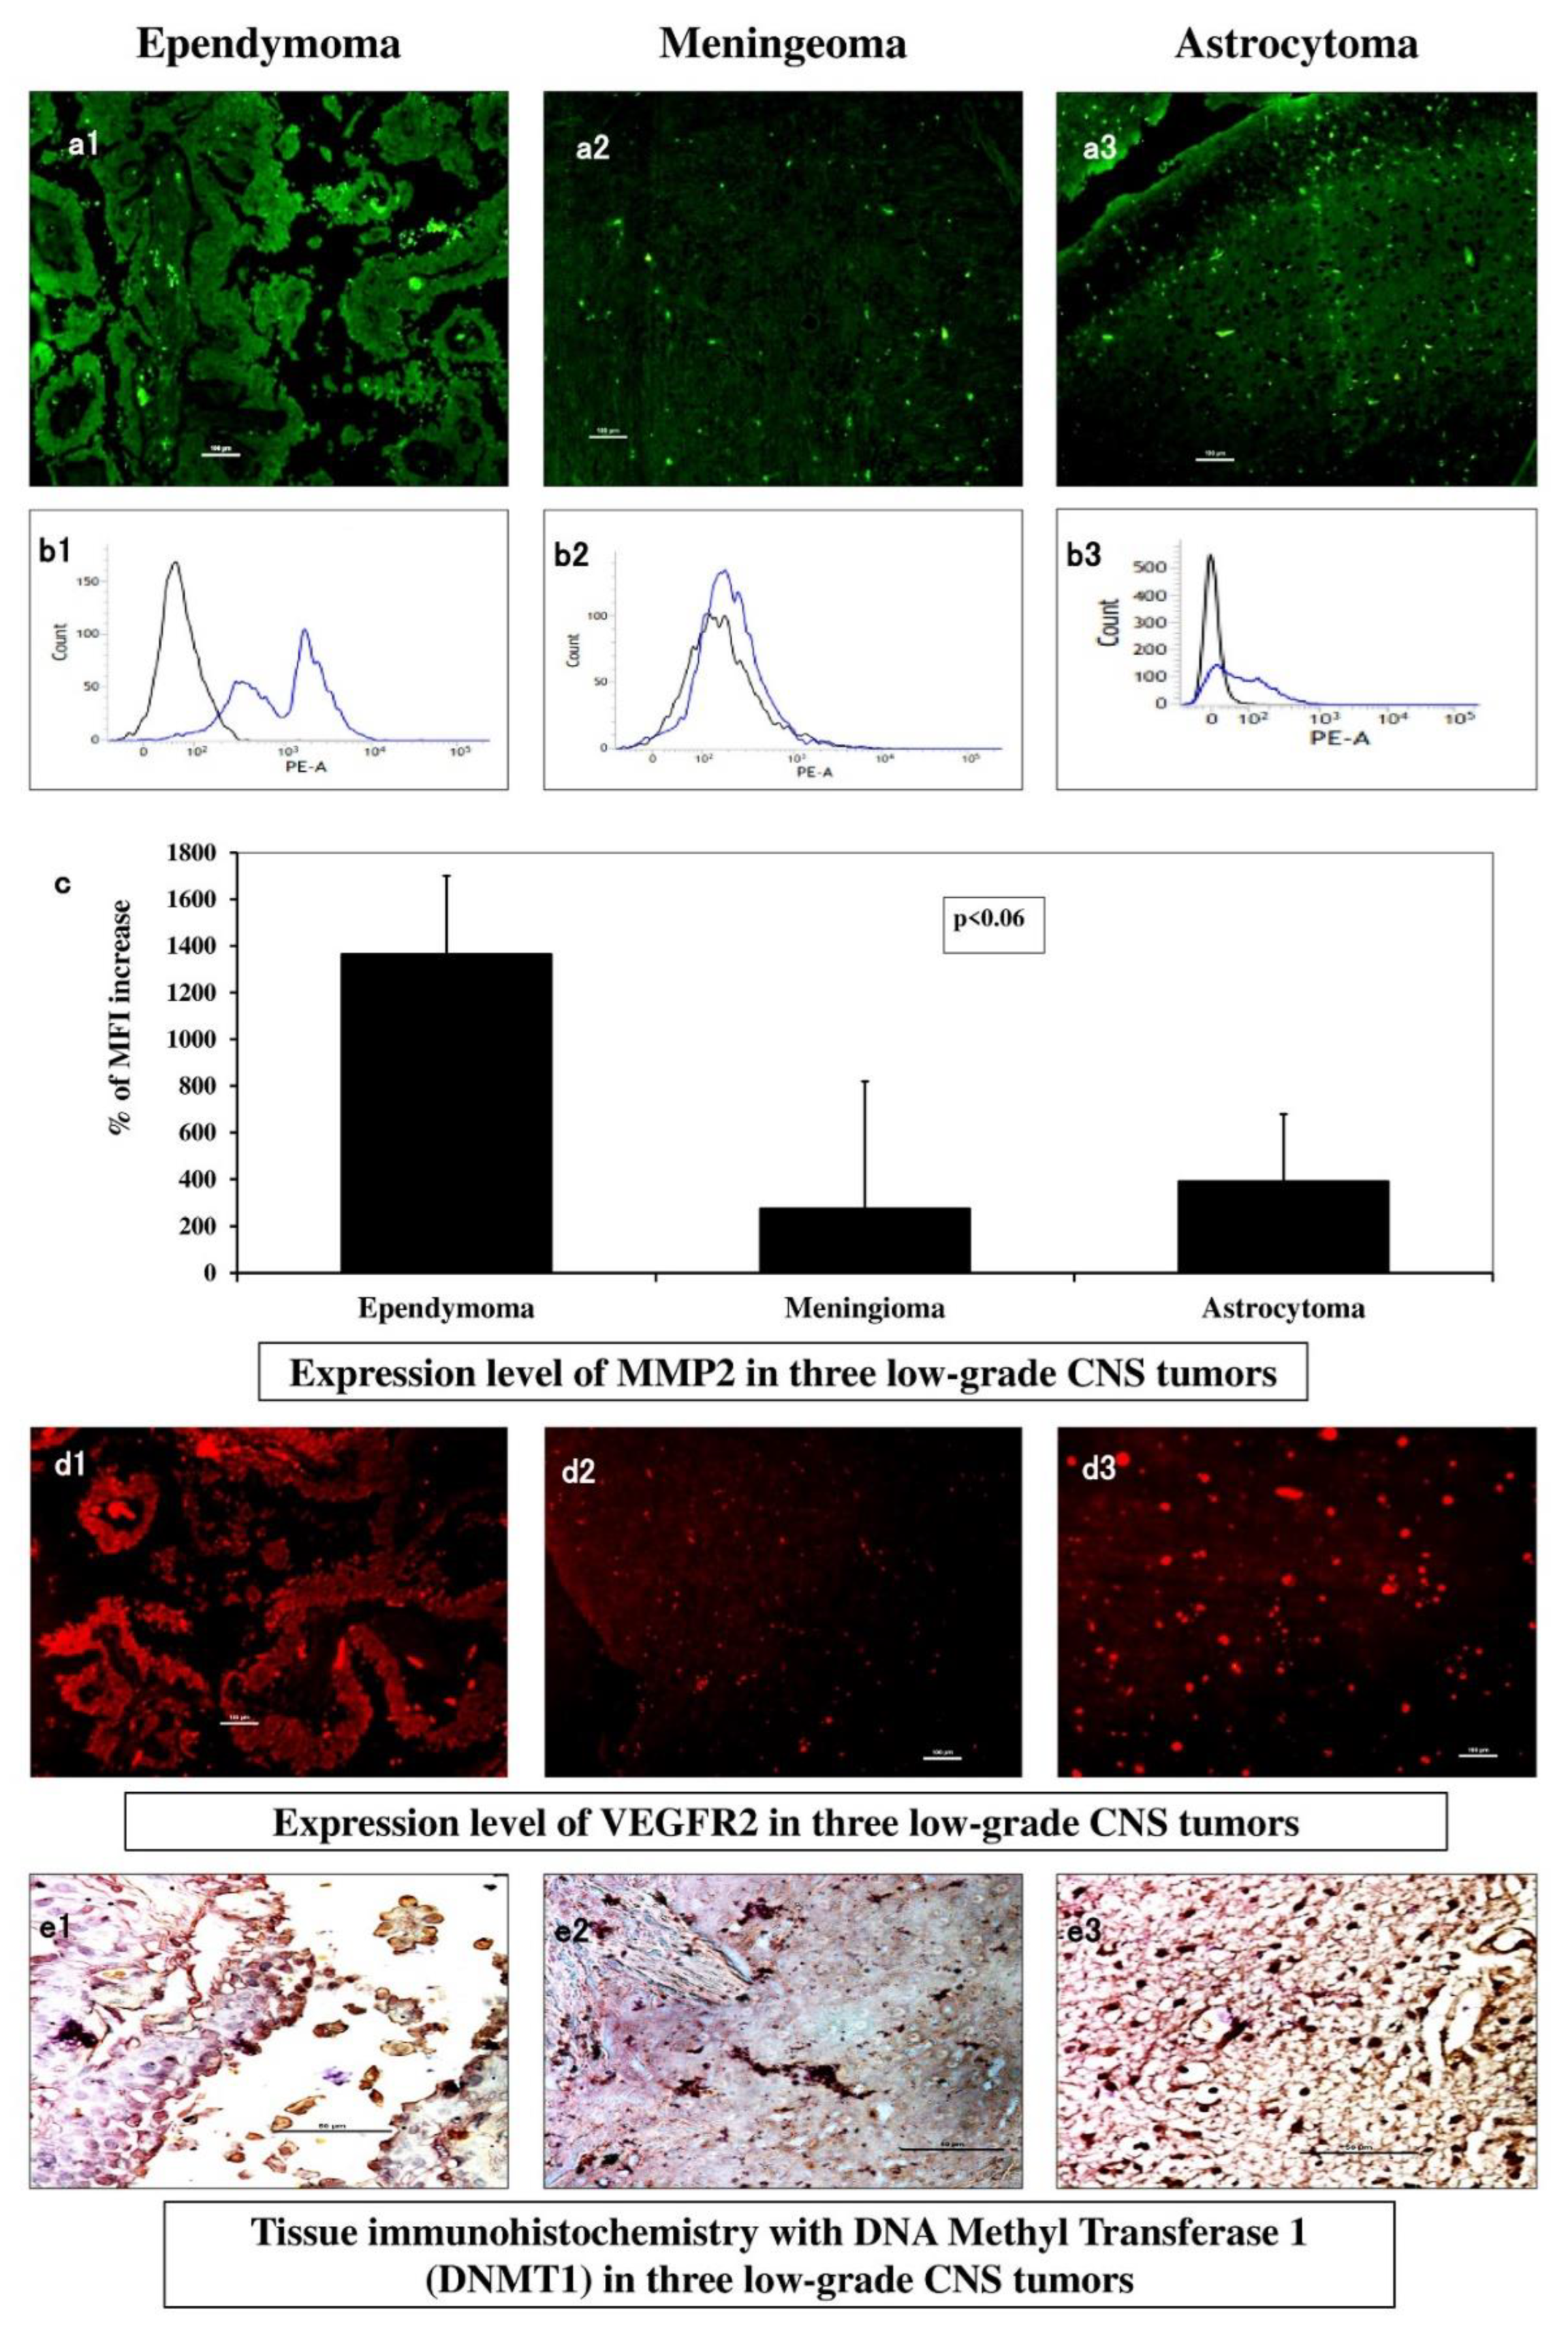
Figure 4.
Tissue sections treated with silver-gold (S/G) staining of ependymoma (a1 in 100X, a2 in 400X), meningioma (b1 in 100X; b2 in 400X) and astrocytoma (c1 in 100X; c2 in 400X). IHC with CD11b as macrophage marker and Iba1 as pan-microglial marker in ependymoma (a3 & a4 respectively; 100X), meningioma (b3 & b4 respectively; 100X) and astrocytoma (c3 & c4 respectively; 100X). Graphical comparison of SG positive cell index along with immunofluorescence intensity with CD11b & Iba1 (d).
Figure 4.
Tissue sections treated with silver-gold (S/G) staining of ependymoma (a1 in 100X, a2 in 400X), meningioma (b1 in 100X; b2 in 400X) and astrocytoma (c1 in 100X; c2 in 400X). IHC with CD11b as macrophage marker and Iba1 as pan-microglial marker in ependymoma (a3 & a4 respectively; 100X), meningioma (b3 & b4 respectively; 100X) and astrocytoma (c3 & c4 respectively; 100X). Graphical comparison of SG positive cell index along with immunofluorescence intensity with CD11b & Iba1 (d).
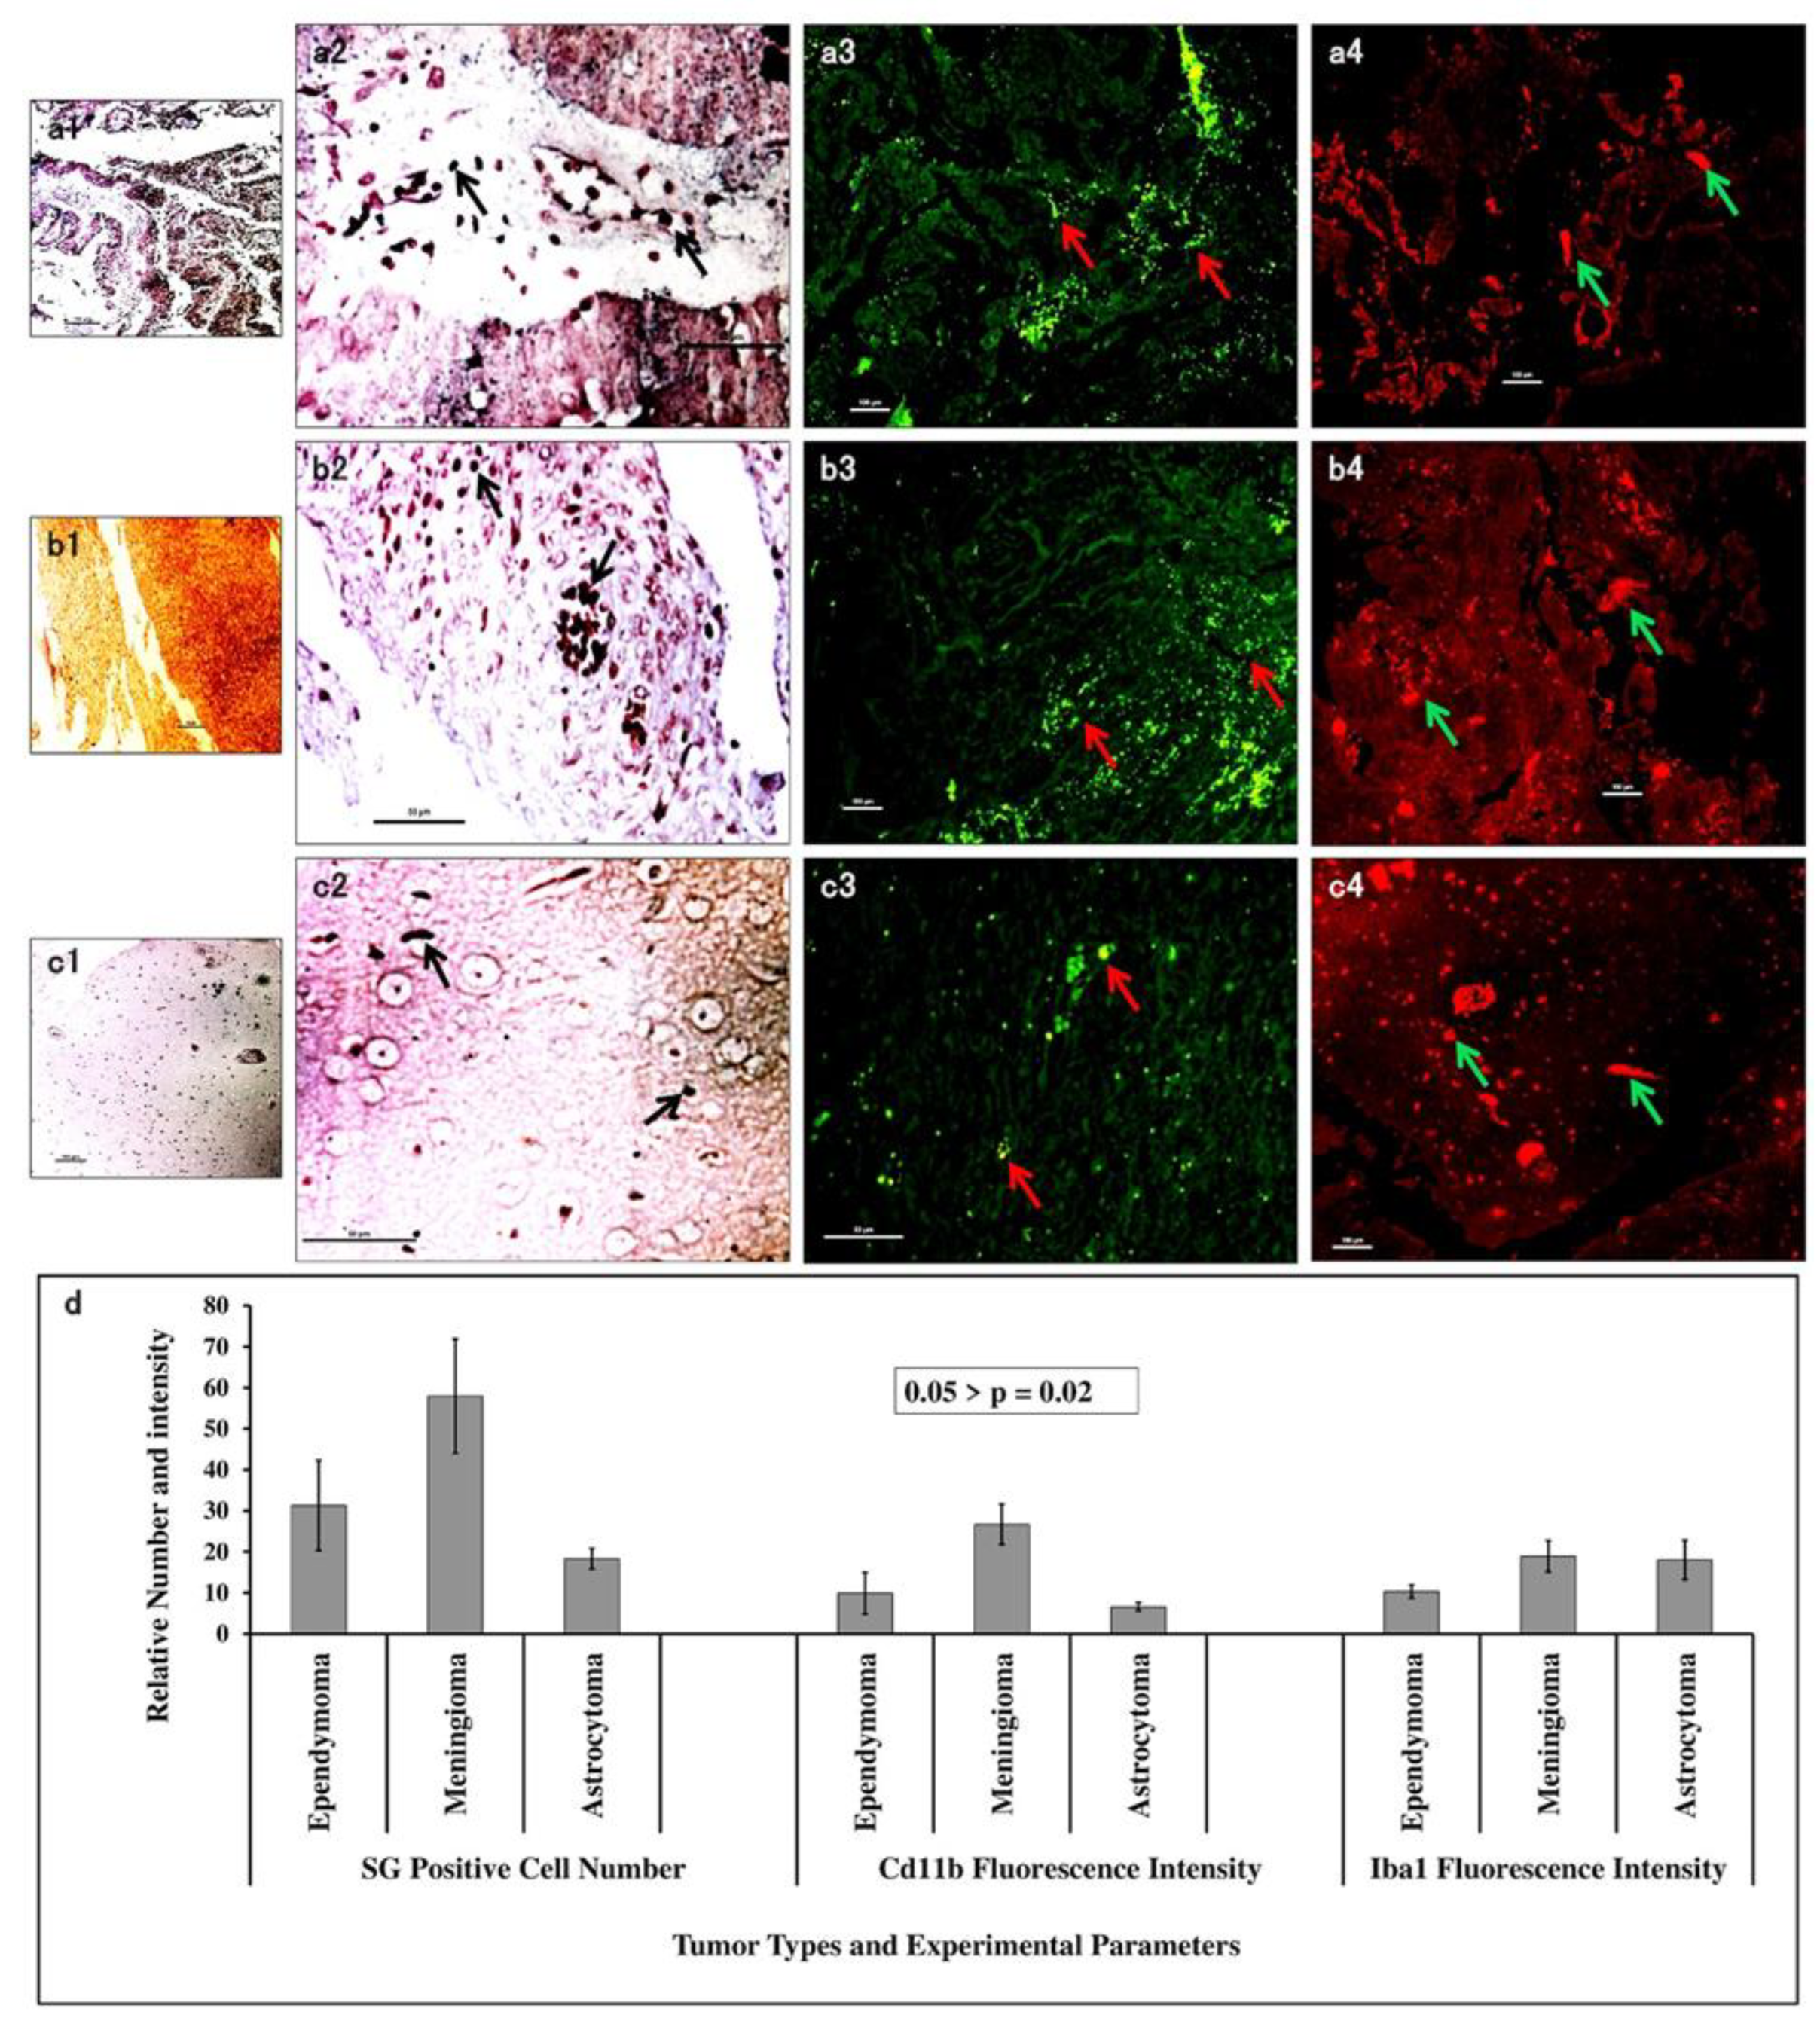

Table 1.
Summary of the comparative features of low-grade Ependymoma, Meningioma and Astrocytoma.
| Experimental Parameters | Defining Characteristics | WHO grade I Myxopapillary Ependymoma |
WHO grade I Fibrous Meningioma | WHO grade II Diffuse Astrocytoma |
|---|---|---|---|---|
| Site of Occurrence | Sub Region (as seen in MRI) | Extra dural, spinal, Involving spinal canal extending from L1-L5 | Extra cranial, mid line basifrontal region | Intracranial, left temporo-parietal region |
|
MRI |
T1 | Hypointense | Iso to hypointense | Hypointense |
| T2 | Overall iso to hyperintense | Iso to hyperintense | Markedly hyperintense | |
| Midline Shift | Mild to negligible | Mild | Vividly observed | |
| Mass Effect | Mild to negligible | Mild | Vividly observed | |
| MR Spectroscopy | Choline Peak | High | High | High |
| NAA Peak | Low | Very low | Low | |
|
Histopathology under Bright Field Microscopy |
H/E Staining (observed both in lower 10X and higher 40X magnification) | Lobulated islands, hyalinised fibrovascular core, perivascular pseudo-rosettes, lobulated blood islands, dystrophic micro-calcification | ‘Whorling’ inter crossing fascicles, vascular sprouting, dystrophic micro-calcification | Fibrillary astrocytic processes, pleomorphic nucleus, conspicuous neovascularization, dystrophic micro-calcification |
|
Astrocytic Glial Origin & Proliferation |
Fluorescence IHC with GFAP-Alexa Fluor 488 to measure expressional intensity | Moderate | Least | Maximum |
|
Gross Proliferation |
Proliferative index by IHC with Ki67-HRP + Haematoxylin counter staining | Minimum (index value 0.4±0.05) | Intermediate (index value 1.3±0.12) | Maximum (index value 1.9±0.26) |
| Tissue cell cycle analysis with PI | Total percentage of S+G2M is minimum (8.30%±0.02) | Total percentage of S+G2M is intermediate (12.80%±0.02) | Total percentage of S+G2M is maximum (21.20%±0.02) | |
| Fluorescence IHC with Ki67-FITC to measure expressional intensity | Minimum | Intermediate | Maximum | |
| Angiogenic Switching or Neovascularization | Fluorescence IHC with VEGFR2-TRITC to measure level of angiogenic receptor expression | Clustered/Patchy | Lowest | Highest |
| Metastatic Nature or Invasiveness | Cellular FC with MMP2-PE(MFI) | Highest | Intermediate | Lowest |
| Fluorescence IHC with MMP2-FITC | Regional intense expression | Low scattered expression | Diffused moderate expression | |
|
Association of Mononuclear Monocytic Lineage Immune Cells |
S/G staining on fixed tissue (positive cells) | Moderate (31±11) | Highest (58±13.9) | Lowest (18±2.5) |
| Fluorescence IHC with CD11b-FITC (intensity profiling) | Moderate (9.9±5.1) | Highest (26.7±4.9) | Lowest (6.6±1) | |
| Fluorescence IHC with Iba1-PE (intensity profiling) | Lowest (10.3±1.6) | Highest (18.9±3.8) | Moderate (18±4.8) | |
|
Epigenetic Alteration |
Global methylation pattern detection by IHC with DNMT1-HRP + Haematoxylin counter staining | Scarce | Patchy and moderate | Diffuse but intense |
Disclaimer/Publisher’s Note: The statements, opinions and data contained in all publications are solely those of the individual author(s) and contributor(s) and not of MDPI and/or the editor(s). MDPI and/or the editor(s) disclaim responsibility for any injury to people or property resulting from any ideas, methods, instructions or products referred to in the content. |
© 2025 by the authors. Licensee MDPI, Basel, Switzerland. This article is an open access article distributed under the terms and conditions of the Creative Commons Attribution (CC BY) license (https://creativecommons.org/licenses/by/4.0/).
Copyright: This open access article is published under a Creative Commons CC BY 4.0 license, which permit the free download, distribution, and reuse, provided that the author and preprint are cited in any reuse.


