
Submitted:
26 March 2025
Posted:
26 March 2025
You are already at the latest version
Abstract
The novel copper oxide CuO0.75 has been prepared by slow oxidation of Cu2O. The compound retains the original crystallographic structure of tenorite CuO, despite considerable presence of disordered oxygen vacancies. The CuO0.75 resembles mixed valence oxide Cu2+/Cu1+, while the unit cell contains one oxygen vacancy. Performance-wise, the electric resistivity and magnetic susceptibility data follow the Anderson-Mott localization theories. Exponential localization decay rate was found to be a –1 = 2.1 nm, in line with modern scaling theories. Magnetic double exchange interaction, mediated by oxygen vacancies, results, by cooling, in Zener conductivity at T~122 K, which is followed by antiferromagnetic transition at T~ 51 K. The obtained results indicate, the CuO0.75 compound can be perceived as showcase material for demonstration of new class of high performance paramagnetic materials.
Keywords:
localization
; scaling
; oxygen defect tenorite
; Mott T-1/4 law
; metal-insulator transition
1. Introduction
On the eve of localization theories in disordered systems Landauer [1] put forward the systematic calculation of the electric conductivity of metals containing point defects and derived an equation σ = e2/h·[ΣTi]; summation is extended over scattering obstacles. Equation is widely used in semiconducting nanostructures, and pre-factor is named Landauer quantum conductance entering in various localization theories, quantum Hall effect, and symbolizes a way toward more universality in the solid state research.
The groundbreaking progress on localization in disordered systems, followed by Anderson [2] and Mott [3], triggered a further tremendous search for universality of magnetic and electric properties in solid state physics, optics, etc. The quantum mechanical functions in localized systems are confined in a finite region and they decay exponentially at higher distances. The localization phenomena cover various materials [4,5] and optics [6-8]. Experimental data, however, derived from the real objects are scarce and dominantly restricted to the resistive measurements [9,10], while accompanied magnetic effects, superposed to resistivity data are rare to trace in the scientific literature.
This paper aims to describe the preparation of the novel copper oxide CuO0.75, indicated by disordered oxygen vacancies, while the X-ray diffraction data stress out maintaining the original structure of the tenorite CuO. In addition to the resistivity, CuO0.75 displays an interesting set of magnetic effects, which start by cooling from T~122 K and are followed by antiferromagnetic transition at T~51 K. In the next step, the experimental data will be discussed in terms of Mott and Anderson theories, as well as, modern scaling models. However, difficulties arise from the fact that theories and models dominantly deal with metals, while CuO0.75 is non-metal indicated by a huge dielectric permittivity ε ~ 1.3·103, evaluated independently in these experiments.
2. Experimental
Oxygen defect form CuO0.75 was produced from the powdered cuprous oxide Cu2O of the particle size 0.5 microns and heated at 388 K in 4 bars oxygen atmosphere. Prior to reaction the powder was heated in vacuum at 423 K in order to remove the traces of gases: like moisture, CO2 and SO2. The slow reaction was monitored during 10 – 12 days by use of the pressure gauge and terminated when oxygen pressure was reduced to the value indicating the necessary stoichiometry CuO0.75. The final product was raw and very hard cluster. Oxygen content was additionally verified by decomposition in 2 bar H2 atmosphere at 673 K.
The powder obtained by subsequent reground of the raw cluster (R-sample) was pressed into pellets of 8 mm in diameter and d=0.9 mm thickness. In order to measure the four probes electric resistance, the 100 microns gold wires were pressed together with powder. Raw CuO0.75 is an insulator, but it was observed that conductance may be induced by applied DC current starting with 1 µA and gradually increasing up to 1.5 mA during repeated annealing-cooling cycles (DC-samples) in argon atmosphere. Annealing temperature was 908 K, while the final conductivity of DC samples at room temperature (RT) saturated at 0.08–1.25·10–2 Ω–1m–1. It may be a tedious work to explain this interesting phenomenon in terms conventional chemical and metallurgical methodology. More recent findings [11,12] may provide some introductory ideas and hints on possible stimulation of disorder and corresponding increase of the conductivity by use of the conducting currents.
3. Results
Copper oxide CuO is narrow band p-type semiconductor and crystallographic unit cell belongs to the monoclinic group C2/c with cell dimensions a = 0.4683 nm, b = 0.3421 nm, c = 0.5129 nm; α = 90°, β = 90°, γ = 99.784 °. Unit cell contains 4 units formulas, and density is ρ= 5.94 g·cm–3, while the oxygen defect form CuO0.75 exhibits ρ=5.64 g·cm–3. Due to one oxygen vacancy per unit cell, CuO0.75 is expected to be a mixed valence oxide with equal number of Cu2+ and Cu+ cations. In this respect, CuO0.75 resembles the copper oxide Cu4O3, known as paramelaconite, with the structure indicating CuO2 chains along c-axis [13]. Pinsard-Gaudart and co-workers reported [14] the antiferromagnetic transition in Cu4O3 at 42 K.XRD data of CuO0.75 are shown in Figure 1.
High resolution measurements of AC susceptibility were performed on R- and DC-samples by use of Cryobind susceptometer, and real and imaginary parts are shown in Figure 2. Samples exhibit a surprising temperature dependence of the susceptibility, and several effects are included. By heating to RT, the magnetic susceptibility reveals three features. At T = 51 K, both DC- and R-samples, undergo an antiferromagnetic transition. The next feature appears in DC sample at T = 101 K, while at TC = 122 K, DC-sample resembles the paramagnetic transition. Both cited transitions are absent in the raw R-sample. At T > 122 K DC sample obeys the Stoner expression χ= χp / [1 – U·N(EF)], while the quantities χp, U and N(EF) are in the respective order; Pauli susceptibility, Coulomb repulsion energy U(Joule·m3) and density of states (DOS) on the Fermi surface. The Pauli susceptibility χP and DOS were evaluated from the inverse susceptibility 1/χ plotted versus 1/T. Horizontal dashed line reflects a contribution of the Pauli susceptibility and foreign ingredients; the latter must be subtracted, after an independent measurement on non-reacted Cu2O. Dimensionless Pauli susceptibility is χp=2.9·10–6, while DOS was calculated [15] from χp = μ0·μB2·N(EF), giving N(EF) = 2.8·1046 Joule–1·m–3. The Fermi energy EF was separately derived from number of states n = 1/V0 = 2.4·1028 m–3, and V0 means the volume of the crystallographic unit cell. Fermi wave number is given as kF = (3π2·n)1/3, and EF = 3.3 eV.
Figure 3 presents the resistance of DC-sample measured by cooling and heating in the range 415 – 80 K. It is evident the linear dependence of lnR on T – 1/4 down to TC = 122 K, when strong linear increase converts in stagnation, which is followed by the sharp downturn at T =101 K. Linear dependence of lnR on T–1/4 is the characteristic behavior of the disordered 3 dimensional (3D) system indicated by localization of the electronic states. Anderson put forward that, in disordered systems, diffusion theories of the conductivity must be replaced by models based upon quantum jumps between the localized states. Continuing upon such a course, Mott developed theory17 of the variable range hopping, and logarithm of the resistivity was derived as
where 1/α and R are localization length and hopping range respectively. This expression was fitted to the measured dependence lnR on T–1/4 in the temperature interval 122 – 415 K when metallic state sets up by further heating. An evaluation of the localization length gives α–1= 2.1·10–9 m, while the variable range length at T =122 K is R = 2.3·10–9 m. R decreases slowly by heating, and Mott expression of the level spacing between two states reads Δ=α3/N (EF)~18.8meV.
lnρ=2αR+ 1/(4απ/3)kBTR3N(EF) R = [αkBTN(EF)]–1/4
Measured electric conductance of CuO0.75 at T= 415 K was G0= 1.5·10–2Ω–1, and evaluated conductivity is σ0 = 0.17 Ω–1·cm–1.When this value should be compared to Mott minimum metallic conductivity σmin= π2·e2/8·z·h·c [ref.16, p.31], it must be encountered the dielectric permittivity of CuO0.75, ε = 1.3·103 in the temperature interval 100 – 415 K. The renormalized value reads σ = ε·σ0 ~ 221 Ω–1cm–1, and it is comparable to the Mott value σmin= 300 Ω–1·cm–1. In further calculations we replace lattice parameter c by α-1 distant localized scatters.
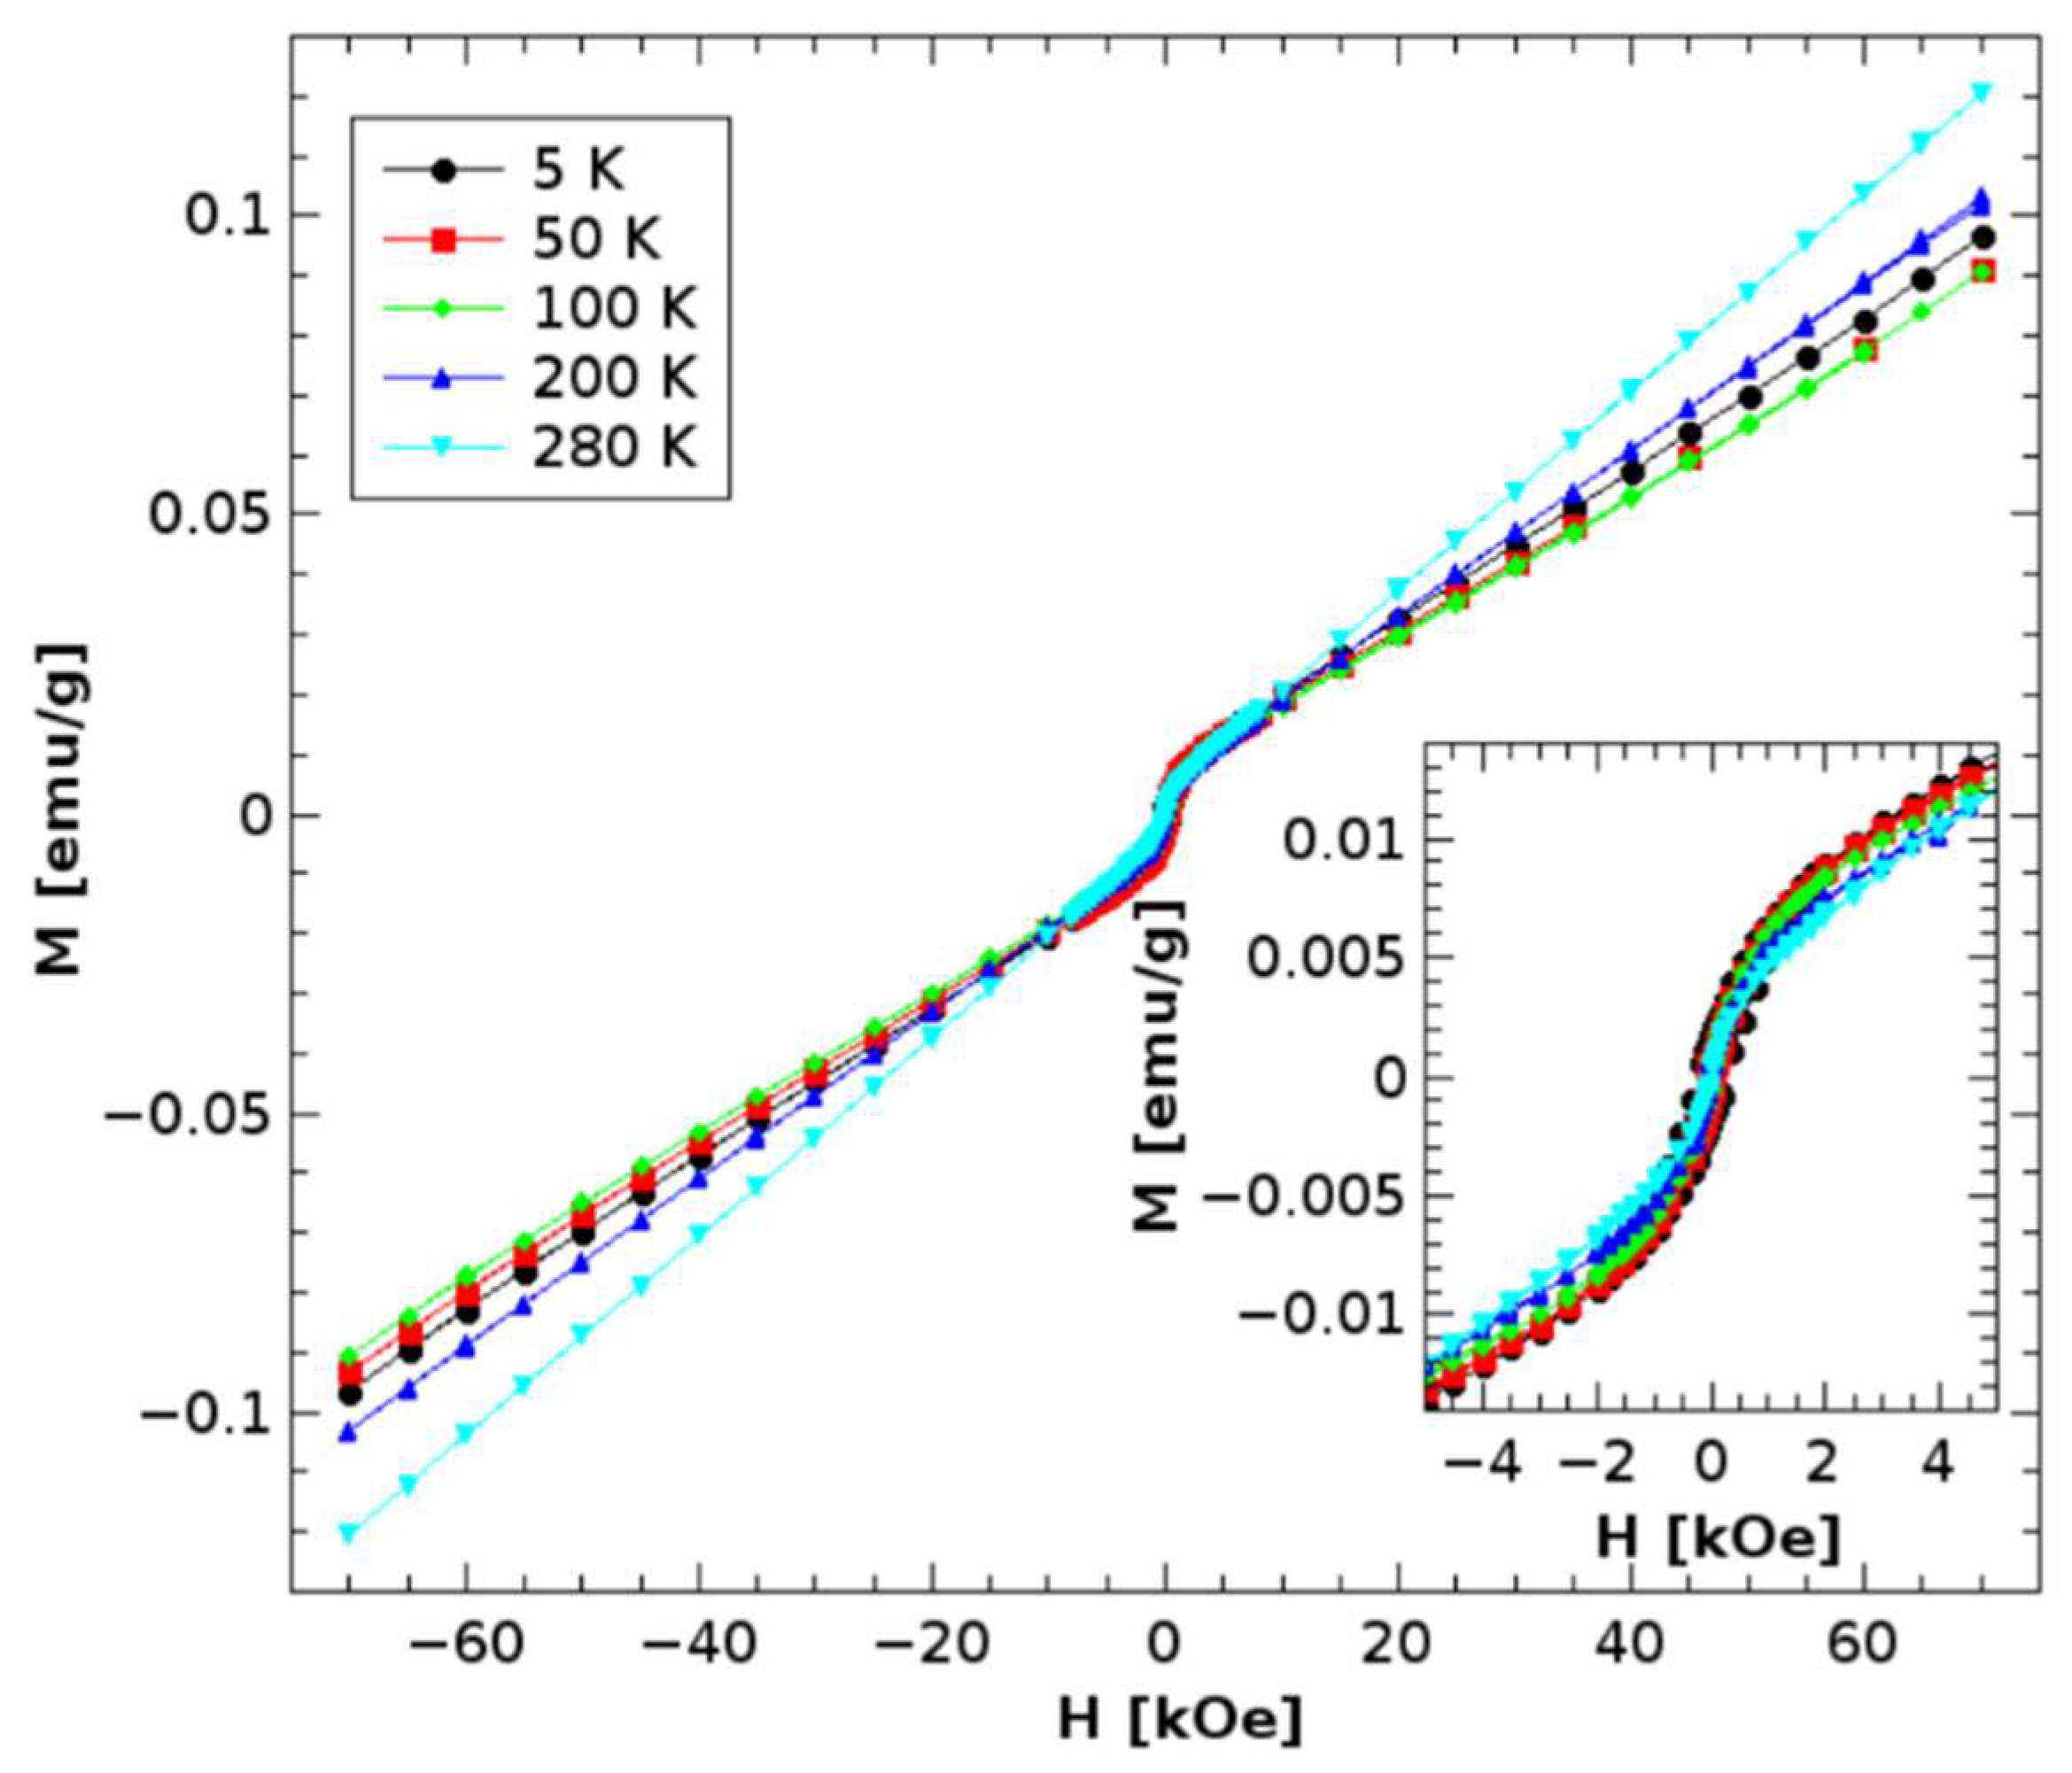
The measurements of hysteresis performed by use of SQUID, are presented in Figure 4. Measurements of magnetization, dependent on magnetic field at various stable temperatures, sound for antiferromagnetic state below 50 K. Bending of hysteresis around small fields could originate from superparamagnetism of nano-clusters, which may reflect the localized states bound to distinct regions.
4. Discussion
Pinsard-Gaudart and co-workers calculated in paramelaconite Cu4O3 the magnetic double-exchange interaction E = 48,3 K between nearest neighbor Cu2+ cations Cu2+–O–Cu2+ (NN). Such a mechanism may also be certain in CuO0.75, with oxygen vacancies involved in double-exchange Cu2+–Vo–Cu2+ or Cu2+–Vo–Cu+. In support, Gao and co-workers [17] reported a weak ferromagnetism mediated by oxygen vacancies in CuO nanoparticles.
Downturn of the resistance in CuO0.75 below 122 K may be explained by Zener model of the magnetic double exchange conductivity. Model was originally applied to the resistance [18] properties of strontium doped manganite (La1-xSrx)MnO3. An exchange is favored by the polarization of the hopping electrons between aligned cation spins Mn4+–O–Mn3+, which, in turn, enhances the electric conductance and the magnetization due to the itinerant electron contribution. Zener evaluated the electric conductance GZ =x·e2E/h·kBT. E and x are exchange energy and fraction of ions involved in the exchange respectively. GZ may compete the resistance divergence T–1/4 in CuO0.75 at T < 122 K giving rise to a possible two fluid conductance. Calculated Zener conductivity reads σZ ~ 380 Ω-1·cm-1, while relative dielectric permittivity is absent in the evaluation.
Thouless [19] introduced dimensionless conductance g=G·h/e2. However, the ratio of the measured and Landauer conductance is impractical for testing the scaling theories by experiment, since measured conductance G is dependent on the sample thickness d, as being no uniquely defined parameter. We introduce dimensionless conductivity g = ε·α−1·G·h/d·e2, and g gives Thouless energy ET =g·Δ. Δ = 18.8 meV is the, above evaluated, level spacing, and from the resistance at T =415 K, Thouless energy reads ET = 9.8 meV giving TC=132 K, which should be compared to transition temperature T = 122 K. Thouless energy and corresponding temperature mark the melting of the localized to extended states, while, upon heating, the T–1/4 regime starts at temperature T= 122 K, and extends up to 415 K.
In the next step, an attempt is presented to compare the resistance data to scaling model put forward by Abrahams and co-workers (AALR) [20]. The problem arises to define the universal scaling length L based on given experimental data. The choice proposed by AALR is the mean free path l, although l is doubtful because of strong dependence on temperature. Following a search for common points of AALR model, Mott theory and our experimental data, we introduce localization decay L=α–1 as a scaling length, since it is independent of temperature. AALR theory introduces parameter β=d(lng)/d(lnL) indicating β = 0 at the metal-insulator transition. The comparatively easy calculation, for the case CuO0.75, starts with an elimination of the temperature in Equation (1), which gives the dimensionless conductivity g =(ε·α-1·h·σ0/e2)·exp–αR[2 + ¾π]. This expression matches the AALR result for 3D system, and little more algebra results in β = lng, giving β= 0 for g = 1, means that metal-insulator transition may be expected when the renormalized conductivity ε·αo approaches the Landauer quantum conductivity e2·α/h proceeded between two localized points distant α-1. In the case CuO0.75 this happens at T~ 415 K, when exp(T0 /T)1/4 regime starts by cooling.
5. Conclusions
In conclusion, a novel copper oxide CuO0.75 was prepared. It is indicated by one oxygen vacancy per unit cell and exhibits the crystallographic structure of a tenorite CuO. In the interval 122 – 415 K, electric resistance is temperature dependent according to the Mott law exp[(T0/T)1/4]. Anderson theory of localization and Mott theory of variable hopping were successfully applied, and characteristic length of exponential decay of the localized state was evaluated α–1= 2.1 nm, while variable hopping range is R=2.3·10–9 m at T =122 K. It has been shown that Mott’s concept of minimum conductivity in metals σmin may be extended to nonmetal CuO0.75, giving rise to a possible universal physical constant. In addition, σmin has been evaluated by taking in account a calculated [21] ratio of critical localization potential and band width Vcrit/B = 2, confirming this result as to be correct. Dimensionless Thouless conductivity g was calculated and corresponding Thouless energy ET, converted to temperature, gives T~142 K. In order to apply scaling theory of Abrahams and co-workers (AALR), L =α–1 is chosen as a scaling length, while β function reads β= lng. At T = 122 K magnetic measurements reveal the transition to a double exchange interaction indicated by Zener conductivity, which is comparable to the Mott conductivity σmin. CuO0.75 undergoes an antiferromagnetic transition at 51 K.
Acknowledgments
Authors re indebted to Dr Ivan Djurek and Tihomir Krajnik for technical assistance.
References
- Landauer, R. Spatial Variation of Currents and Fields Due to Localized Scatters in Metallic conduction. IBM Journal of Research and development, 1 (3), 223-231 (1957). [CrossRef]
- Anderson, P,W. Absence of Diffusion in Certain Random Lattices. Phys. Rev.109,1492-1505 (1958). [CrossRef]
- Mott, N, F. Conduction in non-crystalline systems, Phil. Mag. 19, 835-852 (1969).
- Hu, H.A. et al. Localization of ultrasound in a three-dimensional elastic network. Nat. Phys. 4, 945-948 (2008). [CrossRef]
- Chabanov, A.A.et al. Statistical signatures of photon localization, Nature. 404, 850-853 (2000). [CrossRef]
- John, S. Electromagnetic Absorption in a Disordered Medium near a Photon Mobility Edge, Phys. Rev. Lett. 53, 2169-2174 (1984). [CrossRef]
- Wiersma, D.S.et al. Localization of light in a disordered medium, Nature. 390, 671-673 (1997). [CrossRef]
- Bücker,W. Preparation and dc conductivity of an amorphous organic semiconducting system, Journal of Non-Crystalline Solids. 12,115-128 (1973). [CrossRef]
- Allen, F, R. & Adkins, C. J. Electrical Conduction in Heavily Doped Germanium, Phil.Mag. 26, 1027-1042 (1972). [CrossRef]
- Norwood, T.E. & Fry, J.L. Energy Bands of VO. Phys. Rev. B2, 472-485 (1970).
- Vojta, Th. et al. Infinite-randomness quantum critical point induced by dissipation. Phys.Rev. B79, 024401 (2009).
- Chávez, Nahum C. et al. Disorder-Enhanced and Disorder-Independent Transport with Long-Range Hopping: Application to Molecular Chains in Optical Cavities. Phys. Rev. Lett. 126,153201 (2021). [CrossRef]
- O’Keeffe, M. & Bovin, J.-O. The crystal structure of paramelaconite Cu4O3. Am. Mineral. 63,180-185 (1978).
- Pinsard-Gaudart, L. et al. Magnetic properties of paramelaconite (Cu4O3): A pyrochlore lattice with S = ½, Phys. Rev.B 69, 104408, 1-9 (2004).
- Aschcroft, N.W. & Mermin, N.D. Solid State Physics, Harcourt College Publisher, p. 663.(1976).
- Sir Nevill Mott. Metal-Insulator Transitions, Taylor & Francis, London. p.36 (1974).
- Gao, D. et al. Vacancy-Mediated Magnetism in Pure Copper Oxide Nanoparticles. Nanoscale Res. Lett. 5, 769-772 (2010). [CrossRef]
- Zener, C. Interaction between the d-Shells in the Transition Metals. II. Ferromagnetic Compounds of Manganese with Perovskite Structure. Phas.Rev.82 (3), 403-405 (1951). [CrossRef]
- Thouless, D.J. Electrons in Disordered Systems and the Theory of Localization. Physics Reports.13(3),93-142 (1974). [CrossRef]
- Abrahams, E. et al. Scaling Theory of Localization: Absence of Quantum Diffusion in Two Dimensions. Phys.Rev. Lett. 42(10), 673-676 (1979). [CrossRef]
- Edwards, J.T. & Thouless, D.J. Numerical studies of localization in disordered systems, J. Phys. C: Solid State Phys. 5, 807-2022 (1972). [CrossRef]
Figure 1.
X-ray diffraction analysis of the copper oxide sample.
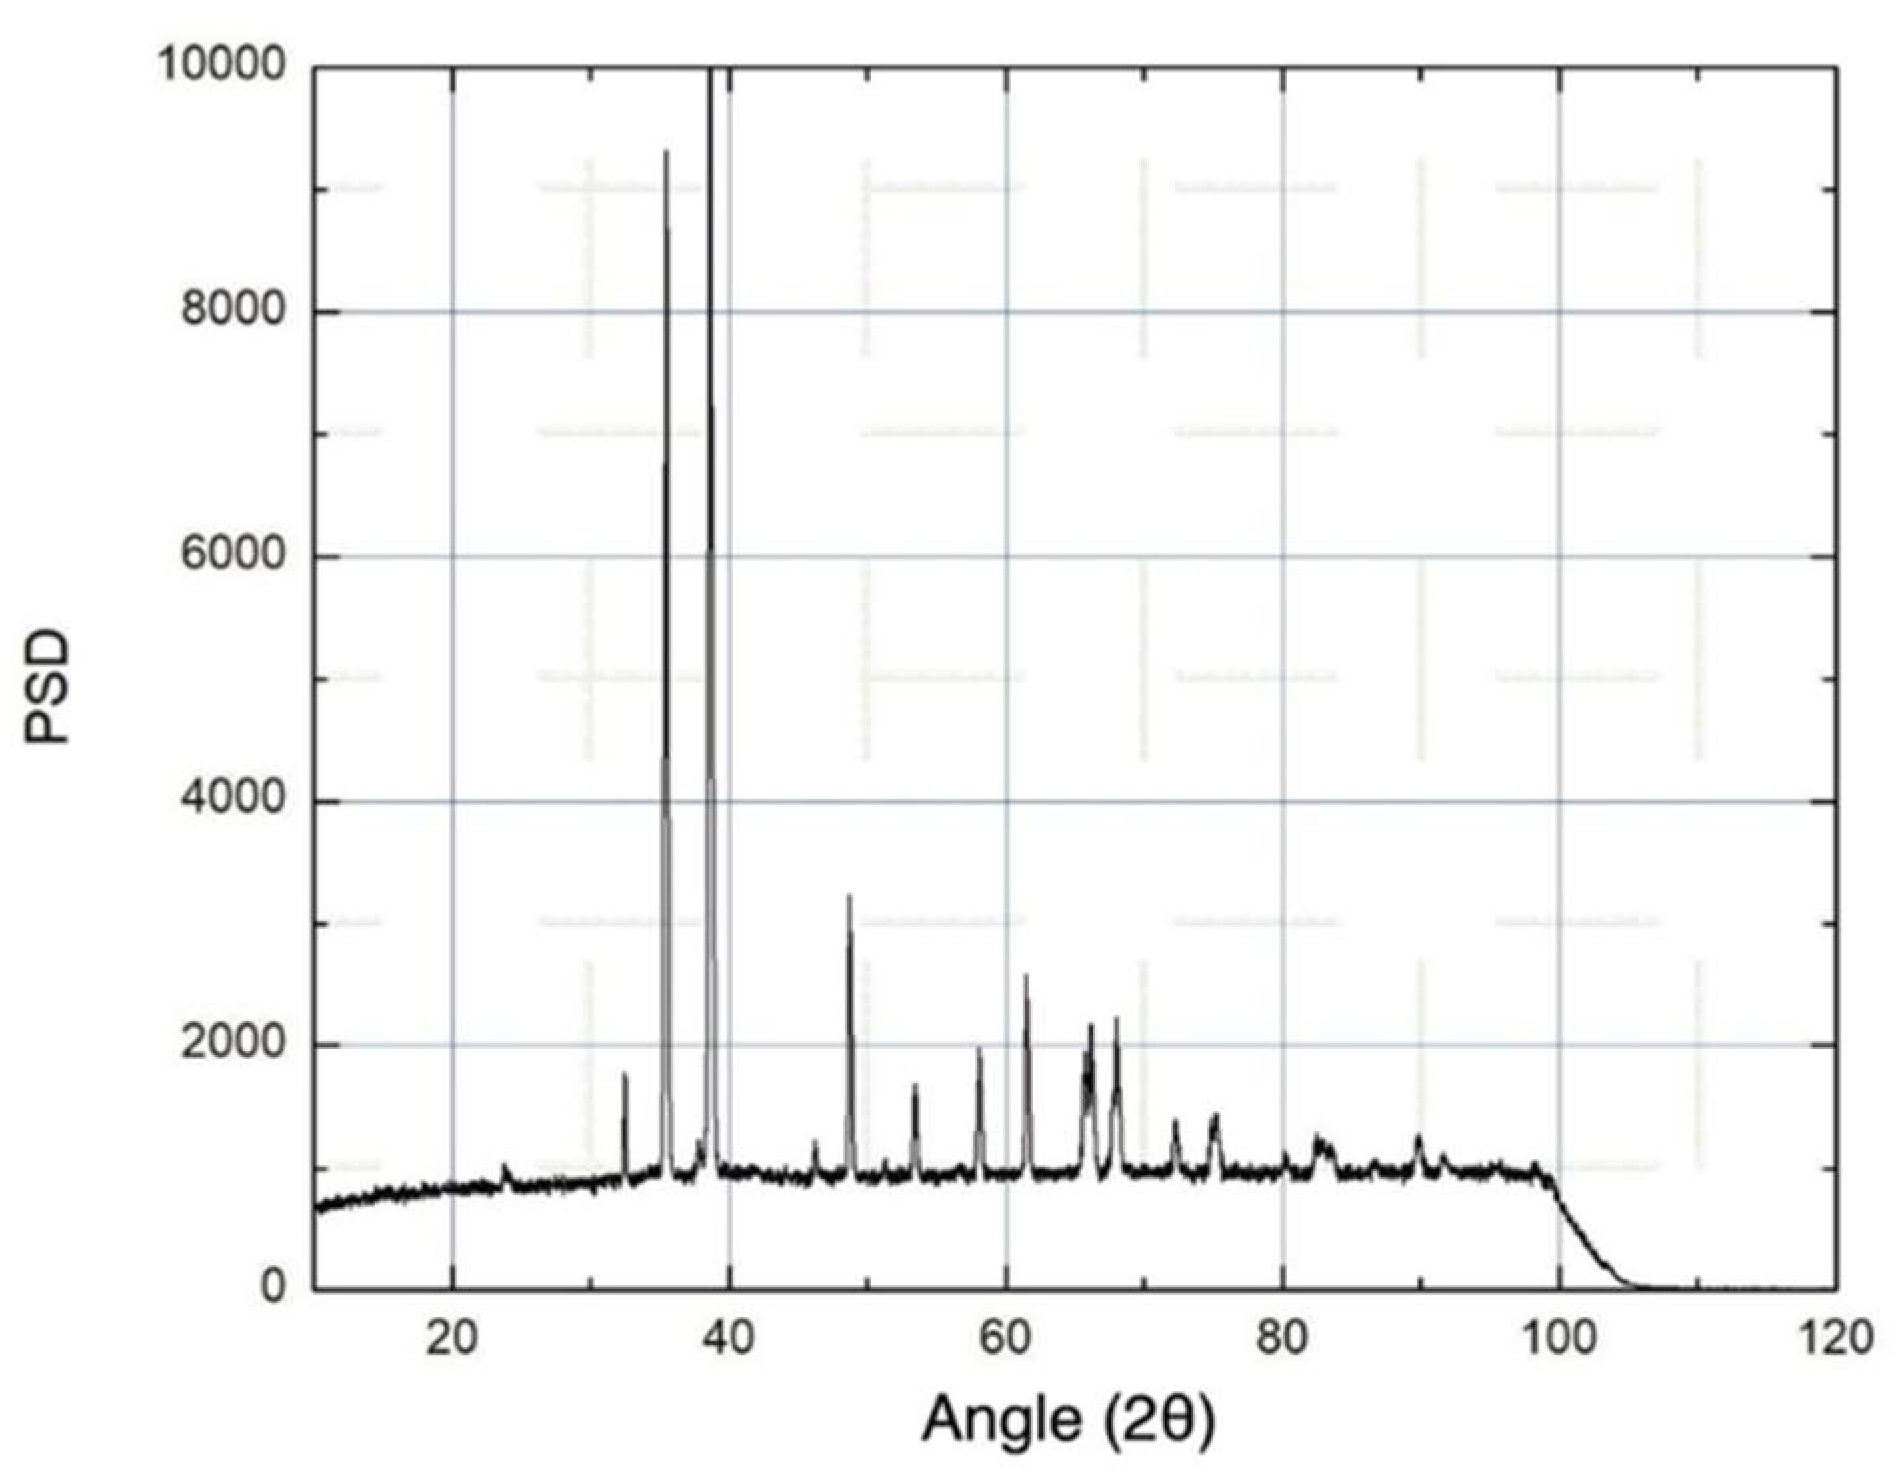
Figure 2.
Temperature dependence of the real and imaginary parts of AC magnetic susceptibility of CuO0.75 recorded by a compensated secondary coils susceptometer at 231 Hz and 1.26 Oe (zero-peak): (a) pellet prepared from the raw powder and multiply annealed at 908 K in 0.5 bar argon gas.(b) pellet multiply annealed in 0.5 bar argon gas at 908 K under passing DC current started at 10–6 A, and finished at 1.5·10-3 A. Heating rate was 430 K/ hour–1, annealing lasted 0.5 hour, and cooling was in 8.8 hours by normal cooling rate of the oven. The sample is the same as used in the presented resistance measurement.
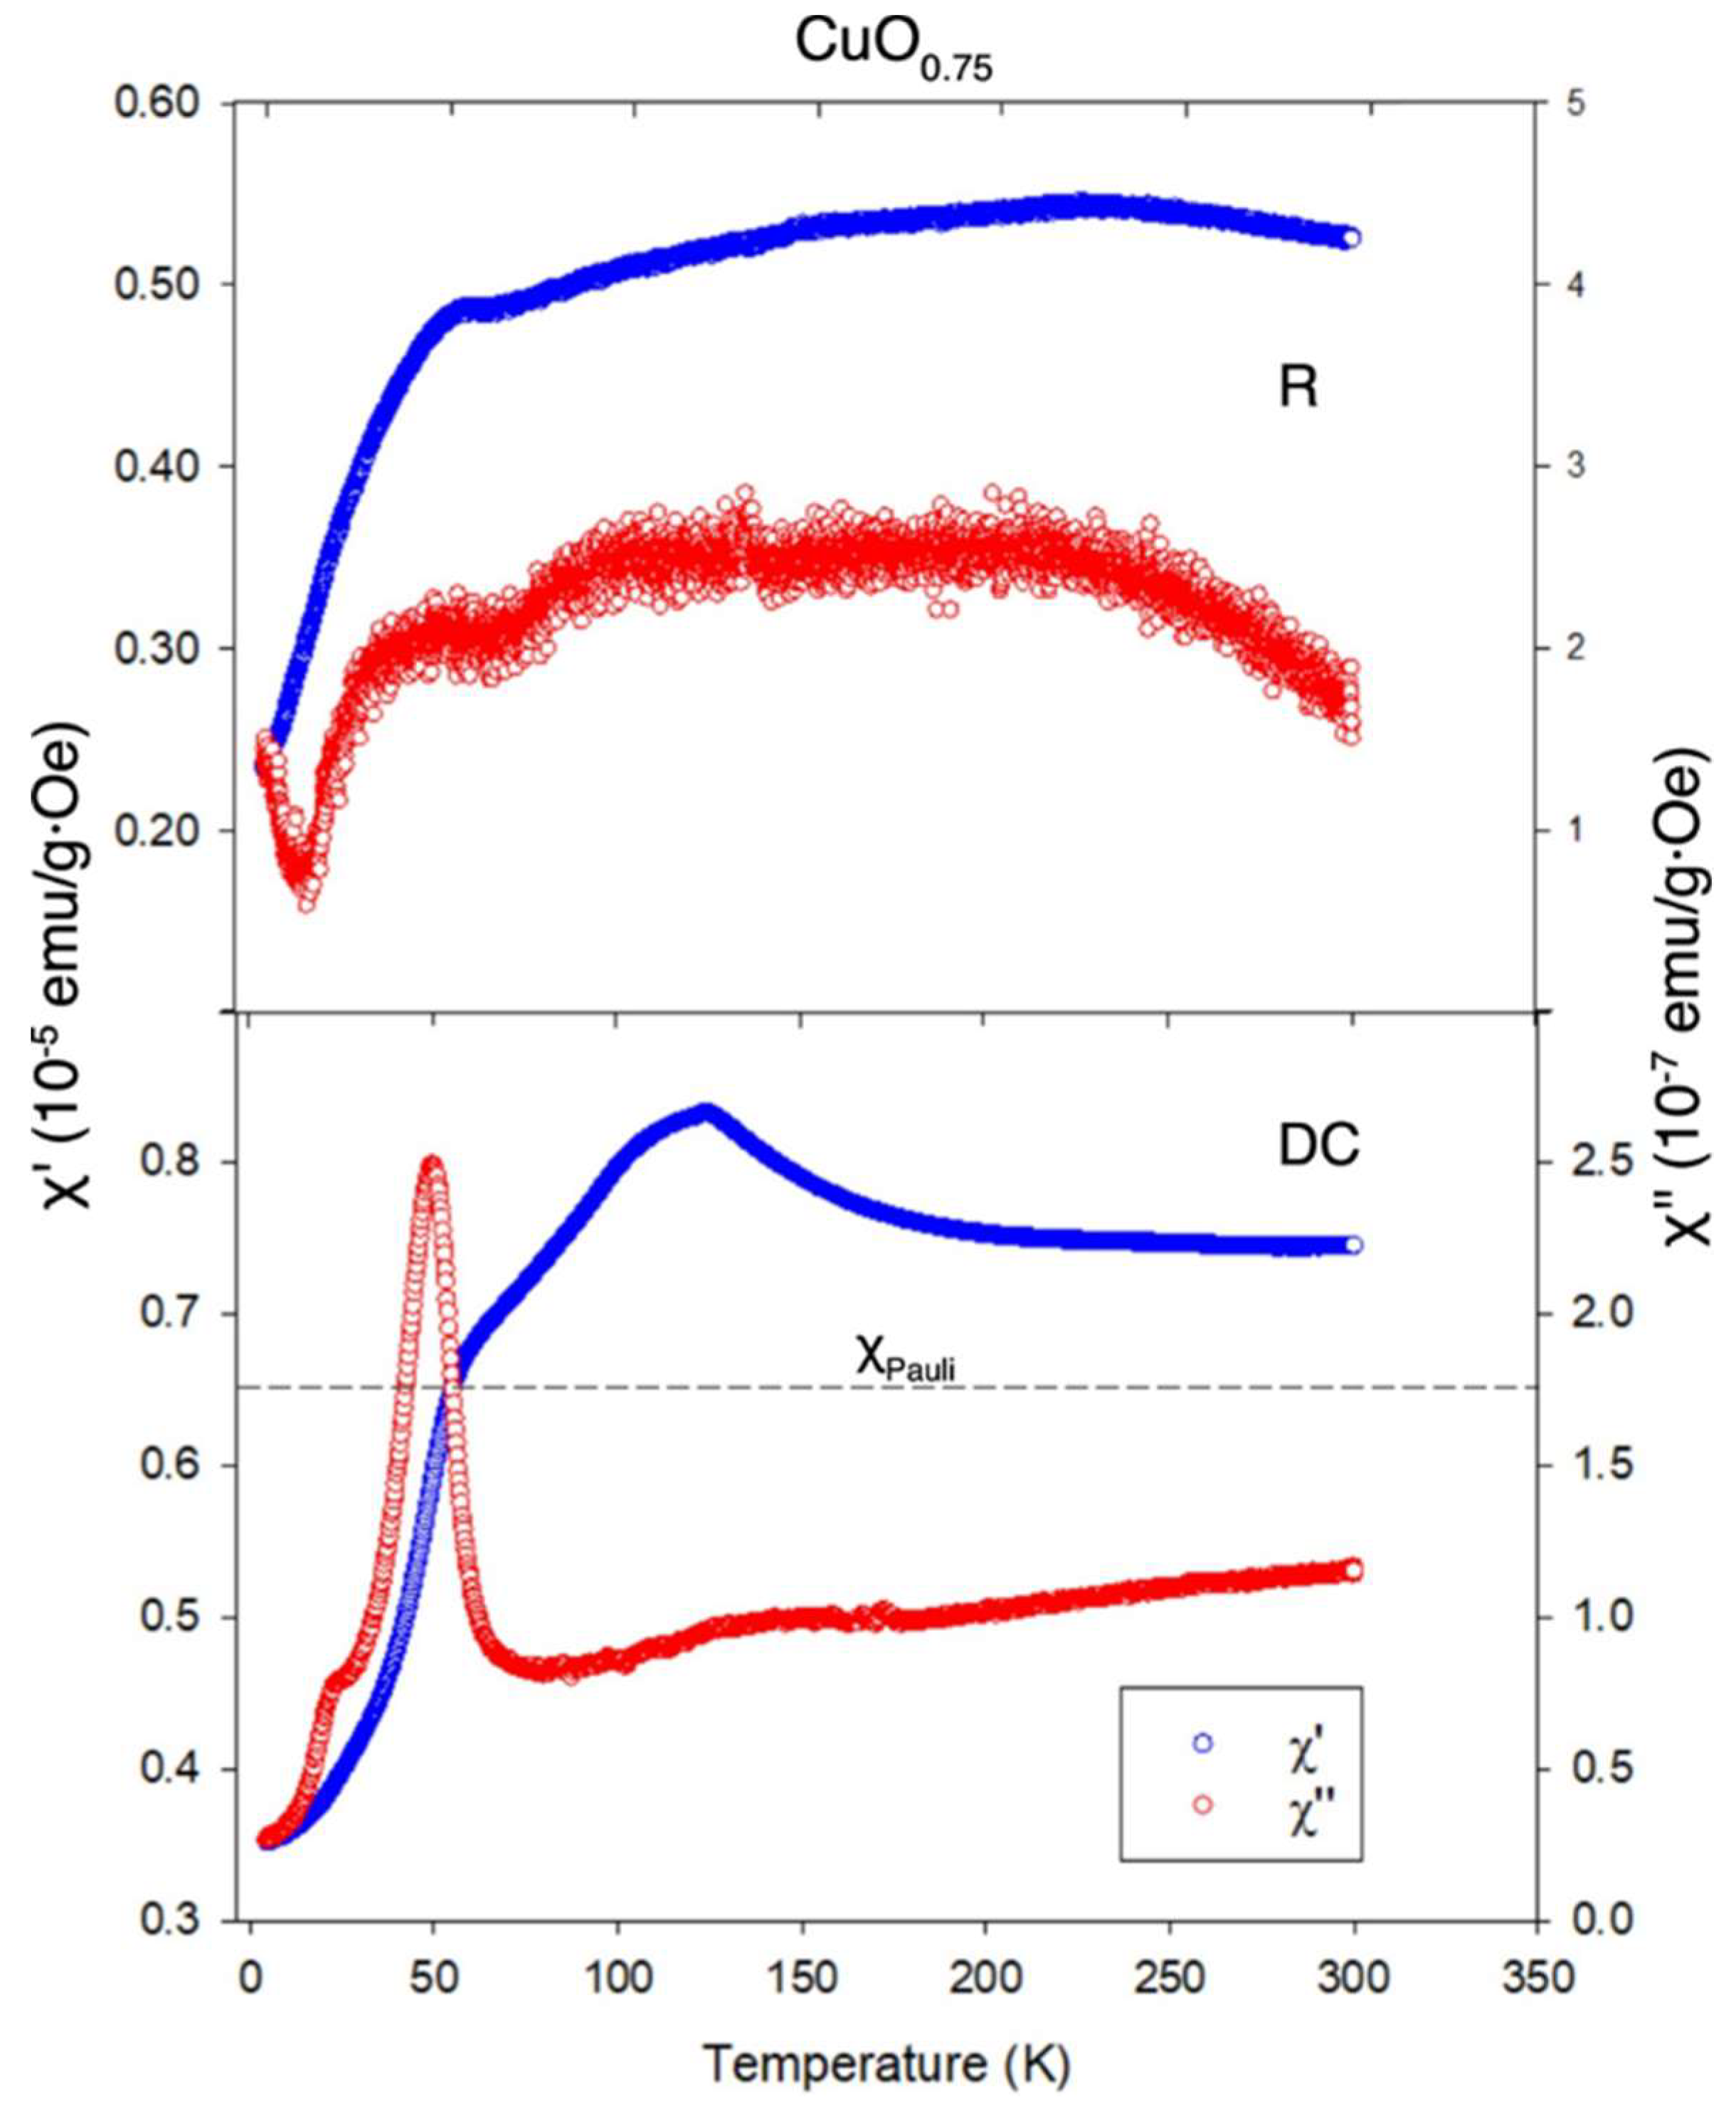
Figure 3.
DC electric resistance of the annealed DC-sample CuO0.75. In-pressed gold wires, 100 microns in diameter, provide four probe measurements. In order to eliminate the contribution of thermopower, cooling-heating cycle was proceeded slowly and extended up to 44 days. Liquid nitrogen level in the surrounding cooling bath was maintained constant, while evaporation was compensated by introduction of the fresh liquid nitrogen by drop-and-drop method via special pump. Copper-constantan thermocouple, consisting of 50 microns wires was attached to the pellet by temperature resistant lacquer, and enforced by the silk weave, as it is shown in the inset. Thermocouple was separated from the pellet by 30 microns mica foil. It is evident the logarithmic plot of the resistance versus T–1/4 in the range 122 – 415 K. Inset shows temperature dependence of the logarithm of the resistance in the range 88 – 140 K.
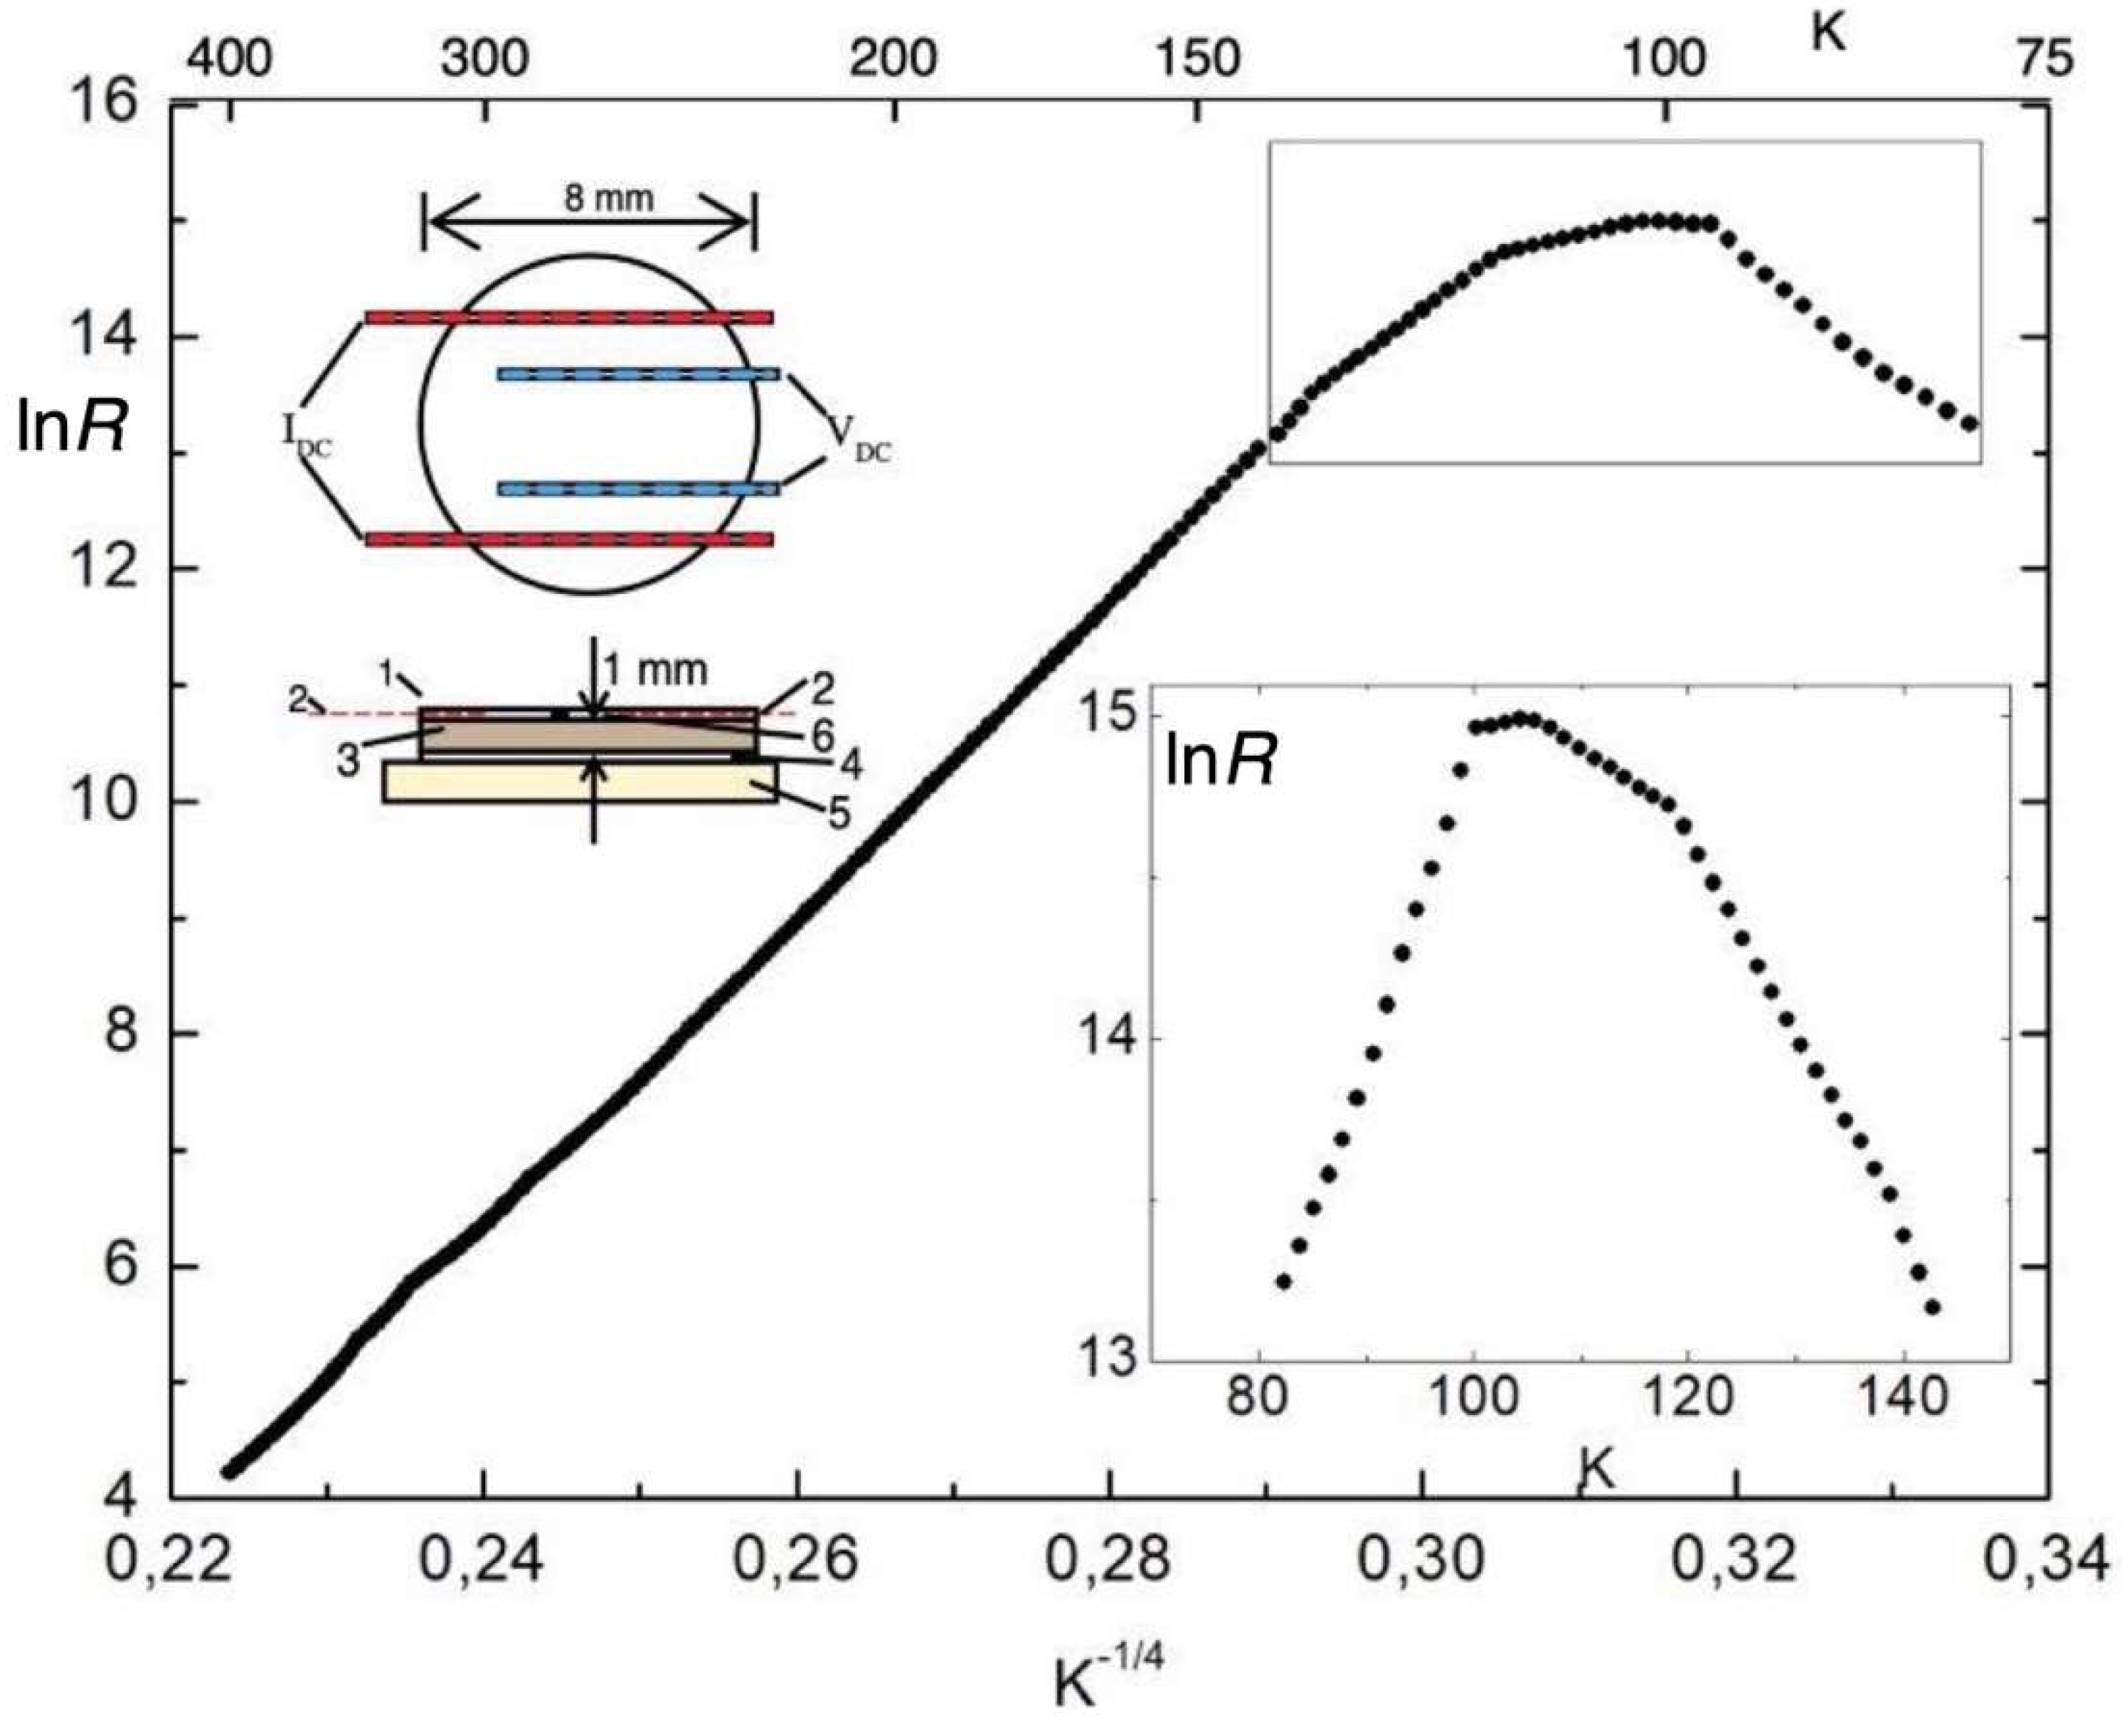
Figure 4.
The SQUID data evaluated in DC-sample CuO0.75.
Disclaimer/Publisher’s Note: The statements, opinions and data contained in all publications are solely those of the individual author(s) and contributor(s) and not of MDPI and/or the editor(s). MDPI and/or the editor(s) disclaim responsibility for any injury to people or property resulting from any ideas, methods, instructions or products referred to in the content. |
© 2025 by the authors. Licensee MDPI, Basel, Switzerland. This article is an open access article distributed under the terms and conditions of the Creative Commons Attribution (CC BY) license (http://creativecommons.org/licenses/by/4.0/).
Copyright: This open access article is published under a Creative Commons CC BY 4.0 license, which permit the free download, distribution, and reuse, provided that the author and preprint are cited in any reuse.


