Submitted:
25 March 2025
Posted:
26 March 2025
You are already at the latest version
Abstract
Background: Thumb carpo-metacarpal arthritis, a form of arthritis at the base of the thumb, causes pain, swelling, and limited mobility, significantly affecting patients' quality of life. This study aimed to evaluate the efficacy of an exercise protocol, comparing standard treatment with an app-assisted approach.
Methods: Two groups of 10 patients each were randomly assigned standard treatment or standard treatment plus a Hand Rehab App. Both groups received physiotherapy sessions over three phases spanning three months.
Results: Both groups showed improvement, with Group 0 showing more significant improvements in several variables. However, the clinical significance of these improvements differed between groups.
Discussion: Group 0 had significant improvements in FLEX IF, FLEX MF TT, and VAS AT NIGHT, while Group 1 had significant improvements in FLEX MF and TT. Group 1 showed greater improvement in JAMAR and TT, while both groups showed similar improvements in other variables. Overall, Group 1 showed more improvement in key measurements.
Conclusion: This study suggests that adding a specific app to exercise therapy may enhance outcomes for trapeziometacarpal osteoarthritis patients, particularly in terms of pain relief and functionality.
Keywords:
metacarpophalangeal joint
; arthroplasty
; thumb
; osteoarthritis
; conservative treatment
; trapeziometacarpal osteoarthritis
Introduction
Trapeziometacarpal osteoarthritis, a degenerative condition affecting the thumb’s carpometacarpal joint, is a common source of pain and functional impairment in the hand. This condition significantly impacts patients' daily activities, often necessitating targeted therapeutic interventions to alleviate symptoms and improve hand function [1,2,3].
Diagnosis relies on a comprehensive clinical history, physical examination, and radiographic assessment, often utilizing Eaton's classification to categorize disease severity [4]. Management decisions are based on both radiographic staging and symptomatology [3,4,5,6,7,8,9,10].
Hand rehabilitation is essential in managing trapeziometacarpal osteoarthritis Stage 1 and stage 2, as it can reduce pain, enhance mobility and functionality, and prevent further joint degeneration [3,11,12].
Optimizing recovery in TMC OA requires adherence to specific behavioral guidelines that minimize joint strain [13,14]. These include avoiding activities that require a strong grip or excessive wrist flexion, such as lifting heavy objects or using hand tools, as well as steering clear of twisting or rotating motions, like wringing a cloth. Utilizing assistive devices, such as a circular blade knife or grip support, can help reduce stress on the thumb joint. Additionally, maintaining the hand in a neutral position and avoiding repetitive movements that provoke discomfort are crucial for managing symptoms effectively.
To develop evidence-based recommendations for the management of TMC OA, a modified Delphi method was employed to achieve consensus among a panel of experts, including hand therapists and hand surgeons. This process was overseen by a steering committee from the American Society of Hand Therapists. The resulting consensus recommendations were categorized according to the World Health Organization's framework, covering assessments of anatomical structures, physiological functions (such as pain and range of motion), and functional capacity. Specific focus areas included thumb mobility (palmar and radial abduction, opposition, metacarpophalangeal joint flexion/extension), grip strength, and tripod pinch strength. Additionally, recommendations emphasized the use of patient-reported outcome measures tailored to the upper extremity.
The consensus also produced detailed treatment recommendations. These included the use of orthotic devices during activities that provoke pain, implementation of dynamic stability programs to maintain joint posture and strengthen stabilizers, and patient education on joint protection strategies. Adaptive equipment and function-based interventions were also advocated to enhance daily living activities. [13].
Various evidence-based techniques and strategies are employed in the rehabilitation of trapeziometacarpal osteoarthritis [13,14,15,16,17], each targeting different aspects of the condition:
Heat Therapy: Applying heat through methods such as hot compresses, paraffin therapy, or infrared lamps helps to reduce pain and alleviate muscle stiffness by promoting relaxation of soft tissues.
- Passive Range-of-Motion Exercises: These exercises are crucial for enhancing joint mobility, reducing stiffness, and preventing adhesions.
- Manual Therapy: Techniques like massage, joint mobilization, and manipulation can reduce pain, improve blood circulation, and support the healing process.
- Braces and Aids: Dynamic daytime braces and static nighttime braces provide support and stability to the hand, helping to reduce pain during both activity and rest.
- Muscle Strengthening Exercises: These exercises are designed to enhance the strength of hand muscles and improve joint balance, often using light weights, elastic bands, or specialized equipment.
- Thumb-Specific Exercises: Targeted exercises focus on promoting joint stability and preventing further cartilage deterioration.
- Correcting Postural Habits: Identifying and modifying behaviors or movements that exacerbate trapeziometacarpal osteoarthritis is crucial for long-term management.
- Thumb Grip Strengthening Exercises: These exercises are important for improving grip strength, enabling patients to perform daily tasks more effectively.
Several studies [11,12,13,14,15,16,17] have demonstrated the efficacy of these techniques in reducing symptoms and improving joint function in patients with trapeziometacarpal osteoarthritis.
Despite the availability of various therapeutic interventions, there remains a lack of consensus on the most effective rehabilitation techniques, underscoring the need for further research in this area [18,19,20,21].
The customization of rehabilitation programs based on the individual needs and the specific pathology of each patient is vital for achieving optimal outcomes.
Conservative management through rehabilitation is often effective but surgical intervention may be necessary in cases where hand function cannot be restored [3,22]. However rehabilitation remains essential in managing post-operative conditions [22,23,24,25,26,27].
Several rating scales found in the literature are used to evaluate hand osteoarthritis: Numeric Rating Scale (NRS), Visual Analogue Scale (VAS), Disability of the Arm, Shoulder and Hand (QUICK DASH), Functional Index for Hand OsteoArthritis (FIHOA), Activities of Daily Living (ADL), Instrumental ADL (IADL), Joint position sense (JPS), Canadian Occupational Performance Measure (COPM), Patient global assessment (PGA), Arthritis Hand Function Test (AHFT), Patient Specific Function Scale (PSFS), Sollerman Hand Function Test (SHFT), Michigan hand questionnaire (MHQ), and Measure of activity performance of the hand (MAP-Hand), Australian Canadian Osteoarthritis Hand Index (AUSCAN), Cochin Hand Function Scale (CHFS), Grip Ability Test (GAT), Jebsen Hand Function Test (JHFT), and Michigan Hand Outcomes Questionnaire (MHQ), ABILHAND score, Upper Extremity Functional Index (UEFI) [28,29,30,31,32,33,34,35,36,37].
Given the varied approaches to rehabilitation in TMC OA, this study aims to evaluate the effectiveness of specific interventions to establish a more standardized treatment protocol.
Material and methods
Study Objectives
The primary objective of this study was to develop and evaluate personalized exercises for patients with trapeziometacarpal osteoarthritis, focusing on joint economy and ergonomic principles to enhance quality of life. The secondary objective was to assess whether an app-assisted approach could improve the outcomes of standard treatment in comparison to traditional methods.
Joint Economy and Ergonomics
Joint economy and ergonomics are essential components in managing trapeziometacarpal osteoarthritis, aimed at minimizing joint stress and enhancing patient well-being. The following principles were emphasized:
Controlled Movements: Patients were instructed on coordinated movements to reduce joint wear and tear.
- Avoidance of Forced Movements: Avoidance of forced or repetitive movements that could exacerbate joint stress was encouraged.
- Load Distribution: Techniques to ensure equal load distribution during daily activities were taught to prevent joint overload.
- Ergonomic Tools and Environment: Recommendations included the use of ergonomic tools and adjustments to the workspace to reduce strain on the thumb and other hand joints.
- Safe Lifting and Posture: Patients were educated on safe lifting techniques and proper posture during activities to minimize tension and stress on the joints.
- Activity Management: Patients were advised to take regular breaks, vary activities to prevent muscle fatigue, and use support devices like ergonomic mice and keyboards.
These principles were tailored to individual patients based on their lifestyle and environment, and were reinforced through professional guidance and patient education.
Current Treatment Practices
This study was motivated by the limited recent advancements in conservative treatment for trapeziometacarpal osteoarthritis. Current treatment practices include education on pain-preventive functional gestures, improving active range of motion (ROM), proprioceptive exercises, manual therapy, and the use of tailor-made splints and joint strengthening exercises. These practices were integrated into the treatment protocol for both study groups.
Study Design and Participants
This was a randomized, controlled oservational study involving 20 patients diagnosed with stage I or II trapeziometacarpal osteoarthritis according to the Eaton scale. Participants were aged 40 to 82 years, and those with prior hand surgeries or comorbidities affecting hand function were excluded. Ethical approval was not necessary because this study is observational and was conducted as part of a therapist’s dissertations. all participants provided informed consent before enrollment.
Participants were casually assigned to one of two groups:
Group 0 (Control): Received standard care, including gesture education, manual therapy, dynamic bracing, and assigned exercises.
Group 1 (Experimental): In addition to the standard care provided to the control group, this group utilized the Hand Rehab tool, a digital application that delivered personalized exercise programs, video tutorials, and progress monitoring.
The treatment spanned 3 months and was divided into three phases:
Phase 1 (Acute Phase): Weekly sessions for the first three weeks, focusing on pain management, edema control, ergonomics, passive mobilization, and functional exercises.
Phase 2 (Gesture Re-education Phase): Sessions every 15 days for seven weeks, aimed at restoring hand functionality through controlled movements in activities of daily living (ADLs) and instrumental ADLs (IADLs).
Phase 3 (Maintenance Phase): Two follow-up sessions at 5 and 12 weeks to sustain results through muscle strengthening, stretching, and gradual return to activity.
Outcome Measures
Outcomes were assessed using a range of validated scales, including the Visual Analogue Scale (VAS), Functional Index for Hand OsteoArthritis (FIHOA), goniometric evaluation, dynamometer measurements, and pinch tests. The primary outcomes were pain reduction (VAS) and functional improvement (FIHOA). Secondary outcomes included joint range of motion and grip strength.
Treatment Sessions
Each session incorporated:
Education: Joint economy concepts and ergonomic principles were reinforced.
Therapeutic Exercises: Progression of exercises tailored to each phase of rehabilitation.
Manual Therapy: Passive mobilization, massage, and other manual techniques were applied as needed.
Behavioral Guidance: Patients were advised to avoid activities requiring strong grip or radial wrist flexion, use soft braces as necessary, and avoid prolonged repetitive gestures.
APP-Based Exercise Protocol
The experimental group’s treatment was augmented by an app-based protocol, which provided:
Instructional Materials: Customized exercise programs, a booklet, and video tutorials for each phase of rehabilitation.
Progress Monitoring: Regular assessments to track improvements and adjust exercises as needed.
Precautions and Safety: Alerts within the app to guide safe practice and prevent overexertion.
Statistical Analysis
Data were analyzed using R software (version 4.3 1), with results summarized as mean ± standard deviation. Normality of data distribution was assessed using the Kolmogorov-Smirnov test. Differences between groups were evaluated using repeated measures ANOVA, while intra-group effectiveness was assessed using paired t-tests or the Wilcoxon Rank test for non-normally distributed data. Missing data were addressed using multiple imputation techniques, and corrections for multiple comparisons were applied where appropriate.
Results
2 study groups of 20 patients with Eaton stage 1-2 trapeziometacarpal osteoarthritis diagnosed by x-ray and visit to the hand surgeon were taken into consideration.
10 patients were treated with manual therapy, pumps, massage and functional and proprioceptive exercises explained verbally.
10 patients were treated with manual therapy, pumps, massage and functional and proprioceptive exercises using a specific App.
Both groups were treated with 1 session per week for 3 weeks, 1 session every 15 days for 3 times and the last one at 3 weeks for a total of 7 sessions in 3 months including follow ups at 5 and 12 weeks.
Both groups underwent: functional assessment, functional neoprene brace for activities of daily living, education, manual therapy and exercises.
GROUP 0
The control group (T0) consists of 10 patients (3 male and 7 female) with an average age of 68 (ranging from 52 to 82 years). The affected hand is the right hand for all patients, and 6 out of 10 do not report pain at rest. During Activities of Daily Living (ADL), 9 patients report varying levels of pain on the Vas scale ranging from 5 to 10, with 3 patients at a level of 10 and only 1 at a level of 0. Nighttime pain is reported by 6 patients, ranging from 5 to 8, while 4 patients do not experience pain. On the FIHOA scale (where a score of 0 means no movement difficulty, 1 means slight difficulty, 2 means significant difficulty, and 3 means impossible), the average score is 18.2, with scores ranging from 7 to a maximum of 30. Thumb opposition, measured using the K scale (where K10 is the maximum score), shows that only 1 patient had a score of K1, and 4 out of 10 patients scored K9. The remaining patients had scores ranging from K3 to K7. Active range of motion (ROM) for thumb flexion (measured with a finger goniometer) ranges from 40 to 60 degrees for the metacarpophalangeal joint, and from 40 to 75 degrees for the interphalangeal joint. Grip strength, measured in kilograms with a Jamar dynamometer, shows an average strength of 17.5 kg, ranging from 5 to 22 kg, with only 1 patient at 0 kg. Pinch Test results show that the average strength for the tip-to-tip pinch is 2.9 kg (ranging from 2 to 4 kg), for the lateral pinch it is 1.85 kg (ranging from 1 to 3 kg), and for the three-jaw chuck pinch it is 0.85 kg (ranging from 0 to 2 kg).
The control group (T1) consists of 10 patients (3 male and 7 female) with an average age of 68 (ranging from 52 to 82 years). The affected hand is the right hand for all patients except 2, who do not report pain at rest. During ADL, 5 patients report varying levels of pain on the Vas scale ranging from 5 to 8, while the other 5 report no pain. Nighttime pain is reported by 2 patients at levels 5 and 6 on the Vas scale, while 8 patients do not experience nighttime pain. On the FIHOA scale, the average score is 8.2, ranging from 3 to 17. Thumb opposition, measured using the K scale, ranges from K7 to K10. Active range of motion shows that thumb flexion ranges from 50 to 72 degrees for the metacarpophalangeal joint and from 45 to 82 degrees for the interphalangeal joint. Grip strength, measured with a Jamar dynamometer, shows an average strength of 20.1 kg, ranging from 5 to 35 kg. Pinch Test results show that the average strength for the tip-to-tip pinch is 3.3 kg (ranging from 2 to 4 kg), for the lateral pinch it is 2.4 kg (ranging from 1 to 3 kg), and for the three-jaw chuck pinch it is 1.4 kg (ranging from 1 to 2 kg).
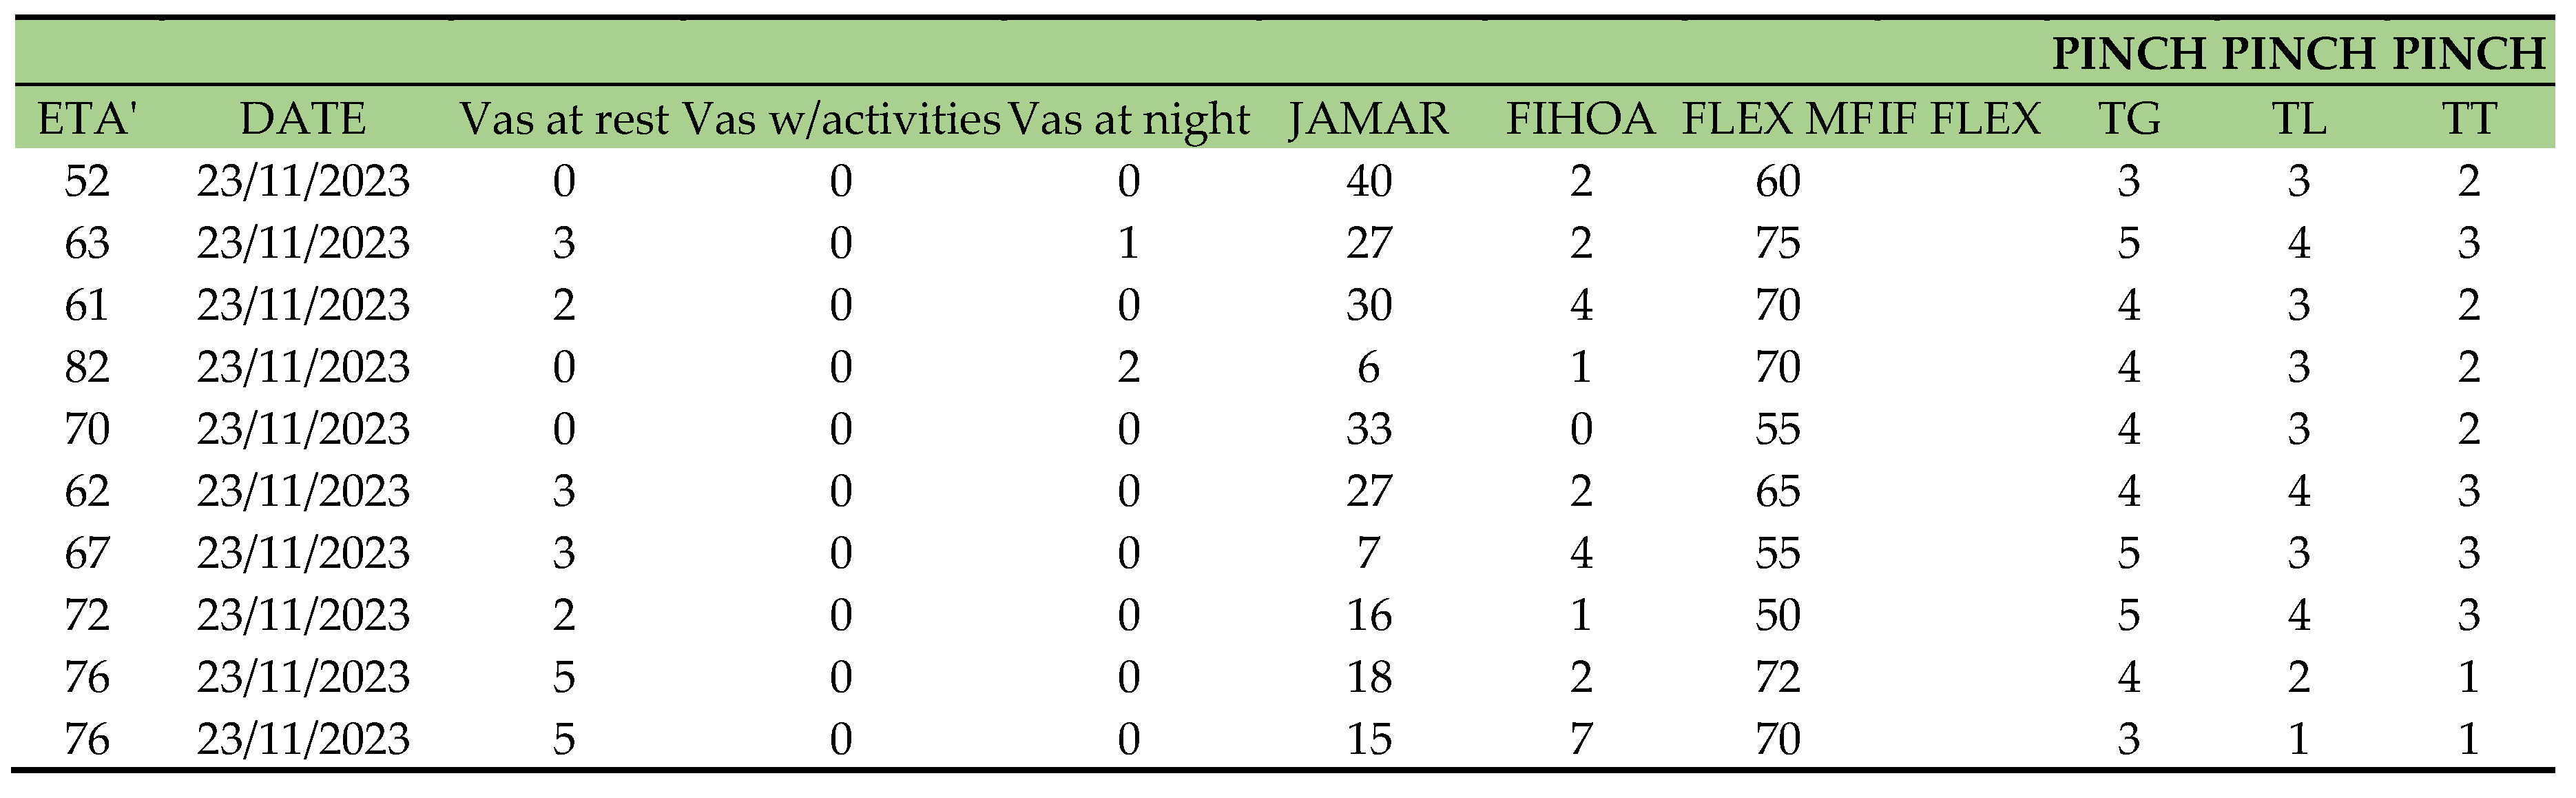
The control group (T2) consists of 10 patients (3 male and 7 female) with an average age of 68 (ranging from 52 to 82 years). The affected hand is the right hand for all patients, and none of the patients report pain at rest. During ADL, 3 patients do not experience pain, while the other 7 report varying levels of pain on the Vas scale ranging from 2 to 5. No patients report nighttime pain. On the FIHOA scale, the average score is 2.5, ranging from 0 to 7. Thumb opposition, measured using the K scale, ranges from K9 to K10. Active range of motion shows that thumb flexion ranges from 50 to 75 degrees for the metacarpophalangeal joint and from 47 to 80 degrees for the interphalangeal joint. Grip strength, measured with a Jamar dynamometer, shows an average strength of 25.3 kg, ranging from 7 to 40 kg. Pinch Test results show that the average strength for the tip-to-tip pinch is 4.1 kg (ranging from 3 to 5 kg), for the lateral pinch it is 3 kg (ranging from 1 to 4 kg), and for the three-jaw chuck pinch it is 2.2 kg (ranging from 1 to 3 kg).

Table 1.
T0 in group 0.
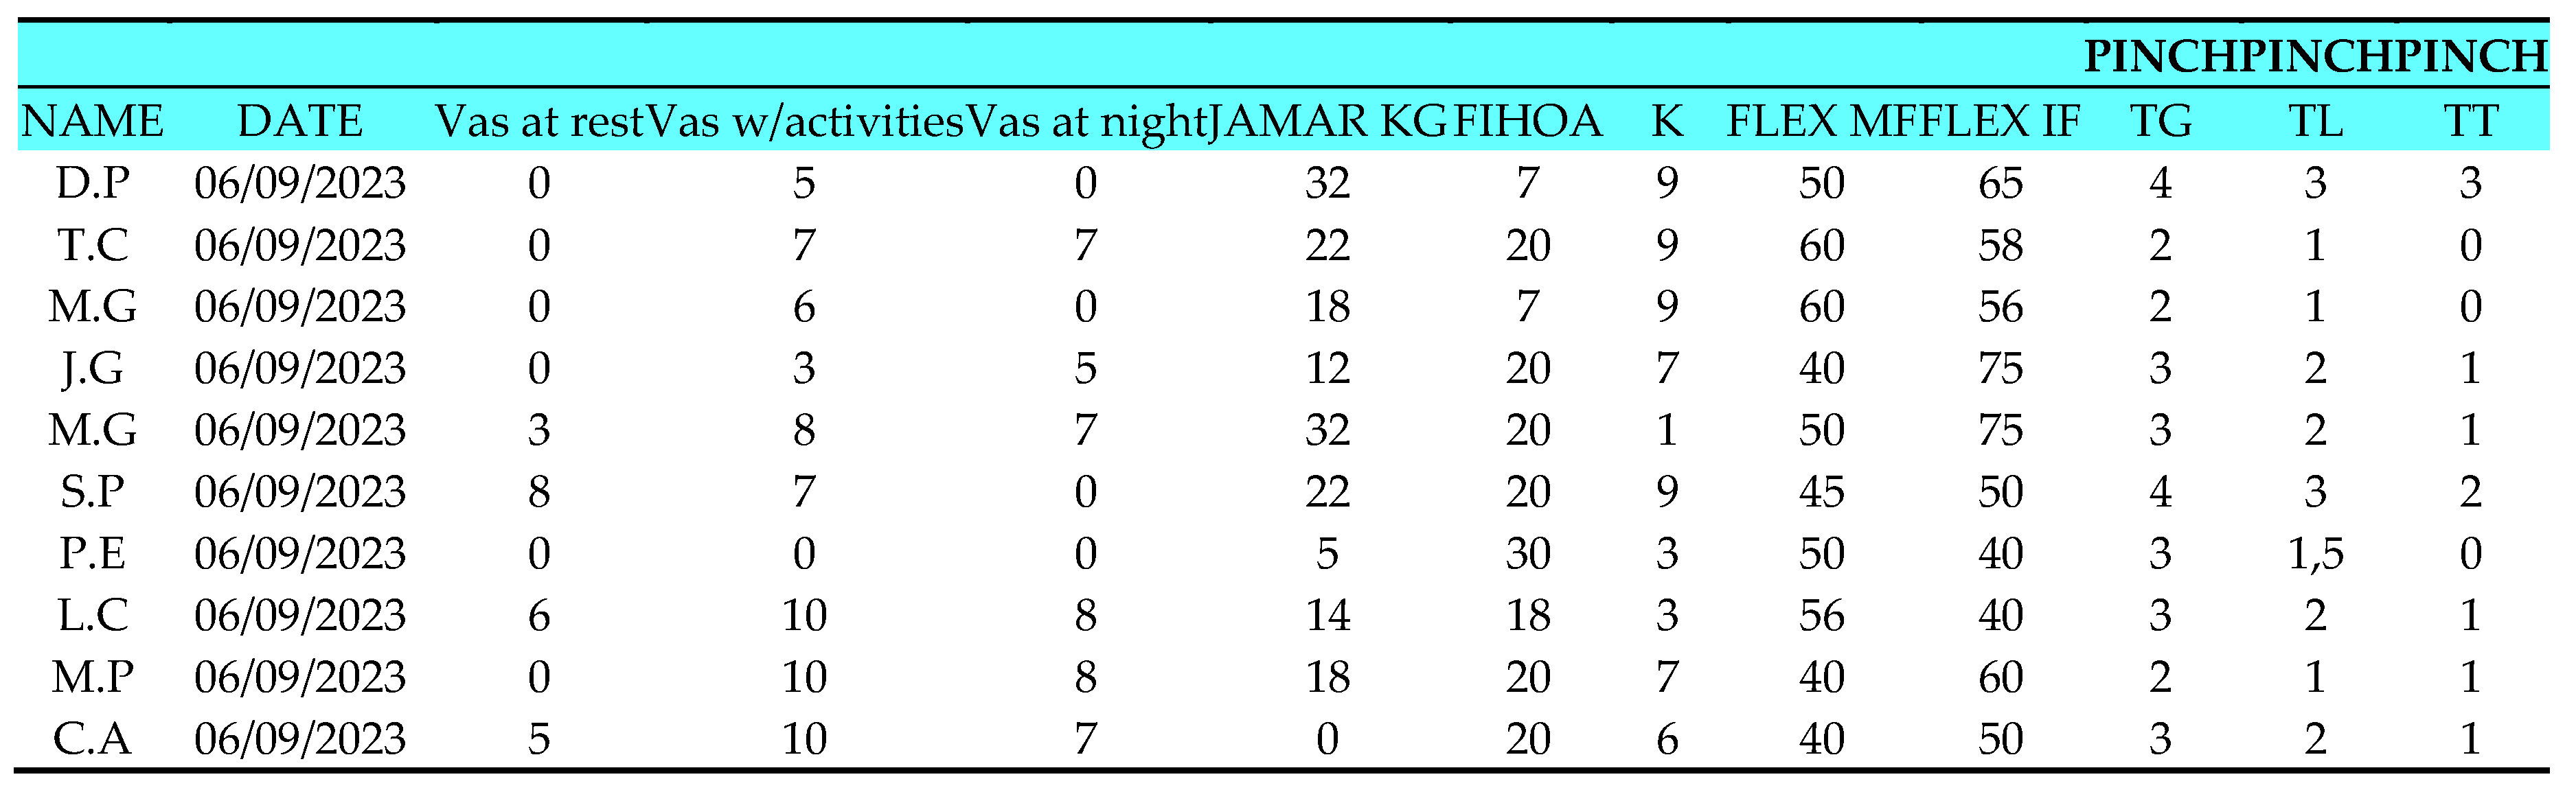 |
Table 2.
T1 in group 0.
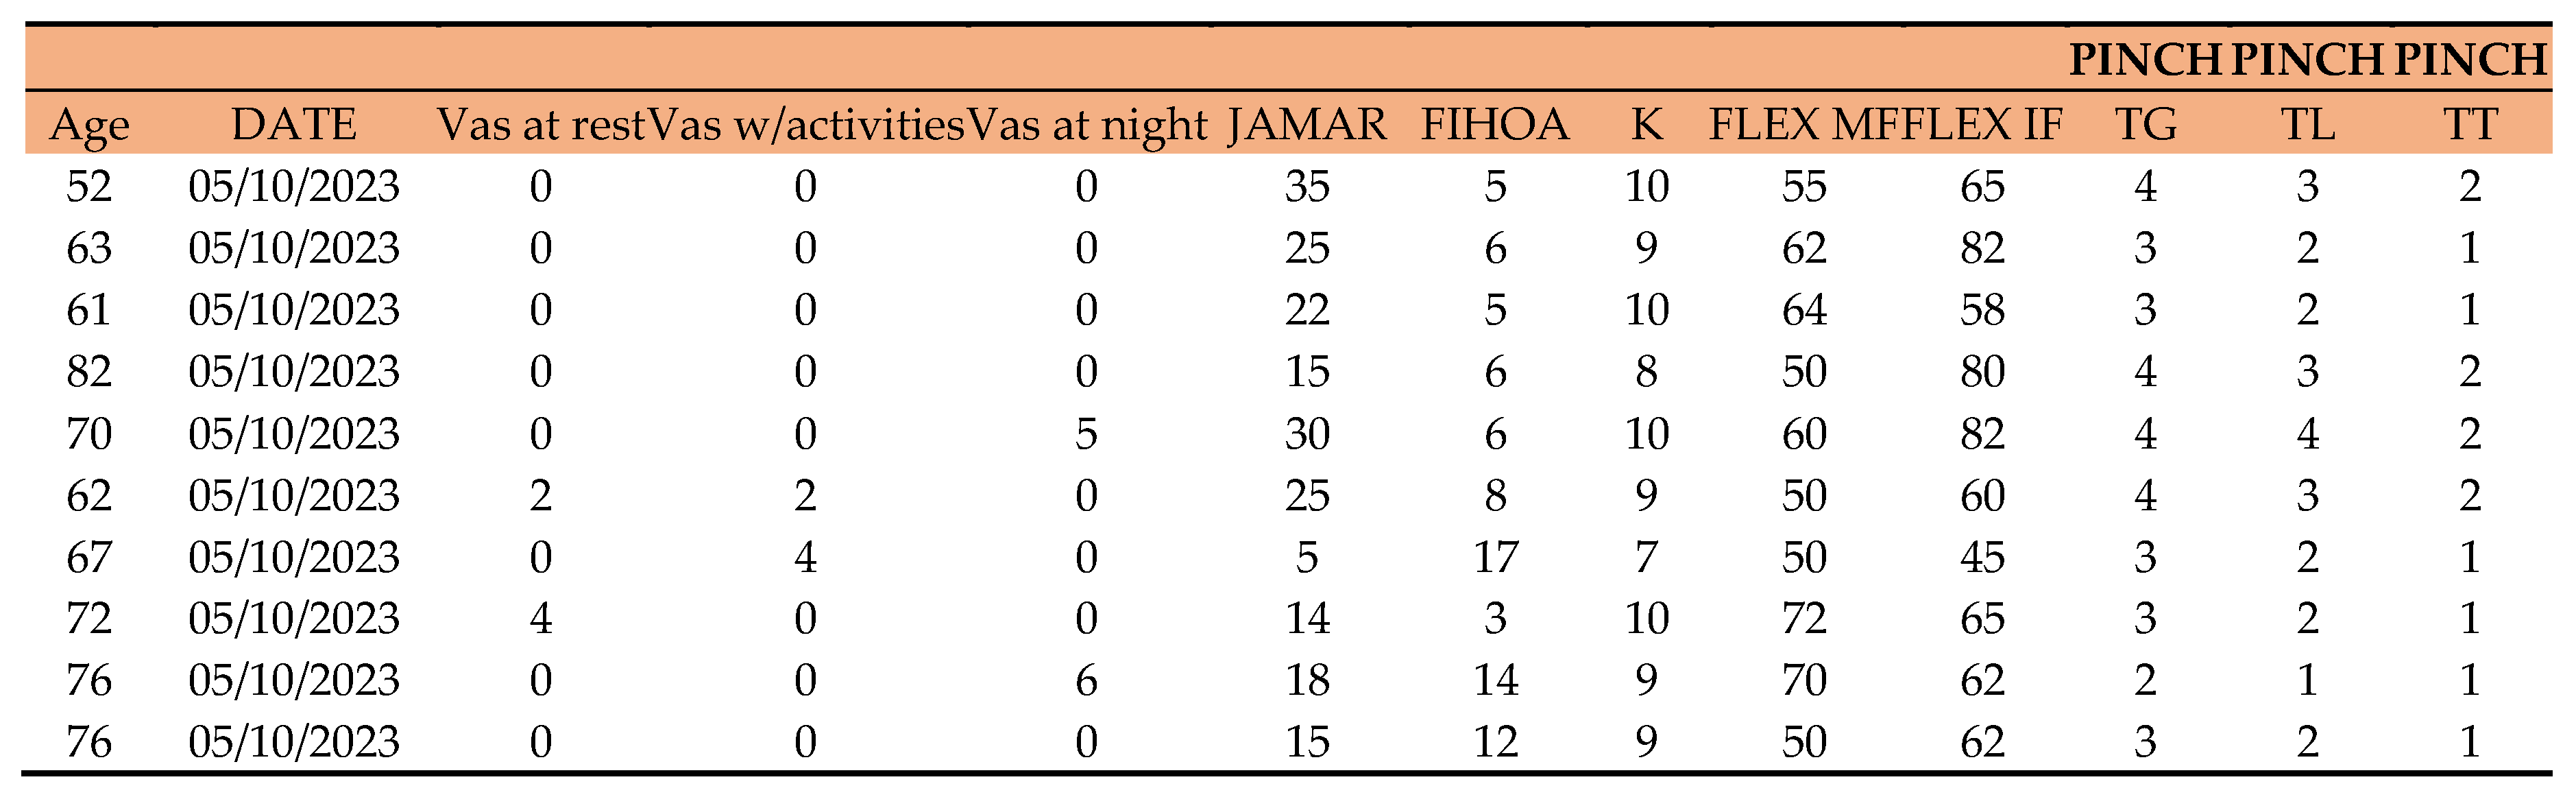 |
Table 3.
T2 in group 0.
 |
GROUP 1
The control group (T0) consists of 10 patients (2 males and 8 females) with an average age of 63 (ranging from 53 to 76 years). The affected hand is the right hand for 8 patients, with 5 out of 10 not reporting pain at rest. During activities of daily living (ADL), all patients report varying levels of pain on the Vas scale, ranging from 1 to 3, with only 1 patient at 10. Nighttime pain is reported by 3 patients, ranging from 1 to 4, while 7 patients do not experience pain at night. On the FIHOA scale (where a score of 0 means movement possible without difficulty, 1 possible with slight difficulty, 2 possible with significant difficulty, and 3 impossible), the average score is 13.3, ranging from 4 to 20. In thumb opposition measured on the K scale (where K10 is the maximum), the range is between K5 and K9. In active range of motion (ROM), flexion (measured with a finger goniometer) of the metacarpophalangeal (MF) joint ranges from 40 to 60 degrees, while flexion of the interphalangeal (IF) joint ranges from 52 to 74 degrees. Jamar strength in kilograms (Kg): the average grip strength measured with Hand Grip is 13.2 kg, ranging from 2 to 32 kg, with only 1 patient at 0. Pinch Test results: Tip Grip (TG) strength has an average of 3.5 kg, ranging from 2 to 5 kg; lateral pinch strength (TL) has an average of 3.3 kg, varying between 1 and 6 kg; terminal pinch strength (TT) has an average of 2.15 kg, varying between 0 and 5 kg.
The control group (T1) consists of 10 patients (2 males and 8 females) with an average age of 63 (ranging from 53 to 76 years). The affected hand is the right hand for 8 patients. Resting pain is reported by only 3 patients at 2 on the Vas scale. During ADL, 9 patients report varying levels of pain on the Vas scale, ranging from 2 to 8. Nighttime pain is reported by 2 patients at 4 and 2 on the Vas scale. On the FIHOA scale, the average score is 9.6, ranging from 3 to 15. In thumb opposition measured on the K scale, the range is between K6 and K10, with 2 patients reaching K10. In active ROM, flexion of the MF joint ranges from 50 to 60 degrees, while flexion of the IF joint ranges from 52 to 74 degrees. Jamar strength in kilograms: the average grip strength measured with Hand Grip is 14.6 kg, ranging from 2 to 35 kg. Pinch Test results: TG strength has an average of 3.9 kg, ranging from 2 to 5 kg; TL strength has an average of 2.4 kg, ranging between 1 and 6 kg; TT strength has an average of 1.4 kg, ranging between 0 and 5 kg.
The control group (T1) consists of 10 patients (2 males and 8 females) with an average age of 63 (ranging from 53 to 76 years). The affected hand is the right hand for 8 patients. Resting pain is reported by only 1 patient, during ADL 8 patients report varying levels of pain on the Vas scale, ranging from 2 to 4, with two patients at 0 on the Vas scale. Nighttime pain is not reported. On the FIHOA scale, the average score is 4.4, ranging from 1 to 10, with only 1 patient at 0. In thumb opposition measured on the K scale, the range is between K7 and K10, with 5 patients reaching K10. In active ROM, flexion of the MF joint ranges from 55 to 70 degrees, while flexion of the IF joint ranges from 60 to 80 degrees. Jamar strength in kilograms: the average grip strength measured with Hand Grip is 16.2 kg, ranging from 4 to 40 kg. Pinch Test results: TG strength has an average of 4.6 kg, ranging from 2 to 6 kg; TL strength has an average of 4.4 kg, ranging between 2 and 6 kg; TT strength has an average of 3.3 kg, ranging between 1 and 5 kg.
Table 4.
T0 in group 1.
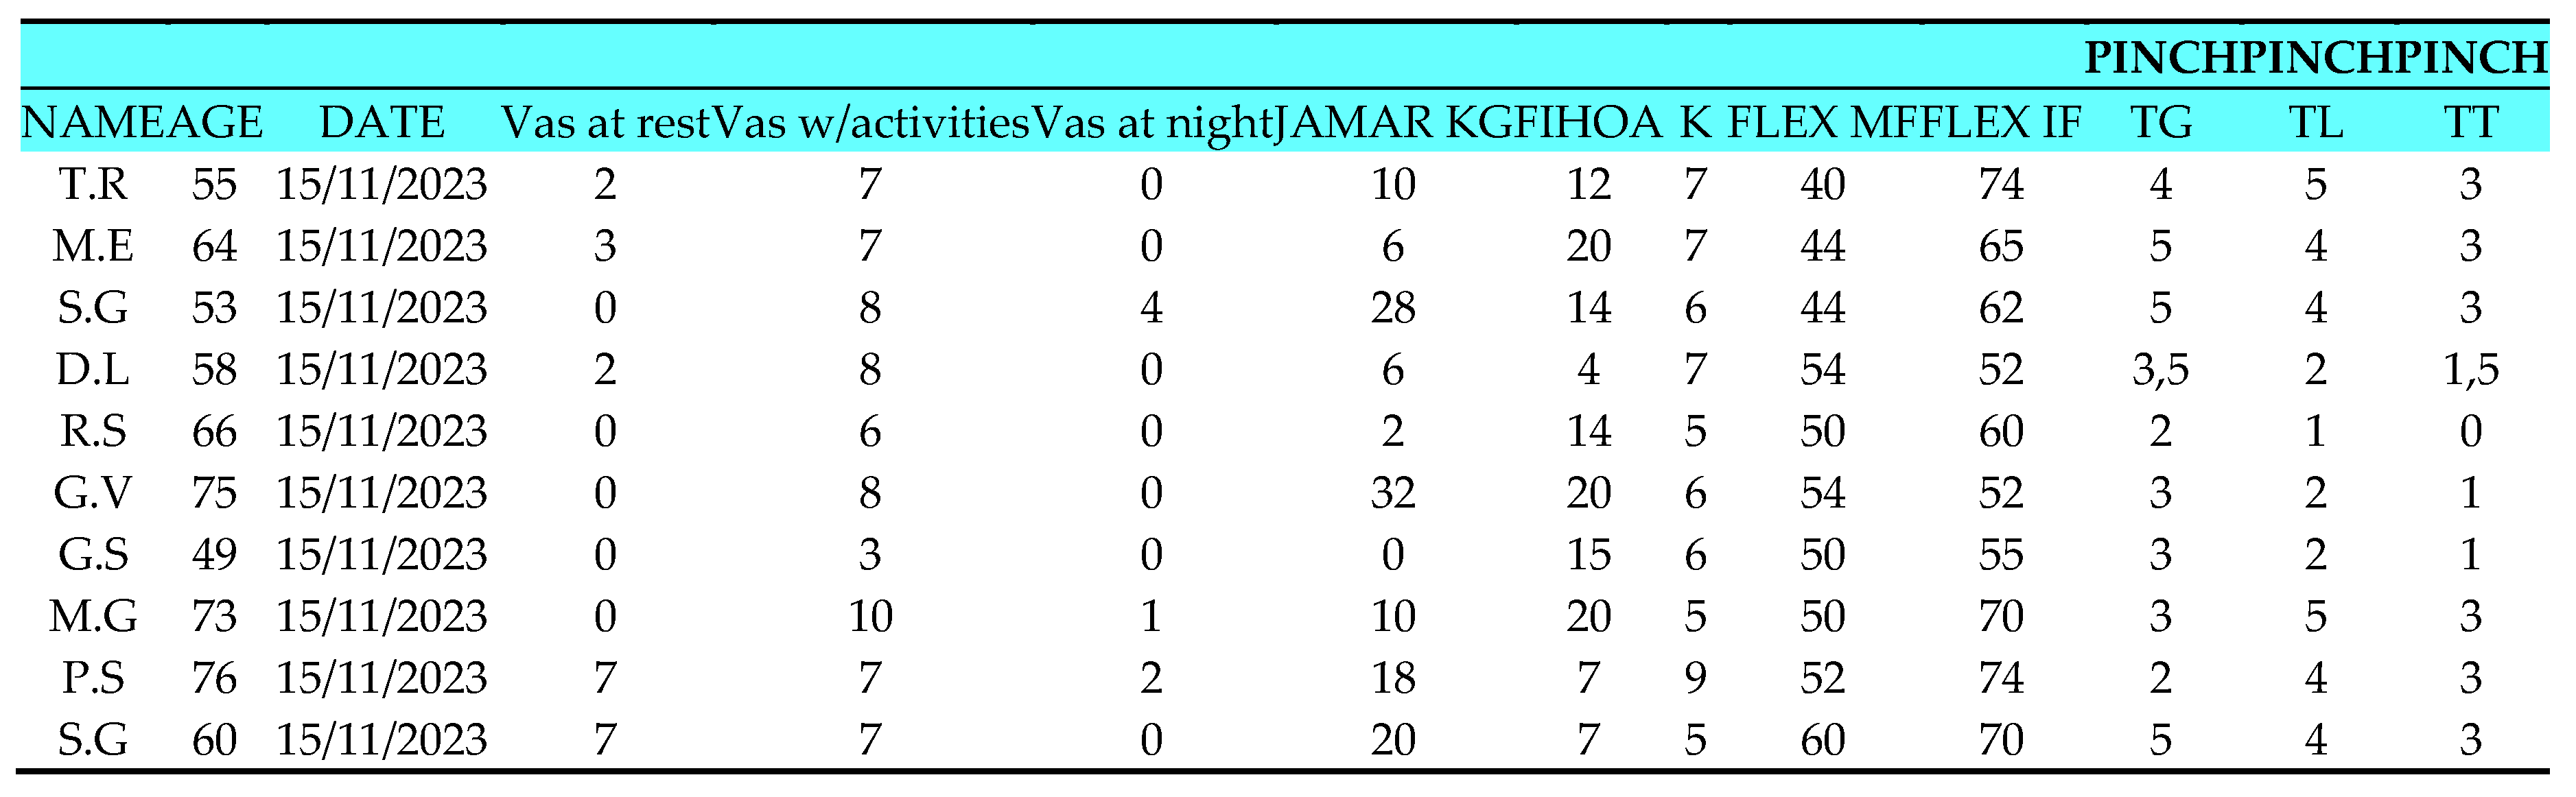 |
Table 5.
T1 in group 1.
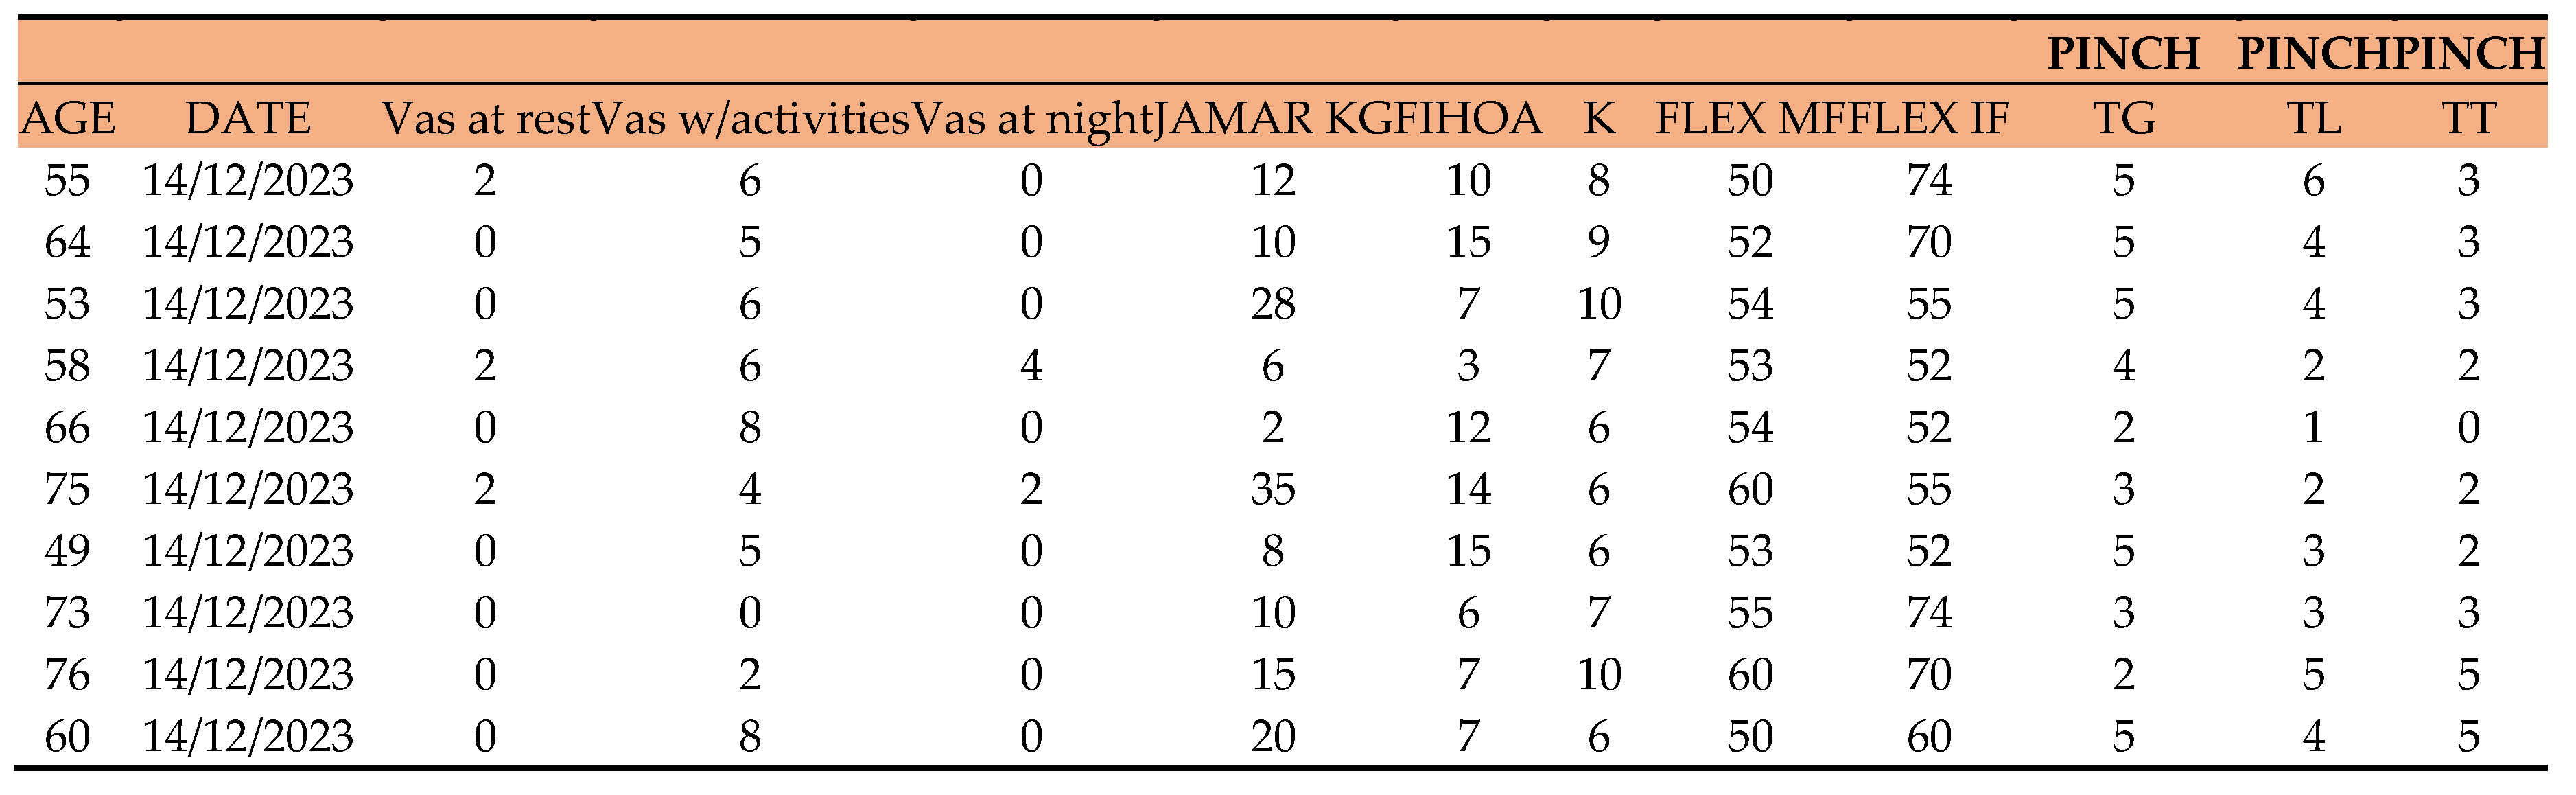 |
Table 6.
T2 in group 1.
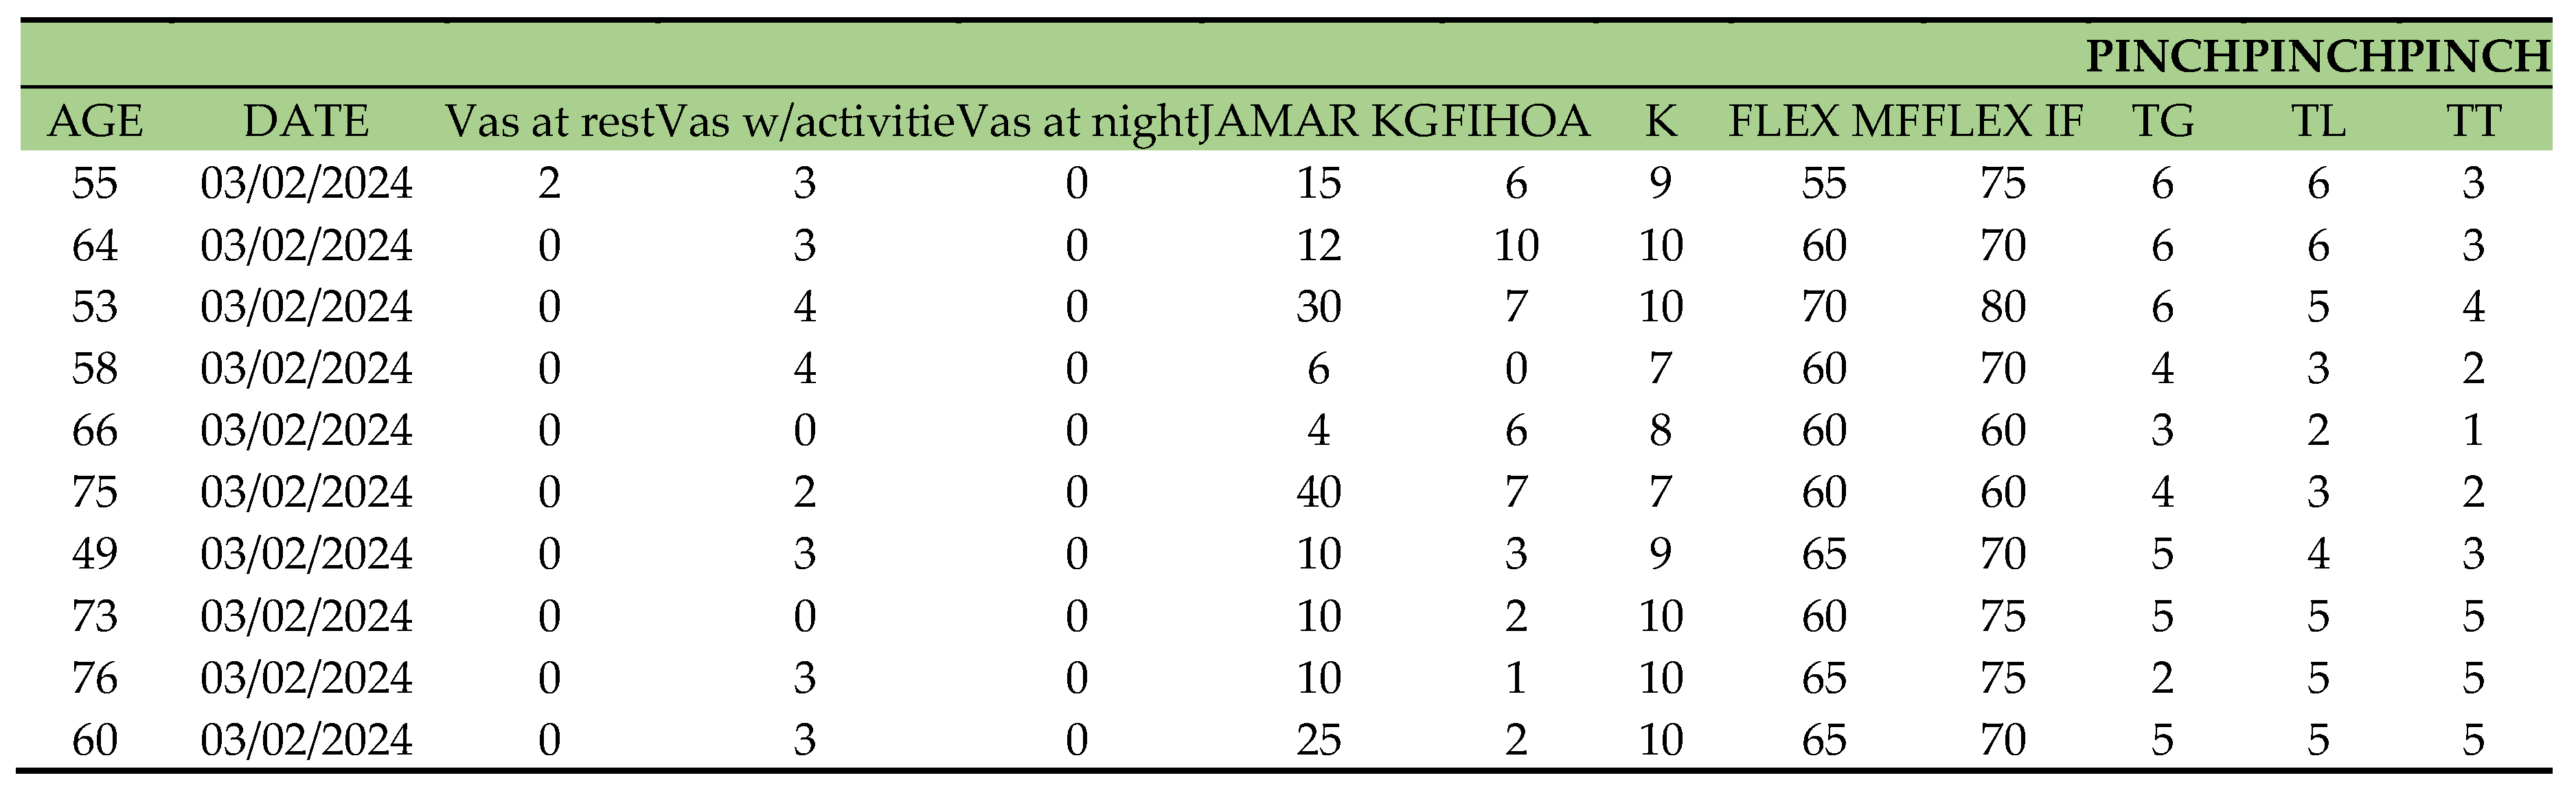 |
Table 7.
Inter-group data analysis ANOVA FIHOA, FIHOAt1, FIHOAt2.
| Sum | Sq num | Df Error | SS den | Df F value | Pr (>F) | |
|---|---|---|---|---|---|---|
| Intercept | 4973.2 | 1 | 779.49 | 17 | 108.4622 | 8.509e-09*** |
| Factor 1 - Group | 4.4 | 1 | 779.49 | 17 | 0.0969 | 0.7593256 |
| Time | 1319.7 | 2 | 344.44 | 34 | 65.1351 | 2.348e-12 *** |
| Factor 1 – Group:Time | 184.1 | 2 | 344.44 | 34 | 9.0842 | 0.0006906 *** |
Signif. codes: 0 '***' 0.001 '**' 0.01 '*' 0.05 '.' 0.1 ' ' 1.
The FIHOA model shows that factor 1 of the group does not have a significant effect on the outcome. The FIHOAt1 and FIHOAt2 models, which include time as a variable, show a significant effect of time on the outcome. In particular, the FIHOAt2 model also shows a significant effect of the interaction between factor 1 of the group and time on the outcome. This suggests that factor 1 of the group has a time-dependent effect on the outcome.
Table 8.
Inter-group data analysis ANOVA FLEX.IF, FLEX.IFt1, FLEX.IFt2.
| Sum | Sq num | Df Error | SS den | Df F value | Pr (>F) | |
|---|---|---|---|---|---|---|
| Intercept | 247298 | 1 | 3913.7 | 18 | 1137.3915 | < 2.2e-16 *** |
| Factor 1 - Group | 49 | 1 | 3913.7 | 18 | 0.2235 | 0.6420497 |
| Time | 737 | 2 | 1478.3 | 36 | 8.9748 | 0.0006881 *** |
| Factor 1 – Group:Time | 338 | 2 | 1478.3 | 36 | 4.1142 | 0.0245931 * |
Signif. codes: 0 '***' 0.001 '**' 0.01 '*' 0.05 '.' 0.1 ' ' 1.
The ANOVA analysis shows that both Intercept and Time are statistically significant, with p values <0.001. However, Factor 1 - Group is not statistically significant, with a p value of 0.642. Additionally, the interaction between Factor 1 - Group and Time is statistically significant, with a p value of 0.0245. This suggests that Time has a significant effect on the outcome of the variables FLEX.IF...9, FLEX.IF...22, FLEX.IFt2, while the Factor Group does not have a significant effect. However, there is a significant interaction between Factor Group and Time, which may indicate that the effect of Time on the variables depends on the Group to which the observation belongs.
Table 9.
Inter-group data analysis ANOVA JAMAR.KG, JAMAR.KGt1, JAMAR.KGt2.
| Sum | Sq num | Df Error | SS den | Df F value | Pr (>F) | |
|---|---|---|---|---|---|---|
| Intercept | 19046.0 | 1 | 4966.3 | 18 | 69.0309 | 0.0000001424 *** |
| Factor 1 - Group | 595.3 | 1 | 4966.3 | 18 | 2.1578 | 0.15911 |
| Time | 298.1 | 2 | 1070.8 | 36 | 5.0116 | 0.01202 * |
| Factor 1 – Group:Time | 62.4 | 2 | 1070.8 | 36 | 1.0489 | 0.36077 |
Signif. codes: 0 '***' 0.001 '**' 0.01 '*' 0.05 '.' 0.1 ' ' 1.
The factor 1, namely "Group", does not have a significant effect on the model, with an F value of 2.1578 and a p-value of 0.15911.
Time has a significant effect on the model, with an F value of 5.0116 and a p-value of 0.01202.
The interaction between "Group" and time does not have a significant effect on the model, with an F value of 1.0489 and a p-value of 0.36077. In summary, the intercept and time are significant factors in the model, while "Group" and the interaction between "Group" and time do not have a significant effect on the outcome.
Table 10.
Inter-group data analysis ANOVA K, K.t1, K.t2.
| Sum | Sq num | Df Error | SS den | Df F value | Pr (>F) | |
|---|---|---|---|---|---|---|
| Intercept | 3840.0 | 1 | 67.067 | 18 | 1030.6163 | <2.2e-16*** |
| Factor 1 - Group | 9.6 | 1 | 67.067 | 18 | 2.5765 | 0.1259 |
| Time | 98.8 | 2 | 76.133 | 36 | 23.3590 | 0.0000003138*** |
| Factor 1 – Group:Time | 6.4 | 2 | 76.133 | 36 | 1.5131 | 0.2339 |
Signif. codes: 0 '***' 0.001 '**' 0.01 '*' 0.05 '.' 0.1 ' ' 1.
Factor 1 - Group has a value of 9.6 with a Df of 1 and an SS den of 67.067. The F test has a value of 2.5765 with a Pr (>F) of 0.1259, which does not reach a level of statistical significance (). The factor "Time" has a value of 98.8 with a Df of 2 and an SS den of 76.133. The F test has a value of 23.3590 with a very low Pr (>F), indicating a very high statistical significance (**). Factor 1 - Group:Time has a value of 6.4 with a Df of 2 and an SS den of 76.133. The F test has a value of 1.5131 with a Pr (>F) of 0.2339, indicating that there is no statistical significance.
In conclusion, the "Intercept" factor and the "Time" factor are both statistically significant, while the factor 1 - Group is not. The factor 1 - Group:Time is not statistically significant.
Table 11.
Inter-group data analysis ANOVA TG, TGt1, TGT2 .
| Sum | Sq num | Df Error | SS den | Df F value | Pr (>F) | |
|---|---|---|---|---|---|---|
| Intercept | 832.54 | 1 | 43.775 | 18 | 342.3341 | 3.676e-13*** |
| Factor 1 - Group | 5.10 | 1 | 73.775 | 18 | 2.0988 | 0.1646 |
| Time | 13.12 | 2 | 13.650 | 36 | 17.3077 | 5.411e-06*** |
| Factor 1 – Group:Time | 0.06 | 2 | 13.650 | 36 | 0.0769 | 0.9261 |
Signif. codes: 0 '***' 0.001 '**' 0.01 '*' 0.05 '.' 0.1 ' ' 1.
In particular, time seems to have a significant effect on the data, while the Group factor does not seem to have a significant impact. There is no significant interaction between the Group factor and Time. Overall, these conclusions suggest that time is an important factor influencing the data, while the Group factor and the interaction between Group and Time do not have a significant effect.
Table 12.
Inter-group data analysis ANOVA TL, TLt1, TLt2.
| Sum | Sq num | Df Error | SS den | Df F value | Pr (>F) | |
|---|---|---|---|---|---|---|
| Intercept | 561.20 | 1 | 61.175 | 18 | 165.1275 | 1.664e-10*** |
| Factor 1 - Group | 24.70 | 1 | 61.175 | 18 | 7.2689 | 0.01477* |
| Time | 13.41 | 2 | 13.150 | 36 | 18.3536 | 3.199e-06*** |
| Factor 1 – Group:Time | 0.61 | 2 | 13.150 | 36 | 0.8327 | 0.44308 |
Signif. codes: 0 '***' 0.001 '**' 0.01 '*' 0.05 '.' 0.1 ' ' 1.
Factor 1 (Group) has a significant effect on the outcome (F=7.2689, p=0.01477), indicating that there is a significant difference between the groups considered in the study. Time has a significant effect on the outcome (F=18.3536, p=3.199e-06), indicating that there are significant variations over time. There is no significant interaction effect between Factor 1 and time (F=0.8327, p=0.44308), suggesting that the effect of the group on the outcome does not vary over time. In summary, we can conclude that there are significant differences between the groups considered in the study and significant variations over time, but the effect of the group on the outcome does not vary over time.
Table 13.
Inter-group data analysis ANOVA TT, TTt1, TTt2.
| Sum | Sq num | Df Error | SS den | Df F value | Pr (>F) | |
|---|---|---|---|---|---|---|
| Intercept | 268.817 | 1 | 50.283 | 18 | 96.2287 | 0.0000000120*** |
| Factor 1 - Group | 24.067 | 1 | 50.283 | 18 | 8.6152 | 0.008846** |
| Time | 15.633 | 2 | 12.467 | 36 | 22.5722 | 0.0000004434*** |
| Factor 1 – Group:Time | 0.233 | 2 | 12.467 | 36 | 0.3369 | 0.716208 |
Signif. codes: 0 '***' 0.001 '**' 0.01 '*' 0.05 '.' 0.1 ' ' 1.
The intercept and Time have a significant effect on the model, while factor 1 (Group) has a significant effect only in TT, TTt1, and TTt2. The interaction between Factor 1 (Group) and Time does not seem to significantly influence the model in any of the three cases.
Table 14.
Inter-group data analysis ANOVA VAS WITH ACTIVITIES VAS WITH ACTIVITIES T1, VAS WITH ACTIVITIES T2.
Table 14.
Inter-group data analysis ANOVA VAS WITH ACTIVITIES VAS WITH ACTIVITIES T1, VAS WITH ACTIVITIES T2.
| Sum | Sq num | Df Error | SS den | Df F value | Pr (>F) | |
|---|---|---|---|---|---|---|
| Intercept | 1188.15 | 1 | 181.1 | 18 | 118.0933 | 0.000000002448*** |
| Factor 1 - Group | 10.42 | 1 | 181.1 | 18 | 1.0353 | 0.3224 |
| Time | 201.70 | 2 | 162.4 | 36 | 22.3559 | 0.000000488176*** |
| Factor 1 – Group:Time | 7.23 | 2 | 162.4 | 36 | 0.8017 | 0.4564 |
Signif. codes: 0 '***' 0.001 '**' 0.01 '*' 0.05 '.' 0.1 ' ' 1.
Time has a significant effect on VAS scores. There are no significant differences between the groups in the effect on VAS scores. There is no significant effect of the interaction between group and time on VAS scores.
Table 15.
Inter-group data analysis ANOVA VAS AT REST, VAS AT REST T1, VAS AT REST T2.
| Sum | Sq num | Df Error | SS den | Df F value | Pr (>F) | |
|---|---|---|---|---|---|---|
| Intercept | 54.150 | 1 | 62.167 | 18 | 15.6788 | 0.0009188*** |
| Factor 1 - Group | 0.017 | 1 | 62.167 | 18 | 0.0048 | 0.9453834 |
| Time | 45.700 | 2 | 122.733 | 36 | 6.7023 | 0.0033544** |
| Factor 1 – Group:Time | 0.233 | 2 | 122.733 | 36 | 0.0342 | 0.9663898 |
Signif. codes: 0 '***' 0.001 '**' 0.01 '*' 0.05 '.' 0.1 ' ' 1.
The analysis of variance indicates that time has a significant effect on the outcome (p=0.0033544), while group and the interaction between group and time do not have a significant effect (p=0.9453834 and p=0.9663898 respectively). This suggests that rest has a significant impact on the outcome, while the type of group does not seem to greatly influence the outcome.
Table 16.
Inter-group data analysis ANOVA VAS AT NIGHT, VAS AT NIGHT T1, VAS AT NIGHT T2 .
| Sum | Sq num | Df Error | SS den | Df F value | Pr (>F) | |
|---|---|---|---|---|---|---|
| Intercept | 72.600 | 1 | 90.067 | 18 | 14.5093 | 0.0012851** |
| Factor 1 - Group | 26.667 | 1 | 90.067 | 18 | 5.3294 | 0.0330511* |
| Time | 61.900 | 2 | 114.933 | 36 | 9.6943 | 0.0004284*** |
| Factor 1 – Group:Time | 35.833 | 2 | 114.933 | 36 | 5.6119 | 0.0075602** |
Signif. codes: 0 '***' 0.001 '**' 0.01 '*' 0.05 '.' 0.1 ' ' 1.
The NIGHT VAS T1 shows a significant difference between groups; the NIGHT VAS T2 shows a significant difference between groups and a significant time effect; the NIGHT VAS shows a significant time effect and a significant interaction between group and time. However, it is important to note that the NIGHT VAS T2 has the lowest p-value, indicating that it may be the most significant.
INTRA-GROUP VARIATION ANALYSIS
To evaluate the differences within the various follow-ups for individual groups, the student t-test was used for normally distributed variables and the Wilcoxon test for non-normally distributed variables.
Table 17.
GROUP 0 intra-group variation analysis.
| p-value T0-T2 | p-value T1-T2 | p-value T0-T1 | |
|---|---|---|---|
| FIHOA | 0.0000547 | 0.00135 | 0.000159 |
| K | 0.00392 | 0.0886 | 0.0174 |
| TG | 0.013 | 0.528 | 0.0368 |
| TL | 0.00944 | 0.111 | 0.0318 |
| VAS WITH ACTIVITIES | 0.0016 | 0.000256 | 0.0185 |
Table 18.
GROUP 1 intra-group variation analysis.
| p-value T0-T2 | p-value T1-T2 | p-value T0-T1 | |
| FIHOA | 0.0000669 | 0.000473 | 0.0234 |
| K | 0.013 | 0.00911 | 0.000725 |
| TG | 0.00183 | 0.00953 | 0.132 |
| TL | 0.000173 | 0.00105 | 0.726 |
| VAS WITH ACTIVITIES | 0.256 | 0.116 | 0.101 |
- In group 0, the variable FIHOA shows significant differences between T0 and T2, T1 and T2, and T0 and T1.
- In group 0, the variable K shows significant differences between T0 and T1 and between T1 and T2, but not between T0 and T2.
- In group 0, the variables TG and TL show significant differences only between T0 and T1. • In group 0, the variable VAS WITH ACTIVITIES shows significant differences between T0 and T2 and between T1 and T2, but not between T0 and T1.
- In group 1, the variable FIHOA shows significant differences between T0 and T2 and between T1 and T2, but not between T0 and T1.
- In group 1, the variable K shows significant differences between T0 and T1 and between T0 and T2, but not between T1 and T2.
- In group 1, the variable TG shows significant differences between T0 and T2, but not between T1 and T2, and between T0 and T1.
- In group 1, the variable TL shows no significant differences between any time periods.
- In group 1, the variable VAS WITH ACTIVITIES shows no significant differences between any time periods.
To evaluate Jamar, pinch, and flex mf and if, we will move on to the Wilcoxon test.
Table 19.
GROUP 0 intra-group variation analysis.
| WILCOXON’S TEST | p-value | t0-t1 | t1-t2 | t0-t2 |
|---|---|---|---|---|
| FLEX IF | 0.0165 | 0.859 | ||
| FLEX MF | 0.0142 | 0.01424 | ||
| JAMAR | 0.0564 | 0.05639 | 0.0168 | 0.06584 |
| TT | 0.0263 | 0.02627 | 0.01356 | 0.05334 |
| VAS AT NIGHT | 0.0335 | 0.03501 | 0.3711 | 0.03351 |
| VAS AT REST | 0.176 | 0.1756 | 0.3711 | 0.1003 |
Table 20.
GROUP 1 intra-group variation analysis.
| WILCOXON’S TEST | p-value | t0-t1 | t1-t2 | t0-t2 |
|---|---|---|---|---|
| FLEX IF | 0.292 | 0.008969 | ||
| FLEX MF | 0.00583 | 0.005825 | ||
| JAMAR | 0.223 | 0.2228 | 0.1346 | 0.1221 |
| TT | 0.0568 | 0.05676 | 0.08897 | 0.01264 |
| VAS AT NIGHT | 0.181 | 1 | 0.3711 | 0.1814 |
| VAS AT REST | 0.0975 | 0.1975 | 0.3458 | 0.09751 |
- For the FLEX IF parameter, the two groups show significant differences only at time t0-t2, with a p-value of 0.008969 for Group 1.
- For the FLEX MF parameter, the two groups show significant differences only at time t0-t2, with a p-value of 0.00583 for Group 1.
- For the JAMAR parameter, the two groups do not show significant differences at any of the considered times.
- For the TT parameter, the two groups show significant differences at time t0-t2, with a p-value of 0.01264 for Group 1.
- For the VAS AT NIGHT parameter, the two groups do not show significant differences at any of the considered times.
- For the VAS AT REST parameter, the two groups do not show significant differences at any of the considered times.
Figure 1.
In the FIHOA, there is an increase in group 0 that decreases at t1 and t2.
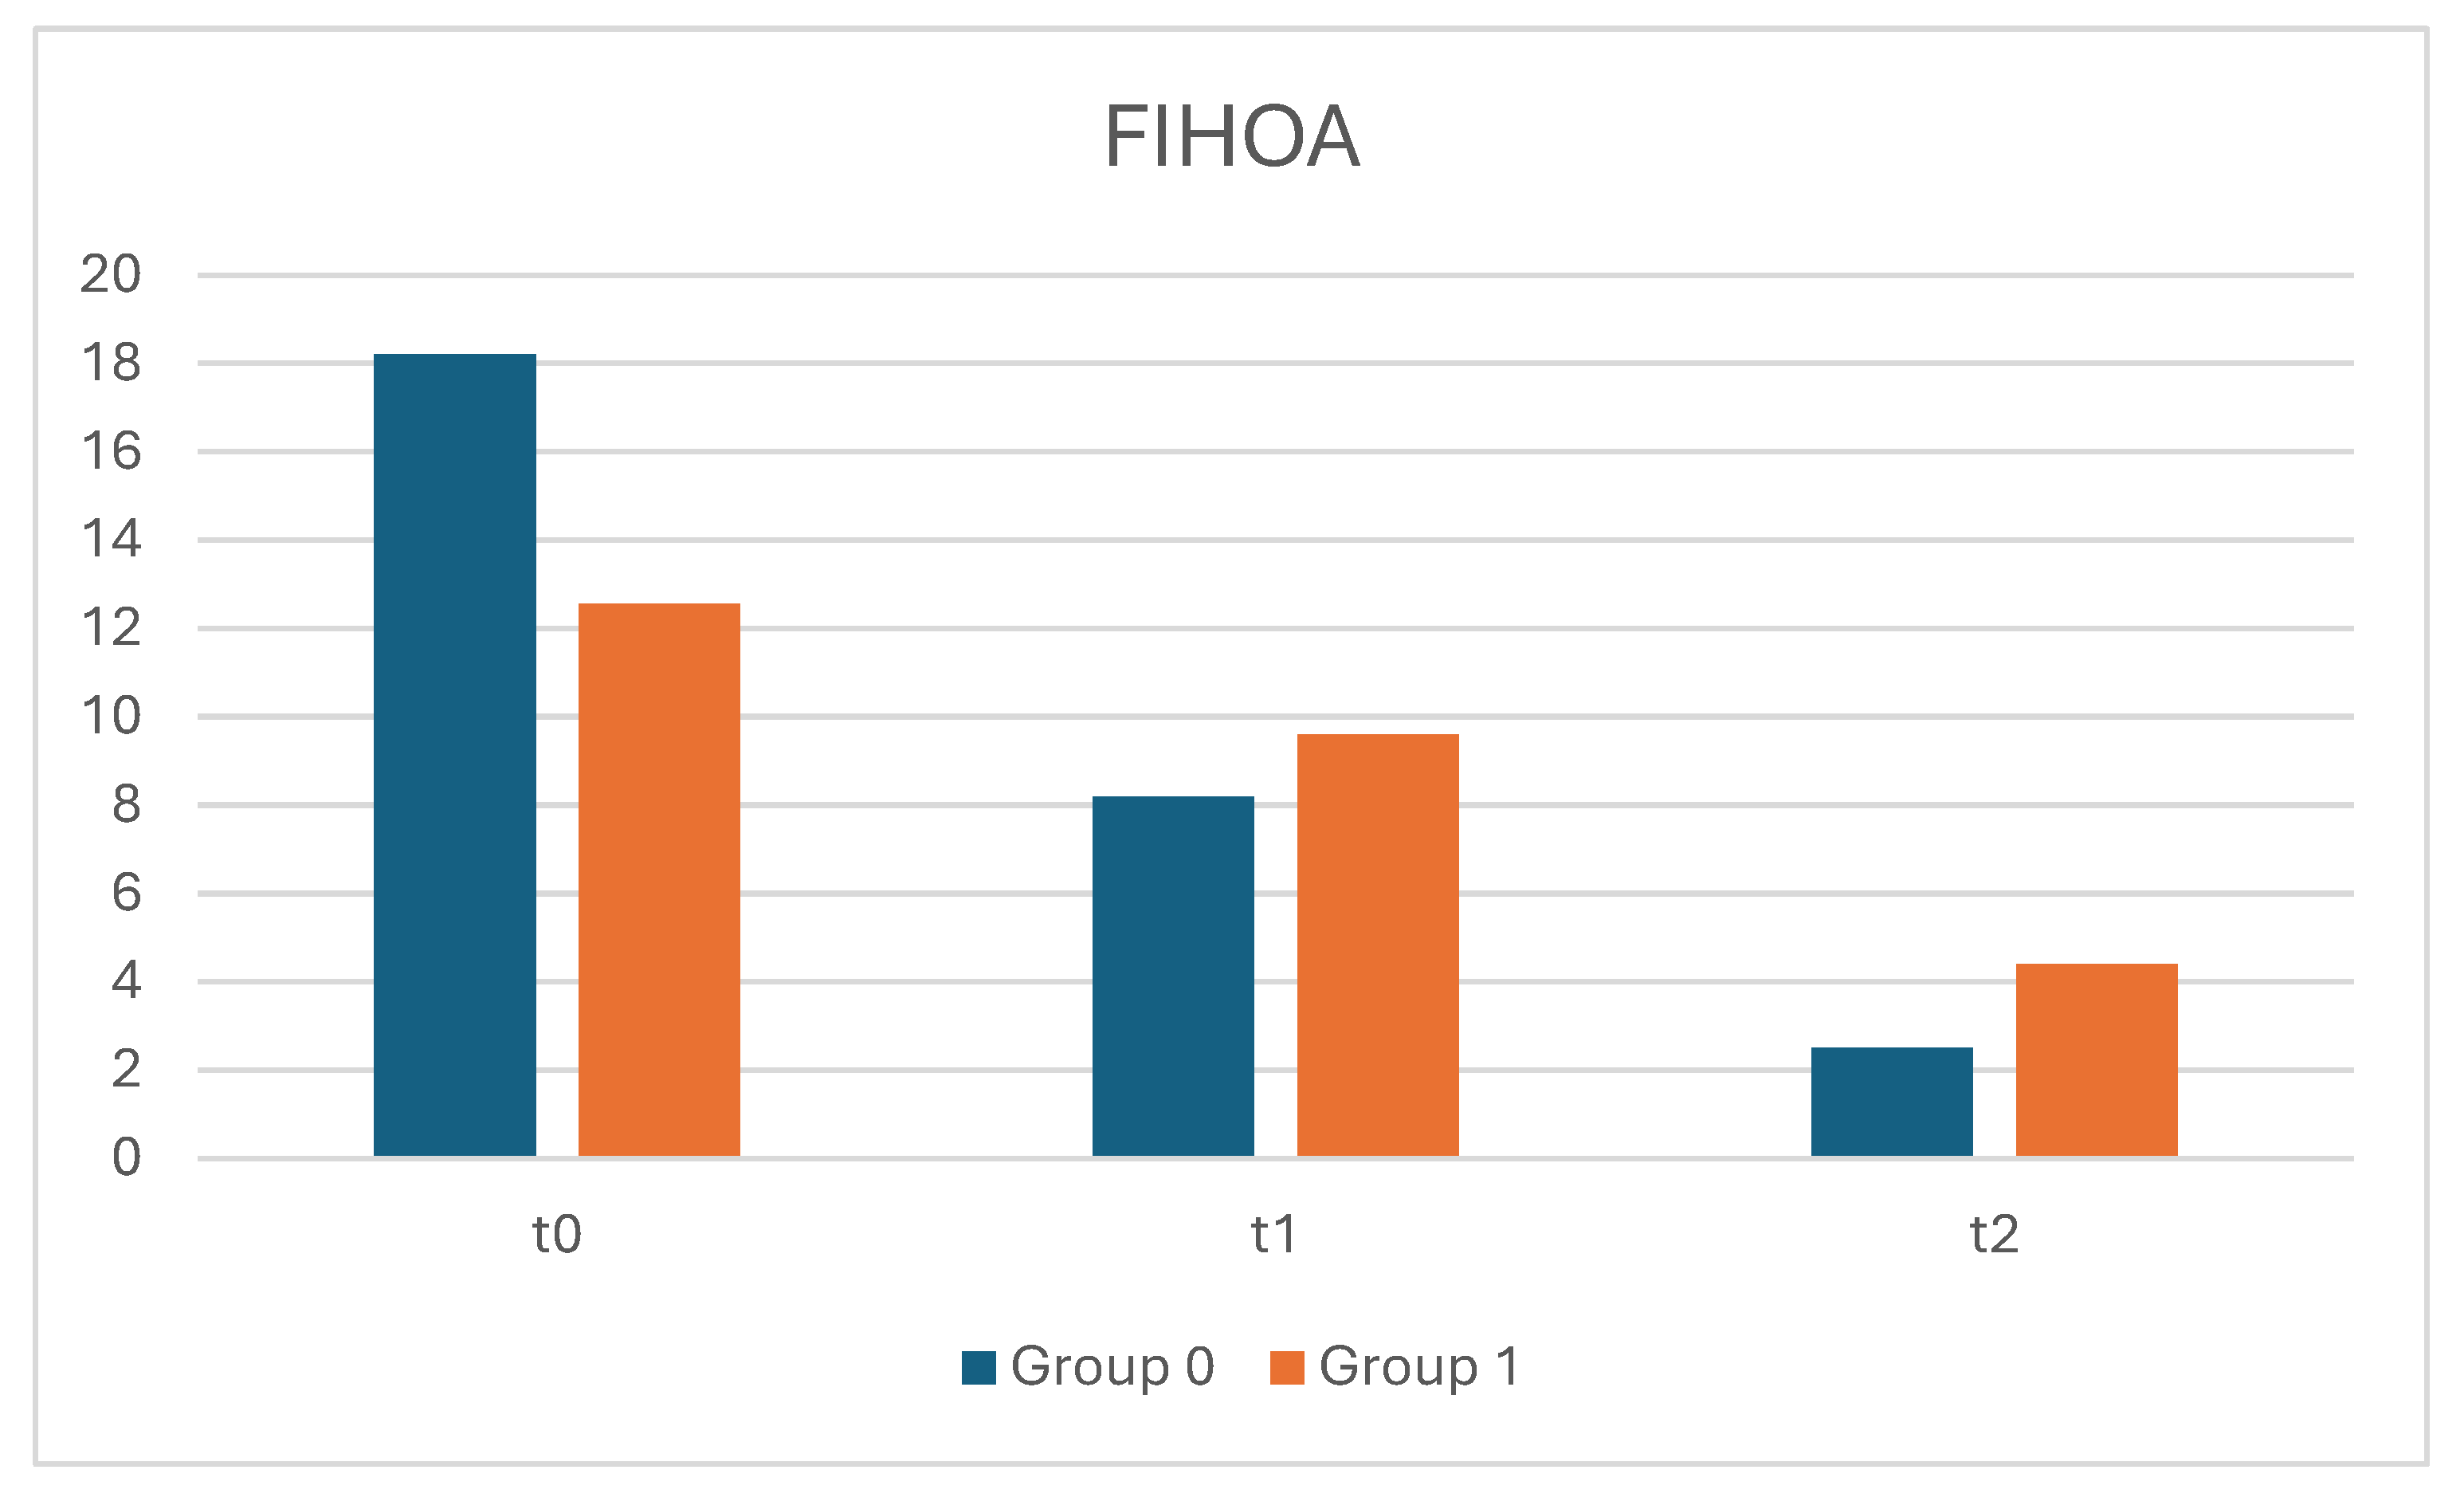
Figure 2.
A and B: In the evaluation of pain, we see how both evaluation groups started with high levels of pain during activities, with significant differences compared to the rest and nighttime VAS (group 0 had high levels during the night unlike group 1, while the rest VAS was low). The situation slightly changed at t1 but still showed high VAS levels during activities. By t3, the situation stabilized with significant improvement for both groups.
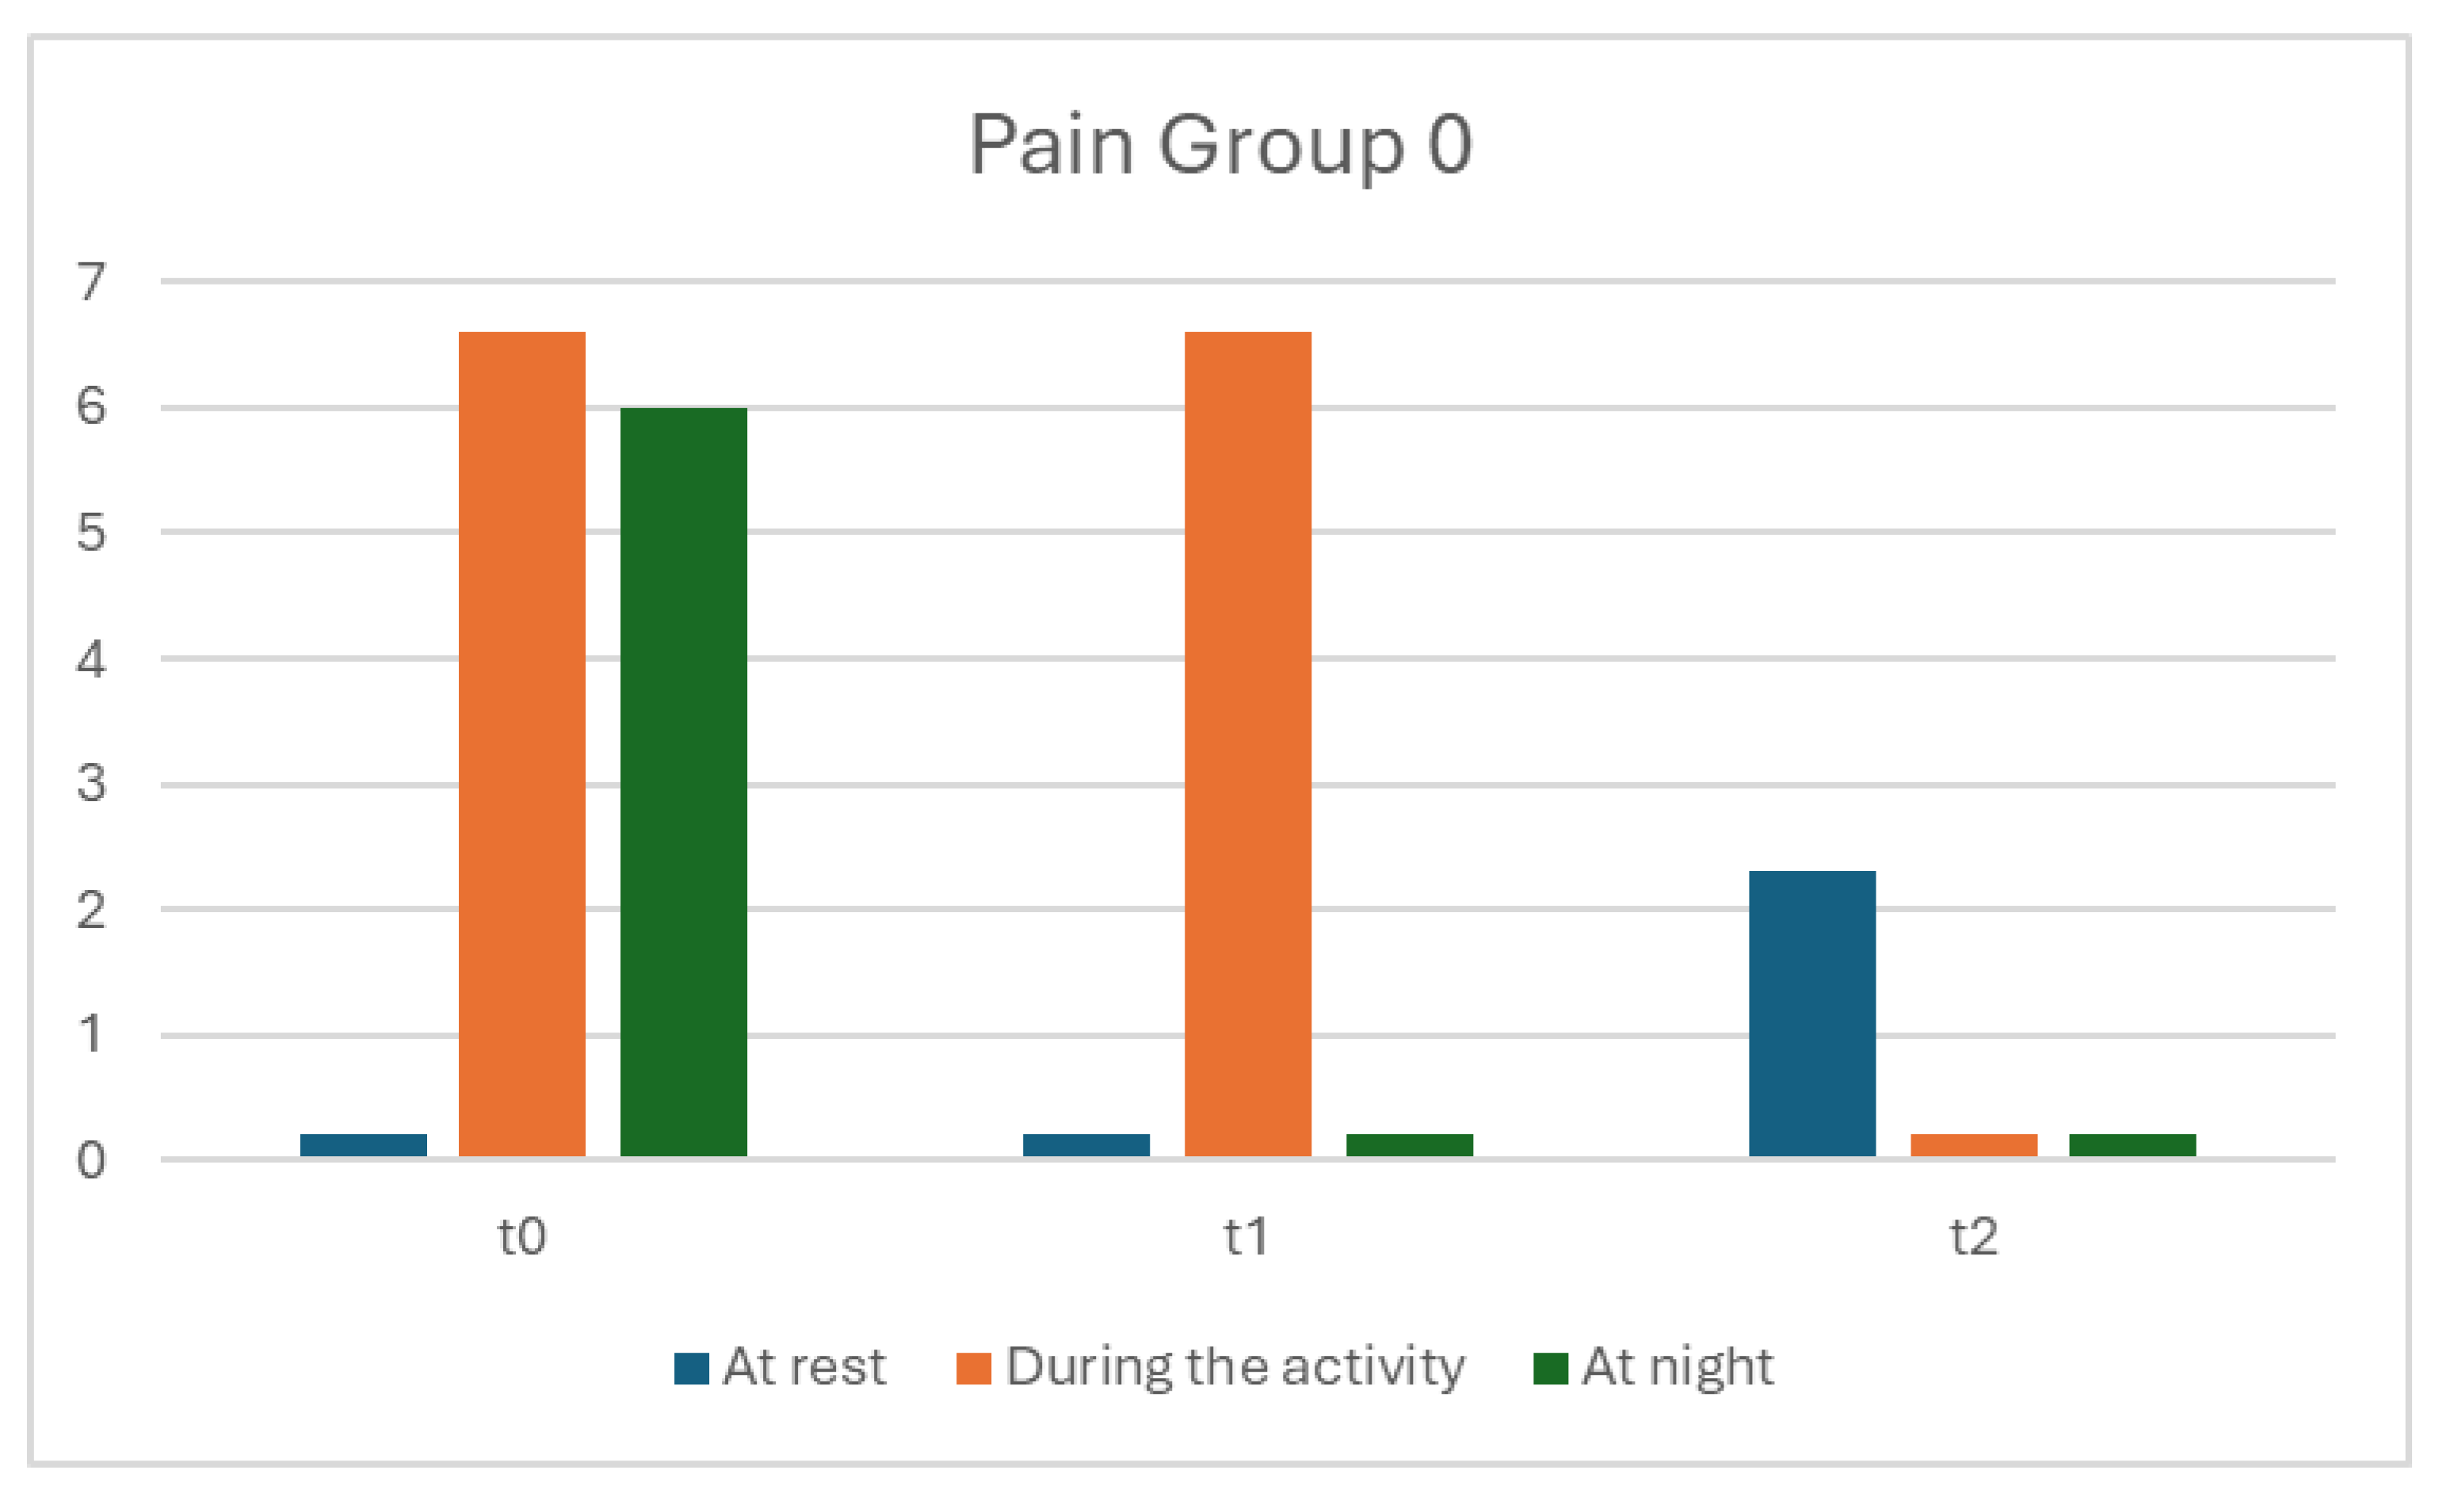
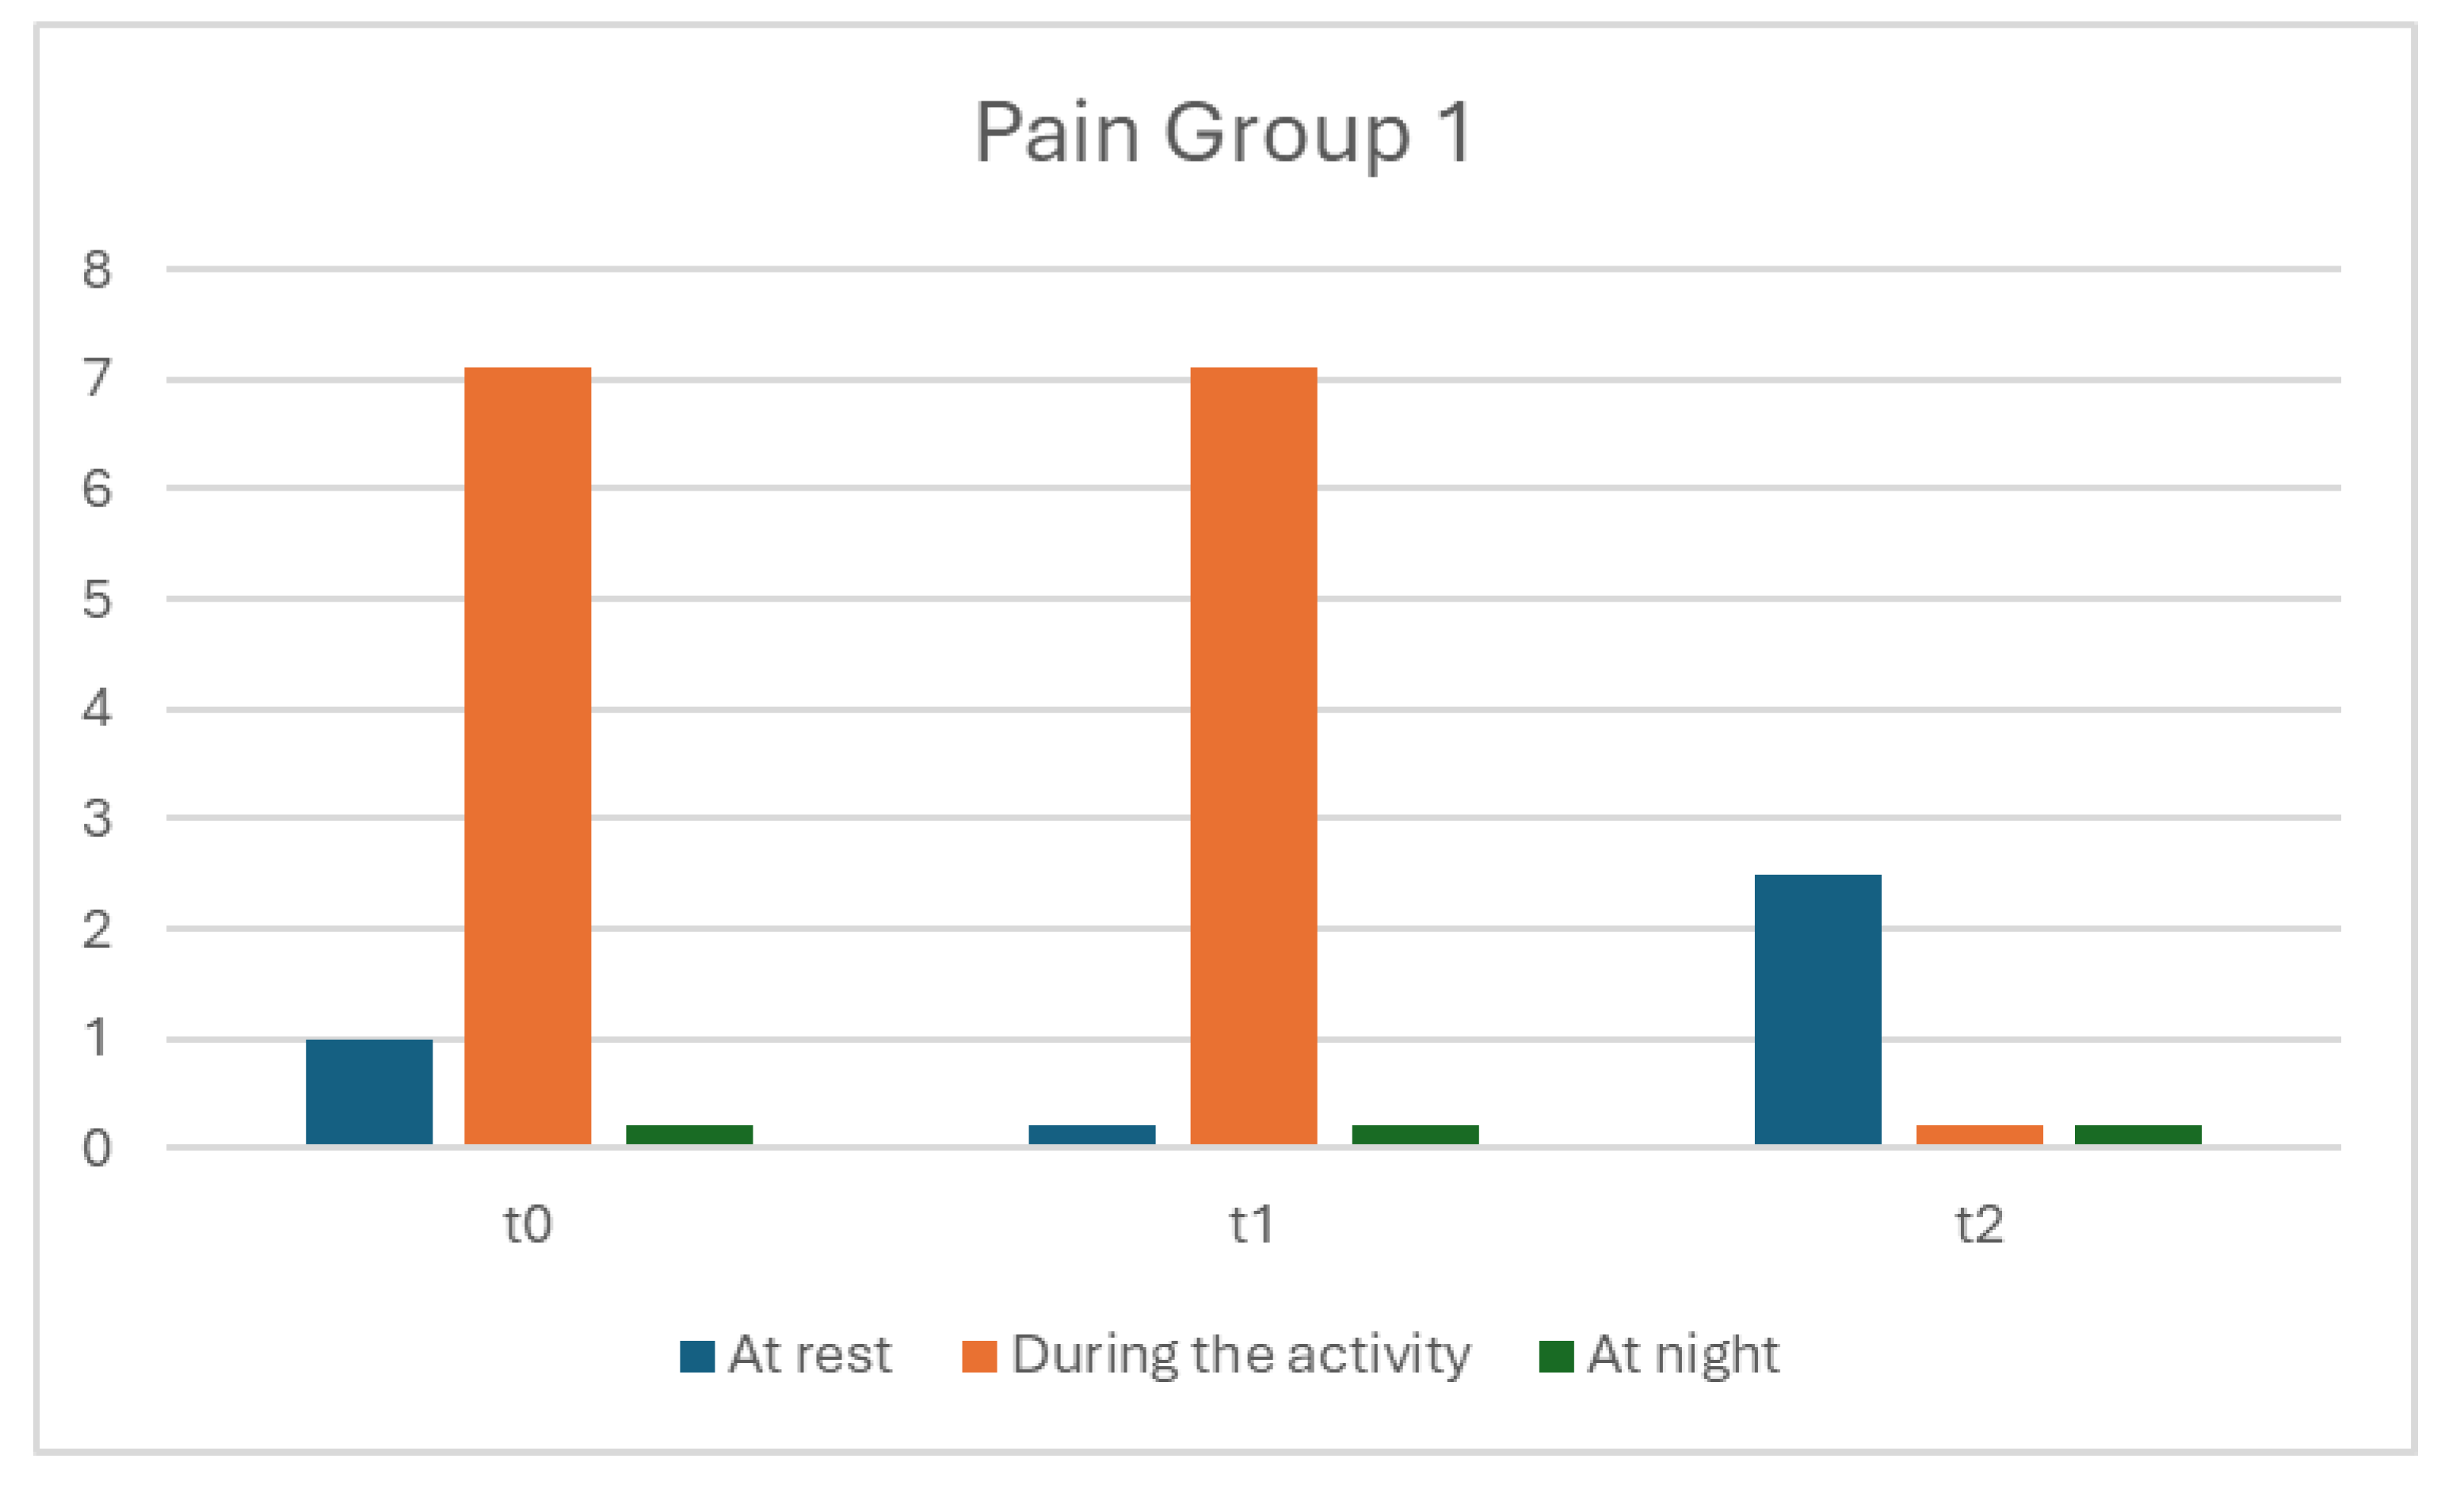
Figure 3.
A and B: In the evaluation of hand grip strength in both groups at T1, the strength ranged from 10-18 kg, increasing from T2 to T3 with a value of 27kg for group 0 and 11kg for group 1.
Figure 3.
A and B: In the evaluation of hand grip strength in both groups at T1, the strength ranged from 10-18 kg, increasing from T2 to T3 with a value of 27kg for group 0 and 11kg for group 1.
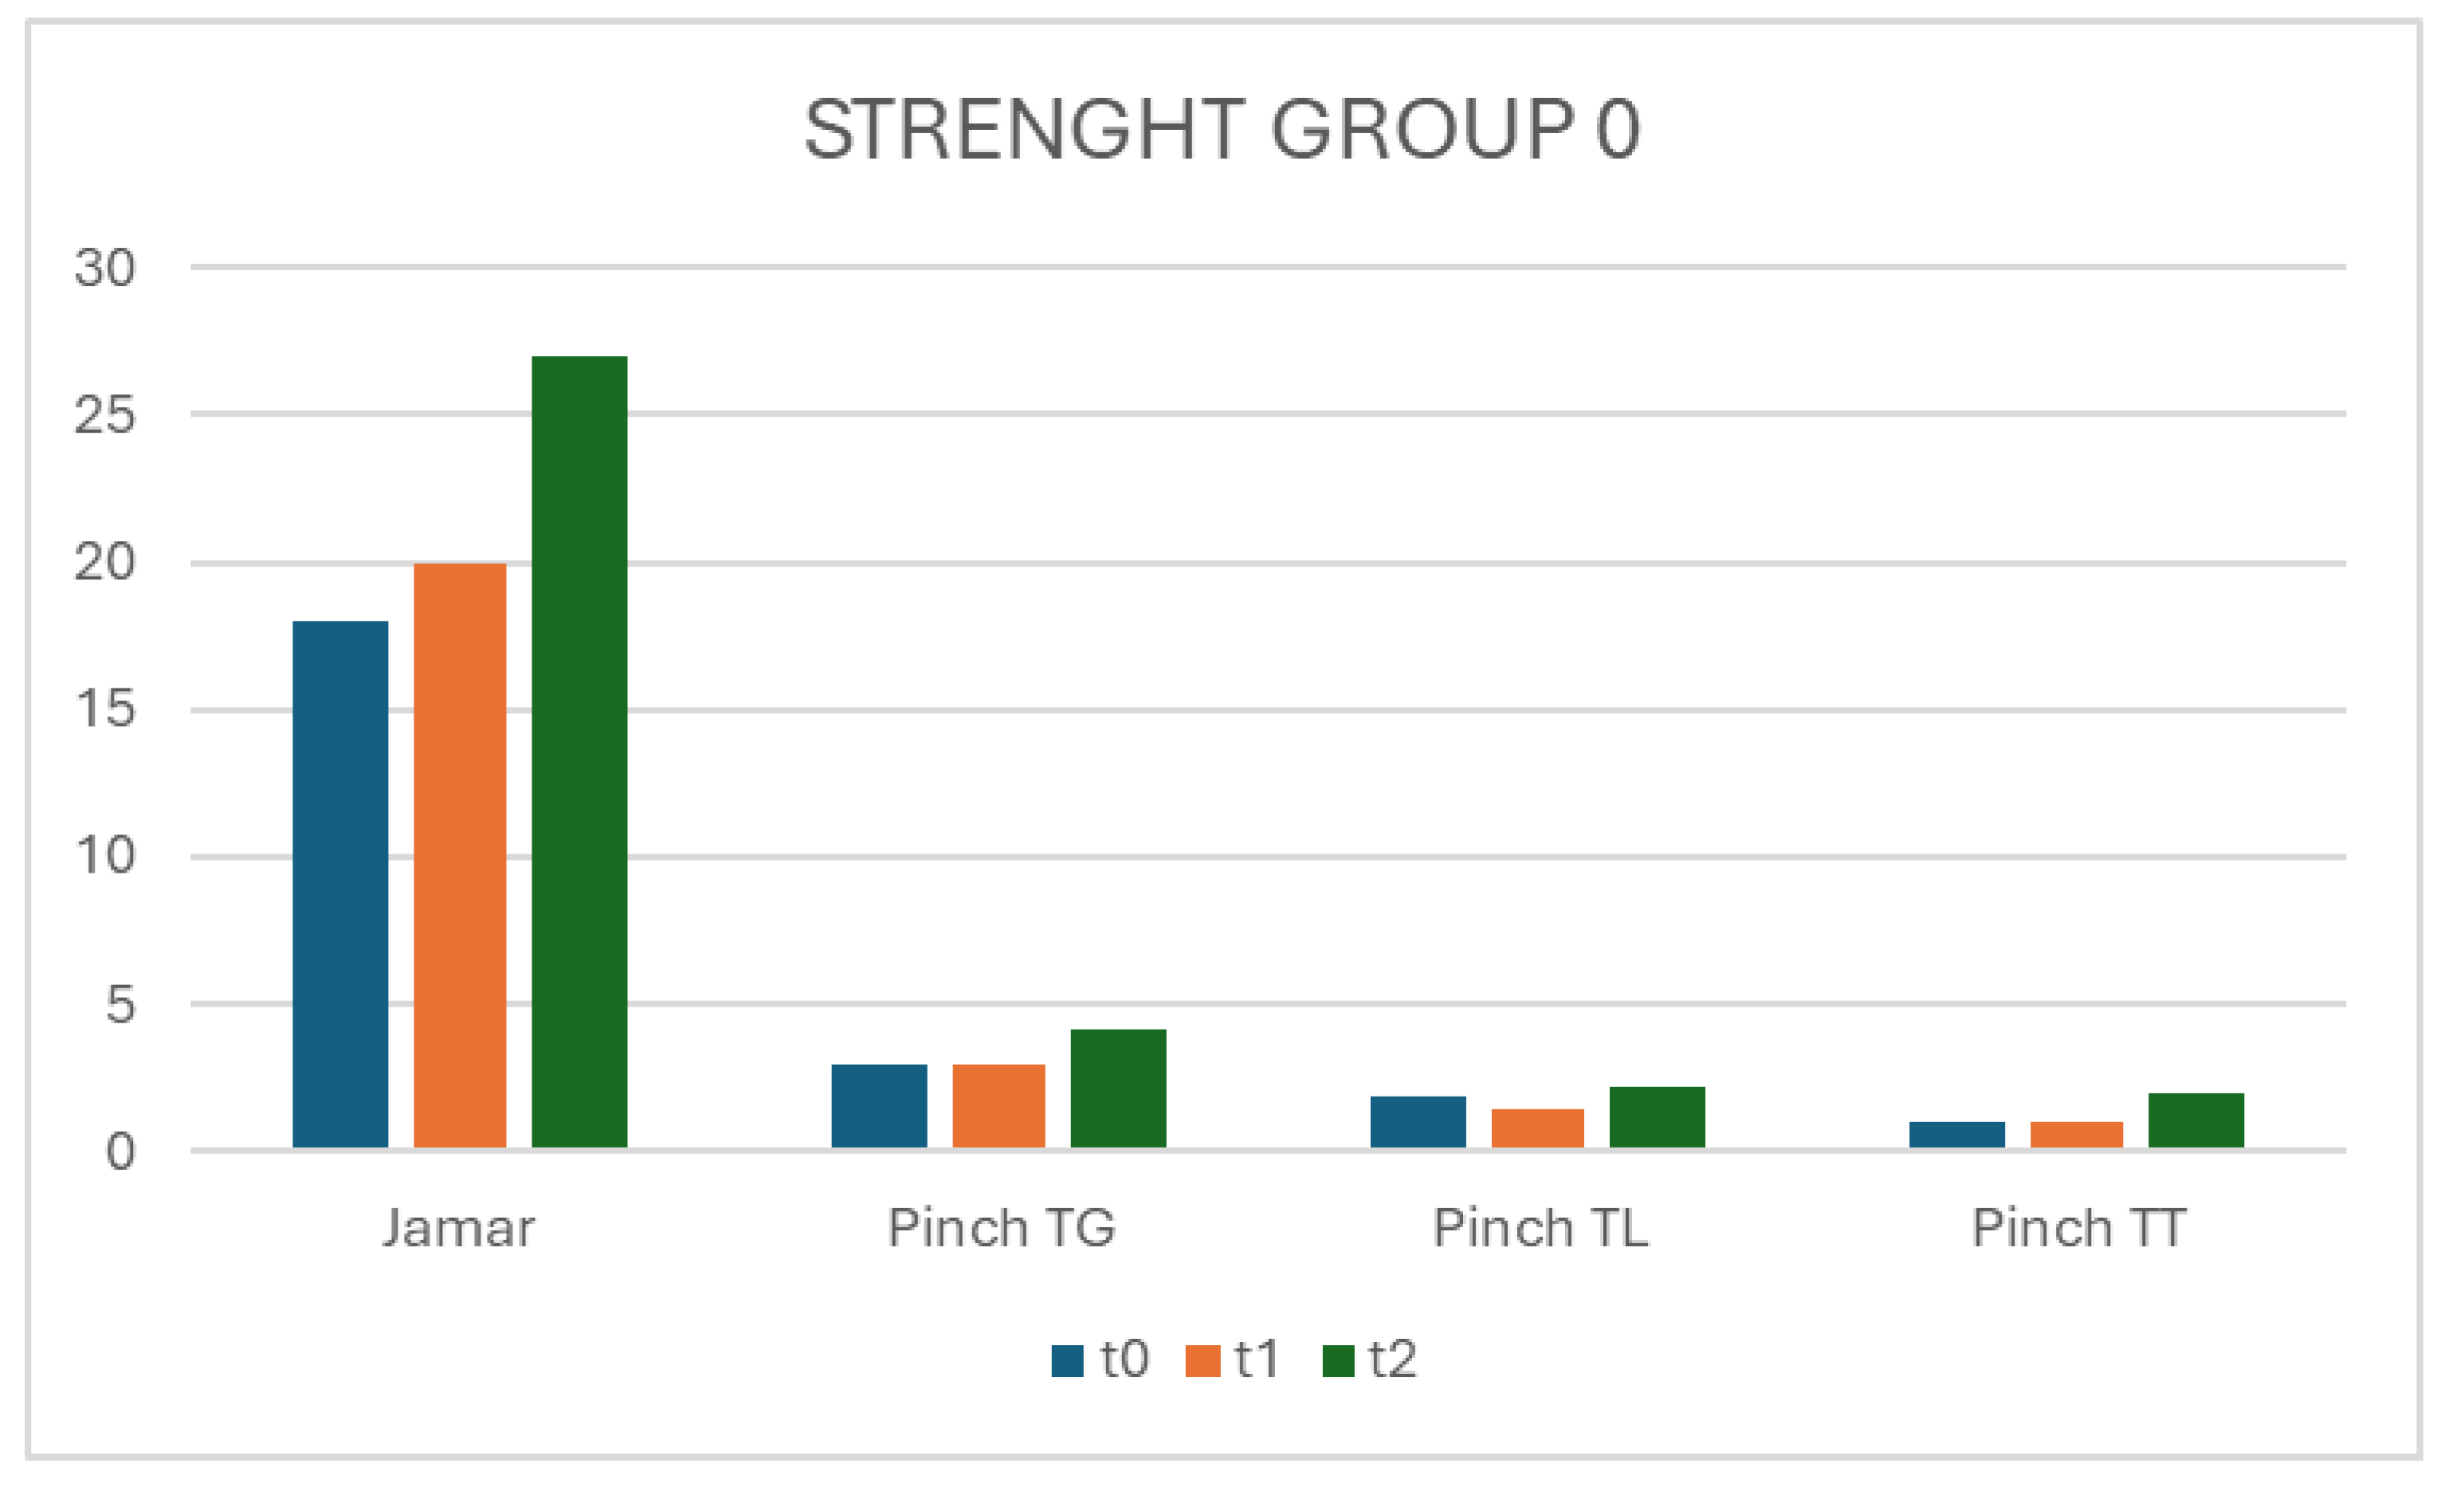
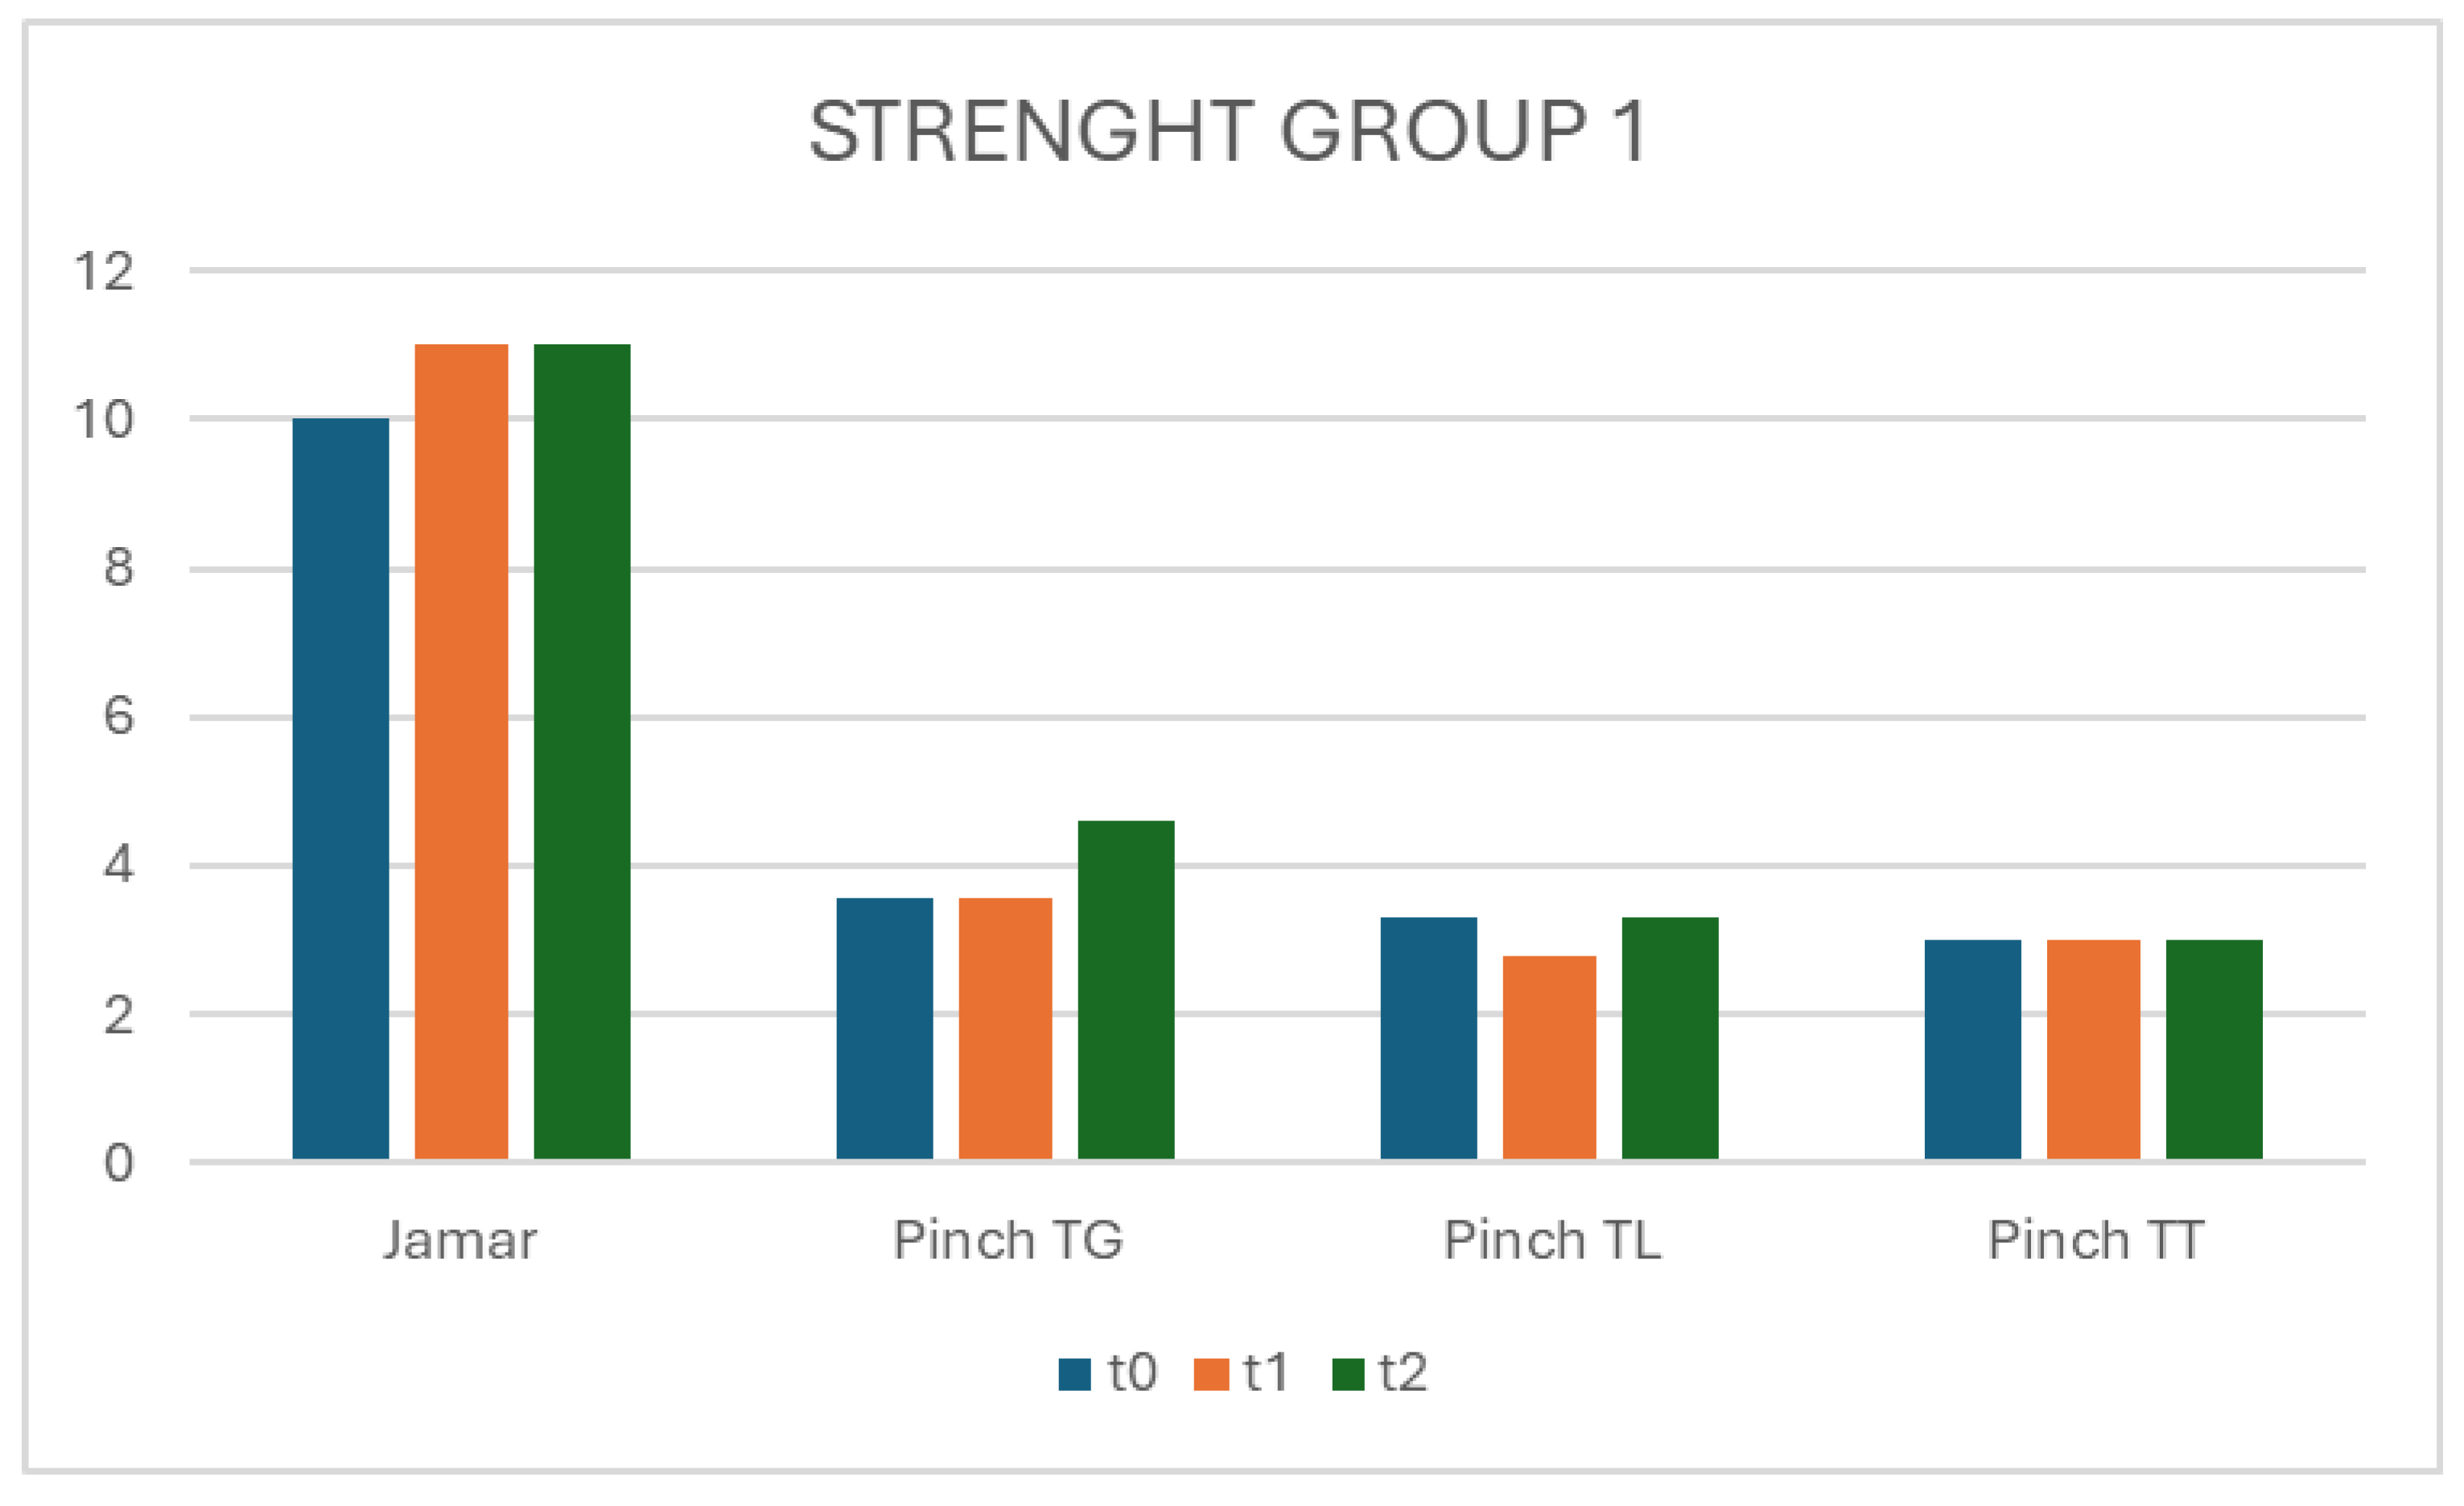
In the Pinch test at TG, TL and TT, there is an improvement in group 1 compared to group 0 from T0 to T2.
Figure 4.
A and B: In the ROM of flex MF and IF, there is a growing trend highlighted in both groups between t0 and t2, but with improvement in group 1.
Figure 4.
A and B: In the ROM of flex MF and IF, there is a growing trend highlighted in both groups between t0 and t2, but with improvement in group 1.
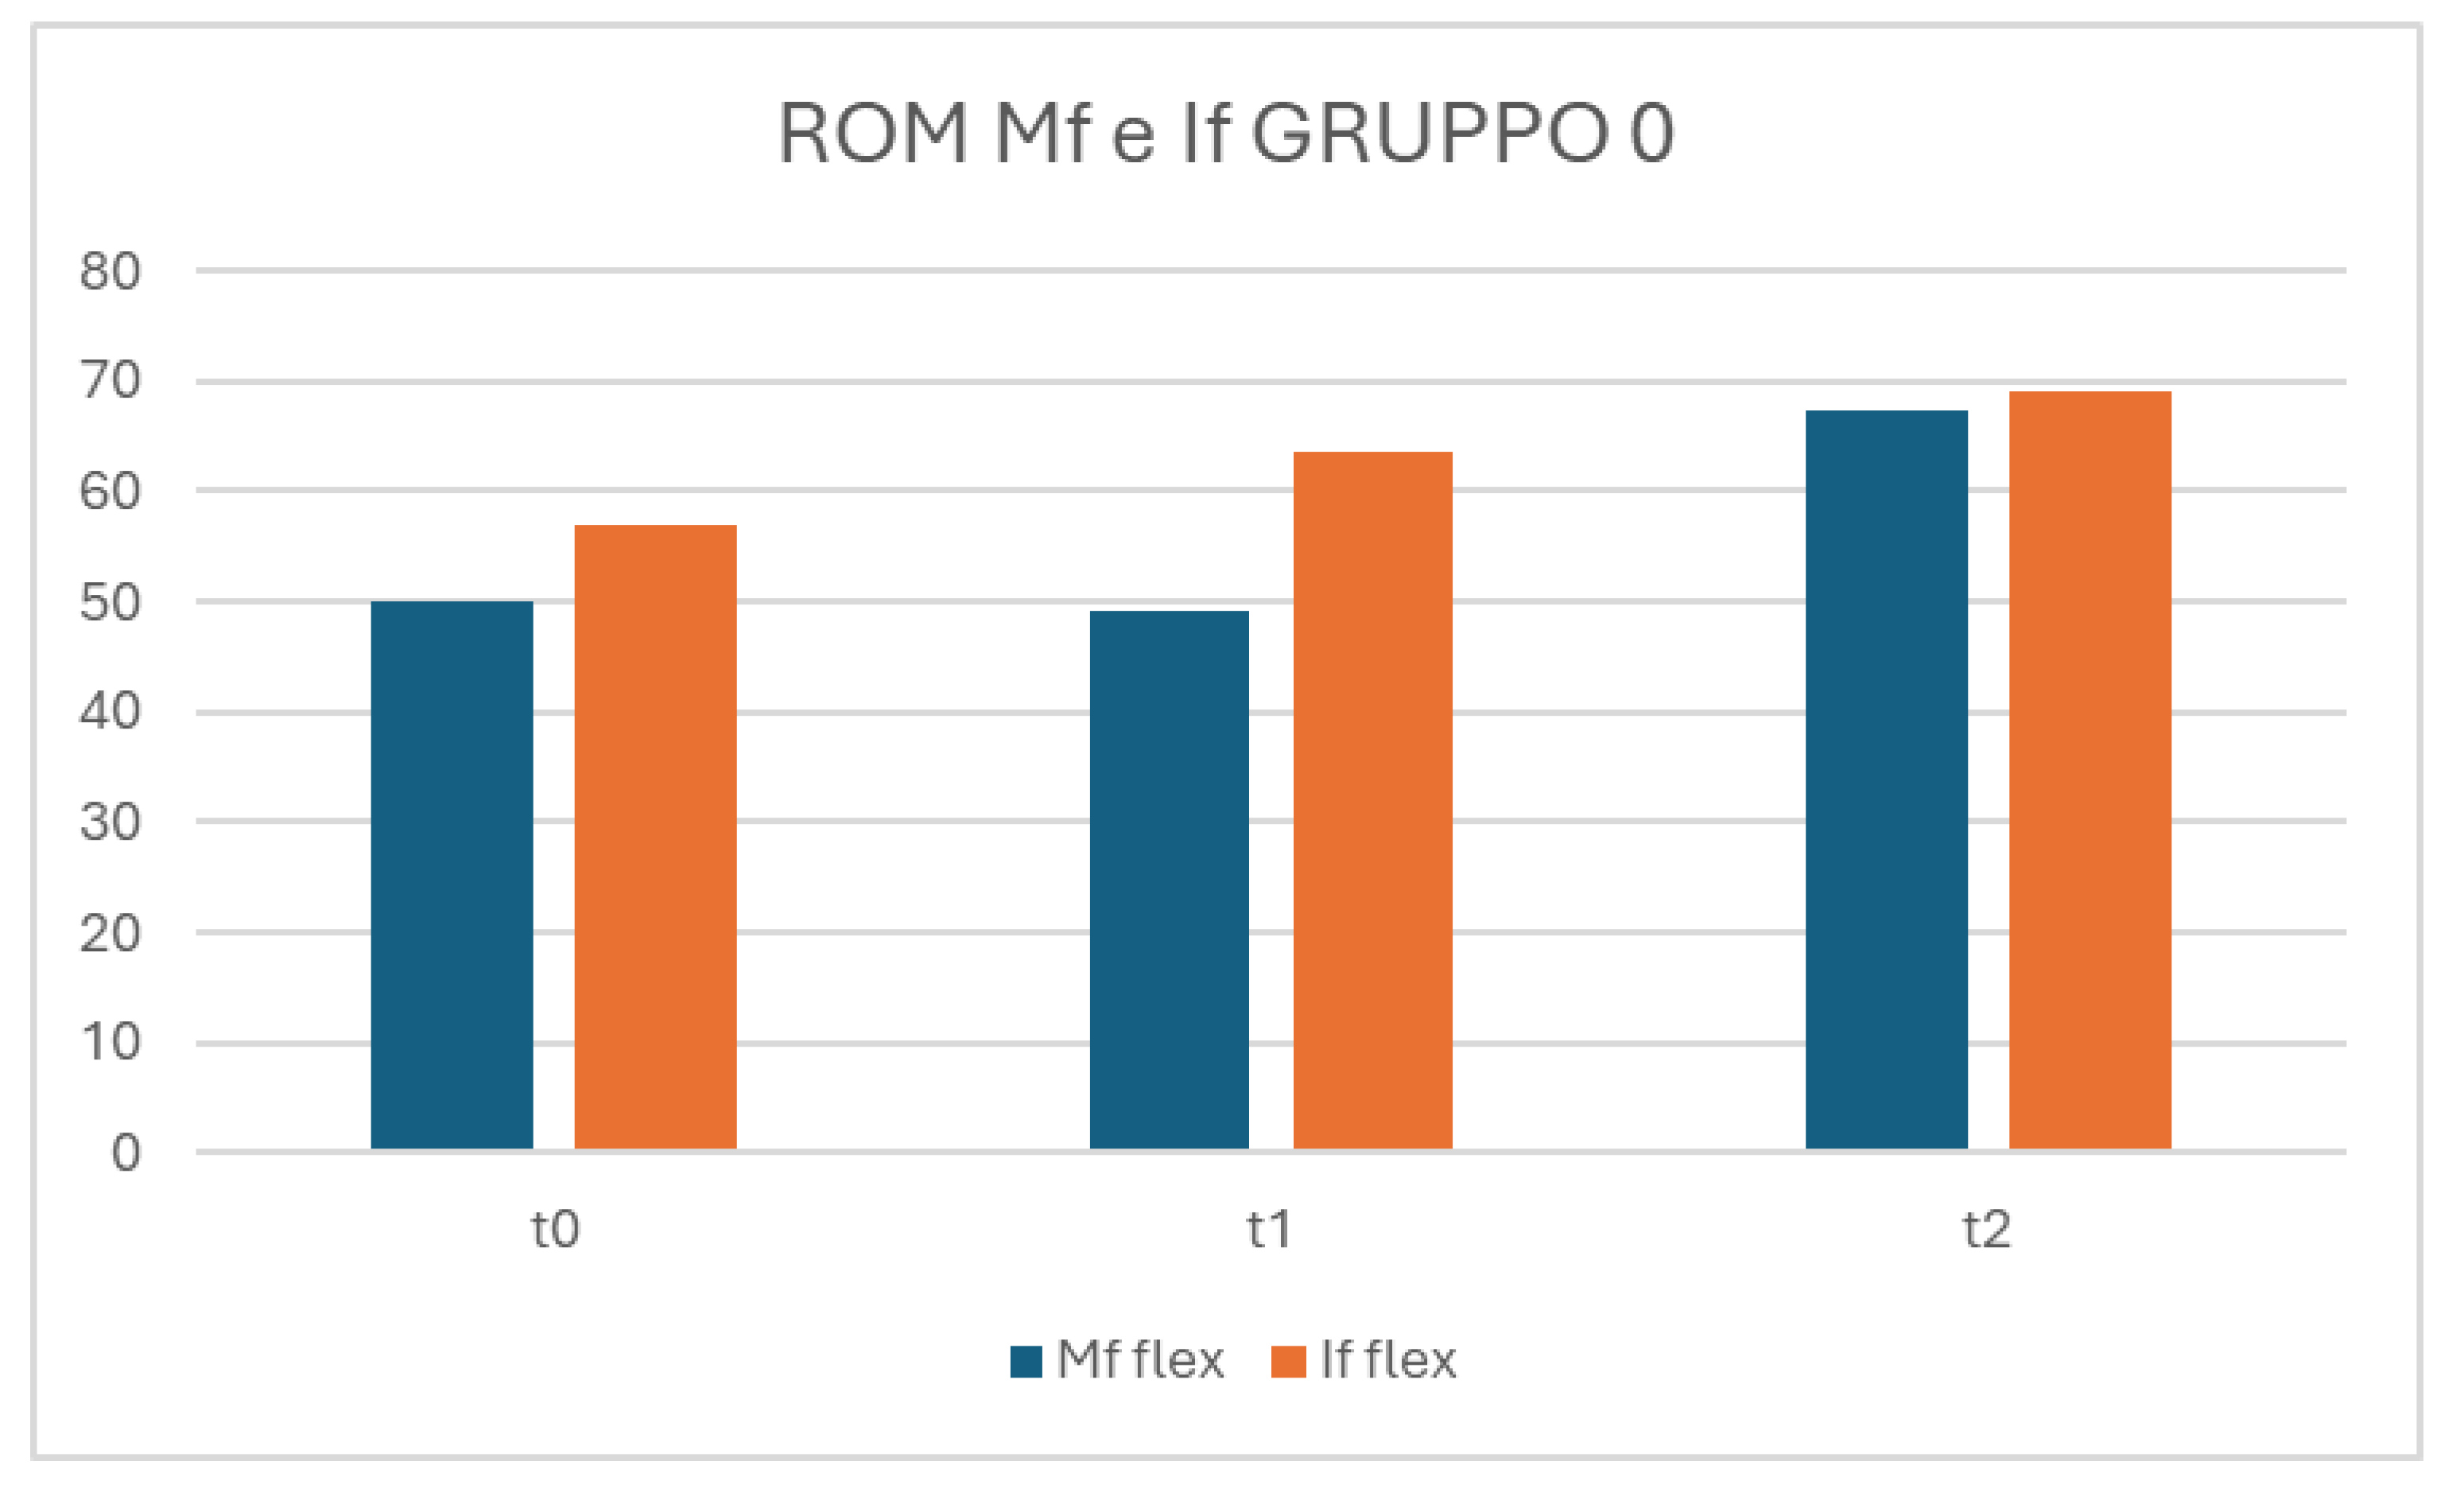
Figure 5.
App Hand Rehab. The first row displays screenshots of the homepage and menu page. The second row shows screenshots of the homepages for phases 1, 2, and 3. The third row includes screenshots of the exercise list for phase 1 and the video page for one of the exercises.
Figure 5.
App Hand Rehab. The first row displays screenshots of the homepage and menu page. The second row shows screenshots of the homepages for phases 1, 2, and 3. The third row includes screenshots of the exercise list for phase 1 and the video page for one of the exercises.
Discussion
The management of thumb carpometacarpal osteoarthritis (CMC-1 OA) varies widely across medical institutions, with treatment approaches influenced by factors such as patients' financial resources, the severity of symptoms, and the availability of specialized care. Non-surgical interventions have been shown to be effective in approximately 60% of cases, particularly when multiple treatment modalities are combined synergistically [9,15,16,17]. Positive outcomes with non-surgical management of CMC-1 OA, such as stable pain levels and maintained functionality in activities of daily living (ADL) after 12 months, have been reported in the literature, with some studies showing sustained benefits for over five years [14].
Conservative treatment typically includes activity modification, orthotic use, oral or topical anti-inflammatory medications, and intra-articular injections [11]. However, when conservative measures fail to adequately control symptoms, surgical intervention is often required [3,12,18,22]. A variety of surgical options are available, each aiming to relieve pain by eliminating the arthritic contact between the thumb metacarpal and the trapezium. Although various techniques are proposed to preserve trapezial height and optimize outcomes, no single procedure has demonstrated clear superiority in terms of long-term pain relief or functional improvement [12].
Interestingly, our findings align with previous studies showing that patients who initially underwent conservative therapy before surgery tended to have a longer duration before requiring surgical intervention [20]. Despite the higher initial costs associated with surgery, healthcare costs and utilization three years post-surgery were lower compared to those who continued with conservative treatment alone. However, the cost savings were insufficient to offset the initial surgical expenses [19].
Postoperative rehabilitation is a crucial component of recovery following surgery, contributing significantly to the restoration of function and pain reduction [22,23,24,25,26,27]. It also prevents the progression and need for treatment of carpal osteoarthritis in both young adult and elderly patients [38,39]. In our study, both groups demonstrated improvement over time, with Group 0 showing significant improvement across all measured variables, and Group 1 displaying improvement at specific intervals. The FIHOA scores improved consistently in Group 0, while Group 1 showed improvement in selected parameters. The t-test and repeated measures ANOVA confirmed overall improvement from baseline (T0) to final assessment (T2) in both groups, with time being a significant factor but no significant interaction between Group and Time. Additionally, the Wilcoxon test indicated significant improvements in both groups from T0 to T2, with Group 0 showing consistent enhancements in pain, hand functionality, and muscle strength across all time points, while Group 1 exhibited gains in pain, range of motion, muscle strength, and pinch test scores at specific intervals.
These findings suggest that personalized exercise programs, when combined with multiple treatment methods, can be highly effective in managing CMC-1 OA. The high satisfaction rates (80% on the CQS) among patients using the Hand-rehab App further underscore the potential benefits of incorporating digital tools into treatment regimens. The App offers several advantages, including progress monitoring, which allows patients and clinicians to track improvements in strength, flexibility, and pain over time. Additionally, its accessibility enables patients to perform exercises consistently, whether at home or while traveling.
However, reliance on technology presents certain challenges. Some patients may become dependent on the App, potentially hindering their ability to perform exercises independently. Furthermore, while the App offers a degree of personalization, it may not perfectly adapt to the specific needs of every user.
This study has several limitations, including its observational design, the lack of blinding, and a relatively small sample size. Additionally, the elderly population's limited ability to use smartphones and apps might have influenced the outcomes. Despite these limitations, the study's strengths include the implementation of personalized exercise programs and comprehensive outcome assessments, which provide valuable insights into the management of CMC-1 OA.
In conclusion, both groups showed significant improvement over time, with Group 1 exhibiting more pronounced gains in certain variables, suggesting that personalized exercise programs are an effective component of CMC-1 OA management. Further research is needed to address the study's limitations and to refine treatment approaches.
The app Hand-Rehab, developed in Italian to ensure patients fully understand it, undergone the patent process with the Italian Society of Authors and Editors (refistration number SIAE D000025019), along with its existing features and future updates. Plans for the future may include enhancing the app by translating it into additional languages and incorporating advanced features like Artificial Intelligence. This could involve adding a virtual assistant that provides real-time feedback and support, such as a Chat-GPT integrated with specialized texts, to increase user engagement and improve results.
Conclusions
The comparison between the effectiveness of exercises for thumb osteoarthritis with and without the use of specific apps in this randomized controlled clinical study compares clinical outcomes, pain, functionality, and patient satisfaction between the groups using the two exercise modalities. This study could help determine if the addition of a specific app can provide significant benefits compared to traditional exercise approaches.
Author Contributions
Caruso L. and Vigliarolo D. wrote the first draft of the manuscript and treated the patients. De Vitis R. and Vigliarolo D. created the app Hand Rehab with the webmaster Badolato E. De Vitis R. and Maggi L. supervised during the treatment of the patients. Frontani F. and Passiatore M. indipendently performed the statistical analysis. Vigliarolo D., Nigro G., Farinella D. acquired data of patients. De Vitis R., Cilli V., Marzella L., Guzzin M. reviewed critically the manuscript. De Vitis R. and Taccardo G. visited and recruited the patients. All authors have read and agreed to the published version of the manuscript.
Funding
The authors received no financial support for the research, authorship, and/or publication of this article.
Institutional Review Board Statement
Not required. This study is observational and was conducted as part of a dissertation, so ethical approval was not required.
Informed Consent Statement
Written informed consent was obtained from the patient for anon-ymized information to be published in this article.
Data Availability Statement
Acknowledgments
Badolato Egidio, Head of Digital Communication Roma Web Service S.r.l.
Conflicts of Interest
The author(s) declare no potential conflicts of interest with re-spect to the research, authorship, and/or publication of this article.
Legal office
Via Tor De’ Conti, 22 - 00184 Roma.
Operative office
Via Gavio Massimo, 13 – 00119 Roma.
egidiobadolato@gmail.com.
References
- Athlani L, De Almeida YK, Martins A, Seaourt AC, Dap F. Thumb basal joint arthritis in 2023. Orthop Traumatol Surg Res. 2024 Feb;110(1S):103772.
- Haara MM, Heliövaara M, Kröger H, et al. Osteoarthritis in the carpometacarpal joint of the thumb. Prevalence and associations with disability and mortality. J Bone Joint Surg Am. 2004;86(7):1452–7.
- Taccardo G, DE Vitis R, Parrone G, Milano G, Fanfani F. Surgical treatment of trapeziometacarpal joint osteoarthritis. Joints. 2013;1(3):138–44.
- Eaton RG, Littler JW. Ligament reconstruction for the painful thumb carpometacarpal joint. J Bone Joint Surg Am. 1973;55:1655–66.
- van der Oest MJW, Duraku LS, Andrinopoulou ER, Wouters RM, Bierma-Zeinstra SMA, Selles RW, Zuidam JM. The prevalence of radiographic thumb base osteoarthritis: a meta-analysis. Osteoarthritis Cartilage. 2021 Jun;29(6):785-792.
- Zarb RM, Sasor SE. Physical Examination and Radiographic Staging of Thumb Carpometacarpal Arthritis. Hand Clin. 2022 May;38(2):141-148.
- Melville DM, Taljanovic MS, Scalcione LR, Eble JM, Gimber LH, DeSilva GL, Sheppard JE. Imaging and management of thumb carpometacarpal joint osteoarthritis. Skeletal Radiol. 2015 Feb;44(2):165-77.
- Laronde P, Duriez P, Oca V, d’Almeida MA, Hustin C. Thumb basal joint arthritis: new classification, diagnostic and therapeutic algorithm. Hand Surg Rehabil. 2022;41(4):419–25.
- Kanak M, Rokicki R, Wojna J. Trapeziometacarpal Osteoarthritis. Conservative and Surgical Treatment. A Diagnostic-Therapeutic Algorithm. Ortop Traumatol Rehabil. 2023 Feb 28;25(1):23-32. PMID: 38078349. [CrossRef]
- Yuan F, Aliu O, Chung KC, Mahmoudi E. Evidence-based practice in the surgical treatment of thumb carpometacarpal joint arthritis. J Hand Surg Am. 2017;42(2):104-112.e1.
- O'Shaughnessy MA, Rizzo M. Nonoperative Management of Carpometacarpal Joint Arthritis. Hand Clin. 2022 May;38(2):161-168. PMID: 35465934. [CrossRef]
- Folchert MD, Tosti R, Rizzo M, Ladd AL, Jupiter JB, Zelouf DS. Managing Challenges in Thumb Carpometacarpal Arthritis. Instr Course Lect. 2022;71:147-162.
- Algar L, Naughton N, Ivy C, Loomis K, McGee C, Strouse S, Fedorczyk J. Assessment and treatment of nonsurgical thumb carpometacarpal joint osteoarthritis: A modified Delphi-based consensus paper of the American Society of Hand Therapists. J Hand Ther. 2023 Oct-Dec;36(4):982-999. Epub 2023 Oct 3. PMID: 37798185. [CrossRef]
- Esteban Lopez LMJ, Hoogendam L, Vermeulen GM, Tsehaie J, Slijper HP, Selles RW, Wouters RM; The Hand-Wrist Study Group. Long-Term Outcomes of Nonsurgical Treatment of Thumb Carpometacarpal Osteoarthritis: A Cohort Study. J Bone Joint Surg Am. 2023 Dec 6;105(23):1837-1845. Epub 2023 Oct 30. PMID: 37903291; PMCID: PMC10695337. [CrossRef]
- McVeigh KH, Kannas SN, Ivy CC, Garner HW, Barnes CS, Heckman MG, Brushaber DE, Murray PM. Dynamic stabilization home exercise program for treatment of thumb carpometacarpal osteoarthritis: A prospective randomized control trial. J Hand Ther. 2022 Jul-Sep;35(3):435-446. Epub 2021 Jul 24. PMID: 34312043. [CrossRef]
- Deveza LA, Robbins SR, Duong V, Bennell KL, Vicenzino B, Hodges PW, Wajon A, Jongs R, Riordan EA, Fu K, Oo WM, O'Connell RL, Eyles JP, Hunter DJ. Efficacy of a Combination of Conservative Therapies vs an Education Comparator on Clinical Outcomes in Thumb Base Osteoarthritis: A Randomized Clinical Trial. JAMA Intern Med. 2021 Apr 1;181(4):429-438. PMID: 33683300; PMCID: PMC7941246. [CrossRef]
- Cantero-Téllez R, Pérez-Cruzado D, Villafañe JH, García-Orza S, Naughton N, Valdes K. The Effect of Proprioception Training on Pain Intensity in Thumb Basal Joint Osteoarthritis: A Randomized Controlled Trial. Int J Environ Res Public Health. 2022 Mar 17;19(6):3592. PMID: 35329279; PMCID: PMC8955750. [CrossRef]
- Billig JI, Kane RL, Yue M, Wang L, Chung KC. Discrepancies in conservative treatment for thumb carpometacarpal arthritis: a comparison between different specialities and patient characteristics. J Hand Surg Eur Vol. 2021 Feb;46(2):141-145. Epub 2020 Sep 9. PMID: 32903123; PMCID: PMC9979249. [CrossRef]
- Yoon AP, Wu H, Chung WT, Wang L, Chung KC. Comparison of Long-Term Healthcare Cost and Utilisation of nonoperative and Surgical Management of Thumb CMC Arthritis. J Hand Surg Asian Pac Vol. 2024 Jun;29(3):191-199. Epub 2024 May 10. PMID: 38726498. [CrossRef]
- Portney DA, Stillson QA, Strelzow JA, Wolf JM. Is Hand Therapy Associated With a Delay in Surgical Treatment in Thumb Carpometacarpal Arthritis? J Hand Surg Am. 2023 Jul 29:S0363-5023(23)00296-4. Epub ahead of print. PMID: 37516939. [CrossRef]
- Schloemann D, Hammert WC, Liu S, Bernstein DN, Calfee RP. Risk Factors for Failed Nonsurgical Treatment Resulting in Surgery on Thumb Carpometacarpal Arthritis. J Hand Surg Am. 2021 Jun;46(6):471-477.e1. Epub 2021 Apr 6. PMID: 33832788. [CrossRef]
- Passiatore M, Taccardo G, Cilli V, Rovere G, Liuzza F, Pannuto L, De Vitis R. Surgical treatment of carpometacarpal thumb arthritis with trapeziectomy and intra-tendon (FCR) suspension with one-loop APL: comparative cohort study. BMC Musculoskelet Disord. 2023 Apr 25;24(1):328.
- Herren DB. Basal thumb arthritis surgery: complications and its management. J Hand Surg Eur Vol. 2024 Feb;49(2):188-200.
- Herren DB, Boeckstyns M, Chung KC, Farnebo S, Hagert E, Tang JB, Verstreken F; FaiTh study group; Marks M. Diagnostic and treatment recommendations for recurrent or persistent symptoms after trapeziectomy: a Delphi study. J Hand Surg Eur Vol. 2024 Jan 31:17531934241227386.
- De Vitis R, Taccardo G, Passiatore M, Boekstyns M, Marks M, Herren DB; FaiTh study group. Re: Herren DB, Boeckstyns M, Chung KC et al. Diagnostic and treatment recommendations for recurrent or persistent symptoms after trapeziectomy: a Delphi study. J Hand Surg Eur Vol. 2024. J Hand Surg Eur Vol. 2024 Apr 29:17531934241248567. [CrossRef]
- Herren DB, Marks M, Neumeister S, Schindele S. Short-term recovery after implant versus resection arthroplasty in trapeziometacarpal joint osteoarthritis. J Hand Surg Eur Vol. 2023 Nov;48(10):1048-1055.
- De Vitis R, Taccardo G, Passiatore M. Re: Herren DB, Marks M, Neumeister S, Schindele S. Short-term recovery after implant versus resection arthroplasty in trapeziometacarpal joint osteoarthritis. J Hand Surg Eur. 2023. J Hand Surg Eur Vol. 2024 Mar;49(3):384-385.
- Phan A, Calderon T, Hammert WC. Evaluation of PROMIS Scores 6 Weeks after Conservative Management of Carpometacarpal Thumb Arthritis. Plast Reconstr Surg Glob Open. 2022 Oct 7;10(10):e4493. PMID: 36225844; PMCID: PMC9542898. [CrossRef]
- Passiatore M, De Vitis R, Cilli V, et al. The Italian version of the Michigan Hand Outcomes Questionnaire (MHQ): translation, cross-cultural adaptation and validation. J Hand Surg Asian Pac. 2021;26(4):666–83.
- Padua R, Padua L, Ceccarelli E, et al. Italian version of the Disability of the Arm, Shoulder and Hand (DASH) questionnaire. Cross-cultural adaptation and validation. J Hand Surg Br. 2003;28(2):179–86.
- Gandini F, Giannitti C, Fattore G, Giordano N, Galeazzi M, Fioravanti A. Validation of an Italian version of the functional index for hand osteoarthritis (FIHOA). Mod Rheumatol. 2012 Sep;22(5):758-65. Epub 2012 Jan 15. PMID: 22245976. [CrossRef]
- Poole JL. Measures of hand function: Arthritis Hand Function Test (AHFT), Australian Canadian Osteoarthritis Hand Index (AUSCAN), Cochin Hand Function Scale, Functional Index for Hand Osteoarthritis (FIHOA), Grip Ability Test (GAT), Jebsen Hand Function Test (JHFT), and Michigan Hand Outcomes Questionnaire (MHQ). Arthritis Care Res (Hoboken). 2011 Nov;63 Suppl 11:S189-99. PMID: 22588744. [CrossRef]
- Valdes KA, Rider JV. Test-retest reliability of joint position sense in the carpometacarpal joint among healthy adults. J Hand Ther. 2024 Apr-Jun;37(2):238-242. Epub 2023 Sep 27. PMID: 37775433. [CrossRef]
- Weinstock-Zlotnick G, Lin B, Nwawka OK. Clinical Assessments of Hand Function in First Carpometacarpal Osteoarthritis Do Not Appear to Correlate with Radiographic Findings. HSS J. 2019 Oct;15(3):269-275. Epub 2019 Aug 7. PMID: 31624483; PMCID: PMC6778263. [CrossRef]
- Wright HH, O'Brien V, Valdes K, Koczan B, MacDermid J, Moore E, Finley MA. Relationship of the Patient-Specific Functional Scale to commonly used clinical measures in hand osteoarthritis. J Hand Ther. 2017 Oct-Dec;30(4):538-545. Epub 2017 Aug 12. PMID: 28807599. [CrossRef]
- El Khoury G, Penta M, Barbier O. ABILHAND-HS: a linear scale for outcome measurement in hand surgery. J Hand Surg Eur Vol. 2021 Feb 8:1753193421991485. Epub ahead of print. PMID: 33557681. [CrossRef]
- Hamilton CB, Chesworth BM. A Rasch-validated version of the upper extremity functional index for interval-level measurement of upper extremity function. Phys Ther. 2013 Nov;93(11):1507-19. Epub 2013 Jun 27. PMID: 23813086; PMCID: PMC3827714. [CrossRef]
- Rocchi L, De Vitis R, Pietramala S, Fulchignoni C, D'Orio M, Mazzone V, Marcuzzi A. Resurfacing Capitate Pyrocarbon Implant for the treatment of advanced wrist arthritis in the elderly: a retrospective study. Eur Rev Med Pharmacol Sci. 2022 Nov;26(1 Suppl):92-99. PMID: 36448861. [CrossRef]
- De Vitis R, Passiatore M, Cilli V, Pamelin E, Velluto C, Ceravolo I, D'Orio M, Ferrari F, Taccardo G. Secondary Wrist Arthritis in Active Workers: Does Capitate Pyrocarbon Resurfacing (RCPI) Improve Proximal Row Carpectomy? A Retrospective Cohort Study. J Hand Surg Asian Pac Vol. 2021 Dec;26(4):625-634. PMID: 34789091. [CrossRef]
Disclaimer/Publisher’s Note: The statements, opinions and data contained in all publications are solely those of the individual author(s) and contributor(s) and not of MDPI and/or the editor(s). MDPI and/or the editor(s) disclaim responsibility for any injury to people or property resulting from any ideas, methods, instructions or products referred to in the content. |
© 2025 by the authors. Licensee MDPI, Basel, Switzerland. This article is an open access article distributed under the terms and conditions of the Creative Commons Attribution (CC BY) license (http://creativecommons.org/licenses/by/4.0/).
Copyright: This open access article is published under a Creative Commons CC BY 4.0 license, which permit the free download, distribution, and reuse, provided that the author and preprint are cited in any reuse.


