Submitted:
26 March 2025
Posted:
26 March 2025
You are already at the latest version
Abstract
In order to study the characteristics of the thermal runaway process of a full-size prefabricated cabin energy storage system, a full-scale prefabricated cabin energy storage physical fire test platform was designed, using 100% SOC energy storage battery packs as the thermal runaway object, and conducts full-scale prefabricated cabin energy storage system physical fire experiments. The experiment analyzes the early change rules of parameters such as temperature, voltage, CO, and VOC after the energy storage system thermal runaway, and explores the technical methods to improve the fire protection of electrochemical energy storage systems. The results show that the time when the surface temperature of the runaway cell undergoes a sudden change is 37 seconds later than the time when the voltage undergoes a sudden change; the CO at the bottom and middle of the runaway cluster reaches the alarm threshold 25 seconds and 39 seconds earlier than that at the top of the cluster, respectively, and the peak concentration of CO at the bottom and middle of the cluster is more than three times that at the top of the cluster. The opening of the fan will cause the CO concentration on the left side of the thermal runaway cluster to be higher than that of the runaway cluster; before the battery thermal runaway, the VOC concentration at the middle and top of the runaway cluster is generally higher than that at the bottom of the cluster. After the thermal runaway occurs, the VOC concentration at the bottom of the thermal runaway cluster exceeds that at other positions of the runaway cluster and the adjacent cluster; the tVOC at the top, middle, and bottom of the thermal runaway cluster is 2296 seconds, 1681 seconds, and 1464 seconds earlier than the tCO, respectively, but the initial detection value of VOC fluctuates more than that of CO.
Keywords:
prefabricated cabin energy storage system
; thermal runaway
; full-size test
; temperature
; gas concentration
1. Instruction
With the large-scale application of lithium battery energy storage prefabricated cabins, their safety issues have become increasingly prominent. In recent years, multiple fire accidents have occurred at energy storage power stations worldwide, resulting in significant casualties and economic losses. For example, in April 2021, a fire and explosion at the Beijing Dahongmen Energy Storage Power Station caused one death and the sacrifice of two firefighters [1]. On April 18, 2022, a fire at an energy storage power station in Arizona, USA, resulted in substantial economic losses [2]. Fire prevention and control have become one of the critical issues in the development of the lithium battery energy storage industry. Research on thermal runaway fire prevention and control for prefabricated cabin energy storage power stations is urgently needed, particularly through full-scale fire experiments to study the characteristics of thermal runaway and related prevention strategies.
Research on the characteristics of lithium battery thermal runaway can be divided into three levels: cell-level, module-level, and system-level. Feng et al. [3] derived the propagation speed of the thermal runaway front, quantitatively characterizing the thermal runaway propagation process in large lithium-ion batteries. Zhang et al.[4] studied the thermal runaway propagation characteristics within battery packs, analyzing temperature, voltage, and gas production to establish a three-dimensional thermal runaway propagation model. Jin et al.[5] conducted overcharge experiments on an 8.8 kWh lithium iron phosphate module, showing that among the six common gases (H2, CO, CO2, HCl, HF, and SO2) released during thermal runaway, H2 was detected 639 seconds earlier than smoke detectors and 769 seconds before the fire. Koch et al.[6] used a series of sensors (including voltage, temperature, gas, smoke, and pressure sensors) to analyze the LIB thermal runaway process, demonstrating that gas signals are the earliest detectable in any battery abuse mode. Many scholars[7,8,9,10,11] have compared the effects of different thermal runaway conditions on the propagation characteristics within modules, with variables including ambient pressure, cathode materials, lithium battery size, thermal runaway trigger conditions, and series-parallel configurations. Some scholars have conducted full-scale fire tests for electric vehicles[12]. However, there are few public reports on the fire characteristics of energy storage prefabricated cabins, especially full-scale physical fire research. Most experiments are conducted using scaled-down or partial simulations, with few real batteries and battery packs, and insufficient placement of dummy packs, leading to differences from actual engineering scenarios and making it difficult to accurately guide fire protection system design.
This paper investigates the temperature and voltage data of cells within battery packs, as well as changes in CO, VOC, and other parameters inside and outside the battery pack, through full-scale fire experiments on prefabricated cabin energy storage systems. It explores the early accident characteristics of actual fires in energy storage power stations, providing a data foundation for the design of fire prevention and detection strategies.
2. Experimental Design
This study used a full-scale 20-foot energy storage power station prefabricated cabin to build a cabin-level fire test platform. The fire protection system was arranged according to actual engineering standards, with some fully charged battery packs placed inside the cabin and dummy packs filling the remaining spaces to simulate real fire scenarios as closely as possible.
2.1. Test Materials
A 1:1 full-scale 20-foot lithium iron phosphate energy storage prefabricated cabin was used. The battery cabin had two air inlets at the middle-lower right side and an outlet/fan at the top left. The cabin could accommodate two rows of battery clusters (front and back), with five clusters per row, totaling ten clusters. Each cluster consisted of eight battery packs and one high-voltage electrical box, with the high-voltage box located at the bottom of each cluster. The battery packs included real packs and dummy packs. Real packs contained 52 fully charged cells (1P52S), while dummy packs were sealed shells without cells. The lithium iron phosphate cells had a nominal voltage of 3.25 V and a capacity of 280 Ah. Mica sheets were used for insulation between cells.
Composite gas detectors were used to measure VOC and CO concentrations during the experiment. The high-voltage box collected cell voltage signals. K-type thermocouples recorded temperature data. A Logitech C920 Pro camera captured images. A 1000 W heating plate was used to induce thermal runaway at constant power.
2.2. Experimental Setup
As shown in Figure 1, the thermal runaway cluster was located at the front right, farthest from the fire protection system cabin. The second battery pack from the bottom in the thermal runaway cluster was designated as the thermal runaway pack (a real pack), while the others were dummy packs. The red-marked cell #1 in the thermal runaway pack was the thermal runaway cell, with five blue-marked surrounding cells as key monitoring cells, and the rest were fully charged cells.
Composite gas detectors were placed at the bottom, middle, and top of the thermal runaway cluster, as well as at the bottom of the first, second, third, and fourth clusters to the left of the thermal runaway cluster. One detector was also placed inside the thermal runaway pack. The heating plate was placed behind cell #1. Eleven K-type thermocouples were arranged on the surfaces of cells #1–#5 and near cell #6 to monitor temperatures. The battery management system (BMS) was placed outside the cabin to prevent damage. Cameras were positioned near the vent openings of the thermal runaway pack and at the top of the cluster to observe the overall situation inside and outside the cabin.
2.3. Test Method
After recording baseline data, the heating plate was activated at 1000 W constant power. Composite gas detectors measured CO and VOC concentrations, thermocouples recorded temperature data, and the BMS recorded cell voltage data. When the CO concentration at the top of the thermal runaway cluster reached 190 ppm or the VOC met specific trends, the fan was activated for ventilation. After smoke reached a certain concentration, ignition was performed, and the fire protection system was activated according to the preset program. After the extinguishing agent was discharged, the system was left undisturbed for 24 hours to confirm safety before opening the cabin, concluding the experiment.
3. Test Results and Analysis
3.1. Temperature and Voltage Changes in the Runaway Cell and Temperature Analysis of Surrounding Cells
Figure 2 shows the voltage and front surface temperature curves of cell #1 over time. After baseline data collection, the heating plate was activated at 316 s. The cell surface temperature rose steadily, while the voltage remained stable at 3.3 V. At 4385 s, the voltage dropped sharply, reaching 0 V within 112 s, indicating a full internal short circuit. The thermal runaway trigger time (tTR=4422 s) was defined as the moment when the temperature rise rate exceeded 60°C/min (1°C/s). After thermal runaway, the surface temperature rose rapidly from 94.6°C, peaking at 364.0°C at 4579 s.
Figure 3 shows the temperature curves of the runaway cell and surrounding cells. Due to heat conduction, the rear temperature of cell #2 followed a similar trend to the front temperature of the runaway cell, but its peak temperature was 58°C lower. The front surface of cell #2 reached a maximum temperature of 105°C, while cells #3, #4, and #5 showed lower peak temperatures. Throughout the experiment, the voltages of surrounding cells showed no significant changes.
In summary, the thermal runaway trigger time was 37 seconds later than the voltage drop time. Although the surface temperatures of cells #2, #3, and #4 exceeded the thermal runaway trigger temperature (94.6°C), thermal runaway did not occur because the internal temperature distribution was uneven[13,14,15]. The heat released by cell #1 caused surface temperature increases in cells #2 and #4, but their internal temperatures remained too low to trigger thermal runaway.
3.2. CO/VOC Concentration Analysis Inside the Pack and at Different Positions in the Cabin
3.2.1. CO Concentration Analysis
(1)CO Concentration Inside the Pack
Figure 4 shows the CO concentration curve inside the pack. Studies[15,16] indicate that before full thermal runaway, continuous gas release and venting occur. In this experiment, trace CO was first detected at 1382 s, when the surface temperature of the runaway cell was only 32.7°C, while the heating plate had reached 296°C. The CO concentration rose slowly until 2780 s, when it surged at over 40 ppm/s, exceeding the detector's range. This corresponded to a small peak in the temperature-time curve (Figure 3), suggesting vent opening, which occurred 1642 s before thermal runaway.
(2)CO Concentration at Different Positions in the Runaway Cluster
Figure 5 shows the CO concentration curves at the bottom, middle, and top of the runaway cluster. After thermal runaway, the CO concentrations at the bottom and middle rose rapidly, reaching alarm thresholds at 4452 s and 4464 s, respectively. The top detector triggered the alarm at 4491 s, activating ventilation. The peak CO concentrations at the middle and bottom were 1413 ppm and 1434 ppm, respectively, while the top peaked at 454 ppm. The bottom and middle detectors reached the alarm threshold 25 s and 39 s earlier than the top, respectively, and their peak concentrations were over three times higher.
(3)CO Concentration in the Runaway Cluster and Left Clusters
Figure 6 shows the CO concentration curves at the bottoms of the runaway cluster and adjacent clusters. After thermal runaway, CO was detected first at the bottom of the runaway cluster and the second cluster, rising rapidly to peak concentrations. Ventilation caused CO concentrations on the left side of the runaway cluster to exceed those in the runaway cluster, potentially affecting fire system judgments.
3.2.2. VOC Concentration Analysis
Figure 7 shows the VOC concentration curve inside the pack. The initial VOC concentration was stable at 238 ppm. As the heating plate temperature rose, organic compounds decomposed or volatilized, causing the VOC concentration to rise steadily. At 2780 s, small-scale combustion led to a rapid increase. During thermal runaway, the VOC concentration peaked at 2944 ppm at 4459 s.
Figure 8 shows the VOC concentration curves at the top, middle, and bottom of the runaway cluster. Before thermal runaway, the middle and top VOC concentrations were generally higher than at the bottom. After thermal runaway, the bottom VOC concentration exceeded other positions, peaking at 4425 ppm at 4468 s.
Figure 9 shows the VOC concentration curves for the runaway cluster and adjacent clusters. The trends were similar, with fluctuations starting around 3000 s. Before thermal runaway, airflow caused the bottom VOC concentration of the runaway cluster to not be the highest. After thermal runaway, it rose rapidly and surpassed other clusters.
3.2.3. Comparison of VOC and CO Concentrations
The CO and VOC concentrations at the top, middle, and bottom of the runaway cluster and the bottom of the first adjacent cluster were compared (Figure 10). Initially, VOC and CO remained at ambient levels. VOC began fluctuating upward first (recorded as tVOC). After full thermal runaway, VOC and CO concentrations rose rapidly (recorded as tCO). The time of the full internal short circuit was recorded as tISC. Table 1 compares VOC and CO at different positions.At the top, middle, and bottom of the runaway cluster, tVOC lagged tISC by 31 s, 14 s, and 36 s, respectively, while tVOC preceded tCO by 2265 s, 1667 s, and 1428 s, respectively.
In summary, tVOC at the top, middle, and bottom of the runaway cluster preceded tCO by 2296 s, 1681 s, and 1464 s, respectively, but the initial VOC detection values fluctuated more than CO. VOC can serve as an early warning signal, providing significantly earlier warnings than CO. However, due to its volatility and potential cross-sensitivity to other organic compounds, which was noted by Hildebrand et al[17], VOC detectors require careful threshold settings to avoid false alarms caused by fluctuations.
4. Conclusions and Recommendations
This study designed a full-scale physical fire test platform for lithium iron phosphate prefabricated cabin energy storage systems, analyzing temperature, voltage, CO, and VOC concentration changes during thermal runaway. The conclusions are as follows:
1.The thermal runaway trigger time was 37 s later than the voltage drop time and 1642 s earlier than vent opening.
2.The CO concentrations at the middle and bottom of the runaway cluster reached alarm thresholds 25 s and 39 s earlier than at the top, with peak concentrations over three times higher. Ventilation caused higher CO concentrations on the left side of the runaway cluster.
3.Before thermal runaway, VOC concentrations at the middle and top of the runaway cluster were generally higher than at the bottom. After thermal runaway, the bottom VOC concentration exceeded other positions.
4.VOC provided earlier warnings than CO was 2296 s, 1681 s, and 1464 s earlier at the top, middle, and bottom, respectively, but its initial detection values were more volatile.
The results show that detectors inside the pack can help predict thermal runaway earlier. Fire protection strategies for cabin-level energy storage systems should be scientifically designed based on airflow distribution.
References
- Wang, Gongquan, et al. A semi reduced-order model for multi-scale simulation of fire propagation of lithium-ion batteries in energy storage system. Renewable and Sustainable Energy Reviews, 186 (2023): 113672. [CrossRef]
- Lai X, Yao J, Jin C, et al. A review of lithium-ion battery failure hazards: Test standards, accident analysis, and safety suggestions. Batteries, 2022, 8(11): 248. [CrossRef]
- Feng X, Zhang F, Feng J, et al. Propagation dynamics of the thermal runaway front in large-scale lithium-ion batteries: Theoretical and experiment validation. International Journal of Heat and Mass Transfer, 2024, 225: 125393. [CrossRef]
- Zhang X, Yao J, Zhu L, et al. Experimental and simulation investigation of thermal runaway propagation in lithium-ion battery pack systems. Journal of Energy Storage, 2024, 77: 109868. [CrossRef]
- JIN Y, ZHENG Z K, WEI D H, et al. Detection of micro-scale Li dendrite via H2 gas capture for early safety warning. Joule, 2020, 4(8) : 1714-1729.
- Koch S, Birke K P, Kuhn R. Fast thermal runaway detection for lithium-ion cells in large scale traction batteries. Batteries, 2018, 4(2): 16. [CrossRef]
- Wang H, Xu H, Zhao Z, et al. An experimental analysis on thermal runaway and its propagation in Cell-to-Pack lithium-ion batteries. Applied Thermal Engineering, 2022, 211: 118418. [CrossRef]
- Kurzawski A, Gray L, Torres-Castro L, et al. An investigation into the effects of state of charge and heating rate on propagating thermal runaway in Li-ion batteries with experiments and simulations. Fire Safety Journal, 2023, 140: 103885. [CrossRef]
- Li Z, Zhang P, Shang R. Effects of heating position on the thermal runaway propagation of a lithium-ion battery module in a battery enclosure. Applied Thermal Engineering, 2023, 222: 119830. [CrossRef]
- Li Z, Guo Y, Zhang P. Effects of the battery enclosure on the thermal behaviors of lithium-ion battery module during thermal runaway propagation by external-heating. Journal of Energy Storage, 2022, 48: 104002. [CrossRef]
- Huang Z, Liu J, Zhai H, et al. Experimental investigation on the characteristics of thermal runaway and its propagation of large-format lithium ion batteries under overcharging and overheating conditions. Energy, 2021, 233: 121103. [CrossRef]
- Kang S, Kwon M, Choi J Y, et al. Full-scale fire testing of battery electric vehicles. Applied Energy, 2023, 332: 120497. [CrossRef]
- Svetlík J, Tancos Z, Tancos P, et al. Large-Scale Fire Tests of Battery Electric Vehicle (BEV): Slovak Case Study. Applied Sciences, 2024, 14(10): 4013. [CrossRef]
- Parhizi M, Ahmed M B, Jain A. Determination of the core temperature of a Li-ion cell during thermal runaway. Journal of Power Sources, 2017, 370: 27-35. [CrossRef]
- Zhang Y, Song L, Tian J, et al. Modeling the propagation of internal thermal runaway in lithium-ion battery. Applied Energy, 2024, 362: 123004. [CrossRef]
- Liu H, Wei Z, He W, et al. Thermal issues about Li-ion batteries and recent progress in battery thermal management systems: A review. Energy conversion and management, 2017, 150: 304-330. [CrossRef]
- Shi S, Lyu N, Jiang X, et al. Hydrogen gas diffusion behavior and detector installation optimization of lithium ion battery energy-storage cabin. Journal of Energy Storage, 2023, 67: 107510. [CrossRef]
- Hildebrand S, Ferrario F, Lebedeva N. Comparative Overview of Methods for the Detection of Airborne Electrolyte Components Released from Lithium-Ion Batteries. Energy Technology, 2024, 12(1): 2300647. [CrossRef]
Figure 1.
Test layout diagram.
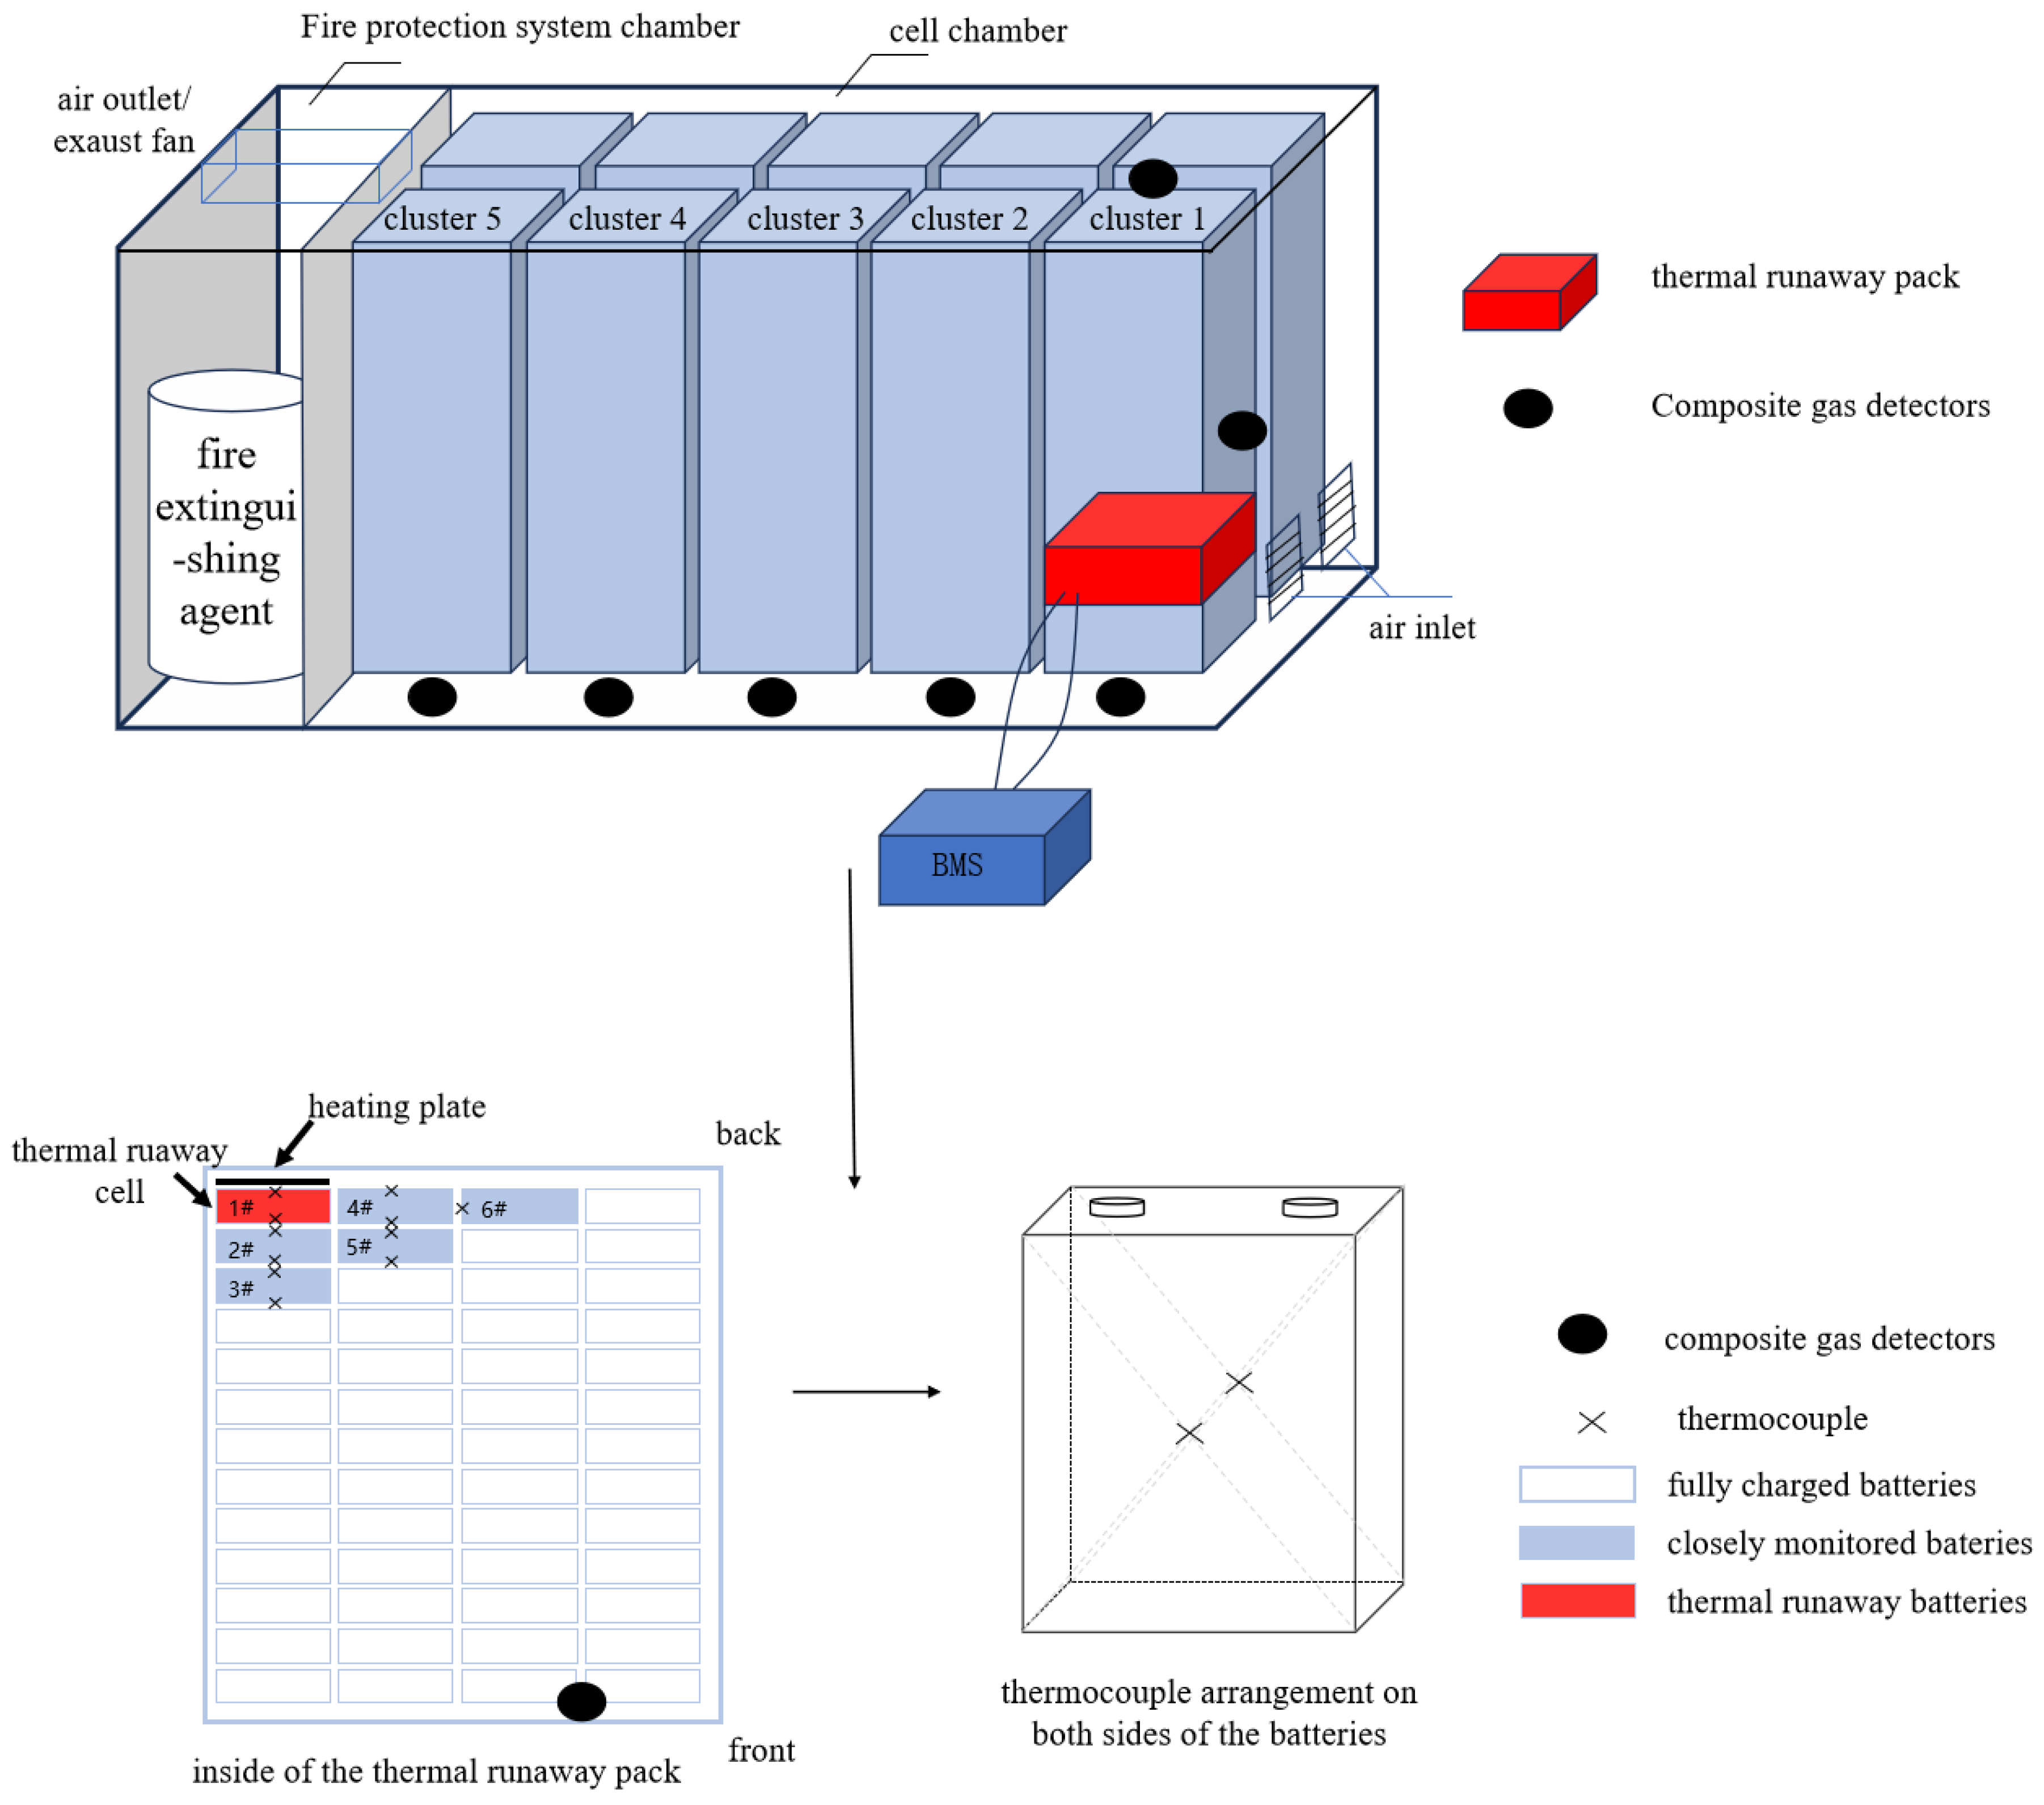
Figure 2.
Curve of the voltage and front surface temperature of the 1# cell with time.
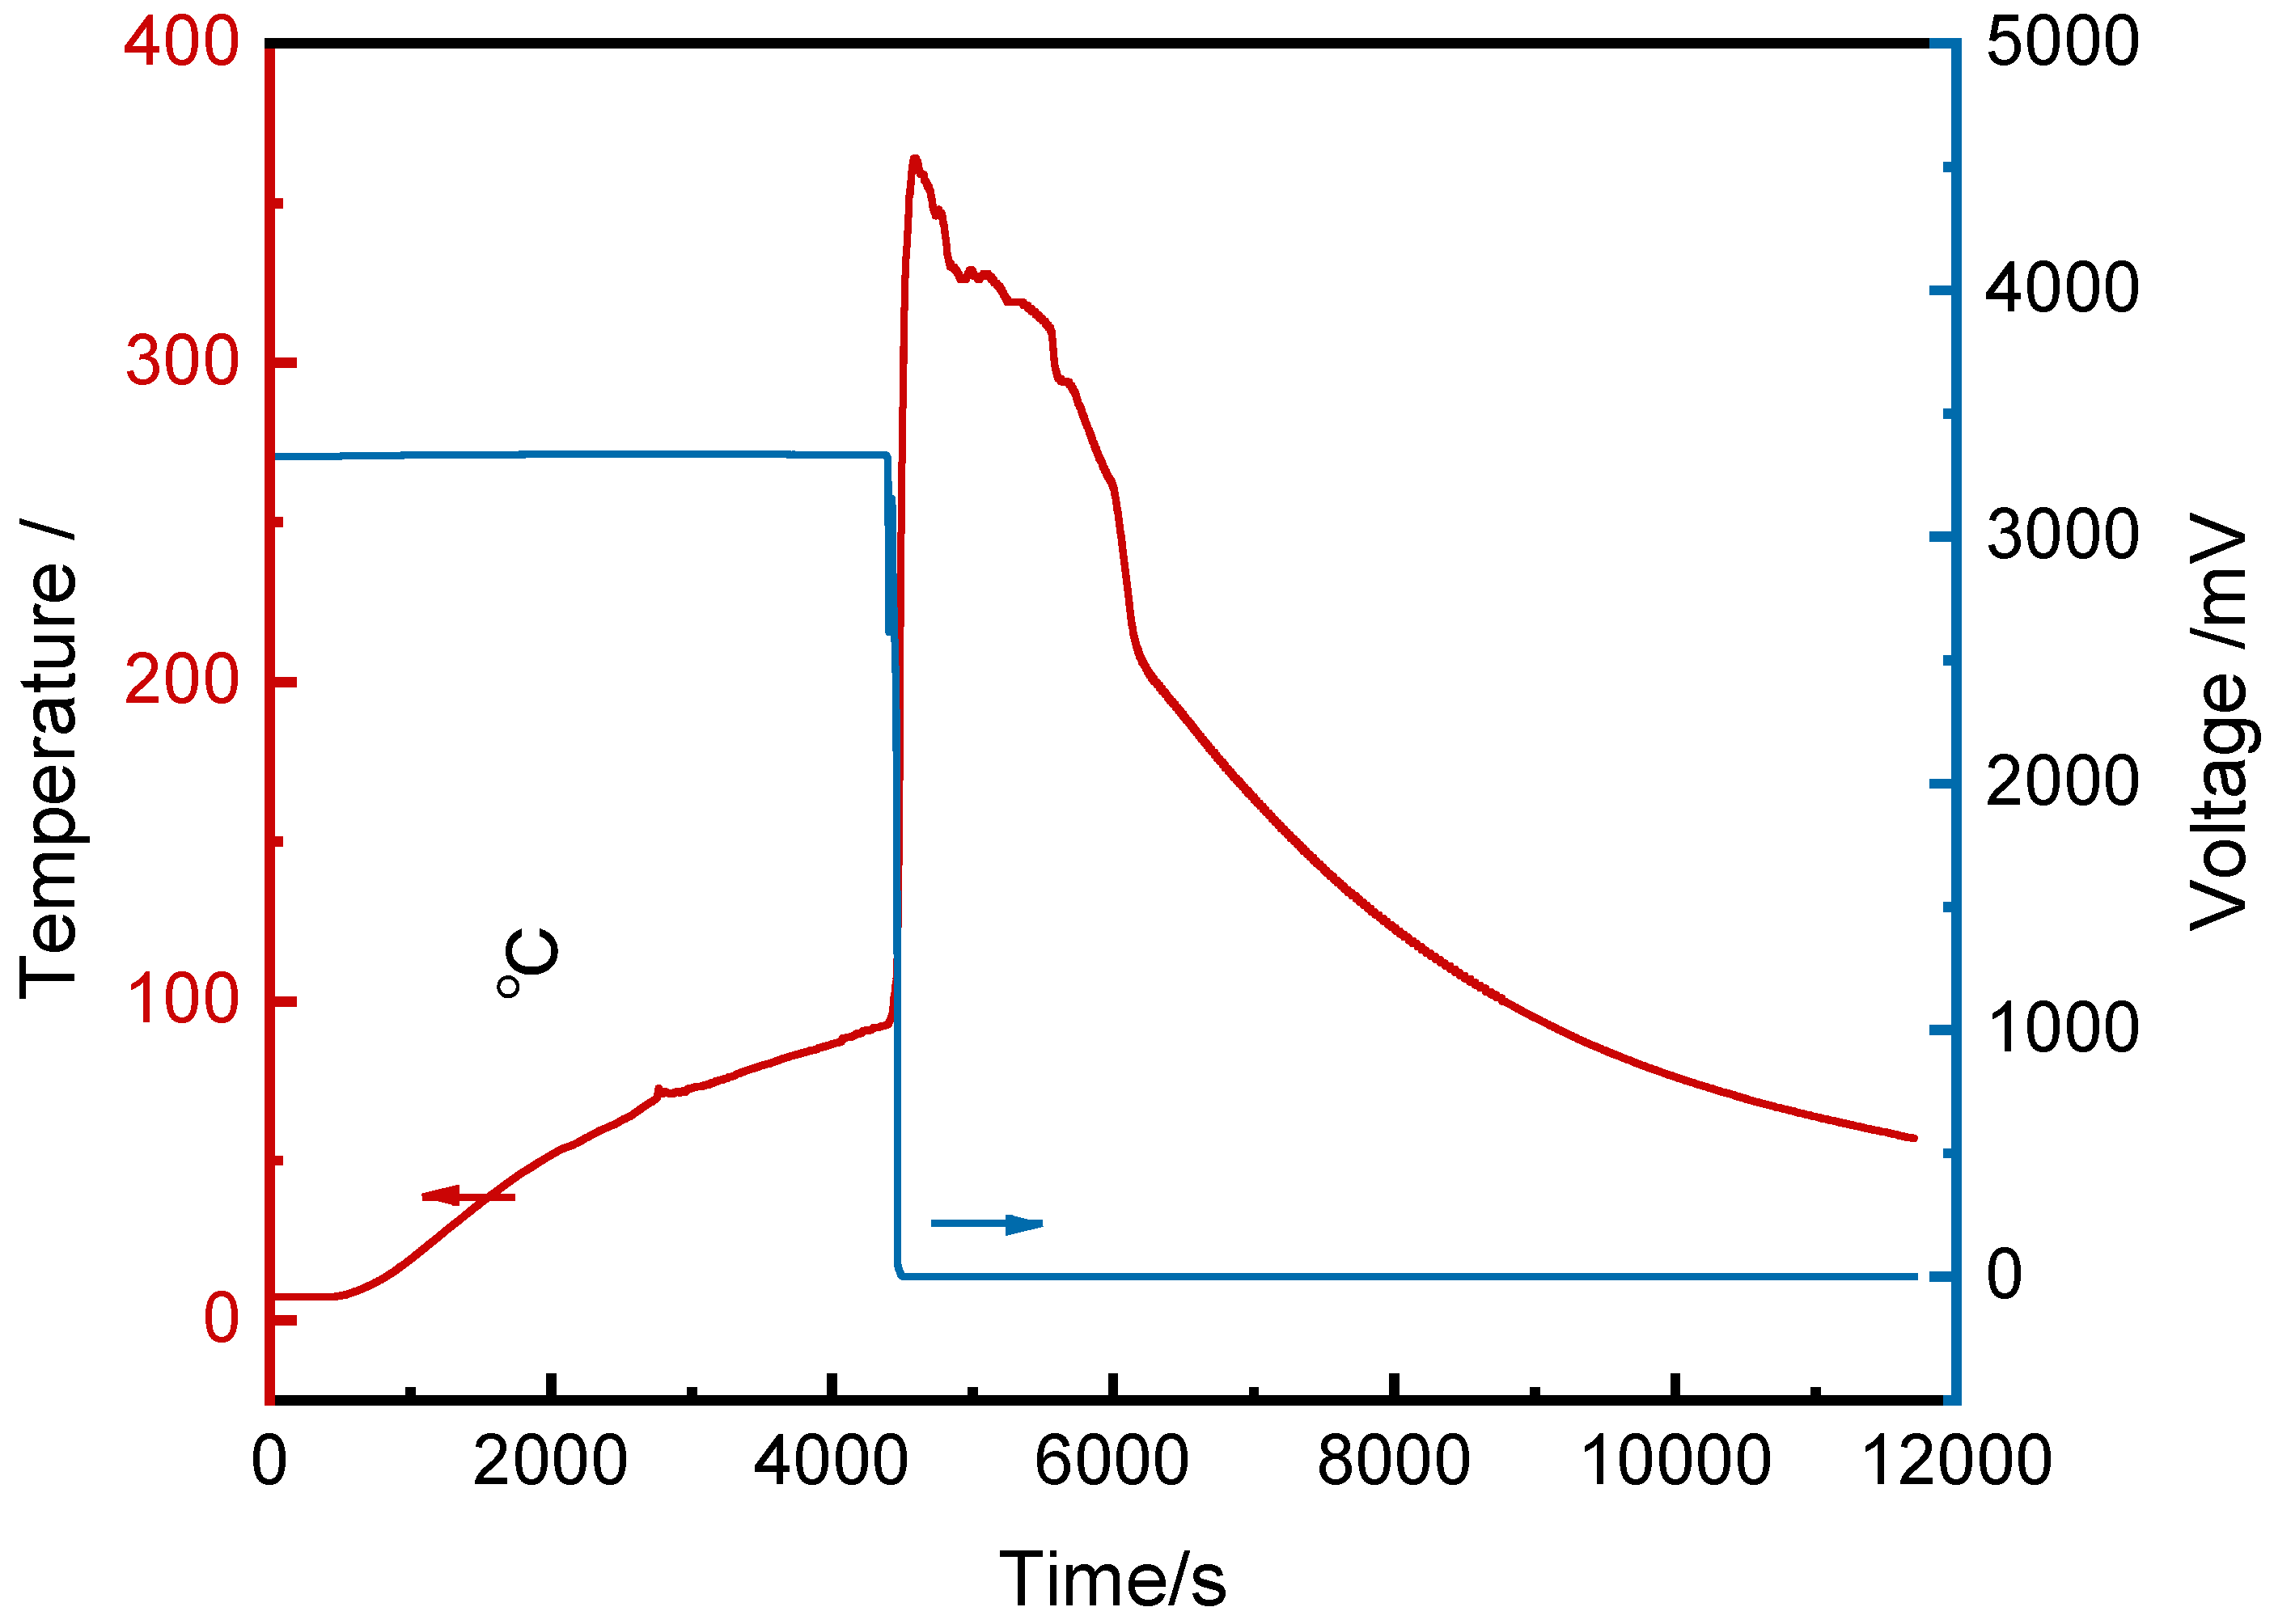
Figure 3.
Temperature curve of thermal runaway cell and surrounding cells with time.
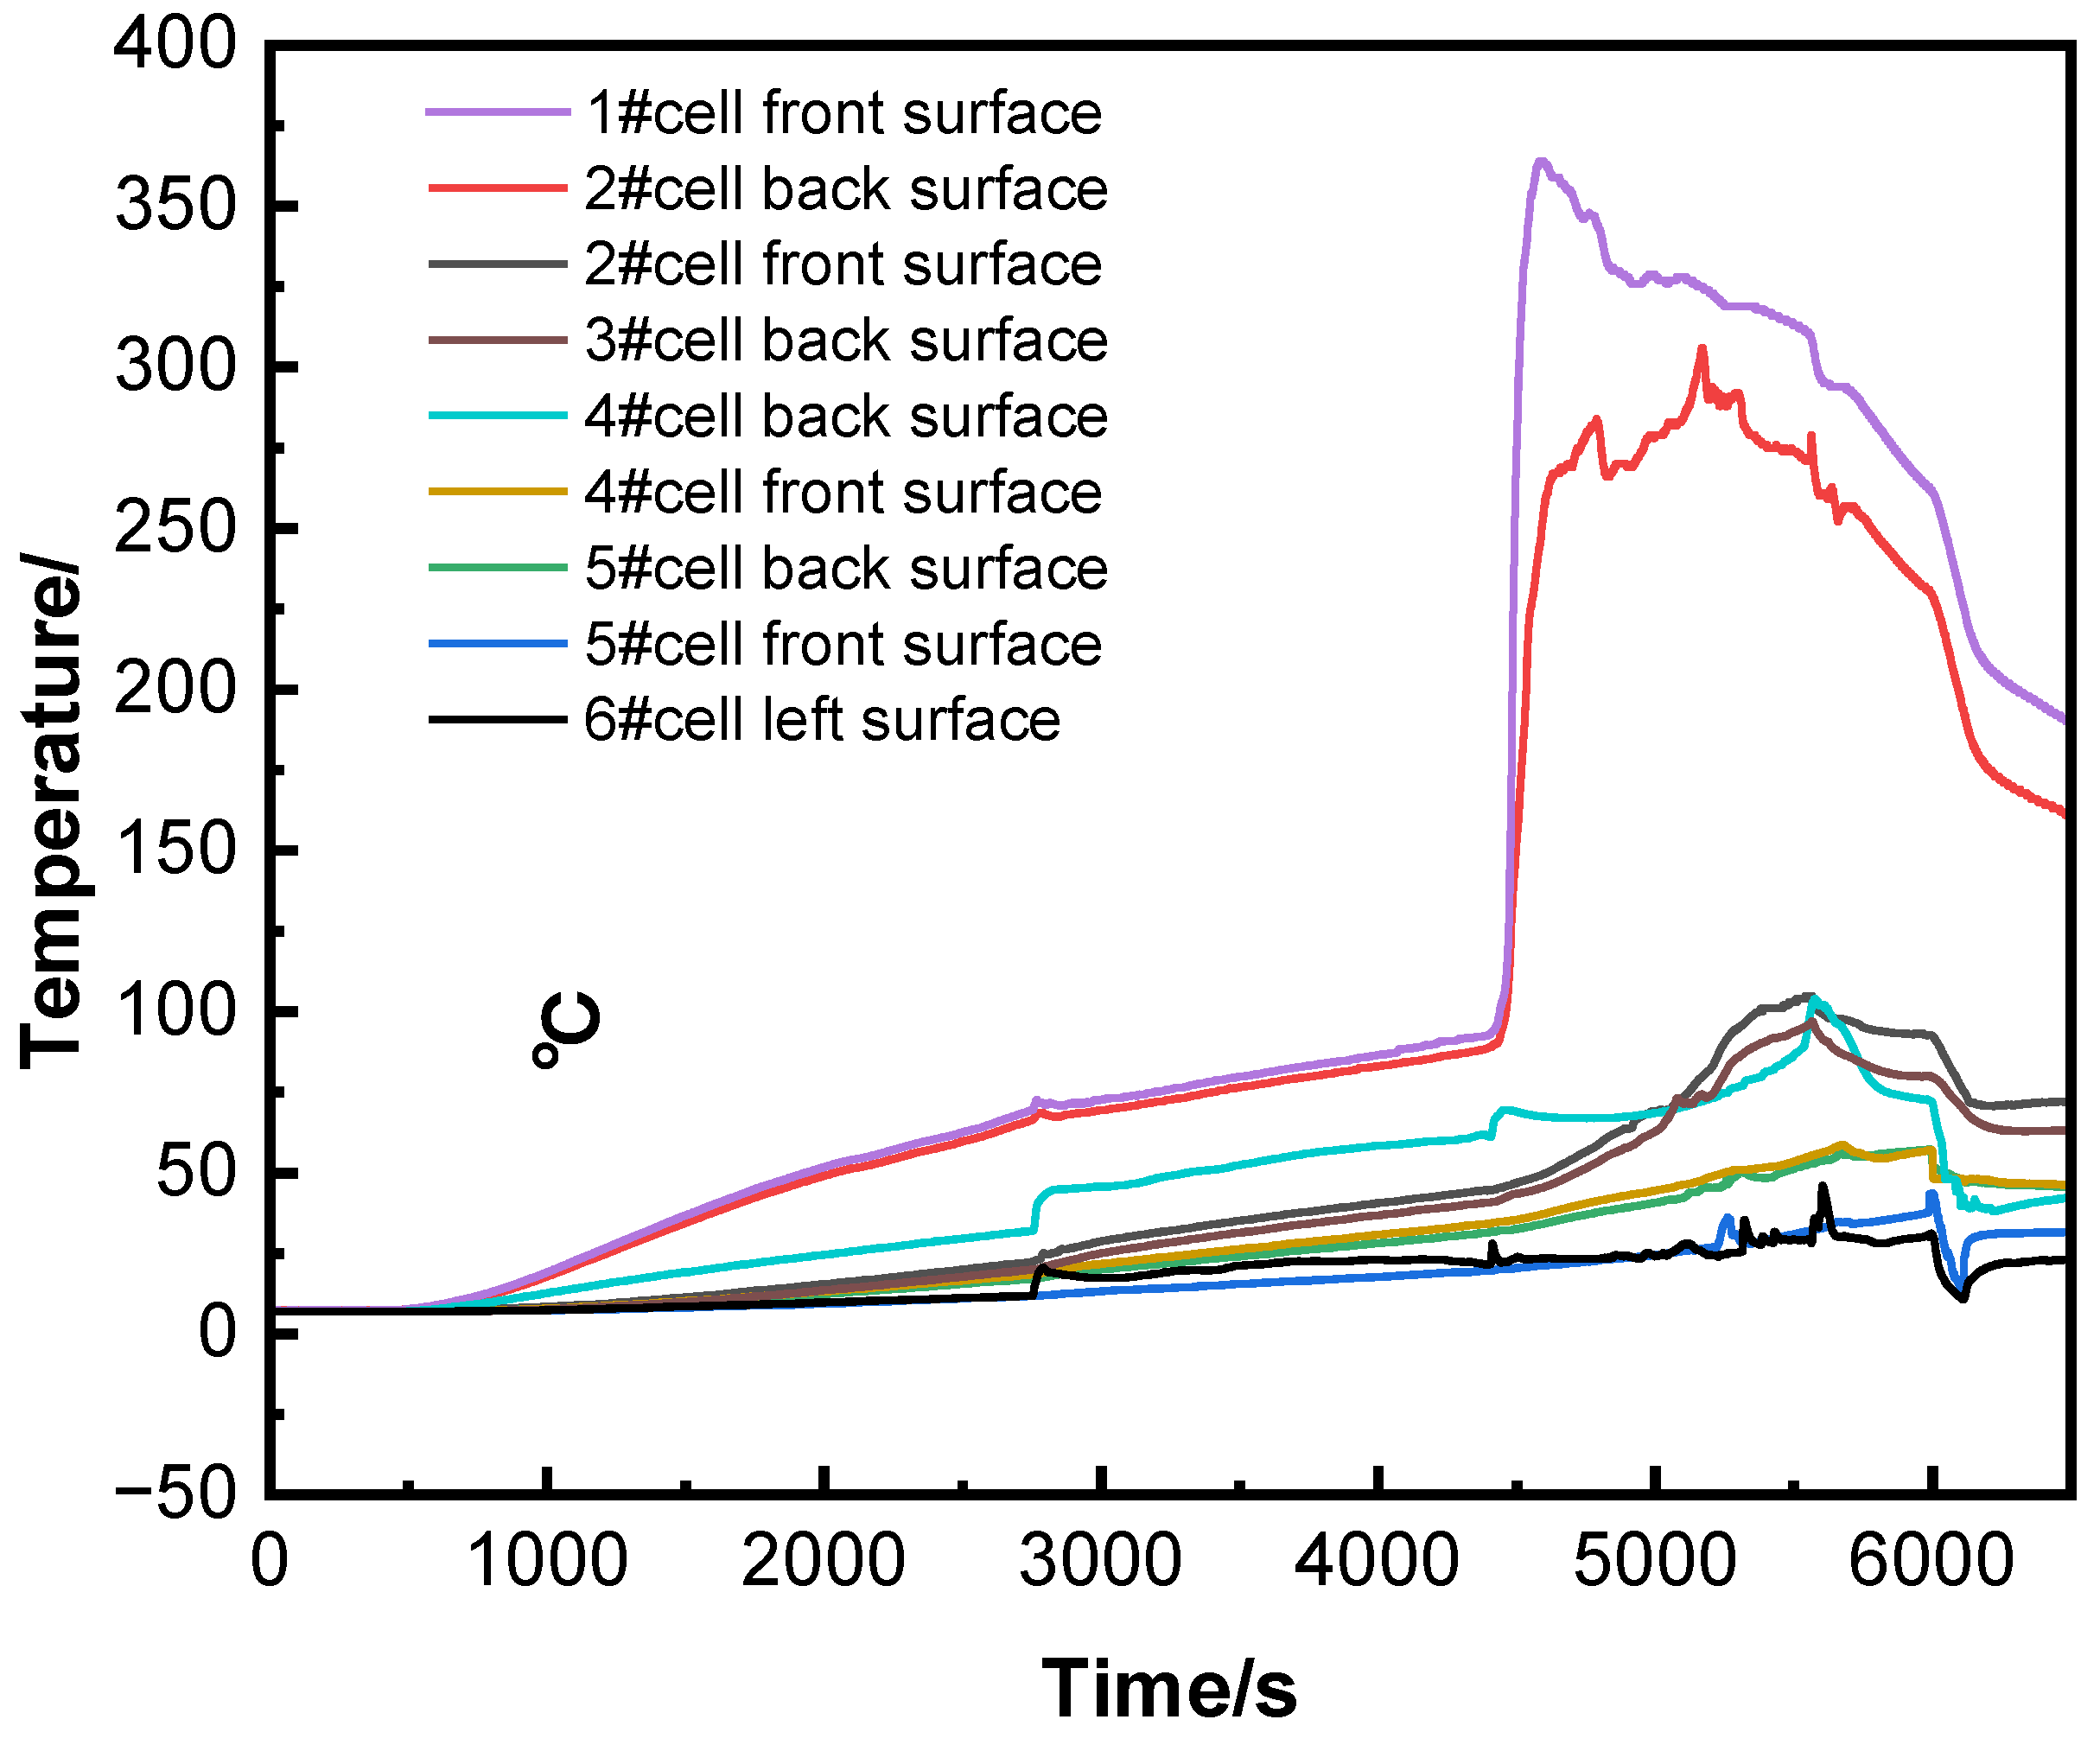
Figure 4.
Curve of the concentration of CO inside the pack with time.
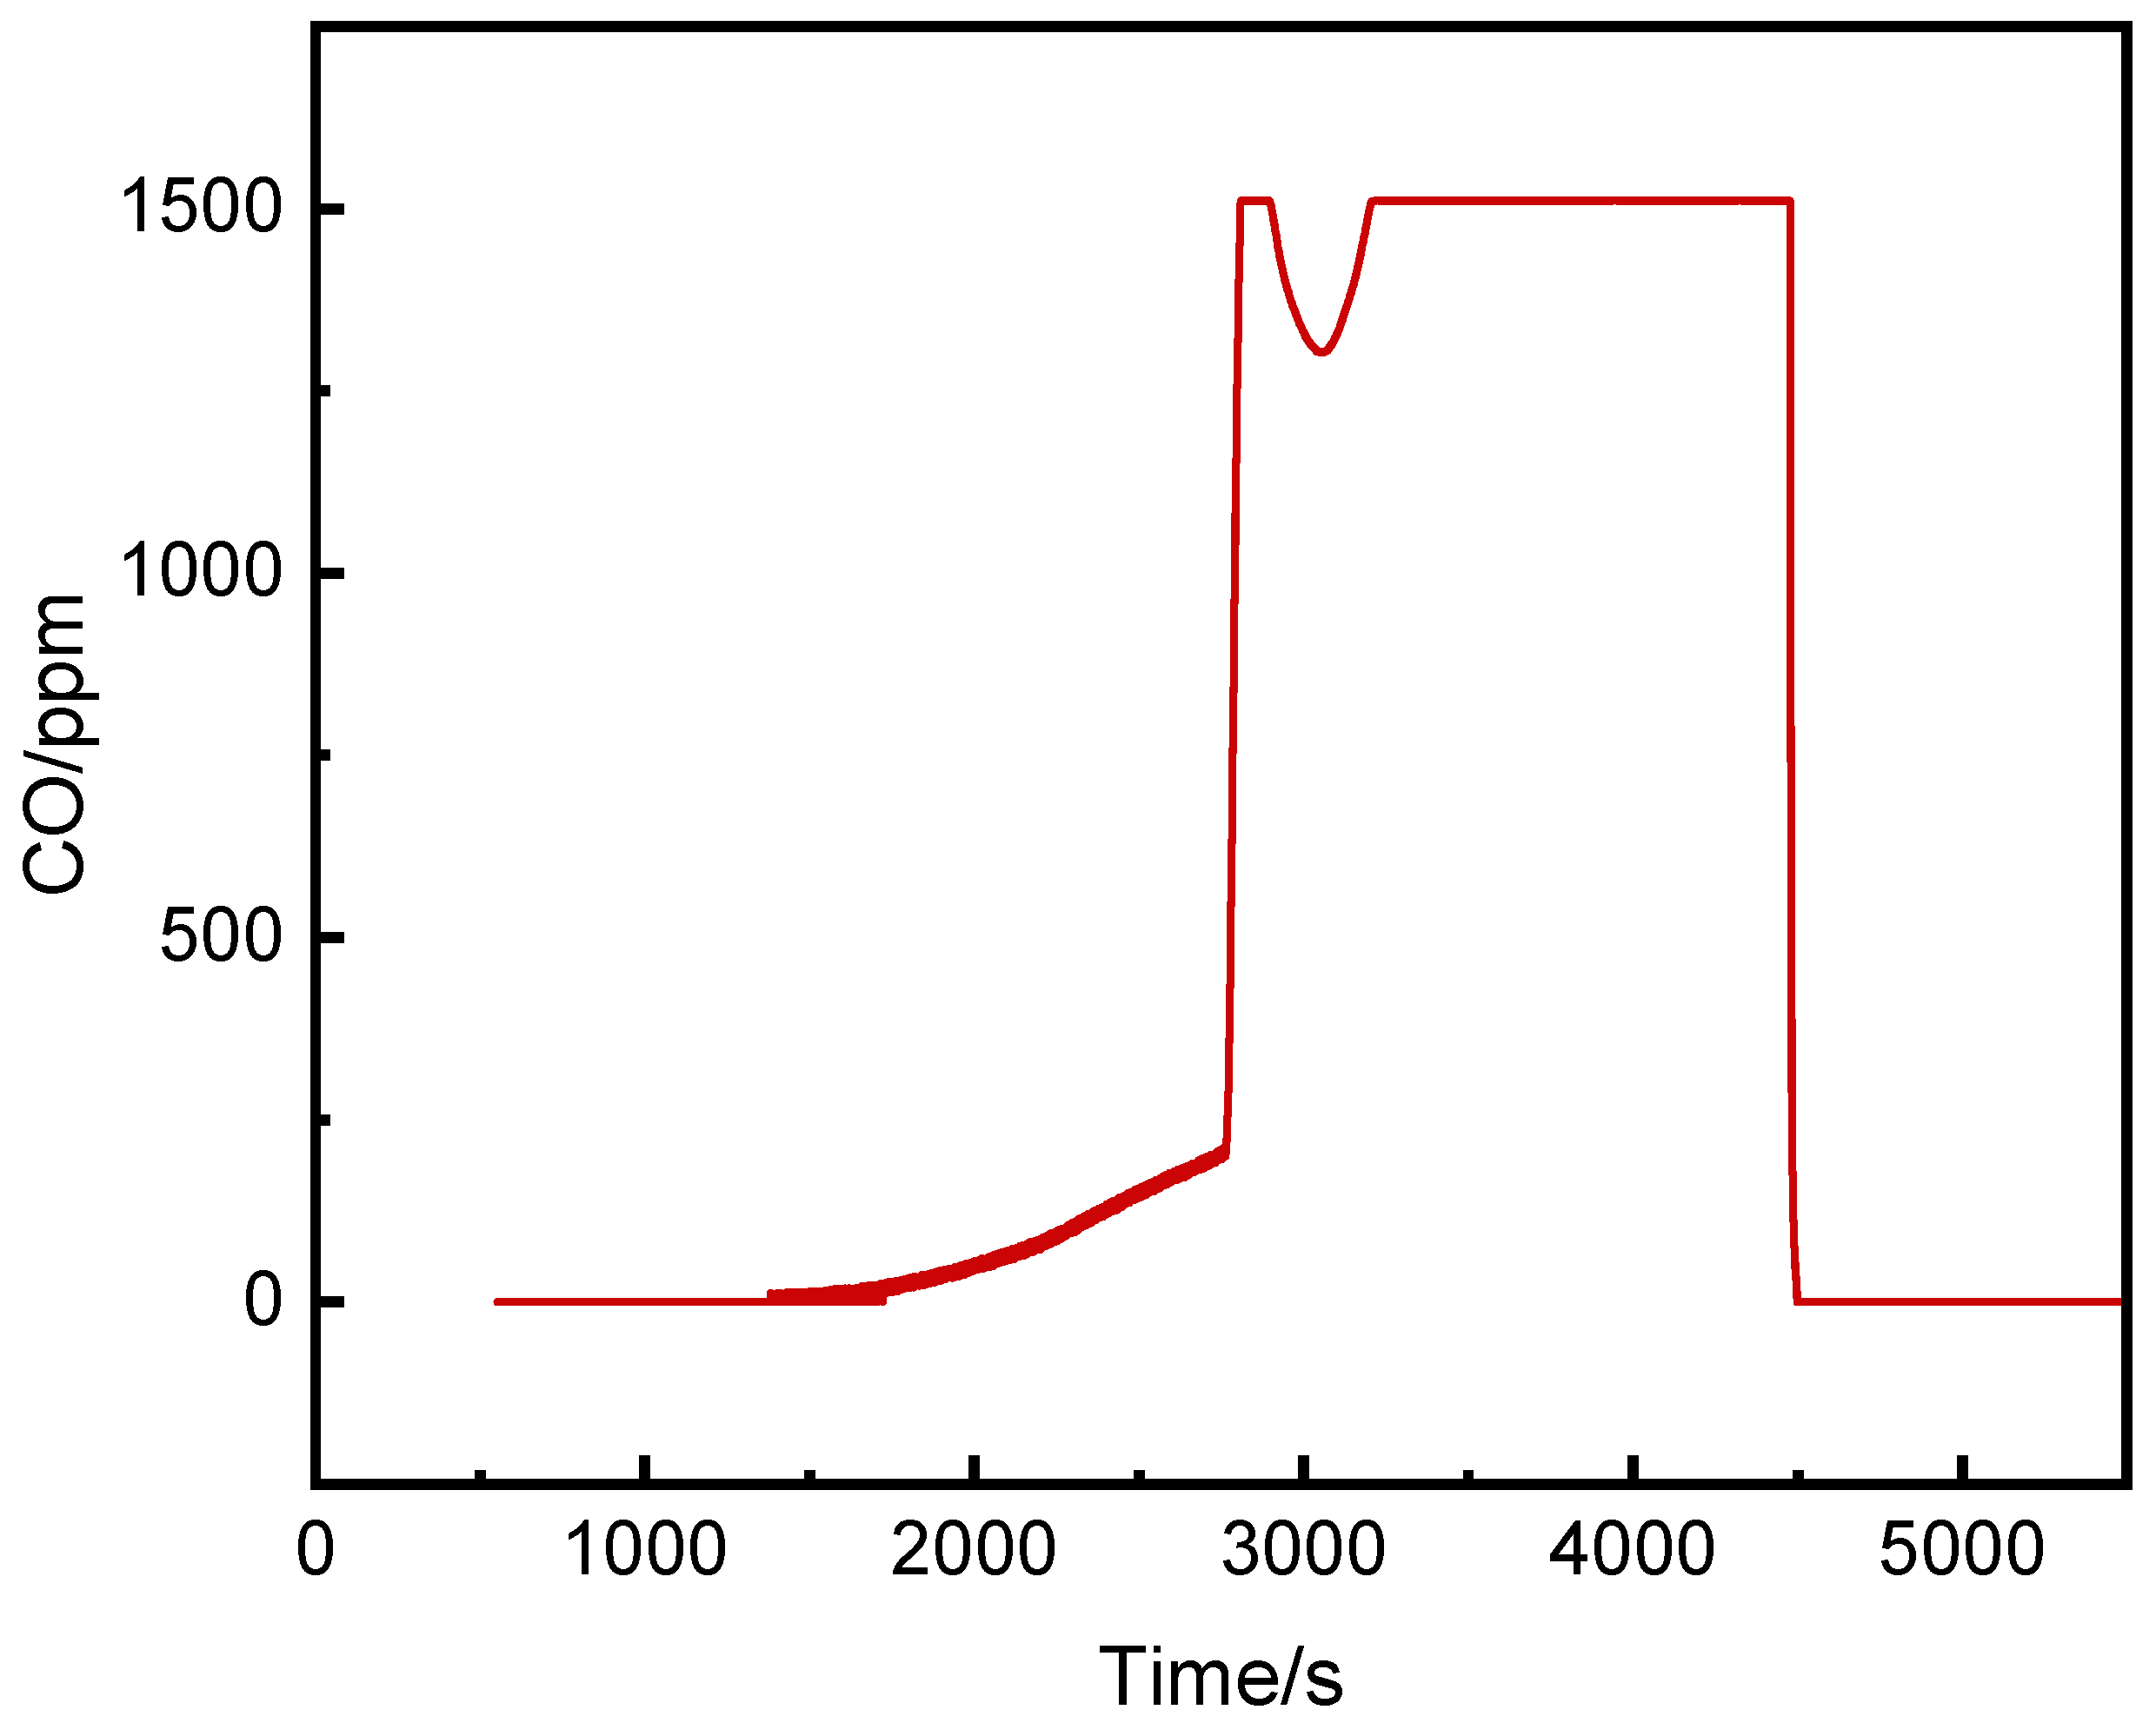
Figure 5.
Curve of the concentration of CO at the bottom/middle/top of the thermal runaway cluster with time.
Figure 5.
Curve of the concentration of CO at the bottom/middle/top of the thermal runaway cluster with time.
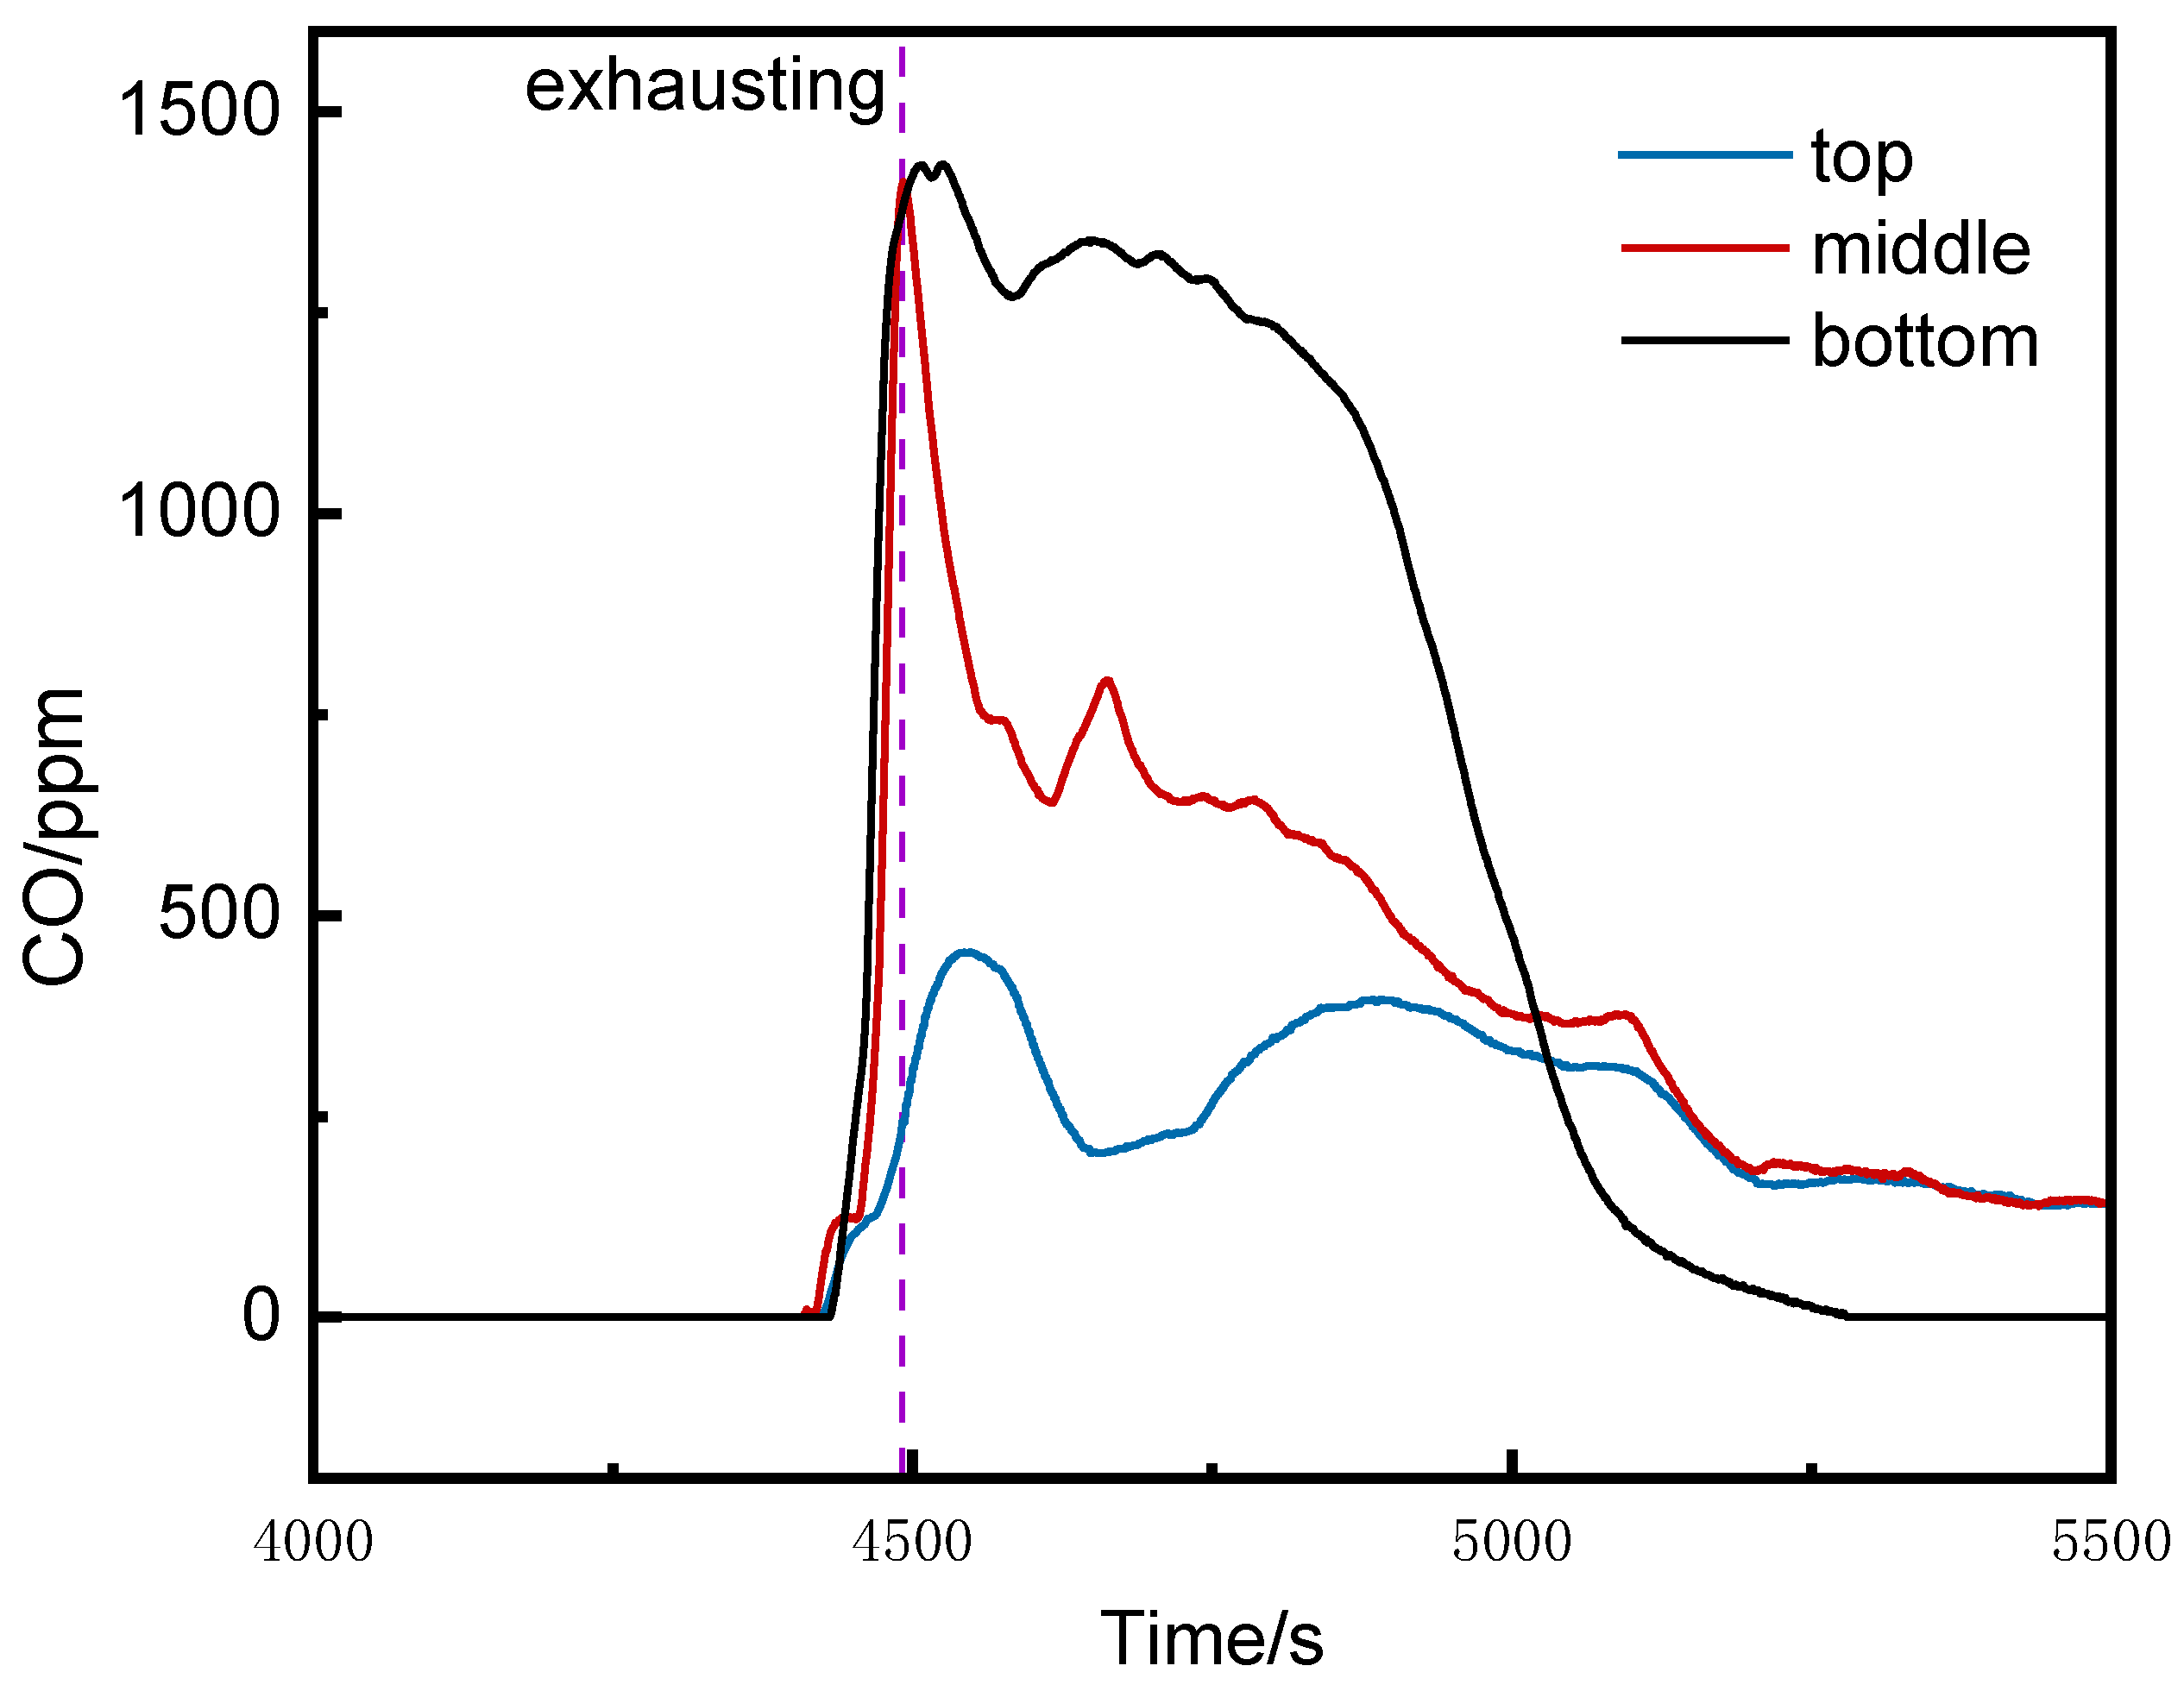
Figure 6.
Curve of CO concentration with time at the bottom of each cluster on the left of the runaway cluster.
Figure 6.
Curve of CO concentration with time at the bottom of each cluster on the left of the runaway cluster.
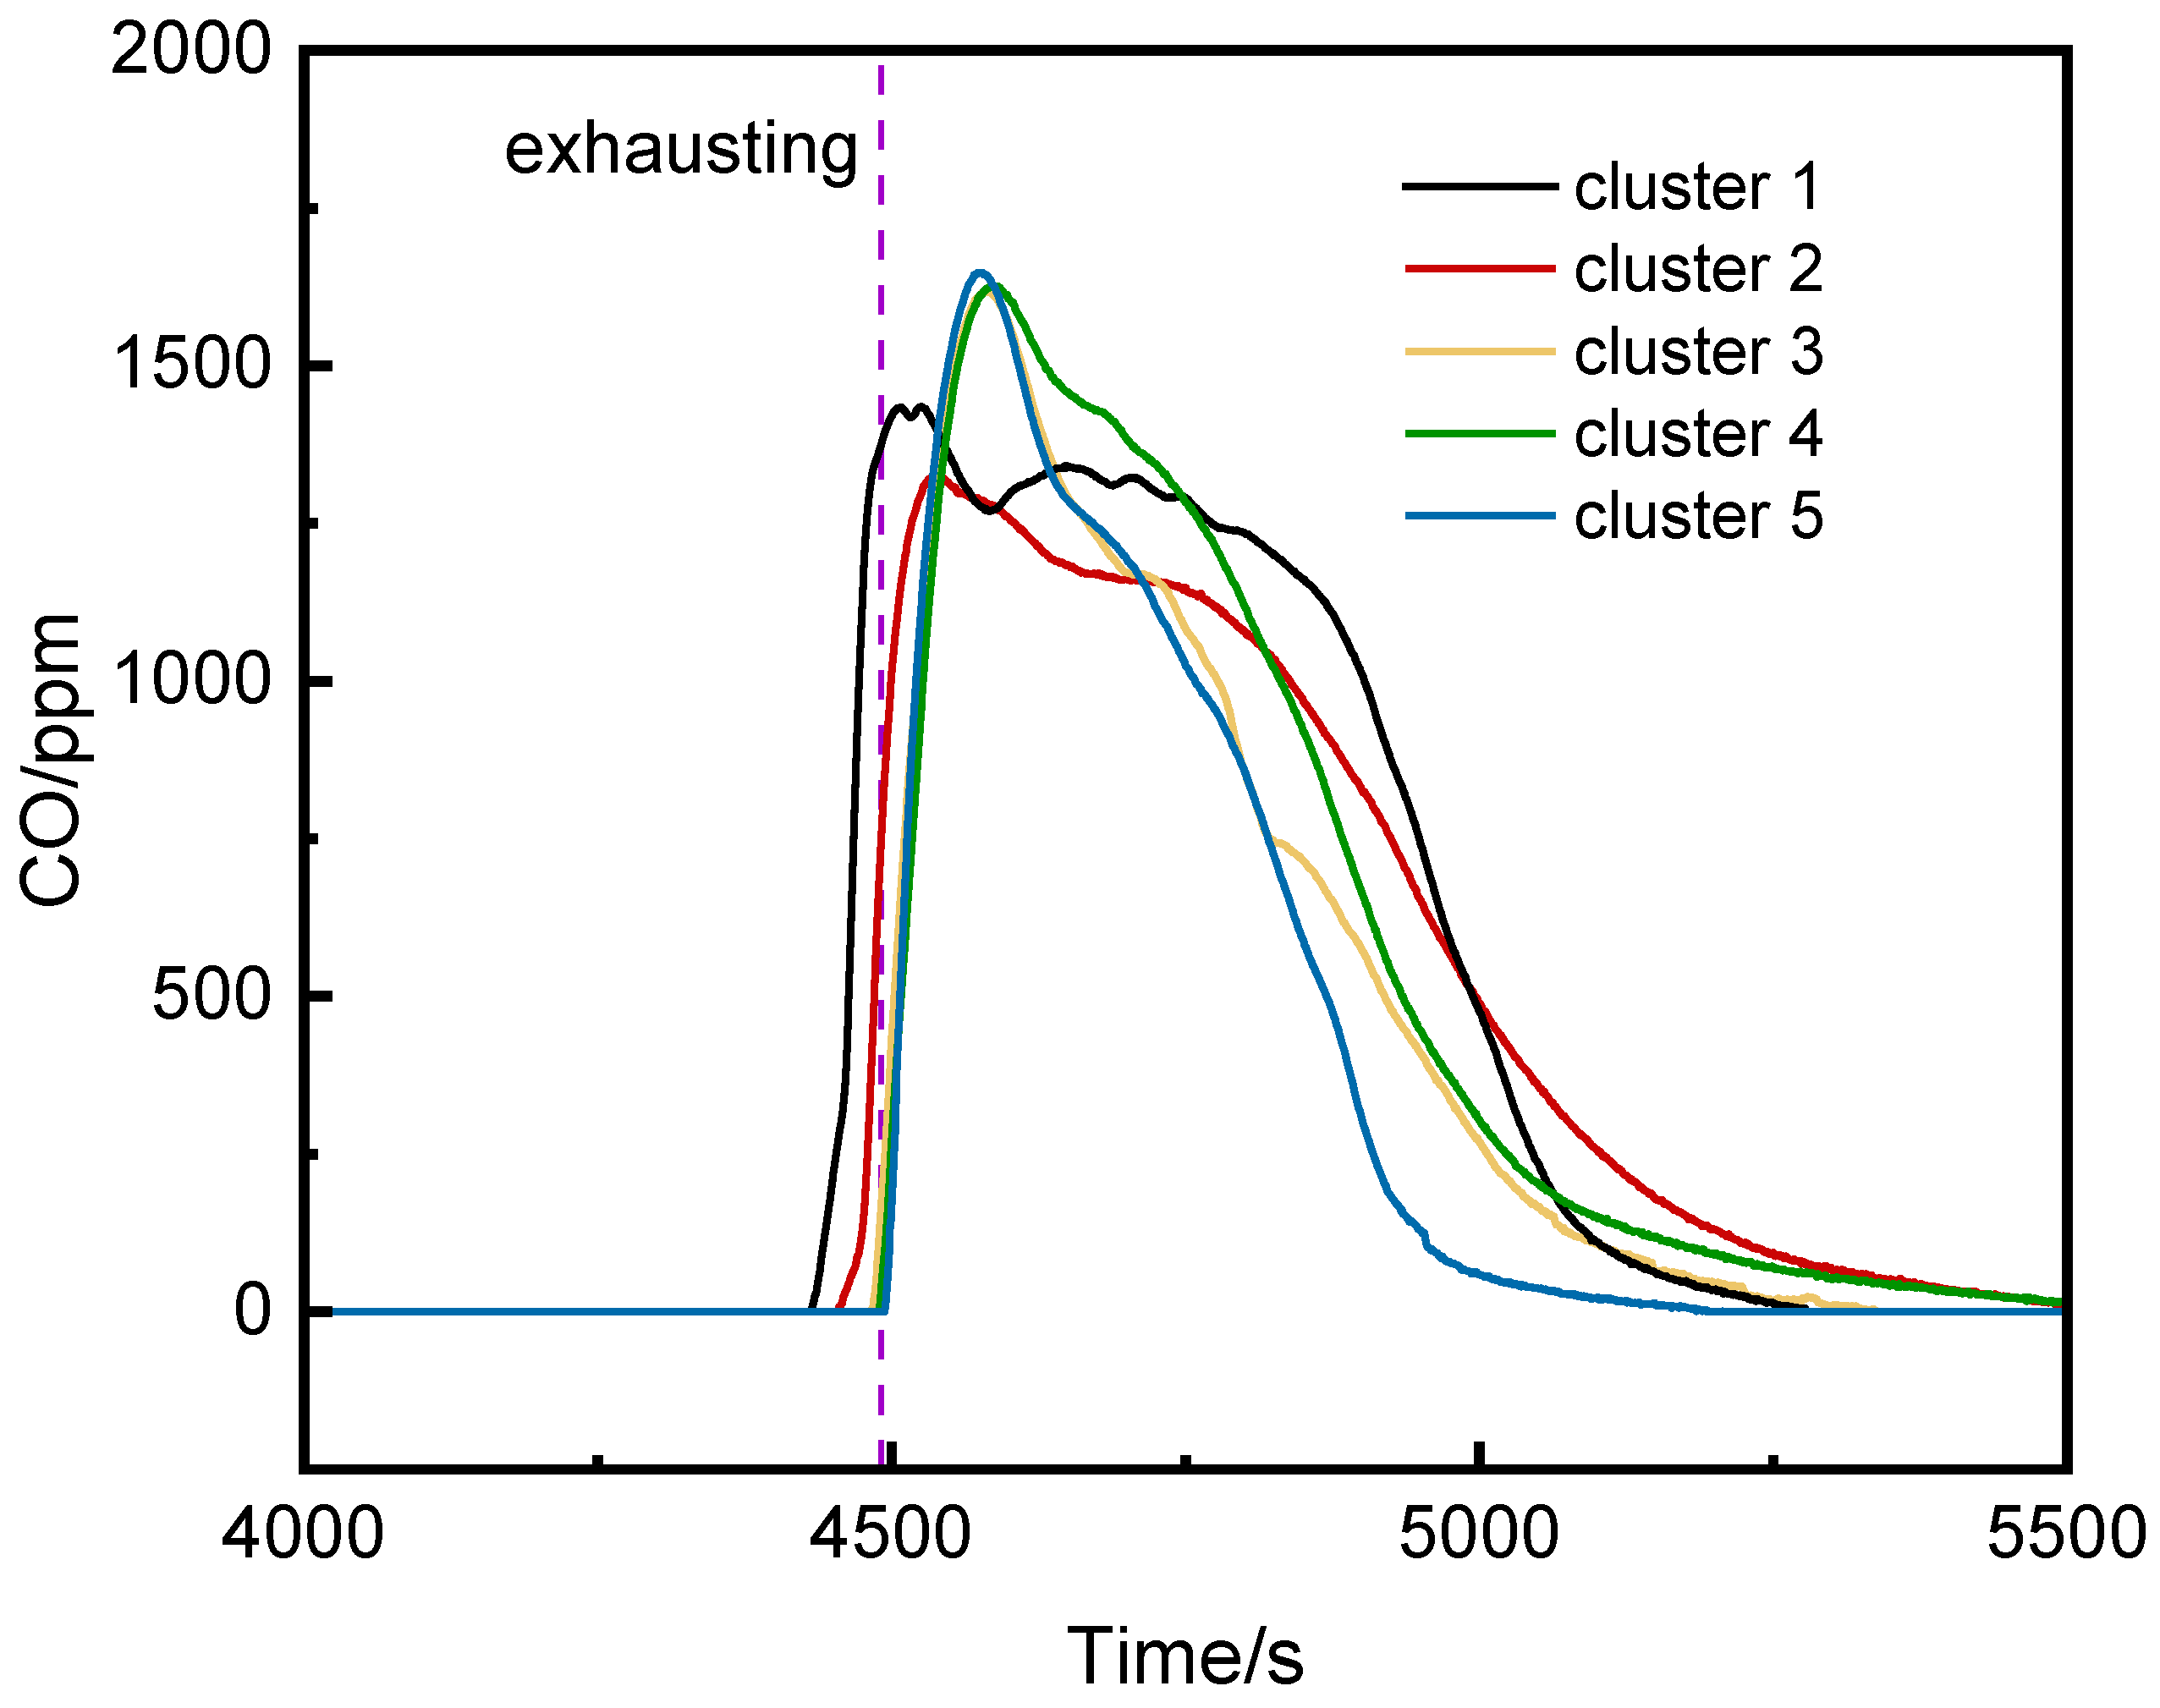
Figure 7.
Curve of the concentration of VOC inside the pack with time.
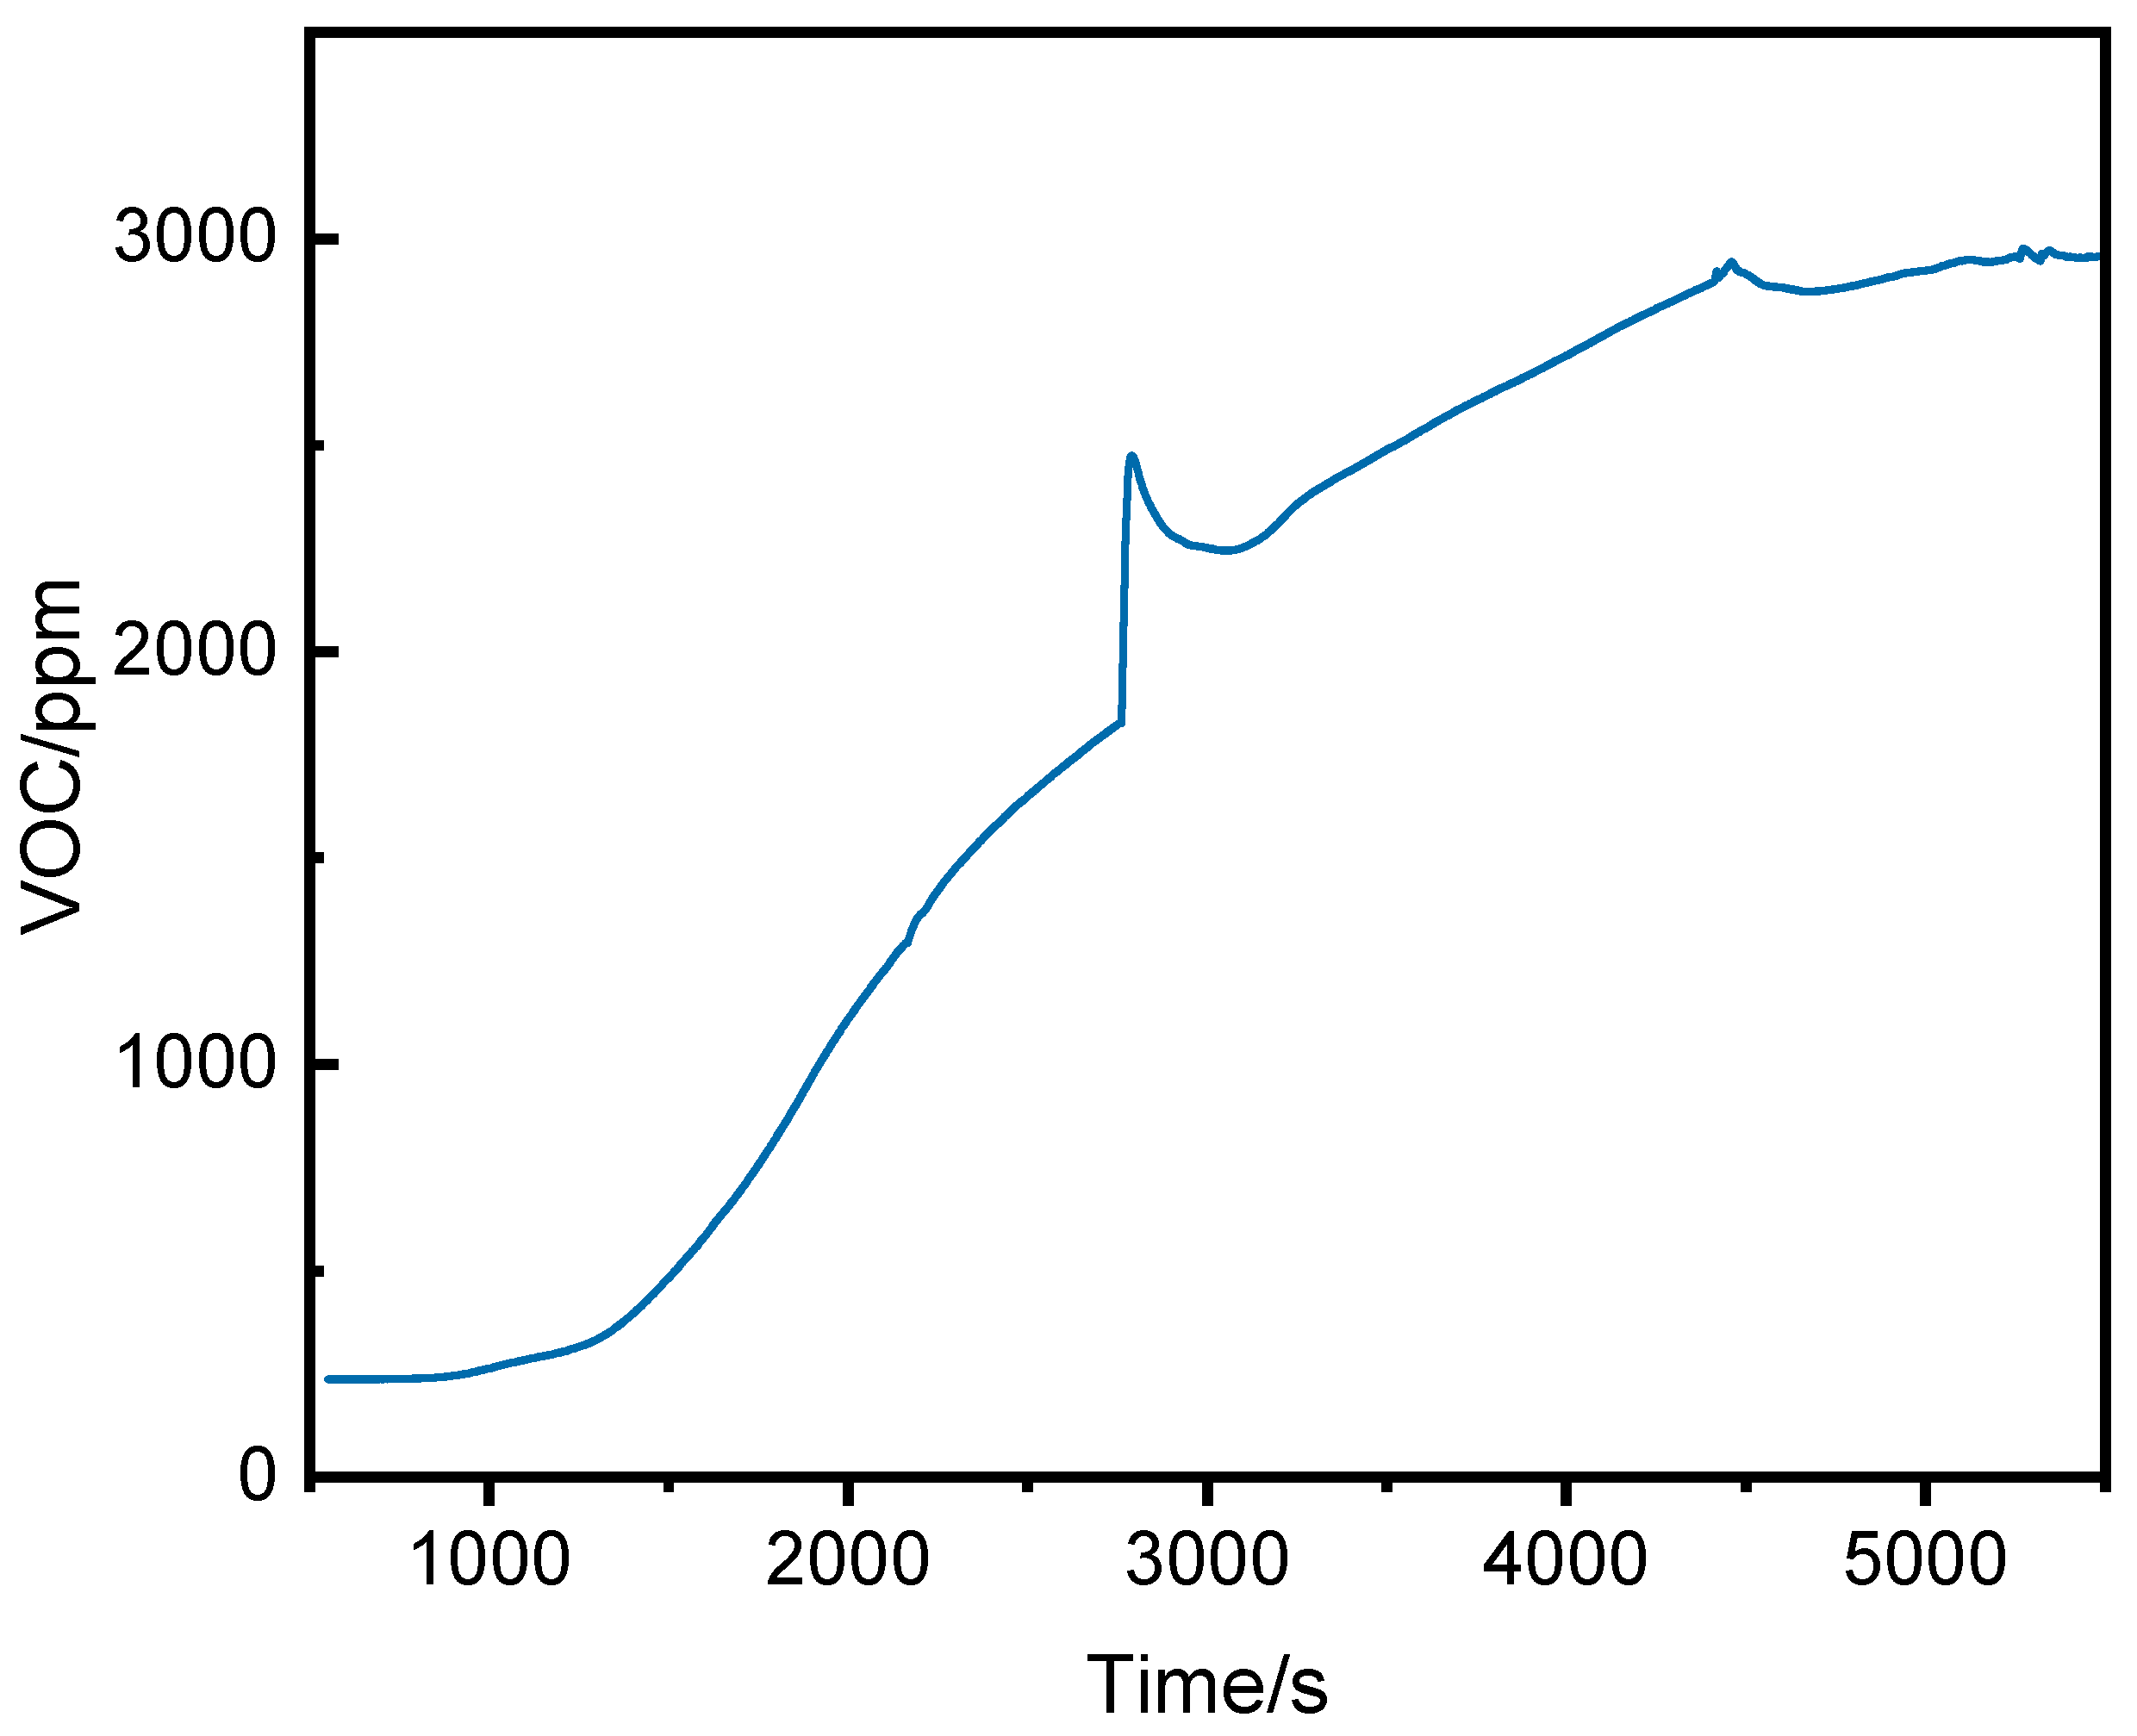
Figure 8.
Curve of the concentration of VOC at the top/middle/bottom of the thermal runaway cluster with time.
Figure 8.
Curve of the concentration of VOC at the top/middle/bottom of the thermal runaway cluster with time.
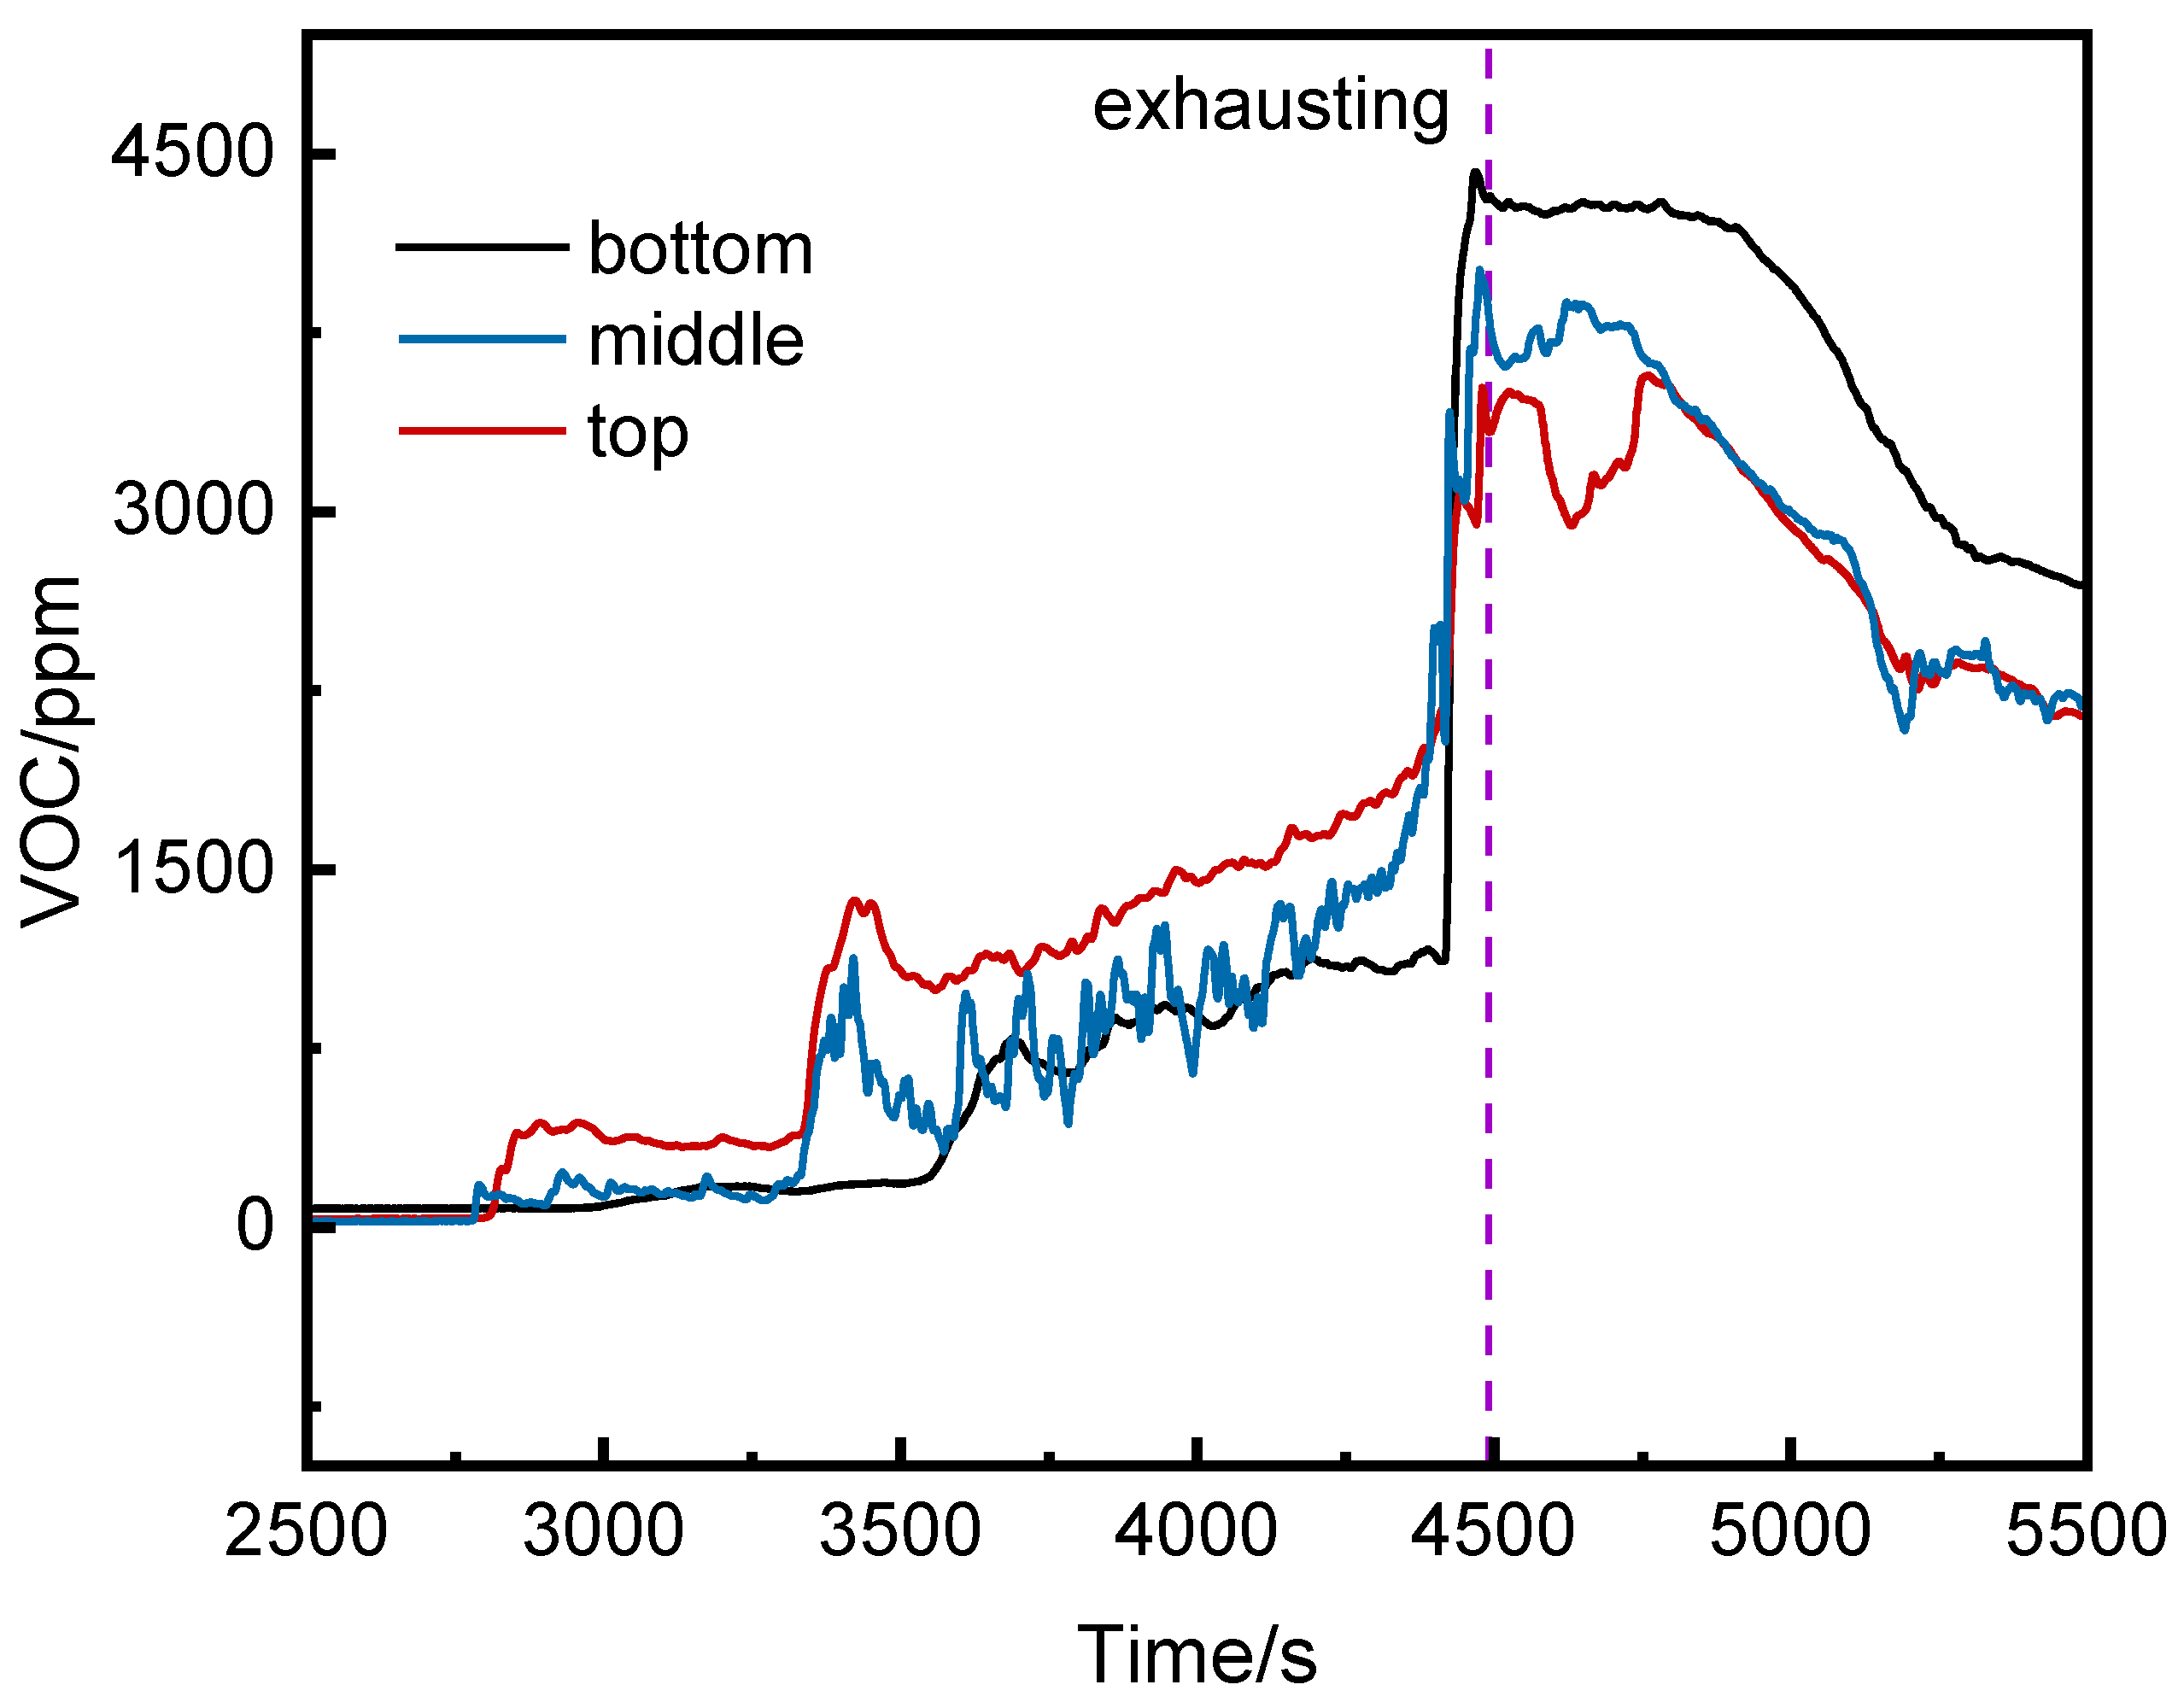
Figure 9.
Curve of VOC concentration with time at the bottom of each cluster on the left of the runaway cluster.
Figure 9.
Curve of VOC concentration with time at the bottom of each cluster on the left of the runaway cluster.
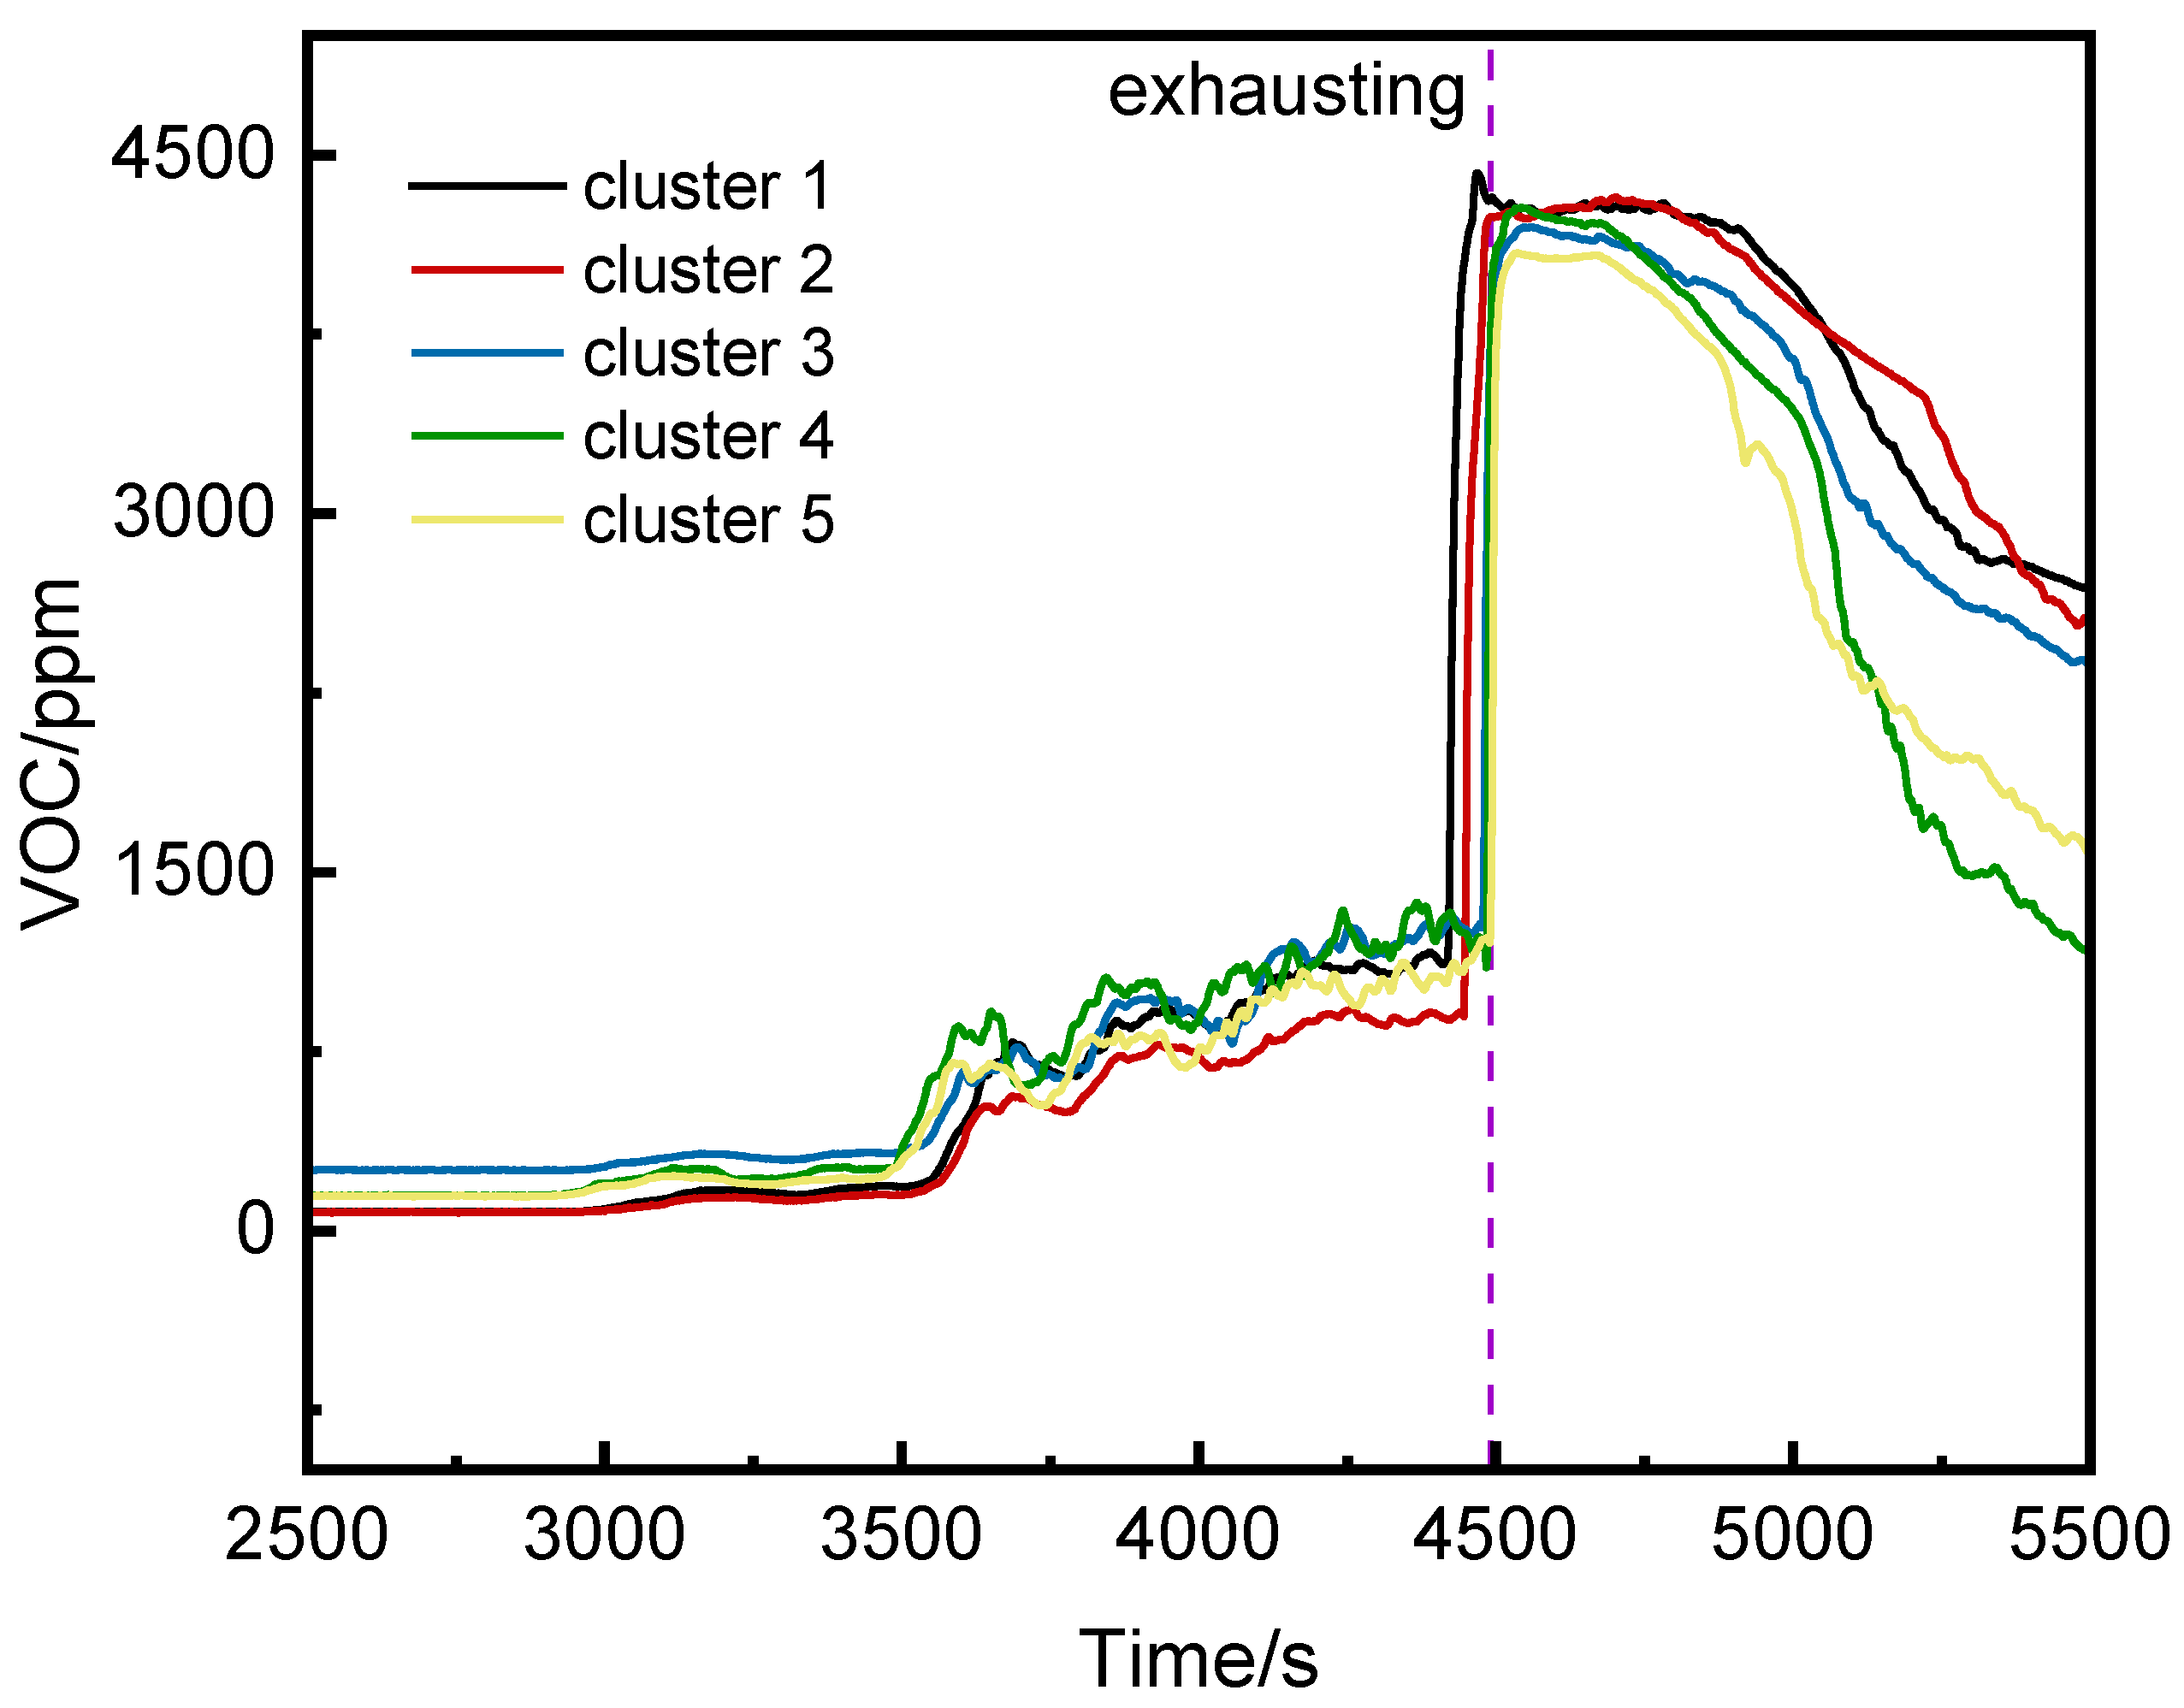
Figure 10.
Comparison of CO/VOC of thermal runaway cluster.
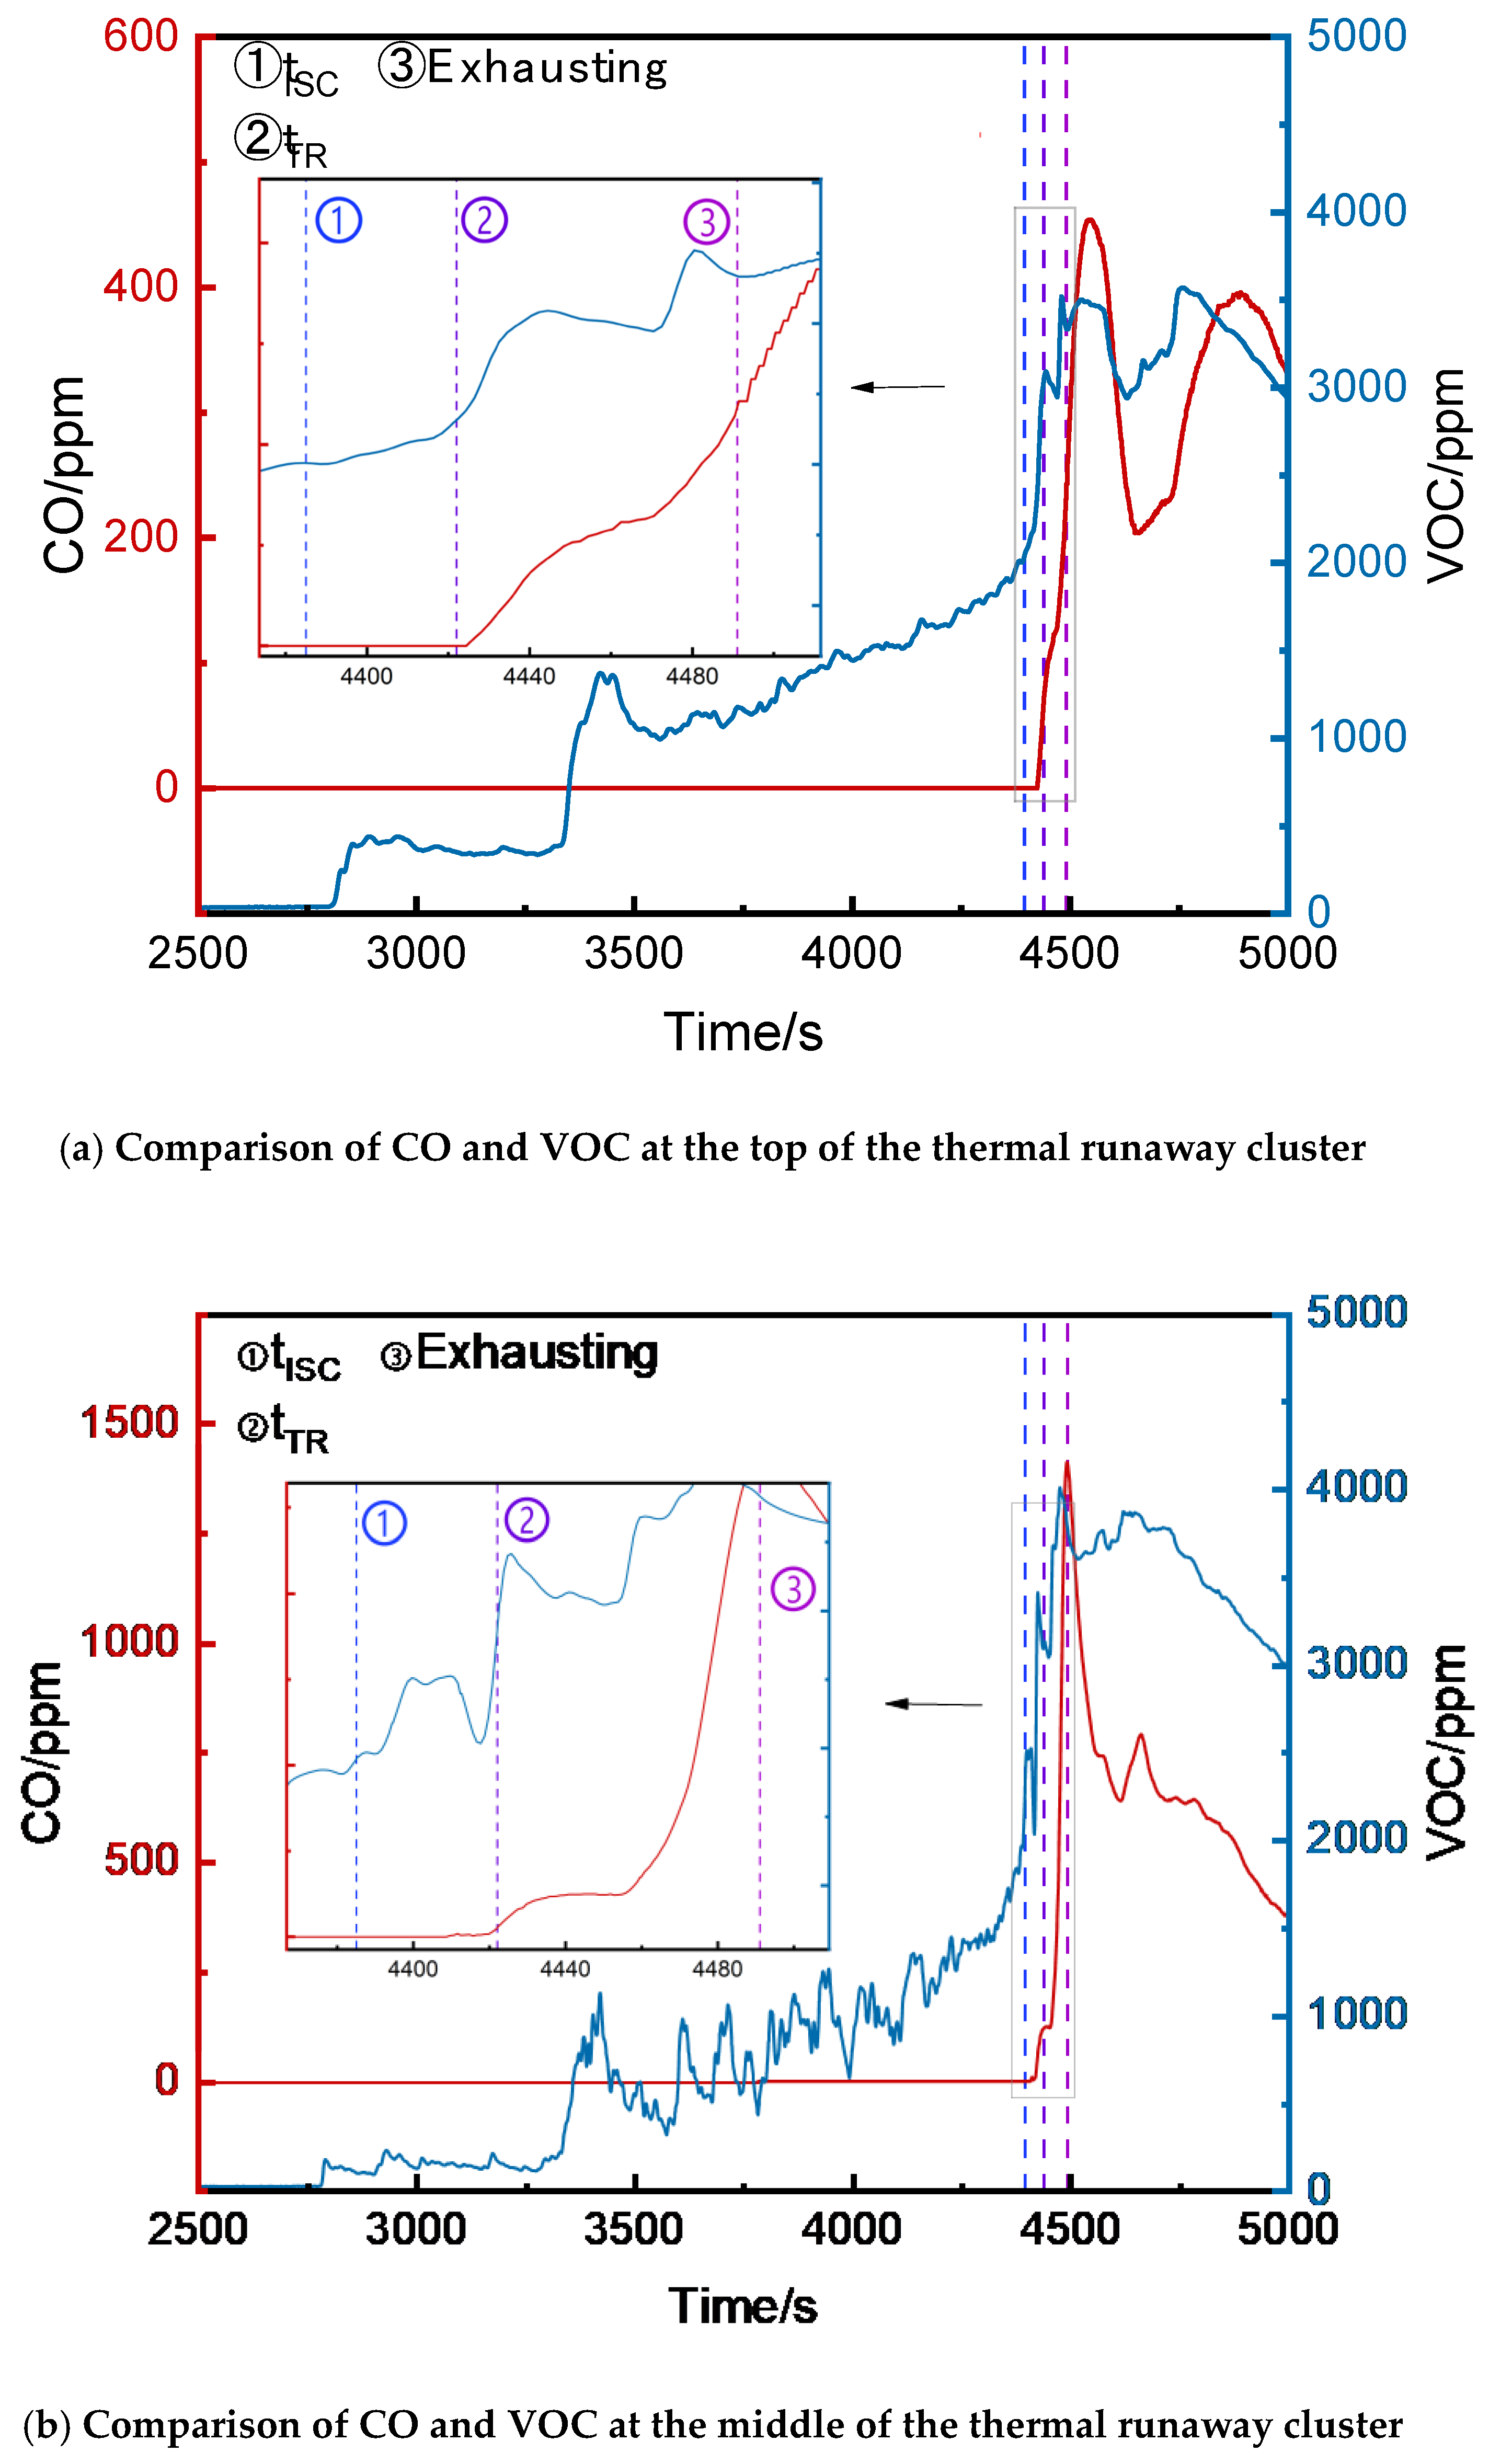
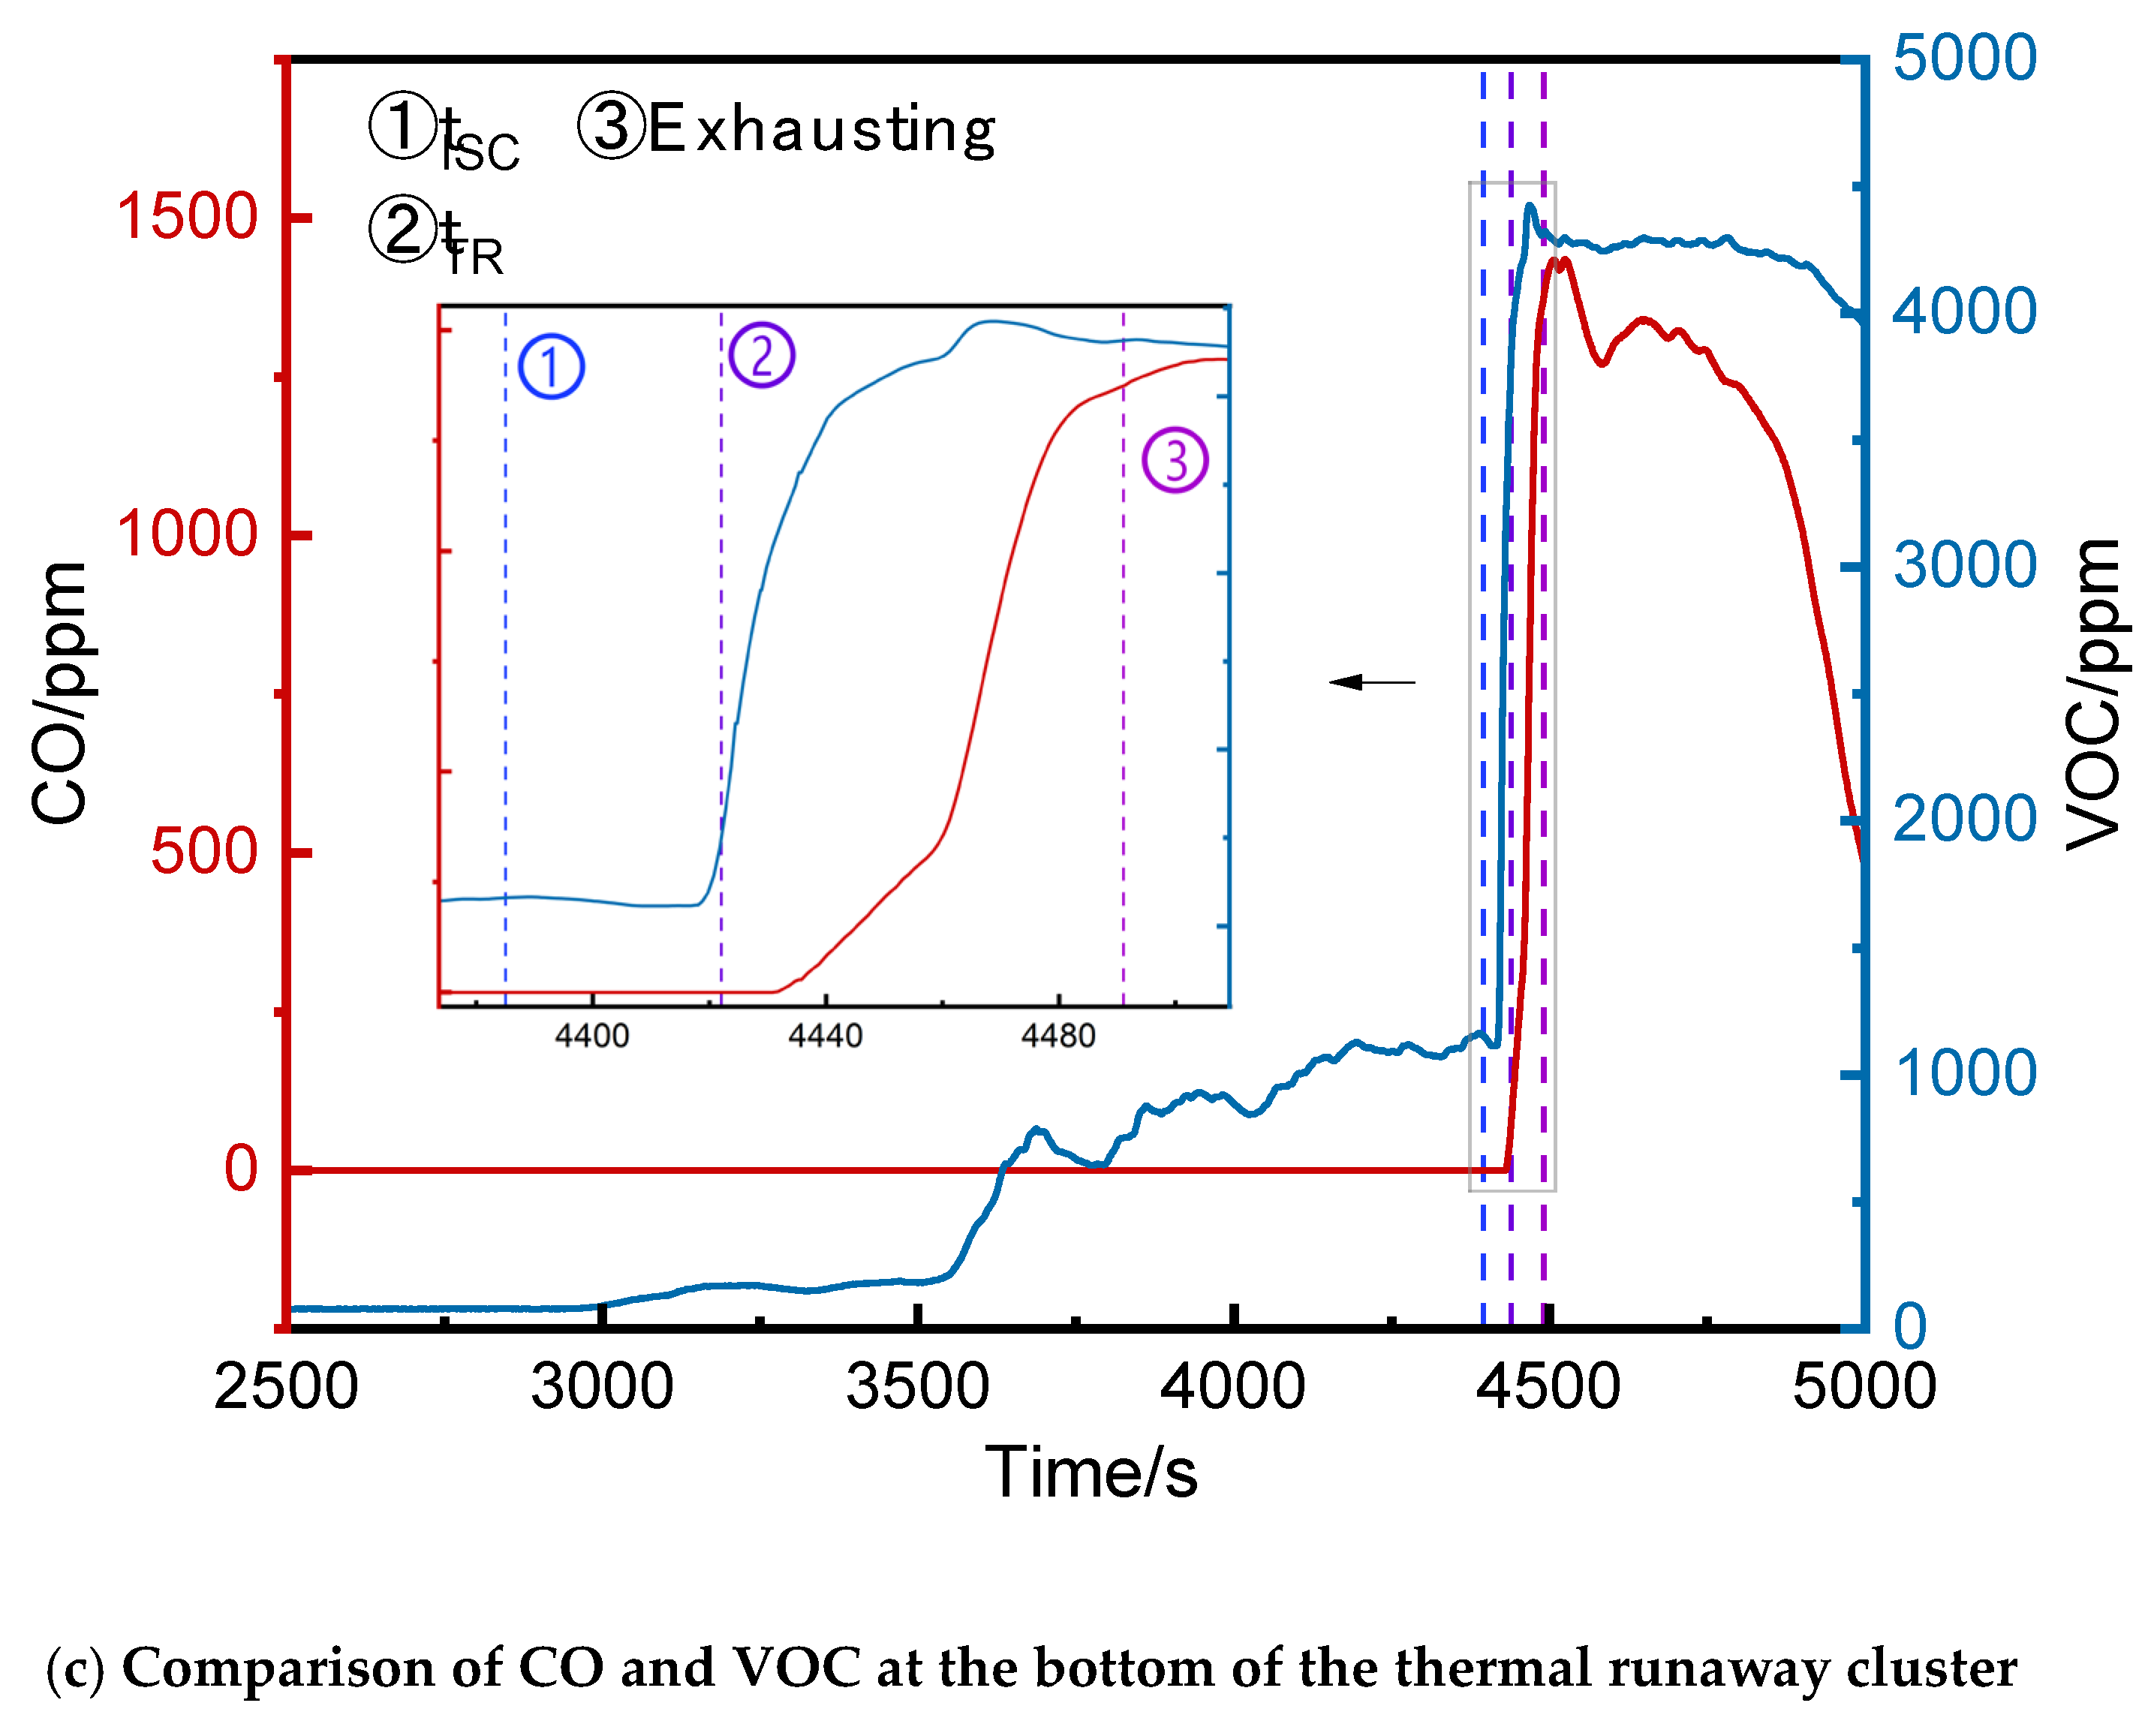

Table 1.
Comparison of CO and VOC at different position.
| Position | initial VOC detection values(ppm) | initial CO detection values(ppm) | tVOC(s) | tCO(s) |
| top | 29 | 0 | 2130 | 4426 |
| middle | 23 | 0 | 2728 | 4409 |
| bottom | 80 | 0 | 2967 | 4431 |
Disclaimer/Publisher’s Note: The statements, opinions and data contained in all publications are solely those of the individual author(s) and contributor(s) and not of MDPI and/or the editor(s). MDPI and/or the editor(s) disclaim responsibility for any injury to people or property resulting from any ideas, methods, instructions or products referred to in the content. |
© 2025 by the authors. Licensee MDPI, Basel, Switzerland. This article is an open access article distributed under the terms and conditions of the Creative Commons Attribution (CC BY) license (http://creativecommons.org/licenses/by/4.0/).
Copyright: This open access article is published under a Creative Commons CC BY 4.0 license, which permit the free download, distribution, and reuse, provided that the author and preprint are cited in any reuse.


