Submitted:
25 March 2025
Posted:
26 March 2025
You are already at the latest version
Abstract
The resuscitation of the patient in shock is a highly complex endeavor which should go beyond normalizing mean arterial pressure and protocolized fluid loading. We propose a holistic, four interface conceptual model of shock which we feel can benefit both clinicians at the bedside and researchers. The four circulatory interfaces whose uncoupling result in shock are the left ventricle to arterial, the arterial to capillary, the capillary to venular and finally the right ventricle to pulmonary artery. We review the pathophysiology and clinical consequences behind the uncoupling of these interfaces as well as how to assess them and propose a strategy on how to approach the patient in shock. Bedside assessment of shock may include these critical interfaces in order to avoid hemodynamic incoherence and focus on microcirculatory restoration rather than simply mean arterial pressure. Further research may incorporate these concepts.
Keywords:
shock
; resuscitation
; sepsis
; microcirculation
; hemodynamics
; coherence
Background
The diagnosis and management of shock remains challenging[1]. While there has been a strong movement to homogenize care by way of protocols, patients are highly heterogeneous, and many clinicians including the authors interpret the current literature as being strongly suggestive that a more physiologically personalized approach may benefit outcomes[2].
Over the past two decades, most guidelines have emphasized mean arterial pressure (MAP) targets, with weight-based fluids and followed by vasopressors and inotropes in the case of ongoing hypoperfusion. More recently, attention to fluid responsiveness has led to some using the lack thereof as a fluid stop point, but without assessing potential venous congestion or fluid tolerance[3,4]. While the use of bedside ultrasound has been slowly increasing, it is not yet formally integrated into the majority of resuscitation algorithms or common practice[5].
Recently, alternative resuscitation algorithms have emerged, some looking at markers of forward flow using echocardiography[6,7], others at assessing peripheral perfusion using capillary refill time (CRT)[8,9]. Nevertheless, the value of a multimodal perfusion assessment has been emphasized by recent guidelines or position papers, including the incorporation of critical variables such as venous-arterial pCO2 gradients and central to venous oxygen saturation in addition to CRT into the decision tree [10,11].
Fortunately, these are moving towards a more personalized, goal-oriented approach[12]. The venous side of the circulation has traditionally received very little focus compared to the arterial side. Recently, work surrounding the role of central venous pressure (CVP) in resuscitation[13] as well as ultrasound markers of venous congestion and right ventricular failure have begun to bring this forward, despite the notion being present in the literature nearly a century ago[14].
Hemodynamic coherence refers to the coupling of macro- and microcirculation[15]. Coherence is achieved when manipulation of macro-circulatory variables such as MAP and cardiac output (CO) leads to improvement in microcirculatory flow and tissue perfusion. Conversely, hemodynamic incoherence is the failure of microcirculatory flow despite improved macrohemodynamic parameters. At this stage, excessive fluid or vasoactive administration may in fact worsen tissue perfusion and organ function.
Personalizing Resuscitation to Patient Pathophysiology
The authors feel that a focus on MAP or stroke volume (SV) paired only with surrogate markers of perfusion such as lactate is insufficient. We propose a four-interface model of the macro- and micro-circulation for the assessment and treatment of hemodynamic instability and the identification of potential incoherence. For instance, the focus on increasing MAP using crystalloids - while ignoring that the increase in central venous pressure can itself be decreasing tissue perfusion pressure - may worsen patient outcomes, as further discussed below[16]. Similarly, increasing MAP with vasopressors without realizing that increased afterload may decrease the SV of a failing heart[17] - and thus tissue perfusion - would be equally deleterious, albeit from a different mechanism. Hence clinicians should familiarize themselves and be able to assess each of these key hemodynamic interfaces.
For the purpose of this conceptualization, source control is both paramount and assumed. No amount of personalized resuscitative efforts will improve patients’ outcomes if source control is not achieved in parallel. As such prior to engaging in any phenotyping of a patient's shock it is necessary to have excluded cardio-respiratory mechanical causes of shock which include pathologies such as massive pulmonary embolism, ventricular free wall rupture, papillary muscle rupture, tamponade, dynamic left or right ventricular outflow tract obstructions, acute ventricular septal defect, tension pneumothorax, acute myocardial infarction, severe air trapping, abdominal compartment syndrome and other pathologies that have specific treatments.
This haemodynamic conceptualization hence applies to the optimization of the patient who is in shock without any interventionally reversible cause or as a bridge until true source control is achieved. We propose four critical shock-related interfaces within the circulatory system, (I) left ventricle (LV) to systemic arterial, (II) arteriolar to capillary (macro- to microcirculation), (III) capillary to venular, and (IV) right ventricle to pulmonary artery (RV to PA).
Note that there are other important hemodynamic interfaces, the veins to large “terminal” veins (inferior and superior venae cavae), the large veins to the right atrium, as well as the pulmonary venous system to the left atrium. While such additional variables are not included in the core conceptual model outlined here to avoid making it overly cumbersome, the four proposed interfaces may be easily assimilated into a broader hemodynamic framework, as outlined in Figure 1.
We offer an integrated framework of assessing the above-described interfaces at different levels, ranging from simple, minimal-resource approach to a full-technology one, serving as a mental model for both clinical use and research design.
Circulatory Coupling
“Coupling” refers to unique structures between which energy transfer occurs. Coupling is considered ideal when it results in minimal expenditure and maximal efficiency. Hemodynamic coupling, historically, has been quantified as a ratio of elastances (change in pressure per change in volume): arterial tree elastance (Ea) divided by the elastance of the ventricle (Ees)[18,19]. Arterial elastance is a determinant of LV afterload whereas ventricular elastance is a marker of contractility. Thus, Ea/Ees is a quotient demonstrating the balance between afterload and contractility. Take for example, a patient presenting in vasodilatory shock from sepsis. Upon initial assessment, left ventricular ejection fraction (LVEF) appears to be normal but Ea or the afterload is low due to vasodilation: a vasopressor is started to counter the low resistance and improve the left ventriculo-arterial coupling. On reassessment, once normal arterial resistance has been restored, impaired LV function is noted and a decreased contractility that was initially masked by the low afterload. To re-establish left ventriculo-arterial coupling an inotrope may be required to improve contractility and therefore LVEF.
Coupling can be graphically depicted on a Cartesian plane, plotting volume on the abscissa and pressure on the ordinate[18]. A resulting line, end systolic pressure-volume relationship (ESPVR), is a marker of the LV inotropic state. The ESPVR line’s intercept on the ordinate is termed V0, a theoretical state where the left ventricle is completely decompressed. Significant deviation from the coupling indices, or uncoupling, results in clinically evident circulatory pathology. In this model we include circulatory interfaces that do not include a pump per se, but where the pressure differences nonetheless possess the potential for uncoupling.
The Concept of Mean Systemic Filling Pressure (MSFP).
During circulatory flow, pressures in the arterial and venous circulation are dissimilar due to differences in the compliance of the arterial and venous compartments. If circulatory flow is stopped, pressure will rapidly equalize between the two compartments as blood volume moves from the arterial compartment to the venous side down a pressure gradient – until the gradient is exterminated. The equalization systemic pressure at “stop flow” conditions is the MSFP and is normally about 7- 10 mmHg in mammals [20,21,22]. The factors influencing the MSFP are the stressed volume (volume that distends the vasculature) and the sum total of the venous compliance or venous tone. Thus, the MSFP will increase or decrease with changes in either intravascular volume or vascular tone. MSFP is the driver behind venous return (VR), with the CVP being the impeding downstream pressure to flow[22]. It is important to note that the MSFP is not only a preloading force to the cardiovascular system but also an afterload to organ venous flow.
The Relevance of Microhemodynamic Variables
Intuitively, the difference between MAP and CVP should govern blood flow in the major cardiovascular circuit. However, this assumption would be true if the vascular system were a continuous and rigid tube, which it is not [23]. Indeed, the hydraulic transition from macro to microcirculation involves a series of intricated phenomena in which microvascular flow remains nearly constant in a wide range of pressures, as tissues can adapt their own perfusion to match oxygen and cell metabolic demands. Such local regulation of flow is finally governed by a combination of cellular and endothelial signals (including oxygen, potassium, hydrogen ions, lactate, adenosine, inorganic phosphate, prostanoids, eicosanoids, endothelium-derived nitric oxide, among others), the sympathetic influx and the vascular myogenic responses [24], which will not be discussed in this manuscript.
The contractile action of the heart provides the force for bloodstream, which is transmitted along the vascular tree as a pressure wave and then gradually dissipated by the resistance encountered as the vessels subdivide and narrow. This leads to a rapid drop in arterial pressure within the small arterioles as a function of resistance. Interestingly, the steepest drop of pressures in the systemic circulation occurs in arterioles whose aggregated resistance is higher than summatory capillary resistances.
According to Laplace’s Law, vascular tension depends on the balance of the distending force generated by the transmural pressure that pushes the wall outward, and the constricting force from elastic components within the wall that pulls it inward. When vasomotor tone or external forces exceeds local arterial pressure (i.e., when transmural pressure becomes negative), the vessel collapses, thus limiting flow. The intraluminal pressure at which arterial vessels collapse is the so-called critical closing pressure (Pcc), which would represent the effective back pressure to arterial flow. In other words, the difference between MAP and Pcc should represent the tissue perfusion pressure (TPP).
Several observations have suggested a “non-continuity” of the vascular system reflected by significant discrepancies between pressures registered during flow cessation at the arterial and venous side of circulation, in both animal models [25,26] and humans after spontaneous cardiac arrest [27]. Such arterial to venous pressure gradient at zero flow represents the called vascular waterfall (VW) [28], which theoretically functions to keep arterial pressure slightly elevated potentially sustaining blood flow to vital organs [29,30]. Such VW could be indeed explained by a Starling resistor-like mechanism [31]. Some authors have theorized that, as well as a waterfall in which flow over its edge is theoretically independent of the height of the fall itself, flow beyond Pcc point should be independent of outflow pressure, i.e., independent of further downstream capillary and venous pressures. Nevertheless, this last concept has not been clearly proved in both humans and even in vivo models.
Progress to bringing these physiological concepts to the clinical arena has been hindered by the challenge of bedside measurement. Beneficial or detrimental effects of vasopressors on tissue perfusion can occur depending on their relative actions on MAP and CCP [7,32]. The ability to monitor TPP would offer an advantage for MAP optimization in circulatory shock patients.
In the discussion below, we will refer to several monitoring and assessment techniques which we will not expand on in detail, as an in-depth review and validation of these is beyond the scope of this text. Interested clinicians should familiarize themselves with the techniques, application and limitations of each of these before application[33,34].
Interface I: Left Ventriculo-Arterial Coupling - End-Systolic Elastance and Systemic Arterial Elastance
Coupling at this interface is expressed as the ratio of effective Ea to the end-systolic elastance of the LV, or Ea/Ees. The gold standard for assessment of ventriculo-arterial coupling (VAC) requires invasive catheterization of the left ventricle and simultaneously measuring ventricular volume (by conductance) and pressure (by pressure transduction) measurements to create the slope of the ESPVR[35,36]. The invasive nature along with the complexity of the multi-beat process is too cumbersome for routine use. Therefore, there have been alternative approaches devised, using a single-beat method, to estimate Ea/Ees. Chen et al have devised one for estimating Ees using systolic and diastolic blood pressure measurements combined with echocardiography to obtain stroke volume, EF, pre-ejection time, and total ejection time[37]. Ea can be estimated by dividing 90% of the systolic blood pressure (SBP) by the stroke volume (SV), Ea = (0.9 x SBP)/SV. The Chen algorithm has been even integrated into a free app (iElastance) which facilitates its calculation. In addition, Monge Garcia et al. showed in an experimental study that changes in Eadyn (pulse pressure variation/stroke volume variation) reflect changes in VAC [38]
There are limitations to single-beat estimation. When V0 is zero, Ea/Ees can more simply be described in terms of the LVEF [39]. Anyone measuring LVEF should know it reflects VAC: LVEF is not a measure of contractility as it depends on loading conditions and end diastolic volume. It becomes more useful in shock management when considered in the context of Ea. For example, if LVEF (and therefore VAC) is normal when Ea is low in a patient with vasodilatory shock, increasing Ea with a vasopressor may result in a decrease in LVEF, revealing underlying impaired LV function, and an inotrope may be required. A high LVEF and low Ea is a sign of a hyperdynamic circulation, usually seen in resuscitated vasodilatory shock[18,40].
It is important to note that hypovolemia represents a form of interface I failure due to low LV preload and SV, even if there is no technical “uncoupling” as Ees and Ea are both increased with sympathetic activation so the Ea/Ees ratio may remain normal. Ultimately, proper function at interface I requires coupling as well as adequate SV (hence adequate preload) and CO. It is particularly relevant to consider that the term “adequate” SV or CO must be determined by its effectiveness to achieve or maintain normal tissue perfusion.
Once an uncoupled state is identified, the clinician must then decide how to address the Ea and/or the Ees and SV. If a low preload is detected, causing a low SV, this needs to be corrected, which may require fluids if the patient is frankly hypovolemic, vasopressors to restore MAP, DBP and eventually MSFP if there is a vasodilatory issue, or assistance to the RV if LV preload is in fact impaired by RV dilation/limitation/septal shift. Additionally, reassessment of VAC after any therapeutic intervention is prudent and necessary.
Interface I at the Bedside - In the absence of Point-Of-Care-Ultrasound (POCUS) availability, pulse pressure (PP) can provide a correlation to SV, although it is subject to false positive error of being increased in patients with increased afterload or low aortic compliance due to reflected pressure waves. In addition, a low PP may reflect either a profound hypovolemia or a LV failure.
With POCUS, LVEF is the most closely related echographic parameter, as it is inherently a load-dependent variable, so a normal or elevated LVEF essentially rules out uncoupling, but does not necessarily equate to adequate CO (which requires adequate SV, not only EF). Left ventricular outflow tract velocity time integral (LVOT-VTI) correlates (and can be used to measure) SV, such that an adequate VTI (>18 cm2) likely rules out significant uncoupling. Corrected flow time of the carotid artery (cCFT) is also proposed as an SV surrogate because the duration of mechanical systole is directly proportional to SV [41,42]. While a cCFT greater than approximately 300 milliseconds (ms) is normal [43], this threshold could lead to false positive results when there is elevated Ea and/or diminished Ees, which both prolong ejection for any given SV; like PP, the duration of ejection increases with age [44,45].
Interface II: Arterioles to Capillary
The second interface occurs at the distal part of the arterial system where CCP occurs, interfacing with the capillary network [46]. Uncoupling can occur if excessive vasoconstriction is limiting capillary perfusion, which can happen when MAP is low (due to low SV), but may also happen in the presence of a normal or even elevated MAP driven by vasoconstriction with a concomitant elevation of the Pcc (Figure 2 with high arterial resistance). The relevance of the DBP is often overlooked. With increased compliance of the proximal larger arteries and increased distal resistor tone of the arterioles, the DBP is increased[47]. Faster heart rates also promote higher DBP, as there is less time for the pressure to decay before a reloading volume–and pressure– is delivered by the next systolic period[48]. As about ⅔ the time of a cardiac cycle is spent in diastole, it is important that DBP is maintained above the Pcc of the major capillary beds, otherwise the viscoelastic properties of the capillary beds will cause them to collapse, resulting in uncoupling of interface II. Normally, local control of regional arteriolar tone allows tissue beds to recruit more or less of the MAP to satisfy their various metabolic needs. However, this local control is often compromised in shock states – either by local pathological derangements or by inappropriate prescription of various therapies such as excessive vasoconstriction.
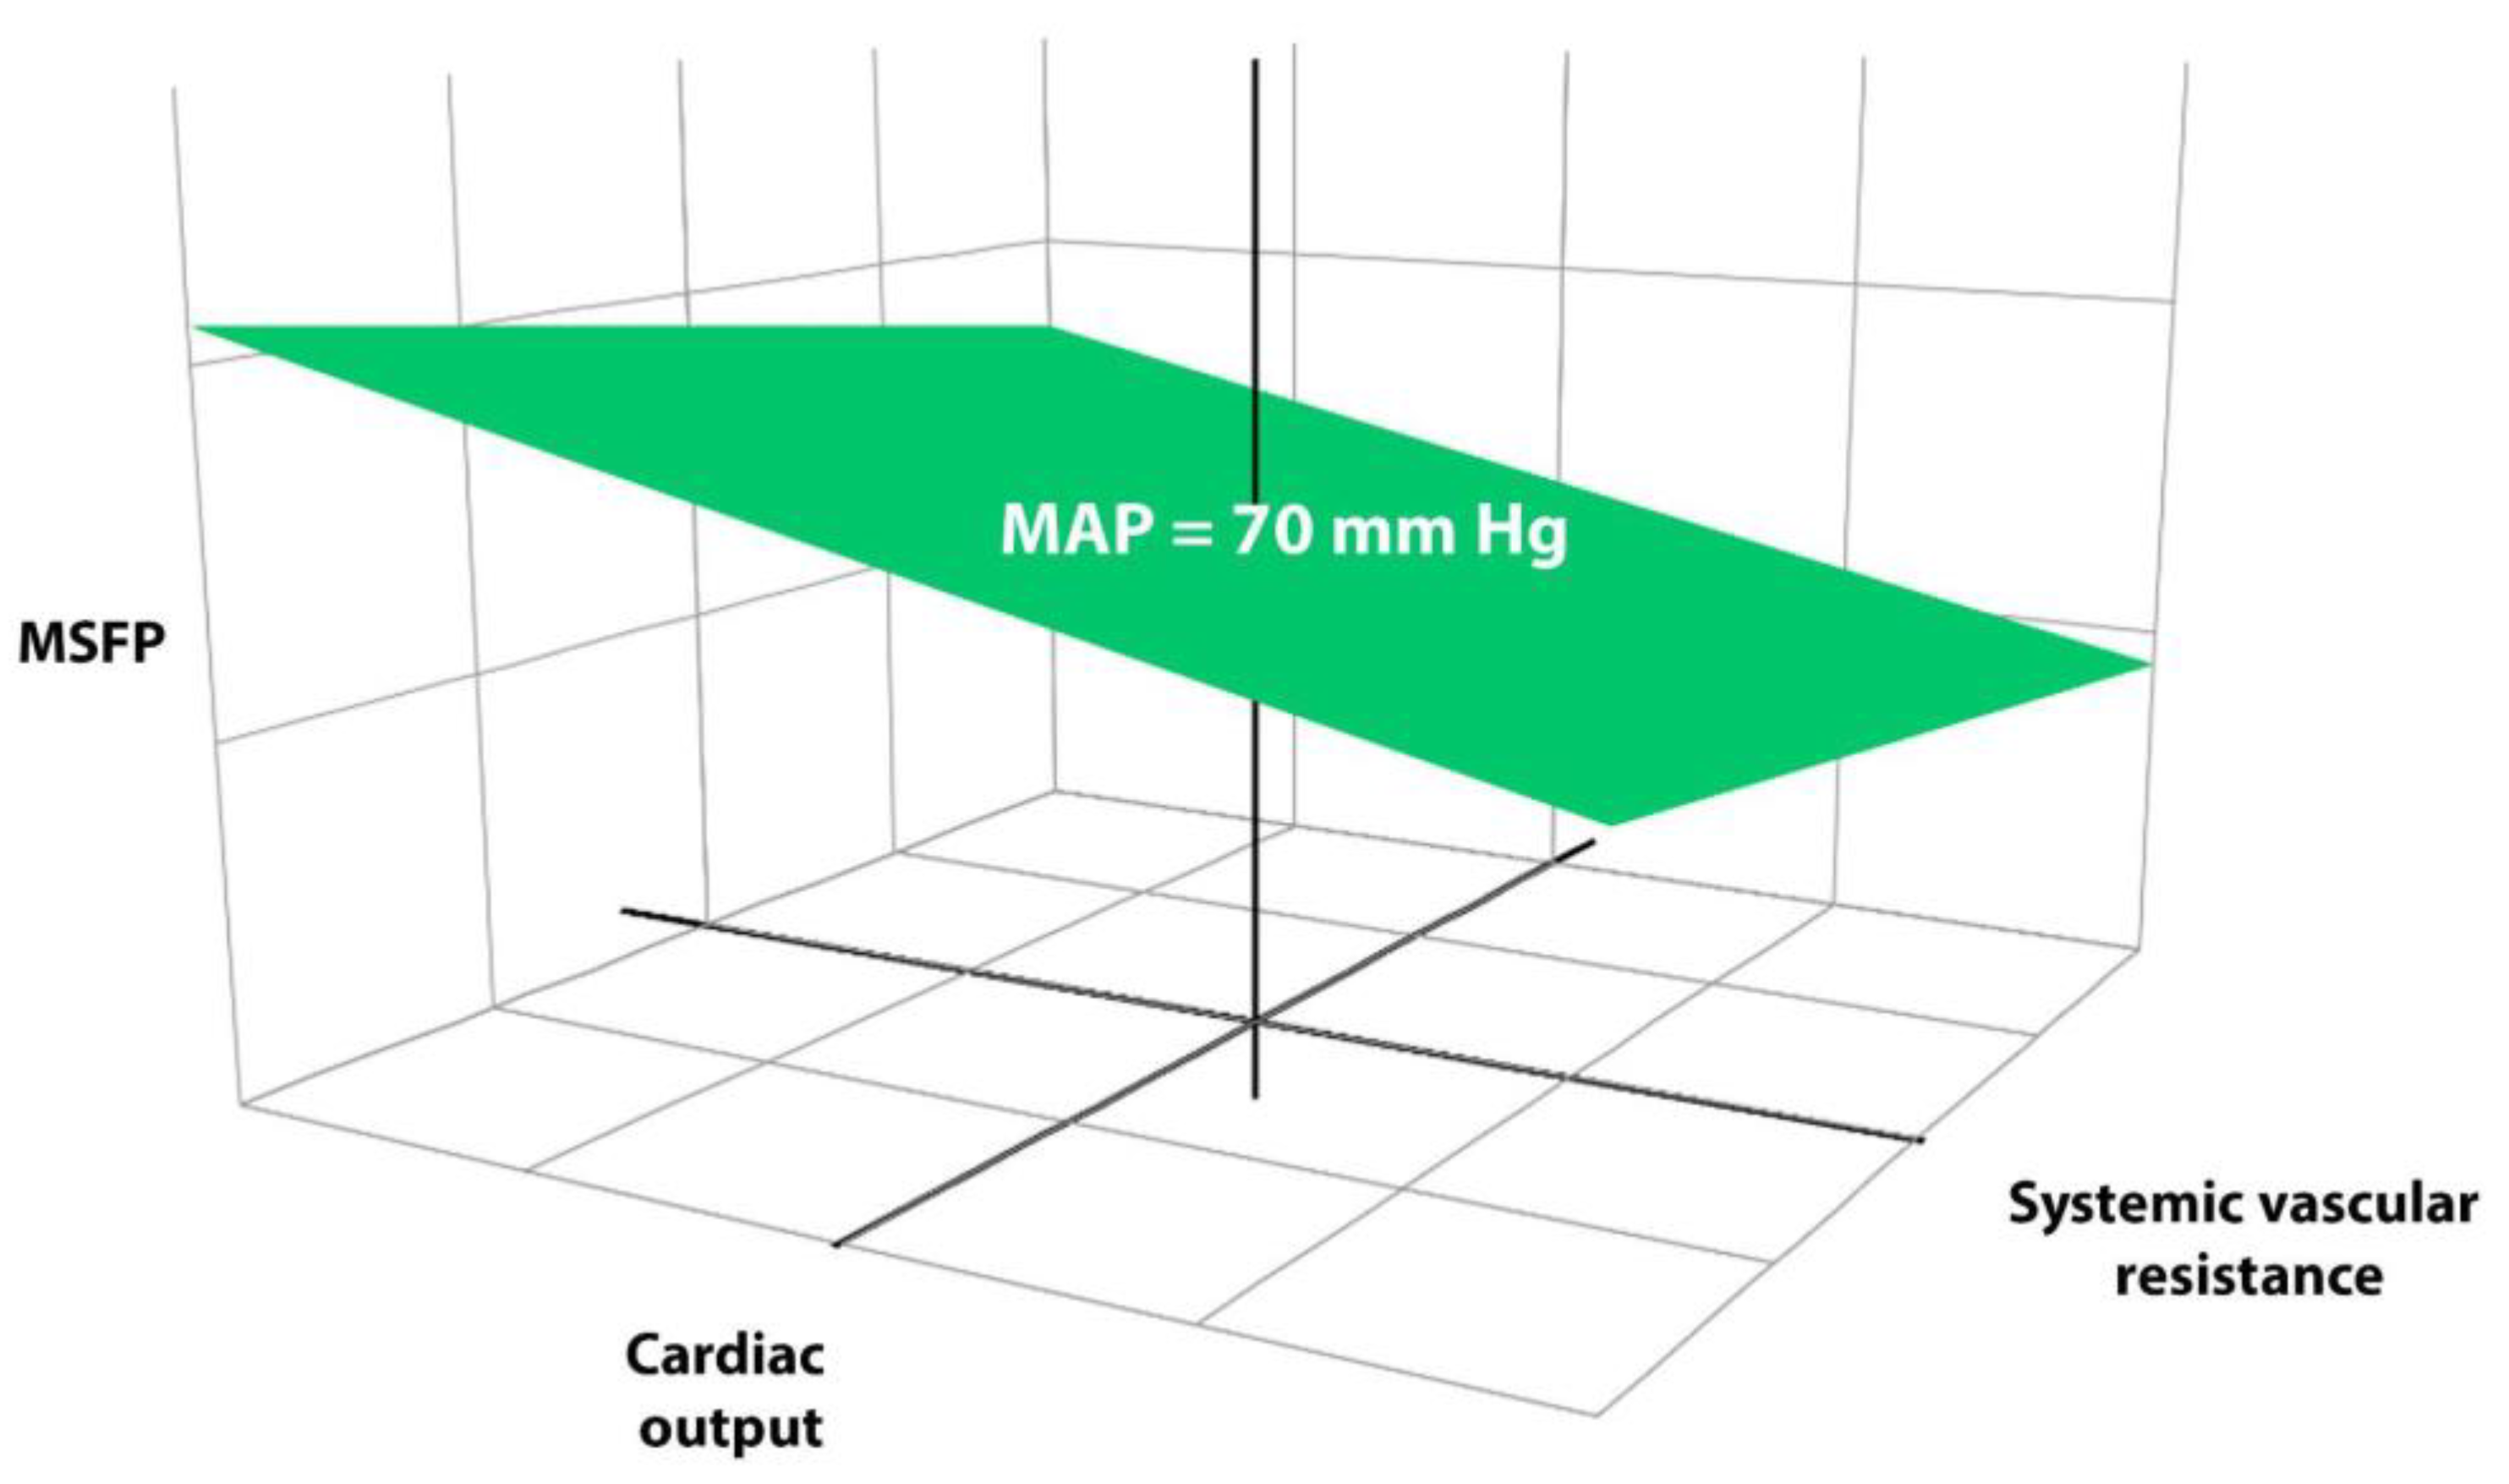
It is important to understand that the relationship between MAP and tissue perfusion is non-linear. In Figure 2, one can visualize that a patient can be on the iso-pressure plane but, if in the right lower quadrant, CO is low and arterial resistance high, hence the critical closing pressure will also be high, and perfusion will have dropped off despite a normal MAP.
The emergence and validation of CRT as a resuscitation target supported by strong epidemiological data[49], physiological background[50] and a major RCT has led to its use as a surrogate of microcirculatory perfusion[9,51]. With extremely rapid response to potentially flow-increasing maneuvers (fluid or MAP challenges), it is the ideal variable to assess the status of macro-to microcirculatory coupling [8,53,54]. In addition, it is simple, rapid, extremely low-cost and requires no technology. However, it has some drawbacks as any perfusion monitoring variable. Among them are interrater reliability, gaps in physiological background knowledge, and the impact on CRT assessment of high or changing vasopressor doses, etc.
Another potential measure of tissue perfusion which is equally simple and available is the skin mottling score, which has been strongly associated with mortality in sepsis and cardiogenic shock [54,55,56].
To some degree, tissue perfusion can also be coarsely assessed by global markers such as the deltas between arterial and venous (central/mixed) and tissue saturation (StO2), representing an “adequacy of supply” measure. A pCO2 gap at or below 6 is generally felt to be suggestive of adequate CO for demands[57]. In addition, analysis of the recovery slope after a vascular occlusion test with thenar NIRS may disclose the status of microvascular reactivity.
Interface II at the Bedside
It is very complex to evaluate this interface at the bedside since only surrogates of microcirculatory flow can be used. Extensive research during the last two decades using handheld videomicroscopes at the sublingual area have described several abnormalities in flow, density and heterogenity at this level on which some are related to shock -related endothelial dysfunction. However, this technique is expensive and restricted to the research arena. Some recent studies suggest that the response of CRT, as representing an extensive microcirculatory territory, to a fluid or a MAP challenge may disclose the status of hemodynamic coherence. A decrease of CRT of more than 25% or one second immediately after a fluid bolus, or an increase in MAP to 80-85 mmHg for 30 minutes may signal a preserved coherence [8,53,54].
Interface III: Distal capillary to Venular
At this level, vascular pressures are low, operating near MSFP values. The gradient driving flow thru from tissues after the VW is the gradient between MSFP and CVP, hence the main factor affecting tissue perfusion is the CVP[30,33]. This venous side of the circulation has long been overlooked, partly since venous pressures, being often an order of magnitude lower than arterial pressures, have been ignored in favor of forward flow centrism and an overly simplified conceptual model of perfusion pressure.
When CVP, then venous and venular pressures rise, a microcirculatory dysfunction may be induced either by stasis or by a decrease in capillary density secondary to tissue edema [15]. As venular pressures increase, this will inevitably cause stasis and edema, worsening the true perfusion pressure. Though physiologically a logical construct, it is important to acknowledge that supporting clinical data for clinical improvement if this congestion is corrected remains under investigation. It has not been demonstrated, for example, if increasing Pmsf by increasing CVP independent of decreasing CO has a specific detrimental effect, or if removing fluid by diuresis or dialysis restores capillary perfusion and improves organ function and prognosis. This opens new avenues for specific research in this therapeutic area.
The importance of CVP is underscored by studies where a high CVP (>12 mmHg) was associated with worse tissue perfusion as measured by low microvascular flow index (MFI <2.6)[16]. More recently, Beaubien-Souligny et al. demonstrated that congestive abnormalities in solid organ venous Doppler correlated with organ dysfunction in post-op cardiac surgery patients [58]. This has since been replicated in several studies, establishing the Venous Excess Ultrasound (VExUS) score as a tool to measure severity of congestion [59,60,61]. This tool must be considered as a starting point and should be validated by ongoing studies in other scenarios such as septic shock.
It is important to realize that Interface III uncoupling takes place at the organ or tissue level, such that the cause of the CVP elevation is immaterial. The presence of a significantly elevated CVP (likely values over 10-12) may uncouple interface 3 and potentially contribute to tissue hypoperfusion irrespective of the cause. This is the key point about interface III which reflects the perspective of the tissue beds - venous afterload - as opposed to strictly a circulatory parameter, and is important to look at, since any resuscitative strategy that causes interface III uncoupling can worsen tissue perfusion and organ function irrespective of potential improvement in macro-hemodynamics - another mechanism behind hemodynamic incoherence.
Interface III at the Bedside – Elevated jugular venous pressure reflects increased CVP. This can be measured by clinical exam or by POCUS [62]. Locating the jugular venous pulse (JVP) can estimate the central venous pressure (CVP) and infer right heart hemodynamics by qualifying the x’ and y descents a and v waves. When supine, the jugular Doppler systolic (S) wave more than diastolic (D) wave is normal, recapitulating x’ > y descent. Several studies have shown that S = D, S < D and monophasic D wave filling are abnormal patterns seen with RV dysfunction, tricuspid regurgitation and/or pulmonary hypertension [63,64,65,66].
Femoral vein Doppler (FVD) is another tool to assess the effect of central venous pressure elevation[67]. It is considered suggestive of venous congestion if any of these criteria are fulfilled (1) pulsatile in nature (2) retrograde flow velocity of more than 10 cm/s or (3) flow reversal/retrograde flow velocity being more than 1/3rd of antegrade flow velocity. It demonstrates a moderate level of agreement and high sensitivity in detecting elevated CVP levels (>12 mmHg). Doppler envelope of abdominal organs has also shown close correlation to central venous pressures and, more importantly, to organ dysfunction. Both the VExUS score, a composite of IVC, hepatic, portal and intra-renal venous assessment, as well as the renal venous stasis index (RVSI) are associated with organ dysfunction as congestion increases [68].
Further studies should address whether risk of acute kidney injury (AKI) is better predicted by a high CVP or the mean perfusion pressure (MAP-CVP) as compared with the VexUS score considering a recent negative study with the latter [59,70,71].
Interface IV - Right Ventricular (RV) to Pulmonary Arterial (RV-PA)
Excessive fluid administration and/or uncoupling of the RV-PA interface is what leads to an elevated CVP (aside from mechanical issues affecting the right atrium such as tamponade, tension pneumothorax, etc.). If the uncoupling is severe enough to elevate CVP, it may uncouple interface III, emphasizing the tight linkage between these interfaces. However, while assessing interface III focuses on the effects on the tissues, interface IV assessment is intended to diagnose and treat the cause of RV-PA uncoupling.
RV-PA coupling is defined as Ees/Ea, rather than Ea/Ees, and differs from LV-arterial coupling in several ways. The normal RV has a lower Ees compared to the LV and ejects blood into the pulmonary circulation with a lower Ea. Optimal RV-PA coupling occurs at a ratio of about 1.5-2:1. Outside of primary RV cardiomyopathies and RV infarct, RV-PA uncoupling typically results from increased Ea. This is true in chronic cases of pulmonary arterial hypertension, though there is ample time for compensatory increase in Ees. In acute pulmonary hypertension, the unconditioned RV may not be able to adapt to abrupt rises in Ea. In contrast to metrics such as pulmonary vascular resistance, Ea incorporates both pulsatile and non-pulsatile measures of pulmonary afterload. As such, it can provide information on loading conditions related to left heart function, and thus integrates interfaces I and IV [72].
As in LV-arterial coupling, the gold standard method of assessment is performed using invasive conductance catheterization to measure both Ea (calculated as end-systolic pressure divided by stroke volume) as well as Ees (the slope of the ESPVR curve). Using a standard pulmonary artery catheter (PAC), Ea can be approximated using calculations such as mPAP/stroke volume, but no easily measured surrogate for Ees exists. The maximal slope of the RV pressure waveform upstroke (dP/dt max) could be considered a rough surrogate for contractility but is inherently load-dependent. Single-beat estimation of Ees, Ea, and the ratio can be performed using the RV pressure tracing as well, but both methods require offline processing of waveform data and hence impractical for the bedside physician. Non-invasive echographic parameters are used to assess RV-PA coupling but only have moderate to strong correlation with invasive gold standards, but correlate fairly well prognostically (Siuba, personal communication).
Interface IV at the Bedside - Direct measure of the CVP is similar to JVP and, if elevated beyond 10-12 mmHg, supports at least the presence of some degree of uncoupling. Additionally, closer analysis of the CVP waveform can suggest poor RV contractility, diastolic dysfunction, and tricuspid regurgitation [73].
The best available bedside techniques for practical assessment of RV-PA coupling rely on echocardiographic surrogates. The best validated echocardiographic method for assessment of RV–PA coupling is the TAPSE/PASP ratio[74]. A TAPSE/PASP ratio of less than 0.31 is specific for RV-PA uncoupling by invasive methods <0.8 (normal Ees/Ea > 1.5), though cutoffs vary considerably. TAPSE is a simple and relatively accurate estimate of RV EF (EF being related to Ees), and similarly correlates with invasive Ees/Ea. PASP, although influenced by SV and HR, contains similar information as Ea.
Other estimates of RV EF include S’, and FAC. RV S’ employs tissue Doppler technique to determine tricuspid annular systolic velocities and is a less angle-dependent measure of the EF than TAPSE.
Further assessment of RV-PA coupling involves interpretation of the RVOT Doppler morphology, including the end diastolic pulmonic regurgitation velocity (PRedv), acceleration time (AT), the presence of RVOT VTI notching, and the relative pre and post notch velocities if present.
Integrating the Circuit
After a thorough assessment, the clinician remains faced with the challenge of identifying the weak(est) link among the interfaces in order to focus treatment, and assess the response at all levels. There is likely to be some degree of trial and error as it is often difficult to reliably predict the degree of response to therapy, and hence the critical importance of close monitoring and re-assessment, while remembering that ultimately, tissue perfusion is what matters most.
Concepts of Clinical Management & Using a Modified Forrester Diagram
Decades ago, Forrester designed a diagram plotting cardiac index to wedge pressure to describe clinical phenotypes post-myocardial infarction [75]. Recently, Kenny reworked the concept, utilizing LVOT VTI on one axis and VEXUS on the other [76]. We feel this is a useful concept that can be used for very initial assessment of shock patients, and subsequently to track their progress along during resuscitation, and this can be done using varying parameters of forward flow vs. congestion, as shown in Figure 3. It is important to acknowledge that this diagram focuses on forward flow and venous congestion which are fundamentals macrohemodynamic variables to tailor resuscitation at restoring tissue perfusion in shock states. By intention and to facilitate clinical applicability it does not take into account more complex physiological variables such as RV or LV VAC unless they cause low CO or elevated CVP. Indeed, profound RV or LV failure may occur with compensated and preserved flow and normal CVP, at least at the beginning. However, in practical terms this diagram can be applied in many clinical situations in the very initial moments of resuscitation prior to fully assessing the interfaces.
Figure 3.
Forrester-Kenny diagram showing the four phenotypic quadrants as well as the dynamic phenotypes. Note that different parameters of forward flow and venous congestion could be used depending on available technology and physician familiarity.
Figure 3.
Forrester-Kenny diagram showing the four phenotypic quadrants as well as the dynamic phenotypes. Note that different parameters of forward flow and venous congestion could be used depending on available technology and physician familiarity.
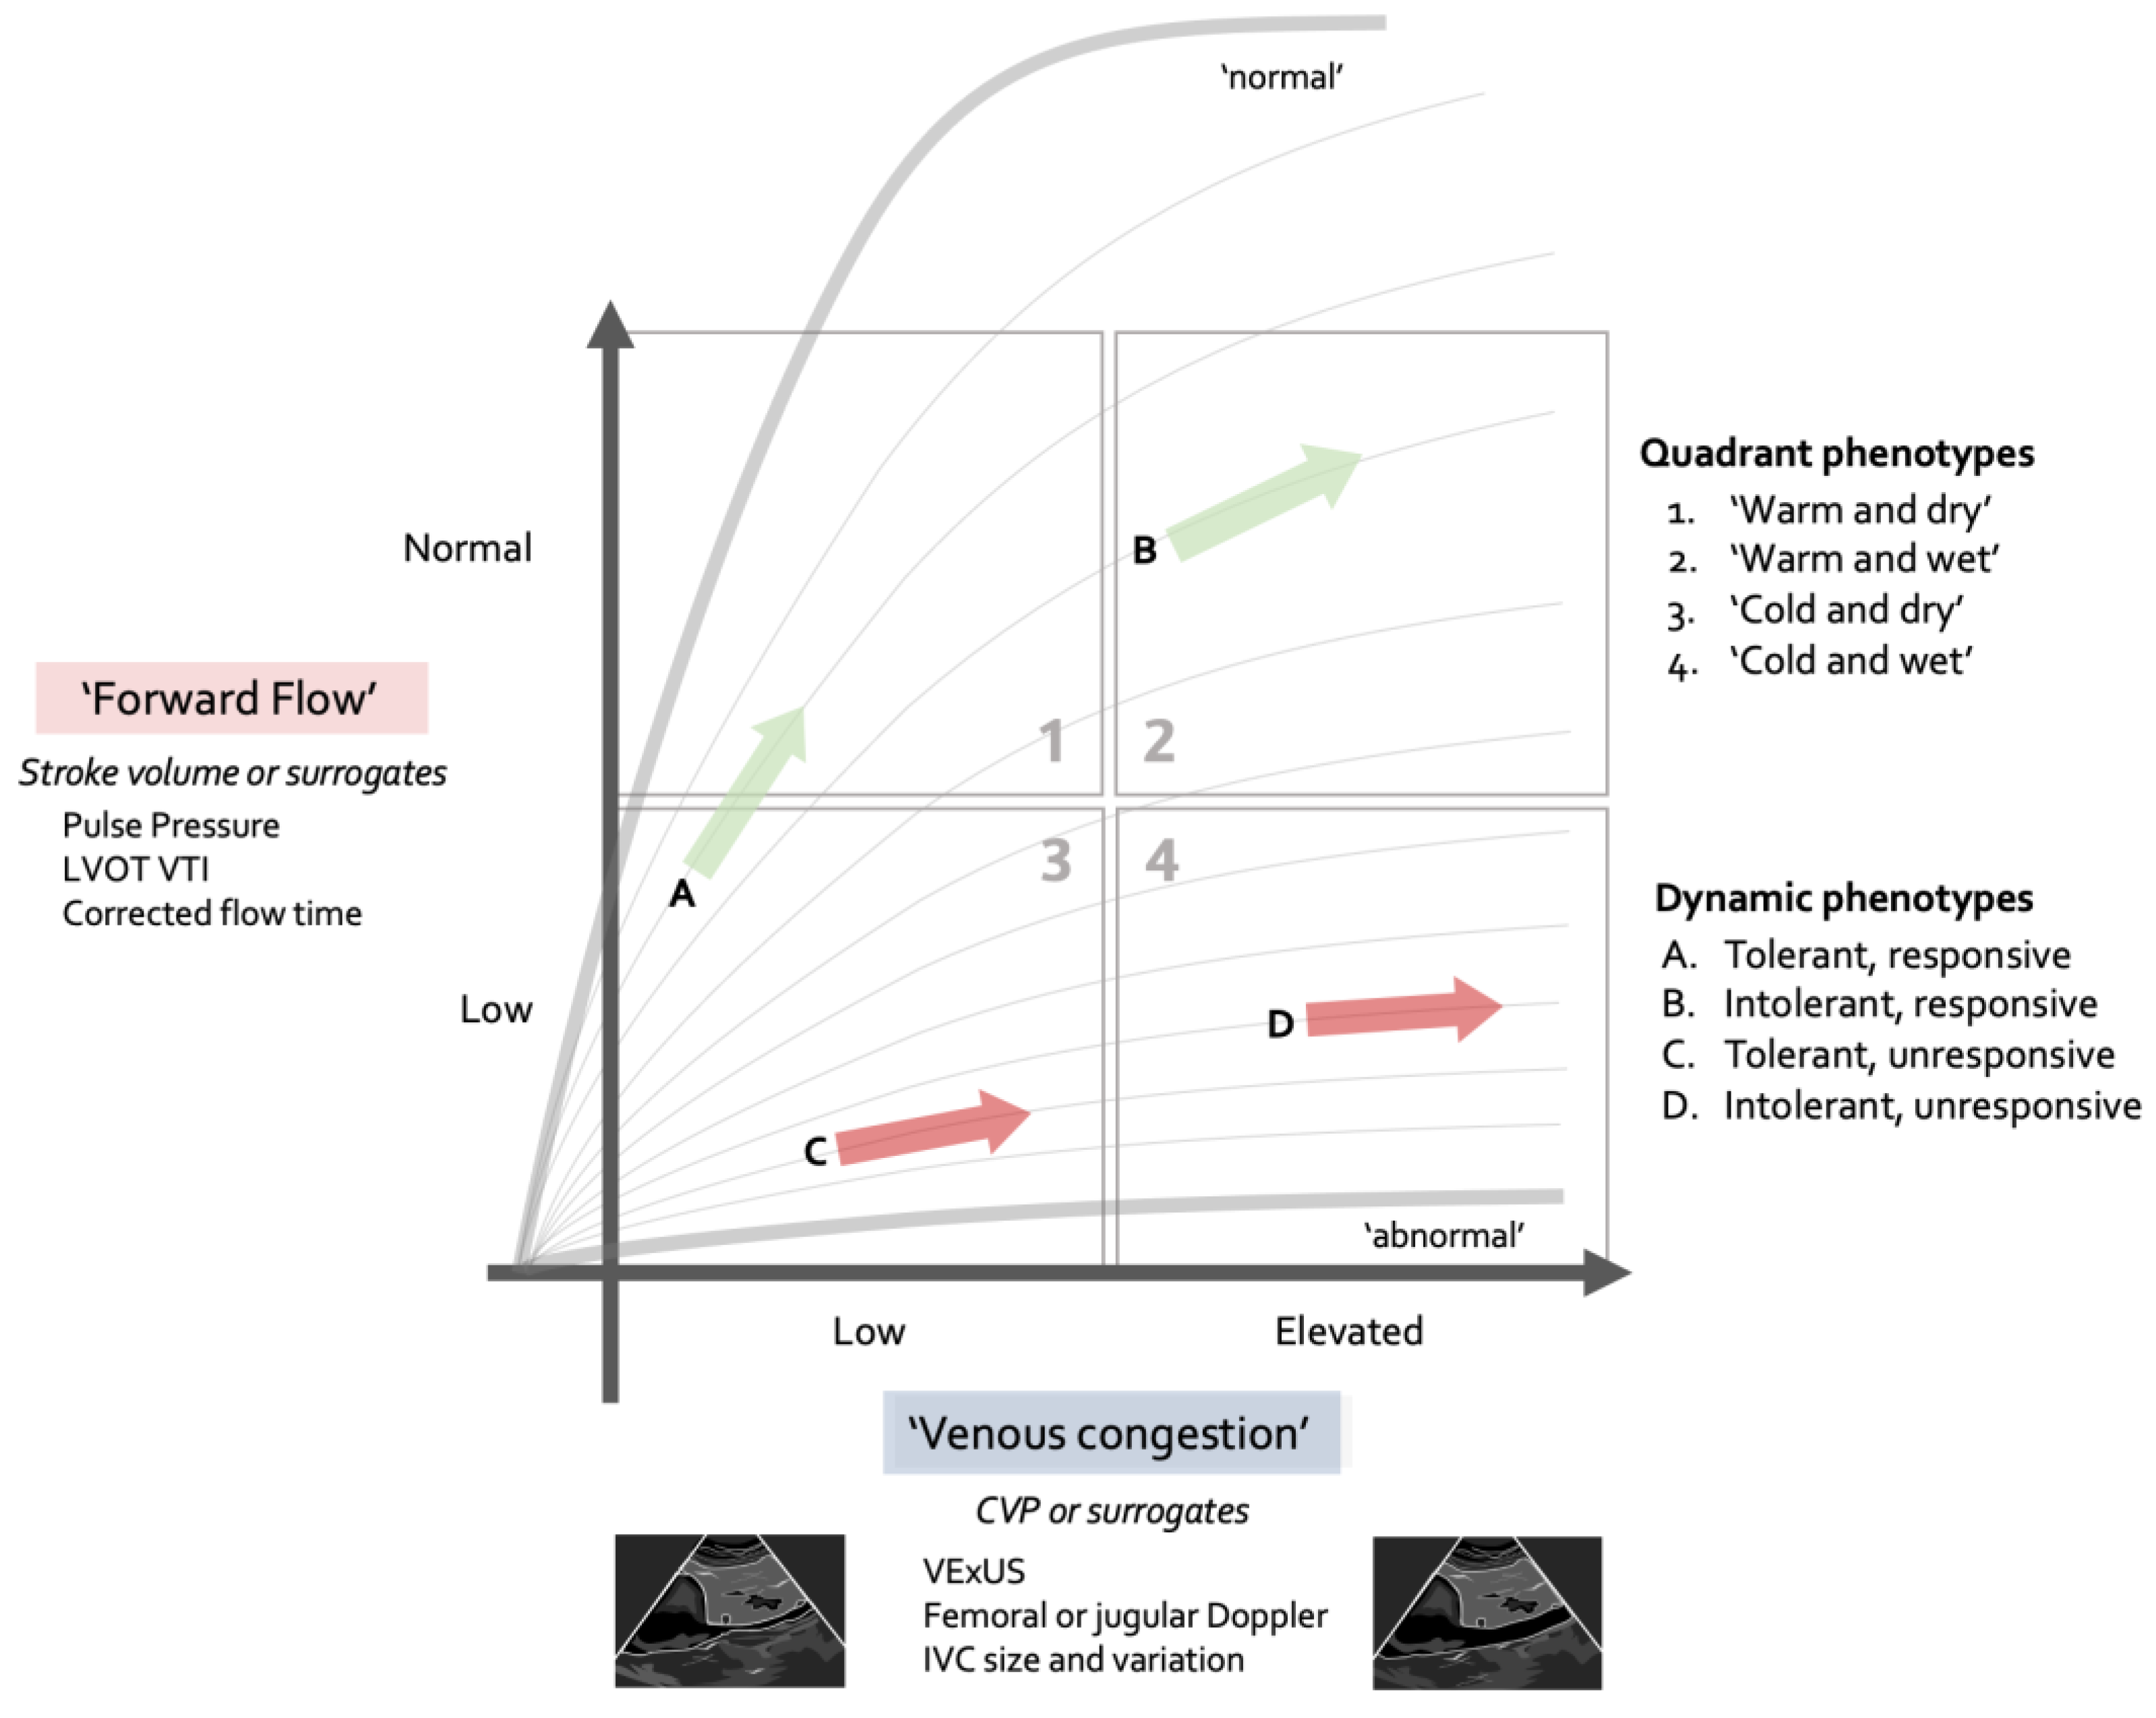
Figure 4.
Basic and advanced assessment alternatives for each interface. Note that this may evolve with further research to include new parameters. Abbreviations: TAPSE - tricuspid annular plane systolic excursion, PASP – pulmonary artery systolic pressure, S’ – tissue Doppler velocity, RV – right ventricle, FAC – fractional area change, Ees/Ea – end systolic elastance/arterial elastance, JVP – jugular venous pulse, CVP central venous pressure, LVEF – left ventricular ejection fraction, VTI – velocity time integral, VExUS – venous excess ultrasound, RVSI – renal venous stasis index, JV – jugular venous, MSFP – mean systolic filling pressure, NIRS – near infrared spectroscopy, VOT – vascular occlusion test.
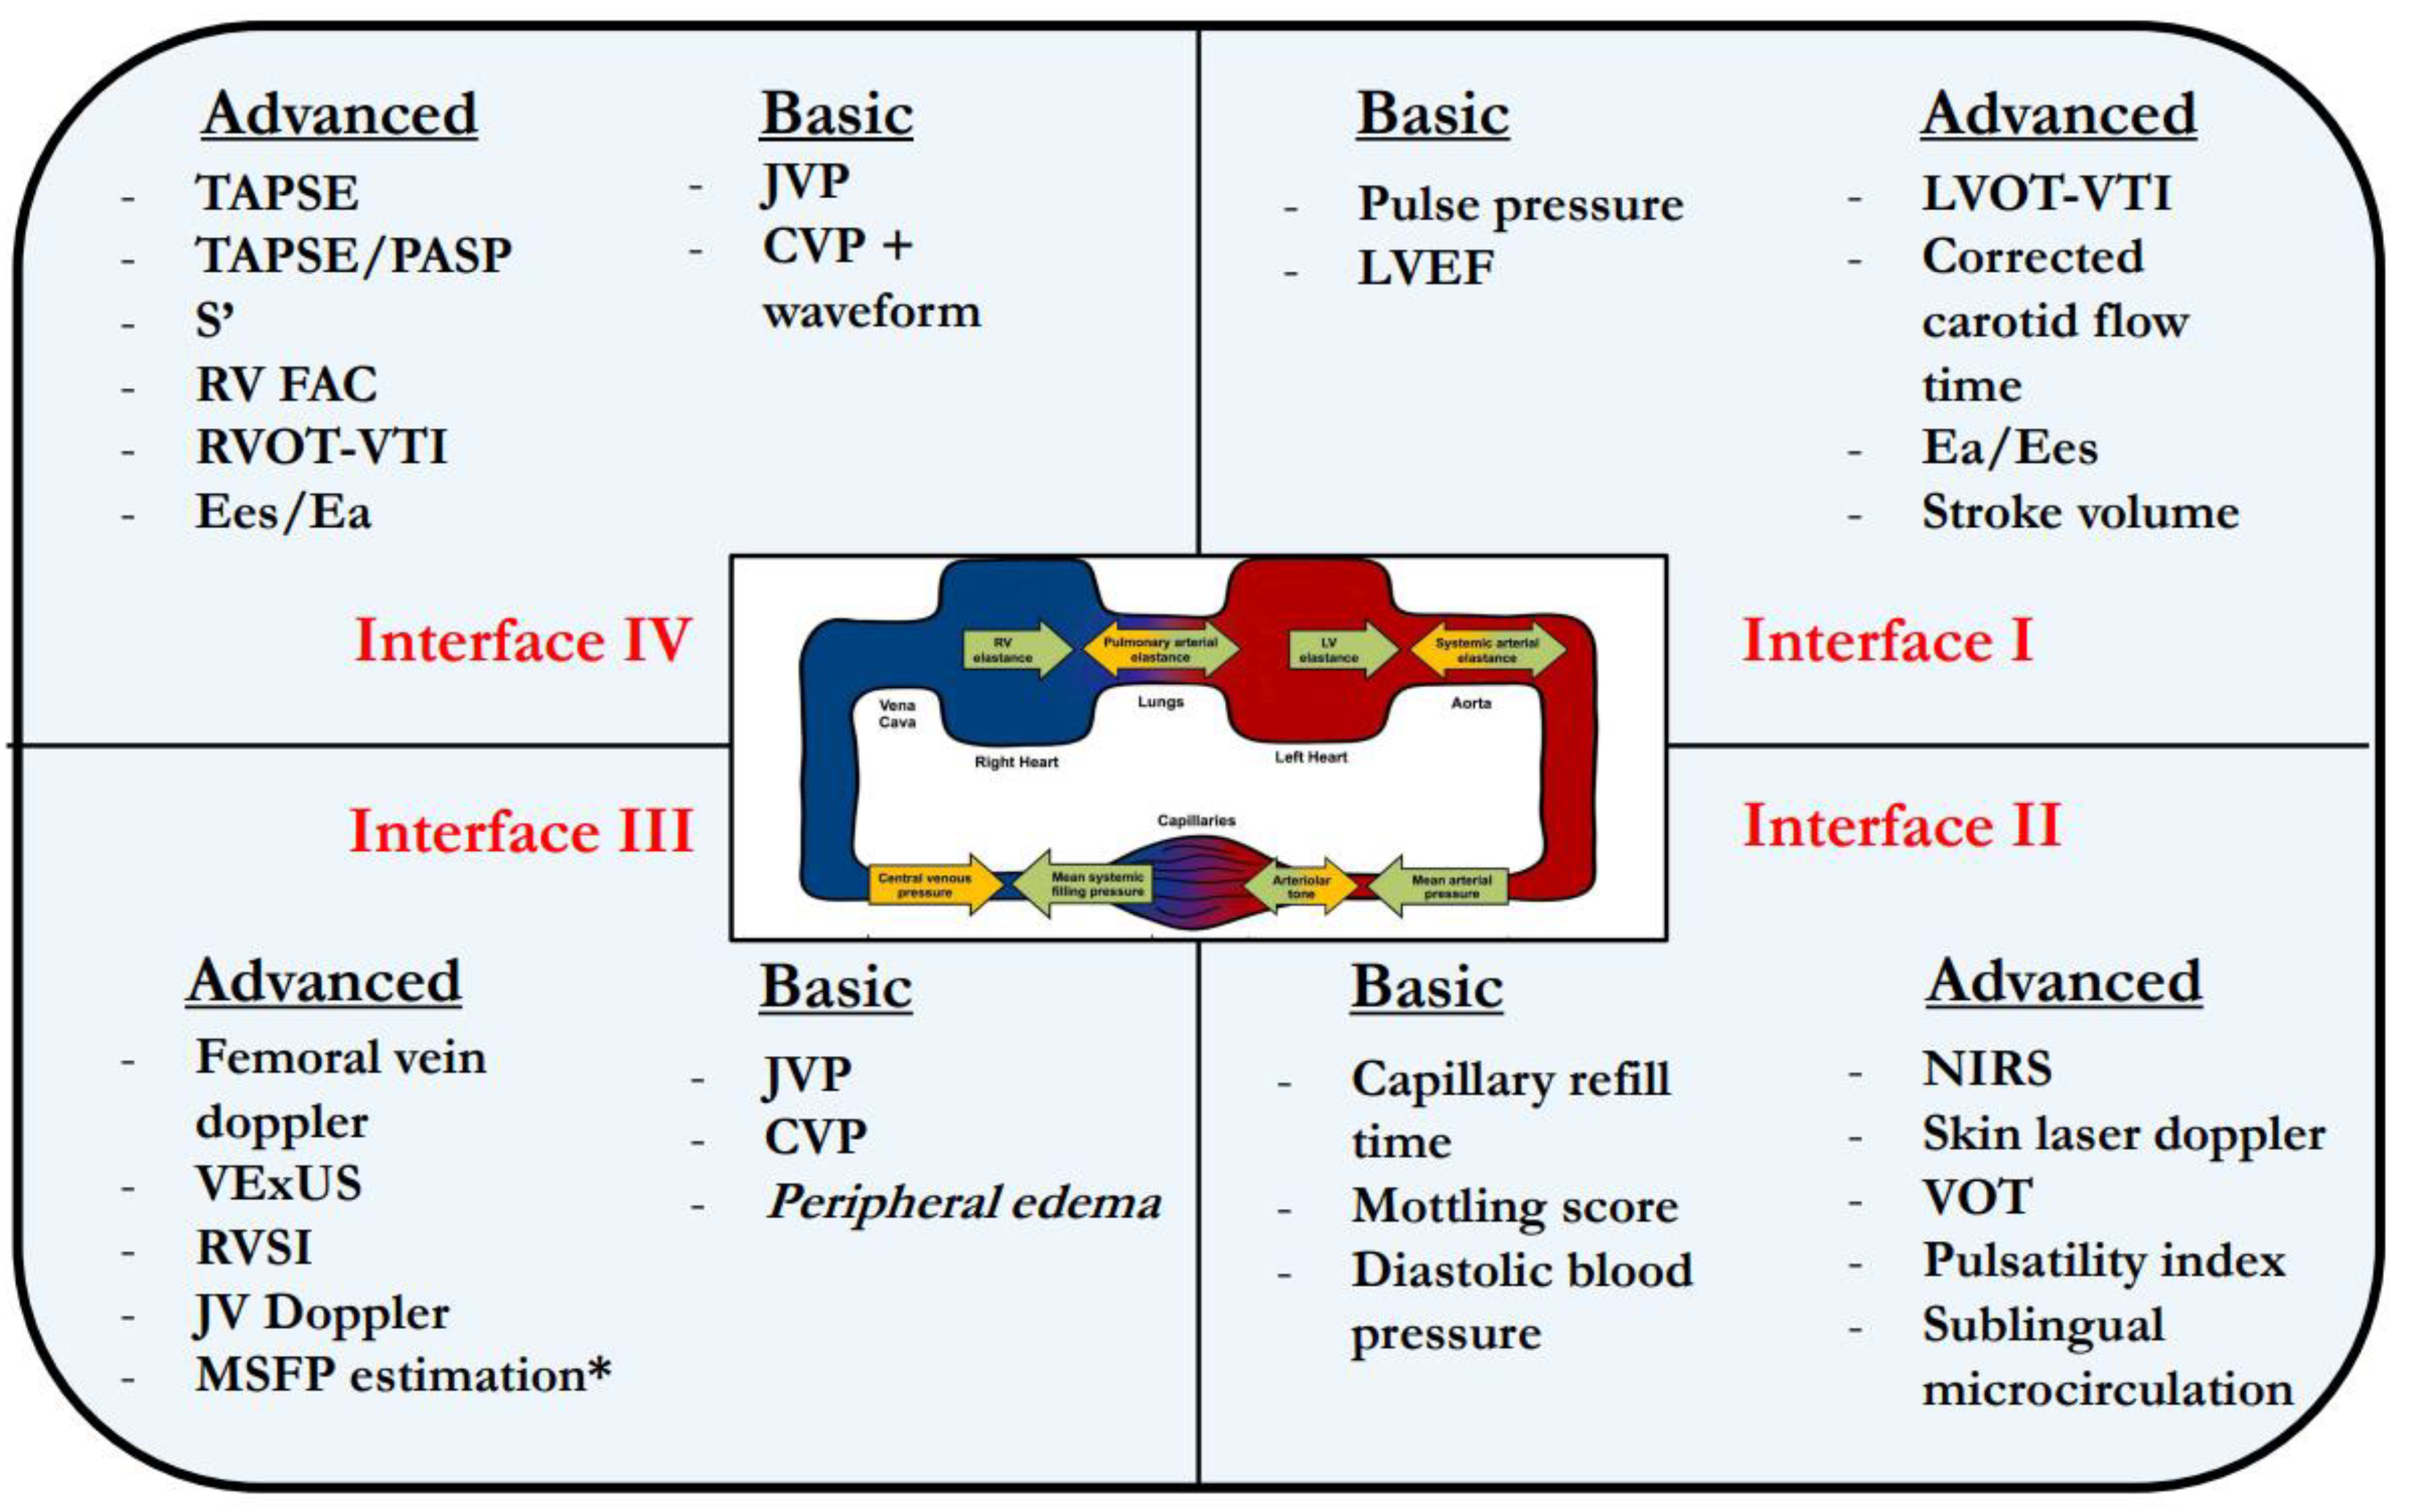
Figure 5.
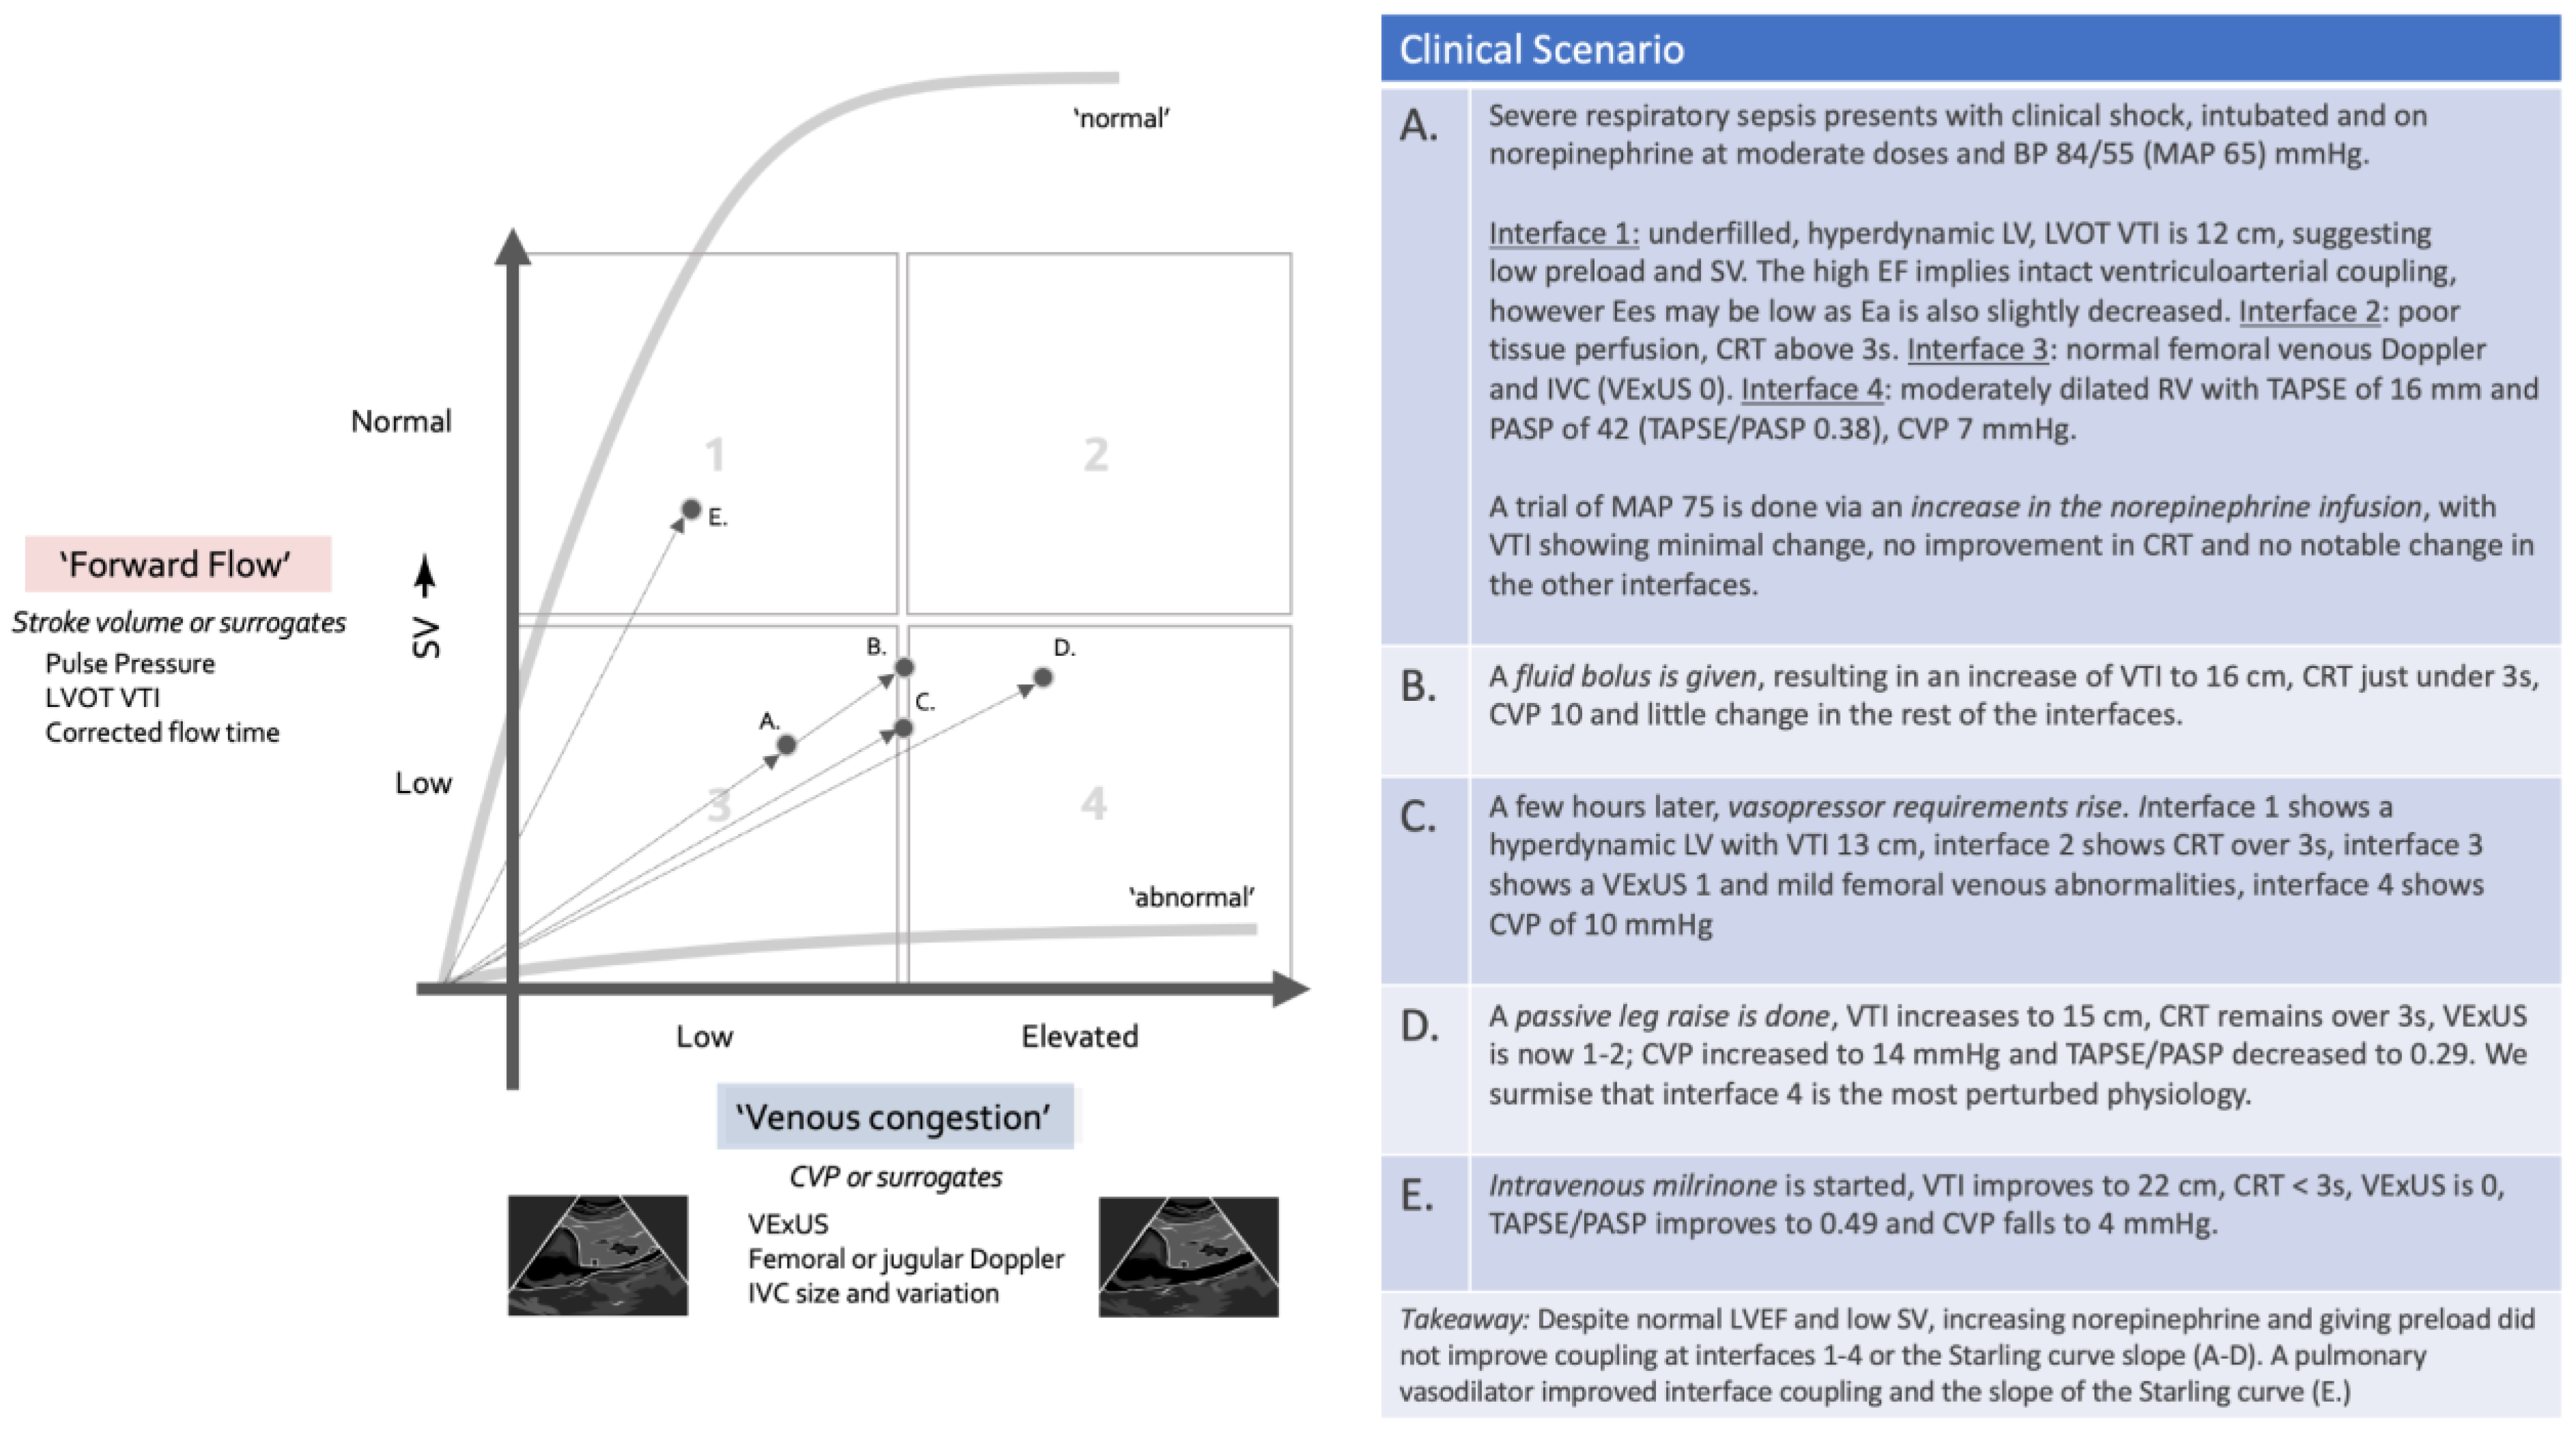
Clinical scenario illustrating the evolution of a patient undergoing resuscitation in a framework of both congestive and forward flow parameters.
Figure 5.
Clinical scenario illustrating the evolution of a patient undergoing resuscitation in a framework of both congestive and forward flow parameters.
Step 1: Placing the Patient in the Modified Forrester Diagram
In the first minutes of the initial assessment, there should be an attempt to place the shock patient into one of the four quadrants, using some measure of congestive assessment in the Y axis and some measure of forward flow or stroke-volume in the X axis. This should provide the clinician with a preliminary therapeutic strategy. This is conceptually important because patients who are cold generally have a low CO while those who are warm, even if hypotensive, often have normal or elevated cardiac output. On the other side, patients who are “dry,” meaning without significant evidence of pulmonary congestion or elevated jugular venous pressure are more likely to be fluid tolerant and responsive while those who have signs of congestion will be less so. While this does not have perfect sensitivity and specificity, it can nonetheless guide the initial therapeutic decision while further assessment is being done.
For instance, a patient who would fall in quadrant 2 (warm and wet) should probably have an initial management with minimal fluids (which could be harmful by uncoupling interfaces 3 or 4) and an emphasis instead on vasoconstriction. Conversely, a patient in quadrant 3 (cold and dry) would probably benefit more from avoiding vasoconstriction that could uncouple interface 2 and likely will need fluids and/or inotropes.
Step 2: Assessing the Interfaces
After assessing each interface, the clinician will have to identify the more severely affected one(s) and initiate a therapeutic plan. While closely correlated, uncoupling in interfaces I and IV may not necessarily result in clinically significant uncoupling at the more important interfaces from a perfusion standpoint. For instance, a patient may have a poor LVEF, but maintain a reasonable SV via LV dilation, and have a well-coupled macro- to microcirculation. In the venous side, one may have a very compromised interface IV with e.g. TAPSE/PASP ratio below 0.3 and an elevated JVP, but concomitantly have a VExUS showing mild congestion and only a mildly pulsatile FVD, hence is not really uncoupled at interface III.
Step 3: Tracking the Progress of Resuscitation on the Modified Forrester Diagram
Assessing therapy is a key component of a good resuscitation strategy. The patient can be re-plotted on the four-quadrant graph to ensure that he/she is headed towards quadrant 1 - warm and dry - where perfusion occurs without congestion and coupling of all interfaces is reasonable. Understandably, this may not be possible in many cases, and the clinician may have to be satisfied with a non-worsening of the clinical path while hoping that, over time, source control and/or tissue healing will remedy to the situation, but it is important to ensure that therapeutic interventions are at least not worsening the situation.
Further Development
There is no question that the relationship between the macro and micro-circulatory systems, interface II, is vital to understanding and managing shock at the bedside. Unfortunately, it is also the interface with the most limited tools to quantify reliably with any granularity. There is a substantial amount of very interesting research that has been done, and certainly much is happening in this field but to date there is a dearth of tools to evaluate uncoupling which occurs at this level. Furthermore, while the physiological and clinical evidence, which does exist, supports many aspects of a personalized resuscitative strategy, it is important to note that, as a whole, there is no evidence that such an approach improves survival, and evidence-based medicine purists may protest. While the above statement is accurate, one could argue the same is true for any resuscitative strategy currently employed. In fact, study after study on heterogenous critically ill patients assessing any particular intervention for shock consistently fails to provide positive results. Such continued quests to find a one-size-fits-all approach to shock betrays the complexity of the patients we treat as well as their underlying acute and chronic physiology. Careful assessment and re-assessment of the four key interfaces is required in most cases, with the ultimate goal of restoring microcirculatory flow and tissue perfusion. We would encourage researchers to go beyond MAP, lactate, and weight-based fluid loading. We hope future research will incorporate a more personalized approach to the management of shock, utilizing the interface principles to seek “perfusion without congestion” in their trial designs.
Conclusion
A holistic and personalized approach to resuscitation is important in critically ill patients. The authors would also like to remind clinicians that guidelines remain guidelines, and are not, in a rapidly developing field, gold standards. It is paramount to phenotype a patient’s shock, identify its source, and characterize the perturbations in each of the four interfaces described above in order to avoid unhelpful and even harmful resuscitative measures. And while large RCT data with meaningful clinical outcomes is lacking, we feel a four-interface model of shock assessment may represent an adequate compromise of clinical evidence, physiologic reasoning, and clinical efficiency to allow clinicians to appropriately manage the heterogeneity and complexity of these critically ill patients.
List of Abbreviations
MAP: mean arterial pressure; CVP: central venous pressure; CRT: capillary refill time; CO: cardiac output; SV: stroke volume; LV: left ventricular; RV: right ventricular; PA: pulmonary artery; Ea: arterial elastance: Ees: ventricular elastance; LVEF: left ventricular ejection fraction; SVR: systemic venous resistance; ESPVR: end systolic pressure-volume relationship; MSFP: mean systemic filling pressure; VR: venous return; CCP: critical closing pressure; VW: vascular waterfall; TPP: tissue perfusion pressure; VAC: ventriculoarterial coupling; SBP: systolic blood pressure; PP: pulse pressure; POCUS: point of care ultrasound; LVOT-VTI: Left ventricular outflow tract velocity time integral; cCFT: corrected flow time of the carotid artery; ms: millisecond; DBP: diastolic blood pressure; CRT: capillary refill time; STO2: tissue saturation; VExUS: Venous Excess Ultrasound; FVD: Femoral vein Doppler; PAC: pulmonary artery catheter; PRedv: end diastolic pulmonic regurgitation velocity; AT: acceleration time; RCT: randomized clinical trial.
Ethics approval and consent to participate
not applicable.
Consent for publication
Not applicable.
Availability of data and material
Not applicable.
Competing interests
JEK is chief medical officer of Flosonics Medical. All other authors declare that they have no competing interests.
Authors' contributions
All authors were involved in conceptualization, writing and editing. EK, SC and JEK additionally created figures and tables. No LLMs were used in the conceptualization or editing of this manuscript. All authors read and approved the final manuscript.
Funding
none.
Acknowledgments
None.
References
- Bakker J, Kattan E, Annane D, Castro R, Cecconi M, de Backer D, et al. Current practice and evolving concepts in septic shock resuscitation. Intensive Care Med. 2022;48:148–63. [CrossRef]
- De Backer D, Cecconi M, Chew MS, Hajjar L, Monnet X, Ospina-Tascón GA, et al. A plea for personalization of the hemodynamic management of septic shock. Crit Care. 2022;26:1–13. [CrossRef]
- Kattan E, Castro R, Miralles-Aguiar F, Hernandez G RP. The emerging concept of Fluid Tolerance : a position paper. J Crit Care. 2022;71. [CrossRef]
- Malbrain MLNG, Van Regenmortel N, Saugel B, De Tavernier B, Van Gaal PJ, Joannes-Boyau O, Teboul JL, Rice TW, Mythen M, Monnet X. Principles of fluid management and stewardship in septic shock: it is time to consider the four D's and the four phases of fluid therapy. Ann Intensive Care. 2018 May 22;8(1):66. doi: 10.1186/s13613-018-0402-x. PMID: 29789983; PMCID: PMC5964054. [CrossRef]
- Evans L, Rhodes A, Alhazzani W, Antonelli M, Coopersmith CM, French C, et al. Surviving sepsis campaign: international guidelines for management of sepsis and septic shock 2021. Intensive Care Med. 2021; 47(11):1181-1247. [CrossRef]
- Monnet X, Shi R, Teboul J-L. Prediction of fluid responsiveness. What’s new? Ann Intensive Care. 2022;12:46.
- Salinas P, Sohn J, Díaz-Gómez JL. Critical Care Echocardiography—A Driven Approach to Undifferentiated Shock. Texas Hear Inst J. 2023;50. Available from: https://dx.doi.org/10.14503/THIJ-22-8075. [CrossRef]
- Hernández G, Valenzuela ED, Kattan E, Castro R, Guzmán C, Kraemer AE, et al. Capillary refill time response to a fluid challenge or a vasopressor test: an observational, proof-of-concept study. Ann Intensive Care. 2024;14:49. [CrossRef]
- Hernandez G, Ospina-Tascon G, Damiani LP, Estenssoro E, Dubin A, Hurtado J, et al. Effect of a Resuscitation Strategy Targeting Peripheral Perfusion Status vs Serum Lactate Levels on 28-Day Mortality Among Patients With Septic Shock. The ANDROMEDA-SHOCK Randomized Clinical Trial. JAMA. 2019;321:654–64. [CrossRef]
- Hernandez G, Bruhn A, Castro R, Regueira T. The holistic view on perfusion monitoring in septic shock. Curr Opin Crit Care. 2012 Jun;18(3):280-6. doi: 10.1097/MCC.0b013e3283532c08. PMID: 22473257. [CrossRef]
- Hernandez G, Bellomo R, Bakker J. The ten pitfalls of lactate clearance in sepsis. Intensive Care Med. 2019 Jan;45(1):82-85. doi: 10.1007/s00134-018-5213-x. Epub 2018 May 12. PMID: 29754310; PMCID: PMC6334727. [CrossRef]
- Messina A, Albini M, Samuelli N, Brunati A, Costantini E, Lionetti G, et al. Fluid boluses and infusions in the early phase of resuscitation from septic shock and sepsis-induced hypotension: a retrospective report and outcome analysis from a tertiary hospital. Ann Intensive Care. 2024;14:123. [CrossRef]
- Chen CY, Zhou Y, Wang P, Qi EY, Gu WJ. Elevated central venous pressure is associated with increased mortality and acute kidney injury in critically ill patients: A meta-analysis. Crit Care. 2020;24:1–8. [CrossRef]
- Winton FR. The influence of venous pressure on the isolated mammalian kidney. J Physiol.1931;72:49. [CrossRef]
- Ince C. Hemodynamic coherence and the rationale for monitoring the microcirculation. Crit Care. 2015;19:S8. [CrossRef]
- Vellinga NAR, Ince C, Boerma EC. Elevated central venous pressure is associated with impairment of microcirculatory blood flow in sepsis: A hypothesis generating post hoc analysis. BMC Anesthesiol. 2013;13. [CrossRef]
- Dugar S, Siuba MT, Sacha GL, Sato R, Moghekar A, Collier P, et al. Echocardiographic profiles and hemodynamic response after vasopressin initiation in septic shock: A cross-sectional study. J Crit Care; 2023;76. Available from: https://pubmed.ncbi.nlm.nih.gov/37030157/. [CrossRef]
- Guarracino F, Ferro B, Morelli A, Bertini P, Baldassarri R, Pinsky MR. Ventriculoarterial decoupling in human septic shock. Crit Care. 2014;18:R80. [CrossRef]
- Guinot PG, Longrois D, Kamel S, Lorne E, Dupont H. Ventriculo-Arterial Coupling Analysis Predicts the Hemodynamic Response to Norepinephrine in Hypotensive Postoperative Patients: A Prospective Observational Study. Crit Care Med. 2018;46:e17–25. [CrossRef]
- Guyton AC, Polizo D, Armstrong GG. Mean Circulatory Filling Pressure Measured Immediately After Cessation of Heart Pumping. Am J Phyisiol.1954 [;179:261–7. [CrossRef]
- Guyton AC, Lindsey AW, Abernathy B, Richardson T. Venous return at various right atrial pressures and the normal venous return curve. Am J Physiol.1957;189:609–15. [CrossRef]
- Persichini R, Lai C, Teboul JL, Adda I, Guérin L, Monnet X. Venous return and mean systemic filling pressure: physiology and clinical applications. Crit Care. 2022;26:1–11. [CrossRef]
- Magder SA. The Highs and Lows of Blood Pressure: Toward Meaningful Clinical Targets in Patients With Shock. Critical Care Medicine. 2014;42:1241–51.
- Davis MJ. Control of bat wing capillary pressure and blood flow during reduced perfusion pressure. Am J Physiol. 1988;255:H1114-1129. [CrossRef]
- Girling F. Critical closing pressure and venous pressure. Am J Physiol. 1952;171:204–7. [CrossRef]
- Sylvester JT, Gilbert RD, Traystman RJ, Permutt S. Effects of hypoxia on the closing pressure of the canine systemic arterial circulation. Circulation Research. 1981;49:980–7. [CrossRef]
- Wijnberge M, Schuurmans J, De Wilde RBP, Kerstens MK, Vlaar AP, Hollmann MW, et al. Defining human mean circulatory filling pressure in the intensive care unit. Journal of Applied Physiology. 2020;129:311–6. [CrossRef]
- Permutt S, Riley RL. Hemodynamics of collapsible vessels with tone: the vascular waterfall. Journal of Applied Physiology. 1963;18:924–32. [CrossRef]
- Magder S. Starling resistor versus compliance. Which explains the zero-flow pressure of a dynamic arterial pressure-flow relation? Circ Res. 1990;67:209–20.
- Maas JJ, de Wilde RB, Aarts LP, Pinsky MR, Jansen JR. Determination of vascular waterfall phenomenon by bedside measurement of mean systemic filling pressure and critical closing pressure in the intensive care unit. Anesth Analg. 2012;114:803–10. [CrossRef]
- Magder S. Starling resistor versus compliance. Which explains the zero-flow pressure of a dynamic arterial pressure-flow relation? Circ Res. 1990;67:209–20.
- Dunn J-O, Mythen M, Grocott M. Physiology of oxygen transport. BJA Education. 2016;16:341–8. [CrossRef]
- Andrei S, Bar S, Nguyen M, Bouhemad B, Guinot PG. Effect of norepinephrine on the vascular waterfall and tissue perfusion in vasoplegic hypotensive patients: a prospective, observational, applied physiology study in cardiac surgery. Intensive Care Med Exp. 2023;11:1–11. [CrossRef]
- Chandrasekhar A, Padrós-Valls R, Pallarès-López R, Palanques-Tost E, Houstis N, Sundt TM, et al. Tissue perfusion pressure enables continuous hemodynamic evaluation and risk prediction in the intensive care unit. Nat Med. 2023;29:1998–2006. [CrossRef]
- Warriner DR, Brown AG, Varma S, Sheridan PJ, Lawford P, Hose DR, Al-Mohammad A, Shi Y. Closing the loop: modelling of heart failure progression from health to end-stage using a meta-analysis of left ventricular pressure-volume loops. PLoS One. 2014 Dec 5;9(12):e114153. doi: 10.1371/journal.pone.0114153. PMID: 25479594; PMCID: PMC4257583. [CrossRef]
- Bronicki RA, Tume S, Gomez H, Dezfulian C, Penny DJ, Pinsky MR, Burkhoff D. Application of Cardiovascular Physiology to the Critically Ill Patient. Crit Care Med. 2024 May 1;52(5):821-832. doi: 10.1097/CCM.0000000000006136. Epub 2023 Dec 21. PMID: 38126845. [CrossRef]
- Chen CH, Fetics B, Nevo E, Rochitte CE, Chiou KR, Ding PYA, et al. Noninvasive single-beat determination of left ventricular end-systolic elastance in humans. J Am Coll Cardiol. 2001;38:2028–34. [CrossRef]
- Monge García MI, Jian Z, Hatib F, Settels JJ, Cecconi M, Pinsky MR. Dynamic Arterial Elastance as a Ventriculo-Arterial Coupling Index: An Experimental Animal Study. Front Physiol. 2020 Apr 6;11:284. doi: 10.3389/fphys.2020.00284. PMID: 32327999; PMCID: PMC7153496. [CrossRef]
- Mihaileanu S, Antohi EL. Revisiting the relationship between left ventricular ejection fraction and ventricular-arterial coupling. ESC Hear Fail. 2020;7:2214–22. [CrossRef]
- Guarracino F, Bertini P, Pinsky MR. Heterogeneity of Cardiovascular Response to Standardized Sepsis Resuscitation. Crit. Care. 2020;24:99. [CrossRef]
- Kerrebijn I, Atwi S, Horner C, et al. Correlation between changing carotid artery corrected flow time and ascending aortic Doppler flow velocity. British Journal of Anaesthesia. 2023 Dec;131(6):e192-e195. DOI: 10.1016/j.bja.2023.09.016. PMID: 37863770. [CrossRef]
- Kenny JS, Barjaktarevic I, Mackenzie DC, Elfarnawany M, Yang Z, Eibl AM, Eibl JK, Kim CH, Johnson BD. Carotid Doppler ultrasonography correlates with stroke volume in a human model of hypovolaemia and resuscitation: analysis of 48 570 cardiac cycles. Br J Anaesth. 2021 Aug;127(2):e60-e63. doi: 10.1016/j.bja.2021.05.007. Epub 2021 Jun 9. PMID: 34116805. [CrossRef]
- Kenny JS, Prager R, Rola P, Haycock K, Gibbs SO, Johnston DH, Horner C, Eibl JK, Lau VC, Kemp BO. Simultaneous Venous-Arterial Doppler Ultrasound During Early Fluid Resuscitation to Characterize a Novel Doppler Starling Curve: A Prospective Observational Pilot Study. J Intensive Care Med. 2024 Jul;39(7):628-635. doi: 10.1177/08850666231224396. Epub 2024 Jan 8. PMID: 38190576; PMCID: PMC11188059. [CrossRef]
- Boudoulas KD, Boudoulas H. Time and left ventricular function: the forgotten dynamic factor. Eur J Heart Fail. 2021 Apr;23(4):552-554. doi: 10.1002/ejhf.2165. Epub 2021 Apr 8. PMID: 33772974. [CrossRef]
- Alhakak AS, Teerlink JR, Lindenfeld J, Böhm M, Rosano GMC, Biering-Sørensen T. The significance of left ventricular ejection time in heart failure with reduced ejection fraction. Eur J Heart Fail. 2021 Apr;23(4):541-551. doi: 10.1002/ejhf.2125. Epub 2021 Mar 23. PMID: 33590579. [CrossRef]
- Pinsky MR, García MIM, Dubin A. Significance of critical closing pressures (starling resistors) in arterial circulation. Crit Care. 2024;28:1–3. [CrossRef]
- Hamzaoui O, Teboul JL. Importance of diastolic arterial pressure in septic shock: PRO. J Crit Care. 2019;51:238–40. [CrossRef]
- Ospina-Tascón GA, Teboul JL, Hernandez G, Alvarez I, Sánchez-Ortiz AI, Calderón-Tapia LE, et al. Diastolic shock index and clinical outcomes in patients with septic shock. Ann Intensive Care. 2020;10:41. [CrossRef]
- Lagrèze J, Care C, Lagrèze MJ, Pernollet A, Kattan E, Oufella HA, et al. Prognostic value of capillary refill time in adult patients : a systematic review with meta - analysis. Crit Care. 2023;1–13.
- Kattan E, Ibarra-Estrada M, Ospina-Tascón G, Hernández G. Perspectives on peripheral perfusion assessment. Curr Opin Crit Care. 2023;29:208–14. [CrossRef]
- Zampieri FG, Damiani LP, Bakker J, Ospina-Tascón GA, Castro R, Cavalcanti AB, et al. Effect of a Resuscitation Strategy Targeting Peripheral Perfusion Status vs Serum Lactate Levels on 28-Day Mortality Among Patients with Septic Shock: A Bayesian Reanalysis of the ANDROMEDA-SHOCK Trial. Am J Respir Crit Care Med. 2020;201:423–9. [CrossRef]
- Fage N, Moretto F, Rosalba D, Shi R, Lai C, Teboul JL, et al. Effect on capillary refill time of volume expansion and increase of the norepinephrine dose in patients with septic shock. Crit Care. 2023;27:1–10. [CrossRef]
- Jacquet-Lagrèze M, Bouhamri N, Portran P, Schweizer R, Baudin F, Lilot M, et al. Capillary refill time variation induced by passive leg raising predicts capillary refill time response to volume expansion. Crit Care. 2019;23:281. [CrossRef]
- Dumas G, Lavillegrand JR, Joffre J, Bigé N, De-Moura EB, Baudel JL, et al. Mottling score is a strong predictor of 14-day mortality in septic patients whatever vasopressor doses and other tissue perfusion parameters. Crit Care. Critical Care; 2019;23:1–9.
- Merdji H, Bataille V, Curtiaud A, Bonello L, Roubille F, Levy B, et al. Mottling as a prognosis marker in cardiogenic shock. Ann Intensive Care. 2023;13:80. [CrossRef]
- Fage N, Demiselle J, Seegers V, Merdji H, Grelon F, Mégarbane B, et al. Effects of mean arterial pressure target on mottling and arterial lactate normalization in patients with septic shock: a post hoc analysis of the SEPSISPAM randomized trial. Ann Intensive Care. 2022;12. [CrossRef]
- Gavelli F, Teboul JL, Monnet X. How can CO2-derived indices guide resuscitation in critically ill patients? J Thorac Dis. 2019;11:1528–37.
- Beaubien-Souligny W, Rola P, Haycock K, Bouchard J, Lamarche Y, Spiegel R, et al. Quantifying systemic congestion with Point-Of-Care ultrasound: development of the venous excess ultrasound grading system. Ultrasound J. 2020;12. [CrossRef]
- Andrei S, Bahr PA, Nguyen M, Bouhemad B, Guinot PG. Prevalence of systemic venous congestion assessed by Venous Excess Ultrasound Grading System (VExUS) and association with acute kidney injury in a general ICU cohort: a prospective multicentric study. Crit Care. 2023 Jun 8;27(1):224. doi: 10.1186/s13054-023-04524-4. PMID: 37291662; PMCID: PMC10249288. [CrossRef]
- Rola P, Miralles-Aguiar F, Argaiz E, Beaubien-Souligny W, Haycock K, Karimov T, Dinh VA, Spiegel R. Clinical applications of the venous excess ultrasound (VExUS) score: conceptual review and case series. Ultrasound J. 2021 Jun 19;13(1):32. doi: 10.1186/s13089-021-00232-8. PMID: 34146184; PMCID: PMC8214649. [CrossRef]
- Anastasiou V, Peteinidou E, Moysidis DV, Daios S, Gogos C, Liatsos AC, Didagelos M, Gossios T, Efthimiadis GK, Karamitsos T, Delgado V, Ziakas A, Kamperidis V. Multiorgan Congestion Assessment by Venous Excess Ultrasound Score in Acute Heart Failure. J Am Soc Echocardiogr. 2024 Oct;37(10):923-933. doi: 10.1016/j.echo.2024.05.011. Epub 2024 May 19. PMID: 38772454. [CrossRef]
- Lipton B. Estimation of central venous pressure by ultrasound of the internal jugular vein. Am J Emerg Med. 2000 Jul;18(4):432-4. doi: 10.1053/ajem.2000.7335. PMID: 10919533. [CrossRef]
- Ranganathan N, Sivaciyan V, Pryszlak M, Freeman MR. Changes in jugular venous flow velocity after coronary artery bypass grafting. Am J Cardiol. 1989;63:725–9. [CrossRef]
- Ranganathan N, Sivaciyan V. Abnormalities in jugular venous flow velocity in pulmonary hypertension. Am J Cardiol. 1989;63:719–24. [CrossRef]
- Matsuyama W, Ohkubo R, Michizono K, Abe M, Nakamura Y, Kawabata M, et al. Usefulness of transcutaneous Doppler jugular venous echo to predict pulmonary hypertension in COPD patients. Eur Respir J. 2001;17:1128–31. [CrossRef]
- Ranganathan N, Sivaciyan V. Jugular Venous Pulse Descent Patterns: Recognition and Clinical Relevance. CJC Open. 2023;5:200. [CrossRef]
- Bhardwaj V, Rola P, Denault A, Vikneswaran G, Spiegel R. Femoral vein pulsatility: a simple tool for venous congestion assessment. ultrasound J [Internet]. Ultrasound J. 2023;15. Available from: https://pubmed.ncbi.nlm.nih.gov/37165284/. [CrossRef]
- Husain-Syed F, Birk HW, Ronco C, Schörmann T, Tello K, Richter MJ, et al. Doppler-Derived Renal Venous Stasis Index in the Prognosis of Right Heart Failure. J Am Heart Assoc. 2019;8. [CrossRef]
- Legrand M, Dupuis C, Simon C, Gayat E, Mateo J, Lukaszewicz AC, Payen D. Association between systemic hemodynamics and septic acute kidney injury in critically ill patients: a retrospective observational study. Crit Care. 2013 Nov 29;17(6):R278. doi: 10.1186/cc13133. PMID: 24289206; PMCID: PMC4056656. [CrossRef]
- Legrand M, Dupuis C, Simon C, Gayat E, Mateo J, Lukaszewicz AC, Payen D. Association between systemic hemodynamics and septic acute kidney injury in critically ill patients: a retrospective observational study. Crit Care. 2013 Nov 29;17(6):R278. doi: 10.1186/cc13133. PMID: 24289206; PMCID: PMC4056656. [CrossRef]
- Kenny JES, Prager R, Rola P, McCulloch G, Eibl JK, Haycock K. The effect of gravity-induced preload change on the venous excess ultrasound (VExUS) score and internal jugular vein Doppler in healthy volunteers. Intensive care Med Exp. 2023;11. Available from: https://pubmed.ncbi.nlm.nih.gov/37055637/. [CrossRef]
- Ostermann M, Hall A, Crichton S. Low mean perfusion pressure is a risk factor for progression of acute kidney injury in critically ill patients - A retrospective analysis. BMC Nephrol. 2017 May 3;18(1):151. doi: 10.1186/s12882-017-0568-8. PMID: 28468613; PMCID: PMC5415805. [CrossRef]
- Tampakakis E, Shah SJ, Borlaug BA, Leary PJ, Patel HH, Miller WL, et al. Pulmonary Effective Arterial Elastance as a Measure of Right Ventricular Afterload and Its Prognostic Value in Pulmonary Hypertension Due to Left Heart Disease. Circ Heart Fail; 2018;11. Available from: https://pubmed.ncbi.nlm.nih.gov/29643065/. [CrossRef]
- Magder S. Central venous pressure monitoring. Curr Opin Crit Care. 2006 Jun;12(3):219-27. doi: 10.1097/01.ccx.0000224866.01453.43. PMID: 16672781. [CrossRef]
- Tello K, Wan J, Dalmer A, Vanderpool R, Ghofrani HA, Naeije R, et al. Validation of the Tricuspid Annular Plane Systolic Excursion/Systolic Pulmonary Artery Pressure Ratio for the Assessment of Right Ventricular-Arterial Coupling in Severe Pulmonary Hypertension. Circ Cardiovasc Imaging. 2019;12. Available from: https://pubmed.ncbi.nlm.nih.gov/31500448/. [CrossRef]
- Forrester JS, Diamond GA, Swan HJ. Correlative classification of clinical and hemodynamic function after acute myocardial infarction. Am J Cardiol. 1977 Feb;39(2):137-45. doi: 10.1016/s0002-9149(77)80182-3. PMID: 835473. [CrossRef]
- Kenny J-ÉS, Prager R, Rola P, Haycock K, Basmaji J, Hernández G. Unifying Fluid Responsiveness and Tolerance With Physiology: A Dynamic Interpretation of the Diamond–Forrester Classification. Crit Care Explor. 2023;5:e1022. [CrossRef]
- CalcPlot3d online statistical package. Accessed 15 March, 2024. Available at: https://c3d.libretexts.org/CalcPlot3D/index.html.
- Kattan, E., Hernández, G., Bakker, J. (2022). Focused Clinical Hemodynamic Assessment in Septic Shock. In: Vincent, JL. (eds) Annual Update in Intensive Care and Emergency Medicine 2022. Annual Update in Intensive Care and Emergency Medicine. Springer, Cham. https://doi.org/10.1007/978-3-030-93433-0_20.
Figure 1.
Diagrammatic representation of the four main circulatory interfaces.
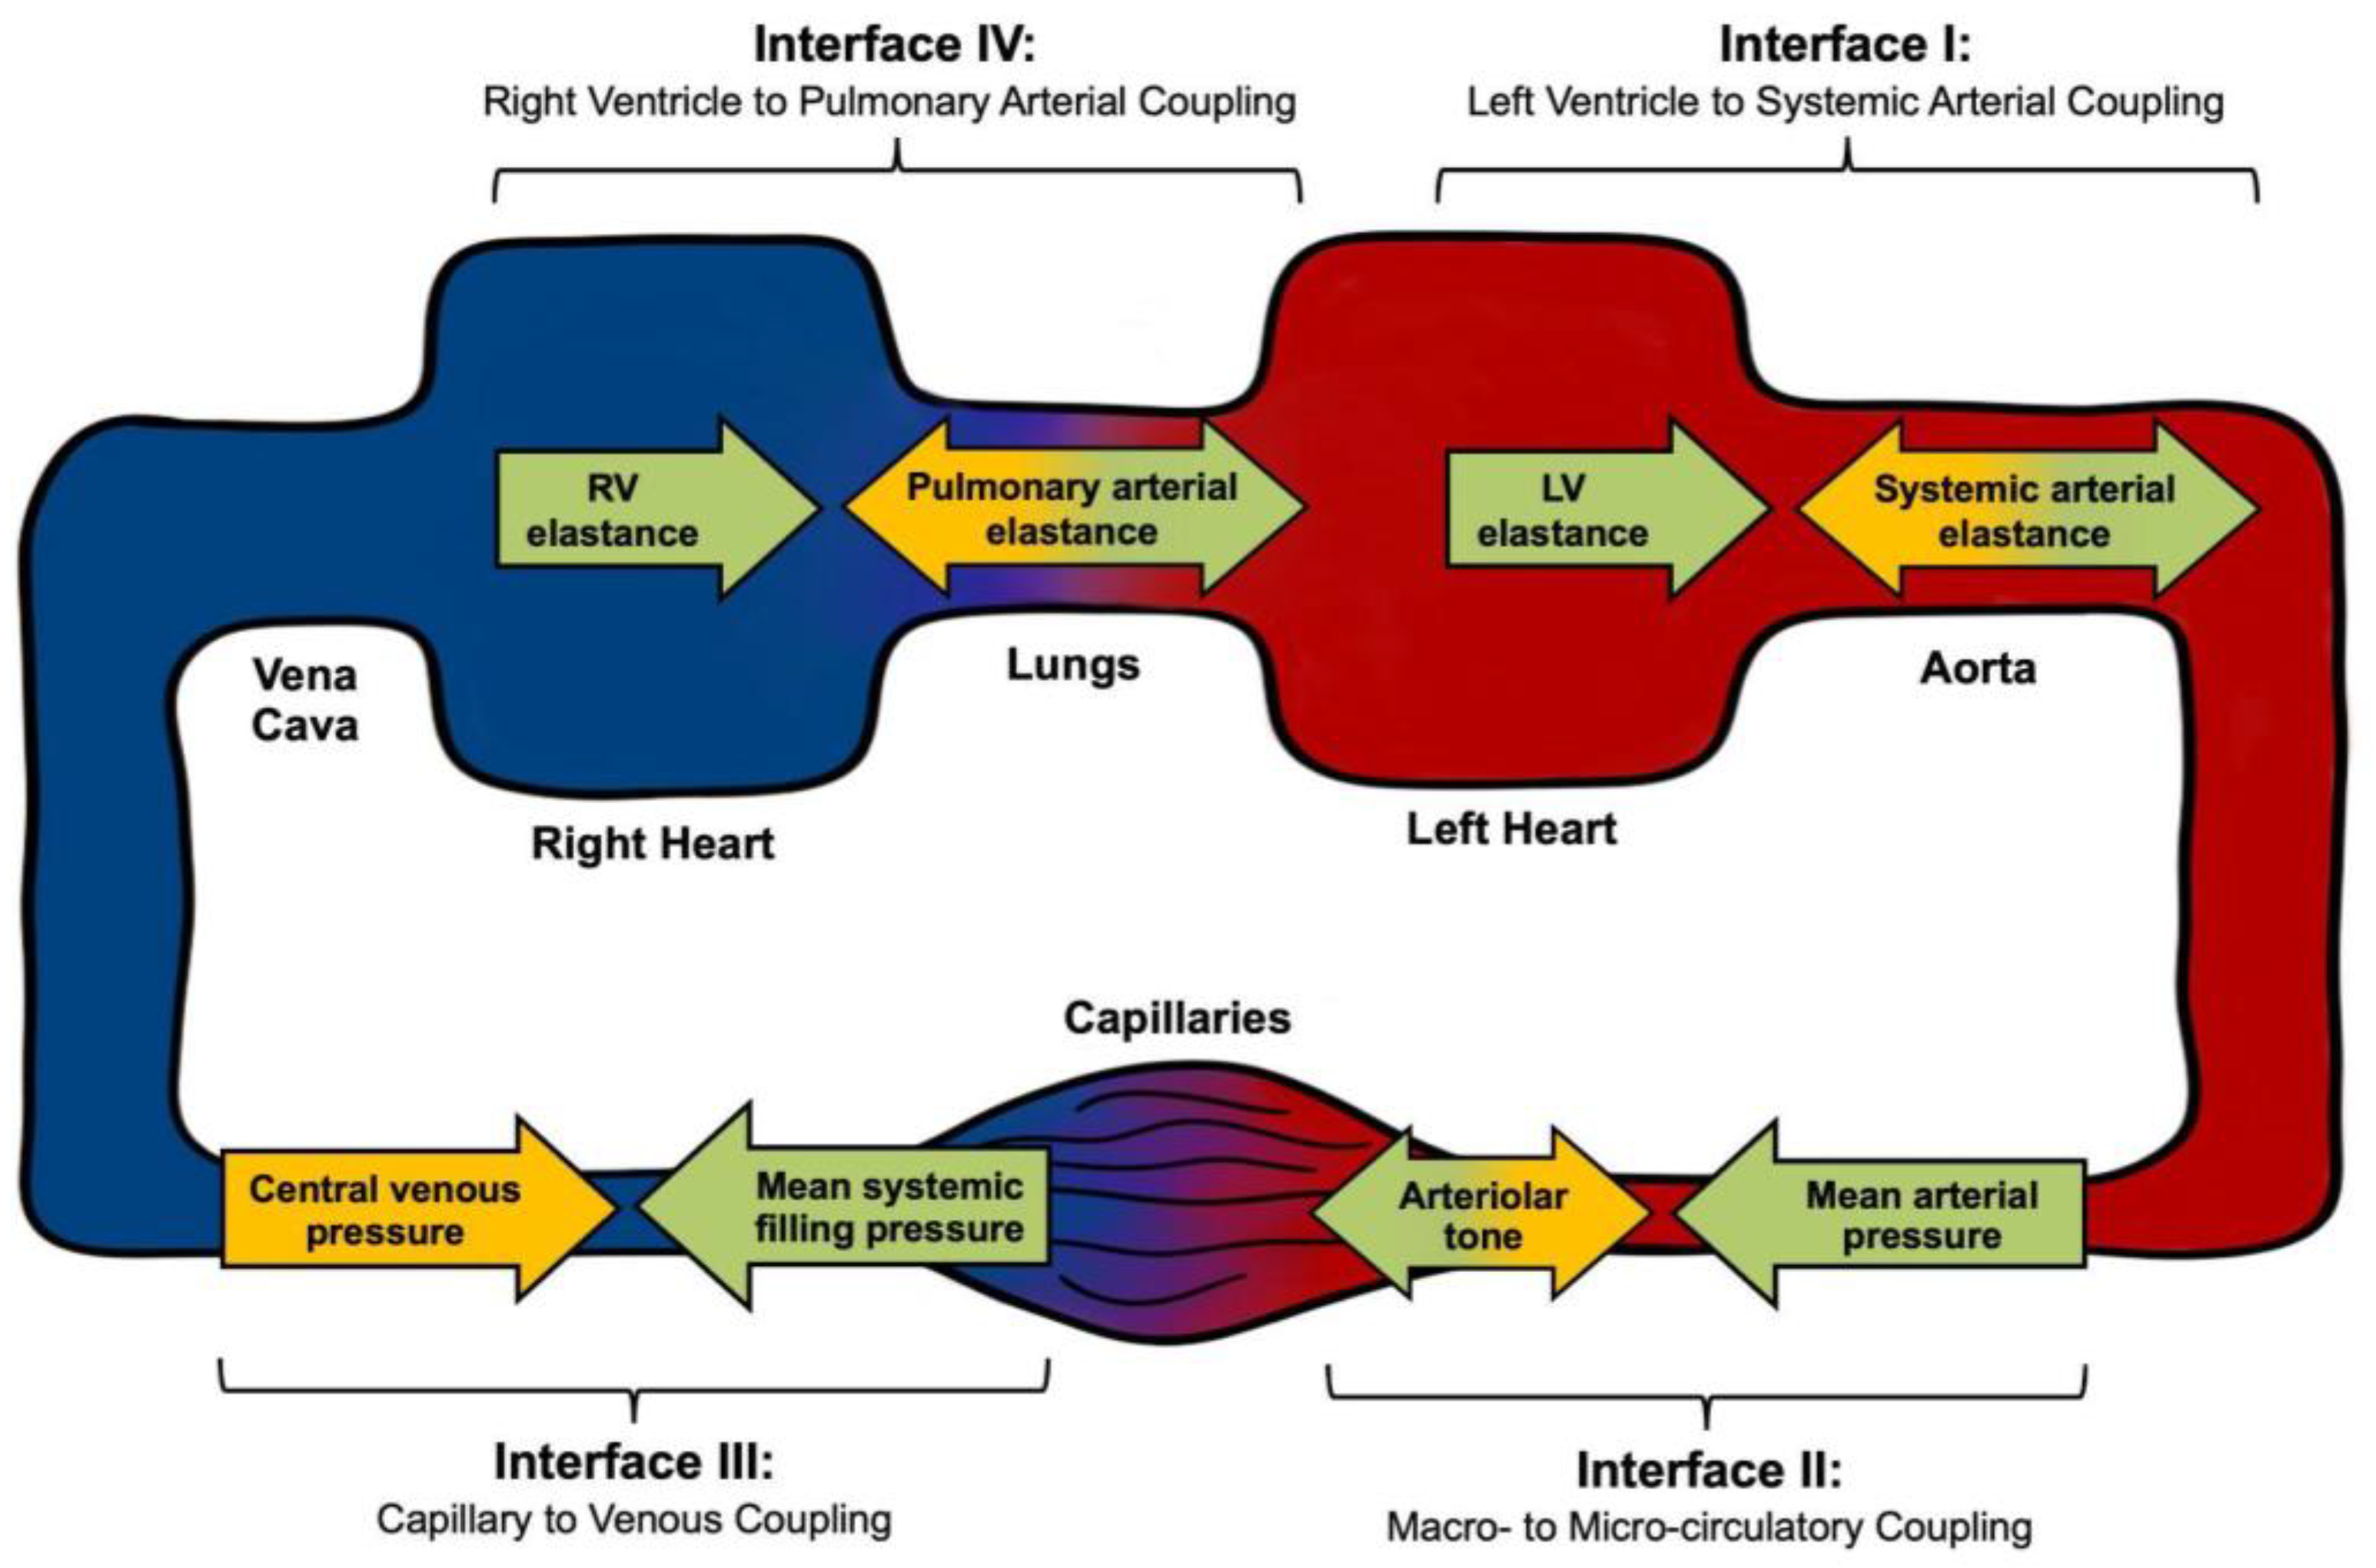
Figure 2.
Theoretical response surface model for a given mean arterial pressure (70 mmHg) according to different combinations of vascular resistance, cardiac output and preload. MAP: mean arterial pressure, MSFP: mean systemic filling pressure. Note that cardiac output can be adequate or inadequate for the same MAP, when it is maintained by a higher resistance.[77,78].
Disclaimer/Publisher’s Note: The statements, opinions and data contained in all publications are solely those of the individual author(s) and contributor(s) and not of MDPI and/or the editor(s). MDPI and/or the editor(s) disclaim responsibility for any injury to people or property resulting from any ideas, methods, instructions or products referred to in the content. |
© 2025 by the authors. Licensee MDPI, Basel, Switzerland. This article is an open access article distributed under the terms and conditions of the Creative Commons Attribution (CC BY) license (http://creativecommons.org/licenses/by/4.0/).
Copyright: This open access article is published under a Creative Commons CC BY 4.0 license, which permit the free download, distribution, and reuse, provided that the author and preprint are cited in any reuse.


