Submitted:
21 March 2025
Posted:
25 March 2025
You are already at the latest version
Abstract
From the urban sustainability perspective and from the steps essential for regulating/balancing the microclimate features, creation and maintenance of urban green spaces (UGS) are vital. The UGS include vegetation of any kind in urban areas such as parks, gardens, vertical gardens, trees, hedge plants, and roadside plants. This “urban green infrastructure” is a cost-effective and energy saving means for ensuring sustainable development. The relationship between urban landscape patterns and microclimate needs to be sufficiently understood to make urban living ecologically, economically, and ergonomically justifiable. In this regard, information on diverse patterns of land use intensity or spatial growth is essential to delineate both beneficial and adverse impacts on urban environment. With this background, the present study aimed to address water requirements of UGS plants and trees during the non-rainy months from Panaji city (Koppen classification: Am) situated on the west coast of India which receives over 2750 mm rainfall almost exclusively during June-September period. In the remaining eight months irrigating the plants in the UGS becomes a serious necessity. The methods followed included primary (field survey-based) and secondary (inputs from key-informant survey questionnaires) data collection address water requirement of the UGS vegetation. Monthly evapotranspiration rates (ET0) derived in this study were used for calculating the water requirement of the UGS. The daily water requirements (DWR) in seven gardens of Panaji city were ~ 25 litres/tree, 6.77 litres/m2 hedge plants and 4.57 litres/m2 groundcover (=lawns). The water requirements for the entire UGS in Panaji city were calculated. Using this information, the estimated total daily volume of water required for the entire UGS of 1.86 km2 in Panaji city is 7.10 million litres. The day-night average ET0 being over 8mm, there appears to be an imminent water stress in most UGS of the city in particular during January-May period. The current supply from borewells of 64200 L vis a vis this ET0 based DWR of 184086 L is at a shortage of over 2.88 times far inadequate in meeting the daily demand of hedge plants and lawn/groundcover.
Keywords:
daily water requirements (DWR)
; urban vegetation
; evapotranspiration
1. Introduction
Urbanization is an inevitable modern phenomenon ongoing worldwide, particularly accelerating in developing countries. The perceived ‘comforts’ and benefits of urban facilities entice the rural population to move into towns and cities which often get overcrowded. Education and employment opportunities, healthcare facilities, and access to advanced infrastructure are notable advantages in an urban setting. However, the drawbacks of rapidly expanding urbanization -often haphazardly- include strain on resources and energy, and environmental vulnerability to severe stormwater runoff, elevated land surface temperature (LST) and urban heat island (UHI) effect.
Importance of vegetation within and around the urban areas is recognised variously. These urban green spaces (UGS), for their removing CO2 from atmosphere and giving out oxygen can be regarded as “lungs of city” and reservoirs of “carbon stock”. Offering a broad range of benefits, their major ecosystem services of sequestering and storing large amounts of carbon ((Pereira et al., 2012)) contribute to mitigation of climate change. With the recent global trend of expanding urbanization, even the smaller share of carbon sink from the urban vegetation must be considered vital and facilitated by proper maintenance and by creating newer UGS for mitigating the increased land surface temperature (LST) and urban heat islands (UHI) for improving the urban living comfort.
Water requirement of plants is an overly complex to predict in practice (Nouri et al., 2013).. However, to achieve “good appeal” in the UGS, irrigation and rainfall should replace the total water lost through evapotranspiration (ETo). This ETo is the sum of water lost through natural evaporation and plant transpiration. This ET has a great ecological relevance. For instance, with growing populations, there is increasing demand for water resources and, therefore, using water efficiently is important for both landscape and agricultural irrigation. This is to minimize competition for limited water resources. For landscape irrigation process, an estimate of evapotranspiration is essential for water management for a good upkeep of landscaped plots in urban areas (Pereira et al., 2012) which offer a variety of ecological and societal services.
Estimating landscape irrigation requirements is problematic because mixtures of plants, small plots of vegetation, and multiple microclimates make it difficult to measure or estimate the ETo. To arrive at a process that can be helpful in landscape water management practices, for providing guidelines several approaches have been ongoing (Nouri et al., 2013). Among them, the Landscape Irrigation Management Program (LIMP) (Romero & Dukes, 2010), the WUCOLS (Costello et al., 2000), and SLIDE Rules (Kjelgren et al., 2016) rely on deriving appropriate coefficients for estimating landscape evapotranspiration for helping landscape managers in defining programs to improve landscape irrigation meet this requirement (Snyder et al., 2015). Ideally, it would be better to calculate water requirement based on local ETL or local reference evapotranspiration (EToL) by all counts. This EToL is an estimate of the ETo for the local climate “if it were possible to measure weather data over a well-watered grass surface to determine ETo in the local climate” (Snyder et al., 2015).
Globally, mostly the estimated EToL or those evolved by the FAO (2012), calculated based on local microclimate data, are used to obtain the EToL. In these efforts, the same standardized reference ET equations as used for deriving the regional ETo. Since no study hitherto seems to have provided ETo based daily water requirements for the UGS in almost all Indian cities or in many Asian cities, one of the objectives of this study was to derive ETo for local conditions in Panaji city. Following this was to provide a basis for estimating the daily requirement of water (DWR) in a select few parks surveyed from Panaji (Sep-Oct 2020). This study also aimed to calculate the DWR for all parks/UGS in Panaji. As detailed later, in Chapter 6, the other primary objective was to examine the feasibility of whether treated/recycled water available regularly would be considered for irrigating the parks and gardens in Panaji city.
2. Materials and Methods
2.1. Data Collection from Urban Green Spaces
A set of key informant survey questionnaires was prepared to collect required information from different gardens/parks, sewage treatment plants, and city development agencies (smart city office, Planning and Development Authority, urban planning). The data were collected by visiting the sites on different days during January – February 2019 and again in August – September 2020. The questionnaires prepared for obtaining information from parks, gardens, and STP are included in Appendix Table A1, Table A2, Table A3 and Table A4. In addition to collecting the on-site data, details obtained through interactive discussions with the garden staff and officers in charge were collated. Main details of these parks are available in Table 4.1 and in the Study Area Section.
2.2. Study Area Details
As many as seven different parks/gardens (social forests) within Panaji city were covered for this study. Various climatological details of Panaji city proposed to be developed as a smart city under Smart City Mission of India are available in Ramaiah et al. (2020).
With the guidance at site and detailed discussion with garden staff many details of these parks were collected. The details for total area of the parks/garden, species and numbers of trees, and ornamental/edge plants were noted (Table 1). In addition, information on the source and amount of water used daily in these parks was also collected. The general practice of watering the gardens in the parks included for this study is no watering during the monsoon months of mid-June to mid-October. There have been instances of acute water shortage, during mid-February till the onset of monsoon/pre-monsoon showers (sometime during late May/early June). During this mostly hot and humid period, the plants, in particular the ornamental plants and the lawn cover suffer from water deficiency.
Except for Joggers Park, the soil is mostly sandy in all the gardens adjacent to, and including, Mahavir Park. Garcia da Orta garden has sandy and silty (66% and 33% respectively) soil. The levelled laterite base of the Joggers Park is topped with soil from elsewhere to grow hedge plants and to support nutrients to existing trees. Ambedkar Park (established 1992) exclusively uses treated wastewater of 16,000 litres every day during non-rainy period from October 15 to June 15 for maintaining the groundcover and long hedge within the garden ca 11,000 m2 total area.
In the parks sourcing borewell water, have drilled bores of varying lengths. Length of the bore in most of these parks is less than 40 meters deep. This is due to their vicinity to the lower stretches of River Mandovi to their left (Figure 1) unlike the deepest borewell of 130 m with the Joggers Park on top of the Altinho which is over 30 m above mean sea level and, at quite a distance of over 3 Km from the northern or western banks of River Mandovi. Notably, in the Ambedkar Park the borewell located within less than 800 m south of Mandovi, was drilled back during mid -1980s yielded saline waters unsuitable for plant growth.
Striking differences in the maintenance practices between each of these parks is as follows: In Mahavir Park established (1963), the water is pumped out directly onto the ground cover and lane edge plants. In Kala Academy (established 1982), the water is pumped out into two overhead tanks from where it is distributed through sprinklers to groundcover and through hand-held pipes to the hedge plants. Within the precincts of Mahavir Park are North Goa Range Forest and South Goa Range Forest Office parks. In the former, the water is used only for ca 200 m hedge of ornamental plants. There is a saplings nursery measuring 800m2 in the South Goa Range Forest Office Park. Year-round regular rearing of tree/forest plants and saplings of as many as 52 different species of medicinal plants (Appendix Table A1) is done. Saplings are sold or distributed free of cost to the interested public. There are also ornamental and hedge plants reared in Mahavir Park (Appendix Table A2) and in Ambedkar Park (Appendix Table A3). In the Art Park, which is right on the banks of River Mandovi, there are big trees (most of them older than 20 years and some planted within the last 6 years) and shrubs not at all watered. Garcia da Orta garden, the oldest park in Panaji established in 1876 in the middle of the city, is home for many raintrees older than 80 years many of 76 of them with girth diameter close to 3 m.
In most of these parks, watering is done for three hours in the morning and three hours in the afternoon for covering only the groundcover (lawns) and ornamental plant-hedge along the walkways. About 20% of the total tall trees in Mahavir Park and those in the Range Forest offices of North and South Goa Districts are trimmed to a maximum height of 10 meters to allow unobstructed passage of light signal from the lighthouse nearby. It is learnt that in addition to litter (dry leaves, twigs, prunes, mowed grass piles) over 30 tons of stem-wood is cut down annually from these trees. Mostly the Casuarina trees ca 200 in numbers stand in the path of the lighthouse signal beam. Joggers Park, created in 2002, is located on top of the Altinho Hill in the central part of the city. Its hard laterite surface is levelled, suitably landscaped, and maintained to keep a largely plain surface for joggers, for a kindergarten play-ground and public amenity (toilet, parking space, and garden office) within an area totalling ca.700m2.
2.3. Derivation of ETo for Panaji Region
The month-wise ETo (mm d−1) for the parks of in Panaji was derived using the formula provided by Snyder et al.( 2015):


Variables in these equations are, net radiation (Rn, MJ m−2h−1), ground heat flux density (G, MJ m−2h−1), psychrometric constant (Δ, kPa K−1), mean air temperature (T,◦C), wind speed (u2, m s−1), saturation vapor pressure (es, kPa), vapor pressure (e, kPa), and slope of the saturation vapor pressure at temperature T (γ, kPa K−1). Data on meteorological parameters viz., solar radiation, temperature, vapor pressure, and wind speed available in literature were used (Table 2 and Table 3). The psychometric constant, slope of the saturation vapor pressure at temperature T were either derived and, for reliability, compared with those of FAO Penman-Monteith datasets (Allen et al., 1998).
2.4. Calculation of Water Requirements of Trees
Daily water requirement of different tree species, major ornamental shrubs maintained by pruning along both sides of the walk paths and of the turfgrass in the ground cover area was calculated based on the principles of Simplified Landscape Irrigation Demand Estimation (SLIDE) Rules (Kjelgren et al., 2016). Unlike the complicated WUCOLS and LIMP methods, the SLIDE rules are used widely to estimate landscape plant water demand as products of evapo-transpiration (ETo), canopy density, and plant factors (PF) which are discrete adjustment factors for broad plant types (Beeson, 2005) based on multiple observations. Since there are many different species of shrubs (<3m tall) and trees (>3m tall) in the parks covered for this study, ranges of height and canopy diameter for each species of trees were obtained from Mahavir Park, Ambedkar Park, and Joggers’ Park during the field visits. Help and knowledge of park maintenance staff was sought to ascertain the height and canopy dimeter estimates. The steps followed are shown in flow chart below:
Flow Chart 1.
Steps followed in the methods for estimating daily ware requirements of plants.
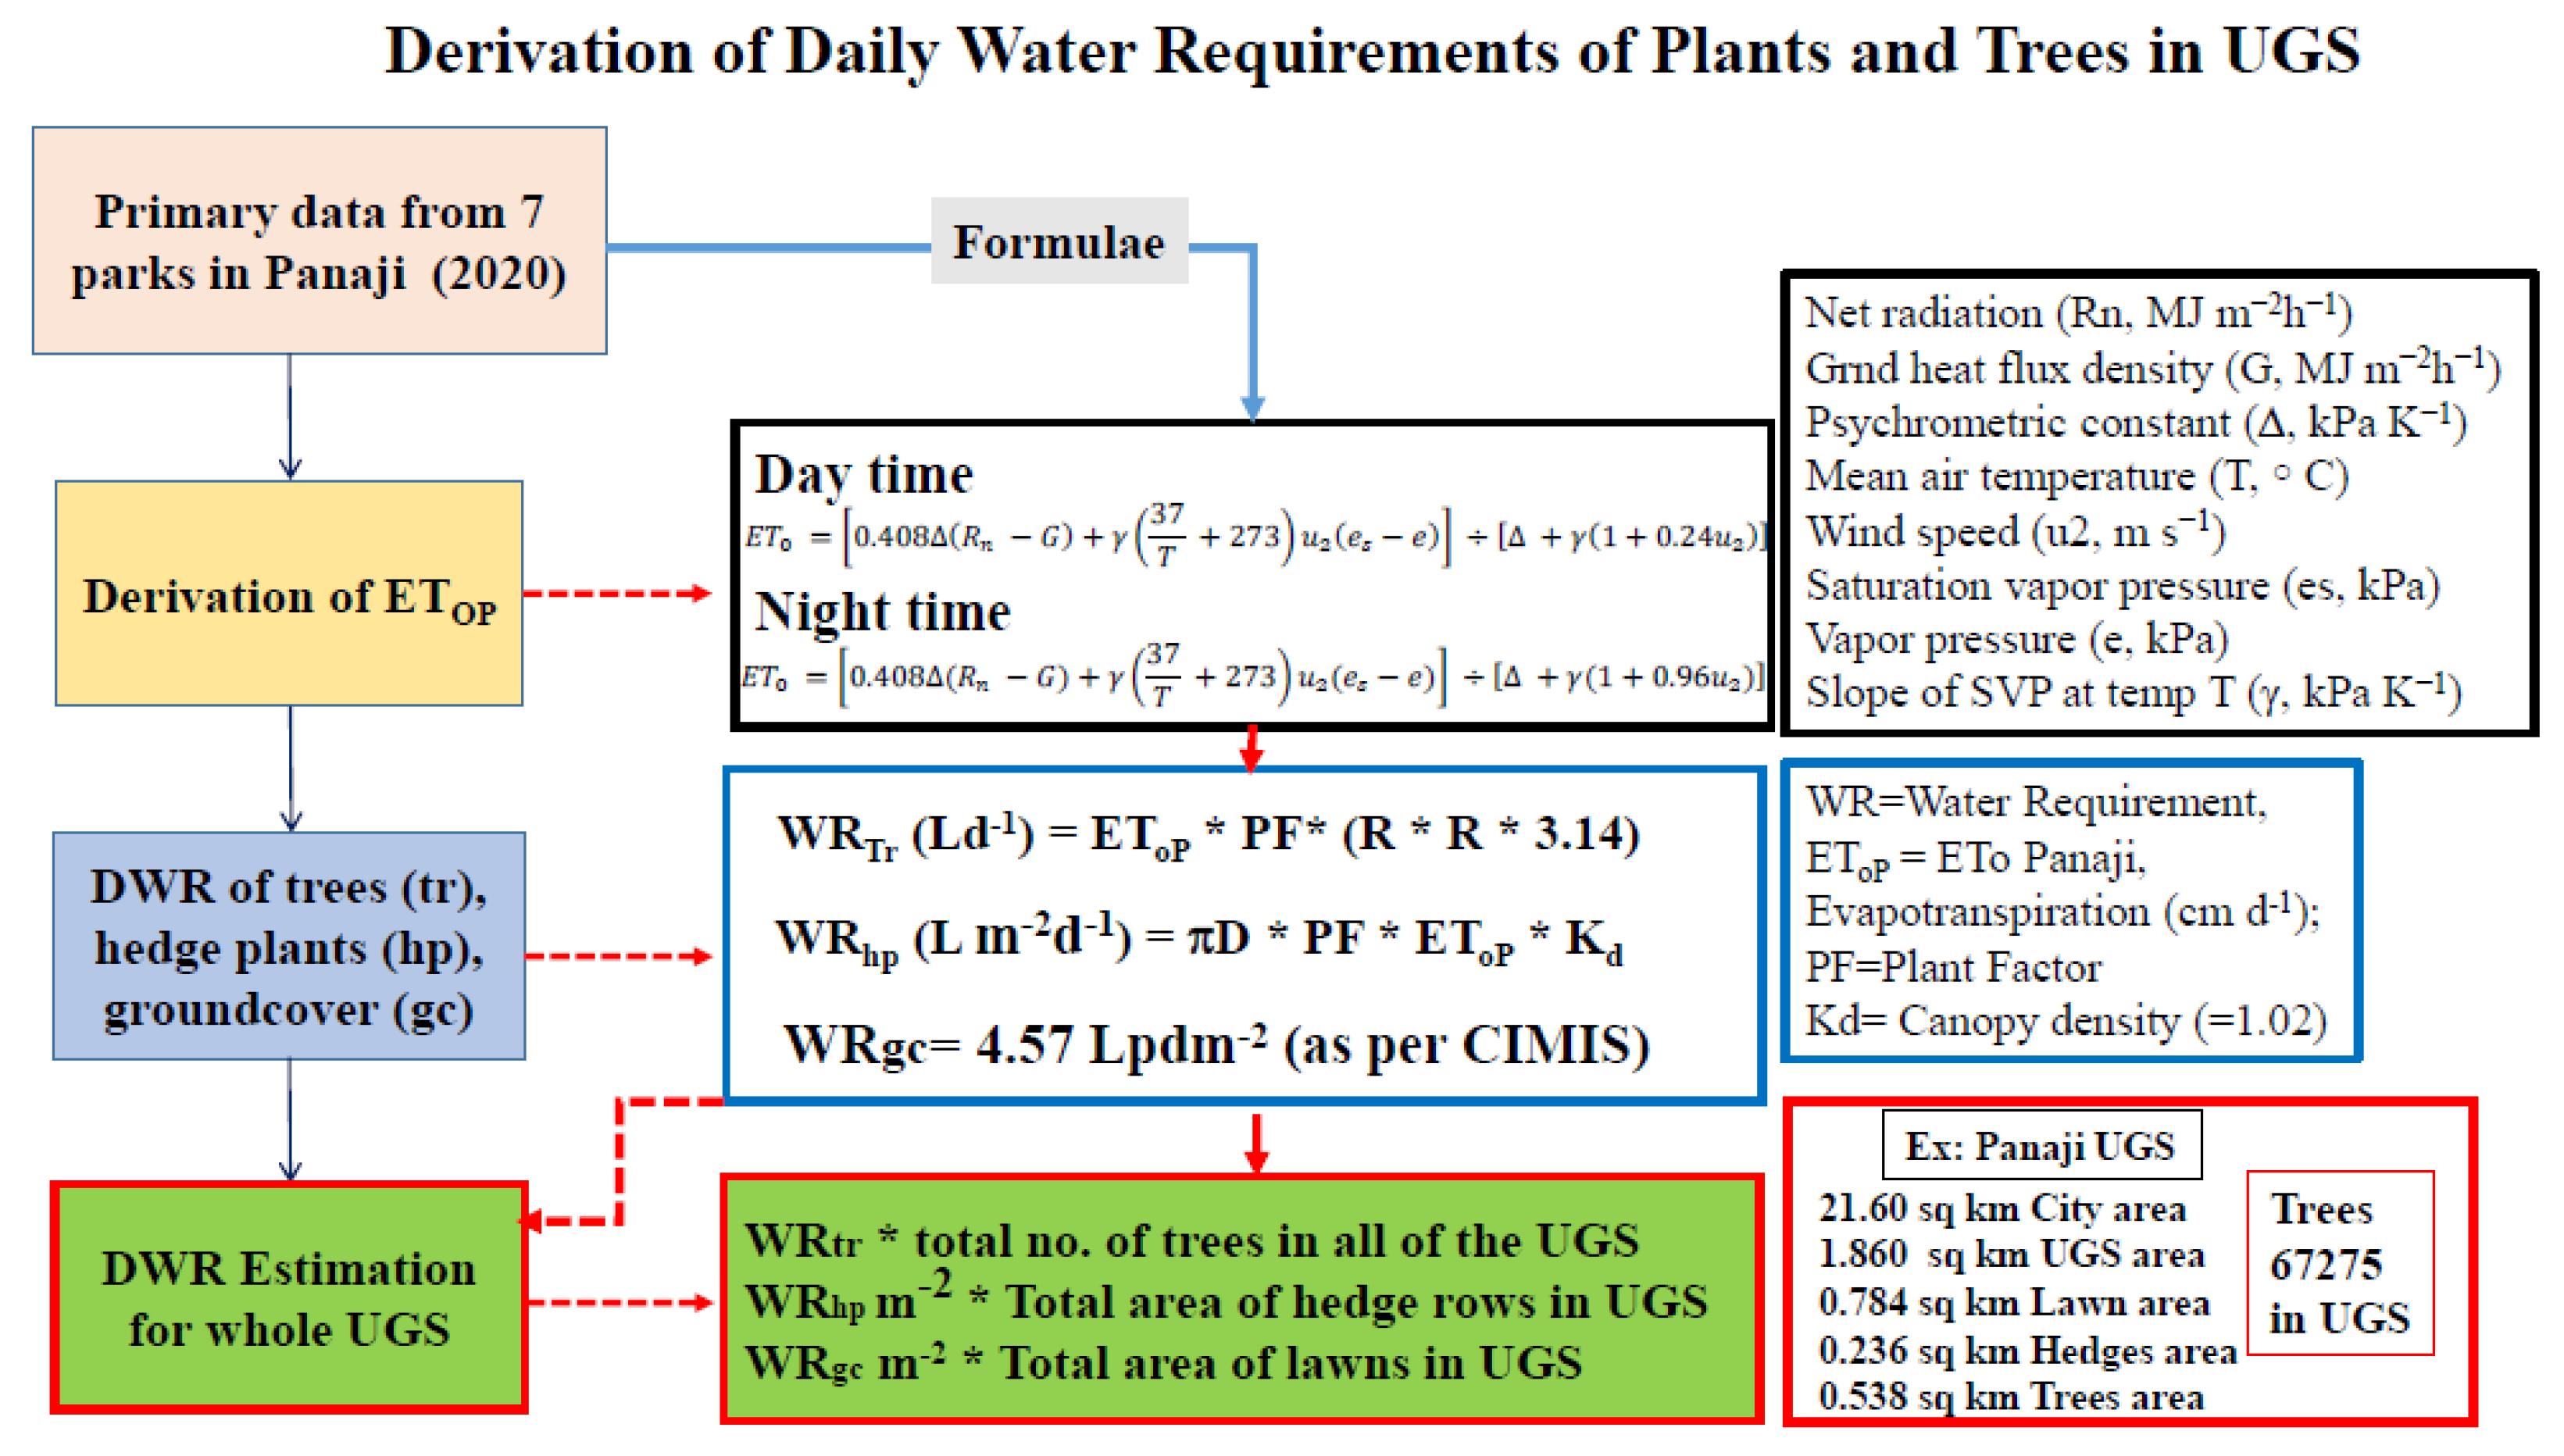
Water requirements of isolated trees in the parks was calculated by appropriately substituting the formula: WR= ETo × PF × (R× R × 3.14) × 0.623 as follows
and
WRTr (Ld−1) = EToP × PF× (R × R × 3.14)
WR (Ld−1) = EToT × PF× (R × R × 3.14)
WR is water requirement, EToP (Panjim), EToT (Tumkur) are evapotranspiration factors (cm d−1); PF is Plant Factor for established landscape trees by following (UCANR, 2020). Two plant factors were used: (a) 0.6 for all trees during somewhat cooler, mildly humid October-January and (b) 0.7 for all trees during more-warmer February-June. R, tree canopy radius in meters; R×R×3.14, area of tree’s canopy-equivalent floor cover; and ETo in mm d−1 were multiplied with this floor cover area to calculate daily water requirement in litres. Irrespective of the canopy shape (triangular, irregular or tapering), its area for a given tree was estimated by projecting the two far end points of the canopy to the floor for a straight line distance that was noted as canopy diameter as per (UCANR, 2020).
2.5. Calculation of Water Requirements of Hedge Plants
With the average height of 0.8 m in all sampled parks where the pruning is done to achieve circular/globular shaped canopy, the perimeter is 3.4 m. Hence, the DWR was calculated using the following relationship
where πD is the area of the perimeter, PF used is 0.65, EToP is the evapotranspiration rates cm d−1 and Kd of 1.02 for higher density mixed species (as per (Snyder et al., 2015)) which works out to 6.77 L m−2 d−1 vis a vis the 7 L m−2 d−1 calculated following SLIDE Rules. Both these volumes closely corroborate with the experience-based input by the garden staff watering 6 to 8 L m−1 hedge length.
WRhp (L m−2d−1) = πD * PF * EToP * Kd
2.6. Calculation of Water Requirements of Lawns (=Groundcover)
For estimating daily water requirement of groundcover, the “non-turf groundcover water demand calculator 2.0” (= NGWDC 2.0) was used (UCANR, 2020). The EToP (0.889 cm or equivalent to 0.36 inches as per American style) derived for this study was applied obtain the DWR for groundcover of Paspalum grass (mostly used as lawn grass in public gardens). The DWR works out to 42.53 for a groundcover area of 9.29 m2 (= 100 sq ft) (or 4.577 Ld−1m−2). Using this rate, the DWR for groundcover was calculated for all parks from where the groundcover area was calculated.
Using these monthly day- and night- time averages of EToP (0.889 cm) derived in this study by following (Snyder et al., 2015), the daily requirement of water was worked out for the number of trees, area of hedge plants and groundcover calculated from all 17 parks of Panaji (Sharma, 2018) as per the weighted mean percentage of landscape spaces listed in Table 3.
3. Results
3.1. Determination of Evapotranspiration Rates
All required values for different variables essential for the Equations (1) and (2) were determined appropriately. Using these derivatives, the daily evapotranspiration rates (mmd−1) for Panaji (EToP) region for each month were obtained. The net radiation (Rn, MJ m−2h−1) value was from the FAO site and the ground heat flux density (G, MJ m−2h−1) used was zero since the ground flux was < 2.5 to 3 MJ m−2h−1. The monthly day and night averages EToP of 8.89 mm d−1 (= 0.889 cm d−1) Table 2 ) were used in all applicable calculations.
3.2. Daily Water Requirements (DWR) of Lawn and Groundcover
Hedge area in Joggers Park, Mahavir Park and Ambedkar Park respectively are 2340 m2 (20.34% of total), 2700 m2 (7.20%), and 1620 m2 (16.20%); and groundcover area is ~ 6410 m2 (35% of combined area of Mahavir Park and Art Park area of 37,211 m2), 6900 m2 (60% of 11,500 m2) in Joggers Park, and 6500 m2 (65% of 10000m2) in Ambedkar Park. These details are listed in (Table 4). To calculate the pooled/total DWR of all plant types in all seven sampled/surveyed parks in Panaji, the percent proportion of areas in all of the Panaji city UGS calculated using the weighted mean mentioned in Table 3 were used.
The daily volumes of water currently applied in these parks varied from 4,000 litres to 16,000 litres (Table 3). As mentioned earlier, borewells are the source of water for all parks except for the Ambedkar Park which uses treated water (given out free of cost) it is ferrying daily from the sewage treatment plant. This supply either from borewells or from other sources is not enough for meeting the daily demand of hedge plants or groundcover (Table 4). For instance, the DWR for 27,860 m−2 ground cover is 127,320 L at 4.77 litres.m−2, and 56767L for 8385 m−2 hedge area at 6.77 litres m−2. The current supply of 64,200 L vis a vis this ETo based DWR of 184,086 L is at a shortage of over 2.88 times. It is to be noted that notwithstanding the presence of over 20 different ornamental plants randomly grown in these parks (Appendix Table A1, Table A2 and Table A3), the DWR for the hedge-plants was calculated at the rate of 6.77 litres m−2 of hedge area.
3.3. Canopy Areas and Water Requirements of Different Species of Trees
At the outset, it is to be noted that most trees in all parks are not watered, except that they may get some moisture/wetness from the nearby groundcover or hedge area. However, in order to highlight their water requirement particularly during the non-rainy months of February to June, the DWR for trees was worked out for tree in 3 parks (Table 5, Table 6 and Table 7)from where confirmed details of taxonomic names were available. The water requirement was calculated for October- January (low to moderate water stress) and February-June (higher water stress) periods using the plant factors of (PF) 0.6 and 0.7, respectively.
Mostly older than 35 years, over 48% (or 1525) of the 3130 individual trees had more than 7m canopy diameter. As stated above, canopy diameter is the important parameter for estimating DWR, the same is described for some trees with quite larger canopy area. The top 10 tree species in Mahavir Park in terms of canopy diameter are Rain tree (Samanea saman min ~25m and max 30 m), Gulmohar (Delonix regia max dia, 18m), Pithecellobium dulce (Inga dulcis), Chinch (Tamarindus indica; 15m), Badam (Terminalia catappa), Taman (Lagerstroemia speciosa; 14 m), Jambal (Syzygium cumini), Peltaphorum (Peltophorum pterocarpum 12m), Spatodea (Spatodea companulata 11m), Saton (Alstonia scholaris), Oval (Mimusops elengi), Ritha (Sapindus mukorossi 10m), Acacia (Acacia auriculiformis), Shankar (Caesalpinia pulcherima), Apto (Bauhinia purpurea), Tecoma (Tecoma capensis 9m), Karanj (Millettia pinnata), Palm (Dypsis lutescens), Palas (Butea monosperma 8m), and Musaenda (Mussaenda erythrophylla 7m). Accounting for another 48%, the canopy diameter of over 40 years old Casuarina (Casuarina equisetifolia) trees ranged narrowly between 5 and 6m. As per Park office information, Casuarinas were planted along the riverside earlier than other species that were introduced. This information serves useful to know the age of these trees in these parks.
In Ambedkar Park, Peltophorum accounted for 38% of the 484 trees belonging to 13 species. Followed by Ashoka tree (11%), Bottle palm (10%), Coconut palm and Badam (5% each). The park was built in 1990s and the age of the trees is taken as 28 years. In Jogger‘s Park, individual trees of Peltophorum sp accounted for 53% of the 404 trees followed by Coconut palm (12%), Beetlenut palm (10%), Bottle palm and Ashoka tree (8% each) with the age of the trees being ~15 years in this park built during 2002. The age of two sandalwood trees is about 2 years.
Overall, the tree species with larger canopy diameter are Gulmohar, Delonix regia (25-30 m); Rain tree, Samanea saman (20-24m); Acacia, Acacia auriculiformis (11-14m); Mango, Mangifera indica (8-13); Bamboo, Phyllostachys pubescens (bundles of 7-12m); Badam, Terminalia catappa (8-12m); Veni tree, Acacia ferruginea (7-10m); Coconut palm, Cocos nucifera (7-9m); Peltophorum, P. pterocarpum (3-7m); and Casuarina, Casuarina equisetifolia (4-7m). Most of the trees with larger canopy are older and those with smaller ones being younger. It was learnt that the two sandalwood trees with ca. 2m canopy diameter were planted about two years ago.
In Joggers’ Park, only four tree species had the maximum canopy diameter of 7 m or more and they accounted for 67.4% of the 402 total trees. The canopy diameter was in the range of 8-10 m for Badam, Terminalia catappa; 7-9m for Coconut palm, Cocos nucifera; 3-7 m for Peltaphorum, P. pterocarpum; and 4-7m for Palm, Dypsis lutescens. The water requirement was of higher volumes for trees with larger canopy. The DWR is the same for identical canopy diameter irrespective of the tree species.
By calculating the DWR, it was evidenced that it is different for different species solely based on the canopy area/diameter of a given species of tree. The DWR of 3130 trees in Mahavir Park (Figure 2a–c) during Oct-Jan period is 79,346 litres (on an average of 25.35 litres/tree). During Feb-June, the total volume of water required is 92,570 litres (average 30 litres/tree). Similarly, in Ambedkar Park (Figure 3), the DWR for 478 trees during Oct-Jan is 10,823 litres (average 23 litres/tree). During Feb-June, it is 12,626 litres (average 26.41 litres/tree). Further, the DWR of 402 trees with younger (<15 years) ones of lesser canopy area, in Joggers Park (Figure 4) during Oct-Jan is 7180 litres (averaging 18 litres/tree) and during Feb-June, the DWR is 8376 litres (average of 21 litres/tree).
For a sum of 4012 trees from Mahavir Park, Ambedkar Park, and Joggers’ Park together, the total volume of water required daily during Oct-Jan is ca. 0.098 MLD, and during Feb-June, 0.114 MLD. Thus, on an average for 4012 trees in three parks, the DWR for the eight non-rainy months period of October 15-June 15 is 0.211 MLD averaging to 26.30 litres/tree.
Indeed, a linear relationship was invariably seen between canopy diameter and volume of water required (Table 4.9). Larger the canopy diameter, higher the volume required during both these periods using different PFs. During Oct-Jan, the minimum water required ranged from 13 litres for Phyllanthus emblica to a high of 317 litres for Rain tree, followed by Gulmohar, Dulce, Badam, Taman, Jambal, Peltophorum, and Chinch most of which possess larger canopies need higher volumes compared to narrow canopied Ashoka, Bottle palm, Avalo, Bayo, Casuarina, and Java cassia.
3.4. Regression Relationships
Regression relationship between independent variables (mean tree heights, canopy, and circumference) and dependent variables such as DWR for lower PF 0.6 and higher PF 0.7 periods within a given species in Mahavir Park, Ambedkar Park, and Joggers Park and R2 values for all these relationships are listed in Table 8. Invariably, the level of significance between independent variable (canopy area) and dependent variable (DWR) was linear and highly significant in Mahavir (R2=0.9417) and Ambedkar Park (R2 =0.833) among the taller, broader canopied, and bigger circumference trees. Indeed, the carbon dioxide fixed/tree/year also bore a linear relationship with DWR during both the periods specifically in Mahavir Park. Lower R2 values were found for trees in Joggers Park.
3.5. DWR in the UGS of Panaji City
Using the information derived from the seven parks, water requirement was worked out for all the parks and gardens in Panaji city. In addition to these two main parameters, literature-search based information on several parameters is also listed for a comprehension The mean proportions/percentages of hedge rows, ground cover, and tree areas in Panaji city are indicated in Figure 4.5 and their area distribution in Figure 5. The volume of water applied currently for watering mainly the hedge area of 236287m2 and the ground cover area of 784,465 m2 in all 17 parks is 2.66 MLD. These two volumes add up to 5.20 MLD (Figure 6). Similarly, the likely volumes of water applied daily to the hedge area of 117497m2 and the ground cover area of 389,952 m2 may be about 1.2 MLD (Figure 7). However, the DWR for hedge plants is about 0.8 MLD and for groundcover, 1.78 MLD. Thus, the daily supply for hedge plants and groundcover must be falling short by 1.53 MLD (or 46.57%) of the requirement (Table 9).
4. Discussion
4.1. Need for Background Details of Microclimate Factors
The DWR estimates can be improved by deriving the ETo for the regions. Therefore, three basic steps were followed in this study. Firstly, based on tree/plant density and diverse species grown, the parks were categorized as mixed type. As per the WUCOLS plant density (Kd) coefficients, the parks in Panaji and Tumkur fall into the category of high or mixed (1.1–1.3) type. Thus, a Kd of 1.2 might seem appropriate for the purposes of inference.
The next step was to recognize as to which of the landscape coefficient best describes these parks. In their study, Snyder et al. (2015) reviewed the WUCOLS and LIMP methods and identified the following coefficients as useful for deriving and practicing improved landscape management strategies. These are KL: landscape coefficient; Kmc: microclimate coefficient; Kp: plant species coefficient which includes plant type and managed water stress, and Kd: plant canopy density. They stated that the Kp coefficients are subjectively separated, depending on estimated water use of specific vegetation as, extremely low (<0.1), low (0.1–0.3), moderate (0.4–0.6), and high (0.7–0.9). Similarly, Kp values are also “determined subjectively based on experience of the authors of WUCOLS”. In that, the Kp for any plant species with moderate water use during the post-monsoon months of October-January can be up to 0.6 and higher (at least 0.7) during the warm months, wherein the water use in the high humidity coastal location of Panaji can be higher at 0.7. With this consideration, these two plant factors were used (UCANR, 2020).
In Panaji and Tumkur parks with high plant diversity, the Kd would be 1.2. The Kmc of plants grown in a windy location such as Panaji city can be up to 1.2 as per (Snyder et al., 2015). Using these inputs suitably in to the equation KL= Kmc * Kd * Kp adapted from (Snyder et al., 2015), the landscape coefficient of Panaji parks could be KL= 1.2 * 1.2 * 0.6 (i.e., KL= 0.864) for October-January and KL= 1.2 * 1.2 * 0.7 (KL= 1.008) for February-June.
4.2. Importance of Establishing Regional ETo
ET0 rates ranging from 3.97 to 6.54 recorded mm d−1 for California Coachella Valley Water District with wide ranging annual temperature and weather are reported in literature [(Kjelgren et al., 2016); (Snyder et al., 2015); (Nouri et al., 2013); (Snyder & Pruitt, 1992); (Rosa et al., 2013)]. Both the EToP and EToT derived for the first time within the Tropic of Cancer are higher by over 20% of these values. Such derivations to suite regional ETo are useful to suite regional needs. Therefore, to be contextual, the EToP from the total UGS area of 1.86km2 would be accounting 8.89 mm (column) multiplied by 106 (sq Km area converted to square meters) would equal a volume of 16.54*106 litres per day. These derivations and the computed month wise ETo could be of regional significance in many Asian countries.
By meeting the DWR of the hedge area (0.236 km2), ground cover area (0.784 km2) and the trees’ area of 0.538km2 with their water requirement of 6.951MLD, the daily transpiration losses of groundwater can be prevented.
4.3. Considerations for Assessing Water Requirements in the UGS
Briefly, temperature and season of the year, soil moisture content, soil’s water holding capacity, extent of tree root development, depth of root zone, root system-health, and tree species’ ability to resist drought are to be taken into account for working out the water requirement and frequency of watering (Pittenger et al., 2001). Several authors [(Beeson, 2012); (Pittenger & Shaw, 2013); (Shaw & Pittenger, 2004); (Staats & Klett, 1995)] have used the values of ETo X PF X Canopy radius for estimating water requirement by a variety of groundcovers, shrubs, and trees. These authorities emphasize the importance of using appropriate factors of ETo for landscape groundcovers and shrubs to achieve acceptable landscape performance. A median ranged ETo value of 0.889 (equivalent to 0.35 as per (Kjelgren et al., 2016)) derived and used in this study is much more valuable than picking any ETo rate in the range of 0.16 to 0.48 supposedly holding good (Beeson, 2012) for most tropical tree species considered to experience.
The same approach can be successful in estimating the amount of water required for landscape tree species to provide acceptable performance in most landscape settings, but a species specific tree PF can be a constraint [(Pittenger & Shaw, 2010); (Costello et al., 2005); (Pannkuk et al., 2010)]. To overcome this, (Kjelgren et al., 2016) provided simplified landscape irrigation demand estimation (SLIDE) Rules. However, focused research efforts across the spectrum of climatic conditions and plant species in UGS settings are called for a realistic measurement of DWR that permits acceptable performance of the given tree species.
For estimating daily water requirement of landscape-trees, Beeson (2012) recommended a single Plant Factor (PF) of 0.5, or 50%, to adjust reference evapotranspiration (ETo), as in ETo Χ 0.5. This PF is reported as applicable to all established, climatically adaptable, traditionally grown, drought tolerant, low-water use, native, or social forestry compatible trees. As explained earlier, two different PFs of 0.6 (for less warm and less humid October- January period) and 0.7 (for warmer and more humid February-June period) were used in this study. The calculated DWR using the formula adapted in this study are largely in the ranges reported by (Shaw & Pittenger, 2004) for many trees growing in tropical regions. In the absence of previous studies on water requirement data all the species grown in the urban areas of Panaji or Tumkur cities, estimates of 25.81 litres/tree can be adapted to project the DWR by trees in UGS in most Asian cities.
Due to reduced evapotranspiration efficiency in water-starved plants and trees (Qaderi et al., 2019), several physiological processes might be altered. For instance, their carbon fixation, growth rate, inflorescence output, and fruiting physiology can be adversely affected. Therefore, carbon sequestration potential during the warmer, non-rainy periods of over 6 months from January in the parks and gardens of Panaji ought to be low apart from reduced efficiency of constraining the UHI because of increased LST.
4.4. DWR for Trees, Hedges and Groundcover
On the basis of DWR for the hedge-area and groundcover in these three parks, approximately 2.66 MLD of water is currently being used in Panaji city for all of its 17 parks with an estimated sum of the hedge area of 236287m2 and the groundcover area of 784,465 m2. Watering the tree - currently not in practice -would fetch several advantageous ecosystem services (Ramaiah 2021)
There are no previous reports on DWR by hedge plants or groundcover in use in UGS. The assessment done after deriving the EToP in this study included sizable lengths of hedge plants and groundcover. Thus, it can be proposed that the DWR of 6.77 Lm−2 for hedge plants and 4.57 Lm−2 for groundcover using the EToP derived in this study and DWR calculated. Although Kjelgren et al. (2016) suggest that this quantity as adequate for 1-4 days for acceptable plant performances, the porous, low retention characteristic sandy/loamy soils in most of the parks covered for this study would need watering at least once in two days in Panaji. Thus the results from this study may prove very pragmatic for several sustainable management steps. For instance, it in future might become an obligate necessity to completely avoid extracting groundwater (through borewells) and use treated wastewater to maintain the UGS in Panaji city.
4.5. Need for Treated Wastewater Use in UGS in Reducing Groundwater Extraction
Over 49% is the combined short supply of water for hedge-plants and lawns in the whole of Panaji UGS. This implicitly suggests the water stress the plants are experiencing. This is despite continuous groundwater pumping out (or frequent resorting to diversion of significant volumes of processed water meant for domestic use (Corporation of the City of Panaji & CRISIL Risk and Infrastructure Solutions Limited, 2015). Therefore, not only this shortfall but also DWR for hedge plants and groundcover together can be effectively met by ferrying in the treated water available to the tune of over 13 MLD. Keeping aside the differences of species-wise requirement, the DWR per tree for 4012 trees in three parks during the eight month-period of October 15-June 15 averages to ~24 litres/tree daily. This average can be applied to all 67,275 trees in Panaji UGS
From the EToP derived in this study for Panaji, it could be estimated that over 16,500 m3 is the volume of evapotranspiration (equivalent to 8.89 mm d−1 m−2) daily from all of the city’s UGS area of 1.86 sq km. For the non-rainy 240 days, it amounts 2134 mm m−2. In other words, close to 76% of the centennial mean rainfall of 2774 mm is lost through evapotranspiration in this region. Such a loss is an overly critical problem in Tumkur city with higher ETo (of 9.36 mm d−1 m−2) receiving far lesser rainfall annually (Ramaiah, 2021, Ramaiah et al., 2022). Perhaps for such reasons, are the rapid and huge depletion of groundwater in most low rainfall/snowfall areas across the globe.
While it is beyond the scope of the present study, it may be suggested that the greatly receding groundwater reserves year on year are posing severe water crises in many parts of the globe (Ramaiah & Avtar, 2019). By using the treated waste water from any STP which is meeting all the safe-limits criteria, a complete stoppage of groundwater extraction can be possible. Currently Panaji city is practicing groundwater extraction for watering all of its UGS except that of Ambedkar Park. This park resorted to transporting ca 20,000 litres after its borewells pumped out saline water found unsuitable for garden uses. In cities, due to failing borewells (some drilled deeper than 250 meters: (Central Ground Water Authority (CGWA), 2020)), it is hard to avoid intense water stress during summer or during long spells of of non-rainy days even during the monsoon months. It may be an issue to save the plants in the UGS even when a consideration-based option is to divert some portion of water processed for potable purposes to UGS use.
5. Conclusions
Optimal irrigation application is typically achieved by applying the correct amount of water to maintain quality of the landscape plants without excessive losses to deep percolation or runoff onto hardscapes. Landscaped-UGS irrigation management is an extremely important factor for water conservation in cities where water losses are often unrecoverable. Efforts to reduce those unrecoverable losses help to distribute water more widely within cities, which is becoming increasingly important in a world with rapid population growth and, decreased water supplies. As Snyder et al. (2015) pointed out, though the ET-based scheduling to improve on the efficient use of water for irrigation has seen considerable advancements in recent decades, there is still a need to improve the estimation of ET in regions with multiple microclimates and where the vegetation is mixed or fetch is inadequate for measurement of ET using traditional methods. Knowledge of regional evapotranspiration (ETo) is vital for deciding on water management for irrigating the UGS. In this study, the ETo for Panaji (EToP) was calculated for every month of the year by assembling a variety of atmospheric data. Using the annual average evapotranspiration rate of 0.889 cm d−1 in Panaji region, the water requirement for different plant types was calculated. Daily water requirement (DWR) was found to be higher by 3-4 liters/tree (than the annual average of ~ 25 liters/tree) in different parks during the warmer months beginning mid-February to mid-June. During the somewhat cooler months in Goa, the water requirement was lower than the annual average. Water requirement for every m2 area of groundcover is 4.57 liters and for every m2 row of hedge-plants, it is 6.77 liters d−1. The water currently applied for hedge area of 236,287 m2 and the ground cover area of 784,465 m2 in all 17 parks totals 2.66 MLD. At 6.77 LPD m−2 for hedge plants and 4.57 LPD m−2, the daily demand is 5.34 MLD. A total of over 80,000 trees needs 1.77 MLD. From this information, the total daily volume of water required for the entire UGS of 1.86 km2 in Panaji city is 7.10 million liters. This volume is much lower (about 50%) than the total treated water of 14 MLD produced and drained into a polluted creek.
6. Patents
This section is not mandatory but may be added if there are patents resulting from the work reported in this manuscript.
Conflicts of Interest
The authors declare no conflicts of interest.
Appendix A

Table A1.
List of medicinal plants grown in South Goa Range Forest Office garden.
| 1 | Abrus precatorius | 27 | Jatropha curcas |
| 2 | Acacia catechu | 28 | Justicia adhatoda |
| 3 | Acorus calamus | 29 | Justicia gendarussa |
| 4 | Aegle marmelos | 30 | Lawsonia inermis |
| 5 | Aloe barbadensis | 31 | Mimusops elengi |
| 6 | Alstonia scholaris | 32 | Mesua ferrea |
| 7 | Andrographis paniculata | 33 | Moringa oleifera |
| 8 | Annona muricata | 34 | Murraya koenigii |
| 9 | Annona squamosa | 35 | Ocimum tenuiflorum |
| 10 | Artemisia vulgaris | 36 | Phyllanthus emblica |
| 11 | Asparagus racemosus | 37 | Phyllanthus fraternus |
| 12 | Azadirachta indica | 38 | Pogostemon cablin |
| 13 | Bacopa monnieri | 39 | Piper longum |
| 14 | Boerhavia diffusa | 40 | Piper nigrum |
| 15 | Bryophyllum pinnatum | 41 | Rauvolfia serpentina |
| 16 | Butea monosperma | 42 | Saraca asoca |
| 17 | Cassia fistula | 43 | Stevia rebaudiana |
| 18 | Catharanthus roseus | 44 | Strychnos nux-vomica |
| 19 | Centella asiatica | 45 | Syzygium cumini |
| 20 | Cinnamomum zeylanicum | 46 | Terminalia arjuna |
| 21 | Cissus quadrangularis | 47 | Terminalia bellirica |
| 22 | Ficus racemosa | 48 | Terminalia chebula |
| 23 | Garcinia indica | 49 | Tinospora cordifolia |
| 24 | Gloriosa superba | 50 | Vitex negundo |
| 25 | Gymnema sylvestre | 51 | Withania somnifera |
| 26 | Hemidesmus indicus | 52 | Zanthoxylum rhetsa |
All these plants are reared in the nursery and sold or distributed occasionally free of cost to interested public. Only a few of these are grown in the hedgerows
Table A2.
Ornamental and hedge plants in Mahavir Park.
| Common name | Botanical Name |
| Golden duranta | Duranta erecta |
| Acalypha | Acalypha wilkesiana |
| Eranthemum | Eranthemum pulchellum |
| Allamanda | Allamanda cathartica |
| Panama Rose | Arachnothryx leucophylla |
| Gardenia | Gardenia jasminoides |
| Tutia | Solanum sisymbriifolium |
| Dracena | Dracaena marginata |
| Bouganvilla | Bougainvillea spp |
| Croton | Codiaeum variegatum |
| Areca Palm | Dypsis lutescens |
| Pentas | Pentas lanceolata |
| Balsam | Impatiens balsamina |
| Agave | Agave americana |
| Hibiscus | Hibiscus rosa-sinensis |
| Spider plants | Chlorophytum comosum |
Table A3.
Ornamental plants in Ambedkar Park grown in nursery and used* in hedge lines.
| Local name | Botanical name | Family |
| Gardenia | Gardenia jasminoides | Rubiaceae |
| Tutia | Solanum sisymbriifolium | Solanaceae |
| Panama Rose | Arachnothryx leucophylla | Rubiaceae |
| Almonda | Allamanda cathartica | Apocynaceae |
| Croton | Codiaeum variegatum | Euphorbiaceae |
| Golden duranta | Duranta erecta | Verbenaceae |
| Eranthemum | Eranthemum pulchellum | Acanthaceae |
| Nerium | Nerium oleander | Apocynaceae |
| Ixora | Ixora coccinea | Rubiaceae |
| Hibiscus | Hibiscus rosa-sinensis | Malvaceae |
| Red and green dressina | Dracaena marginata | Asparagaceae |
| Althernatum | Althernatum sp | |
| Balsam | Impatiens balsamina | Balsaminaceae |
| Jocupus Rendulus |
Ornamental plants. Many in the nursery area; grown for sales. Medicinal plants Mostly in nursey and sold.
References
- Allen, R.G.; Pereira, L.S.; Raes, D.; Smith, M. (1998). Chapter 4—Determination of ETo. FAO - Food and Agriculture Organization of the United Nations. http://www.fao.org/3/x0490e/x0490e08.htm#.
- Beeson, R. Modeling Irrigation Requirements for Landscape Ornamentals. HortTechnology 2005, 15. [Google Scholar] [CrossRef]
- Beeson, R.C. Development of a Simple Reference Evapotranspiration Model for Irrigation of Woody Ornamentals. HortScience Horts 2012, 47, 264–268. [Google Scholar] [CrossRef]
- Central Ground Water Authority (CGWA). (2020). NOCAP. http://cgwa-noc.gov.in/LandingPage/index.htm.
- Corporation of the City of Panaji, & CRISIL Risk and Infrastructure Solutions Limited. (2015, February). Revised City Development Plan for Panaji, 2041. Imagine Panaji. http://imaginepanaji.com/wp-content/uploads/2015/11/Revised-City-Development-Plan-for-Panaji-2041-2.pdf.
- Costello, L.R.; Jones, K.S.; McCreary, D.D. Irrigation effects on the growth of newly planted oaks (Quercus spp.). Arboriculture & Urban Forestry 2005, 31, 83. [Google Scholar]
- Costello, L.R.; Matheny, N.P.; Clark, J.; Jones, K.S. (2000). A Guide to Estimating Irrigation Water Needs of Landscape Plantings in California, the Landscape Coefficient Method and Wucols III. University of California Cooperative Extension, California Department of Water Resources: Berkeley, CA, USA.
- Kjelgren, R.; Beeson, R.; Pittenger, D.; Montague, T. Simplified Landscape Irrigation Demand Estimation: SLIDE Rules. Applied Engineering in Agriculture 2016, 32, 363–378. [Google Scholar] [CrossRef]
- Nouri, H.; Beecham, S.; Kazemi, F.; Hassanli, A. A review of ET measurement techniques for estimating the water requirements of urban landscape vegetation. Urban Water Journal 2013, 10. [Google Scholar] [CrossRef]
- Pannkuk, T.R.; White, R.H.; Steinke, K.; Aitkenhead-Peterson, J.A.; Chalmers, D.R.; Thomas, J.C. Landscape Coefficients for Single- and Mixed-species Landscapes. HortScience Horts 2010, 45, 1529–1533. [Google Scholar] [CrossRef]
- Pereira, L.; Cordery, I.; Iacovides, I. Improved indicators of water use performance and productivity for sustainable water conservation and saving. Fuel and Energy Abstracts 2012, 108. [Google Scholar] [CrossRef]
- Pittenger, D.R.; Shaw, D.A. Estimating water needs of urban landscapes 2010, 45, S96–S96.
- Pittenger, D.R.; Shaw, D.A.; Hodel, D.R.; Holt, D.B. Responses of Landscape Groundcovers to Minimum Irrigation. Journal of Environmental Horticulture 2001, 19, 78–84. [Google Scholar] [CrossRef]
- Pittenger, D.; Shaw, D. (2013). Making Sense of ET Adjustment Factors for Budgeting and Managing Landscape Irrigation. https://www.irrigation.org/IA/FileUploads/IA/Resources/TechnicalPapers/2013/MakingSenseOfETAdjustmentFactorsForBudgetingAndManagingLandscapeIrrigation.pdf.
- Qaderi, M.M.; Martel, A.B.; Dixon, S.L. Environmental Factors Influence Plant Vascular System and Water Regulation. Plants 2019, 8. [Google Scholar] [CrossRef] [PubMed]
- Ramaiah, M. (2021). Role of treated wastewater in mitigating urbanization impacts and maintaining regulatory ecosystem services. Ph D Thesis, Hokkaido University.
- Ramaiah, M.; Avtar, R. Urban Green Spaces and Their Need in Cities of Rapidly Urbanizing India: A Review. Urban Science 2019, 3. [Google Scholar] [CrossRef]
- Ramaiah, M.; Avtar, R.; Kumar, P. Treated Wastewater Use for Maintenance of Urban Green Spaces for Enhancing Regulatory Ecosystem Services and Securing Groundwater. Hydrology 2022, 9. [Google Scholar] [CrossRef]
- Ramaiah, M.; Avtar, R.; Rahman Md, M. Land Cover Influences on LST in Two Proposed Smart Cities of India: Comparative Analysis Using Spectral Indices. Land 2020, 9. [Google Scholar] [CrossRef]
- Romero, C.C.; Dukes, M.D. (2010). Residential benchmarks for minimal landscape water use. Gainesville, FL. Agricultural and Biological Engineering Dept., Univ. of Florida UF Water Institute, USA, 49.
- Rosa, R.; Dicken, U.; Tanny, J. Estimating evapotranspiration from processing tomato using the surface renewal technique. Biosystems Engineering 2013, 114, 406–413. [Google Scholar] [CrossRef]
- Sharma, P. (2018, December 13). Tumkur: A Smart City in the Making. Silicon India. https://www.siliconindia.com/news/general/Tumkur-A-Smart-City-in-the-Making-nid-206312-cid-1.html.
- Shaw, D.A.; Pittenger, D. Performance of landscape ornamentals given irrigation treatments based on reference evapotranspiration. Acta Horticulturae 2004, 664, 614. [Google Scholar] [CrossRef]
- Snyder, R.L.; Pedras, C.; Montazar, A.; Henry, J.M.; Ackley, D. Advances in ET-based landscape irrigation management. Agricultural Water Management: Priorities and Challenges 2015, 147, 187–197. [Google Scholar] [CrossRef]
- Snyder, R.; Pruitt, W. (1992). Evapotranspiration data management in California. 128–133.
- Staats, D.; Klett, J.E. Water conservation potential and quality of non-turf groundcovers versus Kentucky bluegrass under increasing levels of drought stress. Journal of Environmental Horticulture 1995, 13, 181–185. [Google Scholar] [CrossRef]
- UCANR (2020). Estimating Tree Water Requirements. https://ucanr.edu/sites/UrbanHort/Water_Use_of_Turfgrass_and_Landscape_Plant_Materials/Estimating_Water_Requirements_of_Landscape_Trees.
Figure 1.
Parks and Gardens in Panaji city surveyed for this study for calculating water requirements of hedge-plants, groundcover(=lawn) and trees. .
Figure 1.
Parks and Gardens in Panaji city surveyed for this study for calculating water requirements of hedge-plants, groundcover(=lawn) and trees. .
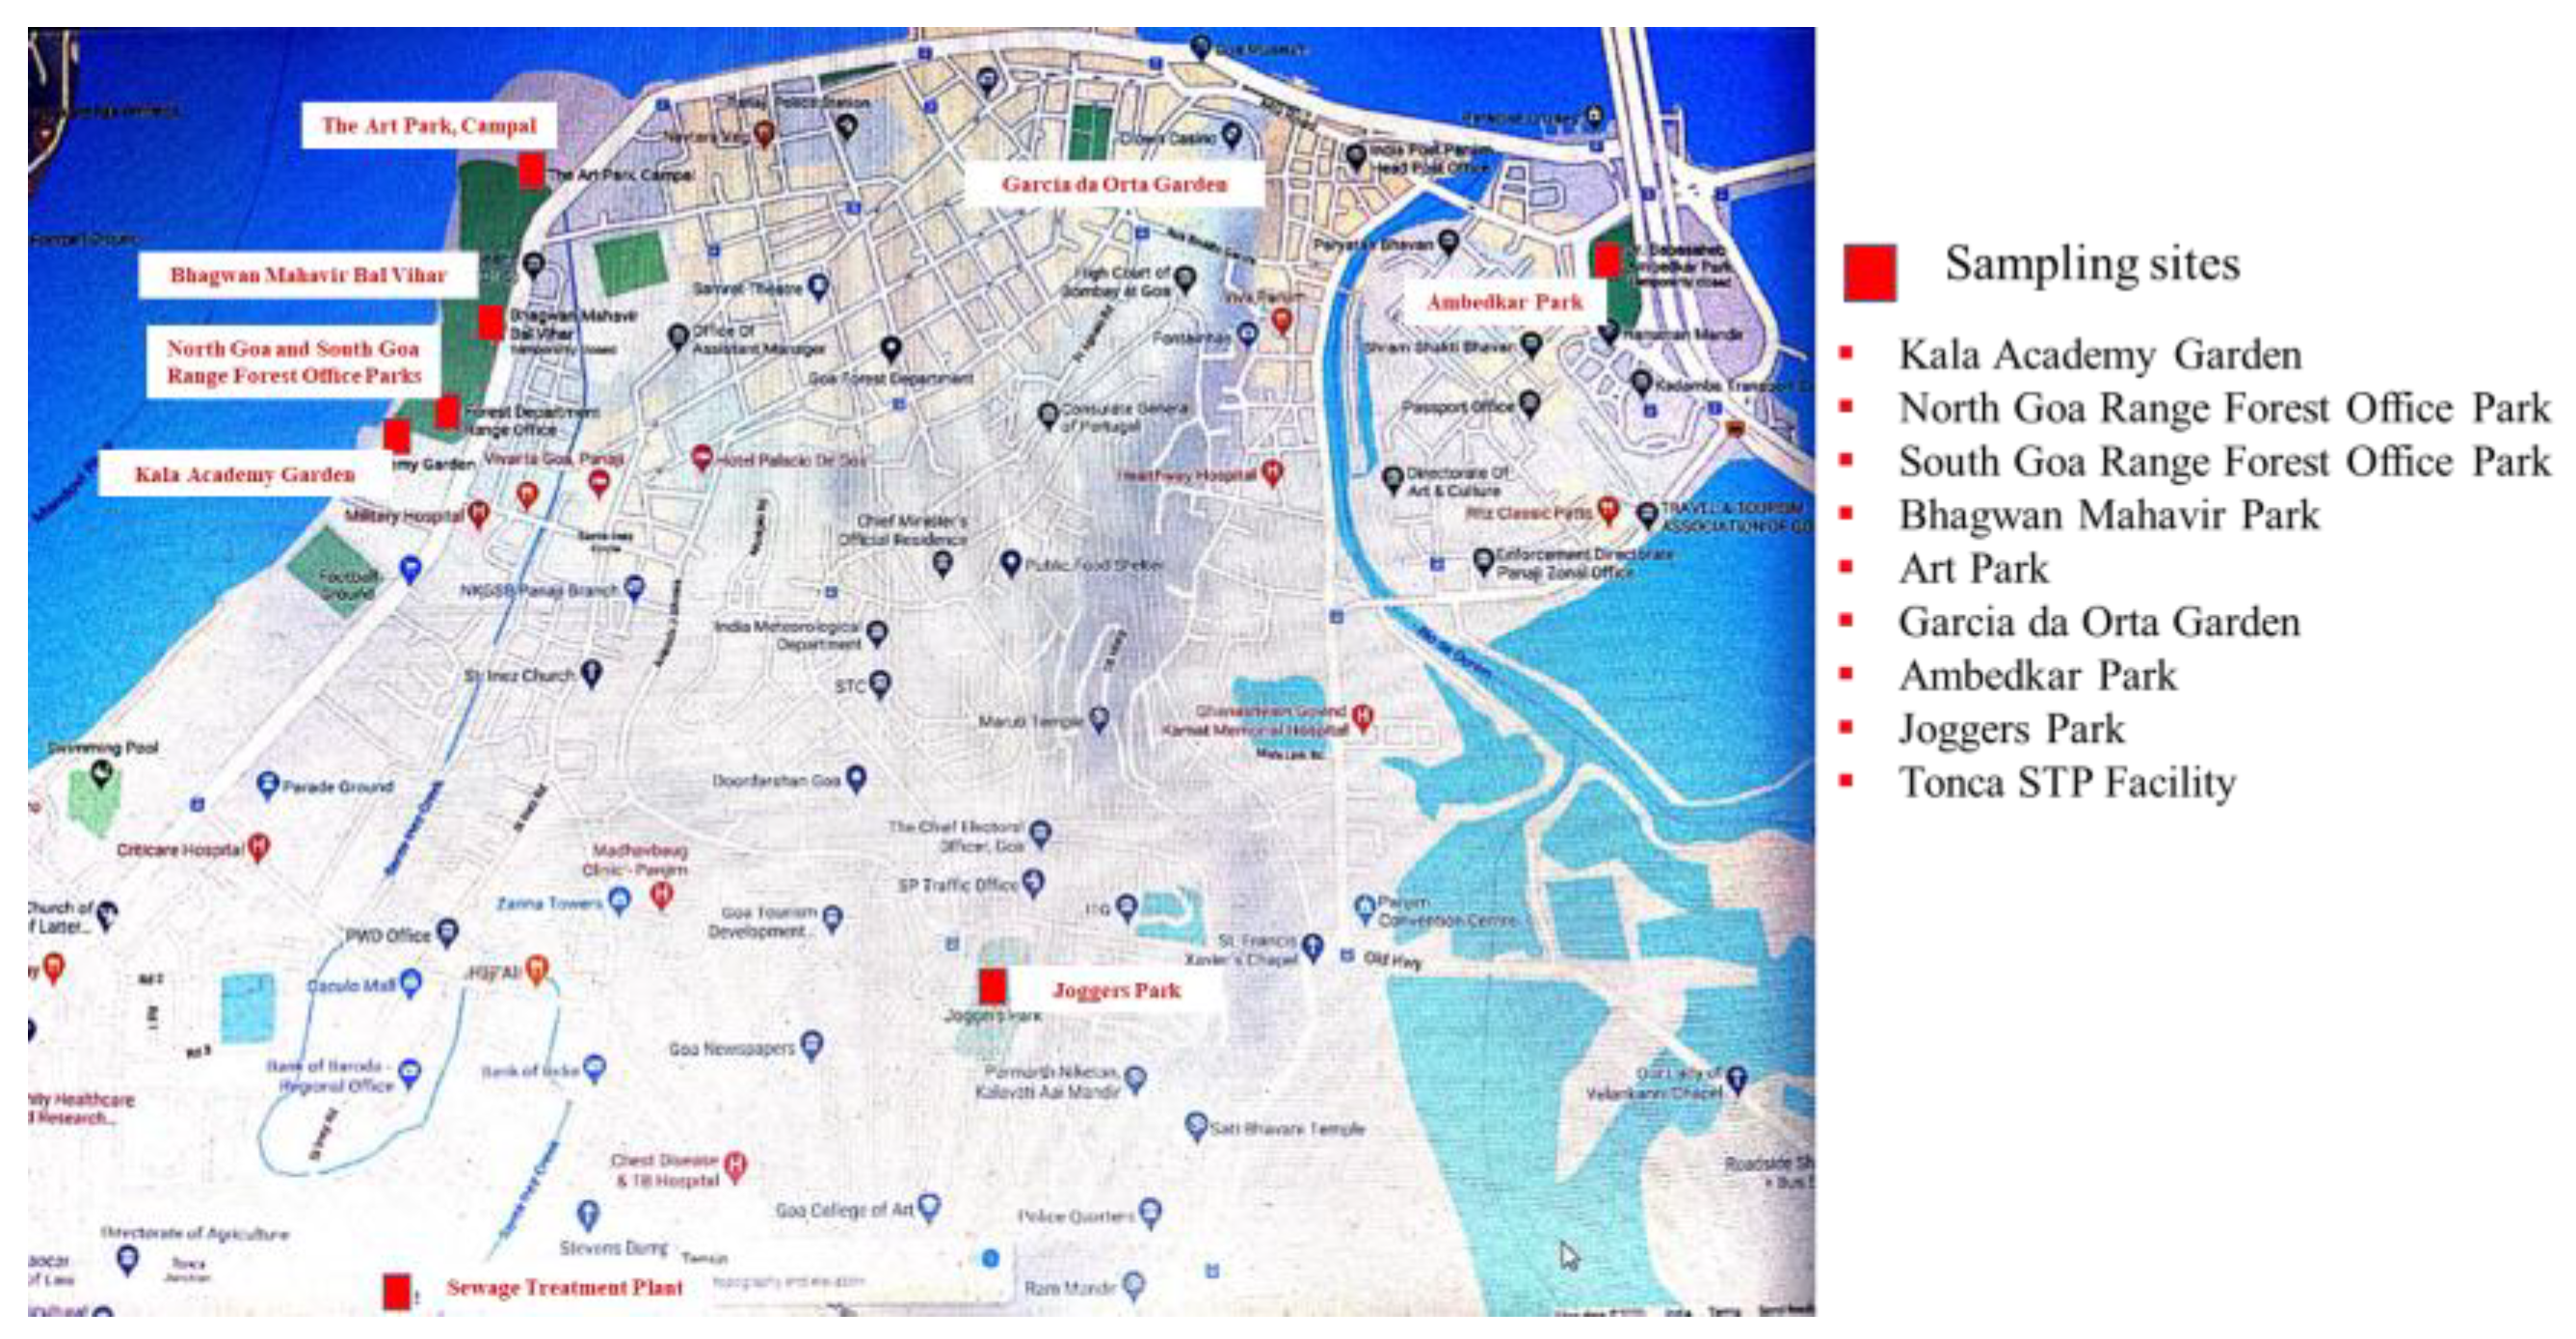
Figure 2.
Canopy areas of larger (a), medium (b), and smaller (c) sized trees in Mahavir Park in Panaji, Goa, and their daily requirement of water (L d−1).
Figure 2.
Canopy areas of larger (a), medium (b), and smaller (c) sized trees in Mahavir Park in Panaji, Goa, and their daily requirement of water (L d−1).
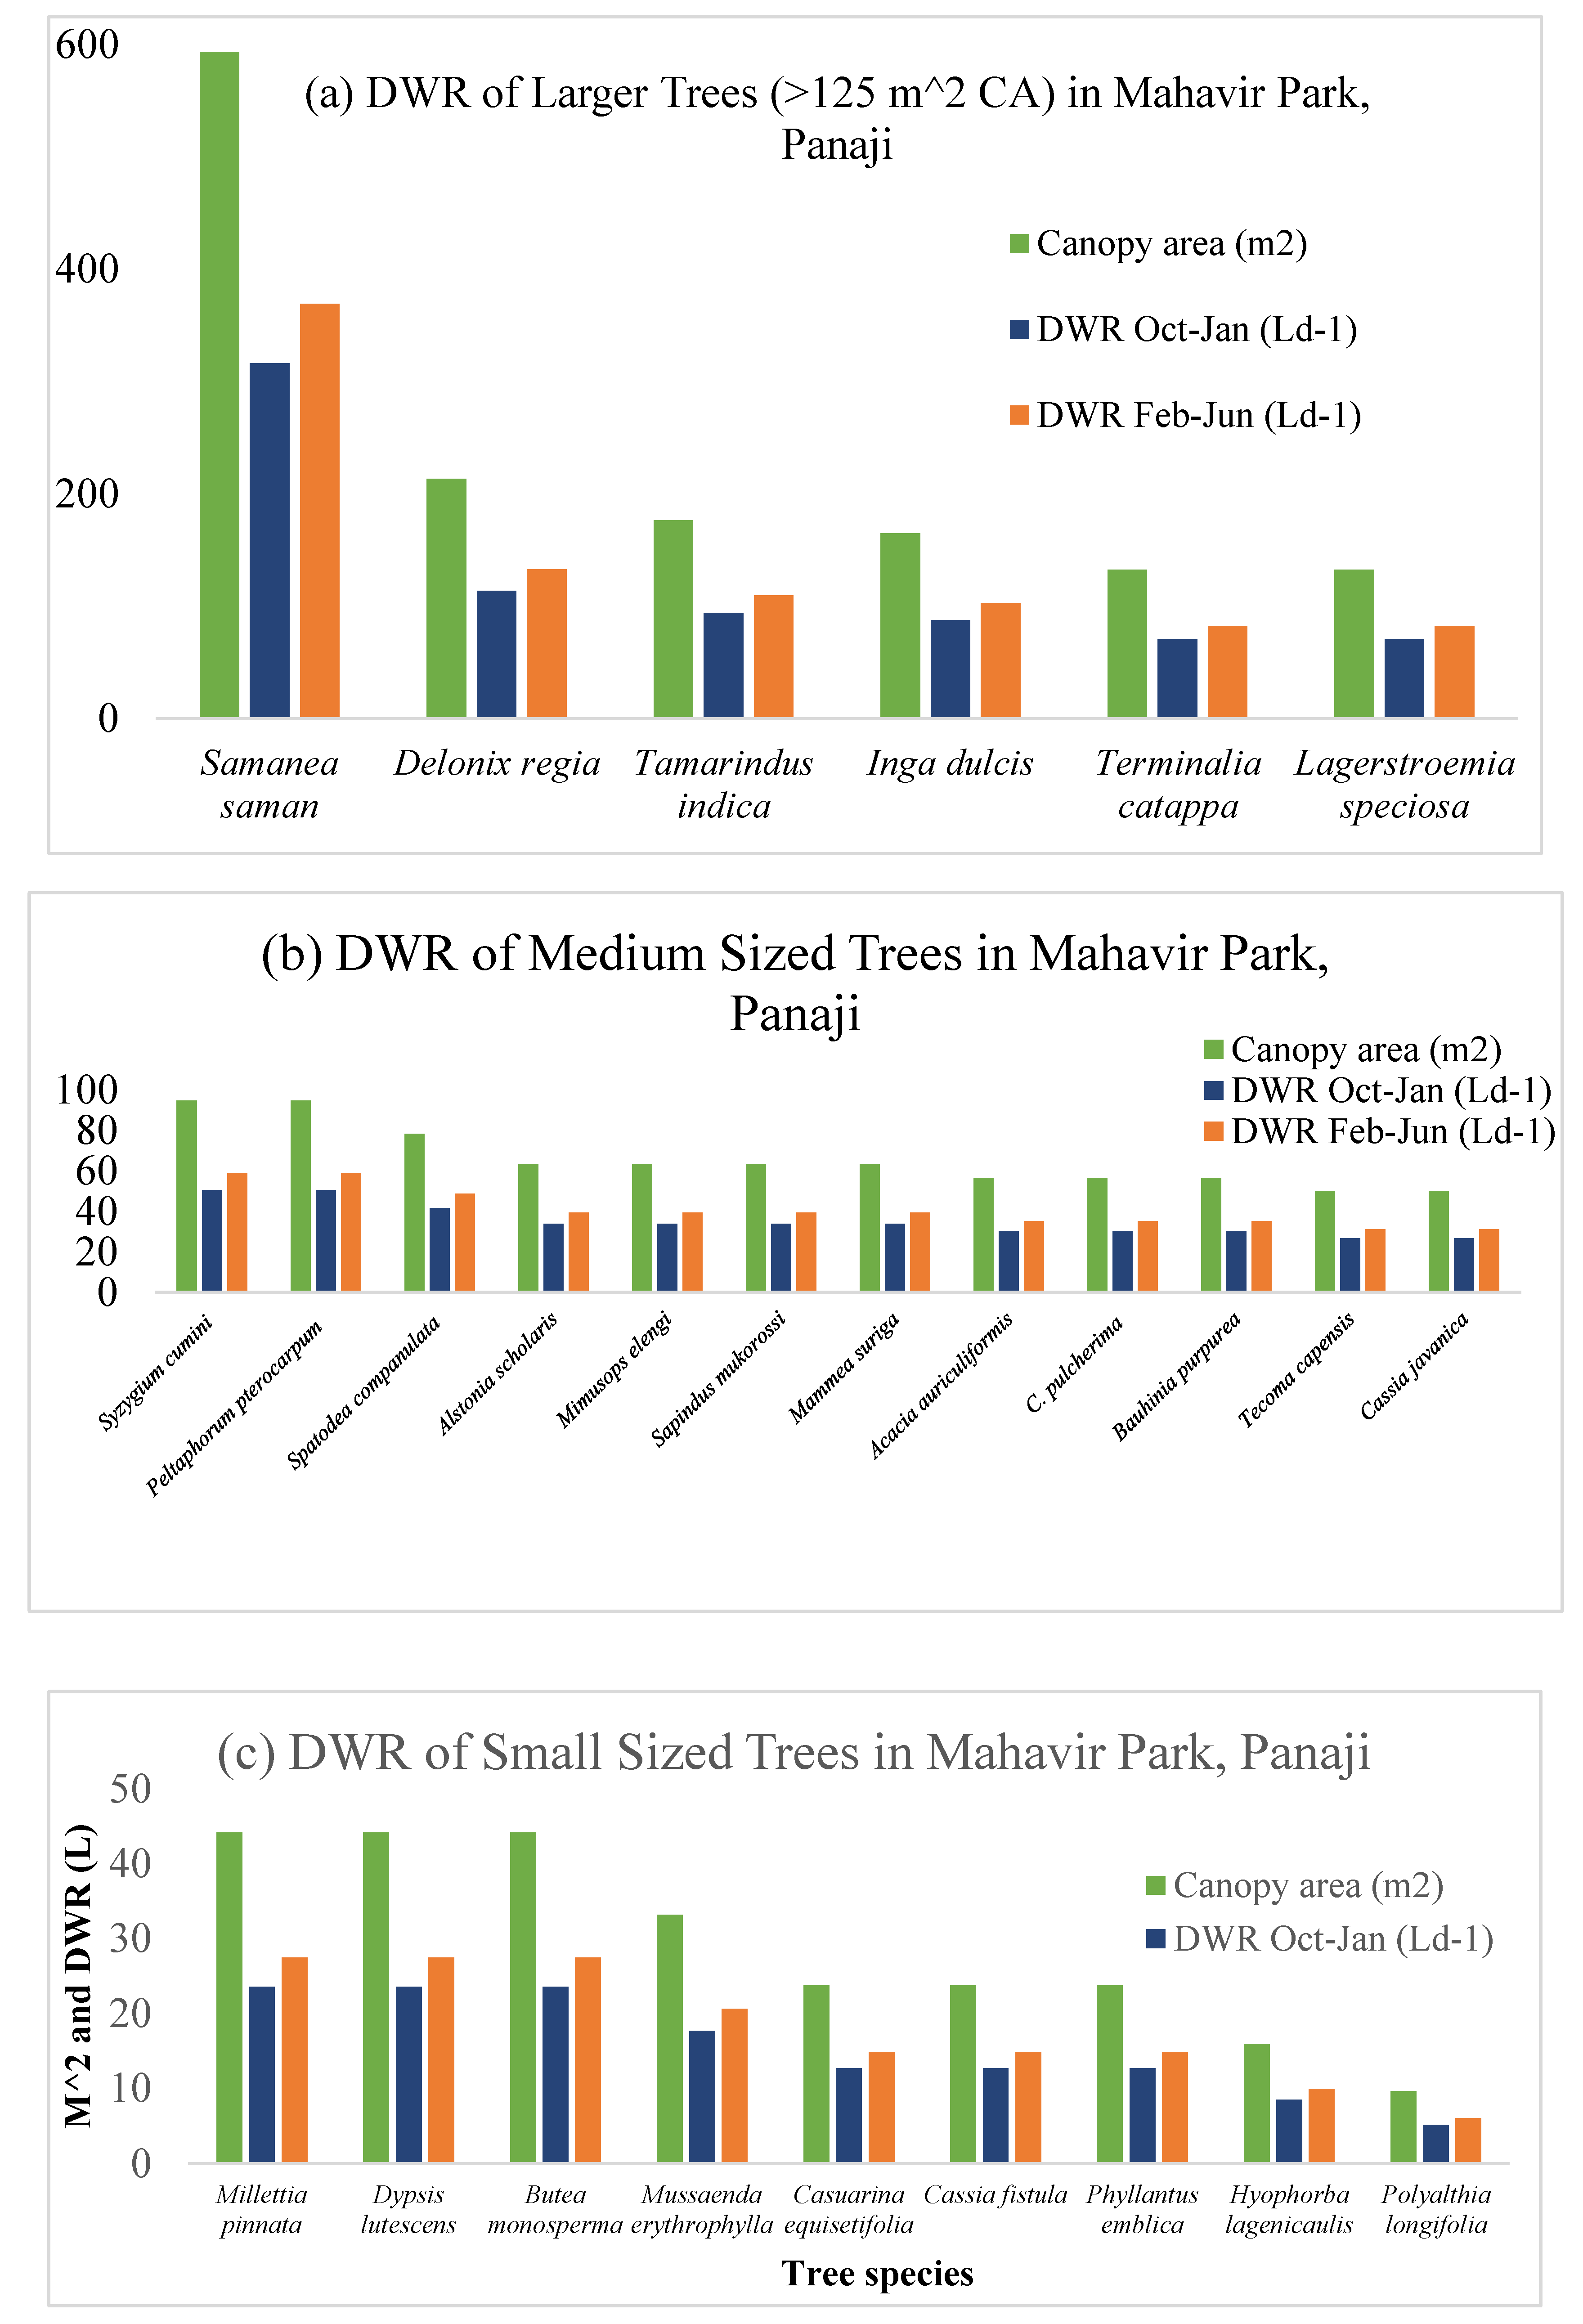
Figure 3.
Canopy areas (y-axis) of different tree species in Ambedkar Park in Panaji, Goa, and their daily requirement of water (L d−1). Species names as per the sequence in Table 4.7.
Figure 3.
Canopy areas (y-axis) of different tree species in Ambedkar Park in Panaji, Goa, and their daily requirement of water (L d−1). Species names as per the sequence in Table 4.7.
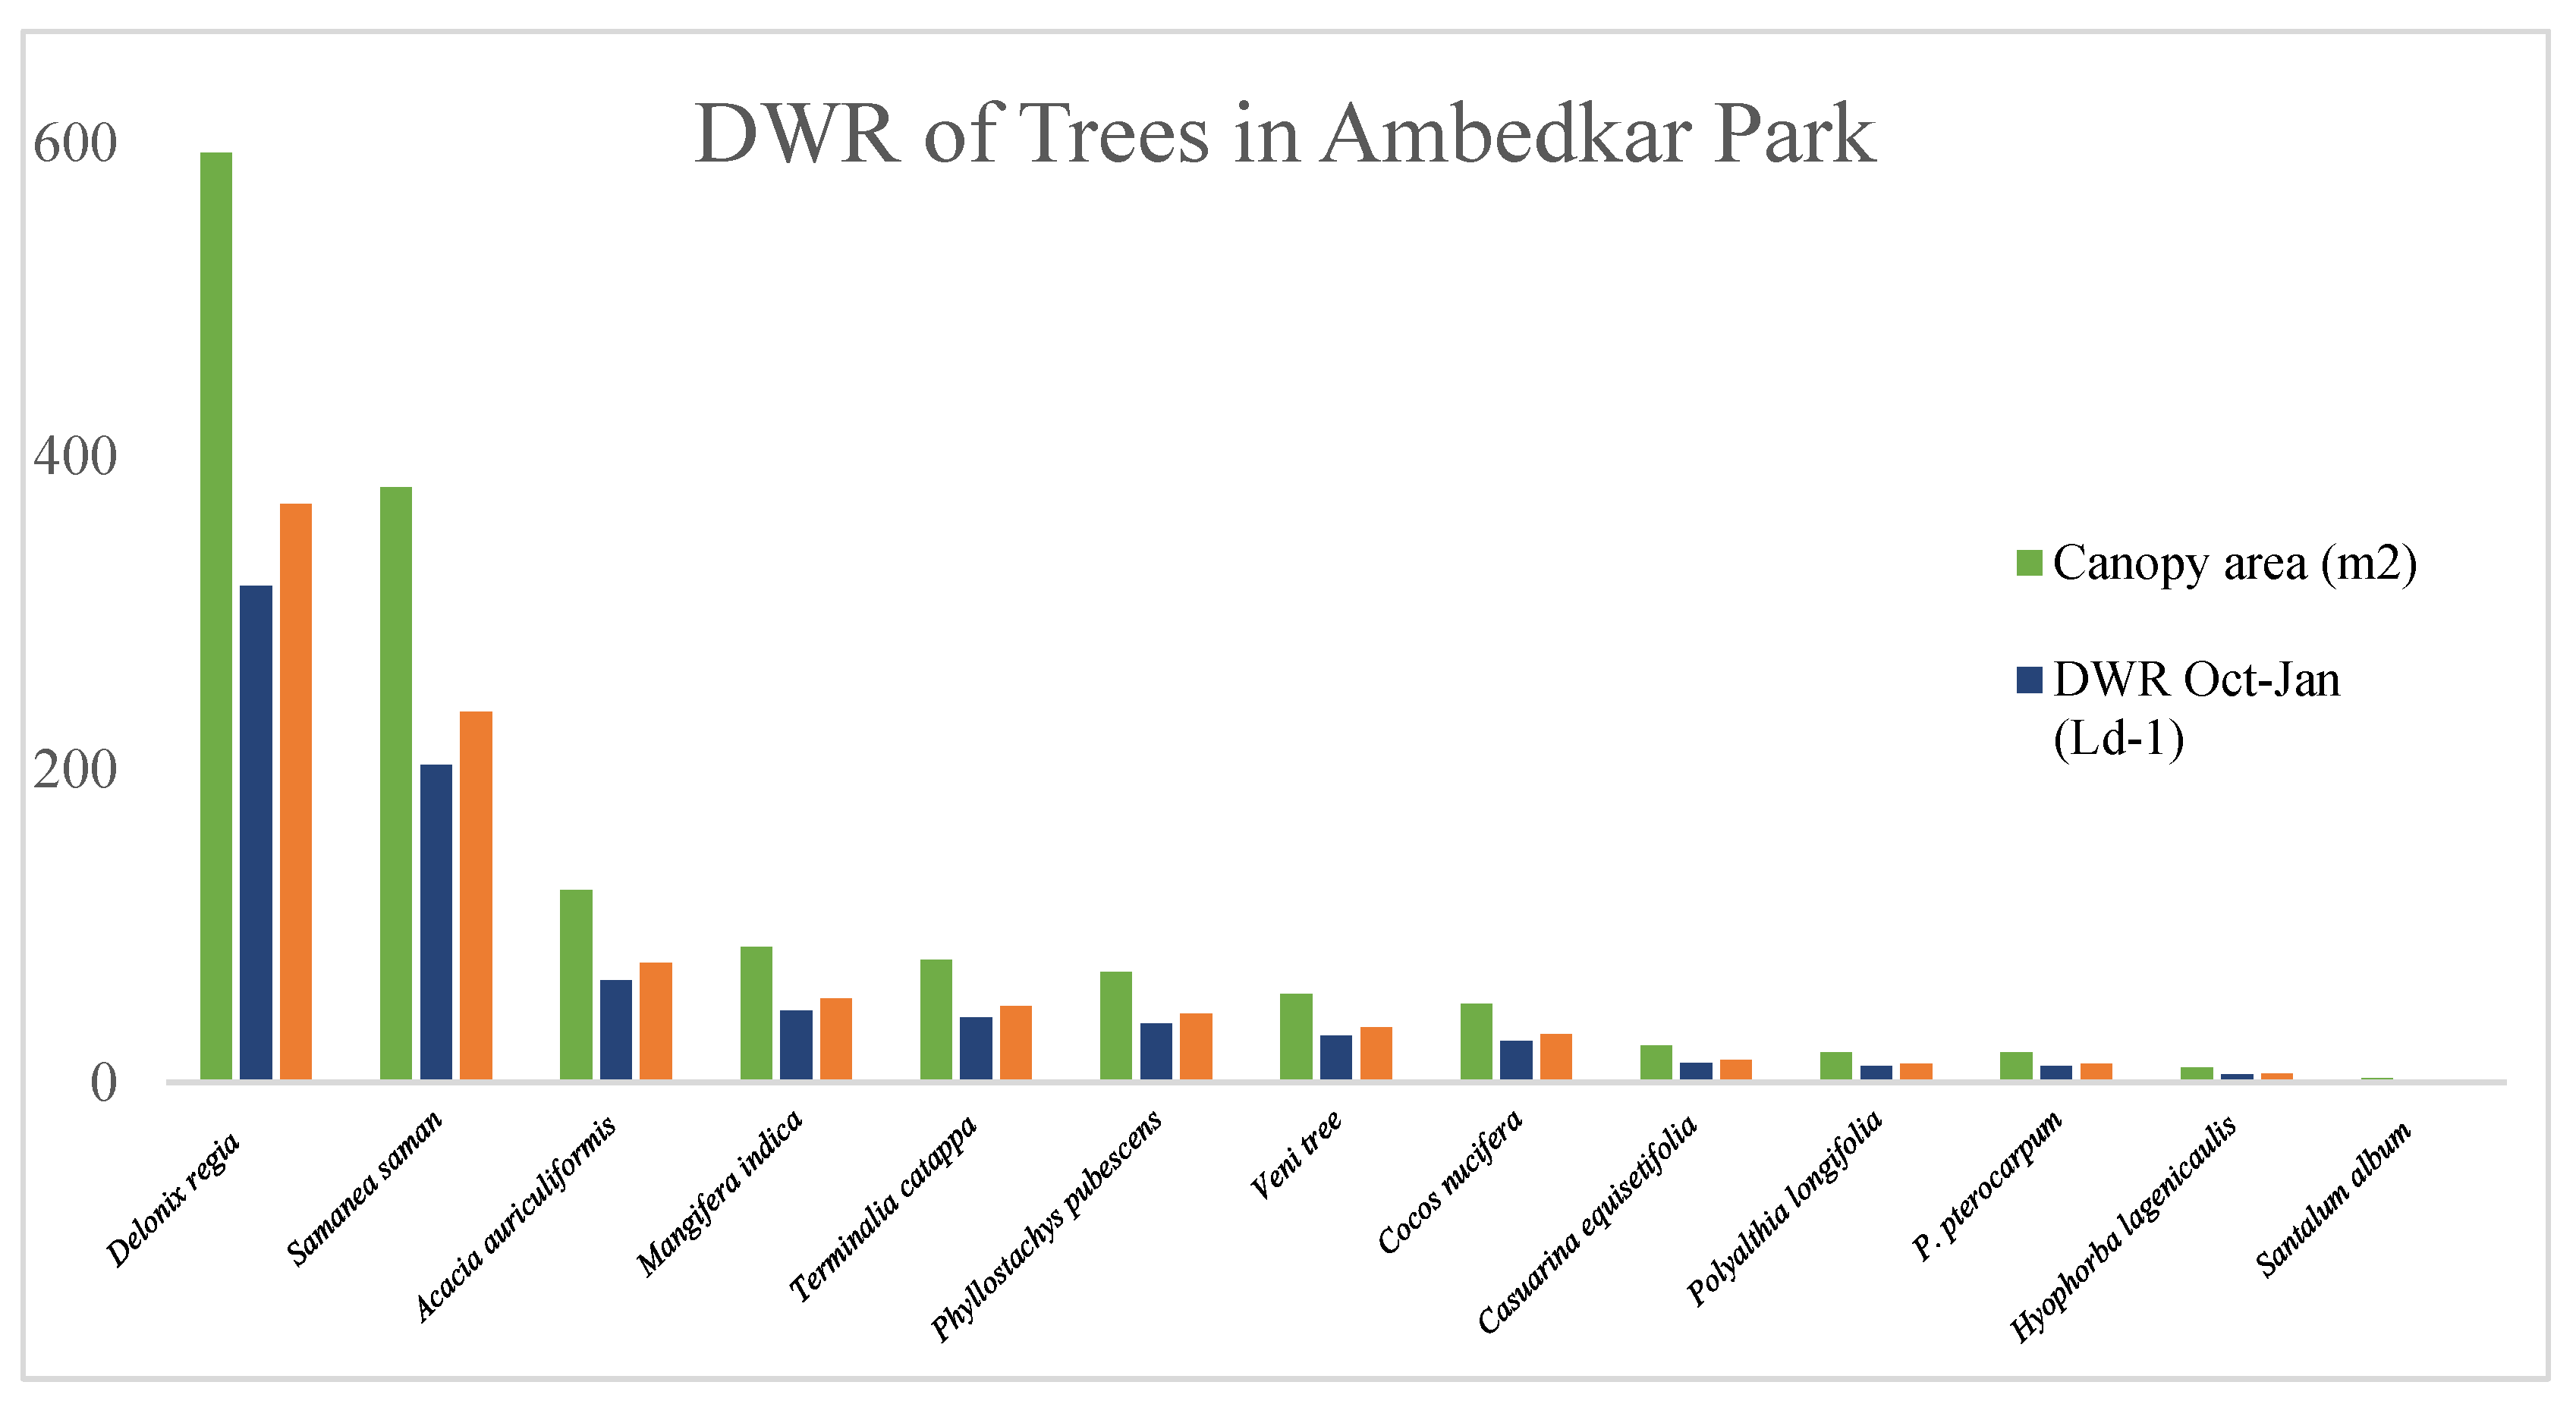
Figure 4.
Canopy areas (y-axis) of different tree species in Joggers’ Park in Panaji, Goa, and their daily requirement of water (L d−1).
Figure 4.
Canopy areas (y-axis) of different tree species in Joggers’ Park in Panaji, Goa, and their daily requirement of water (L d−1).
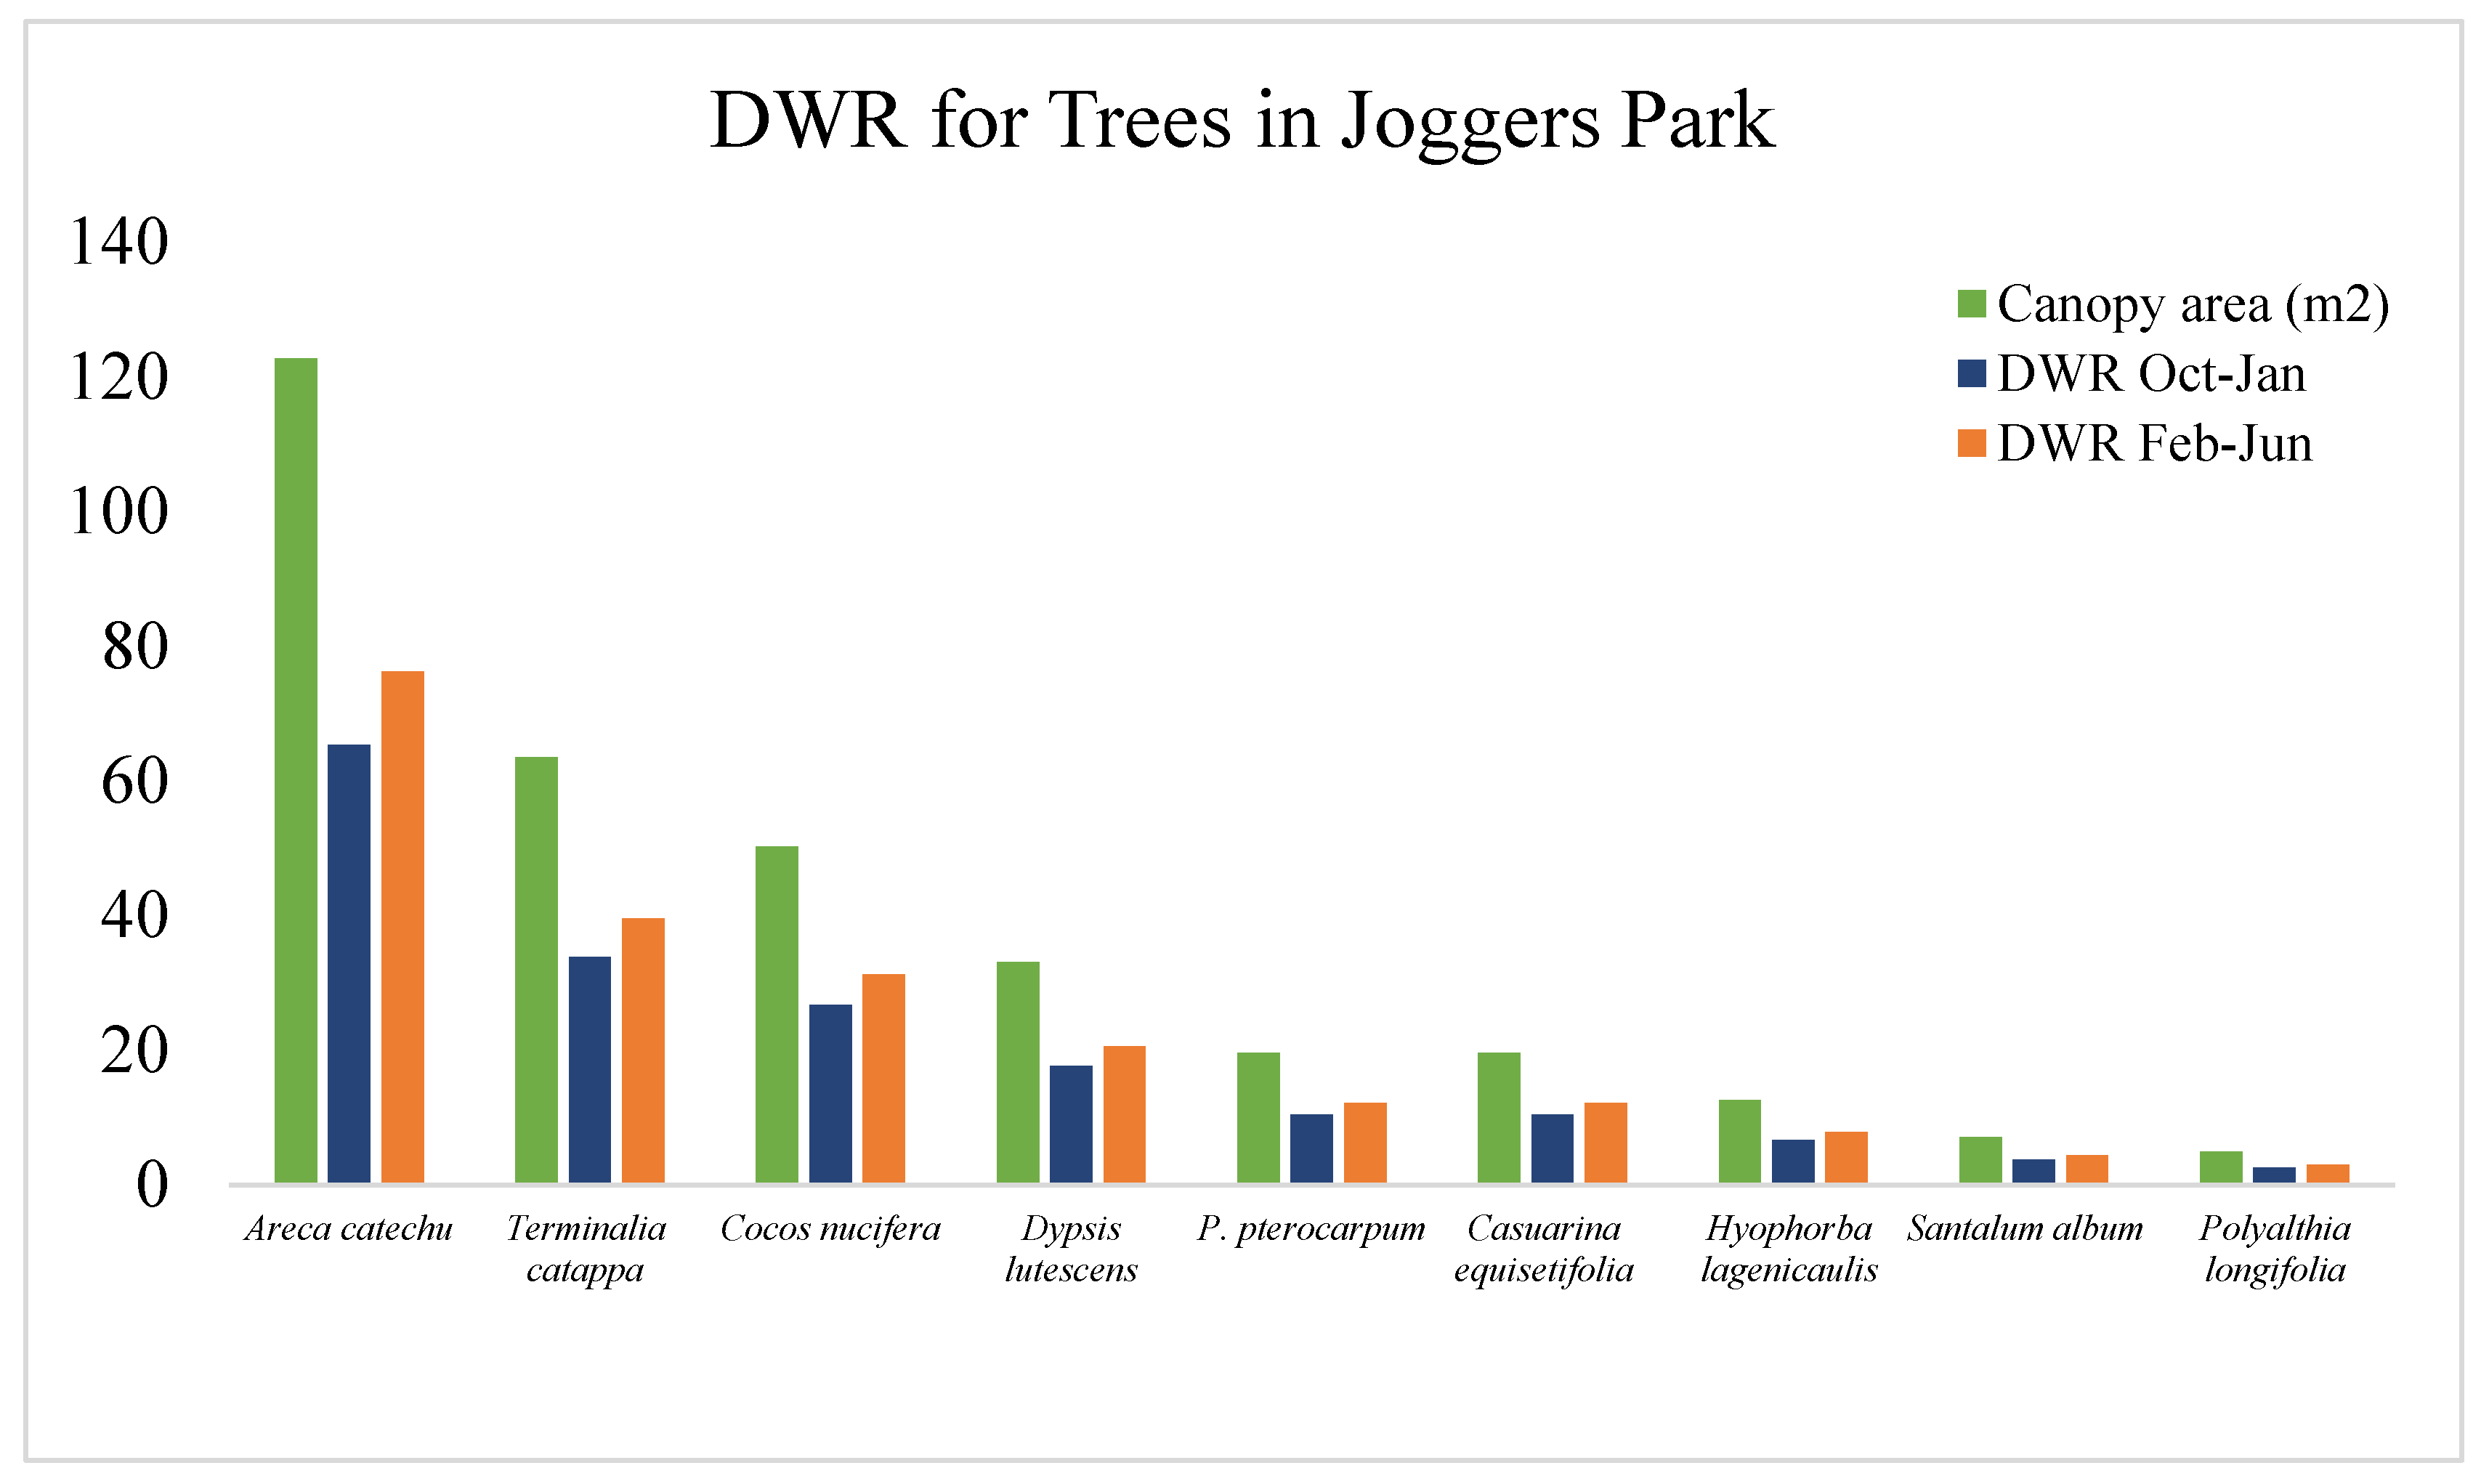
Figure 5.
Estimated landscape proportions of UGS in Panaji (within 1.86 sq km spread in 17 parks) and Tumkur (within 0.923 sq km covering 400 parks) .
Figure 5.
Estimated landscape proportions of UGS in Panaji (within 1.86 sq km spread in 17 parks) and Tumkur (within 0.923 sq km covering 400 parks) .
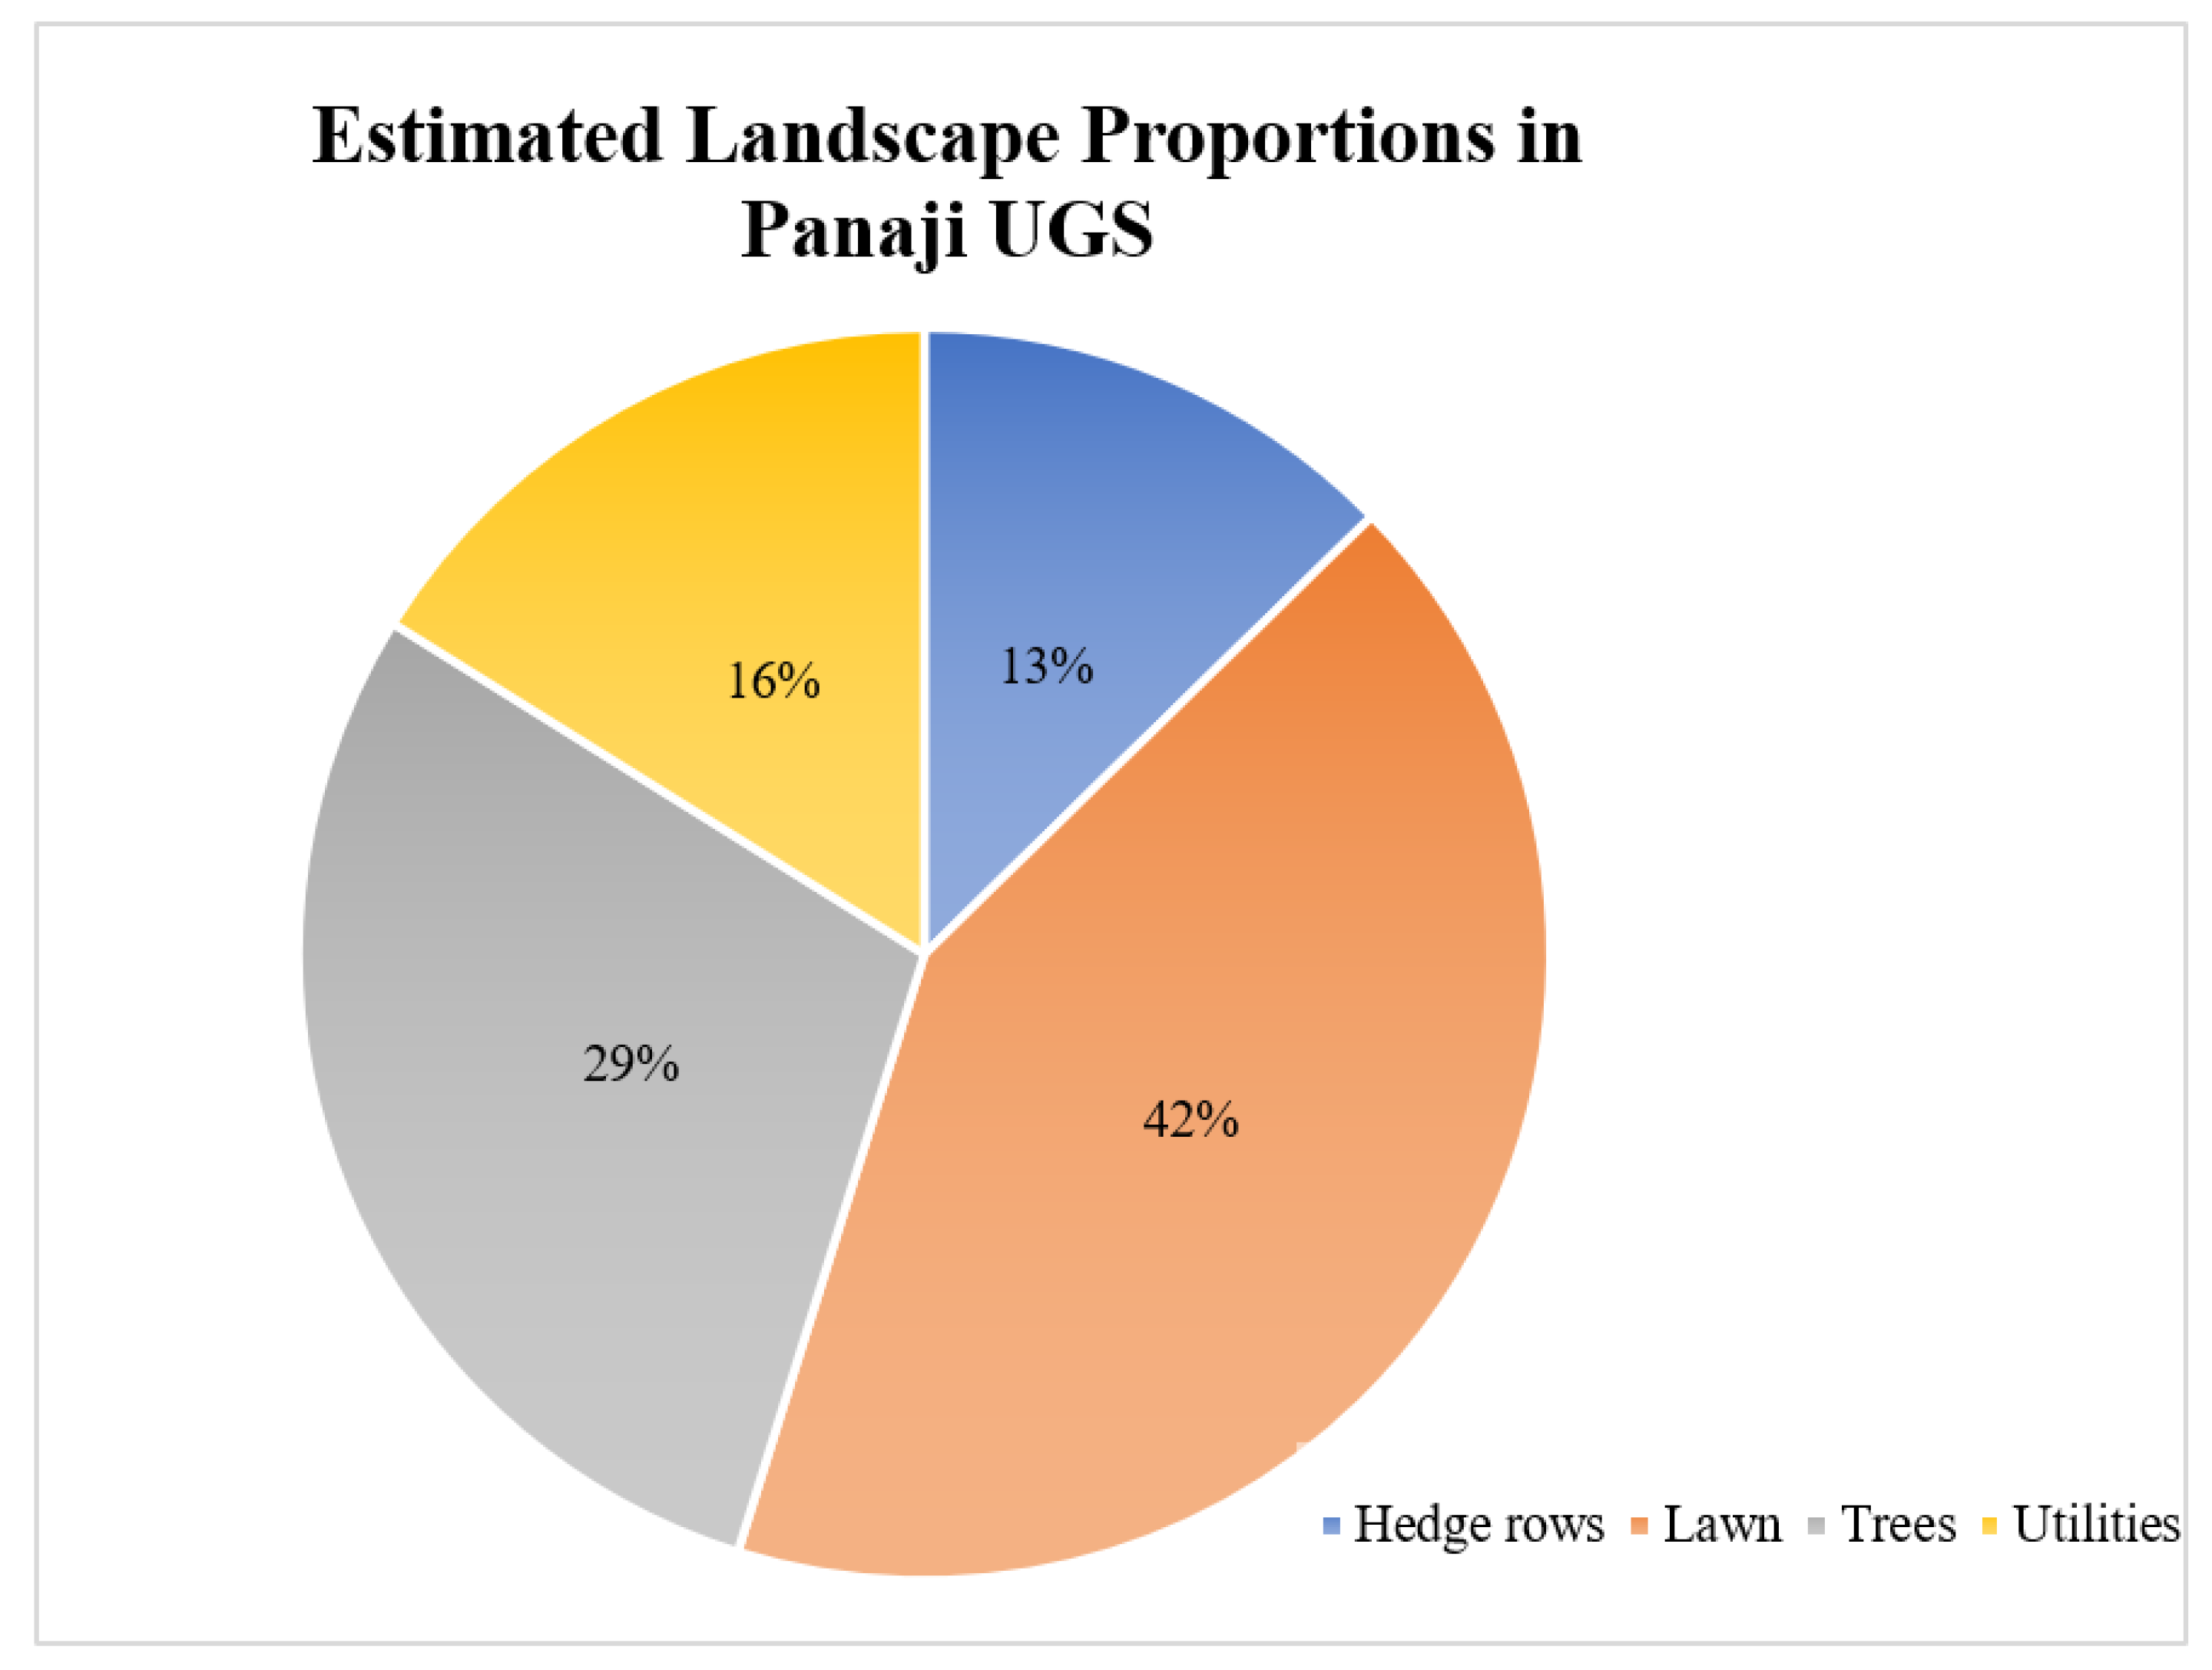
Figure 6.
Overall landscaped spaces in Panaji city.
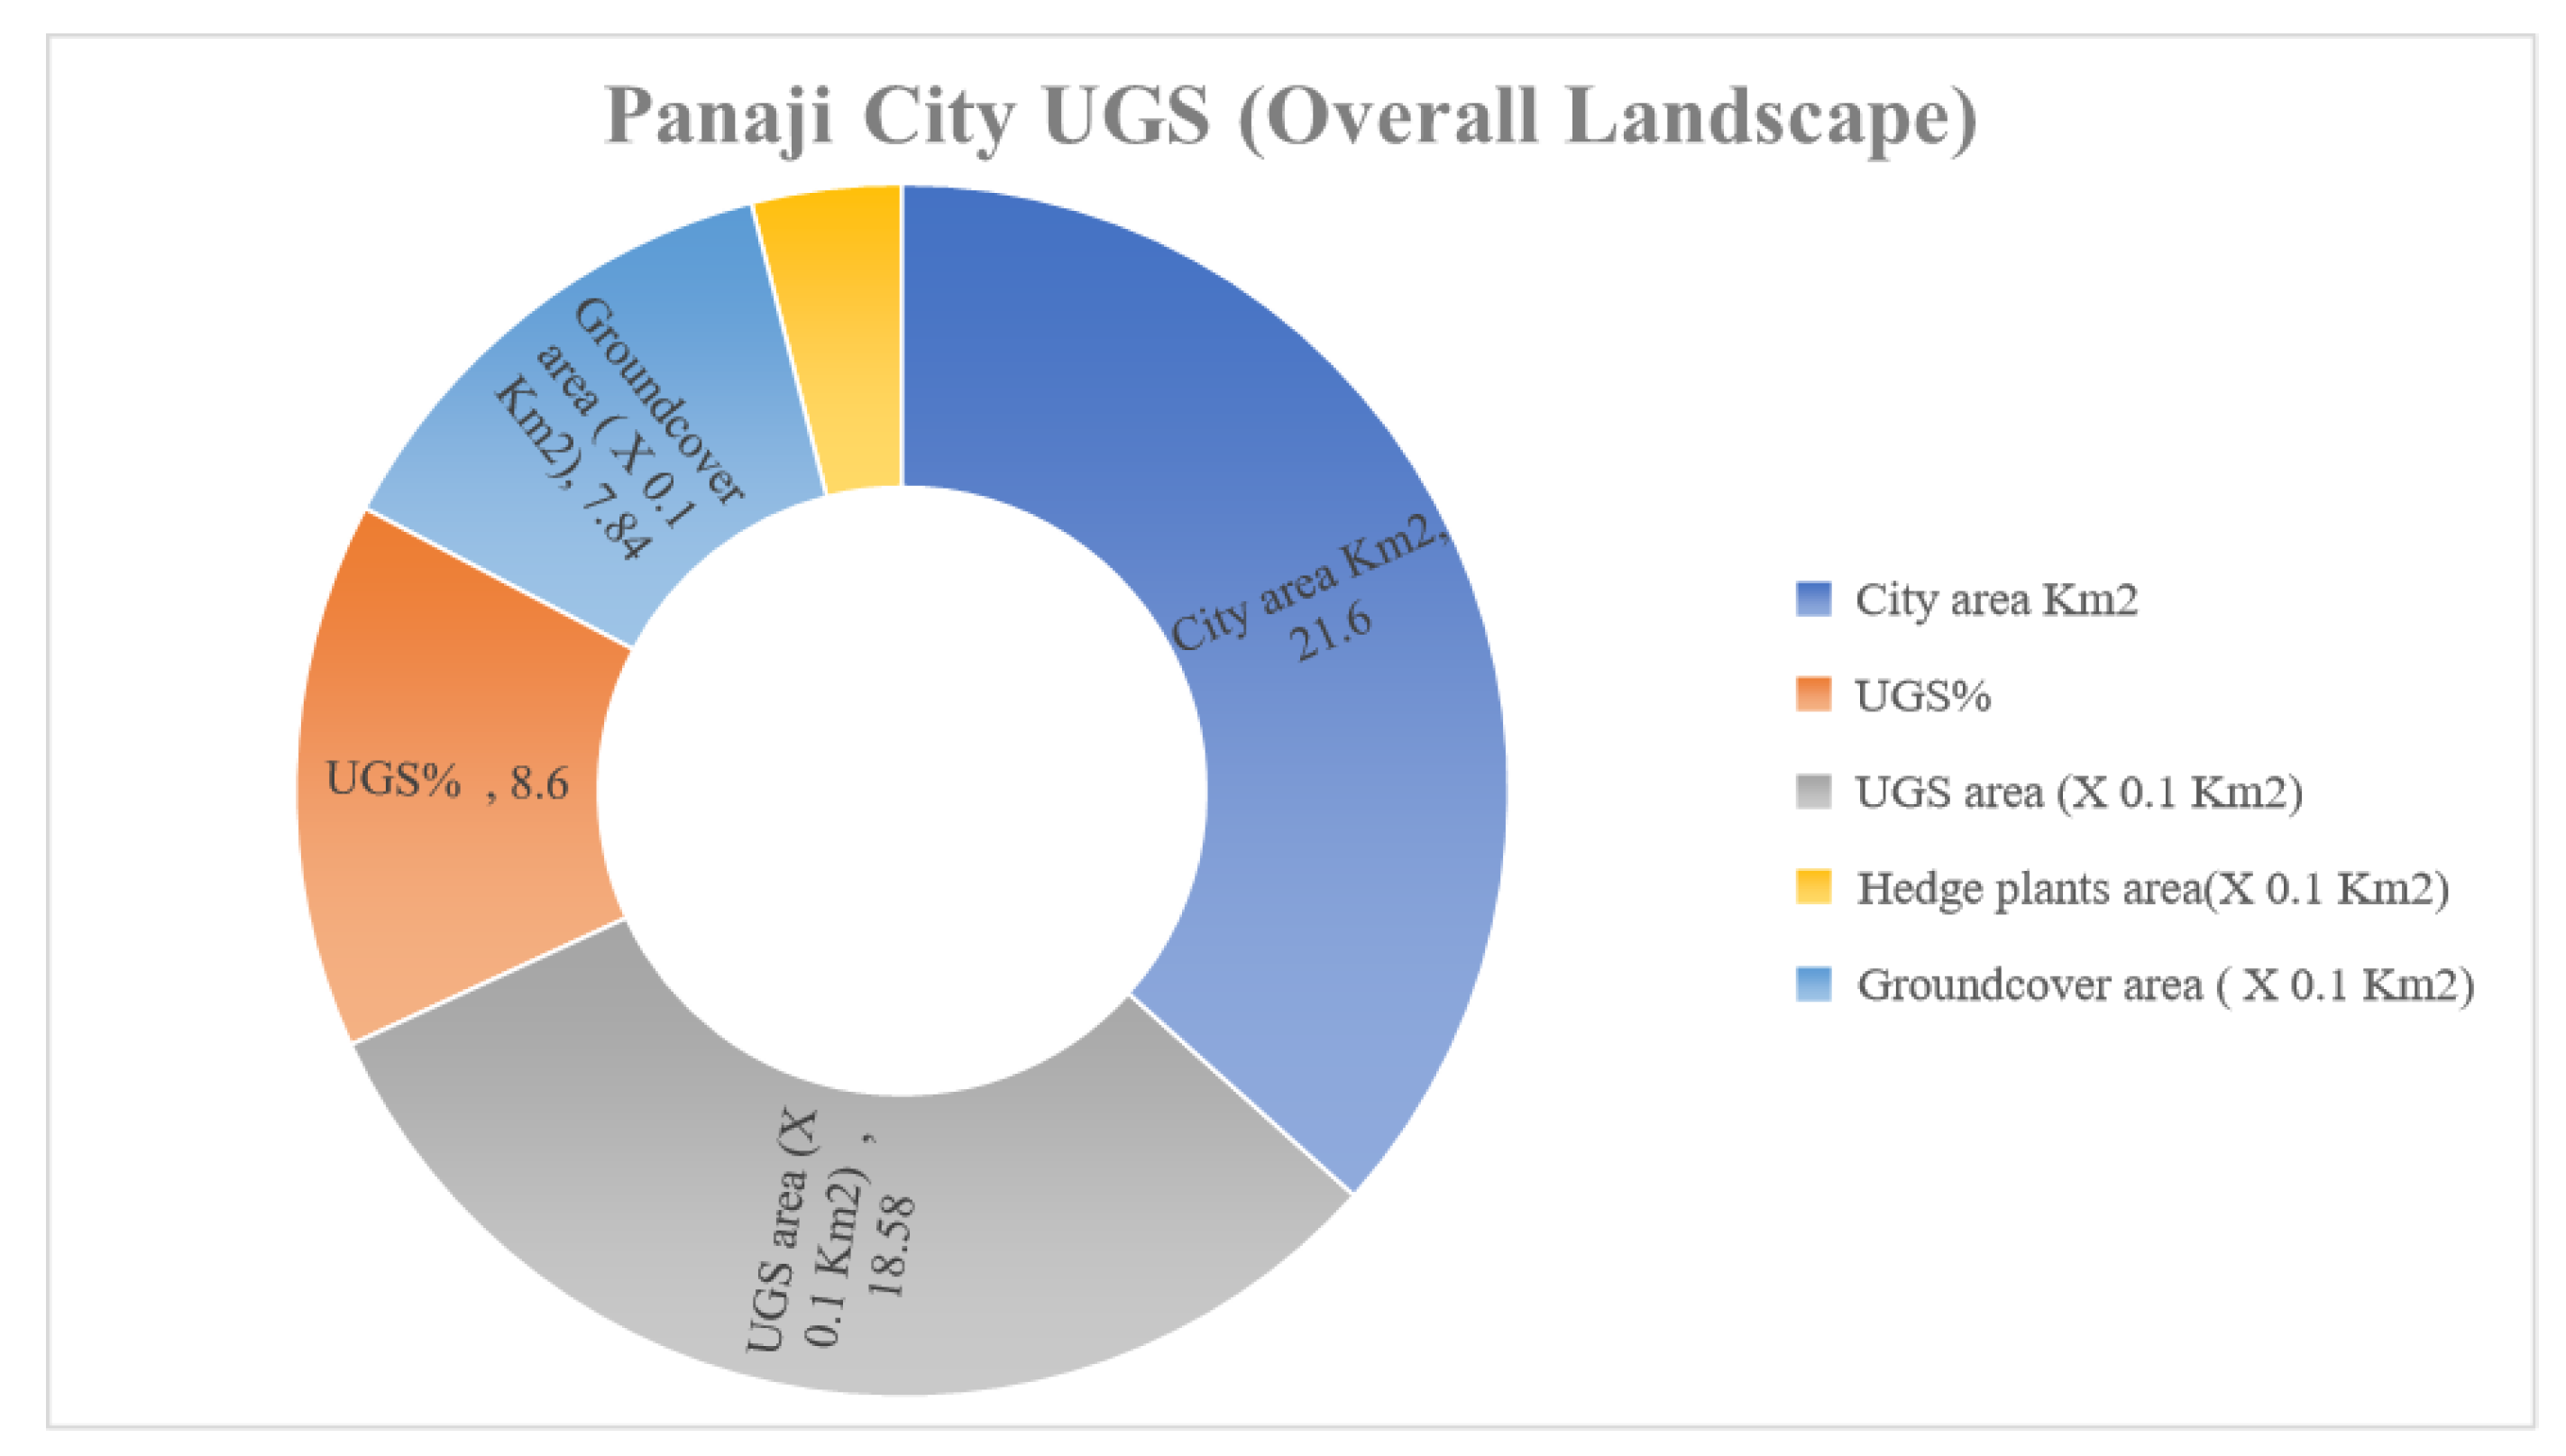
Figure 7.
Daily requirement of water (DWR in MLD) for hedge plants, lawn (=ground cover) and tress in the UGS of Panaji city.
Figure 7.
Daily requirement of water (DWR in MLD) for hedge plants, lawn (=ground cover) and tress in the UGS of Panaji city.
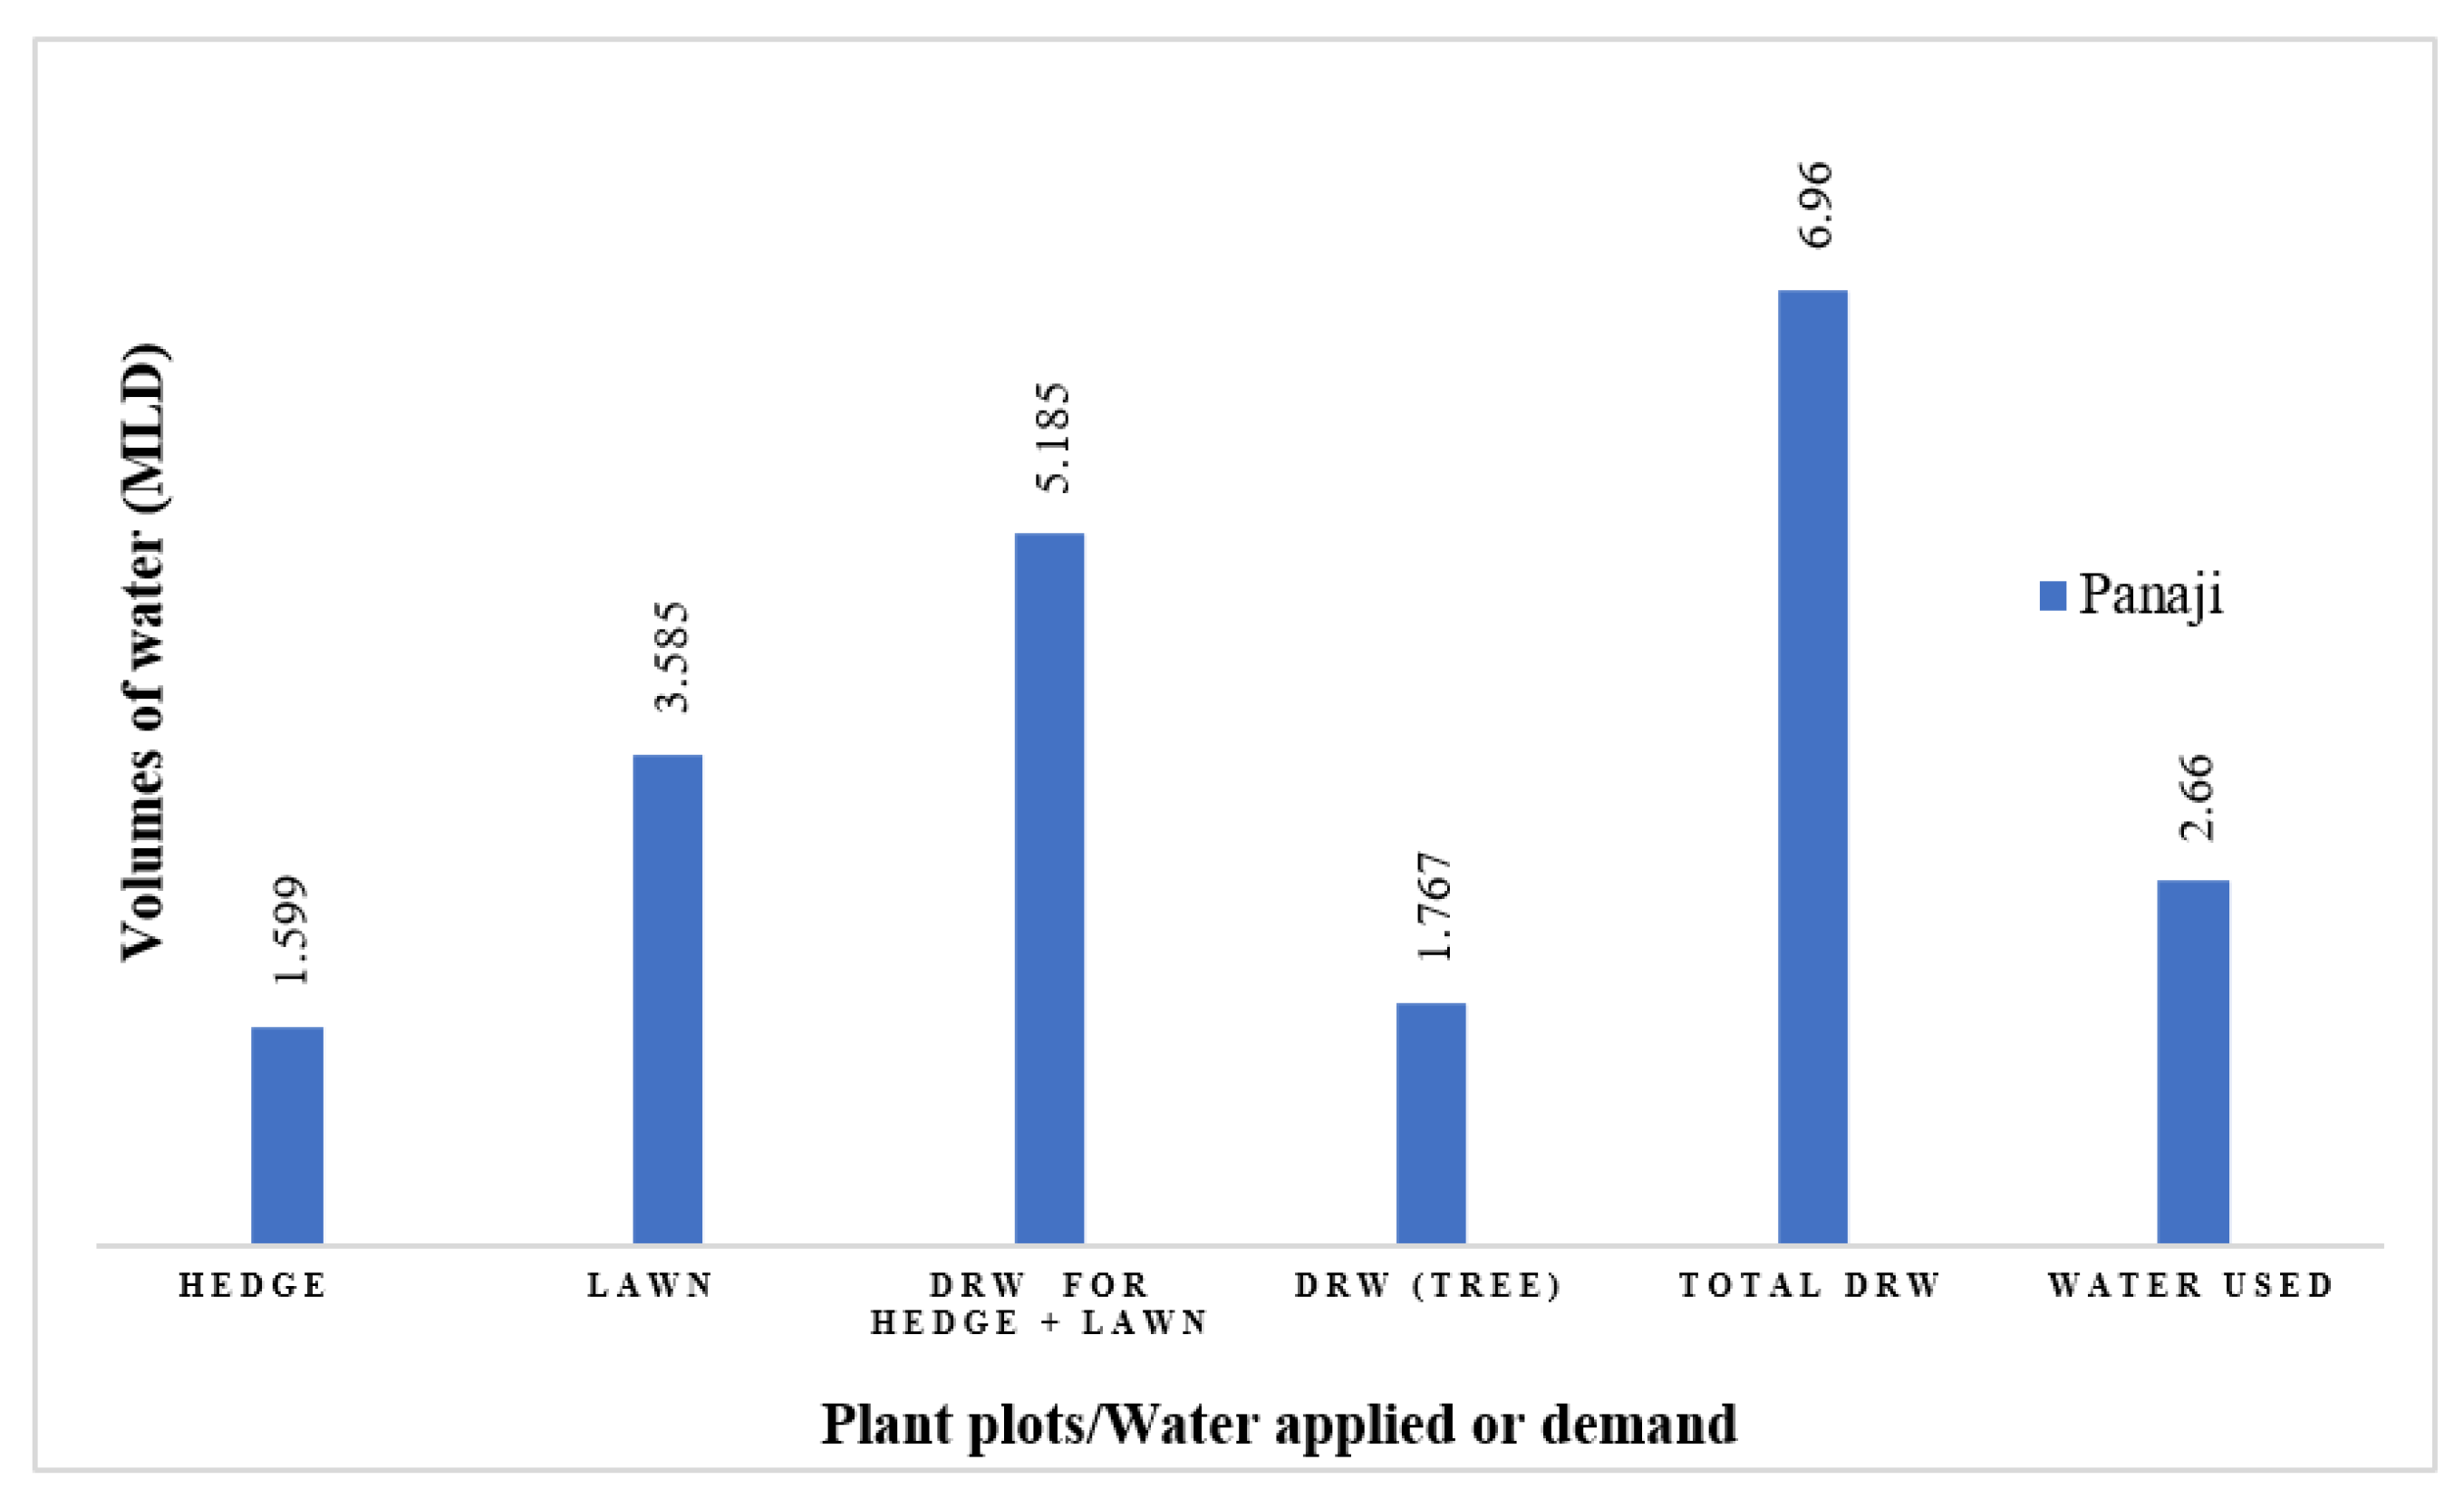
Table 1.
Important details of seven different parks surveyed for this study.
| Park | Area (m2) | No of species | Ground cover (m2) | Source of water | Daily water used (L) | Annual litter fall (tons) | #of staff | |
|---|---|---|---|---|---|---|---|---|
| Trees (Total number) | Ornamental (hedge length; m) | |||||||
| Kala Academy | 10630 | 21 (300) | 6 (400) | 2675 | Borewell | 10000 | 15 | 6 |
| North Goa Range Forest Park | 5000 | 18 (390) | 6 (200) | 2250 | Borewell | 4800 | 10 | 3 |
| South Goa Range Forest Park | 6500 | 9 (200) | 52 medicinal | 1625 | Borewell | 8400 | 6* | 5 |
| Mahavir Park | 18312 | 27 (3130) | 17 (3000) | 6410 | Borewell | 15000 | 60 | 22 |
| Art Park | 18999 | 0 | 0 | Not watered | 0 | 30 | ||
| Garcia da Orta Garden | 4000 | 12 (180) | 6 (450) | 1500 | Corporation water + Borewell | 4000 | 6 | 5 |
| Ambedkar Park | 10000 | 15 (400) | 17 (1800) | 6500 | Treated wastewater | 16000 | 25 | 12 |
| Joggers Park | 11500 | 8 (400) | 12 (2600) | 6900 | Borewell | 36000 | 12 | 22 |
*number of trees together in Mahavir Park and Art Park as per the list provided by the Park Office.
Table 2.
Monthly mean climate and related data (from FAO) solar radiation (Rs), psychometric constant (PC) maximum (Tmax) and minimum (Tmin) dew point (Td) temperature, wind speed (ws), slope of saturation vapour pressure (SVP slope), saturation vapour pressure (SVP), vapour pressure (VP), and ETo for Goa during day and night times.
| Month | Rn | PC | Tmin | Tmax | Td | ws (m s−1) |
SVP slope kPa K−1 |
SVP | VP e, kPa | EToG day-time |
EToG night-time |
|---|---|---|---|---|---|---|---|---|---|---|---|
| Jan | 28.9 | 0.067 | 20.3 | 31.5 | 19 | 1.194 | 0.198 | 3.36 | 3.4 | 8.213 | 6.829 |
| Feb | 32.3 | 0.067 | 21.0 | 31.4 | 20 | 1.278 | 0.201 | 3.39 | 3.4 | 9.180 | 7.564 |
| Mar | 35.7 | 0.067 | 23.4 | 32.1 | 23 | 1.278 | 0.218 | 3.78 | 3.7 | 10.395 | 8.500 |
| Apr | 38.1 | 0.067 | 25.8 | 33 | 24 | 1.472 | 0.236 | 4.17 | 4.1 | 11.233 | 9.227 |
| May | 38.7 | 0.067 | 27.0 | 33.4 | 25 | 2.083 | 0.245 | 4.35 | 4.3 | 11.199 | 8.676 |
| Jun | 38.6 | 0.067 | 25.2 | 30.8 | 25 | 1.833 | 0.22 | 3.78 | 3.8 | 10.947 | 8.556 |
| July | 38.5 | 0.067 | 24.6 | 29.3 | 25 | 2.861 | 0.209 | 3.57 | 3.6 | 10.193 | 7.135 |
| Aug | 38.1 | 0.067 | 24.4 | 29 | 25 | 2.639 | 0.206 | 3.53 | 3.6 | 10.147 | 7.230 |
| Sep | 36.4 | 0.067 | 24.2 | 29.6 | 25 | 1.556 | 0.208 | 3.58 | 3.6 | 10.296 | 8.236 |
| Oct | 33.2 | 0.067 | 24.0 | 31.2 | 24 | 0.972 | 0.216 | 3.76 | 3.7 | 9.799 | 8.469 |
| Nov | 29.6 | 0.067 | 22.4 | 32.2 | 22 | 1.056 | 0.212 | 3.75 | 3.6 | 8.655 | 7.384 |
| Dec | 27.9 | 0.067 | 21.0 | 32 | 20 | 0.917 | 0.204 | 3.46 | 3.5 | 8.126 | 7.037 |
Table 3.
Details of garden/park areas, different UGS parameters from sampled parks in Panaji, Goa.
| Park | Kala Academy | NGRF Office Park | SGRF Office Park | Mahavir Park+Art Park | Garcia da Orta Garden | Ambedkar Park | Joggers Park |
|---|---|---|---|---|---|---|---|
| Total Area (m2) | 10630 | 5000 | 6500 | 37211 | 4000 | 10000 | 11500 |
| Trees (n^) | 250 | 290 | 180 | 3130 | 150 | 480 | 400 |
| Hedge area (m2) | 360 | 160 | 800 | 2700 | 405 | 1620 | 2340 |
| lawn (m2) | 2675 | 2250 | 1625 | 6410 | 1500 | 6500 | 6900 |
| Road/lanes/parking lot (m2) | 4300 | 1200 | 2800 | 6000 | 600 | 750 | 2500 |
| Hedges area (%) [A] | 3.39 | 3.20 | 12.31 | 7.26 | 10.13 | 16.2 | 20.35 |
| Lawn area (%) [B] | 25.17 | 45 | 25.00 | 17.23 | 37.50 | 65 | 42.61 |
| Road/parking area (%) [C] | 40.46 | 24 | 43.08 | 16.13 | 15.00 | 7.50 | 21.74 |
| sum of [A]+ [B] +[C] | 69.01 | 72.20 | 80.38 | 40.61 | 62.62 | 88.70 | 84.70 |
| Area covered by trees (%) | 31.99 | 27.80 | 19.62 | 59.39 | 37.38 | 11.30 | 15.30 |
| Area covered by trees (m2) | 3295 | 1390 | 1275 | 22101 | 1495 | 1130 | 1760 |
| No of trees | 250 | 290 | 180 | 3130 | 150 | 480 | 400 |
| Area available per tree (m2) | 13.18 | 4.79 | 7.08 | 7.09 | 9.97 | 2.36 | 4.40 |
Table 4.
Details of numbers of trees, hedge areas and groundcover in different parks/gardens in Panaji, and their daily water requirement derived using the evapotranspiration factor of 0.889 mm d−1.
Table 4.
Details of numbers of trees, hedge areas and groundcover in different parks/gardens in Panaji, and their daily water requirement derived using the evapotranspiration factor of 0.889 mm d−1.
| Park$ | Area (m2) | Trees (n^) |
Hedge area (m2) | lawn (m2) | Current supply (LPD) | Daily Water Requirement (Litres per Day. LPD) | |||
|---|---|---|---|---|---|---|---|---|---|
| Trees# | Hedges | Lawn | Demand | ||||||
| Kala Academy | 10630 | 250 | 360 | 2675 | 10000 | 5991.25 | 2437.20 | 12224.75 | 20653.20 |
| NGRF Office Park | 5000 | 290 | 160 | 2250 | 4800 | 6949.85 | 1083.20 | 10282.50 | 18315.55 |
| SGRF office Park | 6500 | 180 | 800* | 1625 | 6000 | 4313.70 | 5416.00 | 7426.25 | 17155.95 |
| Mahavir Park+Art Park | 37211 | 3130 | 2700 | 6410 | 8400 | 75010.45 | 18279.00 | 29293.70 | 122583.20 |
| Garcia da Orta Garden | 4000 | 150 | 405 | 1500 | 15000 | 3594.75 | 2741.85 | 6855.00 | 13191.60 |
| Ambedkar Park | 10000 | 480 | 1620 | 6500 | 4000 | 11503.20 | 10967.40 | 29705.00 | 52175.60 |
| Joggers Park | 11500 | 400 | 2340 | 6900 | 16000 | 9586.00 | 15841.80 | 31533.00 | 56960.80 |
| Total | 84841 | 4880 | 8385 | 27860 | 64200 | 116949.20 | 56766.45 | 127320.20 | 301035.90 |
$Data collected through personal visit. ^rounded off to lower 10s (for example 404 in Joggers Park rounded to 400); #currently no direct watering of trees except for a small number nearer the hedge lanes or groundcover. Daily demand of water estimated at an average of 24 litres per tree (see later), *nursery plot including narrow access lanes for watering, nursing/caring or for picking out the saplings for sale or free distribution.
Table 5.
Details of different tree species from Mahavir Park, Panaji, Goa. It is to be noted that canopy area is the main parameter useful for DWR. .
Table 5.
Details of different tree species from Mahavir Park, Panaji, Goa. It is to be noted that canopy area is the main parameter useful for DWR. .
| Tree (scientific name) | Number | Height (m; range) | Canopy dia (m; Range) | Girth circumference (cm) |
||
|---|---|---|---|---|---|---|
| n | Mean | ±SD | ||||
| Casuarina (Casuarina equisetifolia) | 1485 | 18-22 | 5-6 | 23 | 102.35 | 19.24 |
| Acacia (Acacia auriculiformis) | 510 | 7-10 | 8-9 | 18 | 129.56 | 13.81 |
| Karanj (Millettia pinnata) | 294 | 15-18 | 7-8 | 15 | 126.73 | 21.3 |
| Shankar (Caesalpinia pulcherima) | 147 | 8-11 | 8-9 | 12 | 101.67 | 10.47 |
| Badam (Terminalia catappa) | 129 | 6-8 | 12-14 | 12 | 102.92 | 8.908 |
| Ashok (Polyalthia longifolia) | 89 | 6-9 | 3-4 | 10 | 76.40 | 6.168 |
| Apto (Bauhinia purpurea) | 87 | 11-15 | 8-9 | 11 | 119.18 | 17.14 |
| Jambal (Syzygium cumini) | 74 | 9-11 | 10-12 | 11 | 124.09 | 21.61 |
| Tecoma (Tecoma capensis) | 53 | 7-9 | 7-9 | 11 | 112.36 | 14.42 |
| Gulmohar (Delonix regia) | 44 | 16-19 | 15-18 | 10 | 198.10 | 15.99 |
| Saton (Alstonia scholaris) | 27 | 8-10 | 8-10 | 10 | 112.90 | 17.77 |
| Taman (Lagerstroemia speciosa) | 26 | 10-12 | 12-14 | 9 | 138.78 | 9.935 |
| Peltophorum (Peltaphorum pterocarpum) | 25 | 17-19 | 10-12 | 16 | 80.50 | 8.422 |
| Spatodea (Spatodea companulata) | 24 | 13-15 | 9-11 | 13 | 121.08 | 10.28 |
| Oval (Mimusops elengi) | 23 | 7-9 | 8-10 | 11 | 132.09 | 8.608 |
| Palm (Dypsis lutescens) | 16 | 8-11 | 7-8 | 6 | 124.33 | 11.91 |
| Musaenda (Mussaenda erythrophylla) | 15 | 4-6 | 6-7 | 13 | 52.154 | 4.947 |
| Bottle Palm (Hyophorba lagenicaulis) | 13 | 8-12 | 4-5 | 8 | 41.25 | 2.55 |
| Bayo (Cassia fistula) | 13 | 9-12 | 5-6 | 7 | 110.86 | 7.625 |
| Rain tree (Samanea saman) | 11 | 19-23 | 25-30 | 6 | 259.83 | 23.56 |
| Ritha (Sapindus mukorossi) | 9 | 5-7 | 8-10 | 6 | 111.83 | 24.76 |
| Pithecellobium dulce (Inga dulcis) | 5 | 9-12 | 14-15 | 3 | 100.67 | 11.72 |
| Palas (Butea monosperma) | 4 | 7-10 | 7-8 | 3 | 92.50 | 4.95 |
| Avalo (Phyllantus emblica) | 3 | 7-9 | 5-6 | 2 | 64.00 | 0 |
| Chinch (Tamarindus indica) | 2 | 11-12 | 15 | 2 | 164.00 | 11.31 |
| Java cassia (Cassia javanica) | 1 | 7 | 8 | NM | NM | |
| Surang (Mammea suriga) | 1 | 9 | 9 | NM | NM | |
Table 6.
Details of different tree species from Ambedkar Park, Panaji, Goa.
| Tree | Number | Height (m; range) | Canopy diameter (m; Range) | Girth circumference (cm) |
||
|---|---|---|---|---|---|---|
| n | Mean | ±SD | ||||
| Peltophorum, P. pterocarpum | 184 | 10-15 | 3-7 | 22 | 81.67 | 6.64 |
| Casuarina, Casuarina equisetifolia | 92 | 8-11 | 4-7 | 13 | 95.25 | 14.69 |
| Ashoka tree, Polyalthia longifolia | 52 | 10-12 | 3-5 | 8 | 81.57 | 3.69 |
| Bottle palm, Hyophorba lagenicaulis | 48 | 5-8 | 3-4 | 10 | 42.40 | 2.99 |
| Coconut palm, Cocos nucifera | 26 | 7-10 | 7-9 | 12 | 98.17 | 5.97 |
| Badam, Terminalia catappa | 26 | 7-10 | 8-12 | 10 | 102.80 | 8.40 |
| Veni tree, Acacia ferruginea | 12 | 11-15 | 7-10 | 6 | 55.33 | 1.75 |
| Rain tree, Samanea saman | 9 | 20-22 | 20-24 | 4 | 271.00 | 35.35 |
| Acacia, Acacia auriculiformis | 8 | 10-12 | 11-14 | 5 | 118.60 | 0.89 |
| Bamboo, Phyllostachys pubescens | 7 | 8-10 | 7-12 | 18 shoots | 38.22 | 3.04 |
| Mango, Mangifera indica | 6 | 13-16 | 8-13 | 6 | 72.67 | 3.56 |
| Gulmohar, Delonix regia | 6 | 17-19 | 25-30 | 4 | 138.00 | 18.20 |
| Sandalwood, Santalum album | 2 | 3 | 2 | 2 | 24.50 | 2.12 |
Table 7.
Details of different tree species from Joggers Park, Panaji, Goa .
| Tree | Number | Height (m; range) | Canopy diameter (m; range) | Girth circumference (cm) | ||
|---|---|---|---|---|---|---|
| n | Mean | ±SD | ||||
| Peltophorum, P. pterocarpum | 213 | 12-15 | 3-7 | 11 | 82.46 | 8.99 |
| Coconut palm, Cocos nucifera | 48 | 5-11 | 7-9 | 14 | 95.79 | 7.88 |
| Beetlenut palm, Areca catechu | 42 | 6-10 | 11-14 | 10 | 34.67 | 3.74 |
| Bottle palm (Hyophorba lagenicaulis) | 33 | 5-6 | 3-5 | 6 | 67.33 | 5.79 |
| Ashoka tree, Polyalthia longifolia) | 32 | 10-12 | 2-3 | 8 | 71.50 | 7.09 |
| Palm, Dypsis lutescens | 12 | 3-10 | 4-9 | 8 | 114.25 | 9.47 |
| Casuarina, Casuarina equisetifolia | 10 | 7-10 | 4-6 | 10 | 77.40 | 7.71 |
| Badam, Terminalia catappa | 8 | 6-8 | 8-10 | 5 | 40.60 | 2.07 |
| Sandalwood Santalum album | 6 | 4 | 3 | 6 | 29.00 | 2.83 |
Table 8.
Regression Equations for dependent (DWR) and independent variable (Canopy area) for calculating the daily requirements of water .
Table 8.
Regression Equations for dependent (DWR) and independent variable (Canopy area) for calculating the daily requirements of water .
| Independent variable | Dependent variable | Regression Equation | R2 |
|---|---|---|---|
| Mahavir Park | |||
| Mean Canopy | DWR Oct-Jan | y = 236.42x - 622.42 | 0.8333 |
| DWR Feb-Jun | y = 275.82x - 726.15 | 0.8333 | |
| Ambedkar Park | |||
| Mean Canopy | DWR Oct-Jan | y = 469.32x - 2230.6 | 0.9417 |
| DWR Feb-Jun | y = 547.55x - 2602.5 | 0.9417 | |
| Joggers Park | |||
| Mean Canopy | DWR Oct-Jan | y = 20.306x + 3.5236 | 0.4358 |
| DWR Feb-Jun | y = 23.69x + 4.1144 | 0.4358 | |
Table 9.
Compilation of different components of UGS in Panaji city.
| Parameters | Primary data from 7 Surveyed Parks# | Data of DRW + others |
|---|---|---|
| Panaji | ||
| City area Km2 | 21.60* | |
| UGS% in city area | 8.60* | |
| UGS area; Km2 | 1.858* | |
| Hedge plants area (@12.72% of UGS, Km2 | 8385 | 0.236 |
| Groundcover area (@ 42.23% of UGS; Km2 | 25860 | 0.784 |
| Water used in UGS @ av. 2.6LPD (MLD) | 64000 | 2.66* |
| Hedge DWR @ 6.77L m−2 (MLD) | 56766.45 | 1.599 |
| Groundcover DWR @ 4.57Lm−2 (MLD) | 118180.2 | 3.585 |
| Total DWR (MLD) | 107945.6 | 5.184 |
| % DRW shortage hedge + groundcover | 125952.8 | 51.30 |
| DRW @ for hedge + ground cover (MLD)$$ | 0.184 | 5.185 |
| Trees’ area (28.97±16.30% of UGS; Km2) | 32446 | 0.538 |
| Trees area in ha | 3.25 | 53.82 |
| No of trees [@ 1 tree in 8 (±13) m−2] | 4880 | 67275 |
| Average DRW/tree @ 23.87L (MLD) | 0.117 | 1.606 |
| Trees’ DRW % of available treated water | 15.25 | |
#Details of seven parks surveyed for this study are in Tables 4.1, 4.4 and 4.5. * Data collected through informant questionnaire (officials). $$Trees not watered presently in any UGS.
Disclaimer/Publisher’s Note: The statements, opinions and data contained in all publications are solely those of the individual author(s) and contributor(s) and not of MDPI and/or the editor(s). MDPI and/or the editor(s) disclaim responsibility for any injury to people or property resulting from any ideas, methods, instructions or products referred to in the content. |
© 2025 by the authors. Licensee MDPI, Basel, Switzerland. This article is an open access article distributed under the terms and conditions of the Creative Commons Attribution (CC BY) license (http://creativecommons.org/licenses/by/4.0/).
Copyright: This open access article is published under a Creative Commons CC BY 4.0 license, which permit the free download, distribution, and reuse, provided that the author and preprint are cited in any reuse.


