
Submitted:
24 March 2025
Posted:
25 March 2025
You are already at the latest version
Abstract
Data Envelopment Analysis (DEA) is a widely used non-parametric method for evaluating the relative efficiency of decision-making units (DMUs). This study applies DEA to assess the efficiency of SCA Forest Company, one of Europe’s largest privately held forest estates, located in Sweden. The analysis utilizes both the CCR (Charnes, Cooper, and Rhodes) and BCC (Banker, Charnes, and Cooper) models to account for both desirable and undesirable outputs over a 30-year period. Significant variations in efficiency scores were observed across different scenarios using the CCR model, whereas the BCC model exhibited minimal differences among the DMUs. To enhance the precision of the assessment, the Andersen-Petersen (AP) super-efficiency model was employed, identifying several highly efficient DMUs, particularly DMU 1 and DMU 6, which demonstrated superior efficiency. The statistical significance of these findings was validated using the Wilcoxon signed-rank test, revealing significant differences in efficiency scores under the BCC model across scenarios. However, no such differences were found under the CCR model. This study provides valuable benchmarks for operational improvements within SCA and other similar sectors, offering insights into strategies for better resource allocation and performance enhancement.
Keywords:
data envelopment analysis
; CCR model
; BCC model
; efficiency analysis
; Swedish forest industry
1. Introduction
Data Envelopment Analysis (DEA) is a non-parametric technique used to measure the relative efficiency of decision-making units (DMUs) that transform multiple inputs into multiple outputs (Thanassoulis et al., 2008). Unlike parametric approaches, DEA does not require a predefined production function, offering flexibility in efficiency evaluation (Bhat et al., 2001). DEA constructs efficiency frontiers using linear programming to identify optimal input-output relationships and calculate relative efficiencies of DMUs (Bhat et al., 2001; Madhavi & Pagadala, 2013). DEA’s versatility allows for performance measurement in various sectors, particularly in public and non-profit organizations where market prices may not be readily available (Charnes et al., 1981).
The principle behind DEA is to identify the best-performing units, known as the “frontier,” against which all other units are compared. Efficiency is calculated by assessing the ratio of outputs to inputs for each DMU, with the highest-scoring units serving as benchmarks for others. DEA can also provide valuable insights on how to improve efficiency by suggesting ways to reduce inputs or increase outputs for less efficient units. The flexibility of DEA makes it applicable across various sectors, including healthcare, education, manufacturing, and the forestry industry, among others. By comparing performance across units, DEA helps organizations identify inefficiencies, optimize resource allocation, and adopt best practices from top performers (Bhat et al., 2001; Lengacher et al., 2014).
In the forestry and paper industries, DEA has been employed to assess technical and allocative efficiency. For example, in the linerboard sector, DEA revealed the need for improved resource allocation despite showing constant returns to scale (Yin, 1998). A global study of forest and paper companies found varying efficiency scores, with Latin America showing the highest average efficiency (Lee, 2005). Mohammadi Limaei (2013) used DEA to evaluate the efficiency of 14 Iranian forest companies and forest management units, revealing weak performance in the harvesting sub-process as the primary cause of low efficiency in 2010. Similarly, DEA has been applied in the Iranian forest sector, where it considered both economics and carbon dynamics. The study found that the relative efficiency of 33 forest management units varied depending on how undesirable outputs, like CO2 emissions, were modeled (Mohammadi Limaei, 2020).
Research conducted by Shahi et al. (2021) in Ontario employed a meta-frontier DEA approach to evaluate the efficiency across various sub-sectors of the forest industry, uncovering significant inefficiencies. Their findings highlighted the potential for targeted wood supply policies to enhance the performance of value-added sectors. Moreover, the study confirmed the presence of distinct production functions within the industry, indicating that tailored interventions could significantly improve efficiency in specific sub-sectors.
In the paper industry, DEA has been used to assess the performance of Mazandaran Wood and Paper Company in Iran. Using network DEA models with parallel structure, the study found that the company showed good performance across all studied years, with the best performance occurring in 2007 (Zadmirzaei et al., 2015).
Zhou et al. (2019) applied a network DEA model to evaluate the efficiency of Swedish forest bioenergy production, examining outputs like sawtimber, pulpwood, and bioenergy, alongside environmental factors such as biodiversity and CO₂ emissions. Their findings highlight economic inefficiencies in certain regions, underscoring the potential for improved resource use in Sweden’s forest industry and supporting the relevance of DEA in complex forestry systems, as applied in this study of SCA (Zhou et al., 2019).
Efficiency analysis of the forestry and forest-based industries in Bulgaria has also been conducted using DEA, which indicated relatively high efficiency compared to most EU countries. Results showed that higher efficiency scores were observed in countries where forestry holds a larger share of the economy than forest-based industries (Neykov et al., 2019).
DEA’s advantages include its ability to handle multiple inputs and outputs without specifying a production function. However, its limitations include sensitivity to data errors and the need for homogeneous DMUs (Sowlati, 2005; Thanassoulis et al., 2008). DEA provides valuable insights for productivity management and decision-making in sectors like forestry and paper production.
As one of the largest and most influential players in the Swedish forest industry, SCA has a significant impact on the national economy. It is a key producer of wood products, pulp, and paper, and plays an integral role in sustainable forest management. The Swedish forest industry, including major players like SCA, plays a crucial role in the national economy and sustainable forest management (Eriksson, 2008). The company’s operations are central to Sweden’s forestry sector, contributing to both economic growth and environmental stewardship. Understanding SCA’s efficiency is therefore crucial not only for the company itself but also for the broader forest industry in Sweden.
This study explores the efficiency of the Swedish forest industry, with a particular focus on the operations of SCA over an extended period. DEA, the research examines how effectively SCA manages its inputs and outputs, taking into account both positive and negative factors. This provides a valuable benchmark for optimizing resource allocation. While previous studies have offered useful insights, they often lack a thorough analysis of Swedish forest operations. There are also gaps in understanding efficiency within Sweden’s forest sector under different DEA model assumptions and over the long term. This study addresses those gaps by using both the CCR and BCC DEA models, along with the Andersen-Petersen (AP) super-efficiency model, to offer a deeper look at efficiency trends within SCA and the Swedish forest industry as a whole. The findings provide a more context-specific evaluation of efficiency, offering valuable guidance for improving management strategies in the sector.
2. Method
2.1. Data Collection
This study examines 30 years of annual data from SCA’s operations in Sweden, encompassing 30 decision-making units (DMUs), each representing a distinct year from 1987 to 2016. SCA owns one of the largest privately held forest estates in Europe, covering about 2.6 million hectares of land in Sweden. The dataset includes a variety of input and output variables to provide a comprehensive assessment of efficiency for each unit over the period. The DEA models utilize the following input variables: capital employed, asset value, financial expenses, and total liabilities and equity. The desirable outputs measured in the analysis include net profit (SEK million), net sales, return on capital employed, and return on equity. Additionally, the study incorporates total liabilities and equity (SEK million) as an undesirable output, reflecting the financial burden that may negatively impact efficiency. The variables included offer a detailed picture of the operational and financial performance of SCA over the three decades (Table 1).
2.2. DEA Models and Analysis
2.2.1. CCR Model (Constant Returns to Scale)
The CCR model, developed by Charnes, Cooper, and Rhodes, assumes constant returns to scale and measures overall efficiency, combining technical and scale efficiency. The CCR model, assumes that all Decision-Making Units (DMUs) operate at an optimal scale, meaning that efficiency is measured under the assumption that inputs and outputs increase proportionally. This model is well-suited for evaluating aggregate or “overall” efficiency, making it useful in contexts where scale differences between DMUs are minimal or where the focus is on understanding the potential maximum output relative to input use across all units. The CCR model provides a single efficiency score that reflects both technical efficiency and scale efficiency, which makes it ideal for identifying whether a DMU is operating on the “efficient frontier” as compared to all others under the same scale assumptions.
DEA is an effective technique for measuring the relative efficiency of a set of DMUs using the same inputs to produce the same outputs. Suppose there are DMUs. The th DMU uses m inputs , to produce s outputs , r = 1,. . . , s. Its efficiency is calculated through the following CCR model (Charnes et al., 1978):
Let represent the amount of input used by unit, and denote the amount of output produced by unit. The weight assigned to input is denoted as represents the weight given to output. Where and are the most favorable multipliers to be applied to th output and th input for DMUk in calculating its efficiency and is a small non- Archimedean quantity (Charnes et al., 1978; Charnes and Cooper, 1984) ensuring that no input/output factor can be disregarded. The CCR model assumes constant returns to scale and is applied multiple times (n iterations) to evaluate the relative efficiency of all the DMUs. Each DMU determines a set of input and output weights that maximize its efficiency score. A DMU is considered efficient if its score equals 1; otherwise, it is deemed inefficient. It is an input-oriented model that creates a set of linear equations representing the efficiency frontier, identifying the relative efficiency of each unit by comparing their input utilization to generate outputs.
2.2.2. BCC Model (Variable Return to Scale)
The BCC model, introduced by Banker, Charnes, and Cooper in 1984 (Banker et al., 1984), expands upon the CCR model by relaxing the assumption of constant returns to scale, offering a more flexible framework for evaluating the efficiency of DMUs. Unlike the CCR model, which assumes efficiency remains constant regardless of the scale of operations, the BCC model accounts for variable returns to scale (VRS). A key feature of the BCC model is the convexity constraint, which introduces a free variable, often denoted as , to capture the non-linear relationship between inputs and outputs (Eq. 2). This constraint ensures that the production possibility set remains convex, reflecting the operational flexibility that each DMU may encounter. The inclusion of this free variable is a notable distinction from the CCR model, where efficiency is assessed under the assumption of constant returns to scale and no adjustment for scale is made. The free variable in the BCC model allows for the identification of the optimal scale for each DMU, providing a more accurate and dynamic assessment of efficiency in environments where returns to scale are not constant (Banker et al., 1984).
2.3. Efficiency Analysis of SCA, Using Two Models (CCR and BCC)
To gain a comprehensive understanding of DMU efficiency in the presence of undesirable outputs, this study employs a two-scenario approach using DEA. Scenario 1, which disregards undesirable outputs, provides a conventional efficiency measure. However, to account for the negative impact of these output, Scenario 2 incorporates it as additional input in the DEA model. By comparing the efficiency scores obtained from both scenarios, we can identify potential inefficiencies arising from the generation of undesirable output and gain valuable insights into the overall performance of DMUs (Figure 1).
2.3. Andersen-Petersen (AP) Super-Efficiency Model
To further rank the most efficient DMUs, the Andersen-Petersen (AP) super-efficiency model was applied. The AP model is a specific type of Super-efficiency DEA model used for ranking efficient DMUs within DEA (Andersen & Petersen, 1993). Unlike standard DEA, the AP model excludes the DMU being evaluated from the data used to calculate the efficiency frontier. Efficient DMUs in the original DEA analysis will have an AP score of 1. Efficient DMUs with an AP score more than 1 are considered “super-efficient” and ranked higher. This indicates they outperform other efficient units when compared only to their peers. The AP ranking is particularly useful in cases where we need to make finer distinctions among efficient units, especially in studies where only a subset of units are truly outstanding in relative performance. This method ensures that no two DMUs with similar traditional DEA efficiency scores remain undistinguishable, providing a clearer ranking for decision-making.
2.4. Wilcoxon’s Signed-Rank Test
Wilcoxon’s signed-rank test, implemented in STATA, was used to confirm or reject the null hypothesis using STATA software. The null hypothesis was that there is not a significant difference between efficiency cores of various DMUs under two scenarios in CCR and BCC models.
Wilcoxon’s signed-rank test utilized for comparing two related samples or repeated measurements from a single sample. Its primary aim is to assess whether there exists a significant difference between the population means of the compared groups or treatments. This test is particularly valuable when assumptions about data distribution, such as normality, are not met (Wilcoxon, 1945).
3. Results
3.1. CCR Model
In Scenario 1 under the CCR model, several DMUs achieve a perfect efficiency score of 1, indicating they are fully efficient in transforming inputs into outputs under constant returns to scale. These DMUs include DMUs 1, 2, 3, 6, 9, 14, 16, 17, 29, and 30 (Table 2). However, there are some inefficient DMUs, such as DMU 4 (0.77) and DMU 5 (0.78), which score below 1, suggesting they are less efficient in comparison to the frontier DMUs, likely due to scale inefficiencies or suboptimal input-output conversion. In Scenario 2, several DMUs that were previously inefficient, including DMU 4 and DMU 7, show improved efficiency scores. This improvement could be due to adjustments in their inputs or outputs, highlighting how changes in conditions can lead to better performance and greater efficiency (Table 2).
3.2. BCC Model
In Scenario 1, several DMUs achieve an efficiency score of 1, indicating their efficiency under variable returns to scale, including DMUs 1, 2, 6, 8, 14, 16, 17, 29, and 30 (Table 3). Conversely, some DMUs exhibit inefficiencies, as seen with DMU 4 (0.74) and DMU 5 (0.69), suggesting that their inefficiencies are due to scale-related issues rather than problems with input-output conversion. In Scenario 2, most DMUs show either improved or stable efficiency scores, with several DMUs that were inefficient in Scenario 1, such as DMU 4, 5, and 7, achieving full efficiency. This shift highlights how changes in scenario conditions can significantly impact the relative efficiency of DMUs, reinforcing the value of comparing performance across different contexts (see Table 3).
Comparing CCR and BCC scores:
- Scale efficiency: Differences between CCR and BCC scores for each DMU reveal insights into scale efficiency. For example, if a DMU has a high BCC score but a lower CCR score, it suggests that inefficiencies are related to scale rather than technical inefficiency. DMUs 4 and 5 show such a trend in Scenario 1, with higher scores under BCC, indicating that their inefficiencies under CCR may be due to scale.
- Scenario impact: Scenario 1 vs. Scenario 2: Scenario 2 shows increased efficiency for some DMUs that were previously inefficient, particularly in the BCC model. This could suggest that the adjustments or differing factors in Scenario 2 provide conditions where DMUs better convert inputs to outputs or operate closer to their optimal scale.
3.3. The Andersen-Petersen (AP) Model
In the AP model, scores above 1 indicate higher efficiency relative to other “efficient” DMUs. The higher the AP score, the better the performance of that DMU compared to others under the same scenario.
In Scenario 1 of the CCR Model, DMU 6 exhibits an AP score of 1.83, indicating that it is more efficient than DMU 1, which has an AP score of 1.40, as well as the other DMUs with lower scores. This suggests that, relative to the other units in this scenario, DMU 6 demonstrates a higher level of efficiency. In contrast, in Scenario 2, DMU 1 experiences a significant improvement in its AP score, rising to 2.56, which positions it as the most efficient DMU in this scenario. This notable increase in its score highlights that, under the conditions of Scenario 2, DMU 1 outperforms the other DMUs, further confirming its superior efficiency in this particular context (Table 4).
The results of the AP ranking model under the BCC model for two scenarios reveal notable insights. In Scenario 1, DMU 1 is the most efficient, with an AP score of 2.51, followed by DMU 30 (2.12) and DMU 6 (1.81). In Scenario 2, DMU 1 maintains a high ranking with an AP score of 2.29, though its relative efficiency slightly decreases. On the other hand, DMU 6 improves its performance with an AP score of 2.39, indicating greater relative efficiency in this scenario. Other DMUs, such as DMU 2 and DMU 8, show only minimal changes in their rankings across the two scenarios (Table 5).
3.4. Results of Wilcoxon’s Signed-Rank
Wilcoxon’s signed-rank test showed that there is not a significant difference between the mean of efficiency scores of various DMUs in two CCR models (Table 6).
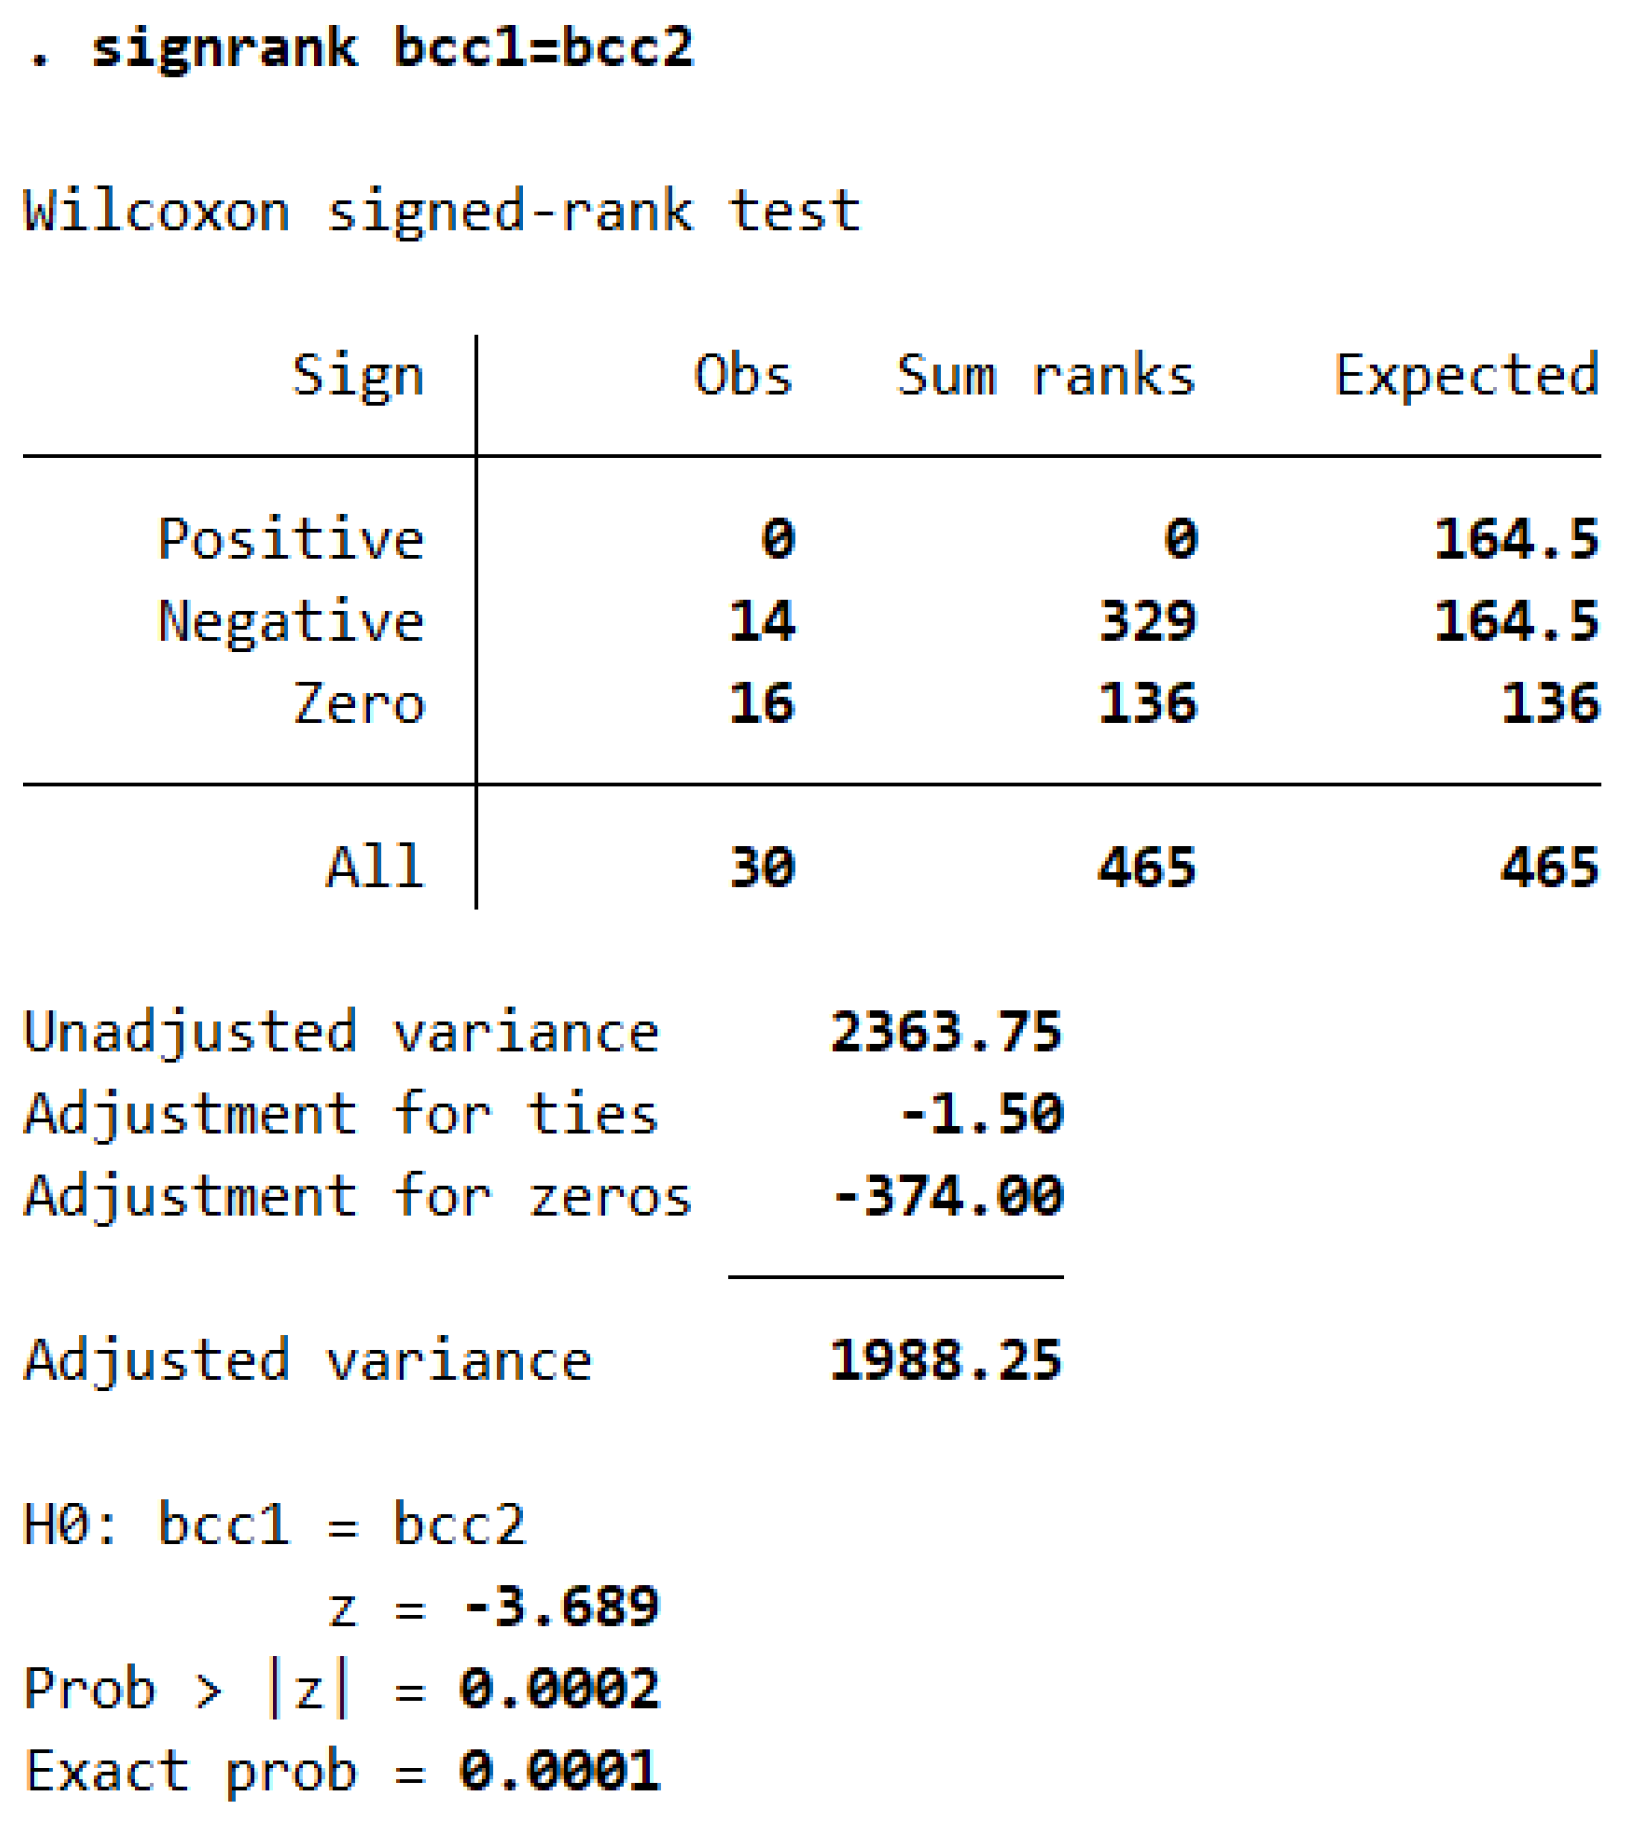
Wilcoxon’s signed-rank test showed that there is a significant difference between the mean of efficiency scores of various DMUs in two BCC models. As the p-value is significantly less than 0.05, we reject the null hypothesis, indicating a strong likelihood that the mean efficiency scores of the two BCC models differ substantially (Table 7).
4. Discussion
This study evaluates the efficiency of the SCA Forest Company in Sweden over a 30-year period using DEA. The results derived from the CCR and BCC models underscore the complex dynamics of the company’s performance, highlighting the pivotal role that model selection plays in efficiency evaluation. By integrating the AP super-efficiency model, this analysis also offers deeper insights into the relative performance of individual DMUs in relation to the efficiency frontier. This discussion elaborates on these results, drawing comparisons to existing literature and emphasizing the broader implications for the forest industry.
DEA has emerged as a critical tool for efficiency evaluation in the forestry and forest products sectors. Previous studies have applied DEA to assess the efficiency of global forest and paper companies (Lee, 2005), Bulgarian forestry (Neykov et al., 2019), and the linerboard sector (Yin, 1998). These studies have provided valuable insights into technical and allocative efficiency, returns to scale, and potential avenues for improvement. As shown by Sowlati (2005), DEA’s non-parametric approach allows for flexibility in evaluating forest management, as it does not rely on specific production functions, making it applicable across diverse forest management models and goals.
Moreover, the performance of super-efficiency DEA models, such as those used in our study, can vary depending on the returns to scale and the relative importance of technical inefficiency. This aspect was highlighted by Chen (2004), who demonstrated that super-efficiency models are useful for ranking efficient units but must be interpreted with care, considering factors such as scale inefficiencies and the degree of technical inefficiency. These insights underscore the importance of model selection in efficiency evaluations.
One of the key findings in this study is the variation in efficiency scores between the CCR and BCC models. The CCR model, which assumes constant returns to scale (CRS), indicated that several DMUs were inefficient due to potentially suboptimal scale sizes. However, the BCC model, assuming variable returns to scale, provided a clearer picture, revealing that many DMUs previously flagged as inefficient under the CCR model were, in fact, efficient when the scale efficiency was taken into account. These results are consistent with those of Neykov et al. (2019), who found that scale differences were significant in their evaluation of Bulgarian forest enterprises.
Additionally, this finding aligns with Shahi et al. (2021), who utilized meta-frontier DEA to assess performance improvements in the Ontario forest industry. They emphasized the importance of considering scale efficiency when evaluating forest industry sub-sectors, as returns to scale significantly impact overall efficiency scores. Similarly, Yin (1998) highlighted the need to account for returns to scale in forest industry sectors such as the linerboard industry, where efficiency gains can be made by adjusting scale parameters.
The integration of the AP super-efficiency model provides a deeper look into the performance of the most efficient DMUs. This model allows us to evaluate units that are already efficient, pushing the analysis beyond the efficiency frontier. The results revealed that certain DMUs consistently outperformed others, which could serve as benchmarks for optimal operational practices within SCA.
This finding mirrors the work of Lee (2005), who demonstrated the utility of super-efficiency models in identifying top performers and using them as benchmarks for other units. As Sowlati (2005) emphasized, benchmarking is a critical tool for operational improvement, as it allows organizations to adopt the best practices from the most efficient units. Similarly, Yin (1998) found that analyzing the best-performing units in a given sector could help drive improvements across the entire industry. In the case of SCA, the study of super-efficient units could help the company optimize resource allocation, improve technological adoption, and enhance workforce management.
However, as noted by Chen (2004), the effectiveness of super-efficiency models in ranking DMUs is influenced by the relative importance of scale inefficiencies versus technical inefficiencies. These factors can significantly impact the ranking of efficient units. While the AP model provides useful benchmarks, careful attention must be paid to how scale inefficiencies are integrated into the ranking process. ts
To validate the robustness of our results, the study employed the Wilcoxon signed-rank test to compare efficiency scores under the BCC and CCR models. The results showed significant differences between the two models, further confirming that model choice is critical in efficiency evaluations. However, there were no significant differences in efficiency scores when comparing results across different time periods within the same model, which indicates that the structural differences between models, rather than temporal shifts, were responsible for the observed variations. These findings corroborate those of Neykov et al. (2019), who also observed that model selection had a considerable impact on efficiency scores in their study of Bulgarian forestry.
The findings from this study have important operational and strategic implications for the SCA Forest Company and similar organizations in the forest industry. The significant role of scale efficiency suggests that optimizing the size and management of operational units could lead to substantial gains in performance. Additionally, by identifying top performers through super-efficiency analysis, SCA can adopt best practices from the most efficient units (year in this study) to enhance overall organizational efficiency.
The importance of adopting best practices is also emphasized by Sowlati (2005), who highlighted that efficiency studies in forestry can guide forest companies in identifying areas for improvement. Similarly, in our study, the application of DEA models has allowed SCA to pinpoint areas where scale efficiency can be improved, and how different DMUs can learn from the top performers. This strategic approach not only helps SCA improve its operational efficiency but also positions the company to remain competitive in the ever-evolving forest industry, where sustainable practices, cost control, and technological advancements are crucial for long-term success.
Moreover, to validate the robustness of our results, the study employed the Wilcoxon signed-rank test to compare efficiency scores under the BCC and CCR models. The results showed significant differences between the two models, further confirming that model choice is critical in efficiency evaluations. However, there were no significant differences in efficiency scores when comparing results across different time periods within the same model, which indicates that the structural differences between models, rather than temporal shifts, were responsible for the observed variations.
These findings corroborate those of Neykov et al. (2019), who also observed that model selection had a considerable impact on efficiency scores in their study of Bulgarian forestry. Similarly, Shahi et al. (2021) validated the use of the meta-frontier DEA model for assessing forest sub-sectors, confirming that proper model selection can improve the accuracy and reliability of performance assessments.
While this study offers valuable insights into the efficiency of the SCA Forest Company, it is important to acknowledge certain limitations. A primary limitation is the reliance on historical data, which may not fully account for recent technological advancements or evolving environmental regulations. The forestry sector is undergoing significant transformation, driven by innovations in technology, sustainability initiatives, and changes in regulatory frameworks. As such, future studies should incorporate these dynamic factors to provide more timely and accurate assessments of efficiency.
Additionally, future research could explore hybrid approaches that combine DEA with other techniques, such as Stochastic Frontier Analysis (SFA) or machine learning algorithms. These methods could offer a deeper understanding by addressing data uncertainty and uncovering latent patterns that might not be apparent in traditional DEA models. Furthermore, the inclusion of non-discretionary factors or the consideration of chance constraints could be explored to refine DEA models. By doing so, researchers could enhance the robustness and applicability of DEA in forest management, particularly in contexts where external factors influence operational outcomes.
5. Conclusion
This study demonstrates the value of DEA, particularly the CCR, BCC, and AP models, in evaluating efficiency within the Swedish forest industry. The significant efficiency variations observed using the CCR model emphasize the impact of scale on resource optimization. Meanwhile, the BCC model’s findings suggest a consistent level of efficiency across DMUs when scale is accounted for. The study’s methodology and findings provide practical benchmarks for SCA and other forest companies, contributing to enhanced resource allocation and operational efficiency. Future research could expand this approach by incorporating environmental and sustainability metrics, further aligning efficiency evaluation with sustainable industry practices.
References
- Andersen, P.; Petersen, N.C. Analyzing efficiency changes in dynamic environments. Journal of the Operational Research Society 1993, 44, 1161. [Google Scholar]
- Banker, R. D.; Charnes, A.; Cooper, W. W. Some models for estimating technical and scale inefficiencies in data envelopment analysis. Management Science 1984, 30, 1078–1092. [Google Scholar] [CrossRef]
- Bhat, R.; Verma, B. B.; Reuben, E. Data envelopment analysis (DEA). Journal of Health Management 2001, 3, 161–180. [Google Scholar] [CrossRef]
- Charnes, A.; Cooper, W.; Rhodes, W. Measuring the efficiency of decision-making units. European Journal of Operational Research 1978, 2, 429–444. [Google Scholar] [CrossRef]
- Charnes, A.; Cooper, W. W.; Rhodes, E. Evaluating Program and Managerial Efficiency: An Application of Data Envelopment Analysis to Program Follow Through. Management Science 1981, 27, 668–697. [Google Scholar] [CrossRef]
- Charnes, A.; Cooper, W. The non-Archimedean CCR ratio for efficiency analysis: A rejoinder to Boyd and Färe. European Journal of Operational Research 1984, 15, 333–334. [Google Scholar] [CrossRef]
- Chen, Y. Ranking efficient units in DEA. Omega 2004, 32, 213–219. [Google Scholar] [CrossRef]
- Eriksson, M. Strategisk och taktisk planering samt länken där emellan; Environmental Science, Business, 2008; Corpus ID: 109765417. [Google Scholar]
- Lee, J.Y. Using DEA to measure efficiency in forest and paper companies. Forest Products Journal 2005, 55, 58–66. [Google Scholar]
- Lengacher, D.; Cammarata, C.; Lloyd, S. Measuring Relative Efficiency and Effectiveness. In Encyclopedia of Business Analytics and Optimization; IGI Global, 2014; p. 10. [Google Scholar] [CrossRef]
- Madhavi, A.A. R.; Pagadala, M. V. B. Efficiency Estimation of Production Functions: Data Envelopment Analysis Approach, Illustrated Edition; LAP LAMBERT Academic Publishing, 2013; ISBN-10: 3659389714, ISBN-13: 978-3659389719. [Google Scholar]
- Mohammadi Limaei, S. Efficiency of Iranian forest industry based on DEA models. Journal of Forestry Research 2013, 24, 759–765. [Google Scholar] [CrossRef]
- Mohammadi Limaei, S. Efficiency analysis of forest management units considering economics and carbon dynamics: A data envelopment analysis (DEA) approach. Austrian Journal of Forest Science 2020, 137, 199–222. [Google Scholar]
- Neykov, N.; Kitchoukov, E.; Antov, P.; Savov, V. Efficiency analysis of the Bulgarian forestry and forest-based industry: A DEA approach. CBU International Conference Proceedings 2019, 7, 1366. [Google Scholar] [CrossRef]
- Shahi, S. K.; Dia, M.; Goyal, J. Meta-frontier data envelopment analysis for performance improvement of forest industry sub-sectors in Ontario. Journal of Environmental Science and Technology 2021, 27, 159–171. [Google Scholar] [CrossRef]
- Sowlati, T. Efficiency studies in forestry using data envelopment analysis. Forest Products Journal 2005, 55, 49–57. [Google Scholar]
- Thanassoulis, E.; Portela, M.C. S.; Despić, O. Data envelopment analysis: The mathematical programming approach to efficiency analysis. In The Measurement of Productive Efficiency and Productivity Growth; Oxford University Press, 2008; pp. 251–420. [Google Scholar]
- Wilcoxon, F. Individual comparisons by ranking methods. Biometrics Bulletin 1945, 1, 80–83. [Google Scholar] [CrossRef]
- Yin, R. DEA: A new methodology for evaluating the performance of forest products producers. Forest Products Journal 1998, 48, 29–34. [Google Scholar]
- Zadmirzaei, M.; Mohammadi Limaei, S.; Amirteimoori, A. Efficiency analysis of paper mill using data envelopment analysis models: (Case study: Mazandaran Wood and Paper Company in Iran). Journal of Agricultural Science and Technology 2015, 17, 1381–1391. [Google Scholar]
- Zhou, W.; Bostian, M.; Färe, R.; Grosskopf, S.; Lundgren, T. Efficient and sustainable bioenergy production in Swedish forests – A network DEA approach. CERE Working Paper 2019, 2019:12. Center for Environmental and Resource Economics (CERE), Swedish University of Agricultural Sciences.
Figure 1.
Two-Scenario Approach to Efficiency Analysis.
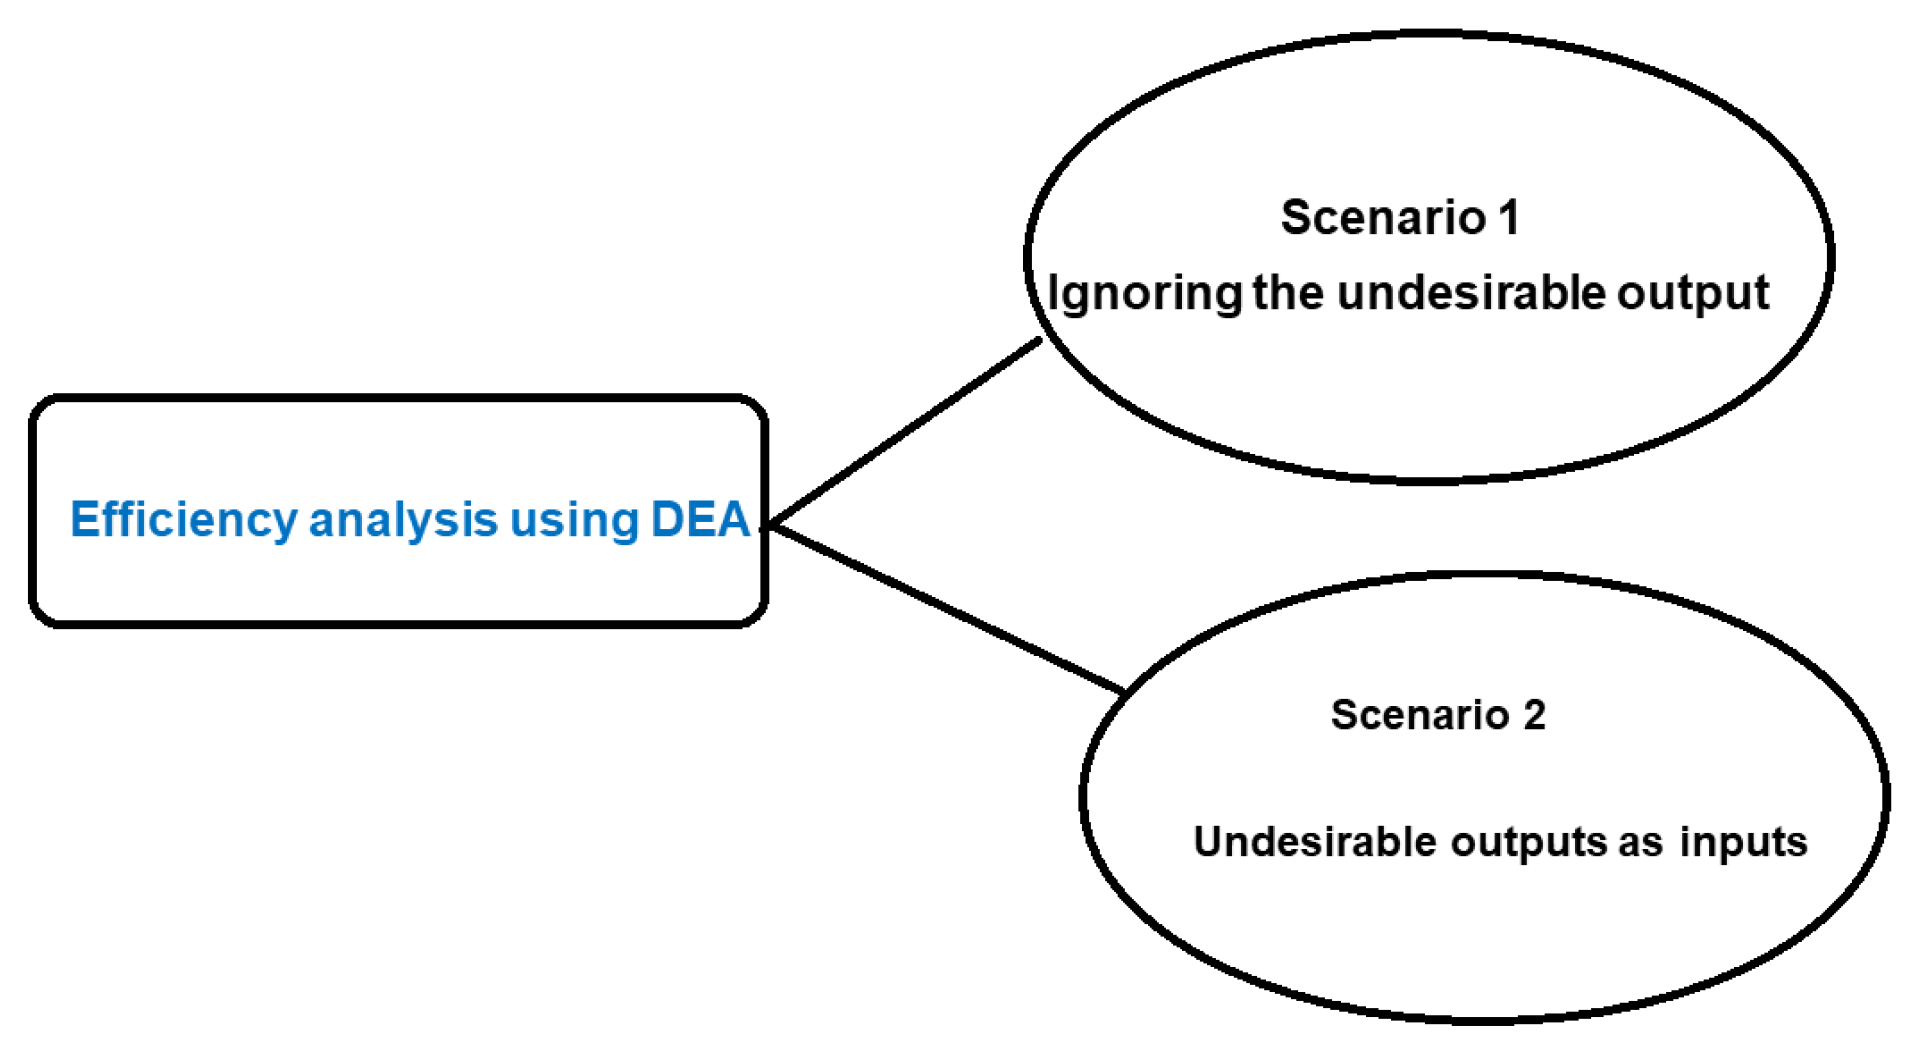

Table 1.
Input and output of 30 DMUs (annual report of SCA during 30 years).
| DMUs | Year | Input | Output | ||||||
| Desirable | Undesirable | ||||||||
| Capital employed (SEk million) | Aasset (SEk million) | Financial expenses (SEK million) | Net Profit (SEK million) | Net Sales (SEK million) | Return on capital employed (%) | Return on equity (%) | Total liabilities and equity (SEK million) | ||
| 1 | 1987 | 9002 | 20503 | 445 | 1262 | 15679 | 27 | 18 | 15679 |
| 2 | 1988 | 10733 | 27567 | 569 | 1358 | 20850 | 26 | 17 | 208501 |
| 3 | 1989 | 14585 | 31088 | 839 | 1734 | 24853 | 22 | 19 | 24853 |
| 4 | 1990 | 24217 | 48429 | 1404 | 1506 | 31122 | 14 | 14 | 31122 |
| 5 | 1991 | 30918 | 43567 | 1740 | 901 | 32760 | 8 | 8 | 32760 |
| 6 | 1992 | 29581 | 46099 | 1899 | 6200 | 32137 | 19 | 47 | 32137 |
| 7 | 1993 | 31459 | 44251 | 1179 | 1071 | 33420 | 7 | 6 | 33420 |
| 8 | 1994 | 31780 | 44928 | 1002 | 555 | 33676 | 6 | 3 | 33676 |
| 9 | 1995 | 47408 | 68130 | 1915 | 3464 | 65317 | 16 | 17 | 68130 |
| 10 | 1996 | 43311 | 67994 | 1327 | 2117 | 55405 | 11 | 10 | 67994 |
| 11 | 1997 | 44840 | 70705 | 1391 | 2759 | 58595 | 12 | 12 | 70705 |
| 12 | 1998 | 47400 | 78373 | 1539 | 3379 | 61273 | 14 | 13 | 78373 |
| 13 | 1999 | 54616 | 85214 | 1534 | 3602 | 64896 | 12 | 12 | 85214 |
| 14 | 2000 | 57501 | 88166 | 1738 | 7148 | 67157 | 18 | 20 | 88166 |
| 15 | 2001 | 67878 | 106788 | 1782 | 5587 | 82380 | 14 | 13 | 106788 |
| 16 | 2002 | 71863 | 109204 | 1432 | 5693 | 88046 | 13 | 12 | 109204 |
| 17 | 2003 | 71687 | 107356 | 1121 | 5075 | 85338 | 11 | 10 | 107356 |
| 18 | 2004 | 79039 | 126151 | 1302 | 5192 | 89967 | 9 | 10 | 117048 |
| 19 | 2005 | 95341 | 135220 | 1651 | 454 | 96385 | 2 | 1 | 135220 |
| 20 | 2006 | 96192 | 133544 | 1851 | 5467 | 101439 | 9 | 9 | 133544 |
| 21 | 2007 | 96368 | 145050 | 2103 | 7161 | 105913 | 11 | 12 | 145050 |
| 22 | 2008 | 105955 | 158968 | 2563 | 5598 | 110449 | 8 | 9 | 158968 |
| 23 | 2009 | 112264 | 149859 | 1802 | 4830 | 109358 | 7 | 7 | 149859 |
| 24 | 2010 | 84664 | 142978 | 1227 | 5592 | 82731 | 8 | 8 | 142978 |
| 25 | 2011 | 83374 | 139004 | 1454 | 607 | 81337 | 4 | 1 | 139004 |
| 26 | 2012 | 87059 | 134285 | 1430 | 5242 | 89229 | 8 | 9 | 134285 |
| 27 | 2013 | 95349 | 144976 | 1193 | 5861 | 92873 | 10 | 9 | 144976 |
| 28 | 2014 | 105409 | 154736 | 1178 | 7068 | 104054 | 10 | 10 | 154736 |
| 29 | 2015 | 108549 | 152372 | 1160 | 7452 | 115316 | 10 | 10 | 152372 |
| 30 | 2016 | 111980 | 165748 | 1051 | 6012 | 117314 | 10 | 8 | 165748 |
Table 2.
Results CCR model under two scenarios.
| Efficiency scores | ||
|---|---|---|
| DMUs | Senario 1 | Senario 2 |
| 1 | 1 | 1 |
| 2 | 1 | 0.90 |
| 3 | 1 | 1 |
| 4 | 0.77 | 0.98 |
| 5 | 0.78 | 0.98 |
| 6 | 1 | 1 |
| 7 | 0.80 | 0.98 |
| 8 | 0.83 | 0.98 |
| 9 | 1 | 1 |
| 10 | 0.93 | 0.93 |
| 11 | 0.96 | 0.97 |
| 12 | 0.93 | 0.93 |
| 13 | 0.90 | 0.90 |
| 14 | 1 | 1 |
| 15 | 0.94 | 0.94 |
| 16 | 1 | 1 |
| 17 | 1 | 1 |
| 18 | 0.94 | 0.95 |
| 19 | 0.87 | 0.87 |
| 20 | 0.91 | 0.91 |
| 21 | 0.90 | 0.90 |
| 22 | 0.82 | 0.82 |
| 23 | 0.89 | 0.89 |
| 24 | 0.85 | 0.84 |
| 25 | 0.78 | 0.78 |
| 26 | 0.85 | 0.85 |
| 27 | 0.87 | 0.87 |
| 28 | 0.95 | 0.94 |
| 29 | 1 | 1 |
| 30 | 1 | 1 |
Table 3.
Results of BCC model under two scenarios.
| Efficiency score | ||
|---|---|---|
| DMUs | Senario 1 | Senario 2 |
| 1 | 1 | 1 |
| 2 | 1 | 1 |
| 3 | 0.98 | 1 |
| 4 | 0.74 | 1 |
| 5 | 0.69 | 0.95 |
| 6 | 1 | 1 |
| 7 | 0.73 | 1 |
| 8 | 1 | 1 |
| 9 | 0.91 | 1 |
| 10 | 0.91 | 0.95 |
| 11 | 0.92 | 0.94 |
| 12 | 0.89 | 0.91 |
| 13 | 0.87 | 0.88 |
| 14 | 1 | 1.00 |
| 15 | 0.93 | 0.93 |
| 16 | 1 | 1 |
| 17 | 1 | 1 |
| 18 | 0.94 | 0.96 |
| 19 | 0.85 | 0.87 |
| 20 | 0.87 | 0.91 |
| 21 | 0.89 | 0.89 |
| 22 | 0.80 | 0.81 |
| 23 | 0.85 | 0.90 |
| 24 | 0.87 | 0.87 |
| 25 | 0.80 | 0.80 |
| 26 | 0.85 | 0.85 |
| 27 | 0.88 | 0.88 |
| 28 | 0.96 | 0.96 |
| 29 | 1 | 1 |
| 30 | 1 | 1 |
Table 4.
Results of AP ranking model for CCR models under two scenarios.
| Efficiency scores | ||||
|---|---|---|---|---|
| DMUs | Senario 1 | AP ranking (senario 1) | Senario 2 | AP ranking (senario 2) |
| 1 | 1 | 1.40 | 1 | 2.56 |
| 2 | 1 | 1.05 | ||
| 3 | 1 | 0.89 | 1 | 1.01 |
| 6 | 1 | 1.83 | 1 | 2.30 |
| 9 | 1 | 0.64 | 1 | 1.15 |
| 14 | 1 | 0.65 | 1 | 1.04 |
| 16 | 1 | 0.50 | 1 | 1.01 |
| 17 | 1 | 0.49 | 1 | 1.03 |
| 29 | 1 | 0.36 | 1 | 1.10 |
| 30 | 1 | 0.34 | 1 | 1.04 |
Table 5.
Results of AP ranking model for BCC models under two scenarios.
| Efficiency scores | ||||
|---|---|---|---|---|
| DMUs | Senario 1 | AP ranking (senario 1) | Senario 2 | AP ranking (senario 2) |
| 1 | 1 | 2.51 | 1 | 2.29 |
| 2 | 1 | 1.25 | 1 | 1.12 |
| 3 | 1 | 1.01 | ||
| 4 | 1 | 1 | ||
| 6 | 1 | 1.81 | 1 | 2.39 |
| 7 | 1 | 1.00 | ||
| 8 | 1 | 0.83 | 1 | 1.00 |
| 9 | 1 | 0.97 | ||
| 14 | 1 | 1.05 | 1 | 1.05 |
| 16 | 1 | 0.84 | 1 | 1 |
| 17 | 1 | 1.03 | 1 | 1.03 |
| 29 | 1 | 1.10 | 1 | 1.01 |
| 30 | 1 | 2.12 | 1 | 1.1 |
Table 6.
Results of Wilcoxon’s signed-rank in CCR models under two scenarios.
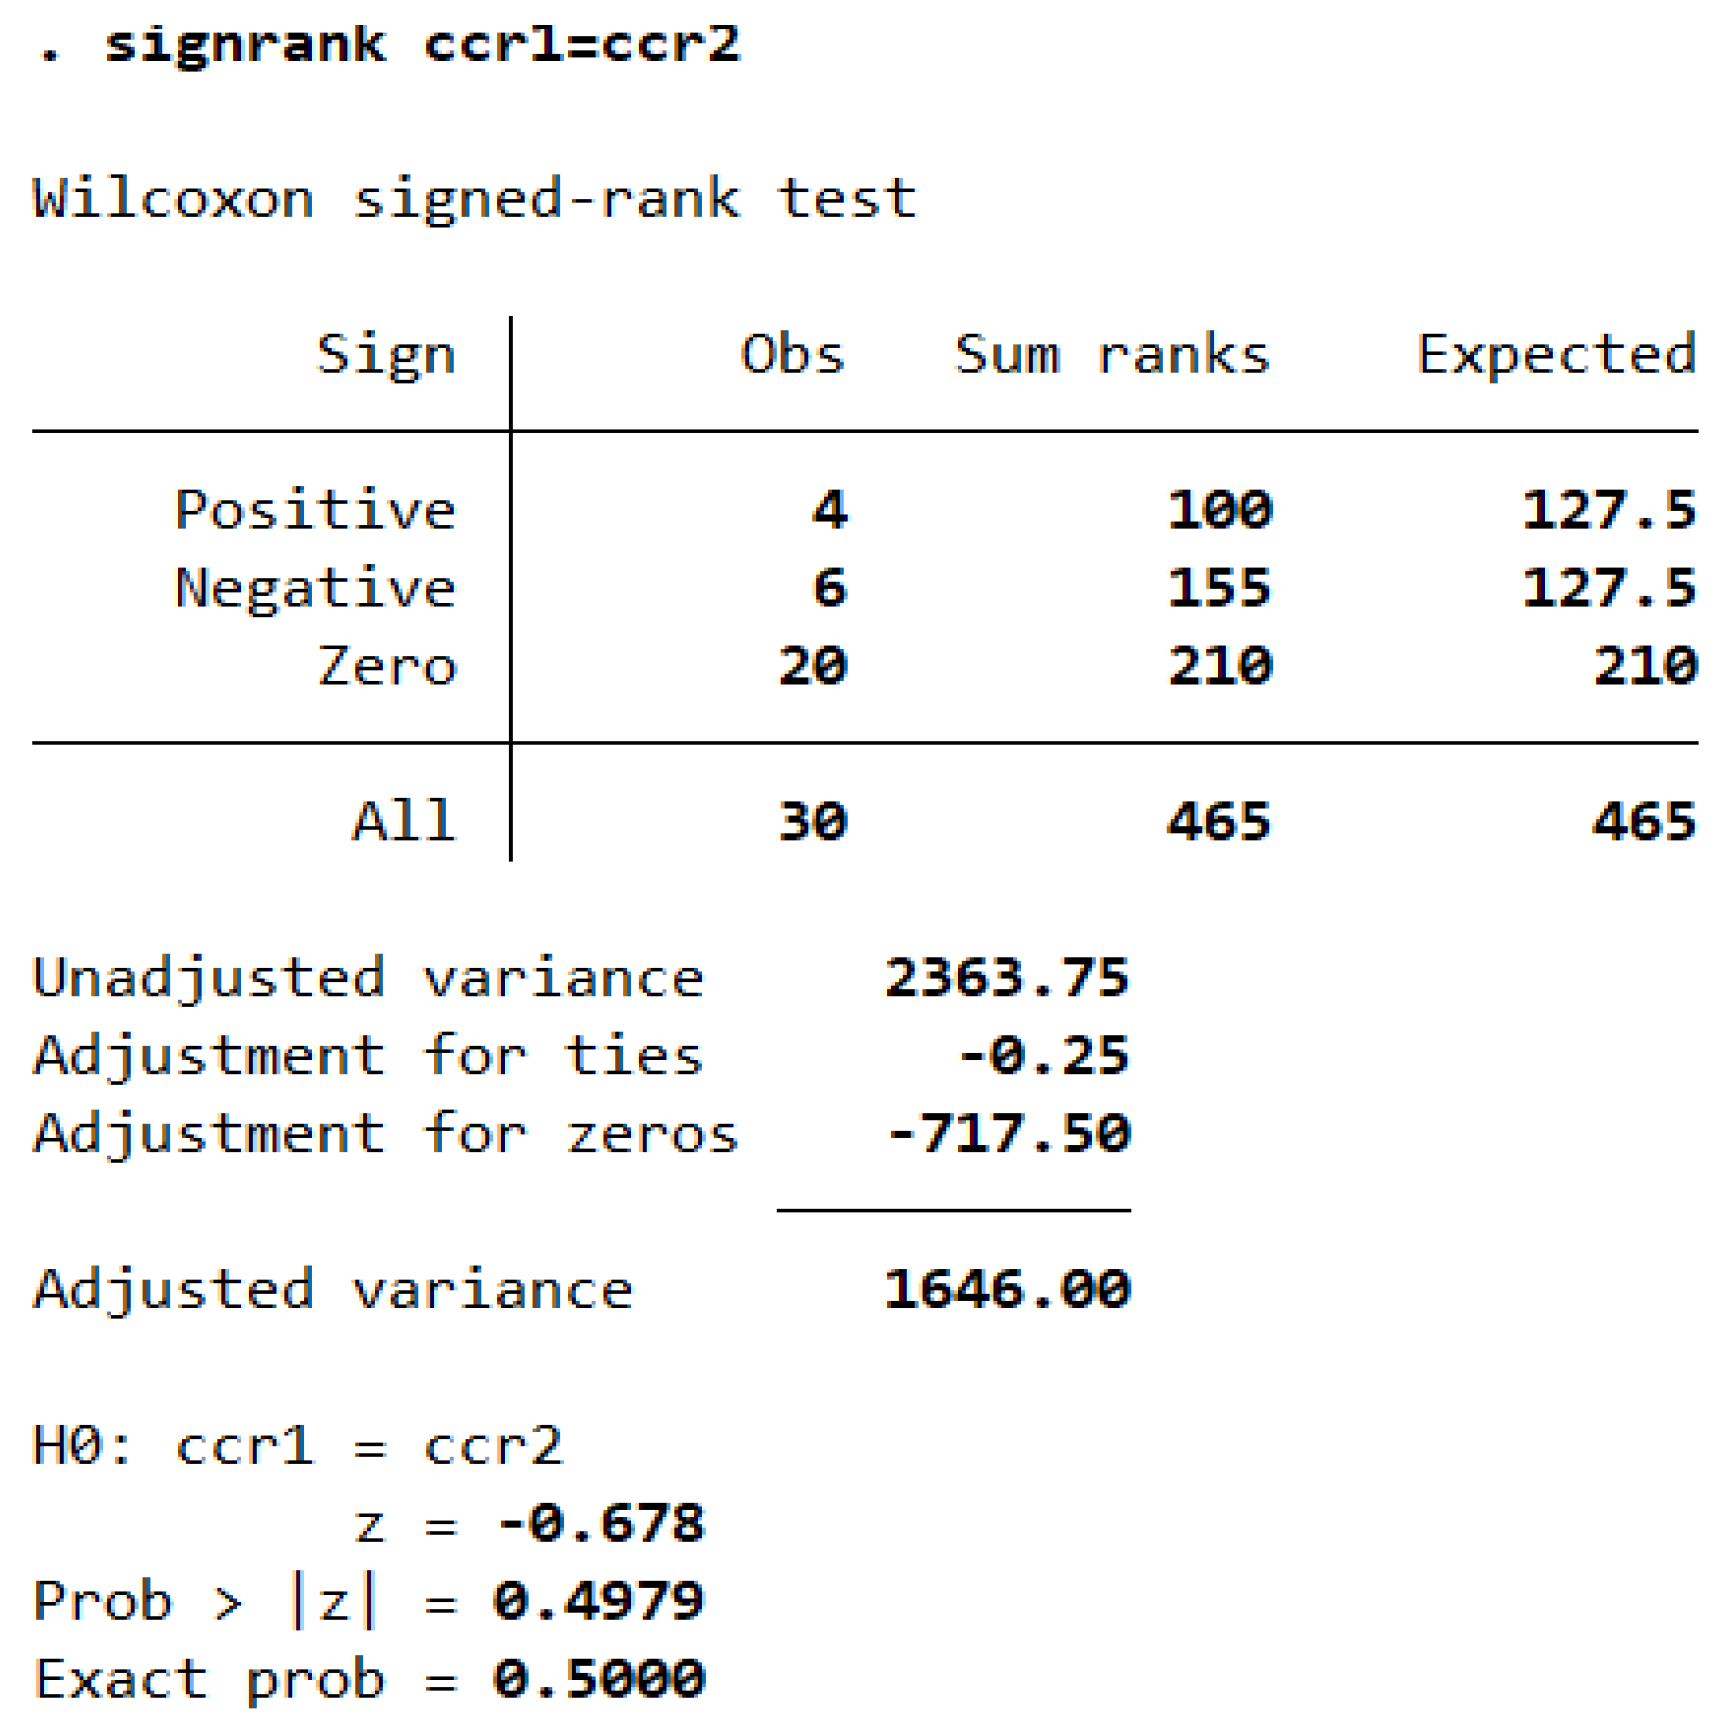
Table 7.
Results of Wilcoxon’s signed-rank in BCC models under two scenarios.
Disclaimer/Publisher’s Note: The statements, opinions and data contained in all publications are solely those of the individual author(s) and contributor(s) and not of MDPI and/or the editor(s). MDPI and/or the editor(s) disclaim responsibility for any injury to people or property resulting from any ideas, methods, instructions or products referred to in the content. |
© 2025 by the authors. Licensee MDPI, Basel, Switzerland. This article is an open access article distributed under the terms and conditions of the Creative Commons Attribution (CC BY) license (http://creativecommons.org/licenses/by/4.0/).
Copyright: This open access article is published under a Creative Commons CC BY 4.0 license, which permit the free download, distribution, and reuse, provided that the author and preprint are cited in any reuse.


