
Submitted:
21 March 2025
Posted:
24 March 2025
You are already at the latest version
Abstract
Characterizing powder feedstock is crucial for ensuring the quality and reliability of parts produced through metal additive manufacturing (AM). The morphology of particles impacts flowability, packing density, and spreadability of powders, affecting productivity and part quality. A new methodology has been developed to classify particle morphological features in AM powder feedstocks, such as spherical or elongated shapes, and the presence of satellites and facets. This approach uses multiple descriptors for quantitative evaluation. The results from shape descriptors can vary based on image resolution, grey/colour thresholding, and software algorithms. There are various commercial systems available for characterizing particle shape, some of which use images taken of static particles, while others use images of particles in motion. This diversity can lead to differences in powder characterization across laboratories with different equipment and methods. This paper compares results from a particle classification approach using two software programs that work with metallographic images with those from an automated static particle analyzer. While traditional methods offer higher resolution and precision, the study shows that automated systems can achieve similar particle shape classification using different shape descriptors and thresholds.
Keywords:
metallic powder
; image analysis
; shape descriptors
; morphological features
; additive manufacturing
1. Introduction
The manufacturing of metal additive parts with predictable and stable properties requires a deep understanding of the characteristics of the powder feedstock. Powder qualification is based on various factors such as chemistry, flowability, particle size distribution, density and shape. Additionally, processes like gas, water or plasma atomization, as well as reuse and recycling processes, can also impact particle characteristics [1,2]. For instance, the blasting of powder cakes after Electron Beam Powder Bed Fusion (EB-PBF) can cause impact marks on the particles, as demonstrated by Ghods et al. with titanium alloy Ti-6Al-4V [3] and Tang et al. [4].
The influence of morphological features, including shape, size and form, on powder flow, packing and behaviour in additive manufacturing (AM) processes has been extensively studied in the literature [5,6,7,8]. Here are a few notable examples. A recent study from Mussato et al. showed that highly spherical particles containing satellites and irregular and fine particles restrict the flowability of particles in powder bed fusion technology [9]. Zhao et al. demonstrated that the use of spherical Inconel 718 alloy powder in EB-PBF resulted in parts with fewer defects, pores and lack of fusion compared to elongated and irregular particles containing satellites [10]. Riener et al. compared AlSi10Mg gas and plasma atomized powders in Laser Powder Bed Fusion (LPBF) and found that the use of spherical plasma atomized powder led to higher bulk and tap density, better flowability, and a decrease in the laser absorption rate. They also observed a relation between laser absorption and layer/part density, suggesting that irregular particles could form additional laser beam traps or cavities, resulting in lower powder bed density. The use of spherical powders in LPBF led to higher powder layer and final part density, slightly higher ultimate tensile strength and elongation at break, and significantly lower surface roughness [11].
Particle shape is often described using a single descriptor such as circularity or aspect ratio, but due to the intrinsic complexity of particle shape, this may not provide an adequate representation [12,13]. This can lead to a biased evaluation where particles of significantly different shapes end up with similar descriptor values. Until recently, it was challenging to relate commonly used descriptors to features observed on AM particles, such as elongation, presence of satellites, or deformation related to recycling EBM powder cakes. While particle shape outlines the external surface, it encompasses the evaluation of its form, roundness, and surface texture [14]. The ISO 9276-6 standard proposes three levels of shape related to particle geometrical proportions, shape, and surface texture [15].
Until recently, no standard was available to address the classification of AM powder particle morphology [16]. The ASTM F3571 Standard Guide for Additive Manufacturing (Feedstock – Particle Shape Image Analysis by Optical Photography to Identify and Quantify the Agglomerates/Satellites in Metal Powder Feedstock) was recently developed to tackle this issue. It recommends using a pair of shape descriptors, either aspect ratio or ellipse ratio coupled with solidity, to distinguish and quantify spherical and non-spherical particles [17].
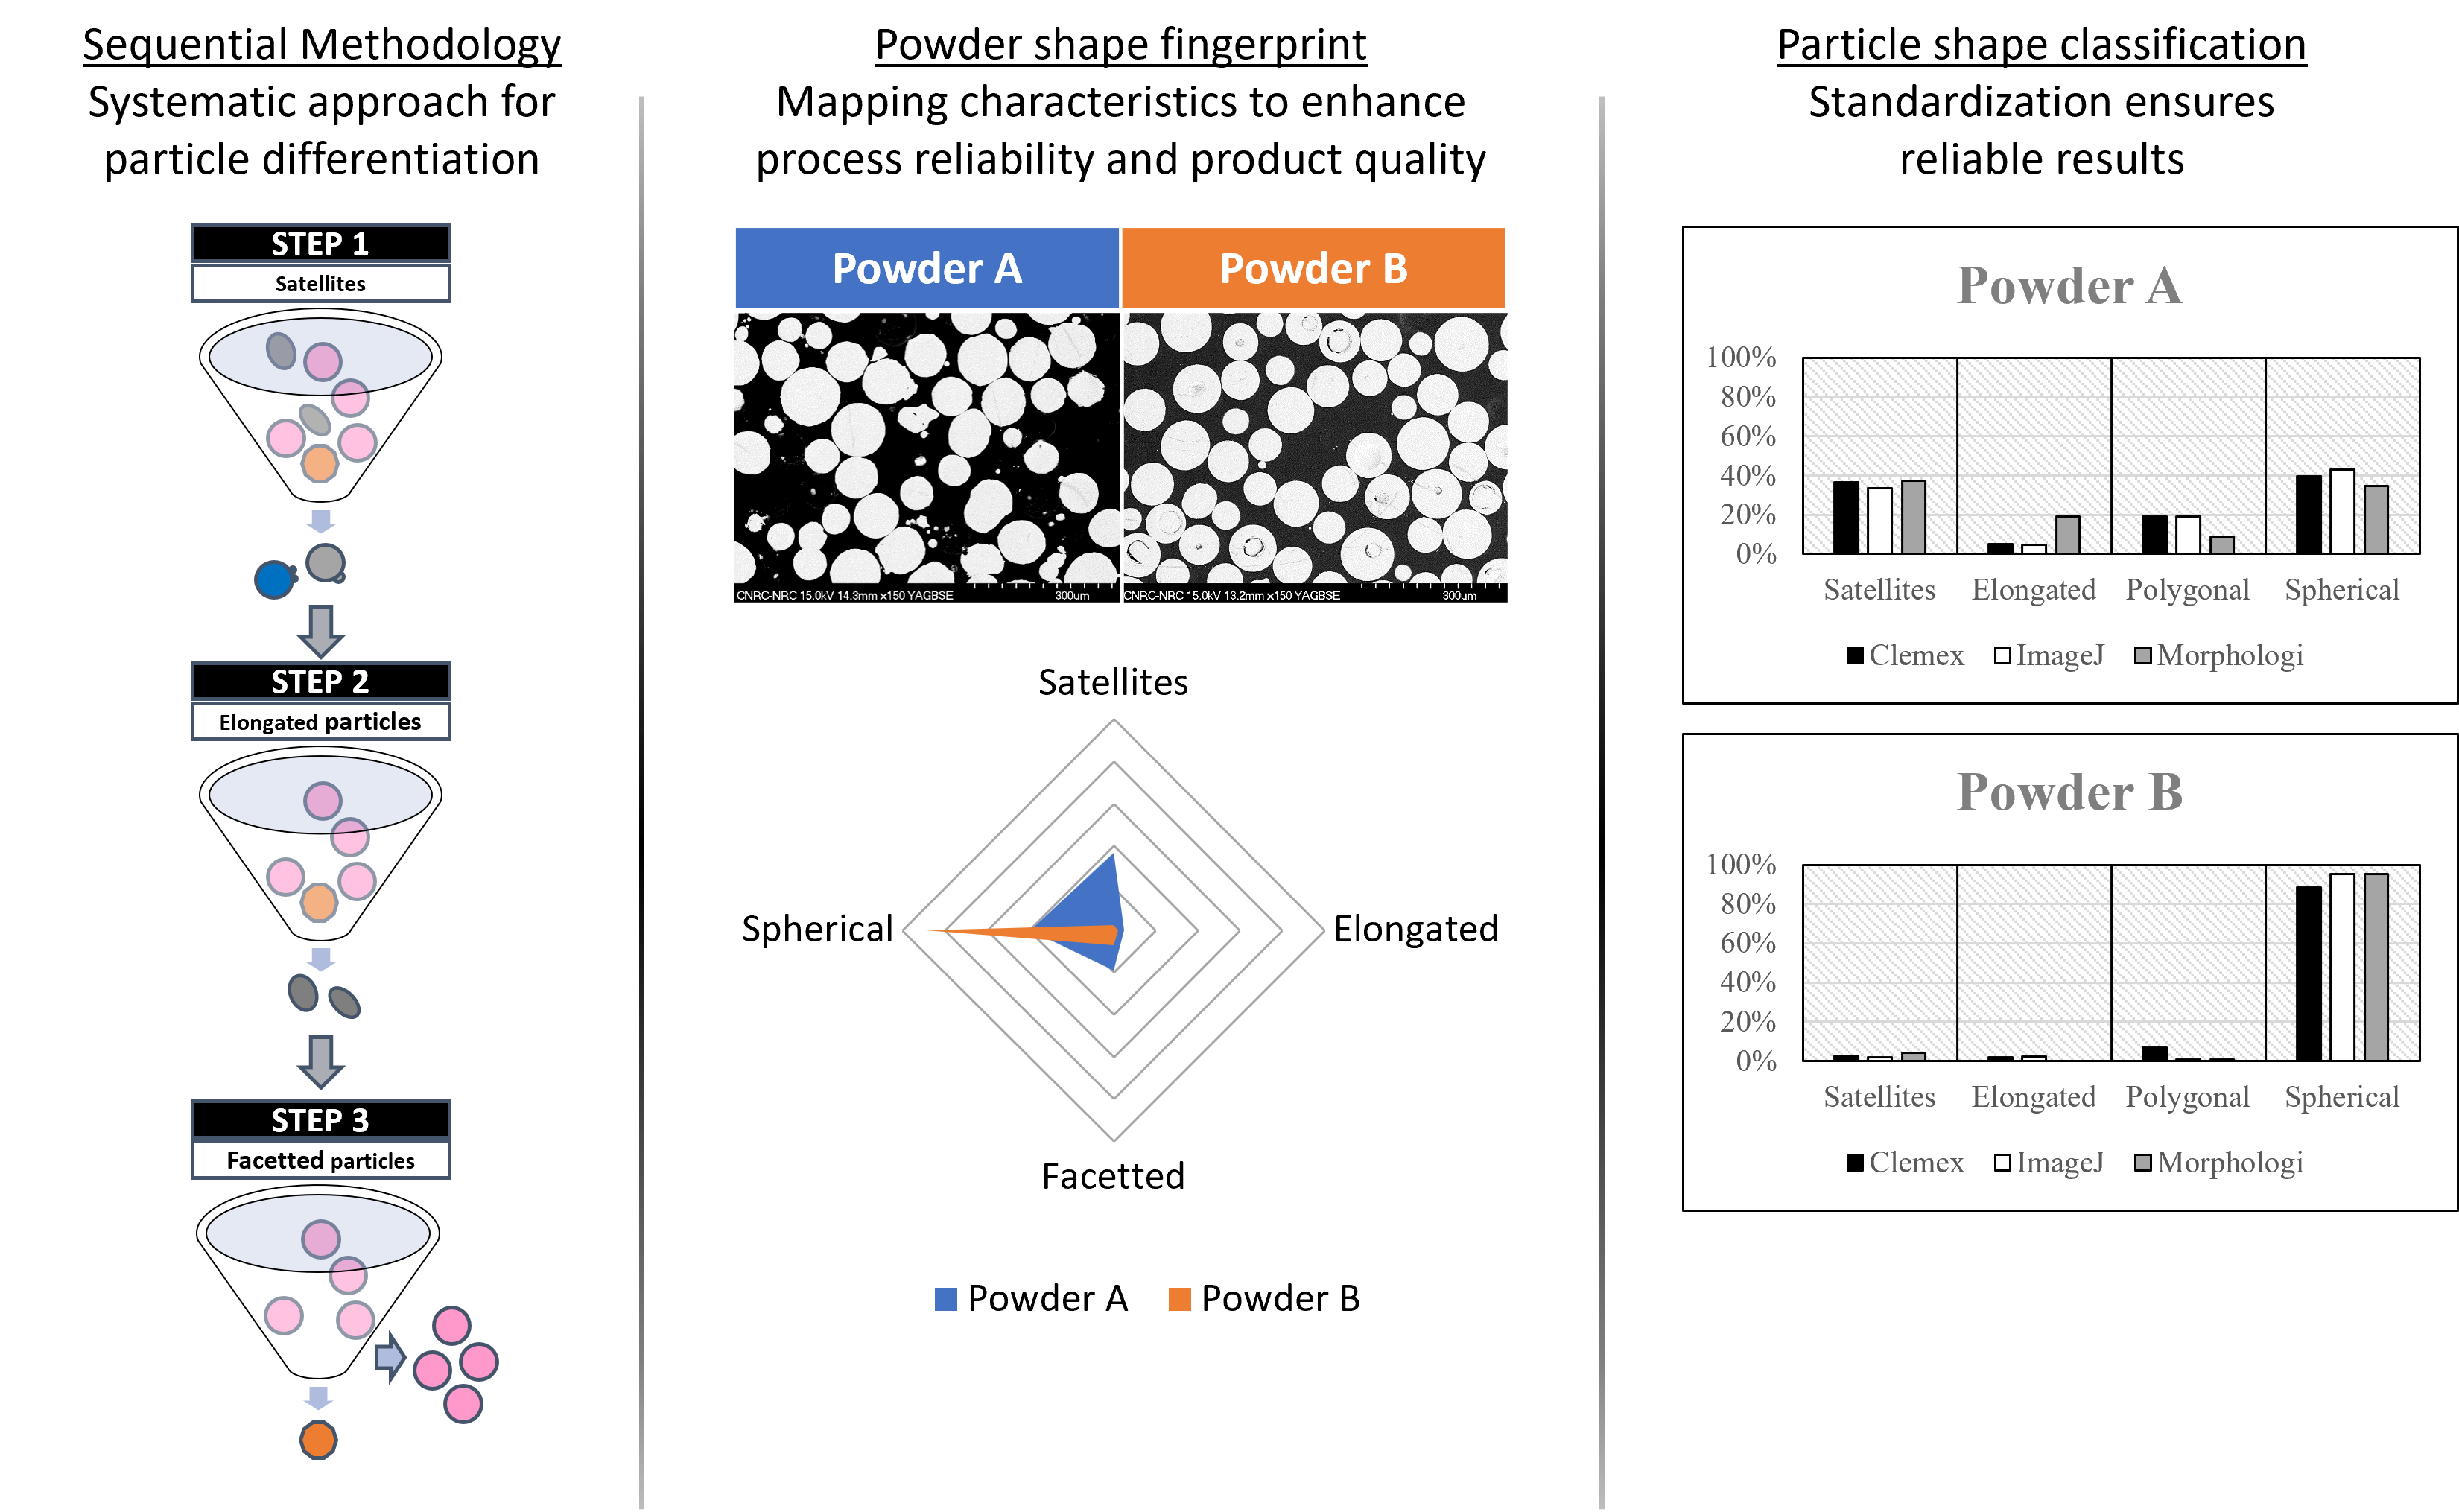
A quantitative methodology based on the use of several shape descriptors was recently developed to classify particle shapes commonly observed in additive manufacturing powder feedstocks, namely elongated, faceted, spherical and particles with satellites [13]. The methodology was developed with an assortment of schematized particles and validated on metallographic images of different metallic powder samples. The method produces a particle shape fingerprint, by sequentially categorizing particles with satellites, then elongated particles and finally faceted from remaining spherical particles. The method was initially developed on a commercially image analysis software.
With the growing demand for AM parts, several morphological analysis software has emerged to meet the needs of the users. However, multiple differences exist when measuring and interpreting basic dimensions and frequently used descriptors with different commercial image analysis software. This could lead to divergent results in different laboratories that are not using the same software. For example, the measurement of the circularity, which is calculated with the projection of a perfect sphere in 2D, as opposed to sphericity, which is calculated with the surface area of a sphere [18]. This can be observed with Clemex and ImageJ systems which leads to significantly different results (Figure 1). It underlines the importance of defining a standard language and methodology to eliminate discrepancies, minimise the human bias from the analysis, and allow reliable measurement of powder fingerprinting. Moreover, with the recent development of automatic particle analyzers, it become mandatory to compare results acquired with different techniques.
The objective of this project is to implement a multidescriptor particle shape classification methodology in several commercial software and automated particle analyzers: Clemex Vision PE (commercial software, 2D static image analysis), ImageJ (open-source, 2D static image analysis) and Morphologi G3 (commercial software, fully automated static image analysis). The focus is on verifying if reliable particle morphology analysis is achievable using these different characterization tools.
2. Materials and Methods
2.1. Sequential Methodology
The sequential methodology previously developed on Clemex Vision PE software to classify powder morphology is illustrated in Figure 2 [13]. The threshold for each descriptor is established first through an analysis of schematized particles, then validated on metallic powder samples. Applying a threshold of 0.95 to a convexity index (Cx) highlights particles with numerous satellites. Cx is the ratio between the convex Hall perimeter and the perimeter. When the number of satellite increases, this ratio drops. An extent ratio (EC) below 0.95 distinguishes the remaining particles with a single satellite. The EC parameter is the ratio of the area over the maximum and minimum Feret diameters adapted for circular-shaped particles. An ellipse ratio (Er) lower than 0.90 discerns remnant elongated particles. Er is the ratio of the best fitting ellipse length and width, based on the second moment of the object. Finally, the spherical particles are sorted from the faceted ones by applying a double constraint with both the roundness index (Rn) and an irregularity ratio (IR) lower than 0.90. Rn approximates the sharpness of the particles, while the IR provides an indication of the irregularities. All equations used for the descriptors are summarized in section 2.4.
2.2. Schematized Particles
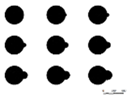
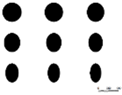
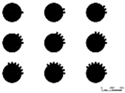
During the elaboration of the sequential methodology, a collection of schematized particles was developed using a design software (AutoCad). The studied particles were based on common morphologies found in metallic powders used for AM, namely particles with satellites, elongated particles and faceted particles. These schematized particles were used to assess discrepancies in the measurements (i.e. area, convex perimeter, perimeter, min/max Feret lengths and ellipse length/width) between two static image analysis software; Clemex Vision PE and ImageJ. Fifty-four schematized particles were analyzed and are presented in Figure 3.
2.3. Preparation of Metallographic Samples
Four metallic powders were used in this study: aluminum alloy Al6061 [75-125µm], titanium alloy Ti-6Al-4V [75-125µm], 316L stainless steel [15-45µm] and 316L stainless steel used in LPBF AM machines [15-45µm]. Metallographic samples were mounted in CaldoFix-2 resin (Struers). The mixture was degassed and heated at 70 °C for 90 minutes, then wet ground with silicon carbide grinding paper grits, and finally polished with diamond and silica suspensions using an automatic polishing equipment (Tegramin-30, Struers). The samples were sputter-coated with Pt before microscopy observation.
Images were acquired using a scanning electron microscope (SEM, HITACHI S4700, 15 kV) with the backscattered electron (BSE) detector. The magnification was selected to provide the minimum number of pixels required by the ISO 9276-6 standard for an accurate analysis of the smallest particles (i.e., from 100 to 5000 pixels per particle). The metallographic cross-sections of all samples are shown in Figure 4.
2.4. Measurements and Shape Descriptors
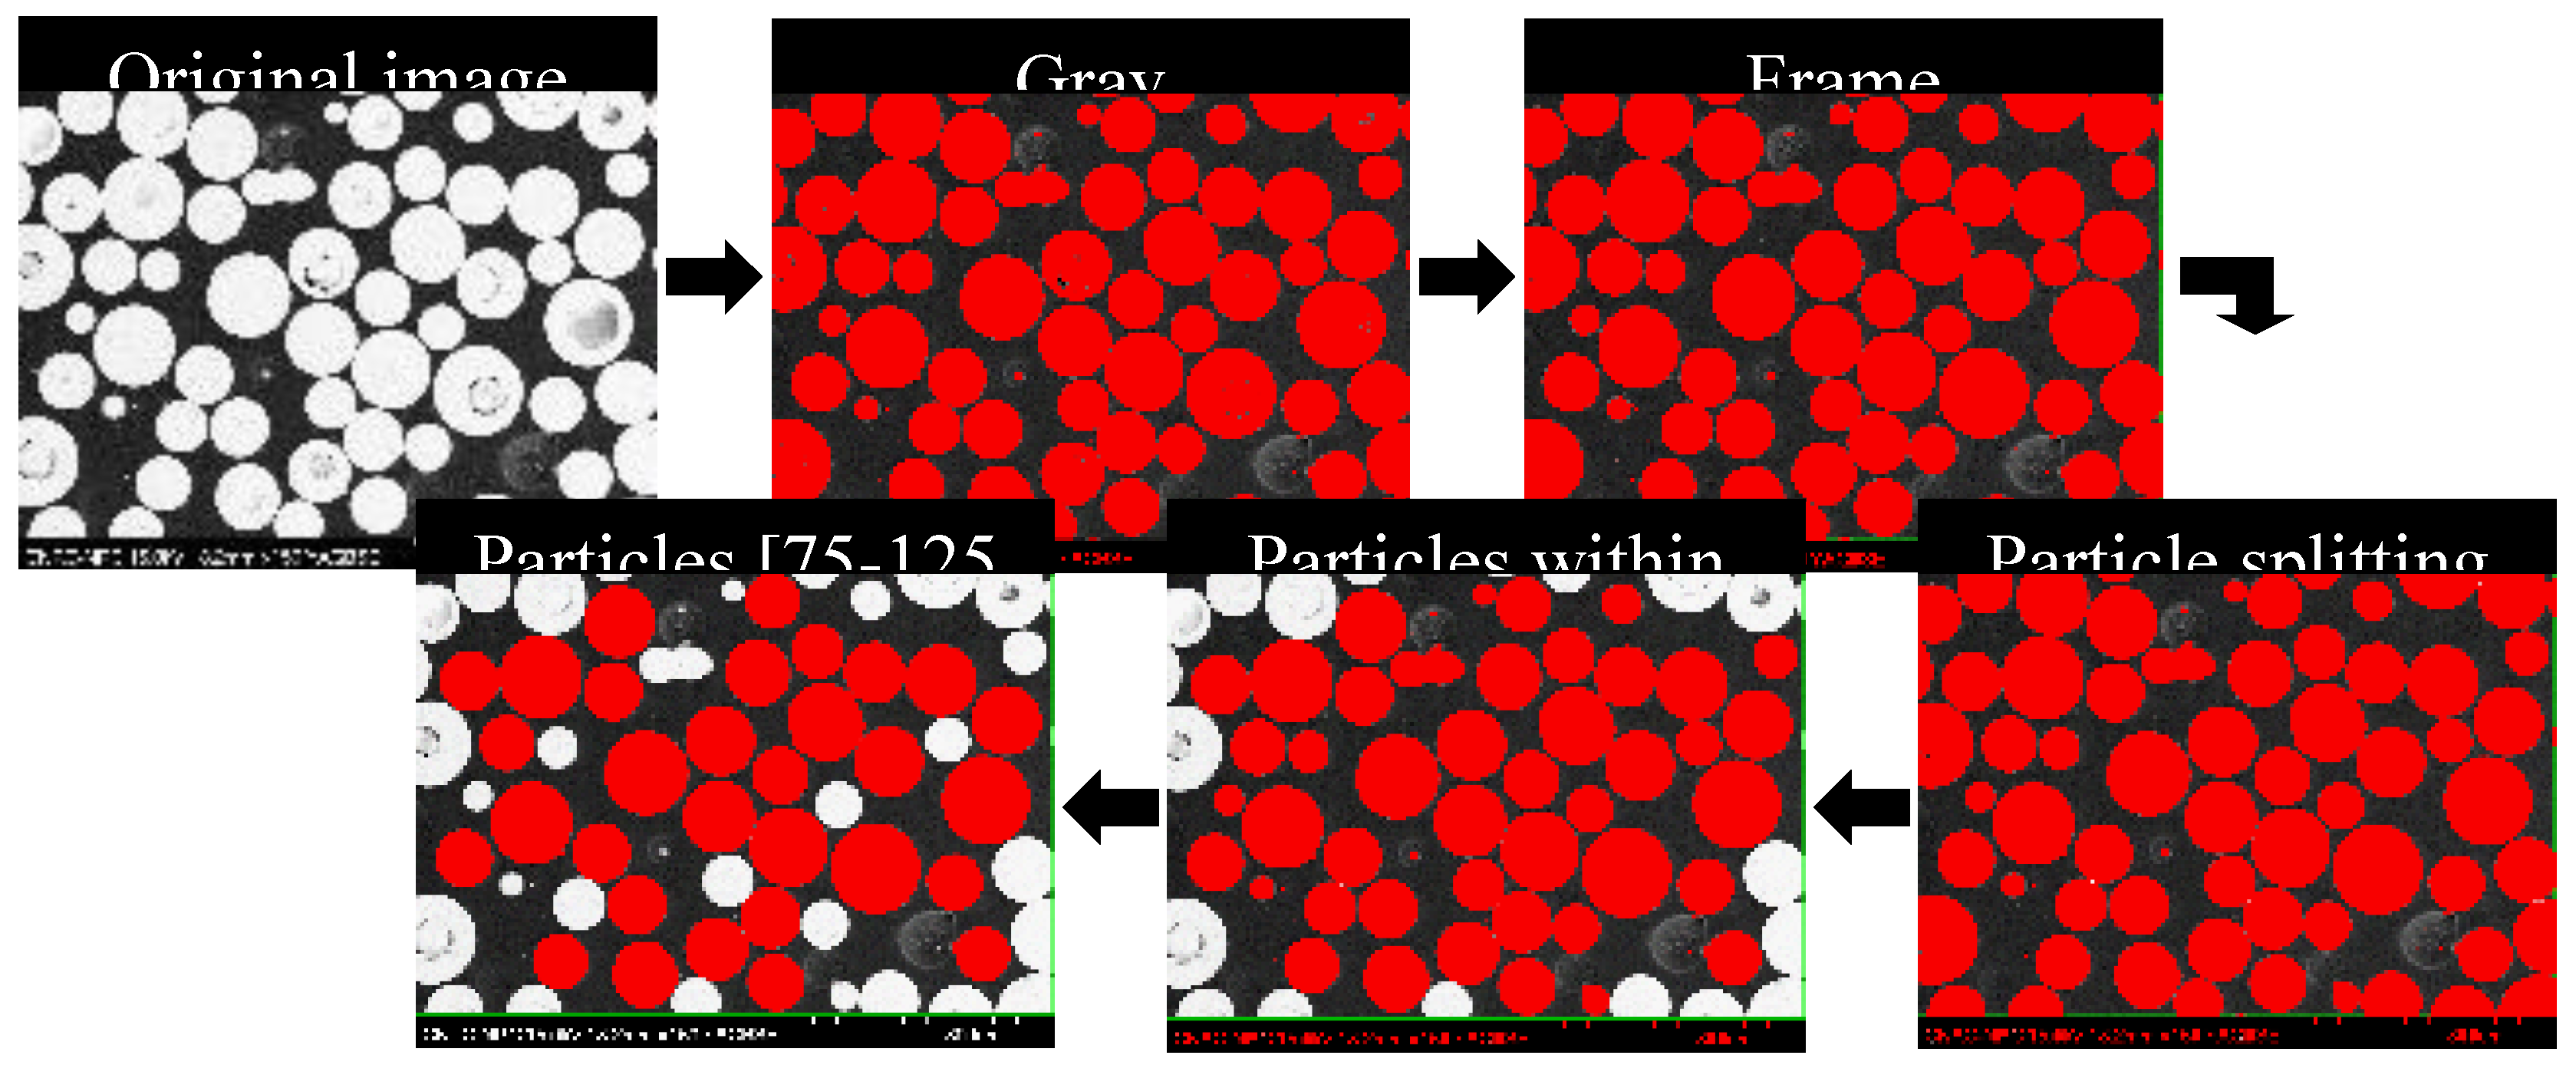
Images of metallographic samples were analyzed using Clemex Vision PE and ImageJ software (Error! Reference source not found.). For both systems, pixels were converted to the international system length units. The images were segmented and touching particles were separated. Particles intersecting the frame of the picture, incomplete or indistinct, and those outside the chosen particle size distribution were excluded from the analysis. The characteristics of the particles were then individually measured. Static automated imaging was accomplished with Morphologi (Malvern Panalytical), a fully automated system with an integrated sample dispersion unit that captures images and provides particle size and shape information.
Figure 5.
Image processing of metallographic samples.
In this study, several descriptors were utilized to analyze the shape characteristics of particles, with each descriptor having specific equations across different software platforms. The descriptor for convexity (Cx) is consistently defined across Clemex, ImageJ, and Morphologi as the ratio of the convex hull perimeter (PC) to the perimeter (P):
Cx = PC/P.
The ellipse ratio (Er) is calculated as the ratio of the best-fit ellipse width (EW) to its length (EL) in Clemex and ImageJ:
while in Morphologi, it is defined as the width (W) to length (L) ratio:
where the width is based on the longest major axis projection passing through the particle centroid with an orientation based on the minimal rotational energy and the length is the longest projection on minor axis passing through the centroid of the particle and perpendicular to the major axis. The extent ratio (EC), which measures the proportion of the particle's area (A) to its bounding ellipse, is expressed as
for Clemex and ImageJ, where XFmin and XFmax are the minimum and maximum Feret diameters, and as:
for Morphologi. The irregularity index (IR) varies significantly and is calculated as:
in Clemex, where ID and OD are the inner and outer circle diameters centered on the centroid of the particle,
in ImageJ, where MIC is the maximum inscribed circle, and
in Morphologi, where Deq is the equivalent diameter. Lastly, the roundness index (Rn) is uniformly defined across all software as
Er = EW/EL,
Er = W/L,
EC= 4A/(πXFminXFmax)
EC= 4A/(πWL)
IR = (ELID)/(EWOD)
IR = (ELMIC)/(EWXFmax)
IR = (DeqW)/(LXFmax)
Rn = 4A/(πXFmax)2.
These descriptors provide comprehensive metrics for assessing particle morphology across various analytical tools.
3. Results
3.1. Image Analysis of Schematized Particles
The use of schematized particles allows to outline morphological features frequently detected in AM powders and compare basic measurements with their resulting calculated descriptors. Table 1 summarizes basic measurement differences (∆) obtained by Clemex and ImageJ:
where MClemex and MImageJ correspond to Clemex and ImageJ measurements. It shows that the results obtained with these two software programs can be significantly different. This discrepancy may negatively impede the comparison of morphological features and shape analysis between laboratories.
∆=(MClemex-MImageJ )/ MClemex ×100,
The values obtained using Clemex are higher than those obtained with ImageJ, but the variation between the two is below 1% for most of the descriptors. This holds true for all basic measurements considered in this study, except for the perimeter, which is smaller by 3 to almost 5% with Clemex when compared to ImageJ. This difference can be explained by the software’s built-in routine used to measure the perimeter. For Clemex, the perimeter is calculated as the sum of all borders belonging to a selected plane interpolated by three points. On the other hand, ImageJ considers an edge pixel as one and a corner pixel as the square root of two (Figure 6). There is limited additional information on perimeter calculations, making it difficult to explain why there is a constant difference of 3 to 5%. The inherent calculation algorithms of each software lead to dissimilar results. MorphoLibJ plug-in from ImageJ uses Crofton’s formula, which relates the length of a curve to the expected number of times a random line intersects it. Inversely, the results with this plug-in led to lower perimeter values by 3 to 5% when compared with Clemex.
These results highlight the importance of thresholding to obtain similar results when using different systems. Table 2 presents the percentage difference of the descriptors used in the sequential methodology for the schematized particles acquired by Clemex and ImageJ. For most of the descriptors, the values obtained from Clemex and ImageJ vary by less than 1%.
However, one descriptor stands out: the convexity index, which involves the convex perimeter and perimeter measurements. Figure 7 demonstrates that the convexity index values measured with the ImageJ routine are significantly lower than the values measured with Clemex. Consequently, to identify particles with numerous satellites, the convexity index must be lower than 0.95 for Clemex and 0.90 for ImageJ respectively.
As illustrated in Figure 8, the extent ratio descriptor used to identify particles with a single growing satellite shows equivalent behavior with both Clemex and ImageJ. The same holds true for the descriptors used to identify elongated particles (ellipse ratio, Er) as shown in Figure 9, and one of the two ratios used to categorize faceted particles (Roundness index, Rn) as shown in Figure 10.
However, it is worth noting that ImageJ does not calculate the internal and external diameters, which are defined as the inner and outer circle diameter centered on the centroid of the particle. The adaptation of the irregularity index (IR) is discussed in the next section with the analysis of the metallic powders.
3.2. Image Analysis of Metallic Powder Samples
The first step of the sequential methodology is to discriminate particles with multiple satellites from those with a single satellite, as well as elongated, faceted and spherical particles. Analyses using Clemex and ImageJ were performed on the same images. Since both software allow the tracking of particles, it was possible to compare, particle by particle, the values of the descriptors calculated with the exported results. This direct comparison ensures that discrepancies in descriptor values can be attributed to the software's analytical methods rather than differences in the sample images themselves.
As mentioned previously, the convexity index provided unreliable results between Clemex and ImageJ, even after adjusting the threshold. This descriptor is a ratio of the convex perimeter to the perimeter measurements. Since the perimeter values differ significantly between the two software, results for the convexity index can be unreliable. To overcome this issue, it is possible to evaluate particles with either a single or multiple satellites without using the convexity index, as shown in Figure 11, by adjusting the corrected xtent threshold.
The black bars on the graph represent the sum of particles with satellites, whether single or multiple, using the original methodology. The striped and doted bars represent the percentage of particles with satellites, captured without using the convexity index, with a threshold of the corrected extent ratio of 0.955 and 0.95 using Clemex and ImageJ respectively. The threshold was adjusted to preserve individual particle categorization and thus maintain the overall percentage of particles with satellites. This approach allows for a more consistent comparison across different software platforms, ensuring that the analysis remains robust despite the inherent discrepancies in measurement calculations.
An ellipse ratio with a threshold of 0.90 provided the best results across all powders, as shown in Figure 12. Once again, the descriptors effectively classify the different powders, and significant differences can be observed between the powders with all systems used. This consistency underscores the utility of the ellipse ratio as a reliable metric for distinguishing elongated particle shapes across various types of metallic powders, regardless of the imaging system employed.
At this stage of the analysis, the remaining particles are neither associated with satellites nor exhibit elongated shapes. To classify a particle spherical, it must meet both the roundness and irregularity index constraints with a threshold above 0.90; otherwise, the particle is considered faceted. This dual-criteria approach ensures a more precise categorization of particle shapes, distinguishing clearly between spherical and faceted forms based on their geometric properties.
The roundness index provided similar results when measured with both ImageJ and Clemex software, indicating consistency in this descriptor across different analysis platforms. The irregularity index, defined as rS/rE, where rS is the ratio of the internal to external diameters and rE the ellipse ratio, presents a challenge in standardization across software due to measurement capabilities. Although ImageJ does not measure internal (ID) and external (OD) diameters directly, it assesses the maximum inscribed circle (MIC) through MorphoLibJ plug-in. Consequently, in the absence of direct ID and OD measurements in ImageJ, ID was substituted with MIC, and OD was replaced with the maximum Feret diameter.
Figure 13 illustrates the differences between ID, OD and MIC, highlighting how these substitutions impact the calculation of the irregularity index. This adaptation allows for a more uniform application of the irregularity index across different software, ensuring that the analysis remains robust despite the inherent discrepancies in measurement capabilities. This approach helps maintain the integrity of particle shape analysis, particularly in distinguishing between spherical and faceted particles.
The application of a threshold of 0.90 with the modified irregularity index in ImageJ resulted in a similar proportion of categorized particles for titanium powder samples as obtained with the Clemex system. However, for stainless-steel and aluminum powder samples, this threshold led to an underestimation of proportions, as shown in Figure 14. This discrepancy suggests that while the modified index works well for certain materials, it may not be universally applicable across different types of metallic powders without further adjustments. To address this issue, the threshold was adjusted to preserve the accuracy of individual particle categorization, thereby maintaining the overall percentage of faceted particles.
When analyzing aluminum particles classified as faceted by Clemex, it was observed that many classifications were influenced by touching particles that had been separated using the automatic bridge removal tool. This separation process often creates an artificial rough surface, which can misleadingly suggest a facetted morphology (as shown in Figure 15). Additionally, the internal and external diameters calculated by Clemex are generally smaller and larger respectively, compared to the MIC and maximum Feret diameter calculated by ImageJ. This discrepancy affects the irregularity index, leading to an overestimation of faceted particles.
To mitigate these inconsistencies and improve the accuracy of particle classification, it would be beneficial to exclude touching particles from the analysis. This approach would avoid the artificial effects introduced by particle separation tools, ensuring that the classification of particles as faceted is based on their inherent morphological characteristics rather than artifacts introduced during image processing. Such a strategy would help standardize results across different software and provide a more reliable understanding of particle morphology.
3.3. Automated Static Image Analysis of Metallic Powder Samples
Morphologi, as an automated imaging system, employs an integrated sampler to disperse the powder and analyze it. This method involves analyzing particles dispersed on a substrate, which contrasts with the analysis of polished cross sections discussed in the previous sections of this paper. The geometrical measurements and descriptors used in Morphologi differ significantly from those utilized in Clemex and ImageJ software. Specifically, Morphologi does not provide measurements such as minimum Feret, ellipse length, ellipse width, internal diameter and external diameter. Due to these differences, several descriptors needed to be adapted to ensure comparability of results across different systems.
The width and length of the particle are introduced for EC, ellipse and irregularity ratios. The length of the particle is defined as the maximum span between two points projected on a major axis passing through the centroid, while the width is the maximum projected length of the minor axis, which lies perpendicular to the major axis. With a threshold of 0.955, the proportions of particles with satellites were found to be comparable to the results obtained using Clemex, as summarized in Figure 16. This indicates that despite the differences in measurement capabilities between the systems, the adapted descriptors can still provide consistent results for certain types of particles.
However, the modified ratio for elongated particles, akin to the aspect ratio, proved to be a less robust parameter as defined in ISO9276-6. The results converged for the stainless-steel samples. In contrast, the results for aluminum and titanium powders were under and overestimated, respectively. This discrepancy suggests that while the adapted descriptors work well for some materials, they may not be universally applicable across all types of metallic powders without further refinement.
For analyzing faceted particles, the roundness descriptor can be effectively utilized, but the irregularity ratio poses challenges due the absence of certain measurements in some systems. To adapt the irregularity ratio for use in systems that do not measure internal and external diameters, a modified approach was taken. This involved multiplying the ratio of the particle's width to its length by the ratio of the equivalent circle diameter to the maximum Feret diameter. Setting a threshold of 0.93 for this modified irregularity ratio yielded results that were comparable to those obtained for stainless steel powders. However, the results for titanium and aluminum powders were under-evaluated using this threshold.
4. Discussion
When considering the overall effectiveness of particle shape classification, it is clear that automatic static image analysis software can achieve reliable results. However, the method of analysis must be carefully considered when using an automated system. For instance, the particles analyzed with metallographic cross-section images capture only one plane of each particle. This method can limit the understanding of the full three-dimensional morphology of the particles. On the other hand, scanning electron microscopy (SEM) offers greater resolution and is more sensitive to certain morphological features, making the analysis potentially more reliable [19]. SEM provides a more comprehensive view of the particle's surface and shape, which can be crucial for accurate classification.
Automated systems are often equipped with a camera that captures the projection of the particles onto a plane. While this method is efficient, it also means that the image represents a 2D projection rather than a 3D structure, which can sometimes lead to misinterpretation of the particle shapes. Additionally, the dispersion unit in these systems helps to reduce the occurrence of touching particles, although it can also lead to particles being deposited in a favored orientation, potentially biasing the results.
The sampling method, the instrument used, and the descriptors chosen are all critical factors that can influence the outcome of the analysis. Ideally, to ensure consistency and comparability, the same images taken from the automated system should be exported and analyzed across different software platforms. This approach would allow for a direct comparison of results from different software, highlighting discrepancies and enabling the refinement of analysis techniques to ensure accuracy across different systems. This cross-validation can help establish standardized protocols for particle shape analysis, enhancing the reliability and reproducibility of results in scientific and industrial applications.
Table 3 summarizes the descriptor and their respective proposed threshold values using the sequential methodology to classify typical morphologies found in metallic powders used in additive manufacturing. This comprehensive approach highlights the inherent challenges and discrepancies that can arise when using different analytical tools and methods.
4.1. Key Differences and Challenges
Algorithm Variability: The study reveals significant differences in how various software evaluate parameters such as the perimeter. These differences are often due to the underlying algorithms used by each software, which can affect the accuracy and comparability of results.
Measurement Availability: The availability of certain measurements, such as ellipse length or minimum Feret diameter, varies between software. This variability can limit the ability to perform consistent and comprehensive analyses across different platforms.
Image Resolution Sensitivity: Some descriptors or basic measurements are sensitive to the resolution of the images used. Higher resolution images generally provide more detailed and accurate data, which can significantly influence the results of particle shape analysis.
4.2. Recommendations for Effective Comparison
Thorough Evaluation: Before comparing results obtained using different procedures, a thorough evaluation of the methodologies, including the resolution of images and the specific measurements used, is essential. This ensures that comparisons are based on equivalent and reliable data.
Establishing a Baseline: When using different software or systems, establishing a baseline for comparison is crucial. This involves standardizing the images, analytical equations, and measurements used across all platforms to ensure that the results are comparable [13].
Adjustments of Descriptors and Thresholds: Even with standardized images and measurements, results may vary from one software to another. In such cases, it is necessary to adjust descriptors and thresholds to align the results more closely.
Challenges with Automatic Systems: Using automatic systems complicates the ability to compare the same powder particles across different setups. This issue is exacerbated in interlaboratory comparisons, especially if there are differences in resolution, calculation methods, and sample sizes.
5. Conclusions
Particle shape plays a critical role in influencing the behavior of powder materials such as flowability, packing density, and spreadability in additive manufacturing (AM) processes. These characteristics directly impact productivity, process reliability, and the quality of the final parts. This study focuses on comparing powder shape classification using different image analysis methods: traditional 2D metallographic image analysis on commercial (Clemex Vision PE) and open-source (ImageJ) software, and an automated 2D system (Morphologi). Automated imaging instruments, designed for industrial environments, offer significant advantages by allowing direct analysis on a sample, bypassing the need for traditional embedding, grinding, and polishing.
Key Findings:
• Classification Accuracy: All three software systems can classify particles with satellites effectively using a corrected extent ratio, with maximum variations slightly above 3%. This demonstrates a high level of consistency across different platforms.
• Ellipse Ratio for Elongated Particles: The Ellipse ratio is particularly effective for identifying elongated particles, especially in sphere-shaped powder samples. Variations near 15% were observed when using a less robust ratio with the automated system.
• Methodological Adjustments: Overall, particle shape classification can be achieved using comparable but adjusted methodologies across different systems. This adaptability is crucial for ensuring consistent and reliable results.
Challenges and Recommendations:
• Complexity of Particle Morphology: No single shape descriptor can fully capture the complexity of particle morphology, which is inherently a three-dimensional feature. This complexity is often simplified in 2D image analysis, as noted in ISO 9276-6, which primarily accommodates 2D-based definitions and dimensions [15].
• Variability in Measurement Capabilities: Not all image analysis software measure basic dimensions such as the perimeter or report shape descriptor values in the same way. This variability can lead to discrepancies in powder characterization results obtained by various laboratories.
Future Directions:
• Linking Morphology to Powder Behavior: Further studies are needed to link particle morphological classification fingerprints to powder properties and behavior in AM processes. Understanding this relationship will be pivotal in predicting and controlling the performance of powder feedstocks.
• Development of New Standards: The insights gained from these studies will support the development of new standards and contribute to a better understanding of the relationship between powder attributes and final part quality. This is essential for advancing the field of additive manufacturing and ensuring the production of high-quality parts.
By addressing these challenges and exploring these future directions, the field can move towards more standardized and precise methods for particle shape analysis, enhancing the overall effectiveness of AM processes.
Author Contributions
“Conceptualization, C.C., F.B., R.P and L-P.L.; methodology, C.C. and F.B.; software, C.C. and E.P.; validation, C.C and E.P.; formal analysis, C.C and E.P..; investigation, C.C. and E.P.; resources C.C; data curation, E.P.; writing—original draft preparation, C.C. and E.P.; writing—review and editing, C.C. and E.P.; visualization, C.C. and E.P; supervision, C.C.; project administration, C.C. All authors have read and agreed to the published version of the manuscript.”
Data Availability Statement
The raw data supporting the conclusions of this article will be made available by the authors on request.
Conflicts of Interest
The authors declare no conflicts of interest.
Abbreviations
The following abbreviations are used in this manuscript:
| Al | Aluminium |
| AM | Additive Manufacturing |
| BSE | Backscattered Electron |
| Cx | Convexity Index |
| EB-PBF | Electron Beam Powder Bed Fusion |
| Er | Ellipse Ratio |
| EC | Extent Ratio |
| ID | Inner Diameter |
| IR | Irregularity Ratio |
| LPBF | Laser Powder Bed Fusion |
| MIC | Minimum Inscribes Circle |
| OD | Outer Diameter |
| Rn | Roundness Index |
| SD | Standard Deviation |
| SEM | Scanning Electron Microscope |
| SS | Stainless Steel |
| Ti | Titanium |
References
- Lewis, G., Aspects of the Powder in Metal Additive Manufacturing: A Review. World Journal of Engineering and Technology, 2022. 10(2): p. 363-409. [CrossRef]
- Powell, D., et al., Understanding powder degradation in metal additive manufacturing to allow the upcycling of recycled powders. Journal of Cleaner Production, 2020. 268: p. 122077. [CrossRef]
- Ghods, S., et al., Electron beam additive manufacturing of Ti6Al4V: Evolution of powder morphology and part microstructure with powder reuse. Materialia, 2020. 9: p. 100631. [CrossRef]
- Tang, H.P., et al., Effect of Powder Reuse Times on Additive Manufacturing of Ti-6Al-4V by Selective Electron Beam Melting. JOM, 2015. 67(3): p. 555-563. [CrossRef]
- Capozzi, L.C., A. Sivo, and E. Bassini, Powder spreading and spreadability in the additive manufacturing of metallic materials: A critical review. Journal of Materials Processing Technology, 2022. 308: p. 117706. [CrossRef]
- Gaffin, N.D., et al., Effect of powder size and geometry on consolidation of Mo30%W alloy by spark plasma sintering. International Journal of Refractory Metals and Hard Materials, 2022. 108: p. 105944. [CrossRef]
- Gallagher, C., E. Kerr, and S. McFadden, Particle size distribution for additive manufacturing powder using stereological corrections. Powder Technology, 2023. 429: p. 118873. [CrossRef]
- Tan, J.H., W.L.E. Wong, and K.W. Dalgarno, An overview of powder granulometry on feedstock and part performance in the selective laser melting process. Additive Manufacturing, 2017. 18: p. 228-255. [CrossRef]
- Mussatto, A., et al., Influences of powder morphology and spreading parameters on the powder bed topography uniformity in powder bed fusion metal additive manufacturing. Additive Manufacturing, 2021. 38: p. 101807. [CrossRef]
- Zhao, Y., et al., Significance of powder feedstock characteristics in defect suppression of additively manufactured Inconel 718. Additive Manufacturing, 2020. 34: p. 101277. [CrossRef]
- Riener, K., et al., Influence of particle size distribution and morphology on the properties of the powder feedstock as well as of AlSi10Mg parts produced by laser powder bed fusion (LPBF). Additive Manufacturing, 2020. 34: p. 101286. [CrossRef]
- April, C. and S. John, Properties of Metal Powders for Additive Manufacturing: A Review of the State of the Art of Metal Powder Property Testing. 2012, NIST Interagency/Internal Report (NISTIR), National Institute of Standards and Technology, Gaithersburg, MD.
- Charbonneau, C., et al., Classification of Particle Shape Using Two-Dimensional Image Analysis. 2022. p. 25-39.
- Singh, P. and P. Ramakrishnan, Powder Characterization by Particle Shape Assessment. KONA Powder and Particle Journal, 1996. 14: p. 16-30. [CrossRef]
- ISO, Representation of results of particle size analysis — Part 6: Descriptive and quantitative representation of particle shape and morphology. 2008, International Organization for Standardization: Geneva, Switzerland.
- International, A., Standard Guide for Characterizing Properties of Metal Powders Used for Additive Manufacturing Processes. 2014, ASTM International: West Conshohocken, PA.
- International, A., Standard Guide for Additive Manufacturing – Feedstock – Particle Shape Image Analysis by Optical Photography to Identify and Quantify the Agglomerates/Satellites in Metal Powder Feedstock. 2022.
- Grace, J.R. and A. Ebneyamini, Connecting particle sphericity and circularity. Particuology, 2021. 54: p. 1-4. 54: p. 1-4. [CrossRef]
- Sutton, A.T.K., Caitlin S.; Leu, Ming-Chuan; Newkirk, Joseph William. Powders for Additive Manufacturing Processes: Characterization Techniques and Effects on Part Properties. in Proceedings of the 27th Annual International Solid Freeform Fabrication Symposium. 2016. Austin, TX.
Figure 1.
Sphericity (Clemex) or Circularity (ImageJ) of a perfect sphere in 2D.
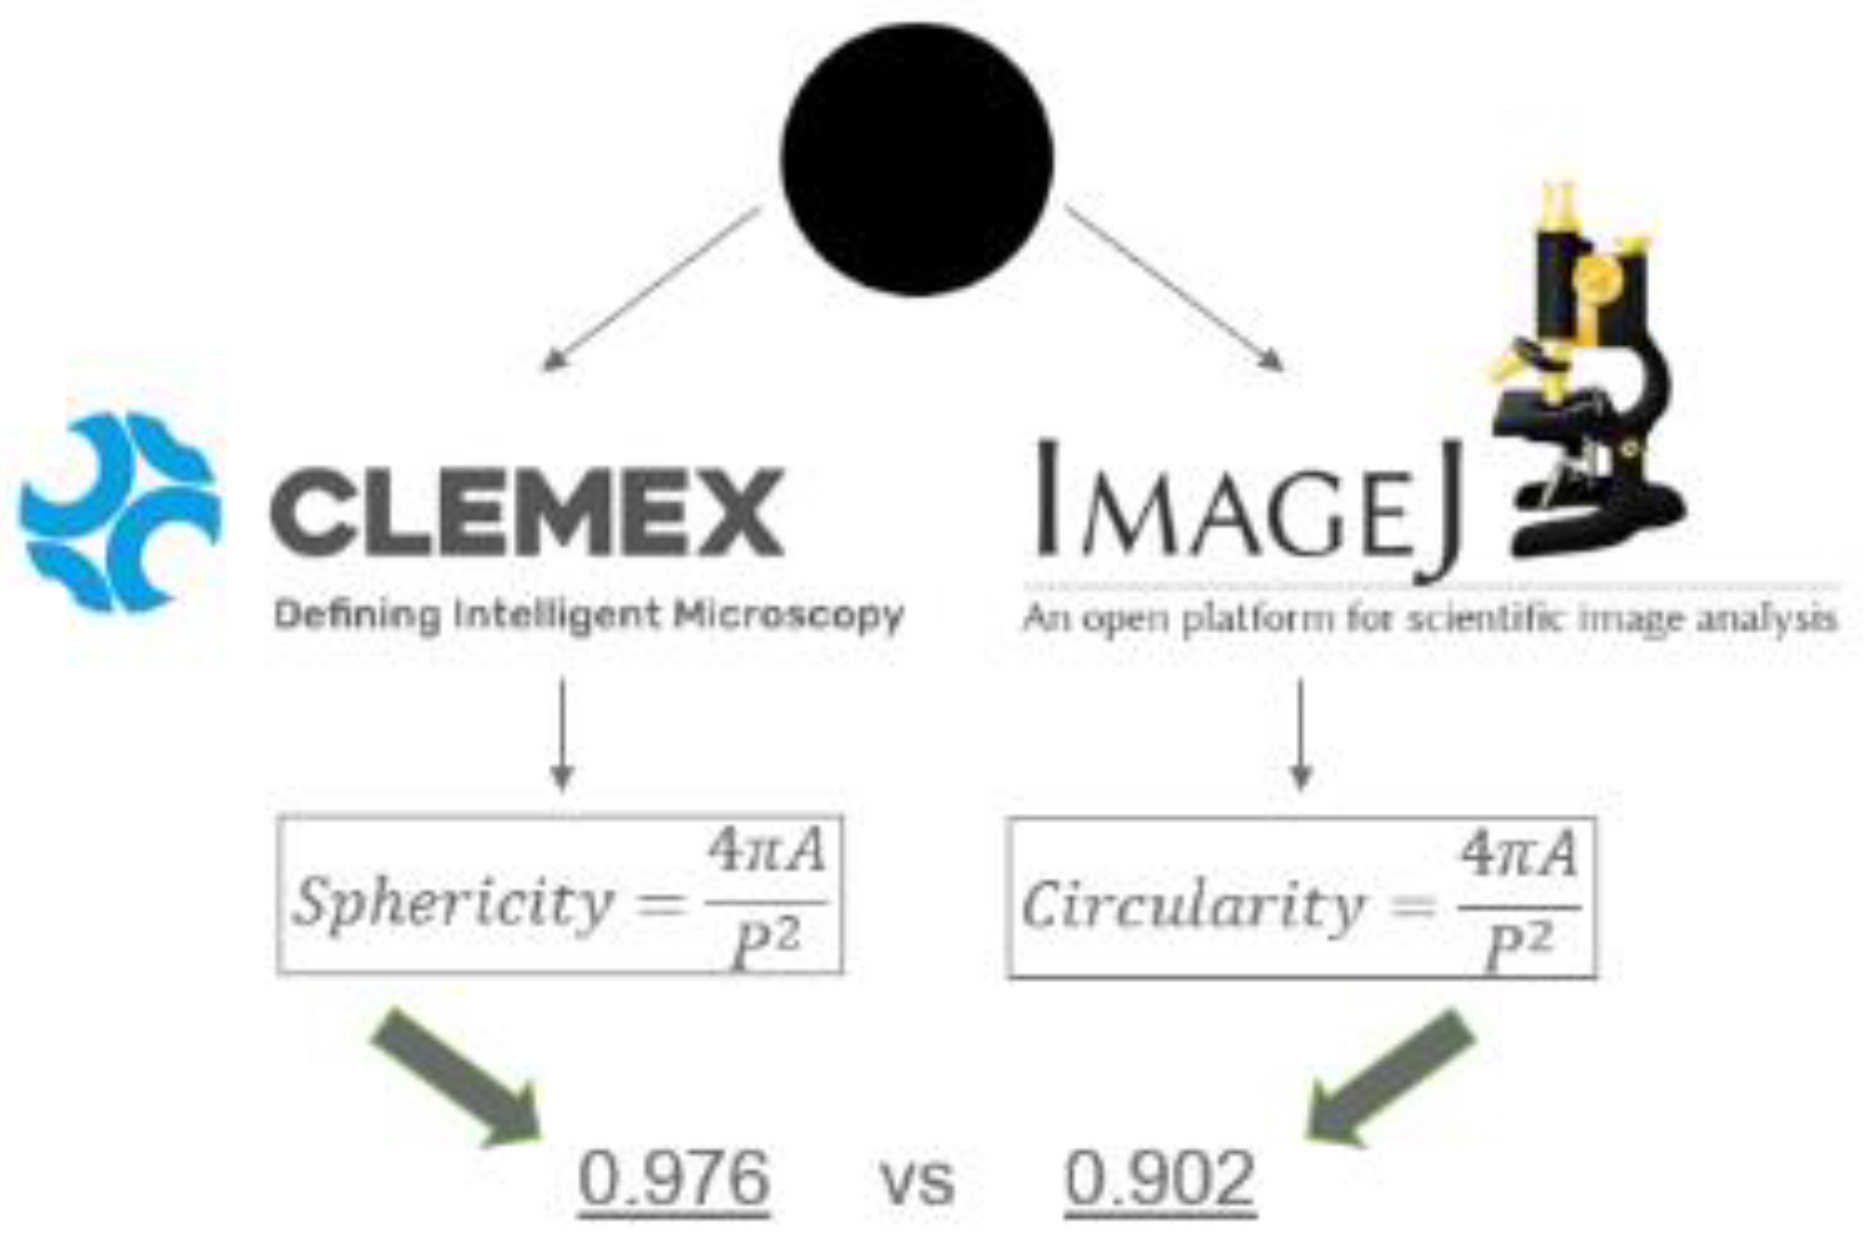
Figure 2.
Sequential methodology for classification of powder morphology.
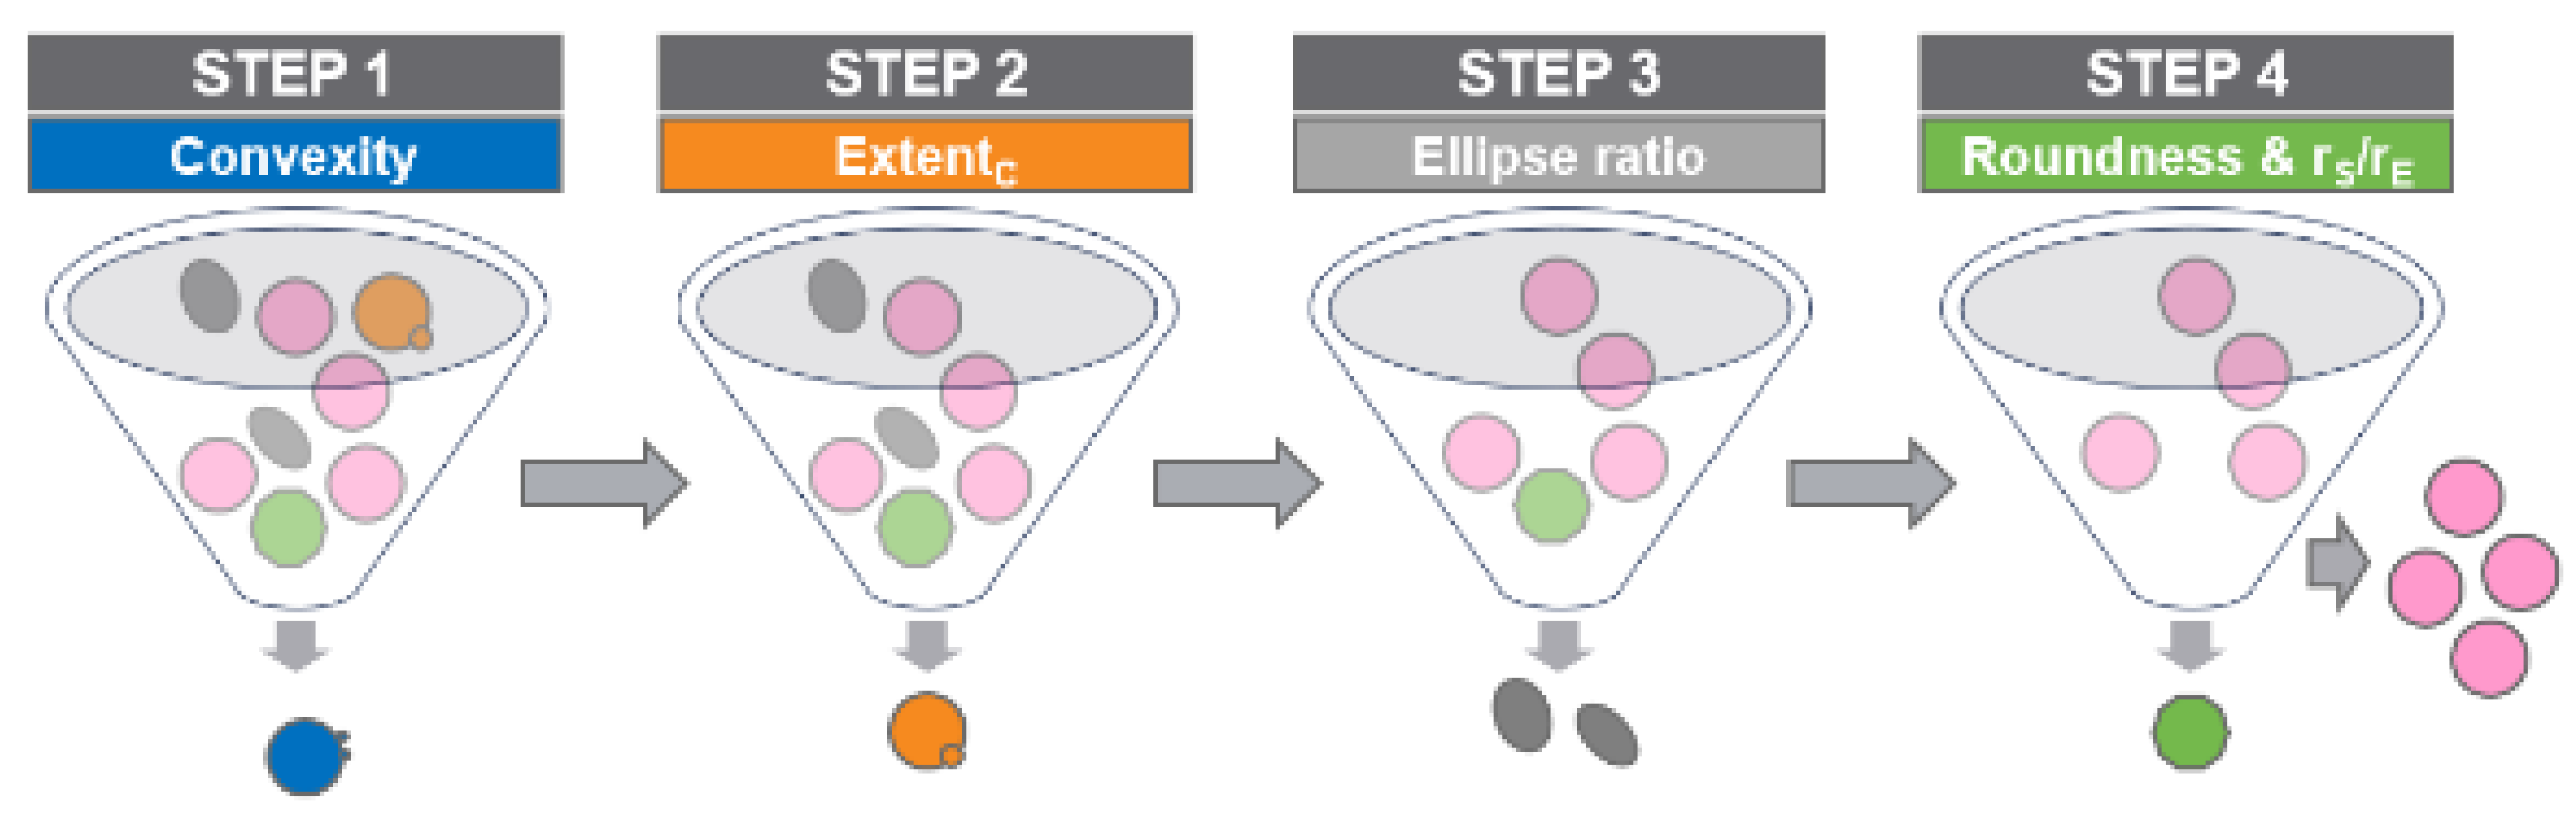
Figure 3.
Collection of schematized particles used for the evaluation of basic measurements and shape descriptors for a single satellite (a,b), elongated (c,d), multiple satellites (e) and faceted (f) particles.
Figure 3.
Collection of schematized particles used for the evaluation of basic measurements and shape descriptors for a single satellite (a,b), elongated (c,d), multiple satellites (e) and faceted (f) particles.
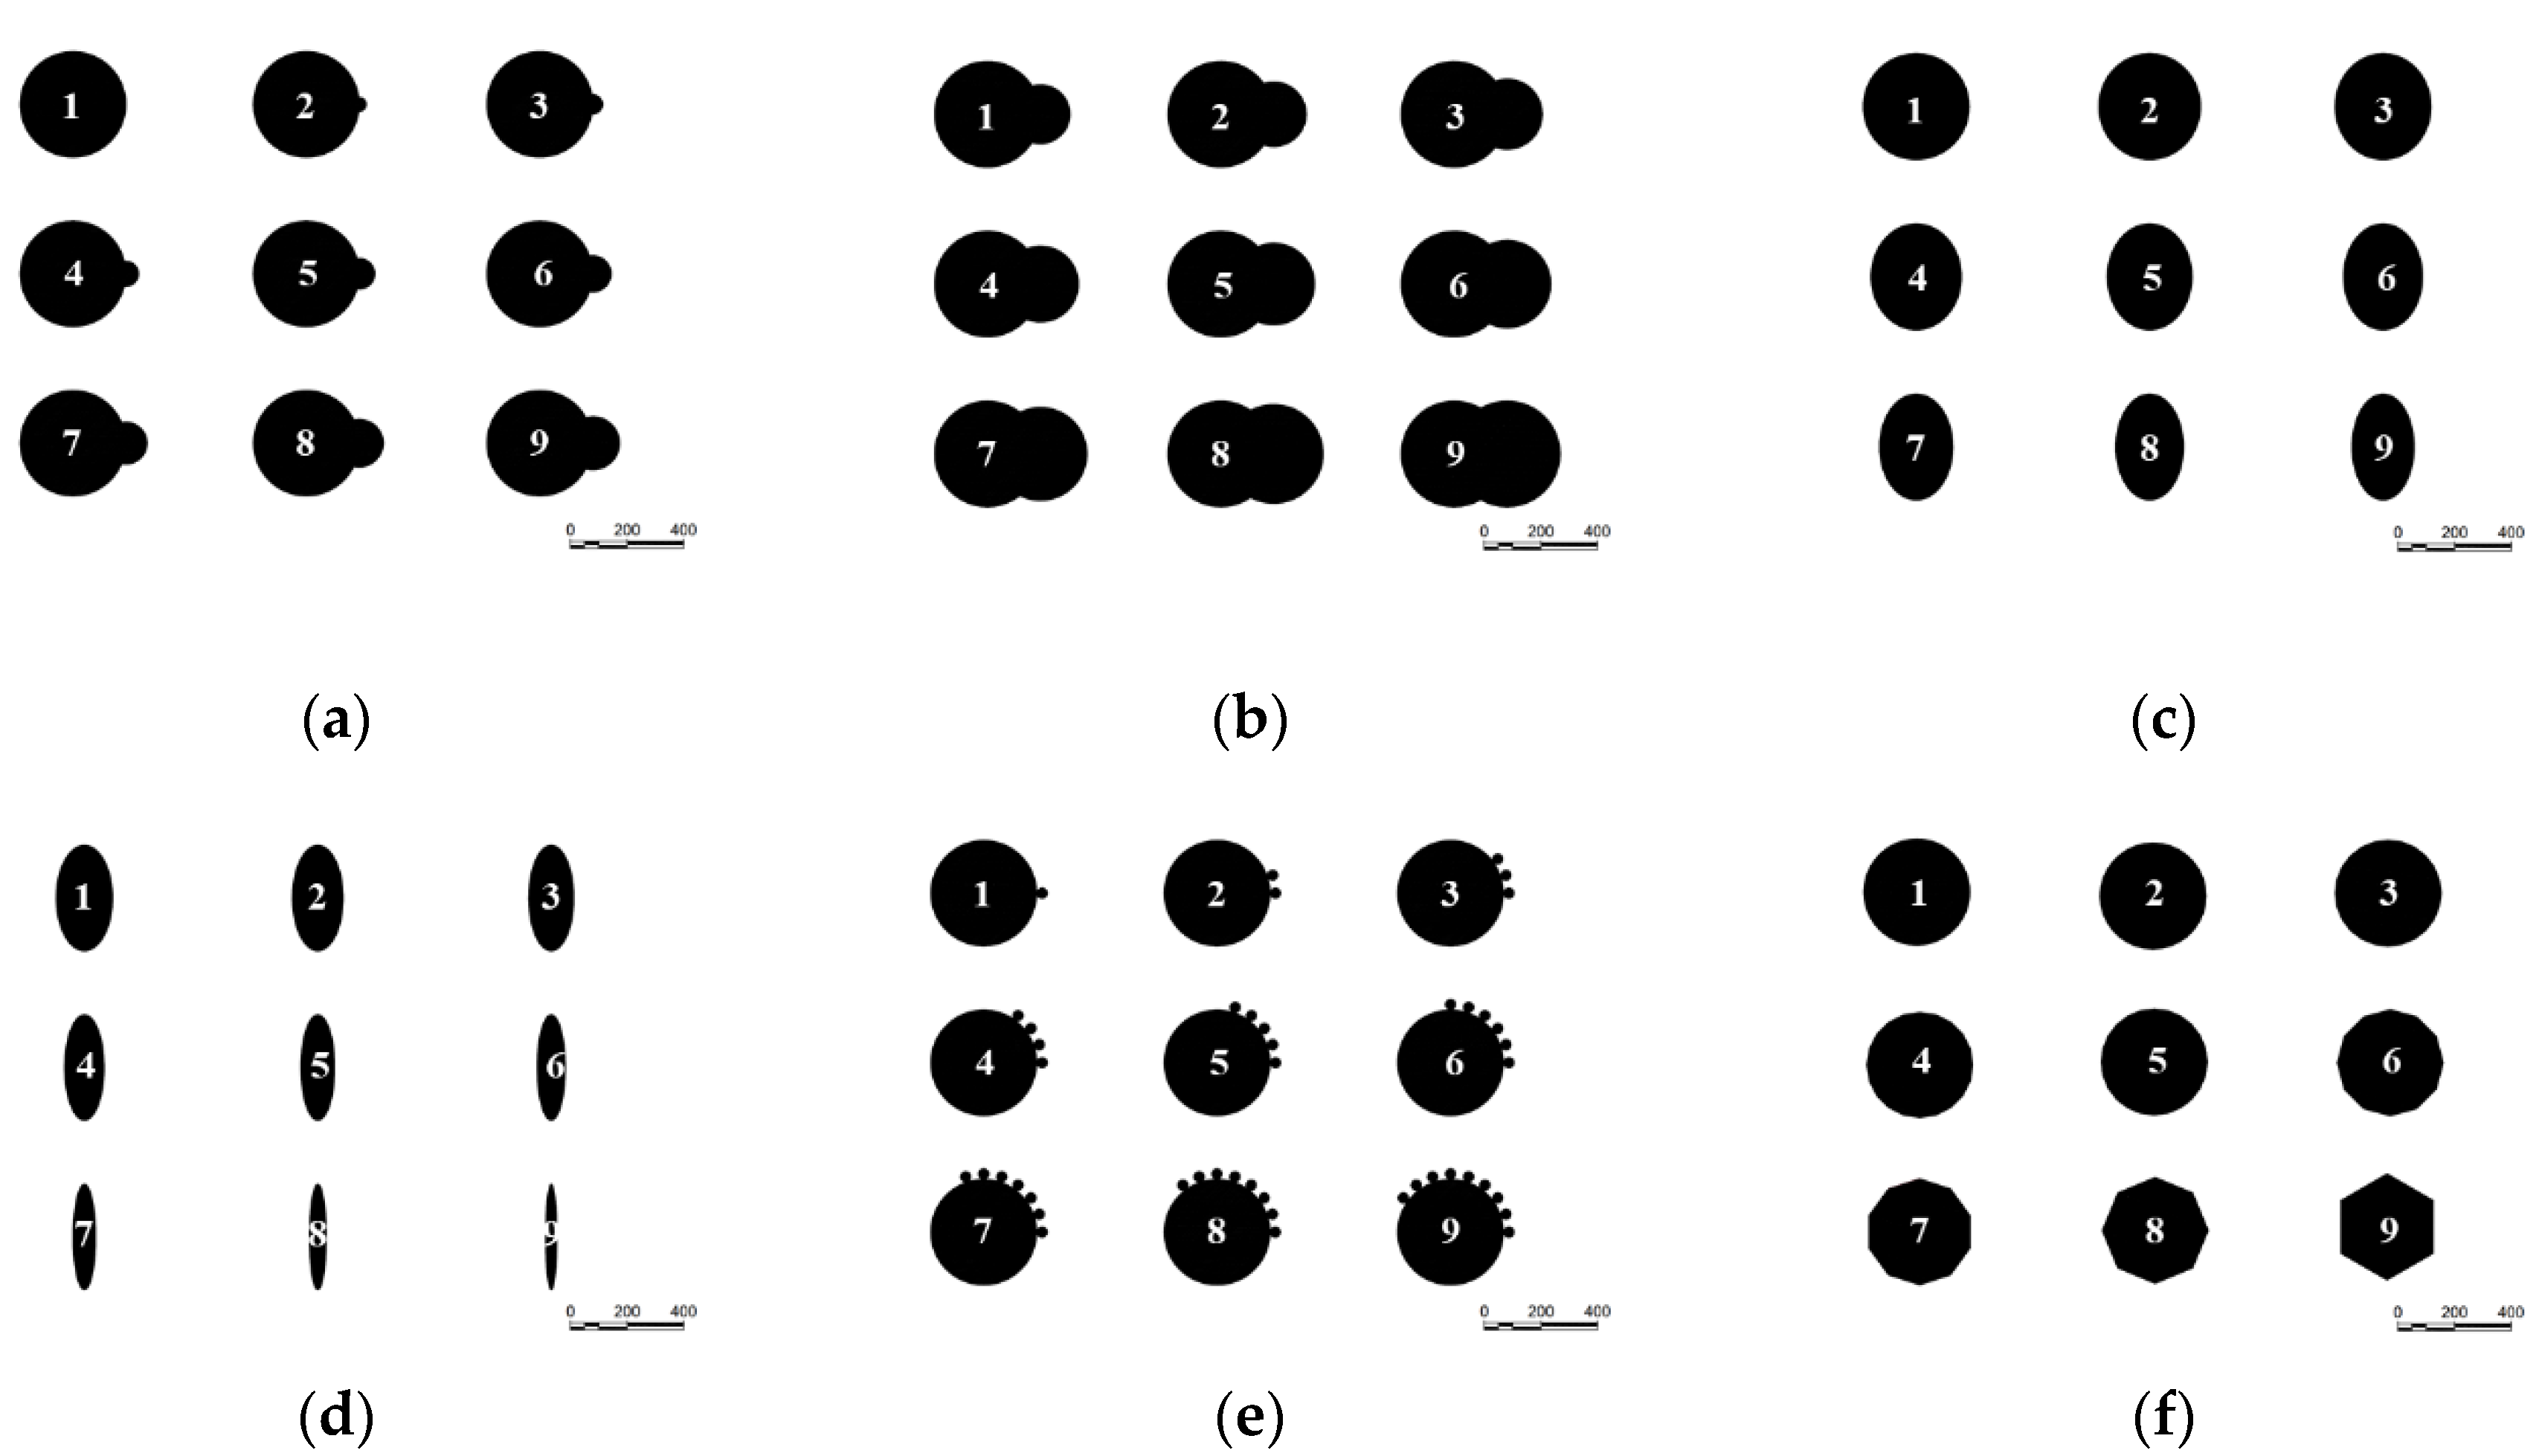
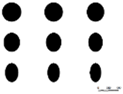
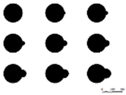
Figure 4.
Micrographs of the cross sections of the powder embedded in epoxy resins: (a) aluminum, (b) titanium, (c) as-received stainless steel and (d) recycled stainless steel powder samples.
Figure 4.
Micrographs of the cross sections of the powder embedded in epoxy resins: (a) aluminum, (b) titanium, (c) as-received stainless steel and (d) recycled stainless steel powder samples.
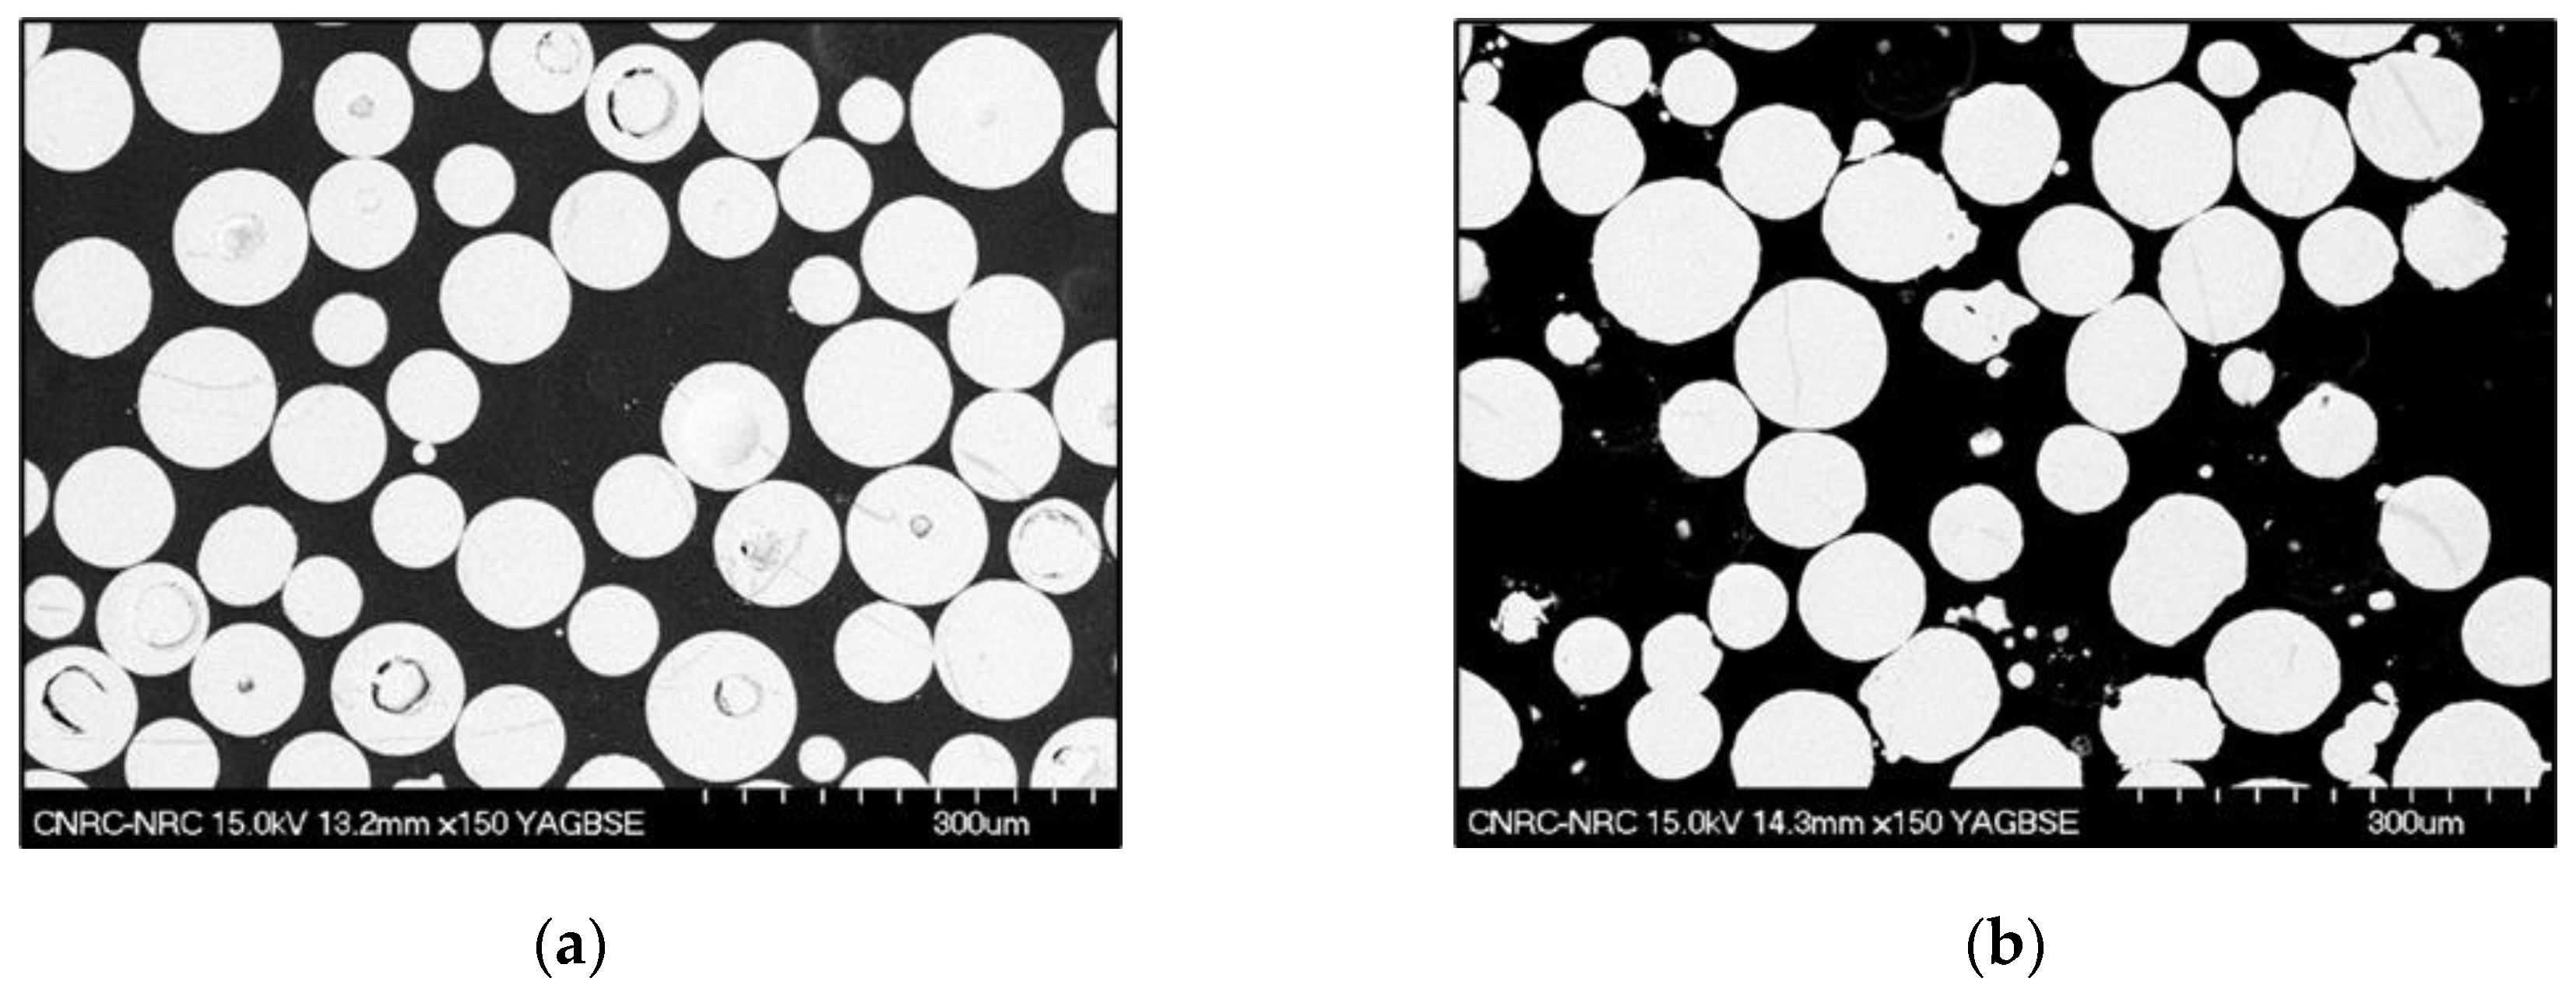
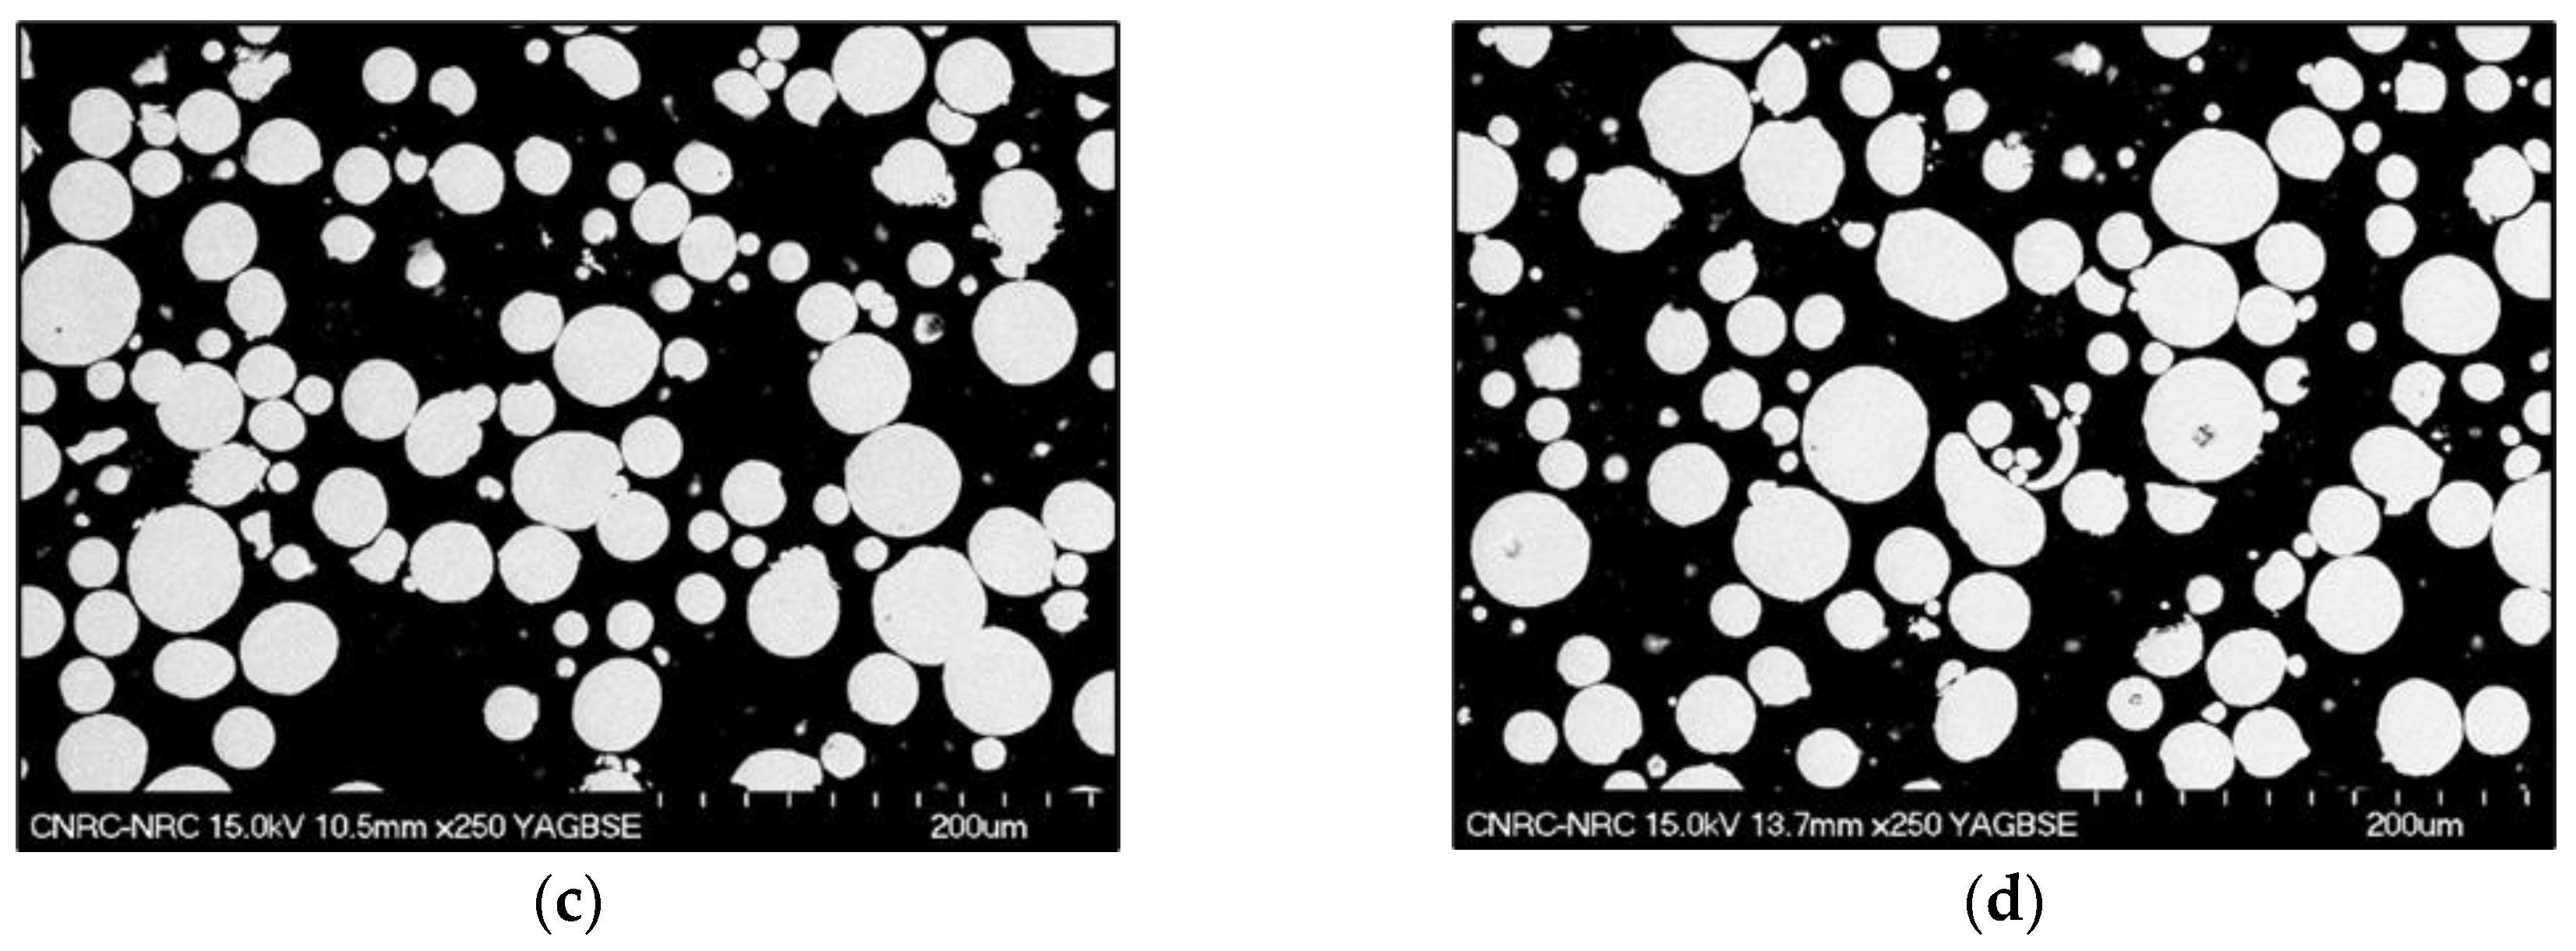
Figure 6.
Perimeter measurements using (a) Clemex, (b) ImageJ and (c) MorphoLibJ plug-in.
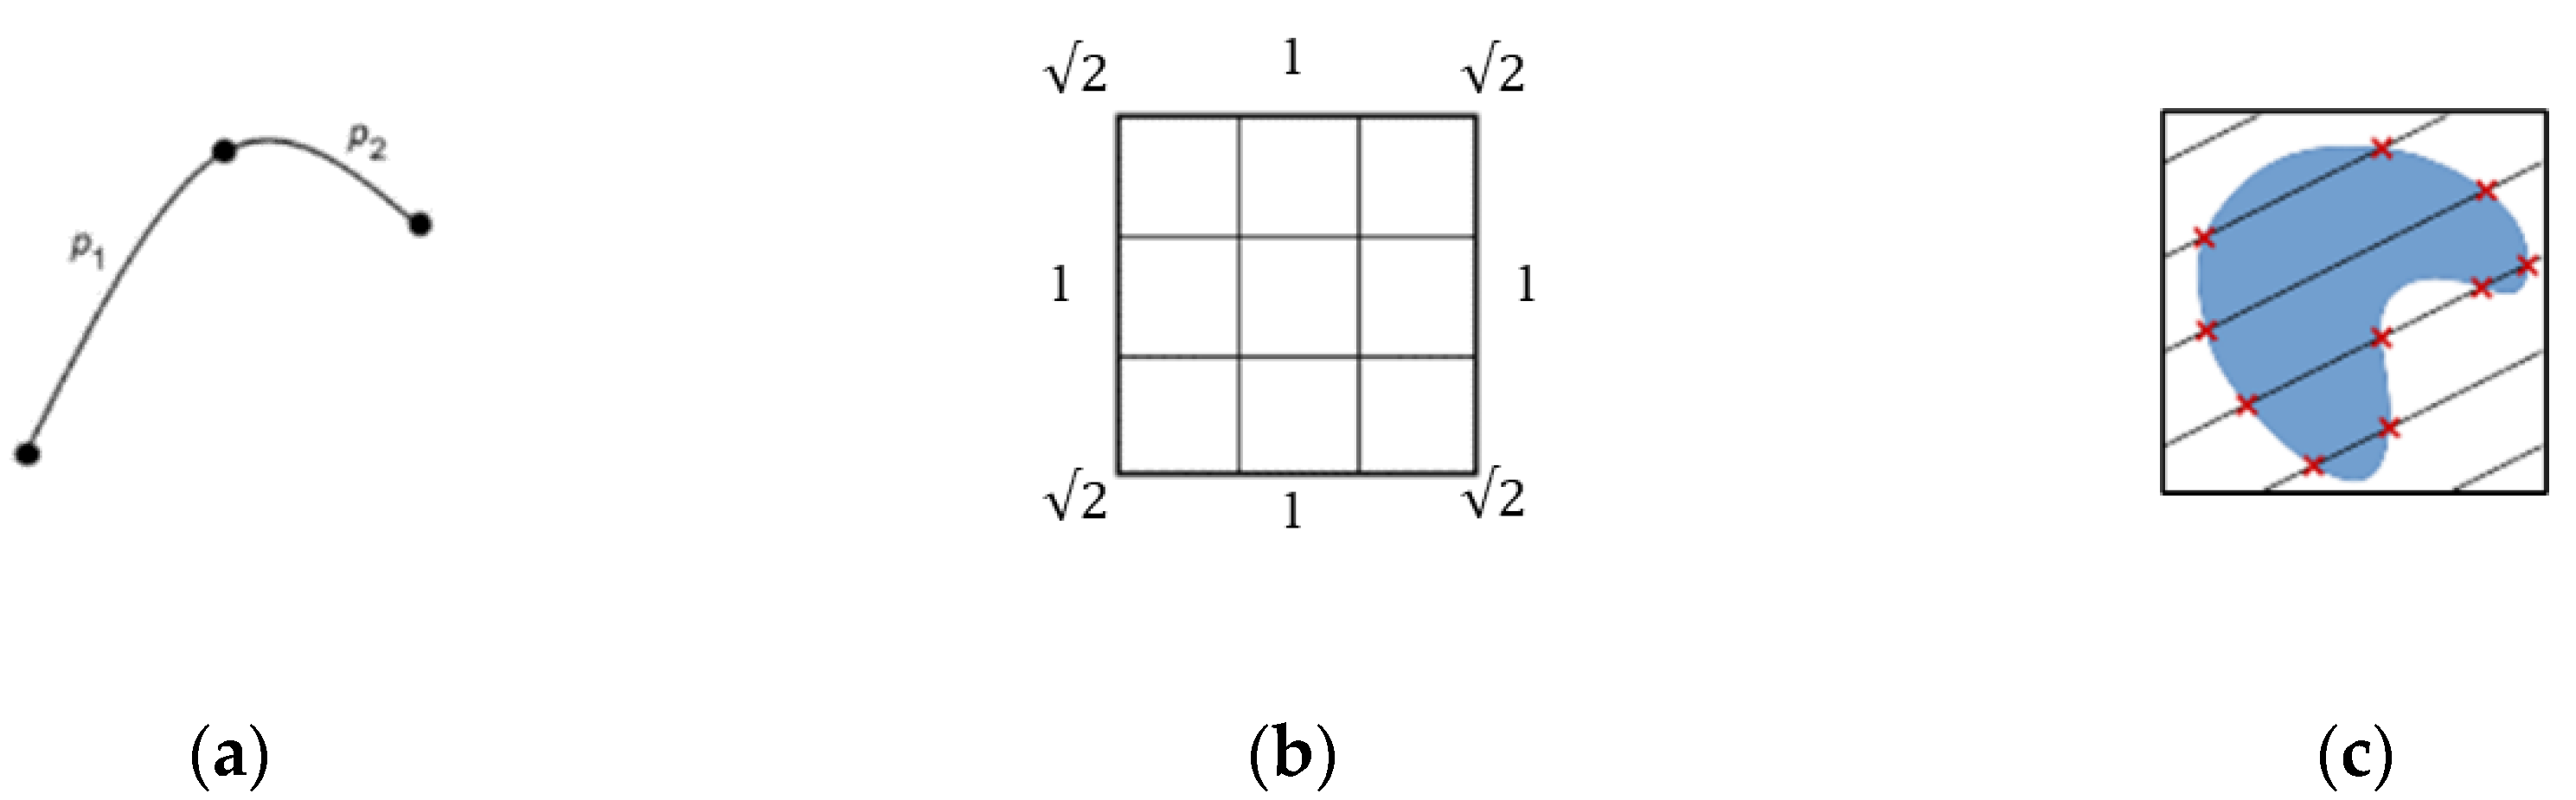
Figure 7.
Convexity index (Cx) for particles with multiple satellites.
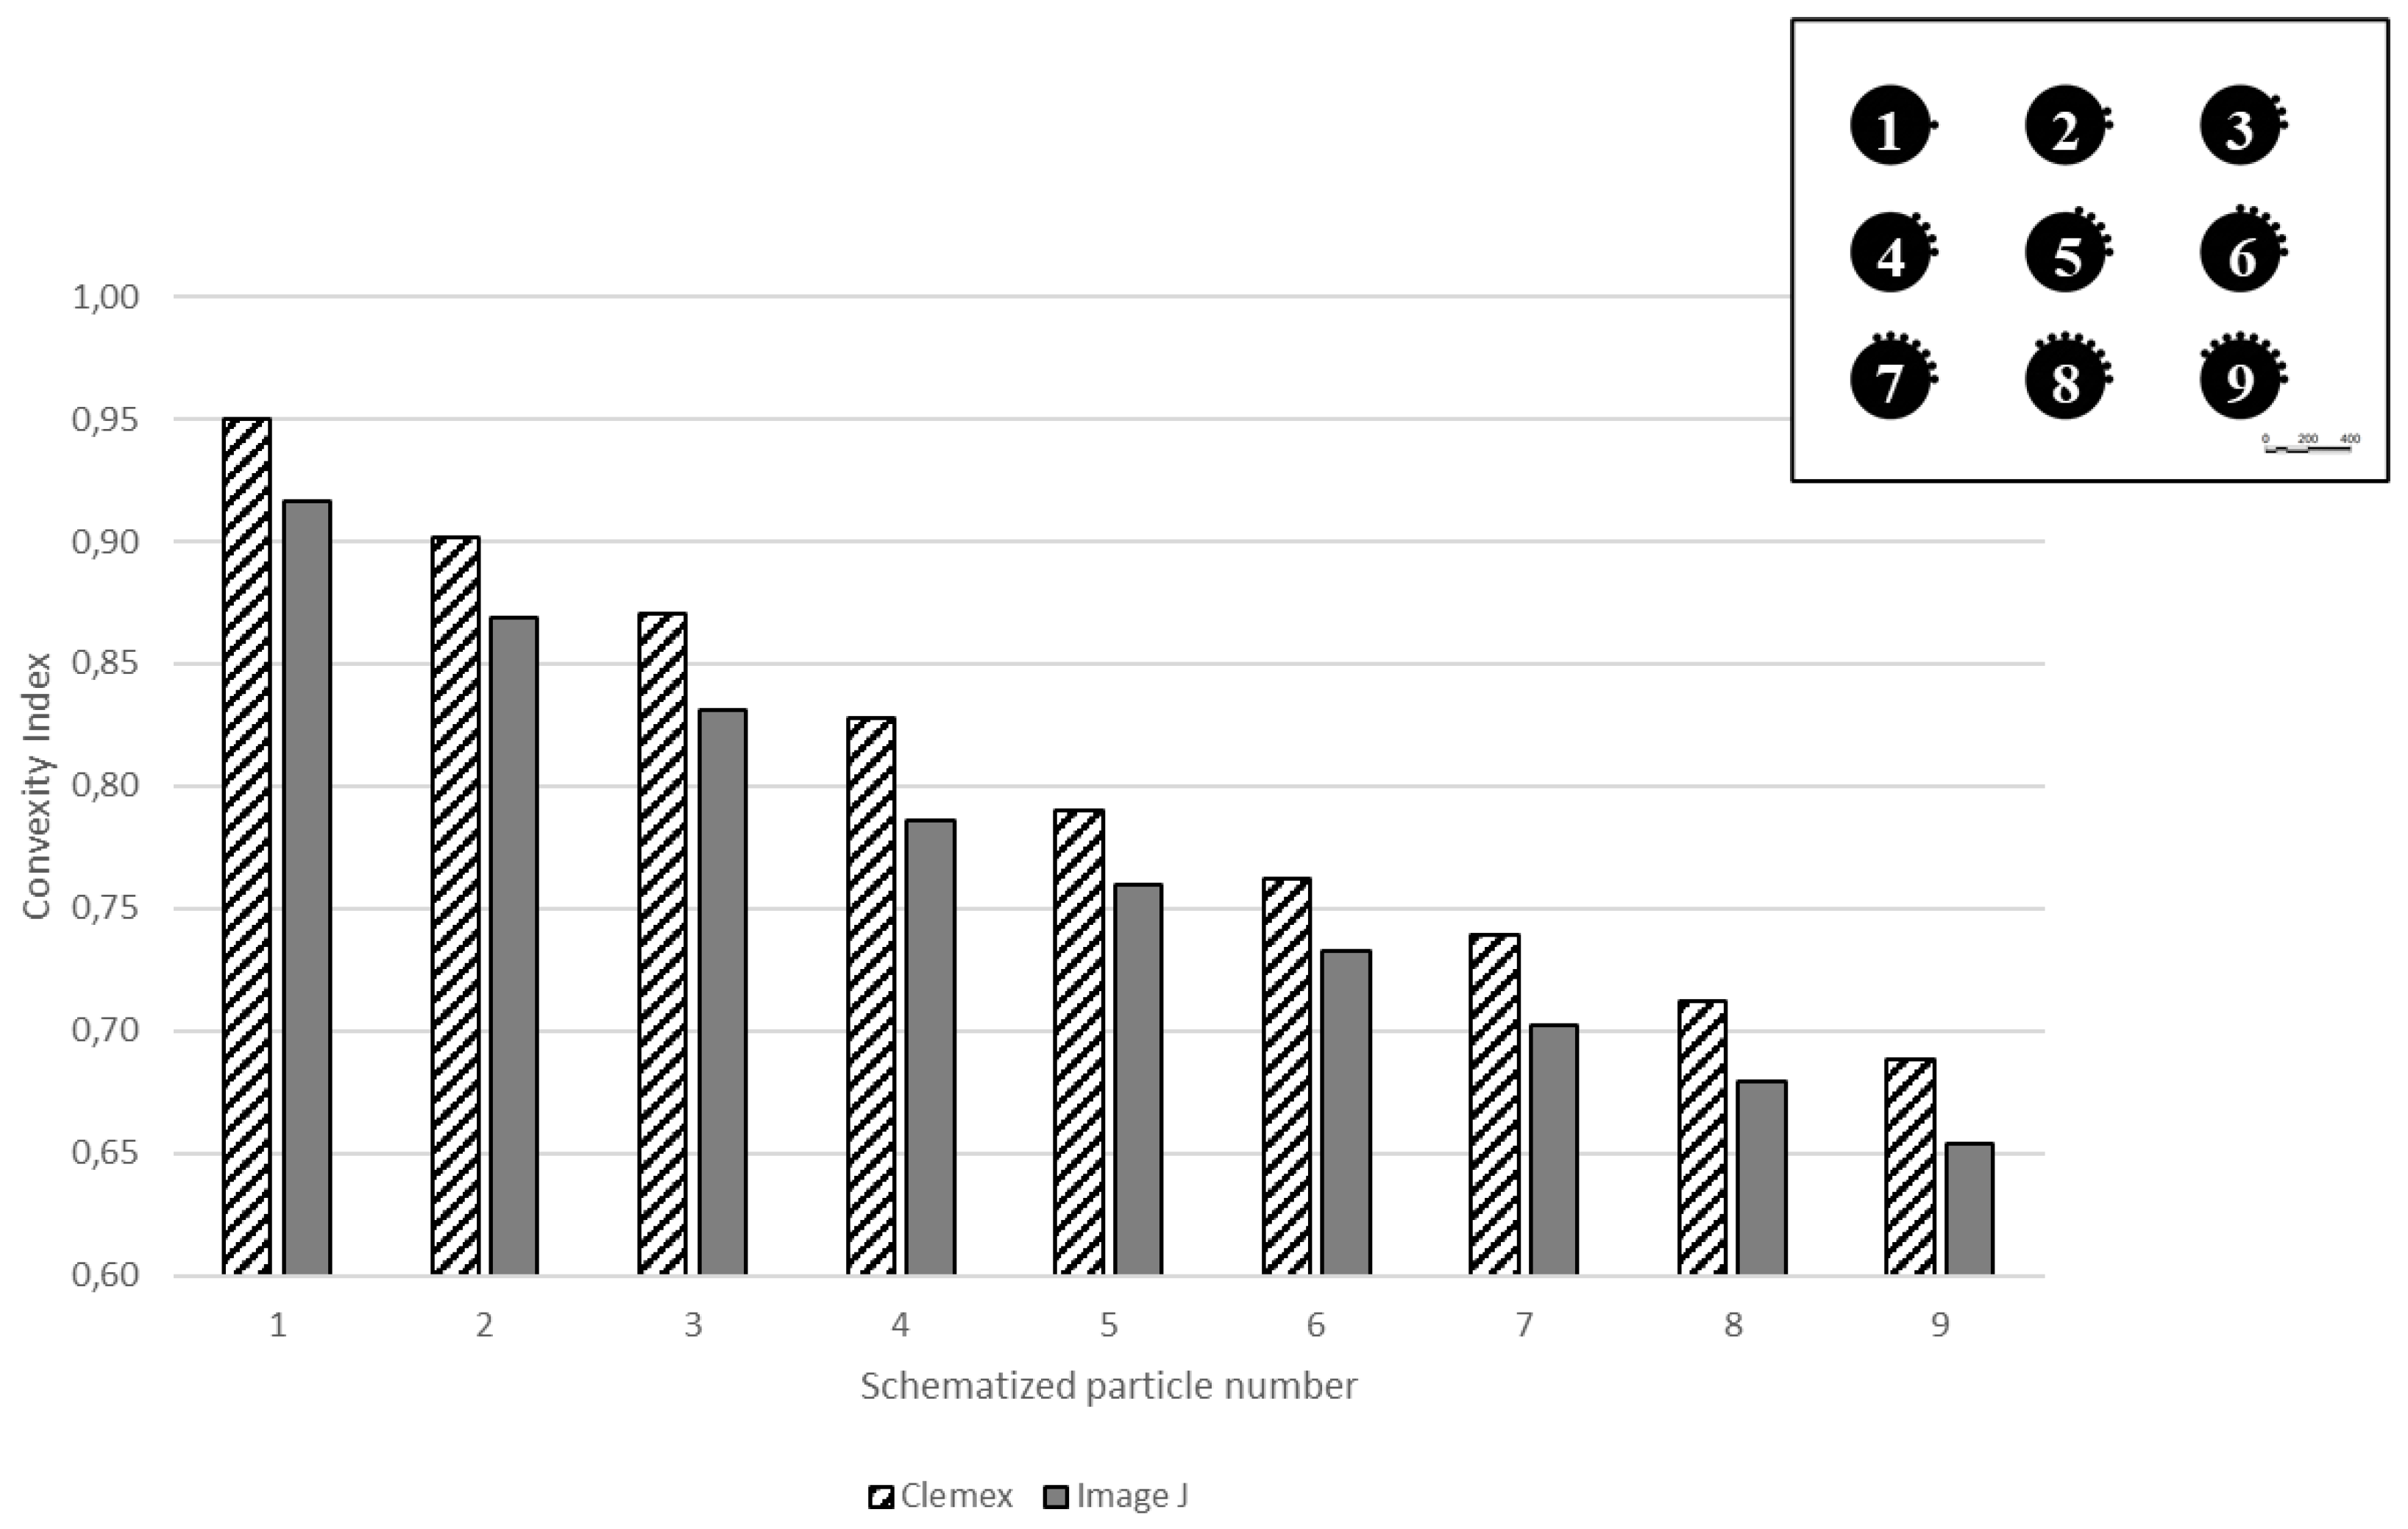
Figure 8.
Extent C for particles with single growing satellites.
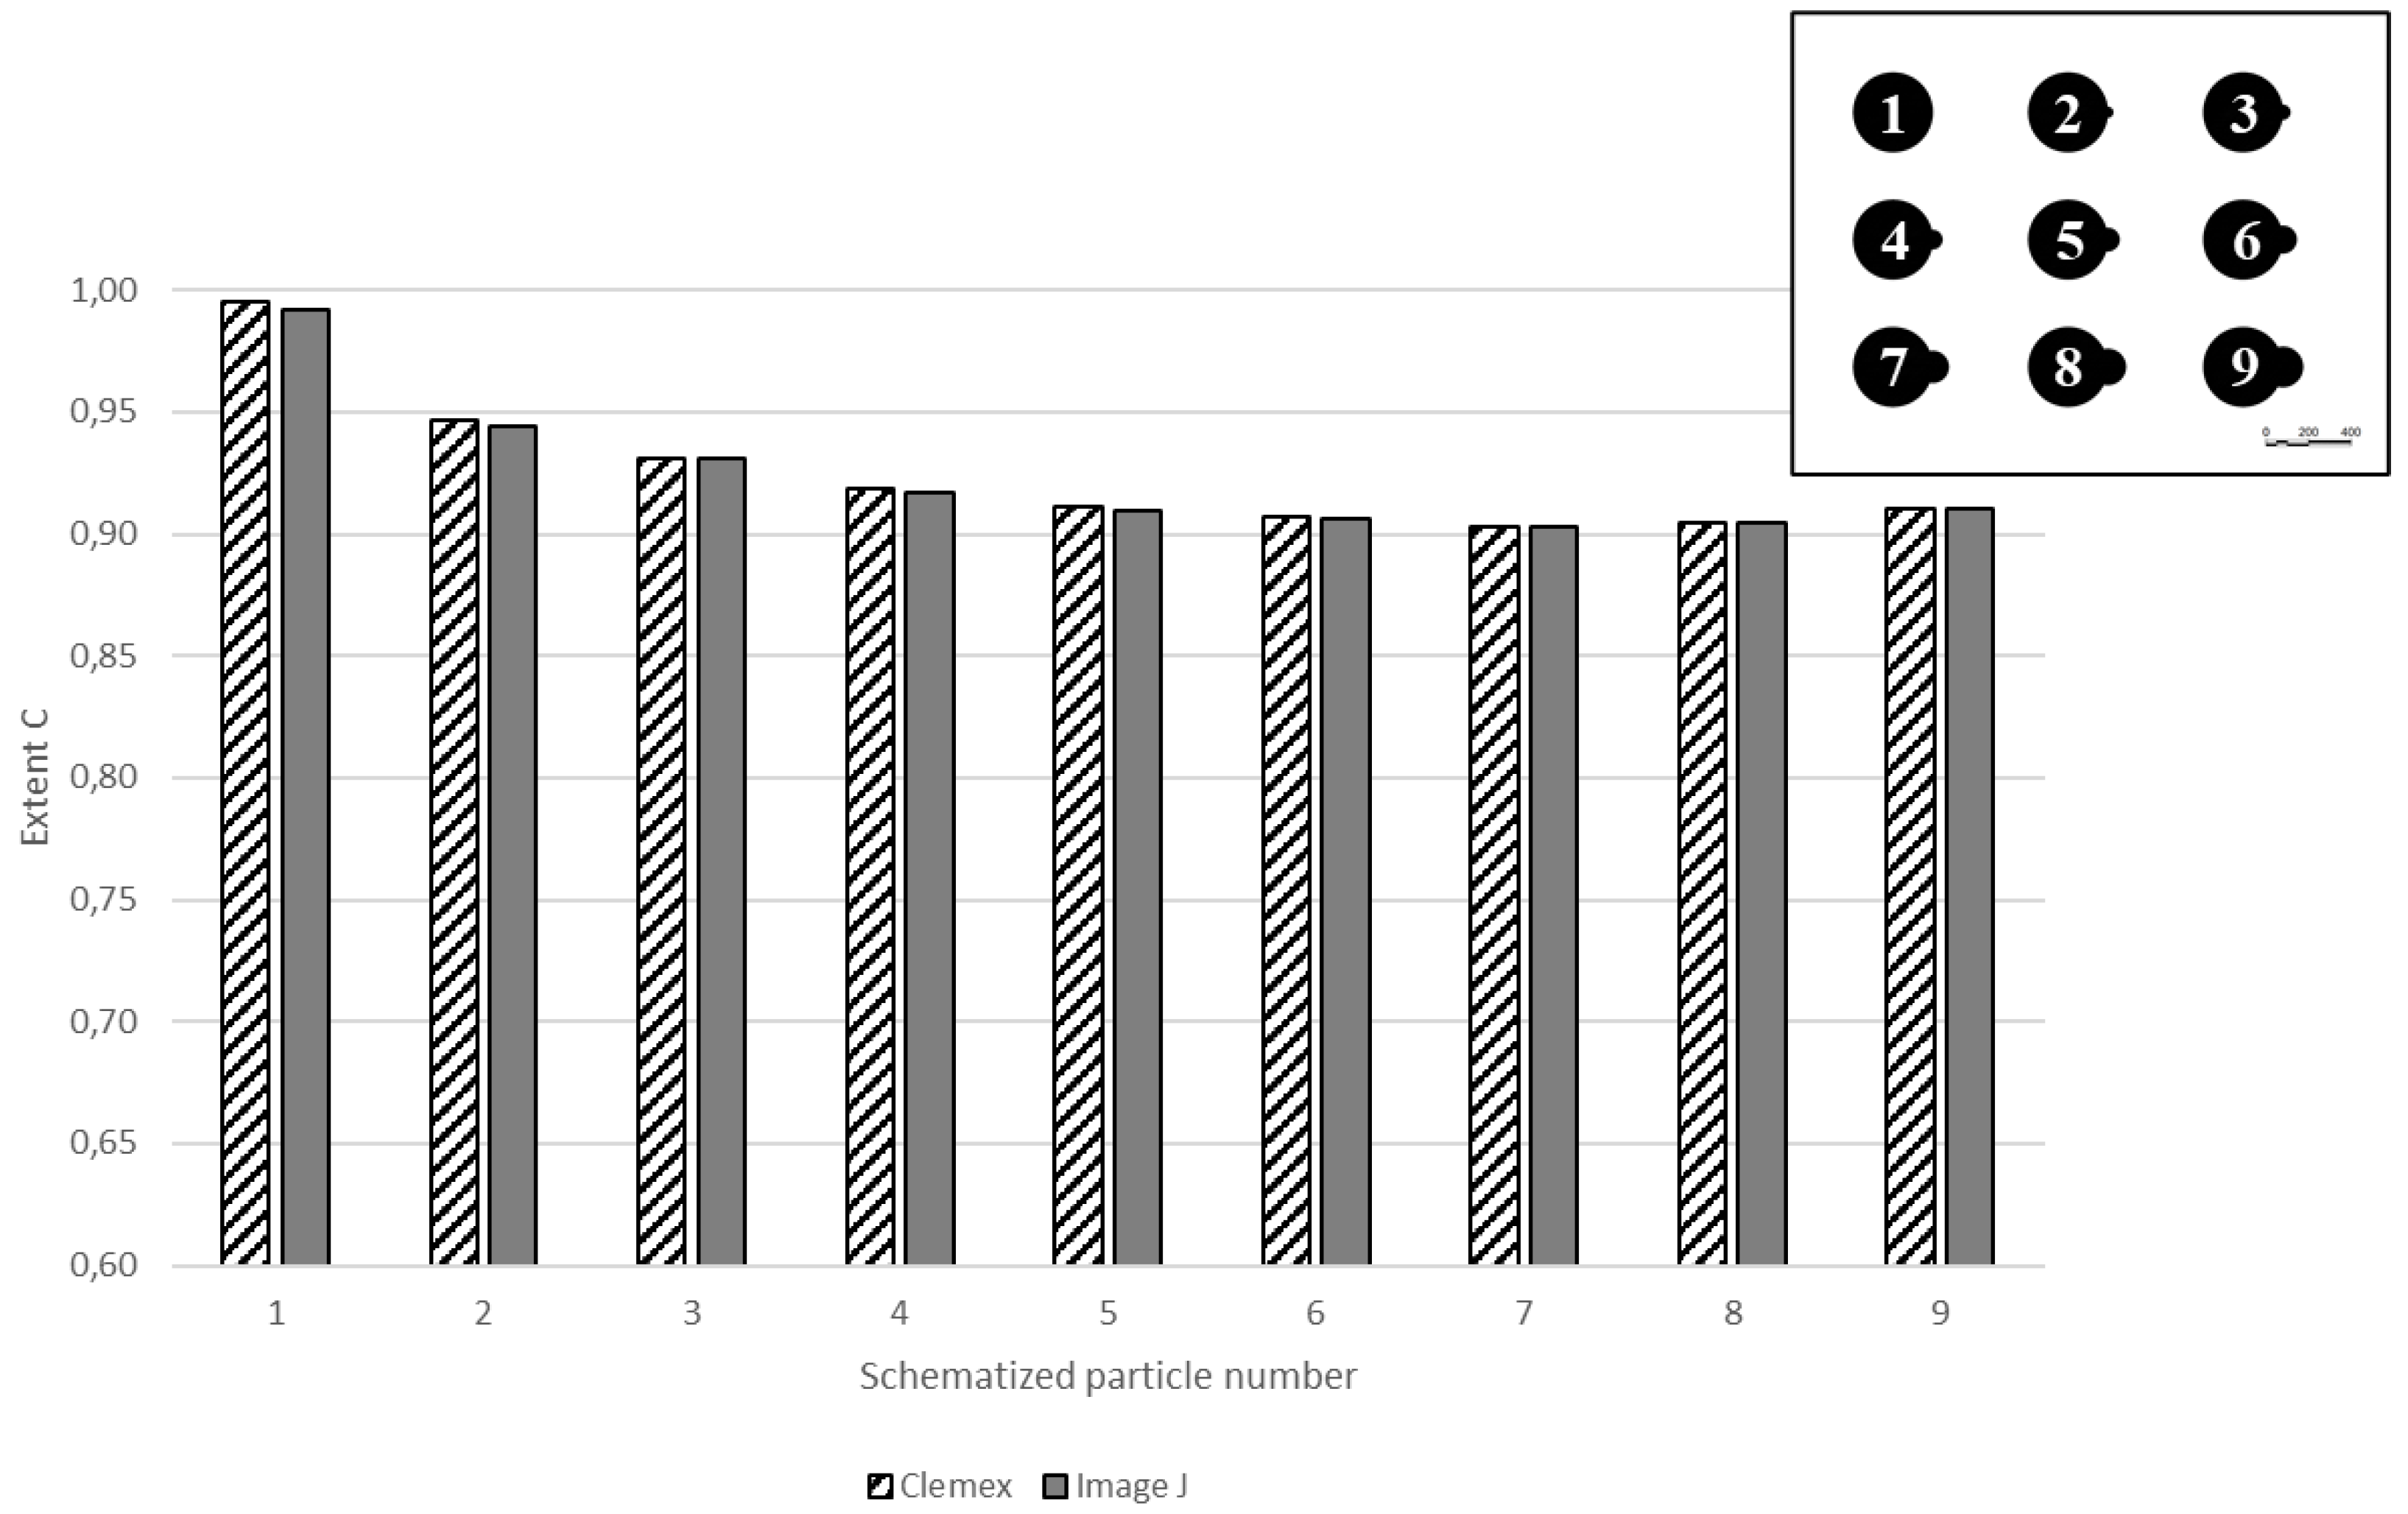
Figure 9.
Ellipse ratio for elongated particles.
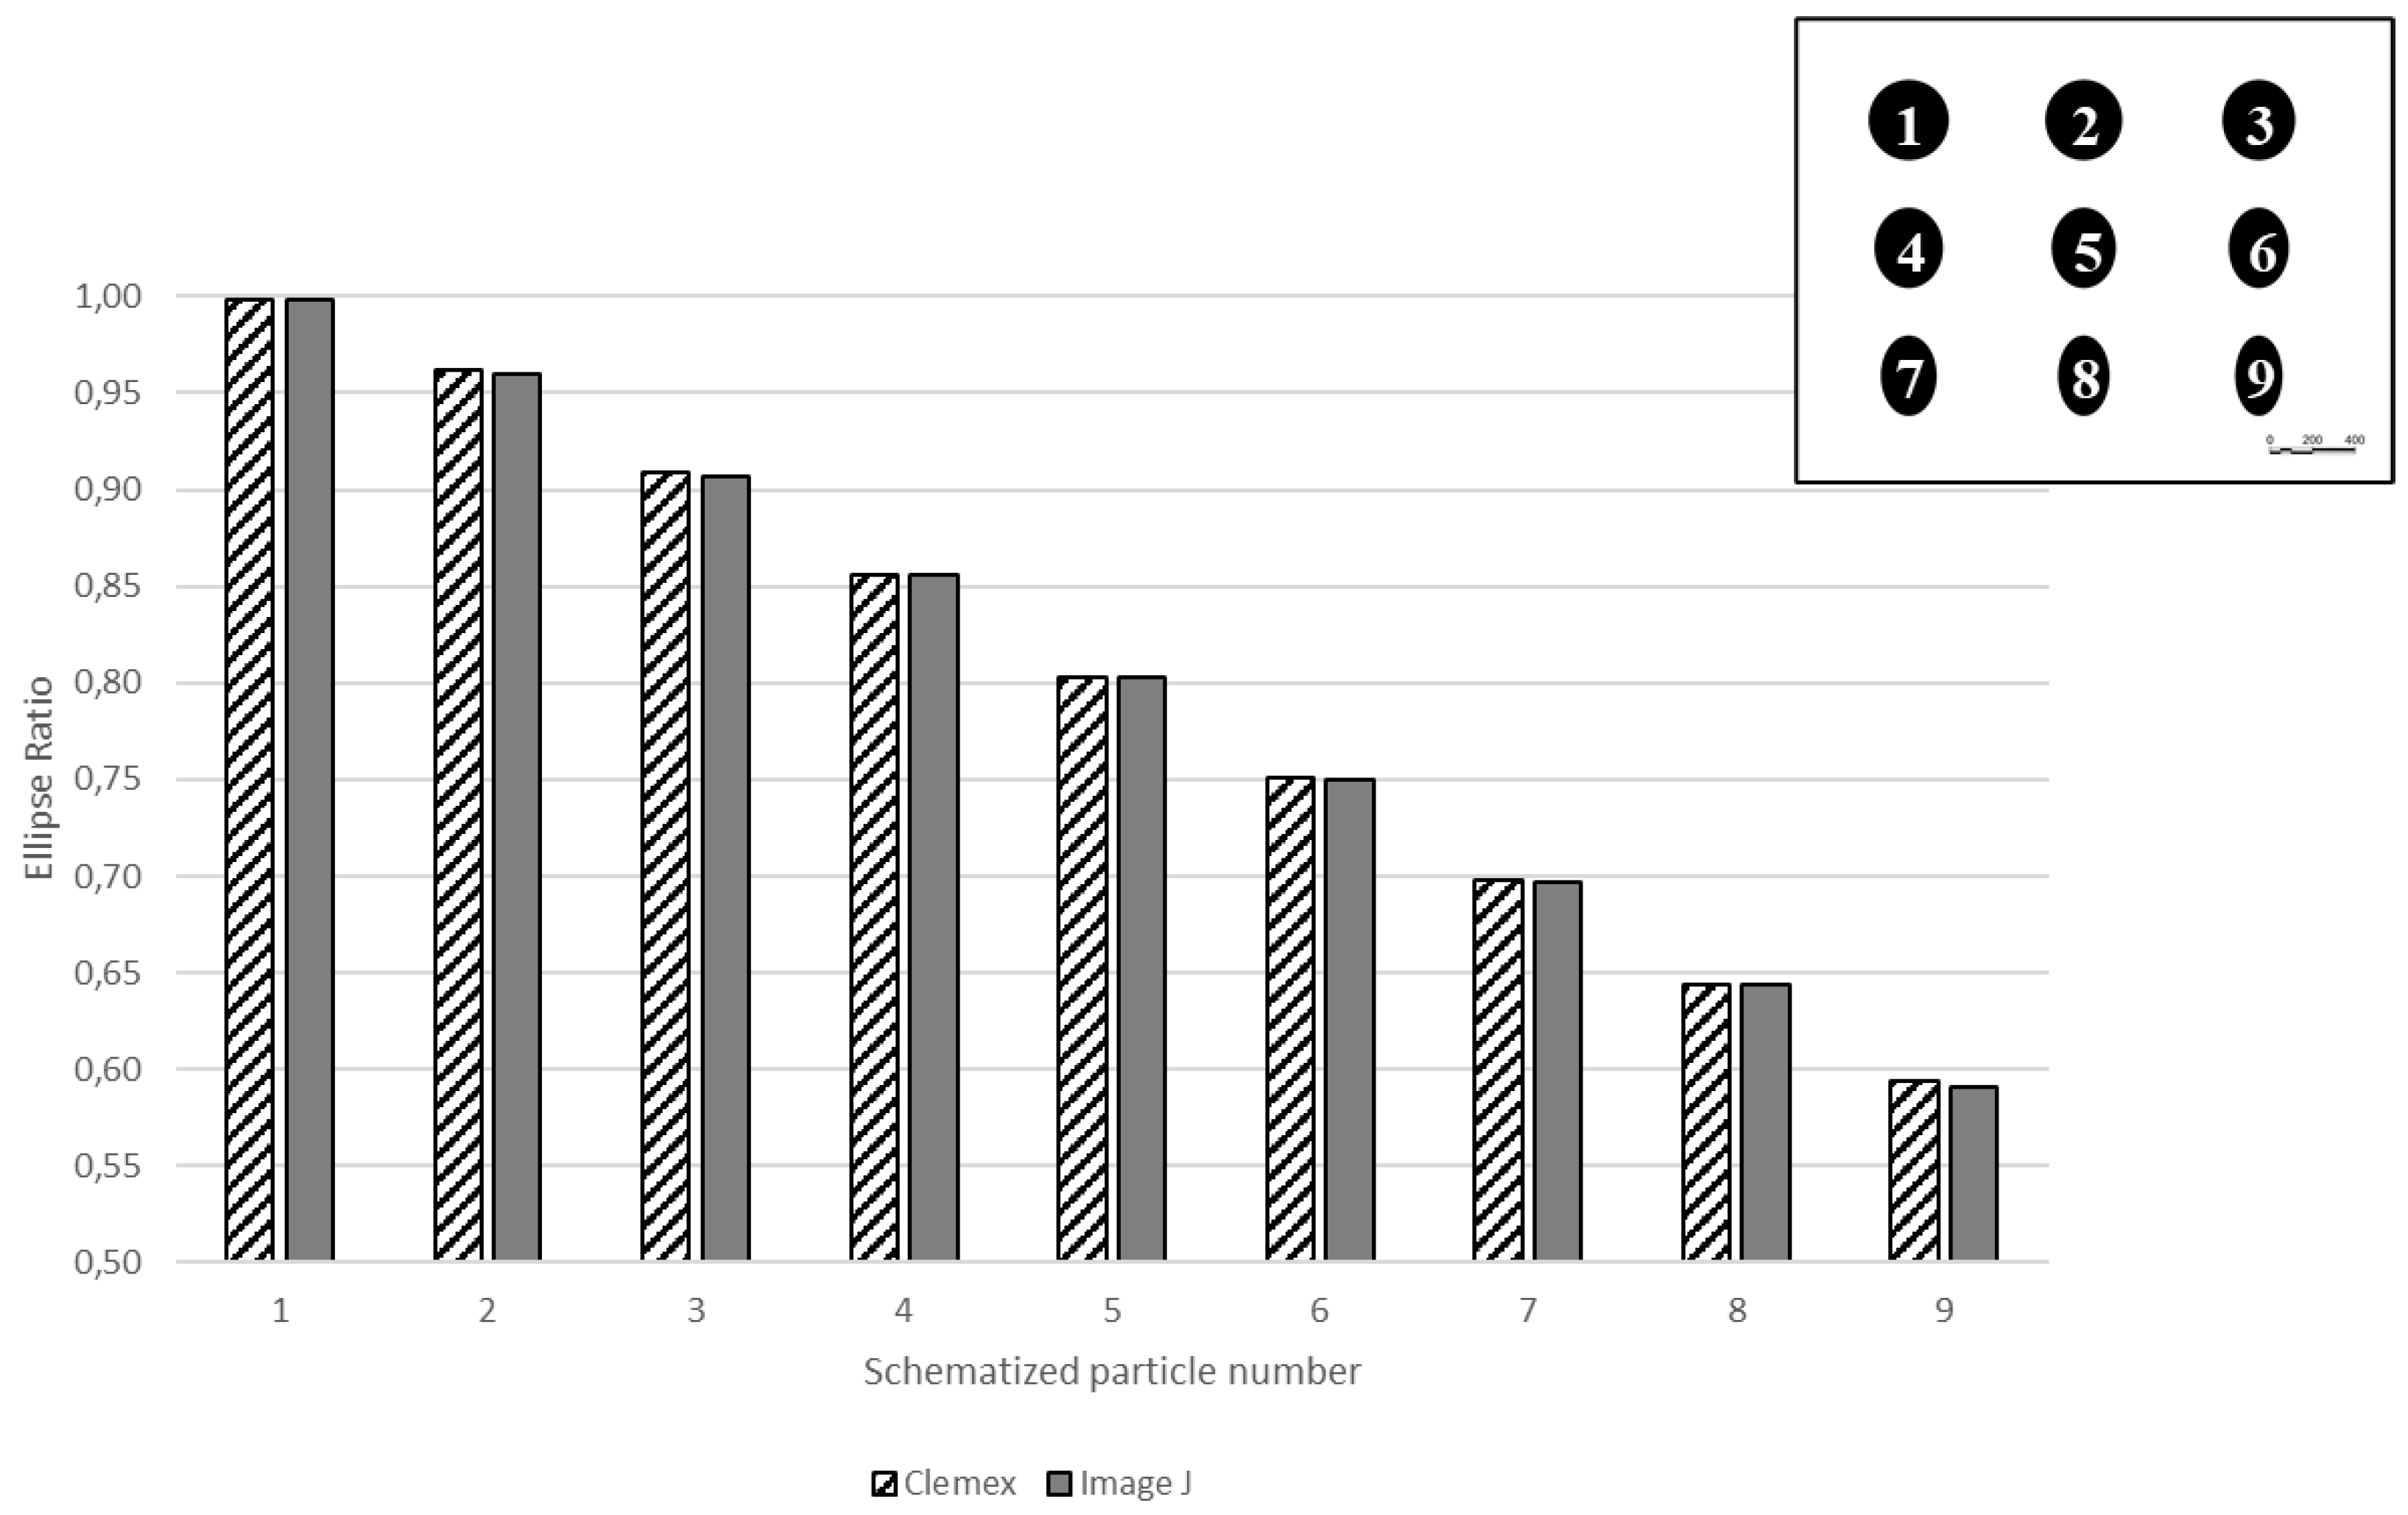
Figure 10.
Roundness index for faceted particles.
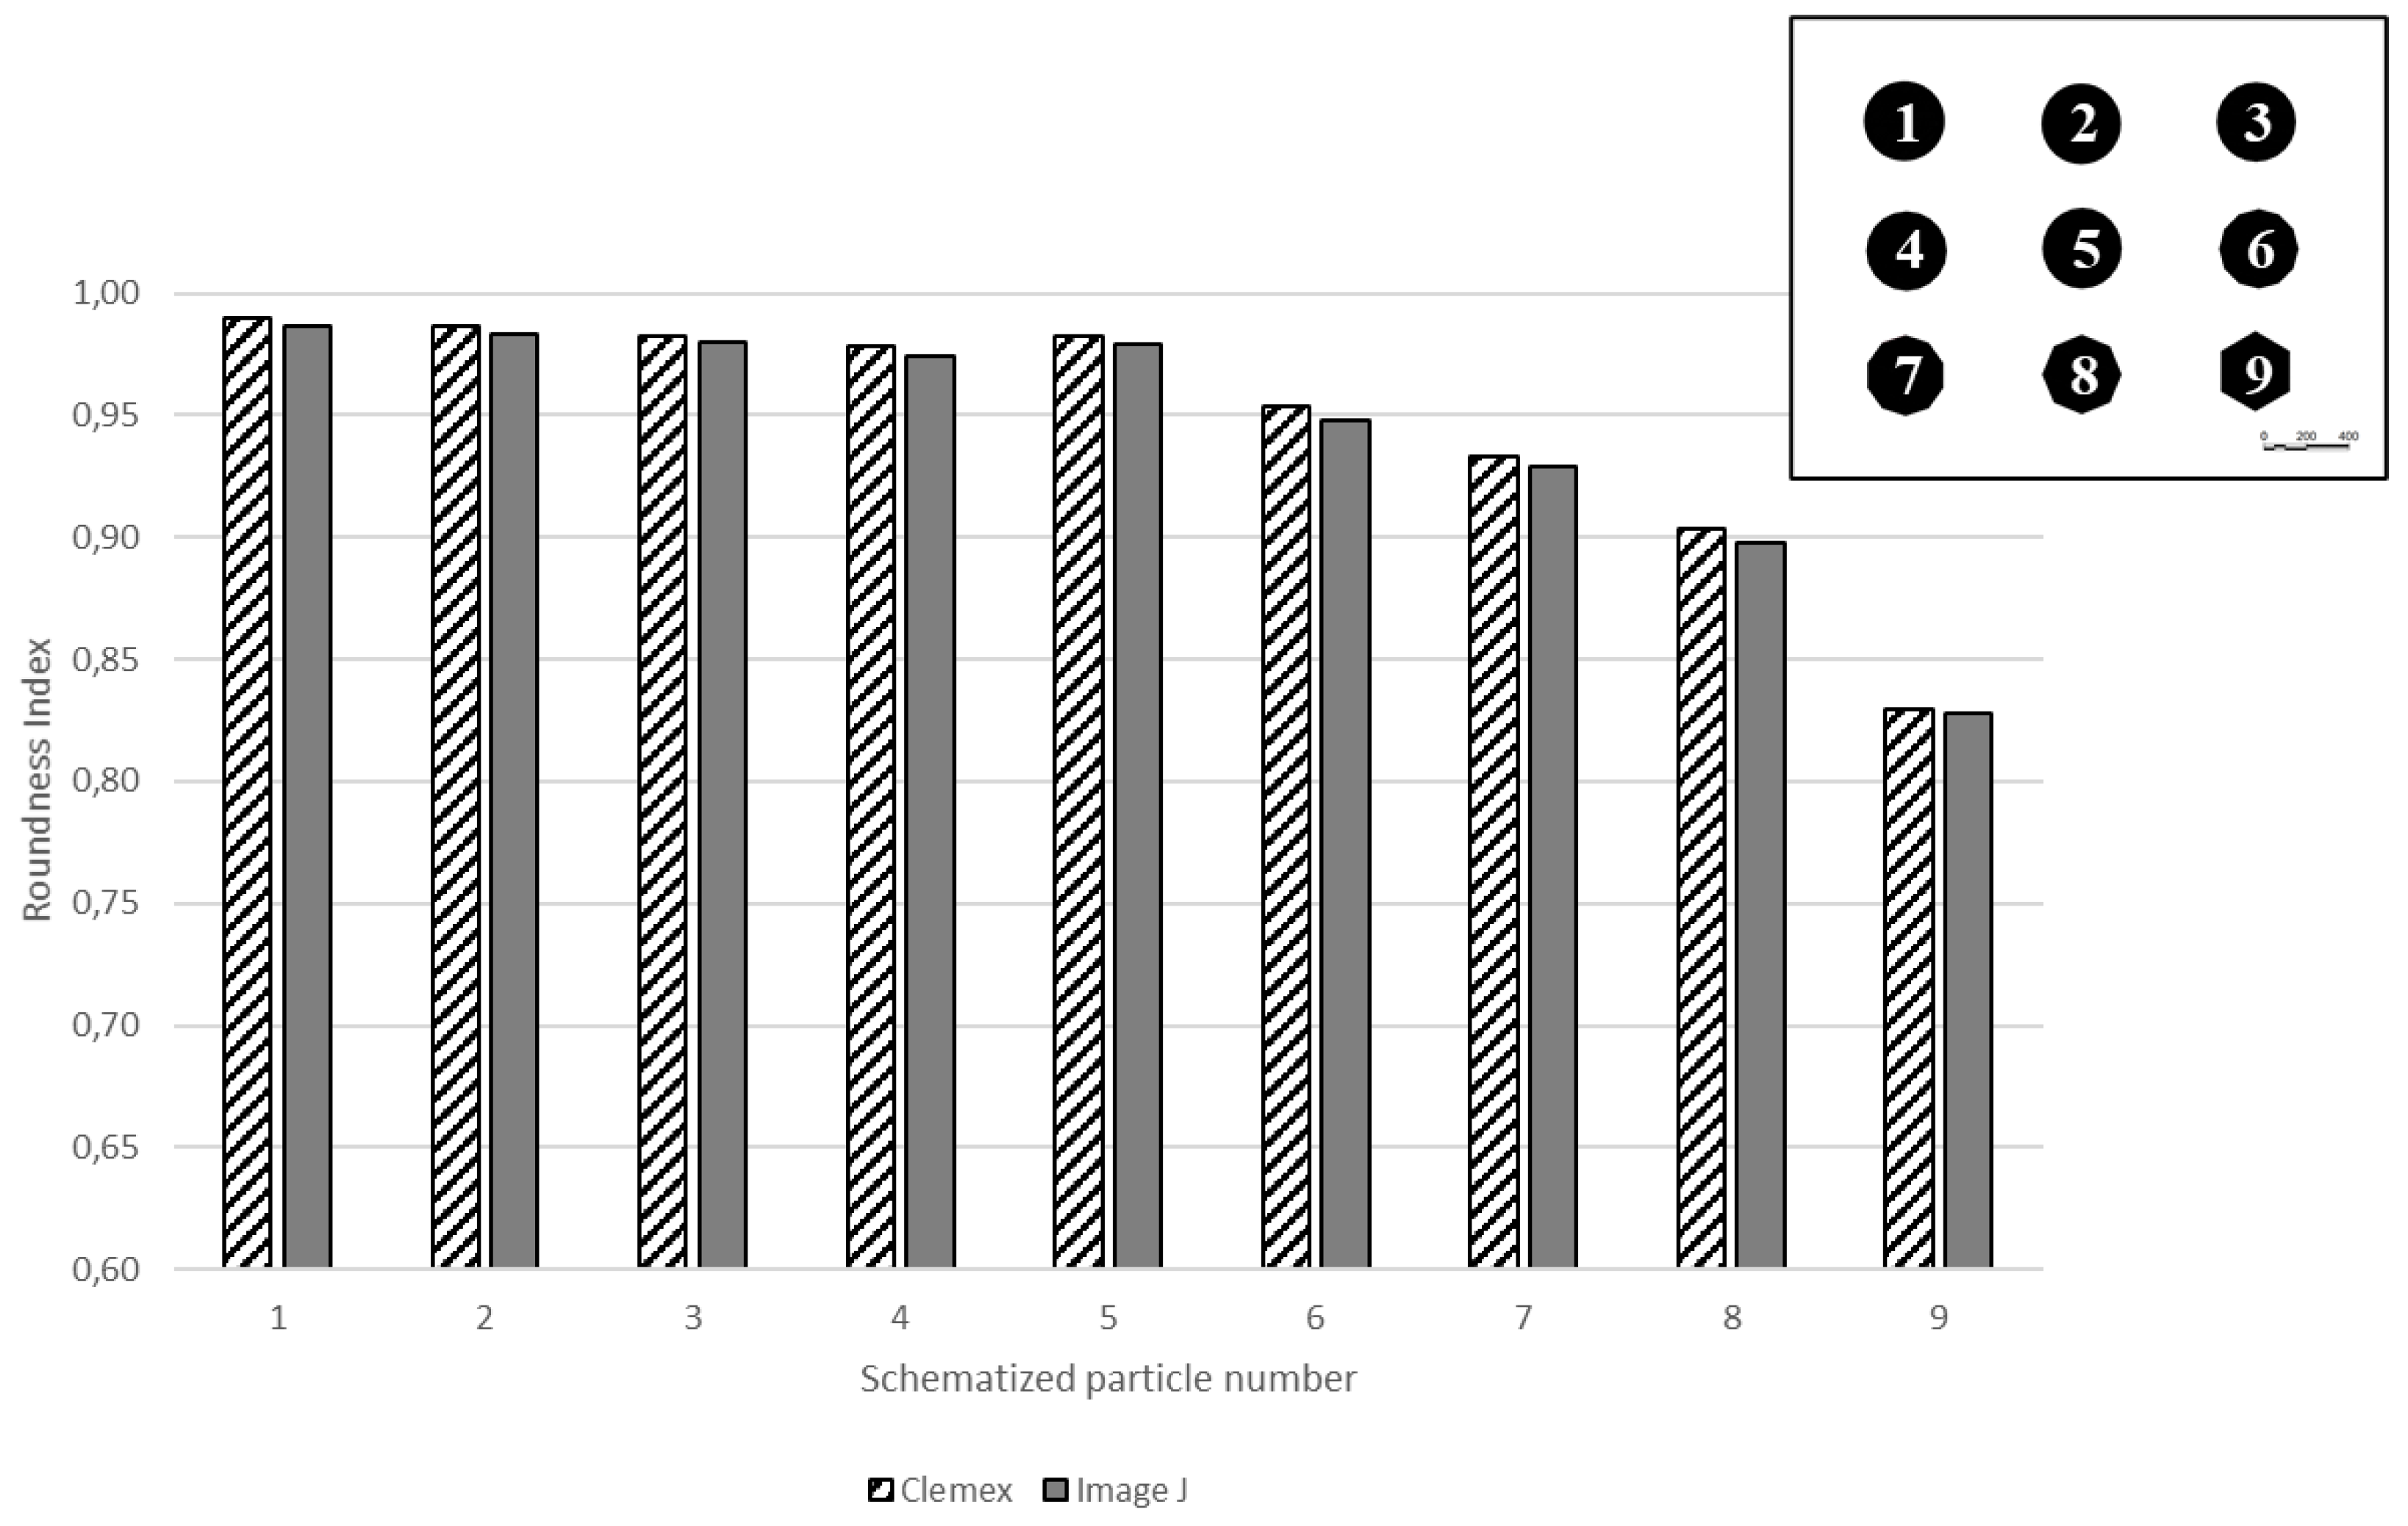
Figure 11.
Percentage of particles with satellites in aluminum (Al), titanium (Ti), stainless steel (SS.-A) and recycled stainless steel (SS.-B).
Figure 11.
Percentage of particles with satellites in aluminum (Al), titanium (Ti), stainless steel (SS.-A) and recycled stainless steel (SS.-B).
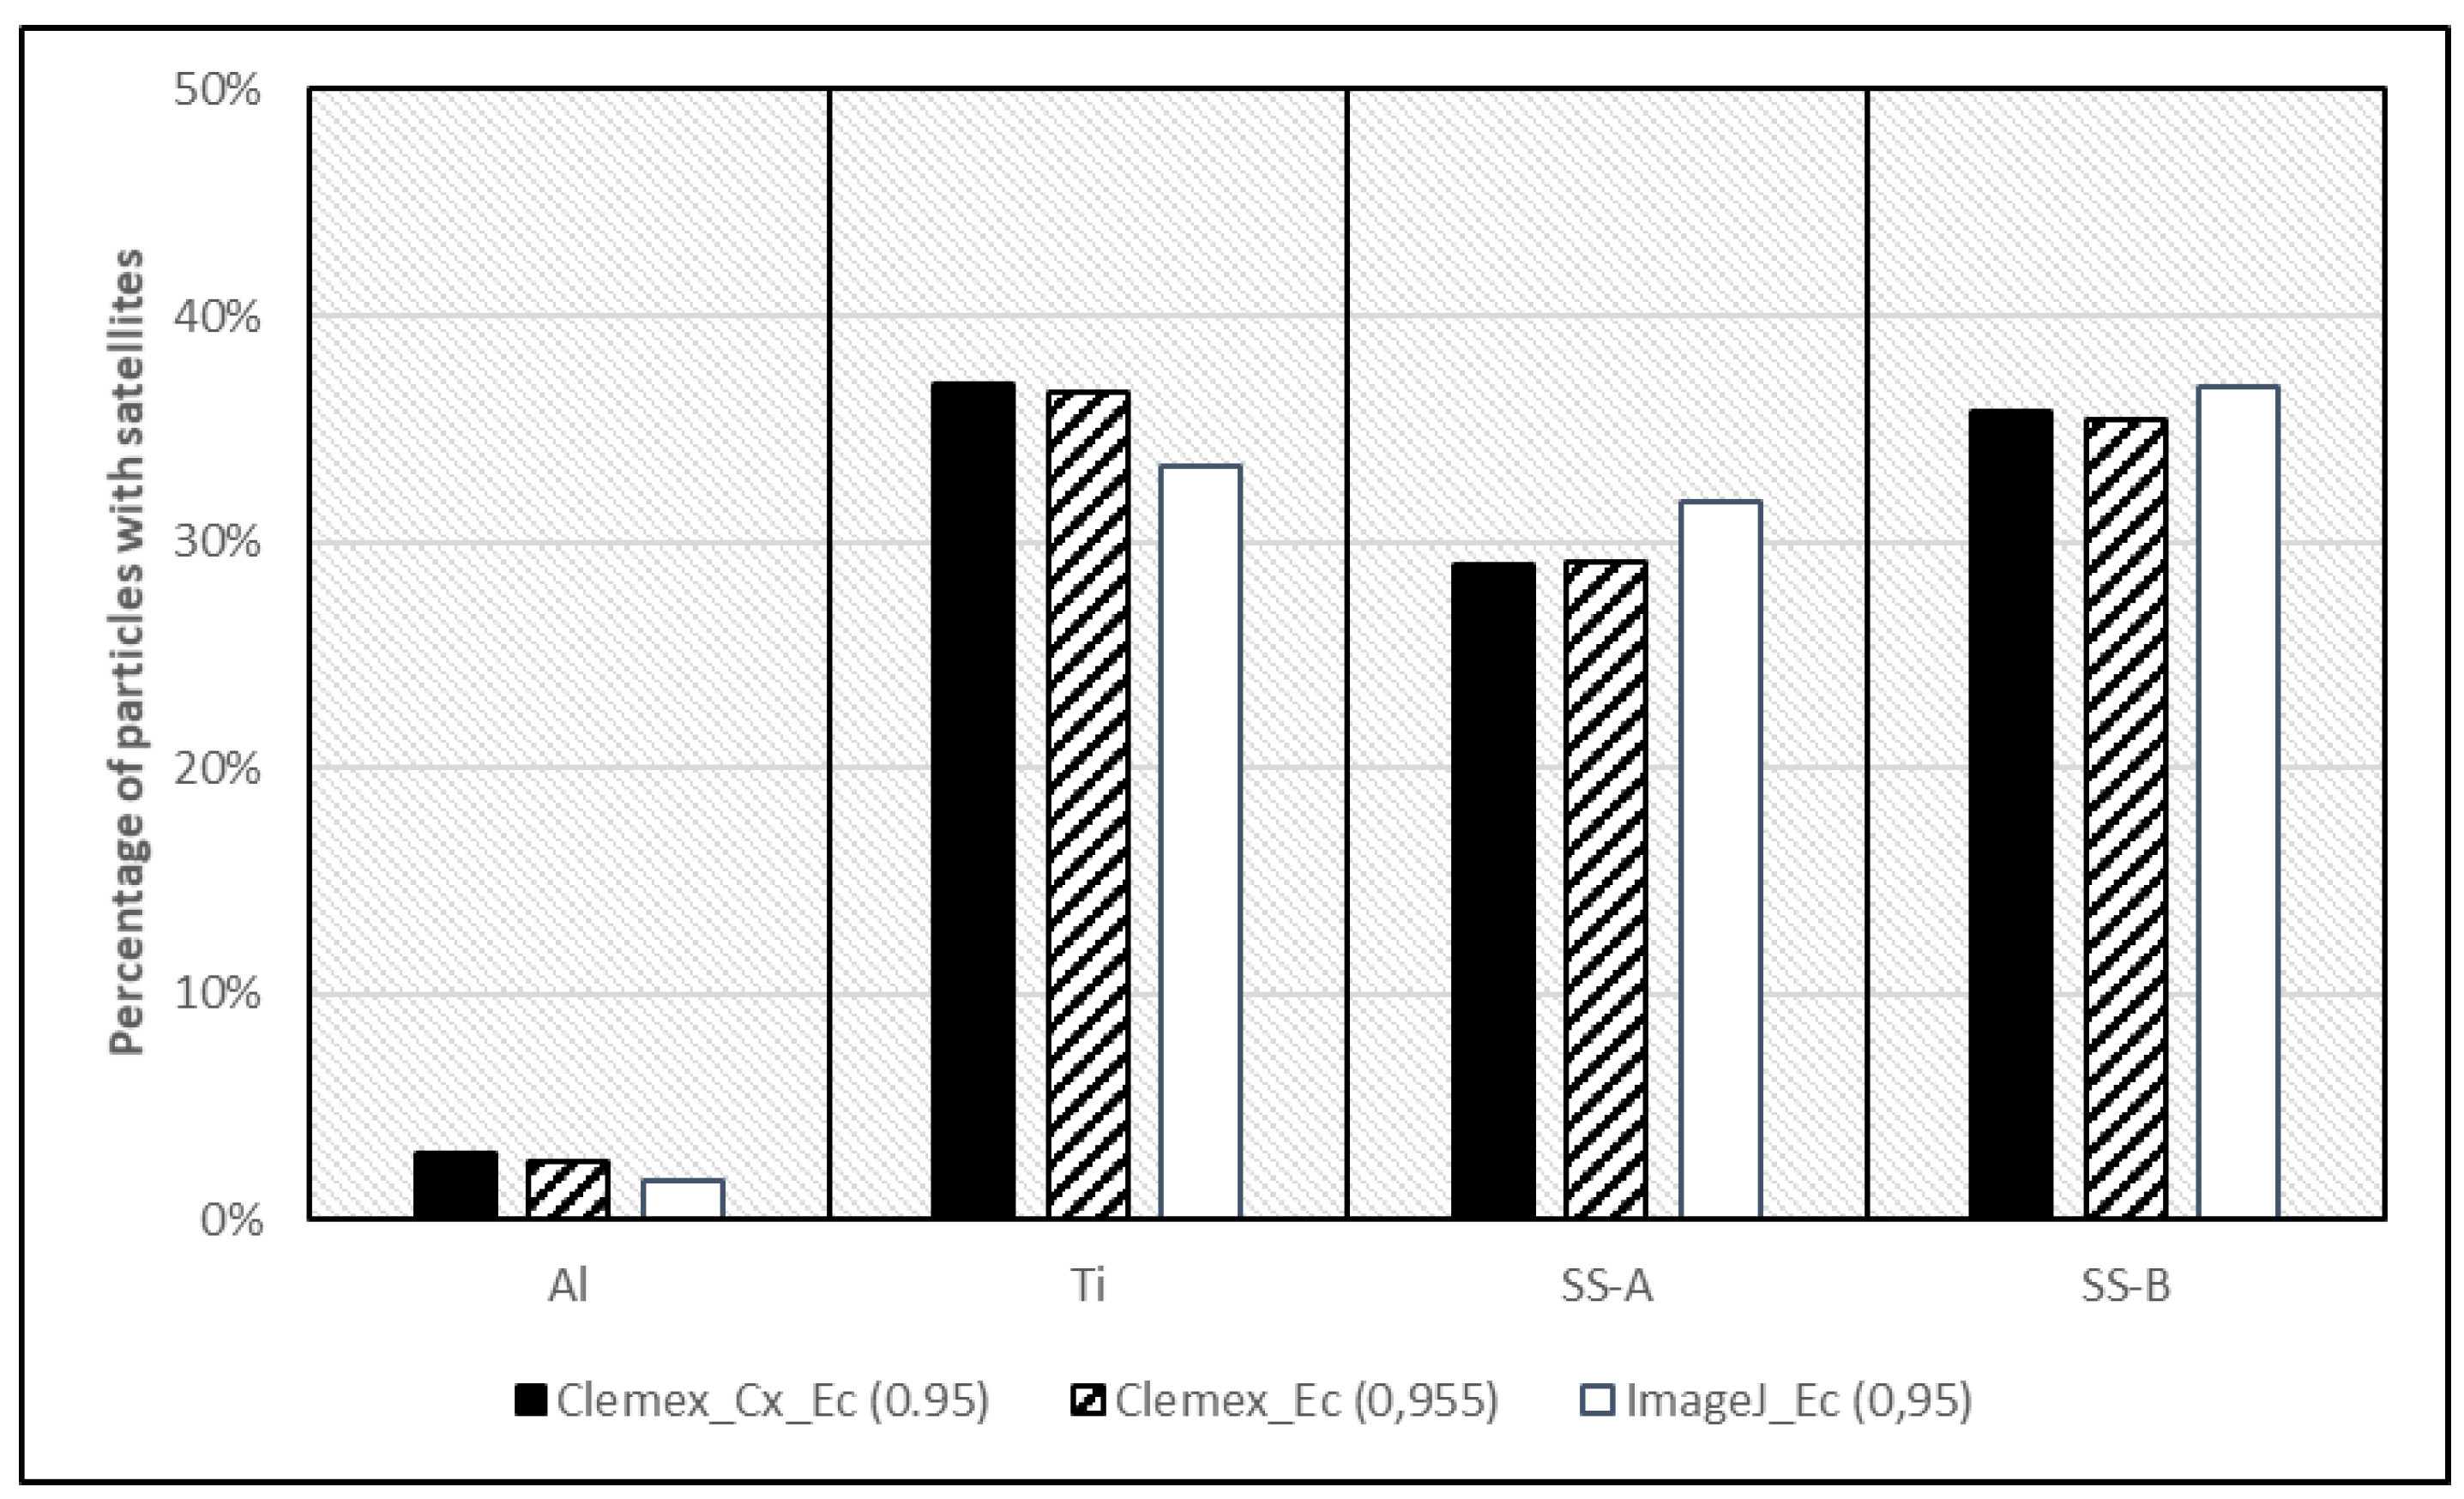
Figure 12.
Percentage of elongated particles in aluminum (Al), titanium (Ti), stainless steel (SS.-A) and recycled stainless steel (SS.-B).
Figure 12.
Percentage of elongated particles in aluminum (Al), titanium (Ti), stainless steel (SS.-A) and recycled stainless steel (SS.-B).
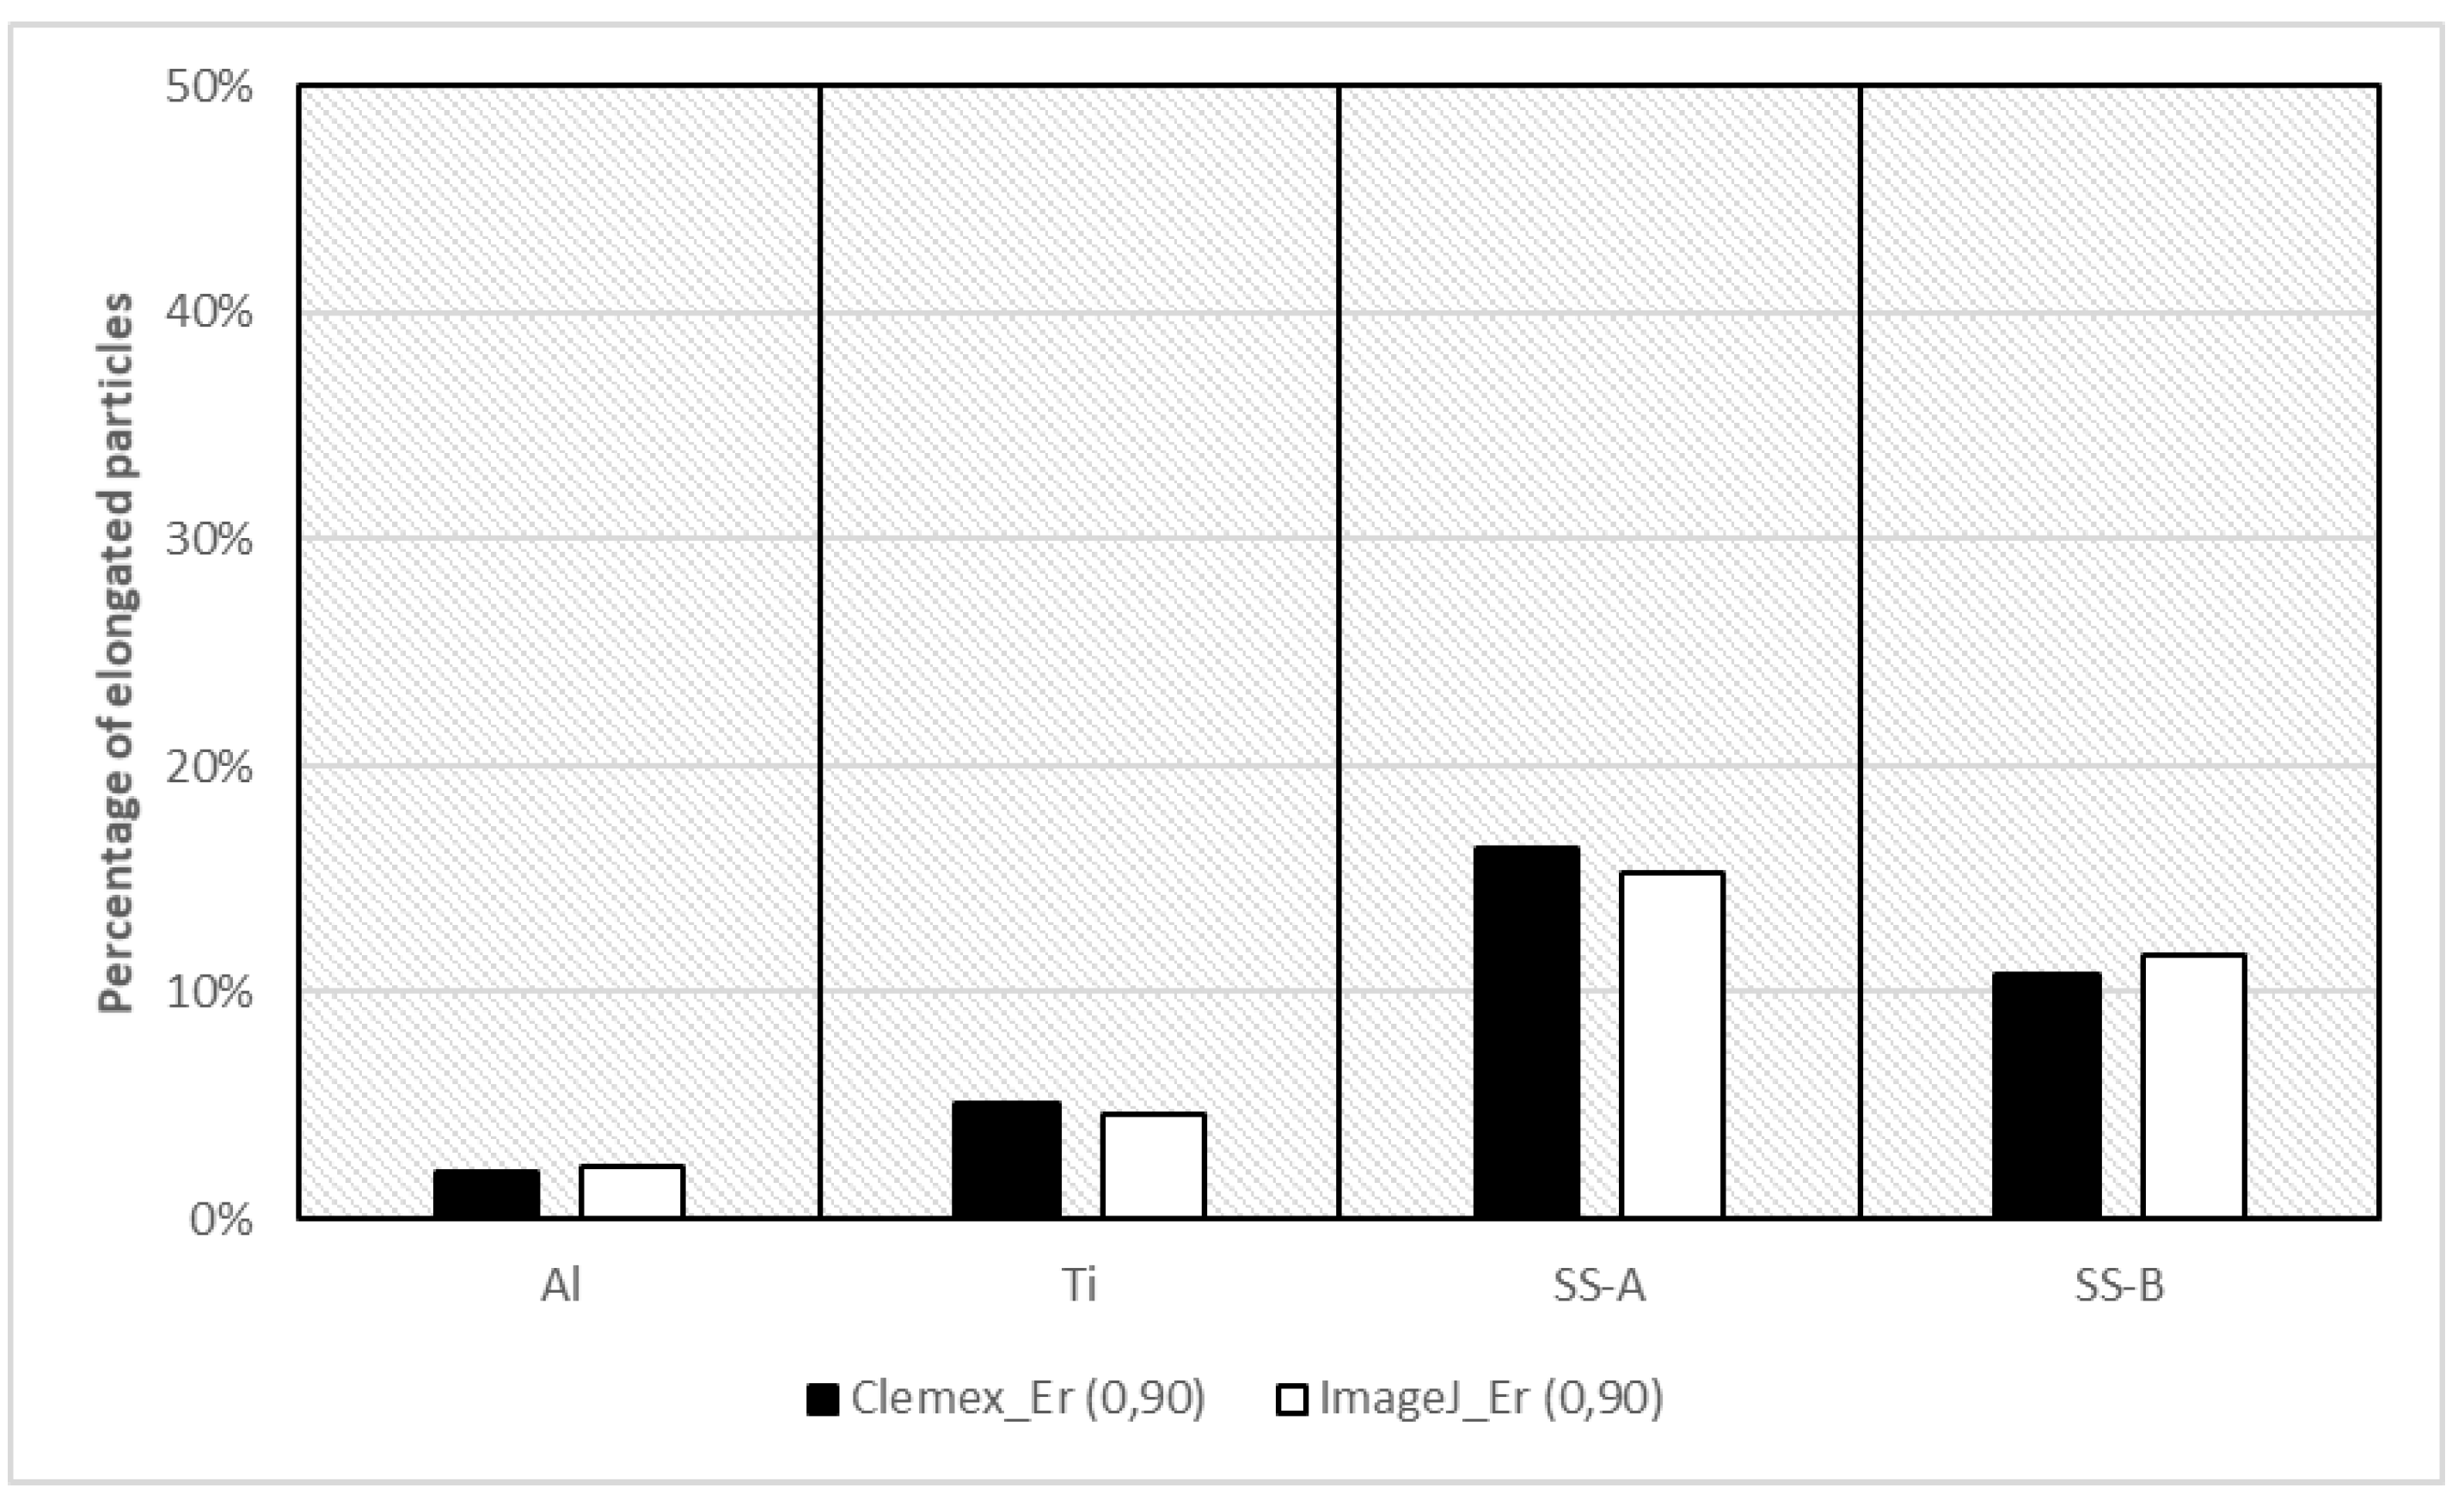
Figure 13.
(a) Internal diameter, (b) external diameter and (c) maximum inscribed circle.
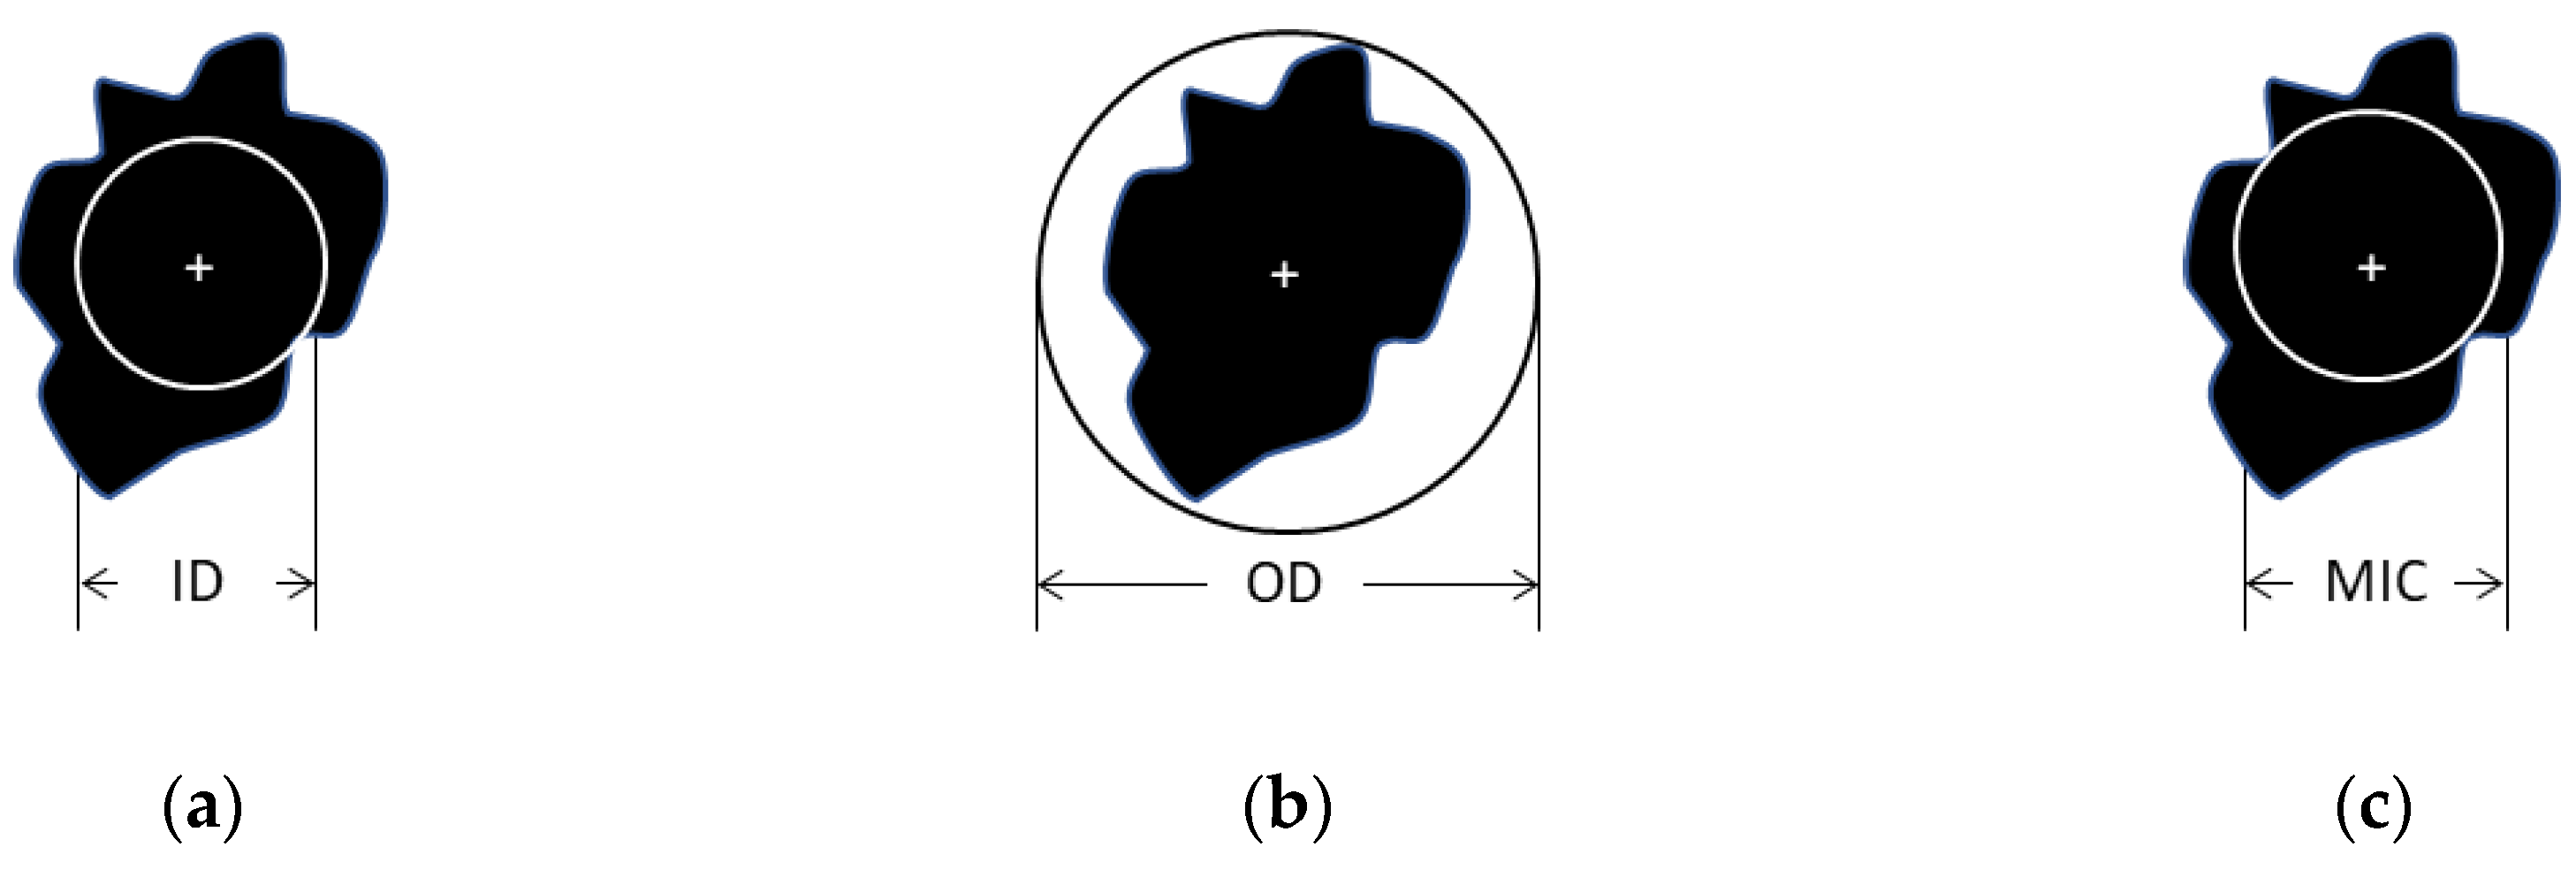
Figure 14.
Percentage of faceted particles in aluminum (Al), titanium (Ti), stainless steel (SS.-A) and recycled stainless steel (SS.-B).
Figure 14.
Percentage of faceted particles in aluminum (Al), titanium (Ti), stainless steel (SS.-A) and recycled stainless steel (SS.-B).
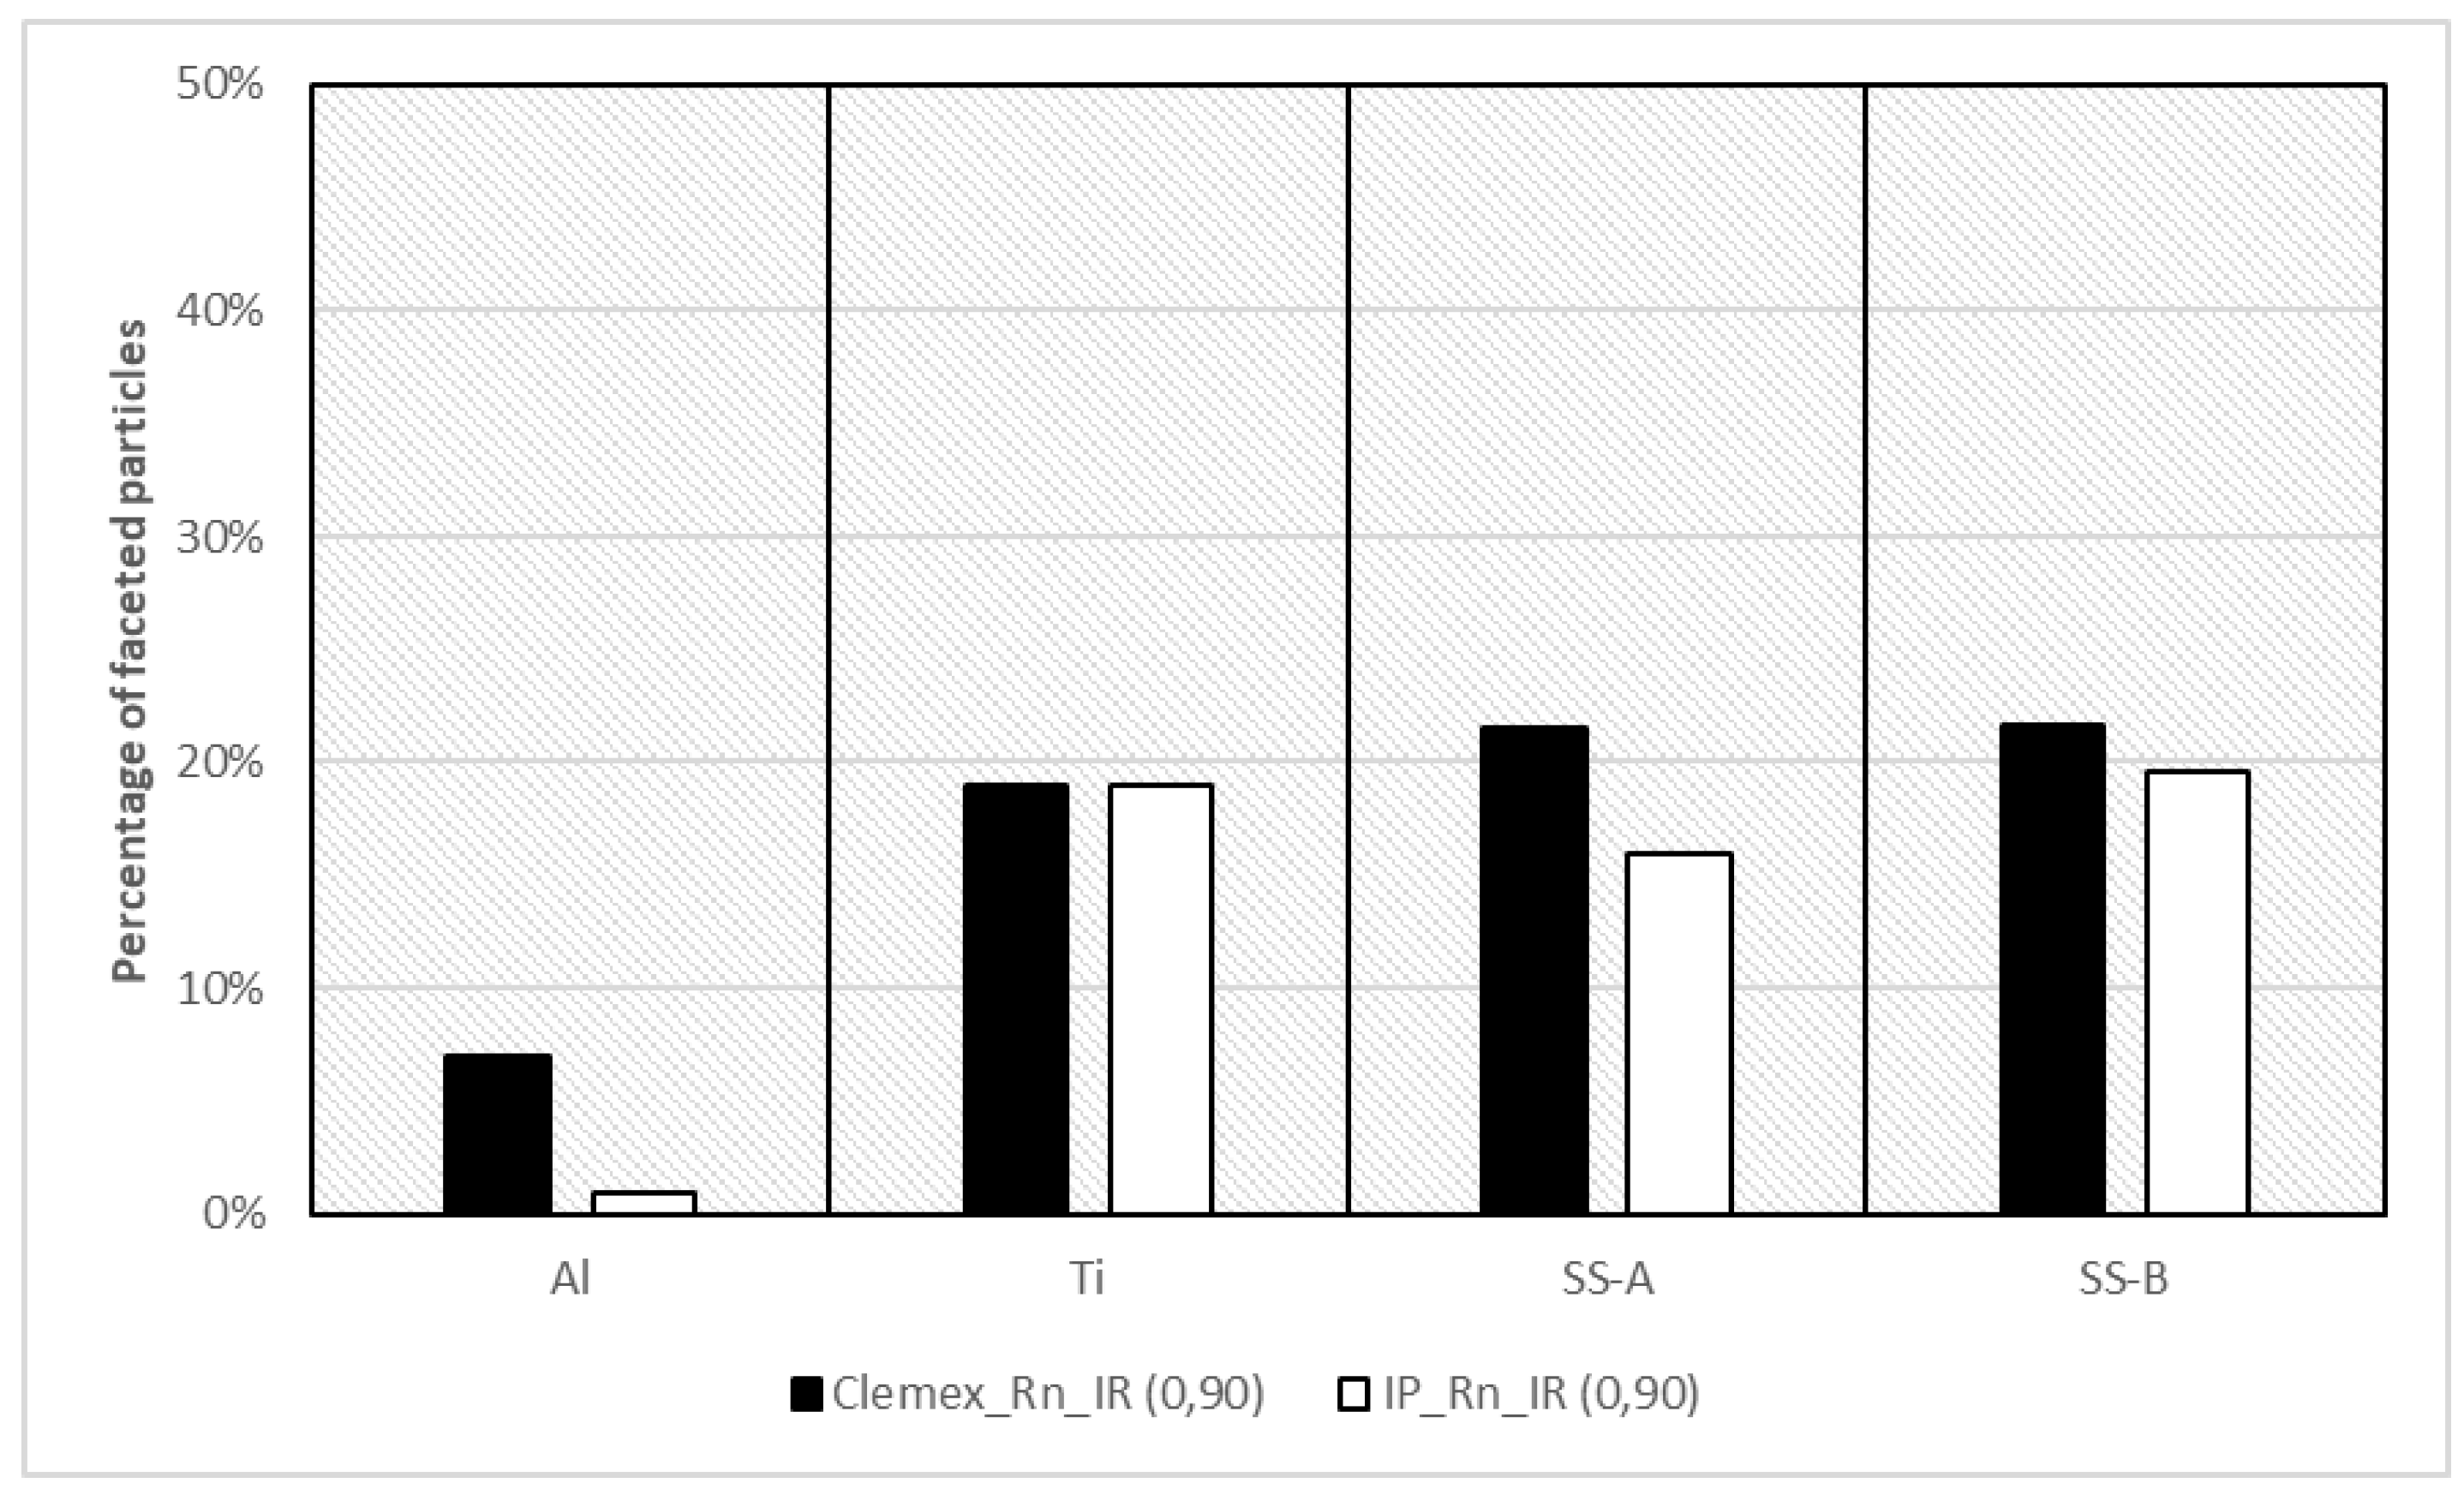
Figure 15.
Clemex bridge removal between touching particles.
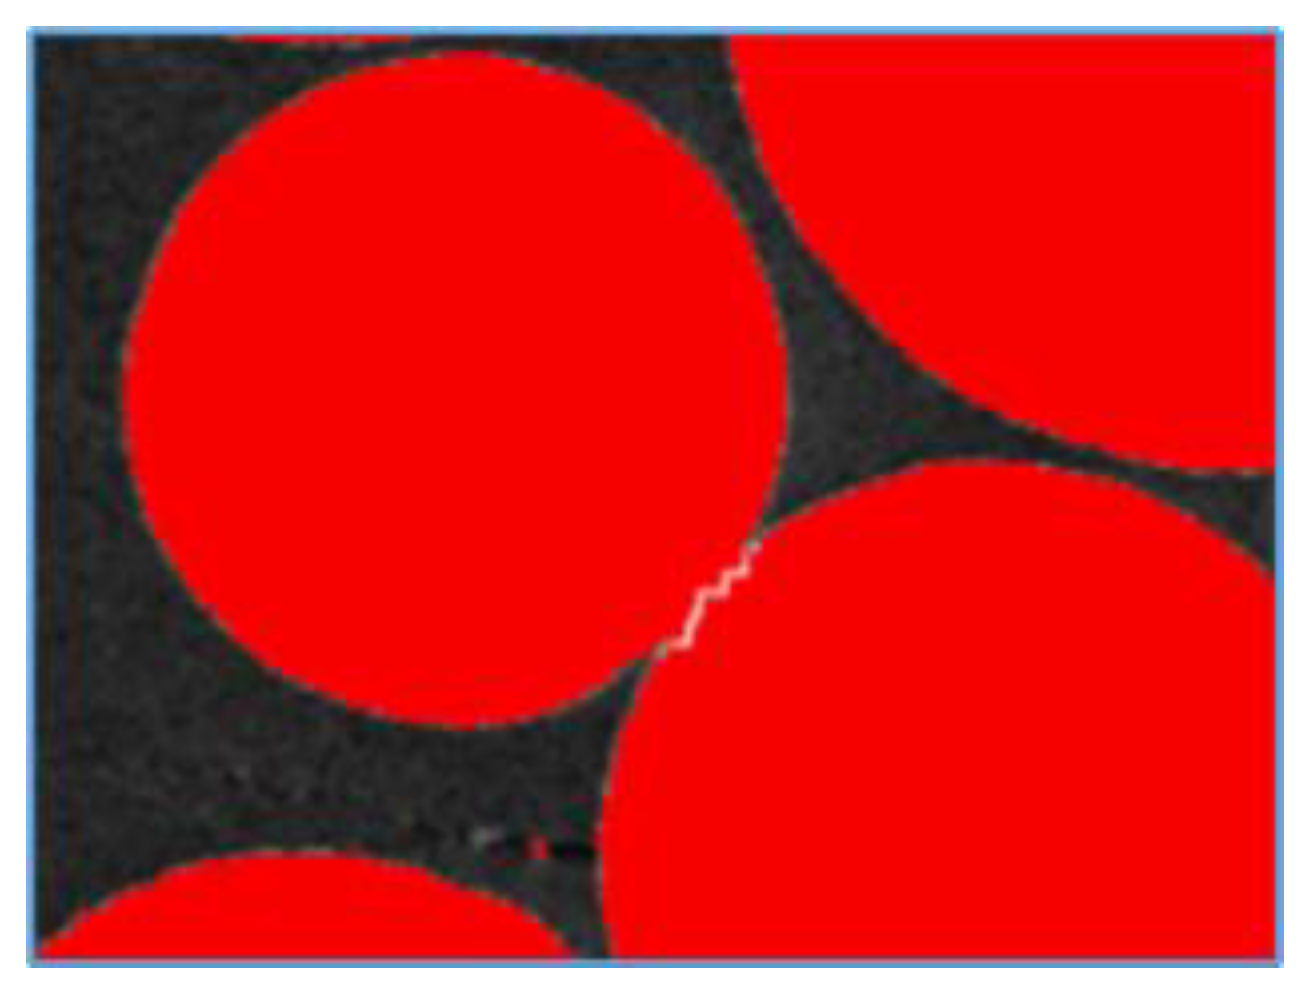
Figure 16.
Summary of the results for (a) aluminum, (b) titanium, (c) as-received and (d) recycled stainless steel with Clemex, ImageJ and Morphologi software.
Figure 16.
Summary of the results for (a) aluminum, (b) titanium, (c) as-received and (d) recycled stainless steel with Clemex, ImageJ and Morphologi software.
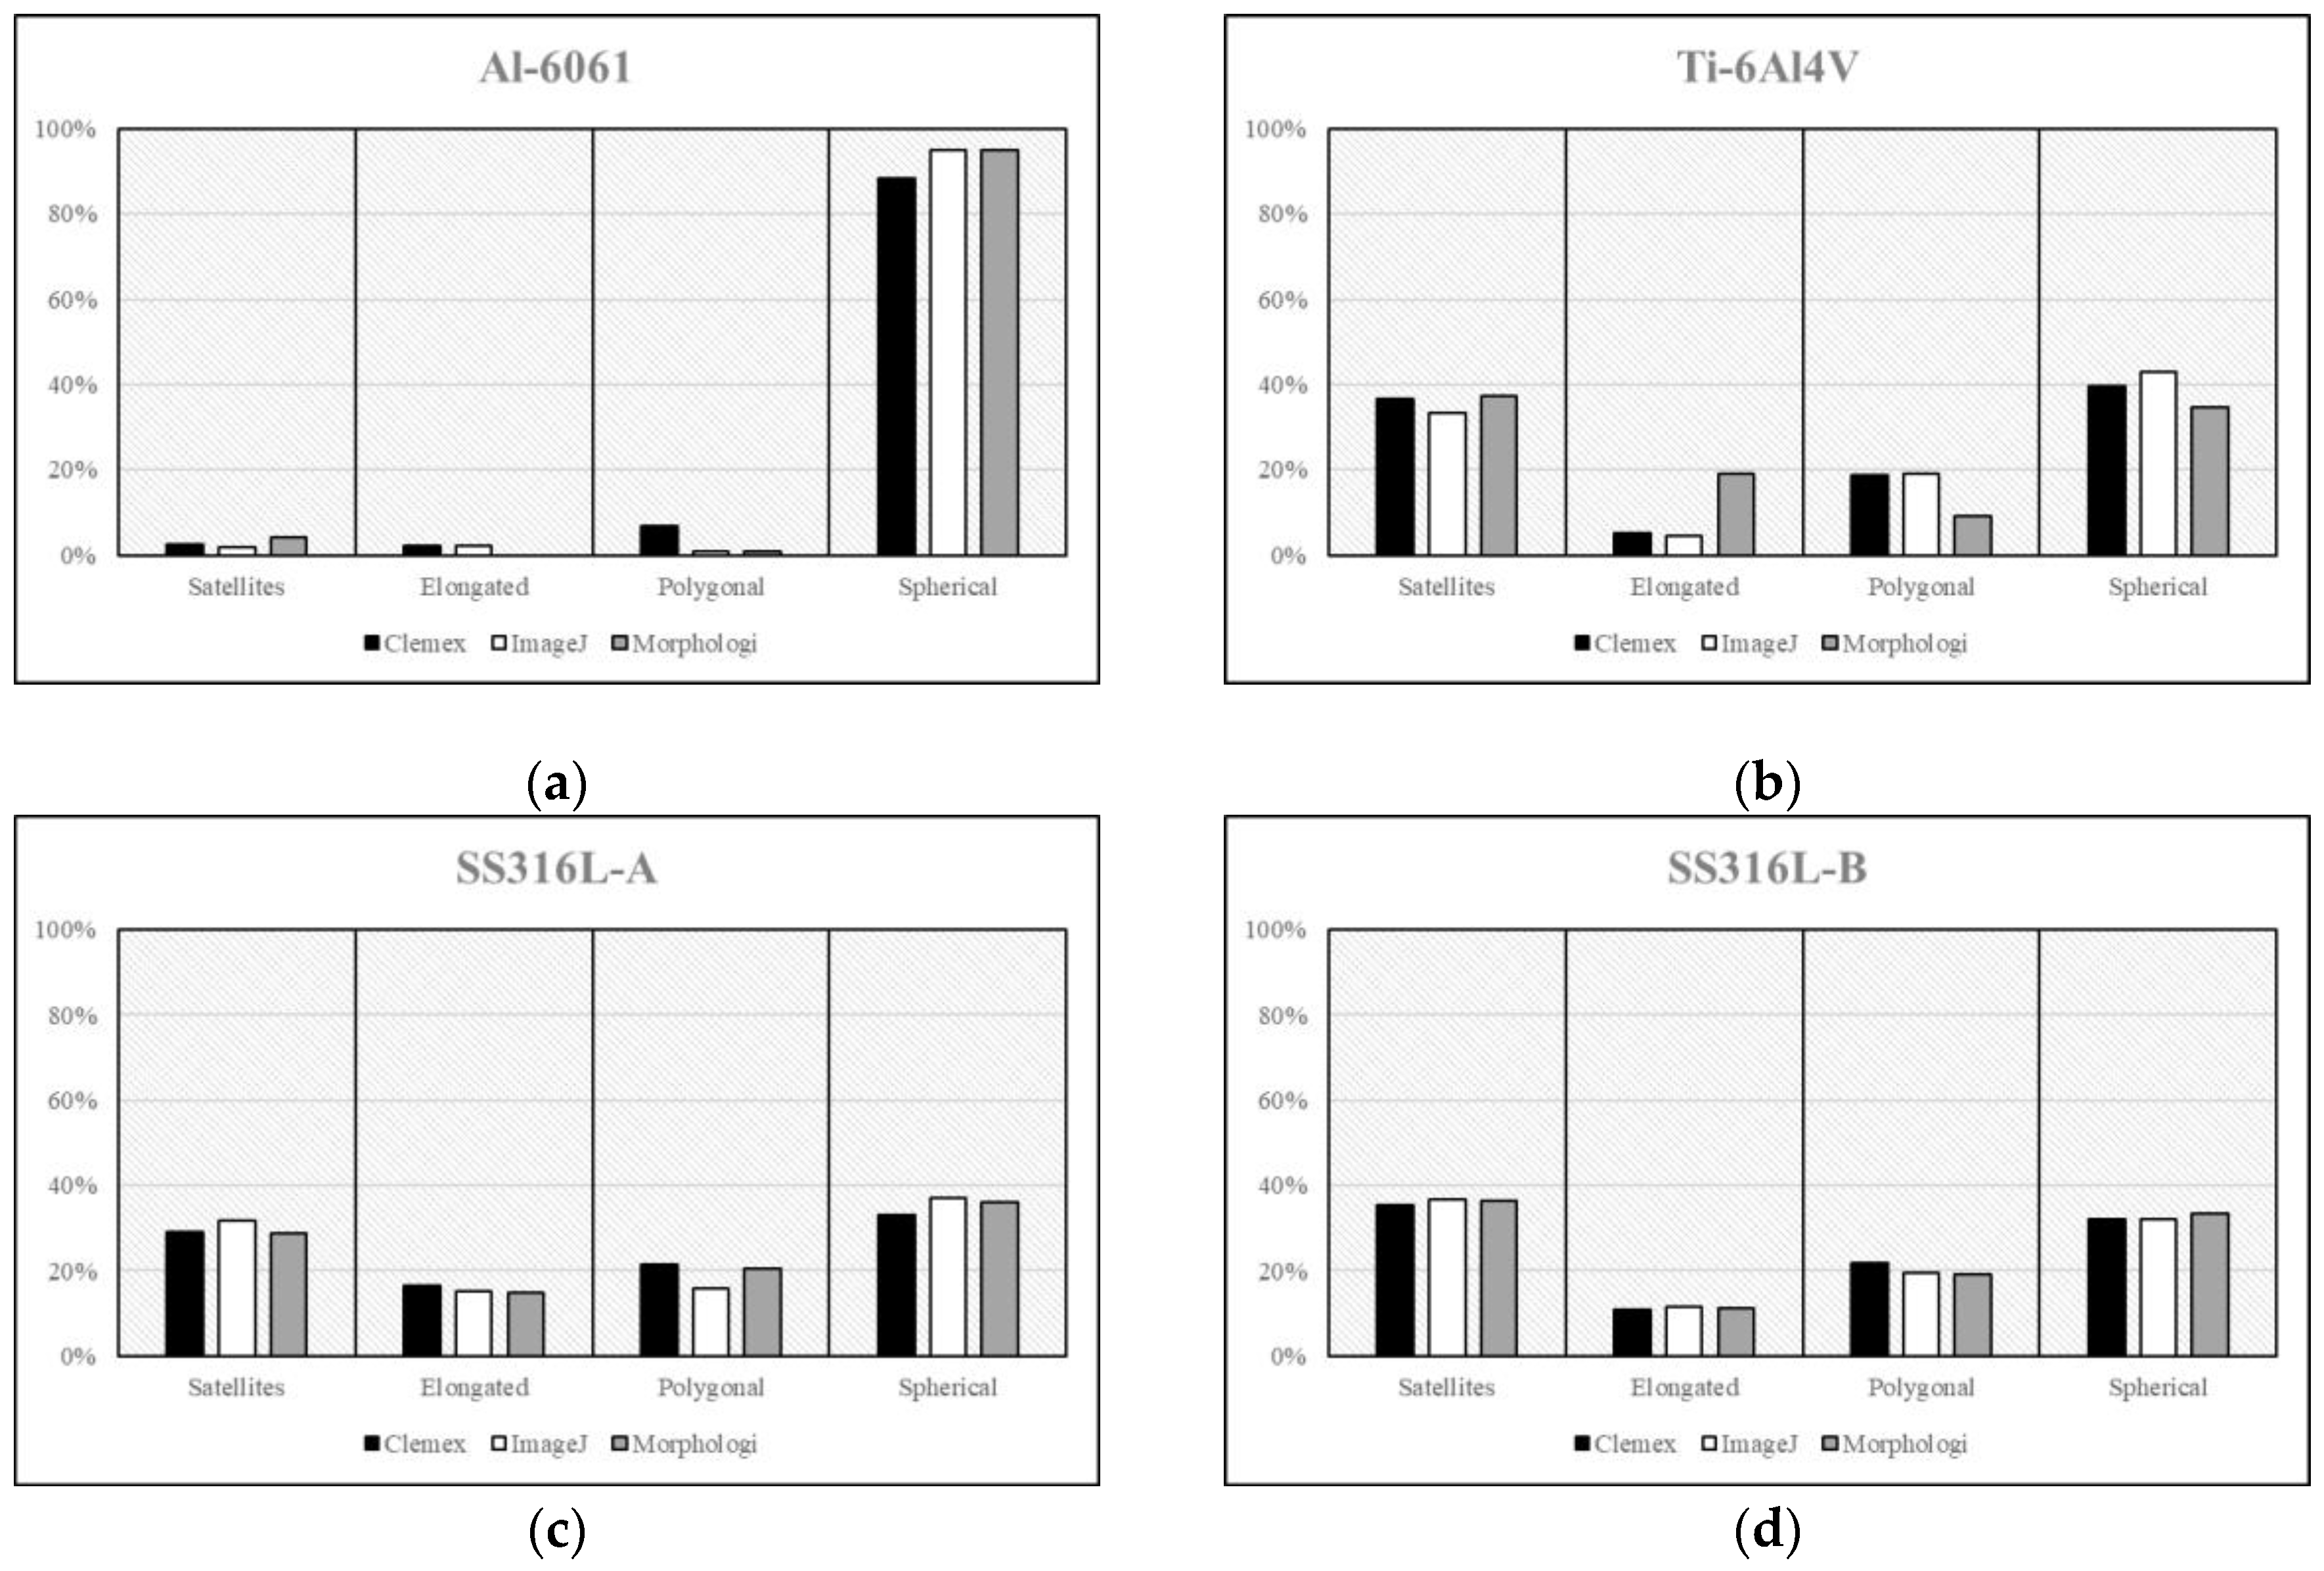

Table 1.
Variation between Clemex and ImageJ measurements.
| Basic measurement | ∆ (%) | SD (%) | Basic measurement | ∆ (%) | SD (%) | ||
 |
A | 0.53 | 0.04 | 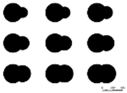 |
A | 0.84 | 0.03 |
| PC | 0.12 | 0.02 | PC | 0.29 | 0.01 | ||
| P | -3.83 | 0.23 | P | -3.48 | 0.27 | ||
| XFmax | 0.18 | 0.11 | XFmax | 0.35 | 0.05 | ||
| XFmin | 0.23 | 0.13 | XFmin | 0.48 | 0.20 | ||
| EL | 0.57 | 0.21 | EL | 0.80 | 0.17 | ||
| EW | 0.55 | 0.24 | EW | 0.87 | 0.13 | ||
 |
A | 1.61 | 0.13 | 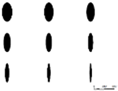 |
A | 1.83 | 0.64 |
| PC | 0.64 | 0.04 | PC | 0.48 | 0.05 | ||
| P | -3.48 | 0.24 | P | -3.23 | 0.61 | ||
| XFmax | 0.68 | 0.13 | XFmax | 0.61 | 0.16 | ||
| XFmin | 0.61 | 0.39 | XFmin | 0.56 | 0.20 | ||
| EL | 0.74 | 0.05 | EL | 0.73 | 0.24 | ||
| EW | 0.88 | 0.14 | EW | 1.16 | 0.49 | ||
 |
A | 0.40 | 0.12 | 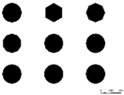 |
A | 1.46 | 0.04 |
| PC | 0.00 | 0.03 | PC | 0.61 | 0.04 | ||
| P | -4.57 | 0.65 | P | -3.56 | 0.96 | ||
| XFmax | 0.13 | 0.06 | XFmax | 0.54 | 0.08 | ||
| XFmin | 0.10 | 0.07 | XFmin | 0.57 | 0.13 | ||
| EL | 0.50 | 0.13 | EL | 0.76 | 0.05 | ||
| EW | 0.40 | 0.17 | EW | 0.77 | 0.07 | ||
Table 2.
Variation between Clemex and ImageJ calculated morphological descriptors.
| Morphological descriptor | ∆ (%) | SD (%) | Morphological descriptor | ∆ (%) | SD (%) | ||
 |
Cx | 3.80 | 0.21 | 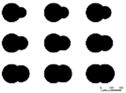 |
Cx | 3.64 | 0.27 |
| EC | 0.11 | 0.11 | EC | 0.00 | 0.18 | ||
| Er | -0.02 | 0.07 | Er | 0.07 | 0.06 | ||
| Rn | 0.16 | 0.19 | Rn | 0.14 | 0.11 | ||
 |
Cx | 4.01 | 0.22 | 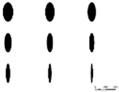 |
Cx | 3.56 | 0.60 |
| EC | 0.33 | 0.36 | EC | 0.98 | 0.94 | ||
| Er | 0.14 | 0.17 | Er | 0.43 | 0.35 | ||
| Rn | 0.26 | 0.26 | Rn | 0.63 | 0.81 | ||
 |
Cx | 4.37 | 0.60 |  |
Cx | 4.02 | 0.84 |
| EC | 0.41 | 0.22 | EC | 0.36 | 0.18 | ||
| Er | -0.10 | 0.09 | Er | 0.01 | 0.05 | ||
| Rn | 0.52 | 0.29 | Rn | 0.40 | 0.15 | ||
Table 3.
Summary of the threshold and descriptors for each software.
| Descriptor | Clemex | ImageJ | Morphologi |
| ExtentC | 4A/(πXFminXFmax) | 4A/(πXFminXFmax) | 4A/(πWL) |
| EC <0.955 | EC <0.95 | EC <0.955 | |
| +++ | ++ | + | |
| Ellipse ratio | EW/EL | EW/EL | W/L |
| Er <0.90 | Er <0.90 | Er <0.90 | |
| +++ | ++ | ++ | |
| Roundness | 4A/(πXFmax)2 | 4A/(πXFmax)2 | 4A/(πXFmax)2 |
| +++ | ++ | ++ | |
| Irregularity | (ELID)/(EWOD) | (ELMIC)/(EWXFmax) | (DeqW)/(LXFmax) |
| Rn&IR <0.90 | Rn&IR <0.89 | Rn&IR <0.93 | |
| +++ | + | + | |
| +++ | Analyzed directly by the software. | ||
| ++ | Calculated from the data exported by the software. | ||
| + | A substitute measurement is required to calculate the descriptor. | ||
Disclaimer/Publisher’s Note: The statements, opinions and data contained in all publications are solely those of the individual author(s) and contributor(s) and not of MDPI and/or the editor(s). MDPI and/or the editor(s) disclaim responsibility for any injury to people or property resulting from any ideas, methods, instructions or products referred to in the content. |
© 2025 by the authors. Licensee MDPI, Basel, Switzerland. This article is an open access article distributed under the terms and conditions of the Creative Commons Attribution (CC BY) license (http://creativecommons.org/licenses/by/4.0/).
Copyright: This open access article is published under a Creative Commons CC BY 4.0 license, which permit the free download, distribution, and reuse, provided that the author and preprint are cited in any reuse.


