
Submitted:
21 March 2025
Posted:
26 March 2025
You are already at the latest version
Abstract
Debt financing is important for financing major investments in the biopharmaceutical industry. Debt financing allows companies to raise funds without giving up ownership or control through indenture and covenants of the company. In this study, I analyze the effects of debt financing decisions on profitability in the biopharmaceutical industry. I find that short-term debt, long-term debt and total debt negatively impacts return on assets (ROA) as a firm's profitability measure. A comparison is made between the US and Europe biopharmaceutical firms and the result shows the negative effects of short-term and long-term debt on profitability persist more for US biopharmaceutical firms than Europe firms. Short-term and long-term debt both impact profitability negatively with 10-year lagged R&D intensity and financial distress. Short-term debt's negative impact is stronger in post-Covid-19, indicating increased financial strain. Long-term debt consistently affects profitability negatively, with relative stable effects during the pre- and post-Covid-19.
Keywords:
debt
; short-term debt
; long-term debt
; profitability
; US biopharmaceutical
; Europe biopharmaceutical
1. Introduction
Debt financing is important for financing major investments like R&D in the biopharmaceutical industry. Debt financing allows companies to raise funds without giving up ownership or control through indenture and covenants of the company. Debt financing provides greater flexibility for firms in biopharmaceutical industry to finance highly intensive research and development (R&D).
Debt financing is a factor that can significantly impact a company's net revenue (Spazek, 2020). Debt financing or borrowing of funds to finance company’s operations and investments can have two impacts on a firm. Debt financing provides the necessary capital for expansion and innovation. On the other hand, it imposes financial obligations that can strain a firm's resources, especially in sectors with high capital intensity and competitive innovation. The biopharmaceutical industry in the United States is an example of such a sector, making it an ideal place to investigate these relationships. When firms are selecting debt to finance their operations and investments, they face decisions regarding the appropriate types of debt.
The choice of debt financing is an important decision for companies aiming to fund their projects. This paper poses research questions: How do short-term and long-term debt impact profitability within the biopharmaceutical industry? What are the ways through which short-term and long-term debt affect profitability? The diverse range of debt instruments, both short- and long-term, provides flexibility in financial strategies. The impact of debt on profitability remains a subject of debate, with conflicting findings in previous studies. While some suggest that debt can lower the cost of capital and enhance profitability (Tailab, 2014; Abor, 2005; Trabelsi & Bouallegui, 2004), others argue that higher interest payments may decrease overall profitability (Harris & Raviv (1991) and Rajan & Zingales, 1995).
Focusing specifically on the biopharmaceutical industry, my interest in analyzing the impact of debt financing is driven by the industry's unique characteristics. The biopharmaceutical sector attracts significant attention due to continuous advancements in R&D, strong investor demand for higher returns and the imperative for companies to replenish their pipelines. Furthermore, the industry's critical role in addressing global health challenges, such as the Covid-19 pandemic, underscores its financial and economic significance.
Debt financing is essential to the biopharmaceutical industry, allowing companies to undertake large R&D activities, grow medication pipelines, and respond quickly to global health emergencies. In this capital-intensive industry, debt provides the financial resources required to drive innovation, maintain competitive market positions, and cover operating costs. It helps biopharmaceutical companies negotiate the complexity of medication discovery, manufacturing, and market dynamics, hence promoting long-term growth and breakthroughs in healthcare.
As the biopharmaceutical industry stands at the intersection of innovation, health care, and economic impact, understanding the dynamics of debt financing and its influence on profitability is important because debt financing minimizes agency costs (Jensen and Meckling, 1976), serve as indicators of firm quality (Myers and Majluf, 1984), and might influence firm’s profit. The strategic decisions made by companies in this sector not only shape their financial performance but also contribute to advancements in healthcare, making it a focal point for financial and strategic analysis (Thakor & Lo, 2015). The strategic decisions made by companies in this sector not only shape their financial performance but also contribute to advancements in healthcare, making it a focal point for financial and strategic analysis. Therefore, debt financing decisions raise important questions regarding how biopharmaceutical firms use their financial structures to influence profitability.
I study 687 public-traded US and Europe biopharmaceutical firms with data on Compustat between 1990-2022 (4284 firm-year observation two-way fixed effects and dynamic panel estimations, I find evidence that total debt, both long-term and short-term, affects profits negatively. This is because the more the short-term debt and long-term debt increases, the more it will increase the firm's interest expense which in turn reduces its profit. In terms of economic significance, a one-standard-deviation increase in the short-term debt leads to 13.7 percent decrease in profitability after controlling for firm-level and macroeconomic characteristics. This negative effect on profitability is more pronounced for US biopharmaceutical firms than European firms.
In addition, the result shows that long-term debt reduces profitability for biopharmaceutical firms. The economic significance of the negative relationship between long-term debt and profitability is that an increase of one standard deviation of long-term debt relates to a 2.55 percent standard deviation decrease in profitability. This suggests a strong negative impact of long-term debt on profitability for pharmaceutical firms in the USA.
Total debt, which combines both short-term and long-term debt, has a negative effect on profitability and is statistically significant at 1 percent. There is a strong negative impact of long-term debt on profitability for pharmaceutical firms in the USA as compared to European biopharmaceutical firms.
Furthermore, I examine the mechanisms through which debt financing affects profitability. The results show that short-term and long-term debt impact profitability negatively with 10-year lagged R&D intensity and financial distress. Biopharmaceutical firms heavily invest in R&D, often necessitating debt financing. However, the finding reveals that long-term debt negatively impacts profitability when combined with 10-year lagged R&D intensity and financial distress. This suggests that while R&D is essential for innovation, high levels of R&D spending paired with long-term debt can strain profitability. Similarly, financial distress exacerbates the negative effects of long-term debt, highlighting the need for effective financial distress management.
This paper contributes to the existing literature that relates how the composition of debt affects profitability. Some studies (Tyagi & Nauriyal, 2016; Pervan et al., 2019; Aashna and Thyagarajan, 2016) overlook how short-term and long-term debt impact profitability separately.
This study contributes to the literature by offering a comprehensive analysis of the interplay between long-term debt, lagged R&D and financial distress in the biopharmaceutical industry. It provides practical implications for financial managers and policymakers aiming to balance debt financing with sustainable profitability.
This study focuses on the biopharmaceutical industry, which is characterized by increased competitiveness, which drives innovation. In response to the need for constant innovation, biopharmaceutical businesses frequently rely on higher debt to fund projects. However, my findings show that increased debt levels are associated with a decrease in profitability, defying the understanding that debt drives growth and financial success in this dynamic market.
The rest of this paper is organized as follows. Section 2 examines relevant theoretical and empirical literature. Section 3 outlines the research methodology, which includes empirical estimation methods. The empirical findings are presented in Section 4. In Section 5, the study's summary and conclusion are presented. The data and variables used in the study are described in the Appendix.
2. Literature Review and Development of Hypotheses
According to Modigliani and Miller (MM) (1958), debt does not affect the value of the firm, so any structure of debt adopted by any firm at any point in time is as good as any other in the absence of corporate tax. Relaxing some of the assumptions of M&M from their initial proposition in prior literature revealed that capital structure affects profitability1. Tyagi & Nauriyal (2016) examined the profitability of the Indian biopharmaceutical sector. Their study employed an OLS regression model with Driscoll-Kraay standard errors and used inflation-adjusted panel data from 2000 to 2013. Export intensity, advertising and market intensity, firm market power, and a stronger patent regime benefit profitability. The MM theory implies that firms can raise their profitability by maximizing their debt financing and reaping the benefits of tax savings as a result. Hence an increase in leverage leads to a positive effect on profitability.
Some authors, including Myers (1976), Jensen & Meckling (1976), Grossman & Hart (1983), Jensen (1986), Harris & Raviv (1990), Ahmed, Abdullahi, & Roslan (2012), and Fosu (2013), have improved the classic capital structure by incorporating control variables. The authors conducted empirical studies based on several capital structure theories. Various theories include trade off, pecking-order, information asymmetry, signaling, product/input market interaction, and market-timing theories.
Consequently, in 1958, Modigliani-Miller's MM theory was developed into trade-off theory2. The trade-off theory focuses on debt repayment and costs of debt issuance, and it predicts that a desirable target debt ratio would add value to the business. Rather than constantly issuing debt to improve firm value, the trade-off theory asserts that firms must strive towards a specific level of debt financing to achieve the optimal company value. Kraus & Litzenberger (1973) stated firms should aim for debt levels that maximize tax benefits while minimizing bankruptcy risks. Jawade (2014) analyzed the effect of capital structure on biopharmaceutical company performance across a range of market capitalizations. The author showed that capital structure provides growth prospects, maintains solvency, and provides an excellent return to stakeholders without dilution of management control; firms must trade-off between the tax benefits of debt and the consequences of bankruptcy.
Myers and Majluf (1984) posited the pecking order theory as an alternative to the trade-off theory. According to this hypothesis, when a company needs external funding, it favors debt over equity. It also predicts that riskier firms will have higher leverage ratios. Investors and managers have a greater incentive to take on riskier projects when a firm's debt financing allocation rises. Mohammadzadeh, Rahimi, Aarabi, & Salamzadeh (2013) examined the relationship between capital structure and profitability in Iranian biopharmaceutical enterprises. The top 30 Iranian biopharmaceutical businesses were studied, and their financial data was collected from 2001 to 2010. This study used the net margin profit and the debt ratio as profitability and capital structure indices, respectively, with sales growth as a control variable. The findings revealed a significant negative association between debt and profitability. Also, the result supports the pecking order theory in the Iranian biopharmaceutical companies. The results show that increased debt financing negatively impacts profitability in Iranian biopharmaceutical firms, aligning with the pecking order theory by prioritizing internal over external financing due to debt's cost and risk. Other authors concluded that internal funding, such as retained earnings, is the best first alternative, followed by debt securities if internal funds are insufficient to finance the firm (Frank & Goyal, 2003; Rasiah & Kim, 2011).
Thus, the use of debt to finance investments projects in the biopharmaceutical industry can positively or negatively affect profitability in a competitive environment. I argue that debt financing does not only affect profitability directly but also influences biopharmaceutical firms’ profitability indirectly through 10-year lagged R&D and financial distress.
2.1. Development of Hypotheses
Three key testable hypotheses are established based on theoretical predictions and historical empirical evidence.
Relationship between debt financing and profitability
Debt financing involves borrowing funds to support business operations or investments, which is either short-term or long-term debt (Allen, 2015). The combination of short-term and long-term debt is the total debt. Debt requires firms to make periodic interest payments, which not only reduce profits in the current accounting period but may also limit available cash for operations in the subsequent period (Sarkar and Sarkar, 2008). Debt financing can provide a tax shelter for profits associated with high financial risk; hence, all firms should consider how much debt capital they should maintain to benefit from such trade-offs. The costs of obtaining new external funding are higher than those of internal financing, as internal funds do not incur any transaction costs. Past research has discovered a positive link between debt financing and profitability (Habib et al., 2016; Margaritis & Psillaki, 2010), while others argue that debt and profit have a negative relationship (Habib et al., 2016; Sadiq & Sher, 2016). However, Weill (2008) shows that debt financing can positively or negatively impact a firm’s performance when industrial histories, current economic conditions, and other macroeconomic factors are accounted for. To make appropriate debt decisions, it is necessary to test the relationship between levels of debt and firm profitability. In this light, I test the following:
Hypothesis 1:
Debt finance has a significant relationship with profitability.
Short-term debt refers to obligations that last shorter than a year and are typically related to internal or external company concerns while long-term debt refers to a company's borrowing or external finance that is repayable over a longer period of time. Short-term debt is riskier and has a greater impact on profitability than long-term debt due to several factors. The frequent and immediate repayment schedules associated with short-term debt create significant liquidity pressures, forcing firms to allocate substantial cash flow to debt servicing. This can strain resources, limit funds available for strategic investments like R&D and reduce overall financial flexibility. Additionally, short-term debt often comes with higher and more volatile interest rates, increasing interest expenses and financial uncertainty. Short-term debt has a greater negative influence on biopharmaceutical industry profitability than long-term debt because of higher periodic interest payments and the urgency of repayment. I hypothesize that
Hypothesis 2:
Short-term debt has a more negative impact on profitability than long-term debt.
2.2. Mechanisms Through which Debt Financing Affects Profitability
Interaction between debt and lagged of R&D on Profitability
R&D investments in the biopharmaceutical industry typically take considerable time to impact on a firm's profitability. Firstly, new drugs undergo extensive preclinical and clinical trials spanning approximately 10 years. Secondly, FDA approval is essential to ensure safety, efficacy, and quality, adding complexity and time to the process. Thirdly, translating successful R&D into economic benefits involves patenting innovations, a time-consuming process to protect against competitors. Therefore, immediate financial gains from R&D investments may not be realized if the benefits of innovative products do not sufficiently outweigh their costs. Thus, the impact of debt on profitability when combined with lagged R&D investments in the biopharmaceutical industry can vary. Zhao & Wu (2013) and Lu & Wang (2011) found a negative impact of current expenditure on performance using ROA, but a positive and significant effect of one-year lagged expenditure on profitability. Debt may provide necessary funding for R&D activities, contributing positively to future profitability through innovation and market competitiveness. However, excessive debt levels could increase financial risk and interest expenses, potentially negatively impacting profitability. I hypothesized that
Hypothesis 3a:
There is a significant effect of debt and lagged R&D on a firm’s profitability.
2.3. Interaction Between Debt and Financial Distress on Profitability
Financially distressed biopharmaceutical firms with high debt face adverse impacts on profitability due to increased interest expenses, risk of default, reduced investor confidence and market valuation, strategic constraints on R&D and growth investments, heightened regulatory scrutiny, and competitive disadvantages against financially stable peers. These factors collectively hinder financial stability, operational effectiveness, and long-term growth prospects in a competitive industry reliant on innovation and regulatory compliance. Therefore, I hypothesize that
Hypothesis 3b:
There is a negative effect of debt and financially distressed firms on a firm’s profitability.
3. Data and Empirical Methodology
3.1. Data and Data Sources
This study uses unbalanced panel data consisting of publicly traded biopharmaceutical firms with data available on COMPUSTAT. I consider all audited financial data for biopharmaceutical companies based on 4-digit Standard Industrial Classification (SIC) code (SIC 2833: Medicinal Chemicals and Botanical Products, SIC 2834: Pharmaceutical Preparations, SIC 2835: In Vitro and In Vivo Diagnostic Substances, SIC 2836: Biological Products, Except Diagnostic Substances) retrieved from COMPUSTAT. I merge the resulting sample of the COMPUSTAT data with macroeconomic data (Inflation, real gross domestic product per output and interest rate) from the Federal Reserve Economic (FRED) from 1990-2022. The final sample comprises 687 US and European public-traded biopharmaceutical firms and 4284 firm-year observations from 1990-2022. 485 firms belong to US while 202 firms belong to Europe. The European countries with biopharmaceutical firms are Belgium, Switzerland, Germany, Denmark, Spain, France, United Kingdom, Ireland, Luxembourg, Netherlands, Norway, Sweden. Out of 687 firms, 45 firms did not report R&D. Therefore, R&D expenses were set to zero when they were not reported, and those firms are found in Appendix.
3.2. Definition and Measurement of Variables
The definition of all variables with expected signs is found in the Appendix. I defined the dependent and independent variables to be used in this study so that they were consistent with those of Rajan and Zingales (1995), Loderer & Waelchli (2010), Abor's (2005), Fosu (2013), and Pervan, Pervan, & Ćurak (2019).
3.3. Empirical Model and Estimation Strategy
Theoretically, the leverage-profitability relationship is expressed in equation 1 after controlling for firm-specific characteristics. These variables were chosen based on prior literature and their theoretical significance in determining a firm’s profitability.
is firm i’s profit in year t. The return on assets (ROA) has been used in prior research and by managers and other stakeholders, supporting the use of ROA as a measure of profitability (Bettis, 1981; Baum et al., 2007; Kebewar, 2013; Pervan, Pervan, & Ćurak, 2019). As a result, this study employs ROA as a profitability metric, and it is the dependent variable in the data analysis. It is measured as earnings before interest, taxes, depreciation, and amortization. The main explanatory variable is debt. measures the debt financing decisions such as total debt, long-term, and short-term debt and they are measured in percentages. are the firm-level variables that include firm age, firm size, R&D intensity, cash holding, capital intensity, growth opportunity and macroeconomic variables such as real GDP, interest rate, inflation and global financial crisis (2007-2009). I lag the variables to address endogeneity and reverse causality issues.
3.4. Method of Estimation
The relationship between debt and a firm's profitability at time t can be expressed in equation 2 using two fixed effects estimations:
I expect that companies in the sample may have other unobserved idiosyncrasies that distinguish them from one another. To determine and control for the unobserved individual-specific firm and year effects, I use two-way fixed as depicted in Equation 2:
Mechanisms through which debt financing influences profitability
where represents the profitability of firm i at time t, i = 1, …, N and t = 1, …, T. in that captures the time-invariant firm-specific effects, accounts for unobserved heterogeneity, and is the white noise. are 10-year lagged of R&D and financial distress.
The fixed-effects model controls for the potential correlation between regressors' and unobservable individual effects. The fixed effects approach takes to be a group-specific constant term in the regression model (Wooldridge, 2012). The use of the fixed effects helps to address the problem of possible endogeneity concerns. By analyzing the within-firm variance in profitability across time, I include firm-fixed effects and firm-specific controls like age, tangibility, etc. address this concern. Also, I introduce year-fixed effects to account for unobserved time-specific shocks influencing all firms (Grullon, Larkin & Michaely, 2018). I use cluster-robust standard error estimations at the firm level to control for possible heteroscedasticity and autocorrelation.
4. Results and Discussions
4.1. Summary Statistics
Table 1A shows how number of firms varies across years. 2022 has the highest firms with 1990 having the lowest number of biopharmaceutical firms. Table 1B presents the summary statistics for dependent and independent variables. I winsorize all continuous variables at the 1st and 99th percentiles in the analysis to reduce the influence of outliers (Campbell, Hilscher & Szilagyi, 2008; Loderer & Waelchli, 2010). I use two measures for firm profitability. The first measure is calculated as the ratio of earnings before interest, taxes, depreciation and amortization over total assets (EBITDA/TA). and it is the main measure. The second measure is measured as the ratio of net income over total assets (NI/TA). A firm's profitability as measured by return on assets (ROA) depicts an average of 6 percent decrease of total assets. Having a negative ROA indicates that biopharmaceutical firms have a downward trend in profitability. The average short-term debt ratio of 18.9 percent indicates that biopharmaceutical firms utilize a relatively large portion of their total debt (28.9 percent) for short-term financing needs relative to long-term debt of 10.52 percent. This suggests that biopharmaceutical firms rely heavily on short-term debt to fund their operations. The average firm age of around 9 years suggests that many firms in the biopharmaceutical industry are relatively young. This reflects the dynamic and innovative nature of the sector, with many new entrants focused on breakthrough technologies and treatments. R&D intensity, which measures R&D expenditure as a percentage of total asset, is about 21.56 percent. This high R&D intensity shows the industry's commitment to innovation and the significant resources allocated to developing new drugs and treatments.
Table 1C shows the descriptive statistics in the subsample of firms in US and Europe. US biopharmaceutical firms have a mean profitability of 7.87 percent, while European firms have a mean of 2.36 percent. This indicates that US firms, on average, generate higher profitability relative to their total assets compared to European firms, suggesting potentially higher efficiency in asset utilization or stronger market positioning. Also, US biopharmaceutical firms maintain a mean short-term debt ratio of 16.31 percent, compared to 14.52 percent for European firms. This difference implies that US firms rely more on short-term debt relative to their total assets, which may indicate varying strategies in managing liquidity and financing short-term obligations. US firms have a mean long-term debt ratio of 10.66 percent, while European firms have a mean of 8.82 percent. The higher mean long-term debt ratio among US firms suggests a greater reliance on long-term financing for capital investments and strategic initiatives relative to their total asset base.
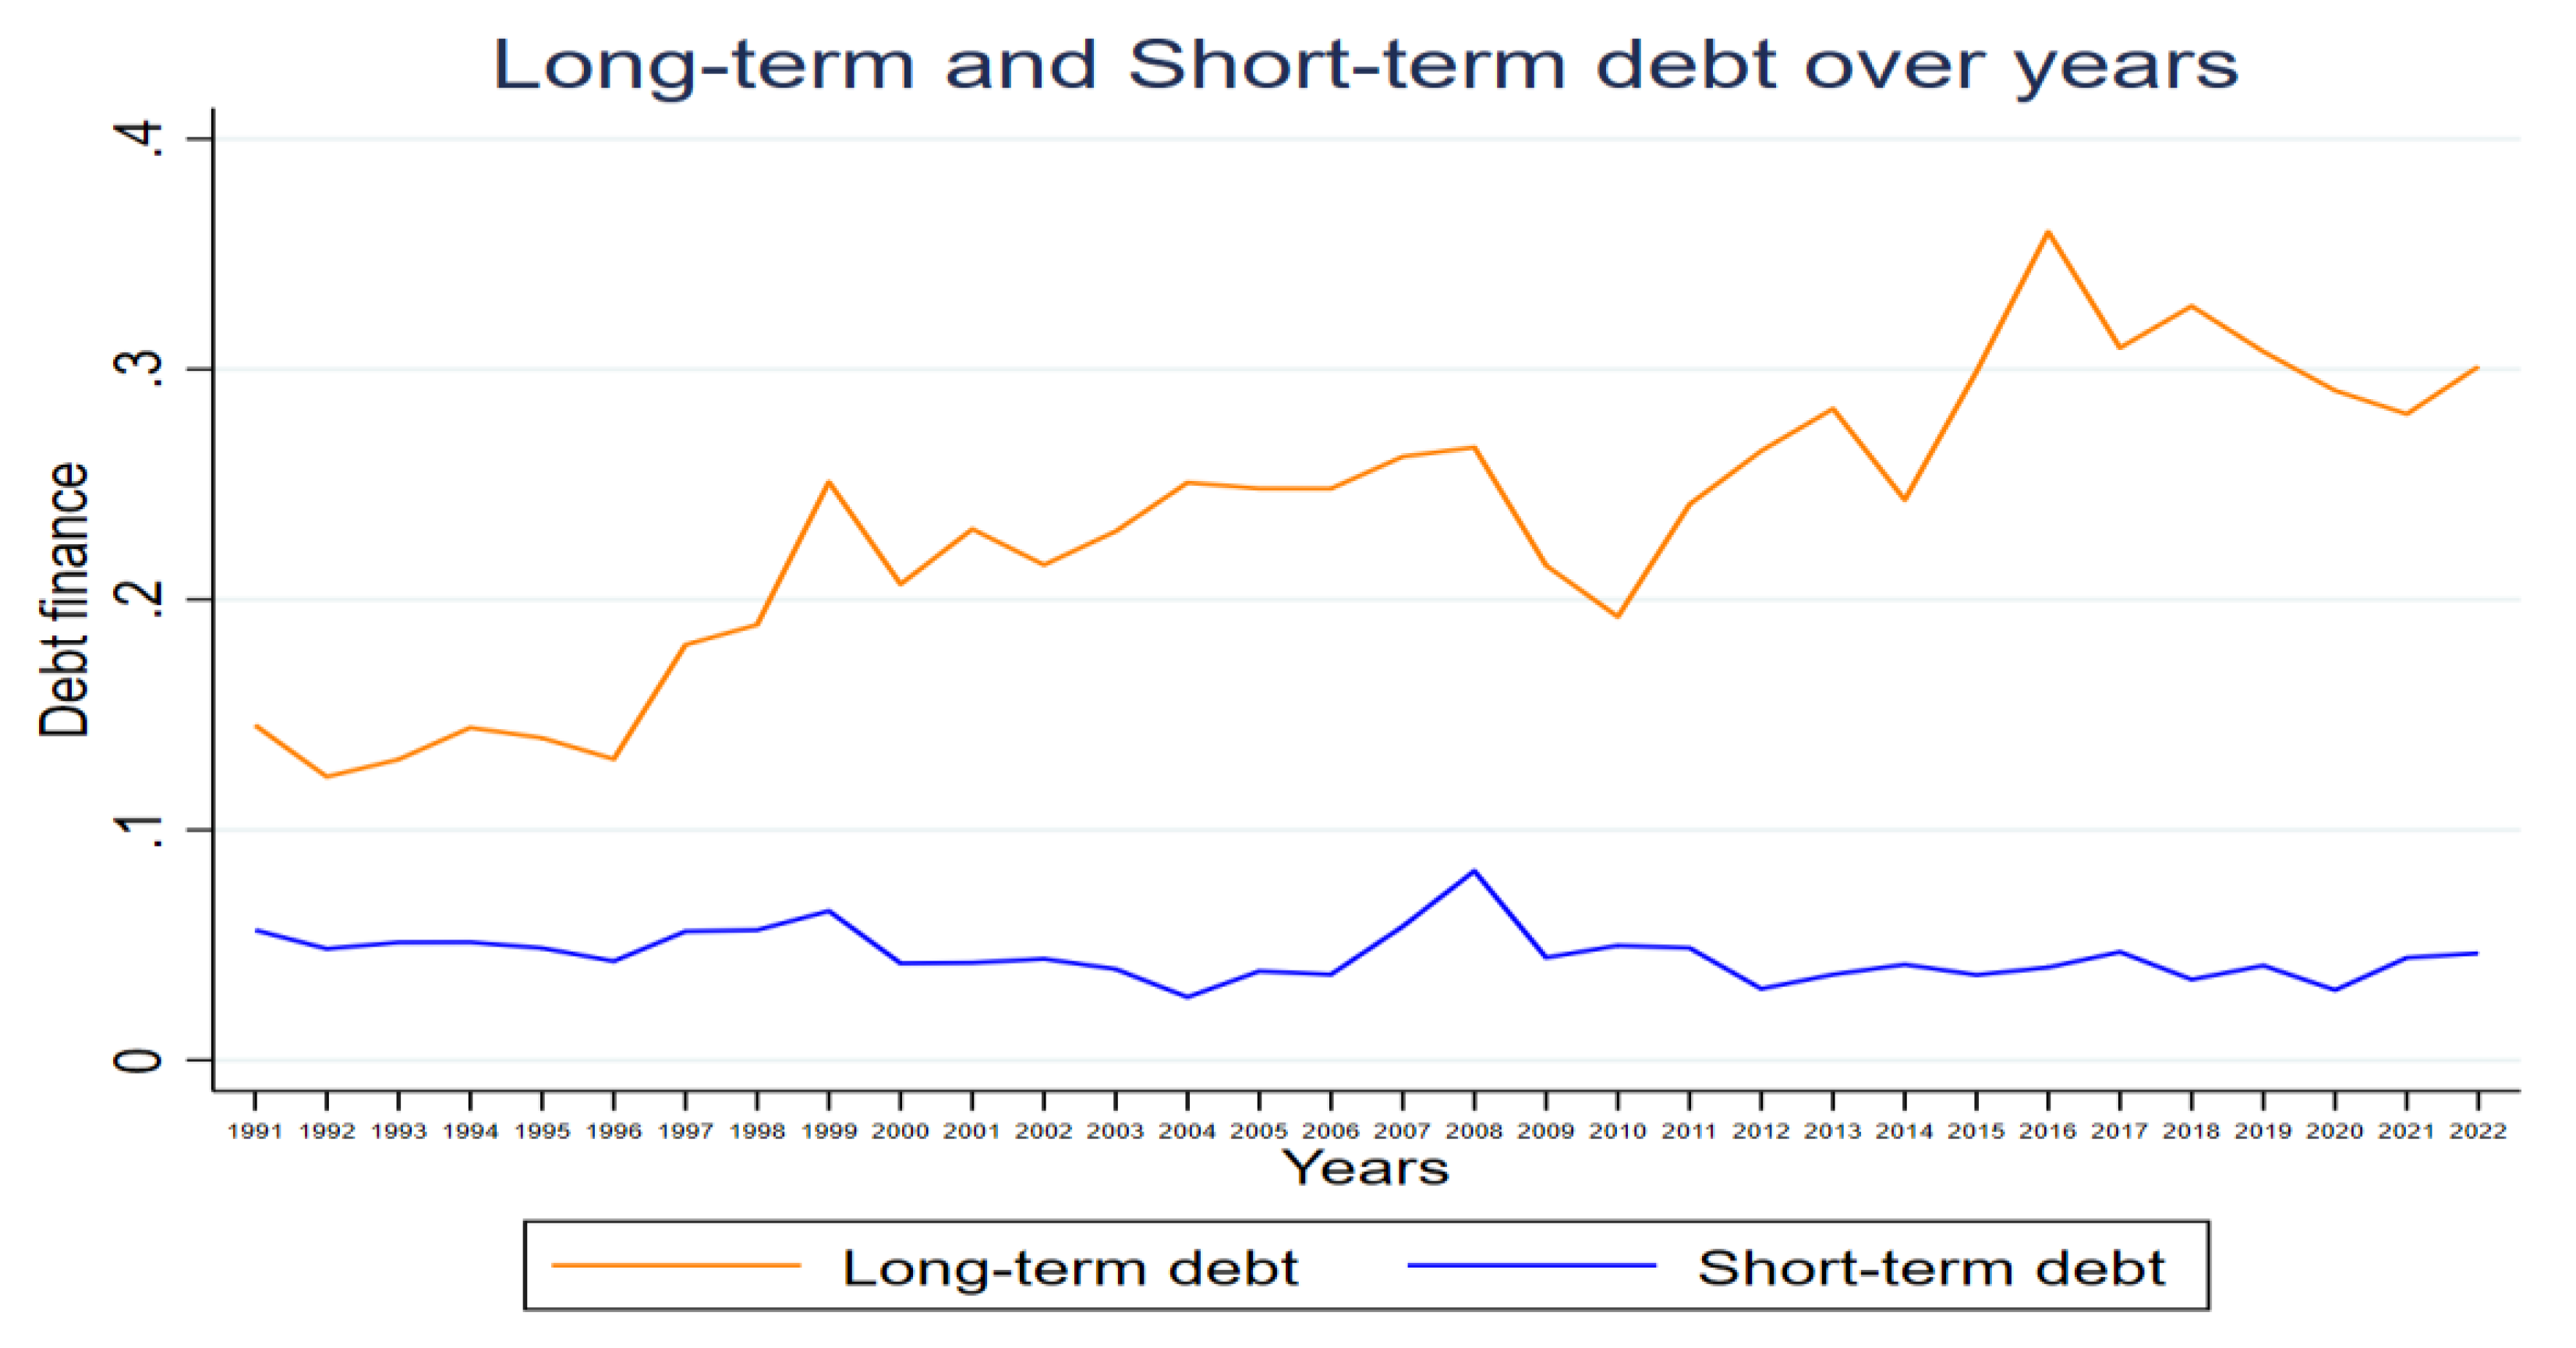
Figure 1 shows how short-term debt and long-term debt vary across years.

Table 1.
A: Number of firms across years.
| Year | Number of firms |
|---|---|
| 1990 | 34 |
| 1991 | 59 |
| 1992 | 66 |
| 1993 | 89 |
| 1994 | 103 |
| 1995 | 103 |
| 1996 | 111 |
| 1997 | 126 |
| 1998 | 138 |
| 1999 | 142 |
| 2000 | 134 |
| 2001 | 157 |
| 2002 | 160 |
| 2003 | 151 |
| 2004 | 155 |
| 2005 | 160 |
| 2006 | 157 |
| 2007 | 150 |
| 2008 | 131 |
| 2009 | 115 |
| 2010 | 99 |
| 2011 | 97 |
| 2012 | 93 |
| 2013 | 92 |
| 2014 | 103 |
| 2015 | 118 |
| 2016 | 125 |
| 2017 | 132 |
| 2018 | 135 |
| 2019 | 191 |
| 2020 | 201 |
| 2021 | 218 |
| 2022 | 239 |
Table 1.
B: Descriptive Statistics.
| N | Mean | Std. Dev. | p25 | Median | p75 | p99 | |
|---|---|---|---|---|---|---|---|
| Outcome variables | |||||||
| Profitability_1 (ROA_1) | 4284 | -0.0623 | 0.3105 | -0.2421 | 0.0361 | 0.1534 | 0.4032 |
| Profitability_2 (ROA 2) | 4284 | -0.1467 | 0.3466 | -0.3055 | -0.0401 | 0.0750 | 0.3357 |
| Main Explanatory variables | |||||||
| Total debt | 4284 | 0.2890 | 0.3270 | 0.0774 | 0.2060 | 0.3907 | 1.4417 |
| Short term debt | 4284 | 0.1838 | 0.3070 | 0.0435 | 0.1500 | 0.3460 | 1.3566 |
| Long term debt | 4284 | 0.1052 | 0.1118 | 0.0029 | 0.0135 | 0.0448 | 0.4629 |
| Control variables | |||||||
| Firm age | 4284 | 9.1041 | 7.8820 | 7 | 15 | 32 | 41 |
| Firm size | 4284 | 6.2258 | 2.1511 | 4.6286 | 5.8536 | 7.4414 | 11.7563 |
| R&D intensity | 4284 | 0.2156 | 0.2818 | 0.0570 | 0.1380 | 0.3012 | 1.0789 |
| R&D-lag 10 | 4284 | 0.0119 | 0.0456 | 0.0021 | 0.0033 | 0.0069 | 0.1796 |
| Cash holding | 4284 | 0.3839 | 0.2836 | 0.1251 | 0.3259 | 0.6324 | 0.9426 |
| Capital intensity | 4284 | 0.0374 | 0.0407 | 0.0114 | 0.0257 | 0.0494 | 0.2030 |
| Growth opportunity | 4284 | 2.6531 | 2.3850 | 1.1594 | 1.9916 | 3.3544 | 11.498 |
| Panel B: Macroeconomic variables | |||||||
| Real GDP | 33 | 1.5327 | 1.7141 | 0.7712 | 1.6551 | 2.6583 | 5.1866 |
| Interest rate | 33 | 2.6288 | 2.3205 | 0.18 | 2.16 | 4.68 | 7.31 |
| Inflation | 33 | 2.6479 | 1.5146 | 1.6400 | 2.6074 | 3.1568 | 8.0028 |
| Global financial crisis | 33 | 0.0909 | 0.2919 | 0 | 0 | 0 | 1 |
This table reports the summary of descriptive statistics of the dependent variable (ROA) and the main explanatory variables: debt (shot term debt, long-term and total debt) with other control variables. The sample contains 687 biopharmaceutical firms, making a total of 4284 firm-year observations from 1990-2022. All the firm-specific variables were winsorize at the 1st and 99th percentiles.
Table 1.
C: Summary statistics.
| All Biopharmaceutical Firms | |||||||
|---|---|---|---|---|---|---|---|
| USA Biopharmaceutical firms Europe Biopharmaceutical firms | |||||||
| N | Mean | Std. Dev. | N | Mean | Std. Dev. | ||
| Main dependent variables | |||||||
| Profitability_ 1 | 3595 | 0.0787 | 0.3180 | 689 | 0.0236 | 0.2513 | |
| Profitability_ 2 | 3595 | 0.1638 | 0.3563 | 689 | 0.0572 | 0.2744 | |
| Main explanatory variables | |||||||
| Total Debt | 3595 | 0.2697 | 0.3412 | 689 | 0.2334 | 0.2322 | |
| Short-term debt | 3595 | 0.1631 | 0.3205 | 689 | 0.1452 | 0.2172 | |
| Long-term debt | 3595 | 0.1066 | 0.1182 | 689 | 0.0882 | 0.0685 | |
| Control variables | |||||||
| firm age | 3595 | 9.3366 | 7.8366 | 689 | 7.8911 | 8.0117 | |
| firm size | 3595 | 5.9451 | 1.9957 | 689 | 7.6902 | 2.3325 | |
| R&D intensity | 3595 | 0.2256 | 0.2996 | 689 | 0.1639 | 0.1492 | |
| R&D-lag 10 | 3595 | 0.0132 | 0.0495 | 689 | 0.0050 | 0.0066 | |
| cash holding | 3595 | 0.3961 | 0.2846 | 689 | 0.3202 | 0.2697 | |
| Capital intensity | 3595 | 0.0380 | 0.0419 | 689 | 0.0338 | 0.0336 | |
| Growth opportunity | 3595 | 2.7065 | 2.4459 | 689 | 2.3744 | 2.0166 | |
This table reports the summary of descriptive statistics between US and Europe biopharmaceutical firms. The dependent variable is profitability measured as (EBITDA/TA) and is income before depreciation and amortization divided by book value of assets. The main explanatory variables are debt financing (shot term debt, long-term and total debt) with other control variables. The sample contains 687 biopharmaceutical firms, making a total of 4284 firm-year observations from 1990-2022. All the firm-specific variables were winsorize at the 1st and 99th percentiles.
Figure 3.
1: A graph showing a relationship between short-term and long-term debt across years.
4.2. Correlation Matrix
The correlation matrix is displayed in Table 1D. From Table 1D, short-term debt and long-term debt are negatively correlated with ROA. The variance inflation factors (VIF) for the rest of the main explanatory variables and controls are within the acceptable limits (1.24-3.82).
Table 1.
D: Correlation Coefficients.
| Variables | (1) | (2) | (3) | (4) | (5) | (6) | (7) | (8) | (9) | VIF |
|---|---|---|---|---|---|---|---|---|---|---|
| (1) Profitability (ROA) | 1.0000 | |||||||||
| (2) Short Term debt | -0.1580 | 1.0000 | 1.06 | |||||||
| (3) Long-term debt | -0.2490 | 0.0030 | 1.0000 | 1.02 | ||||||
| (4) Firm age | 0.2760 | 0.0390 | -0.0530 | 1.0000 | 1.29 | |||||
| (5) Firm size | 0.4350 | -0.1130 | -0.0230 | 0.0450 | 1.0000 | 1.20 | ||||
| (6) R&D intensity | -0.4440 | -0.0450 | 0.0620 | -0.1260 | -0.1970 | 1.0000 | 1.31 | |||
| (7) cash holding | -0.5260 | -0.1620 | 0.0210 | -0.3020 | -0.2640 | 0.4510 | 1.0000 | 1.57 | ||
| (8) Capital intensity | -0.0840 | -0.0580 | -0.0680 | 0.0250 | -0.1580 | 0.1230 | 0.1900 | 1.0000 | 1.90 | |
| (9) Growth opportunity | -0.0580 | -0.0660 | -0.0350 | 0.0290 | -0.0280 | 0.2490 | 0.2550 | 0.1660 | 1.0000 | 1.15 |
This table reports the correlation coefficients among the variables employed in this study. All continuous variables are winsorize at the 1st and 99th percentiles.
4.3. Discussion of Empirical Results
Table 1E shows the result of hypothesis test using paired t-test. The result is to prove whether the short-term and long-term debt variables individually have an influence on profitability. The result shows that p-value is less than 1 percent meaning that short-term and long-term debt individually have an influence on profitability.
Test difference between short-term debt and long-term debt
t = 39.8290
Degrees of freedom = 4283
Hypothesis:
Null hypothesis: There is no difference between short-term debt and long-term debt
Alternative hypothesis: There is no difference between short-term debt and long-term debt
Table 1.
E: Test difference between short-term debt and long-term debt.
| Variable | Observation | Mean | Standard error | Standard deviation |
|---|---|---|---|---|
| Long term debt | 4,284 | 0.2438 | 0.0047 | .3069 |
| Short term debt | 4,284 | 0.0452 | 0.0017 | .3069 |
Pr (T > t) = 0.0000.
Table 2 shows the regression of how short-term debt affects profitability. Without any controls, short-term debt affects profitability negatively by 44.7 percent and statistically significant at 1 percent. For economic significance, one standard deviation increase in short-term debt leads to 13.7 percent decrease in profitability. Column 2 shows that Short-term debt has a statistically significant negative effect on profitability (ROA) with all controls. From economic significance, one standard deviation increase in short term relates to 13.1 percent decrease in profitability. Columns 3 and 4 display how short-term debt affects profitability among US and Europe biopharmaceutical industry. The coefficient for short-term debt shows a negative effect on profitability and is statistically significant at 1 percent. This suggests that, in the USA, an increase in short-term debt is associated with a substantial and significant decrease in profitability but there is no statistically significant relationship between short-term debt and profitability for European biopharmaceutical firms.
Table 2.
The effect of short-term debt on profitability.
| USA | Europe | |||
|---|---|---|---|---|
| (1) | (2) | (3) | (4) | |
| ROA | ROA | ROA | ROA | |
| Short term debt | -0.4475*** | -0.4256*** | -0.5349*** | -0.3152 |
| (0.131) | (0.1212) | (0.1332) | (0.2552) | |
| Firm age | 0.0026*** | 0.003*** | 0.0013* | |
| (0.0007) | (0.0008) | (0.0007) | ||
| Firm size | 0.0437*** | 0.0468*** | 0.0375*** | |
| (0.0026) | (0.0031) | (0.0042) | ||
| R&D intensity | -0.2688*** | -0.2571*** | -0.4611*** | |
| (0.0797) | (0.0788) | (0.0999) | ||
| Cash holding | -0.3821*** | -0.3993*** | -0.2629*** | |
| (0.0306) | (0.0318) | (0.0509) | ||
| Capital intensity | 0.0386 | 0.0405* | 0.024 | |
| (0.025) | (0.0241) | (0.0731) | ||
| Growth Opportunity | 0.0102*** | 0.0079*** | 0.0271*** | |
| (0.0028) | (0.0029) | (0.0049) | ||
| Real GDP | 0.022*** | 0.0202*** | 0.0277*** | |
| (0.0014) | (0.0016) | (0.0037) | ||
| Interest rate | 0.0627*** | 0.0631*** | 0.0537*** | |
| (0.0039) | (0.0043) | (0.0081) | ||
| Inflation | -0.0516*** | -0.053*** | -0.0403*** | |
| (0.0028) | (0.003) | (0.0062) | ||
| Global Financial Crisis | -0.0291*** | -0.0391*** | 0.0364*** | |
| (0.0056) | (0.0065) | (0.0097) | ||
| Constant | 0.1529*** | -0.1415*** | -0.1571*** | -0.1481*** |
| (0.0074) | (0.0262) | (0.0302) | (0.0502) | |
| Observations | 4284 | 4284 | 3595 | 689 |
| R-Squared | 0.0694 | 0.4967 | 0.483 | 0.6111 |
| Year Effects | Yes | Yes | Yes | Yes |
| Firm Effects | No | No | No | Yes |
Table 2 examines the effect of short-term debt on profitability. Columns 3 and 4 compare the effect of short-term debt on profitability among US and Europe biopharmaceutical firms. In all regression models, I control for year fixed effects and firm fixed effects. Robust standard errors clustered by firms are presented in parentheses. *, **, *** denote a two-tailed p-value of <0.10, 0.05, and 0.01, respectively. Definitions of variables and their estimation methods are provided in Appendix.
Table 3 displays the effect of long-term debt on profitability. Long-term debt affects profitability negatively by 22.85 percent and statistically significant at 1 percent without any controls. Column 2 shows that the coefficient of long-term debt has a negative effect on profitability and is statistically significant at 1 percent when controls were included. From economic significance, one standard deviation increase in long-term debt leads to 2.2 percent decrease in profitability. Columns 3 and 4 display how long-term debt affects profitability among US and Europe biopharmaceutical industry. The coefficient for long-term debt shows a negative effect on profitability and is statistically significant at 1 percent. The negative impact of long-term debt on ROA is statistically significant in the USA, suggesting a clear relationship between increased long-term debt and decreased profitability. However, in Europe, the relationship is not statistically significant, indicating no clear impact of long-term debt on profitability. This is in line with hypothesis 2 which states that short-term debt impacts profitability more than long-term debt.
Table 3.
The effect of long-term debt on profitability.
| USA | Europe | |||
|---|---|---|---|---|
| (1) | (2) | (3) | (4) | |
| ROA | ROA | ROA | ROA | |
| Long-term debt | -0.2285*** | -0.1948*** | -0.2078*** | -0.0276 |
| (0.0267) | (0.0227) | (0.0261) | (0.0518) | |
| Firm age | 0.0029*** | 0.0033*** | 0.0012* | |
| (0.0008) | (0.0008) | (0.0007) | ||
| Firm size | 0.0465*** | 0.0511*** | 0.0369*** | |
| (0.0025) | (0.0029) | (0.0038) | ||
| R&D intensity | -0.2572*** | -0.245*** | -0.468*** | |
| (0.0757) | (0.0744) | (0.1014) | ||
| Cash holding | -0.3447*** | -0.3549*** | -0.2535*** | |
| (0.0291) | (0.0303) | (0.0526) | ||
| Capital intensity | 0.0326 | 0.0354 | 0.008 | |
| (0.0247) | (0.0231) | (0.0835) | ||
| growth Opportunity | 0.0094*** | 0.0072*** | 0.0273*** | |
| (0.0024) | (0.0025) | (0.005) | ||
| Real GDP | 0.0174*** | 0.0164*** | 0.0234*** | |
| (0.0015) | (0.0016) | (0.0021) | ||
| Interest rate | 0.0527*** | 0.0548*** | 0.0451*** | |
| (0.004) | (0.0044) | (0.0062) | ||
| Inflation | -0.0452*** | -0.048*** | -0.0337*** | |
| (0.0028) | (0.003) | (0.0041) | ||
| Global Financial Crisis | -0.0345*** | -0.0517*** | 0.0463*** | |
| (0.0049) | (0.0055) | (0.0081) | ||
| Constant | 0.1608*** | -0.1587*** | -0.1785*** | -0.1594*** |
| (0.0039) | (0.0267) | (0.0288) | (0.0444) | |
| Observations | 4284 | 4284 | 3595 | 689 |
| R-squared | 0.0929 | 0.4983 | 0.4878 | 0.6049 |
| Year Effects | Yes | Yes | Yes | Yes |
| Firm Effects | No | No | No | No |
This table reports the results from the regression of the effect of long-term debt on profitability. The dependent variable is profitability measured as (EBITDA/TA) and is income before depreciation and amortization divided by book value of assets. The main explanatory variable is long-term with other control variables. Models (3) and (4) are for the sample of firms in USA and Europe. All other variables are defined in Appendix. The sample period is from 199 to 2020. I control for year fixed effects and firm fixed effects. Standard errors are clustered by firm, and standard errors are reported in parentheses. The *, **, and *** denote statistical significance at 10%, 5%, and 1% respectively.
In Table 4, there is a negative impact of total debt on ROA and is statistically significant at 1 percent. This shows a clear relationship between increased total debt and decreased profitability. This is in line with hypothesis 1 that states that debt financing (total debt) has a significant effect on profitability.
Table 4.
The effects of total debt on profitability.
| USA | Europe | |||
| (1) | (2) | (3) | (4) | |
| ROA | ROA | ROA | ROA | |
| Total debt | -0.2534*** | -0.2345*** | -0.2484*** | -0.0552 |
| (0.0306) | (0.0285) | (0.0315) | (0.0468) | |
| Firm age | 0.003*** | 0.0034*** | 0.0012* | |
| (0.0007) | (0.0008) | (0.0007) | ||
| Firm size | 0.0438*** | 0.048*** | 0.0362*** | |
| (0.0022) | (0.0026) | (0.0036) | ||
| R&D intensity | -0.2517*** | -0.2396*** | -0.4682*** | |
| (0.0736) | (0.0724) | (0.1002) | ||
| Cash holding | -0.3657*** | -0.3764*** | -0.2629*** | |
| (0.0277) | (0.0291) | (0.048) | ||
| Capital intensity | 0.0225 | 0.0229 | 0.0073 | |
| (0.0246) | (0.0237) | (0.0846) | ||
| Growth Opportunity | 0.0091*** | 0.0071*** | 0.0267*** | |
| (0.0023) | (0.0024) | (0.005) | ||
| Real GDP | 0.0162*** | 0.0149*** | 0.0233*** | |
| (0.0013) | (0.0015) | (0.0015) | ||
| Interest rate | 0.049*** | 0.0503*** | 0.0442*** | |
| (0.0036) | (0.0039) | (0.0048) | ||
| Inflation | -0.0423*** | -0.0443*** | -0.0334*** | |
| (0.0025) | (0.0028) | (0.0034) | ||
| Global Financial Crisis | -0.0334*** | -0.0500*** | 0.0465*** | |
| (0.0048) | (.0052) | (0.0075) | ||
| Constant | 0.1788*** | -0.1175*** | -0.1344*** | -0.1409*** |
| (0.0062) | (0.0264) | (0.0292) | (0.0411) | |
| Observations | 4284 | 4284 | 3595 | 689 |
| R-Squared | 0.1128 | 0.5205 | 0.5131 | 0.6065 |
| Year Effects | Yes | Yes | Yes | Yes |
| Firm Effects | No | No | No | No |
This table reports the results from the regression of the effect of long-term debt on profitability. The dependent variable is profitability measured as (EBITDA/TA) and is income before depreciation and amortization divided by book value of assets. The main explanatory variable is total debt with other control variables. Models (3) and (4) are for the sample of firms in USA and Europe. All other variables are defined in Appendix. The sample period is from 199 to 2020. I control for year fixed effects and firm fixed effects. Standard errors are clustered by firm, and standard errors are reported in parentheses. The *, **, and *** denote statistical significance at 10%, 5%, and 1% respectively.
Table 5 and 6 examine the channels through which short-term and long-term debt affect profitability. In column 1 of Table 5, the interaction suggests that although short-term debt alone might reduce profitability, combining it with 10-year lagged R&D intensity can potentially enhance profitability. This implies that there is a synergistic effect, meaning firms that have invested in R&D in the past might use short-term debt more effectively. This could be because the innovative products developed from earlier R&D efforts eventually become profitable. However, the interaction term between long-term debt and 10-year lagged R&D suggests a positive relationship on profitability but not statistically significant as shown in Table 6.
The interaction term between short-term debt and financial distress is negative and statistically significant. This means that when short-term debt and financial distress occur together, they significantly worsen profitability. Biopharmaceutical firms facing financial distress are particularly harmed by short-term debt, likely because of higher borrowing costs and less financial flexibility. In Table 6, when both long-term debt and financial distress are present, the negative impact on profitability worsens. Firms in financial distress situation may find long-term debt especially burdensome, likely due to increased difficulties in managing and servicing debt over a long period.
The coefficients for short-term debt in models (1) and (2) show a significant negative impact on profitability both before and after the Covid-19 pandemic. Before Covid-19, the effect is quite negative, meaning that higher levels of short-term debt are linked to lower profitability in biopharmaceutical firms. After Covid-19, this negative effect becomes even stronger. The pandemic likely made short-term debt more burdensome for firms due to increased financial uncertainty and operational disruptions. Similarly, the coefficients for long-term debt in models (3) and (4) indicate a clear negative impact on profitability both before and after the Covid-19 pandemic. Before Covid-19, long-term debt reduces profitability. This negative effect remains significant but becomes slightly less severe after Covid-19. The persistent negative effect of long-term debt on profitability implies that long-term debt imposes a continuous financial strain on biopharmaceutical firms, likely due to the ongoing costs associated with servicing the debt as displayed in Table 7.
Table 5.
The effect of short-term debt on profitability through 10-year lag of R&D, financial distress and total productivity.
Table 5.
The effect of short-term debt on profitability through 10-year lag of R&D, financial distress and total productivity.
| (1) | (2) | (3) | |
|---|---|---|---|
| ROA | ROA | ROA | |
| Short term debt | -0.5385*** | 0.0482 | 0.4542** |
| (0.1233) | (0.057) | (0.1873) | |
| -0.1016** | |||
| (0.0453) | |||
| Short-term debt x | 1.4842** | ||
| (0.6015) | |||
| Financial distress | -0.1819*** | ||
| (0.0141) | |||
| Short term debt x financial distress | -0.5454*** | ||
| (0.1513) | |||
| Firm age | 0.0026*** | 0.0025*** | -0.0007*** |
| (0.0007) | (0.0006) | (0.0002) | |
| Firm size | 0.0438*** | 0.0313*** | 0.0193*** |
| (0.0026) | (0.002) | (0.0012) | |
| R&D | -0.2688*** | -0.221*** | 0.0011 |
| (0.0797) | (0.0641) | (0.0283) | |
| Cash holding | -0.3824*** | -0.3398*** | -0.0796*** |
| (0.0306) | (0.0248) | (0.0165) | |
| Capital intensity | 0.0386 | 0.0116 | -0.0344** |
| (0.0251) | (0.0191) | (0.0175) | |
| Growth Opportunity | 0.0102*** | -0.0016 | 0.014*** |
| (0.0028) | (0.0021) | (0.0017) | |
| Real GDP | 0.0223*** | 0.0106*** | 0.009*** |
| (0.0014) | (0.0011) | (0.0005) | |
| Interest rate | 0.0634*** | 0.0313*** | 0.0245*** |
| (0.0039) | (0.0031) | (0.0011) | |
| Inflation | -0.052*** | -0.0261*** | -0.0148*** |
| (0.0027) | (0.0022) | (0.0009) | |
| Global Financial Crisis | -0.0297*** | 0.0076** | 0.0358*** |
| (0.0055) | (0.0031) | (0.0028) | |
| Constant | -0.141*** | -0.0322 | 0.3004*** |
| (0.0261) | (0.0215) | (.0216) | |
| Observations | 4284 | 4284 | 2555 |
| R-Squared | 0.4972 | 0.5693 | 0.4693 |
| Year Effects | Yes | Yes | Yes |
| Firm Effects | Yes | Yes | Yes |
This table reports the results from the regression of the effect of long-term debt on profitability. The dependent variable is profitability measured as (EBITDA/TA) and is income before depreciation and amortization divided by book value of assets. The main explanatory variable is short-term debt with other control variables. The moderating variables are 10-year lag of R&D and financial distress. All other variables are defined in Appendix. The sample period is from 199 to 2020. I control for year fixed effects and firm fixed effects. Standard errors are clustered by firm, and standard errors are reported in parentheses. The *, **, and *** denote statistical significance at 10%, 5%, and 1% respectively.
Table 6.
The effect of long-term debt on profitability through 10-year lag of R&D, financial distress and total productivity.
Table 6.
The effect of long-term debt on profitability through 10-year lag of R&D, financial distress and total productivity.
| (1) | (2) | (3) | |
|---|---|---|---|
| ROA | ROA | ROA | |
| Long term debt | -0.1936*** | -0.0027 | 0.0552 |
| (0.0239) | (0.050) | (0.1178) | |
| 0.0746 | |||
| (0.1017) | |||
| Long-term debt x | 0.1695 | ||
| (0.2827) | |||
| Financial distress | -0.1667*** | ||
| (0.0172) | |||
| Long term debt x financial distress | -0.1117** | ||
| (0.0561) | |||
| Firm age | 0.0029*** | 0.0026*** | -0.0008*** |
| (0.0008) | (0.0007) | (0.0003) | |
| Firm size | 0.0464*** | 0.0349*** | 0.0193*** |
| (0.0026) | (0.0022) | (0.0012) | |
| R&D | -0.2571*** | -0.2201*** | 0.002 |
| (0.0757) | (0.0636) | (0.0264) | |
| Cash holding | -0.3444*** | -0.313*** | -0.0816*** |
| (0.029) | (0.0256) | (0.0158) | |
| Capital intensity | 0.0331 | 0.0100 | -0.0355** |
| (0.0247) | (0.0203) | (0.0177) | |
| Growth Opportunity | 0.0093*** | -0.0009 | 0.0138*** |
| (0.0024) | (0.002) | (0.0018) | |
| Real GDP | 0.0172*** | 0.0105*** | 0.008*** |
| (0.0015) | (0.0012) | (0.0006) | |
| Interest rate | 0.0521*** | 0.0332*** | 0.0223*** |
| (0.004) | (0.0035) | (0.0013) | |
| Inflation | -0.0448*** | -0.0279*** | -0.013*** |
| (0.0028) | (0.0025) | (0.0011) | |
| Global Financial Crisis | -0.0339*** | 0.0028 | 0.0353*** |
| (0.005) | (0.0035) | (0.0031) | |
| Constant | -0.1593*** | -0.0657*** | 0.3091*** |
| (0.0264) | (0.0233) | (0.0342) | |
| Observations | 4284 | 4284 | 2555 |
| R-Squared | 0.4984 | 0.5521 | 0.4692 |
| Year Effects | Yes | Yes | Yes |
| Firm Effects | No | No | No |
This table reports the results from the regression of the effect of long-term debt on profitability. The dependent variable is profitability measured as (EBITDA/TA) and is income before depreciation and amortization divided by book value of assets. The main explanatory variable is long-term debt with other control variables. The moderating variables are 10-year lag of R&D and financial distress. All other variables are defined in Appendix. The sample period is from 199 to 2020. I control for year fixed effects and firm fixed effects. Standard errors are clustered by firm, and standard errors are reported in parentheses. The *, **, and *** denote statistical significance at 10%, 5%, and 1% respectively.
Table 7.
The effects of short-term and long-term debt on profitability.
| Short-term debt | Long-term Debt | ||||
| (1) | (2) | (3) | (4) | ||
| Pre-Covid-19 | Post Covid-19 | Pre-Covid-19 | Post Covid-19 | ||
| Short term debt | -0.3934*** | -0.6195*** | |||
| (0.0816) | (0.3406) | ||||
| Long term debt | -0.1937*** | -0.183*** | |||
| (0.0251) | (0.0398) | ||||
| Firm age | 0.0033*** | 0.0019 | 0.0037*** | 0.0006*** | |
| (0.0008) | (0.0013) | (0.0009) | (0.0001) | ||
| Firm size | 0.0433*** | 0.0535*** | 0.0449*** | 0.0655*** | |
| (0.0027) | (0.0016) | (0.0025) | (0.0107) | ||
| R&D intensity | -0.2577*** | -0.5425** | -0.245*** | -0.5937*** | |
| (0.0793) | (0.2109) | (0.0747) | (0.1662) | ||
| Cash holding | -0.3838*** | -0.2198*** | -0.3538*** | -0.1714*** | |
| (0.0301) | (0.0847) | (0.0293) | (0.0047) | ||
| Capital intensity | 0.0386 | 0.127*** | 0.0338 | 0.0228 | |
| (0.0265) | (0.0297) | (0.0258) | (0.0374) | ||
| Growth Opportunity | 0.0096*** | 0.0134** | 0.0087*** | 0.0119*** | |
| (0.003) | (0.0068) | (0.0025) | (0.0039) | ||
| Real GDP | -0.0051*** | -0.0256*** | -0.0058*** | -0.0283*** | |
| (0.0016) | (0.0008) | (0.0017) | (0.0098) | ||
| Interest rate | 0.0519*** | 0.0544* | 0.0458** | 0.0619* | |
| (0.0021) | (0.0032) | (0.002) | (0.0041) | ||
| Inflation | -0.0288*** | -0.0449*** | -0.0301*** | -0.0491*** | |
| (0.0016) | (0.0004) | (0.0015) | (0.0147) | ||
| Global Financial Crisis | 0.0152* | 0.0415*** | -0.0059 | 0.0346*** | |
| (0.009) | (0.0004) | (0.0096) | (0.0024) | ||
| Constant | -0.222*** | -0.0571*** | -0.212*** | -0.0467*** | |
| (0.027) | (0.0011) | (0.0316) | (0.0031) | ||
| Observations | 3827 | 457 | 3827 | 457 | |
| R-Squared | 0.4881 | 0.5882 | 0.5078 | 0.4249 | |
| Year Effects | Yes | Yes | Yes | Yes | |
| Firm Effects | No | No | No | No | |
5. Robustness Check
For robustness test, I employ the system dynamic panel data (DPD) estimator to estimate the econometric model in equation 1. The DPD integrates equations involving differences and levels. In this System GMM approach (Blundell & Bond, 1998), lagged levels act as instruments for the differenced equations, while lagged differences are employed as instruments for the level equations. I measure ROA as the net income divided by total assets, and it is the dependent variable in the data analysis. It is measured as earnings before interest, taxes, depreciation, and amortization. The main explanatory variable is debt. Debt measures the debt financing decisions such as total debt, long-term, and short-term debt and they are measured in percentages. The findings from Table 8 highlight that both short-term and long-term debt negatively affect profitability in biopharmaceutical firms. Short-term debt has a more negative effect compared to long-term debt. When considering total debt, the negative impact on profitability remains significant, emphasizing the need for careful management of debt financing to sustain profitability in the biopharmaceutical industry.
Table 8.
The effect of debt financing on alternative measure of profitability.
| (1) | (2) | (3) | |
|---|---|---|---|
| Variables | Short-term | Long-term | Total debt |
| 0.0773*** | 0.0668*** | 0.0432*** | |
| (0.0003) | (0.0003) | (0.0001) | |
| -0.1098*** | -0.1290*** | -0.1393*** | |
| (0.0003) | (0.0002) | (0.0001) | |
| Short term debt | -0.3682*** | ||
| (0.0009) | |||
| Long-term debt | -0.1683*** | ||
| (0.0001) | |||
| Total debt | -0.2388*** | ||
| (0.0001) | |||
| Firm age | 0.0127*** | 0.0170*** | 0.0151*** |
| (0.0004) | (0.0004) | (0.0004) | |
| Firm size | 0.1444*** | 0.1465*** | 0.1416*** |
| (0.0003) | (0.0002) | (0.0001) | |
| R&D intensity | -0.1821*** | -0.1753*** | -0.1758*** |
| (0.0002) | (0.0002) | (0.0002) | |
| Cash holding | 0.0740*** | 0.0910*** | 0.0653*** |
| (0.0005) | (0.0003) | (0.0002) | |
| Capital intensity | -0.0031*** | 0.0118*** | 0.0080*** |
| (0.0005) | (0.0002) | (0.0001) | |
| growth Opportunity | 0.0035*** | 0.0039*** | 0.0032*** |
| (0.0000) | (0.0000) | (0.0000) | |
| Real GDP | 0.0023*** | 0.0015*** | 0.0010*** |
| (0.0000) | (0.0000) | (0.0000) | |
| Interest rate | 0.0038*** | 0.0027*** | 0.0033*** |
| (0.0001) | (0.0001) | (0.0000) | |
| Inflation | -0.0044*** | -0.0025*** | -0.0025*** |
| (0.0000) | (0.0001) | (0.0000) | |
| Global Financial Crisis | -0.0004*** | -0.0018*** | -0.0009*** |
| (0.0001) | (0.0001) | (0.0001) | |
| Constant | -1.4391*** | -1.5679*** | -1.4413*** |
| (0.0108) | (0.0115) | (0.0113) | |
| Observations | 2,780 | 2,780 | 2,780 |
| Number of firms | 445 | 445 | 445 |
| Observation | 2780 | 2780 | 2780 |
| AR (1) | -4.497 | -4.488 | -4.484 |
| AR (2) | 1.353 | 1.036 | 0.898 |
| Sargan | 291 | 291.2 | 290.6 |
This table shows the results of two-step System GMM (SGMM) regressions of profitability from 1990 to 2020. The dependent variable is ROA, measured as the ratio of net income divided by total assets. The proxy for corporate debt is total debt. Sargan statistic is a Sargan-Hansen test of overidentifying restrictions. AR (2) is the test for the null of no residual serial correlation. Instrument: two lags of ROA and the rest of the explanatory variables are exogenous. Significant levels are indicated by *** p<0.01, ** p<0.05, * p<0.1.
6. Conclusions and Recommendations
Debt financing is important for financing major investments like R&D in the biopharmaceutical industry. Debt financing allows companies to raise funds without giving up ownership or control through indenture and covenants of the company. Debt financing provides greater flexibility for firms in biopharmaceutical industry to finance highly intensive research and development (R&D).
The choice of debt financing is an important decision for companies aiming to fund their projects. This paper poses research questions: How do short-term and long-term debt impact profitability within the biopharmaceutical industry? What are the ways through which short-term and long-term debt affect profitability? The diverse range of debt instruments, both short- and long-term, provides flexibility in financial strategies.
The results show that short-term debt, long-term debt and total debt negatively impacts return on assets (ROA) as a firm's profitability measure. A comparison is made between the US and Europe biopharmaceutical firms and the result shows the negative effects of short-term and long-term debt on profitability persist more for US biopharmaceutical firms than Europe firms. Short-term and long-term debt both impact profitability negatively with 10-year lagged R&D intensity and financial distress. Short-term debt's negative impact is stronger in post-Covid-19, indicating increased financial strain. Long-term debt consistently affects profitability negatively, with relative stable effects during the pre- and post-Covid-19.
The empirical findings from this research have some interesting implications for policymakers in the biopharmaceutical industry. Firstly, they emphasize the importance of prudent debt management strategies, particularly for US biopharmaceutical firms, where the negative impact of both short-term and long-term debt on profitability is more pronounced compared to European counterparts. This suggests a need for careful monitoring and sustainable debt practices to mitigate financial strain, especially post-Covid-19.
Appendix
Table 9.
A: 45 firms reporting zero R&D.
| Company legal name | Company legal name |
|---|---|
| NBTY Inc | MedMen Enterprises Inc |
| Nabi Biopharmaceuticals-Old | Green Thumb Industries Inc |
| Sigma-Aldrich Corp | Trulieve Cannabis Corp |
| HST Global Inc | Curaleaf Holdings Inc |
| Unigene Laboratories Inc | Cresco Labs Inc |
| Natural Alternatives International Inc | cbdMD Inc |
| Acelity Holdings Inc | The Cannabist Company Holdings Inc |
| Avid Bioservices Inc | Ayr Wellness Inc |
| NewAge Inc | 4Front Ventures Corp |
| MariMed Inc | Upexi Inc |
| PDK Labs Inc | Glass House Brands Inc |
| Bradley Pharmaceuticals Inc. | Smart for Life Inc |
| Dura Pharmaceuticals Inc | Xstelos Holdings Inc |
| Pml Inc | BMP Sunstone Corp |
| Catalytica Inc | Transgene SA |
| NSA International Inc | Nextera Enterprises Inc |
| Rexall Sundown Inc | AXM Pharma Inc -Old |
| NovelStem International Corp | Life Sciences Research Inc |
| IVC Industries Inc | IGC Pharma Inc |
| Derma Sciences Inc | Marizyme Inc |
| Nanobac Pharmaceutical | Youngevity International Inc |
| Bactolac Pharmaceutical Inc | Item 9 Labs Corp |
| Goodness Growth Holdings Inc |
Table 9.
B: Definition of variables, Expected signs, and Data sources.
| Variable | Description and Definition | Expected sign | Data Source | |
|---|---|---|---|---|
| Dependent Variables: | ||||
| Profitability indicators | ||||
| Return on Asset (ROA_1) | Measures how well a company can handle its assets to generate profit over time. Calculated as earnings before interest, taxes, depreciation, and amortization, (ebitda) divided by total assets(at). | COMPUSTAT | ||
| Return on Asset (ROA_2) | Calculated by net income (ni) divided by total assets(at) | COMPUSTAT | ||
| Main explanatory variables | ||||
| Debt: | ||||
| Short term debt | short-term debt is a form of debt that matures in less than a year. short term liabilities (debt)/total assets | +/- | COMPUSTAT | |
| Long-term debt | Long-term debt is a form of debt that matures in more than a year. long term liabilities (debt)/ total assets | +/- | COMPUSTAT | |
| Total debt | It is the combination of short-term and long-term debt. Total debt/total assets | +/- | COMPUSTAT | |
| Other Controls | ||||
| Firm size (size) | natural logarithm of the company's total assets | +/- | COMPUSTAT | |
| Capital Intensity | Capital expenditure/total assets | +/- | COMPUSTAT | |
| Growth opportunity | market to book ratio: market value of common equity/book value of common equity The market value was scaled by thousands. i.e. (prcc_f* csho*1000)/1000000 The book value is calculated by subtracting total liabilities from total assets. |
+/- | COMPUSTAT | |
| Research and Development Intensity | Research and development expense divided by total assets | +/- | COMPUSTAT | |
| Firm age | The difference between the year under investigation and the year in which the firm is included in COMPUSTAT. | +/- | COMPUSTAT | |
| Altman Z-score/ Financial distress |
The Z-score is a financial indicator that uses various inputs from company income statements and balance sheets to measure a company's financial status. It is calculated as 1.2 (working capital / total assets) + 1.4 (retained earnings / total assets) + 3.3 (earnings before interest and tax / total assets) + 0.6 (market value of equity / total liabilities) + 1.0(sales / total assets). I use the above and below the grey zone of the Altman z-score to create a dummy. 1=No financial non-distress if the Altman z-score is less than 1.8 0= financial non distress if the Altman z-score is above 1.8 |
+/- | COMPUSTAT | |
| Inflation rate (Infl) | Proxy use is a Consumer price index. It is the consumer price index for all urban consumers (entire items U.S. City). It is percent change, seasonally adjusted annually | +/- | FRED St. Louis | |
| Real Gross Domestic Product (RGDP) | Real Gross domestic product per capita as a measure. It is measured as chained 2012 Dollars and seasonally adjusted annual rate. I scale it by taking the log of it | +/- | FRED St. Louis | |
| Interest Rate | Federal funds rate is the overnight interest rate for depository institutions trading federal funds held at Federal Reserve Banks | Federal Reserve Bank of St. Louis (FRED) | ||
References
- Abor, J. (2005). The effect of capital structure on profitability: an empirical analysis of listed firms in Ghana. The Journal of risk finance. [CrossRef]
- Al-Dhamari, R., & Ismail, K. N. I. K. (2015). Cash holdings, political connections, and earnings quality: Some evidence from Malaysia. International Journal of Managerial Finance.
- Alti, A. (2003). How sensitive is an investment to cash flow when financing is frictionless? The Journal of finance, 58(2), 707-722.
- Arellano, M., and S. Bond. 1991. Some tests of specification for panel data: Monte Carlo evidence and an application to employment equations. Review of Economic Studies 58: 277–297. [CrossRef]
- Arellano, M., and O. Bover. 1995. Another look at the instrumental variable estimation of error components models. Journal of Econometrics 68: 29–51. [CrossRef]
- Babich, Makki & Bradley (2019). Creating Value Through Intelligent Borrowing.
- Baker, M., & Wurgler, J. (2002). Market timing and capital structure. The Journal of finance, 57(1), 1-32. [CrossRef]
- Baker & McKenzie International report (2020). Unlocking opportunity Baker & McKenzie paves the way to success in pharmerging markets.
- Baum, C. F., Schafer, D., & Talavera, O. (2006). The effects of short-term liabilities on profitability: a comparison of German and US firms (Vol. 636, pp. 1-24). Boston College Working Papers in Economics.
- Beiner, S., Schmid, M. M., & Wanzenried, G. (2011). Product market competition, managerial incentives and firm valuation. European Financial Management, 17(2), 331-366. [CrossRef]
- Bhutta, N. T., & Hasan, A. (2013). Impact of firm-specific factors on profitability of firms in food sector. [CrossRef]
- Blundell, R., & Bond, S. (2000). GMM estimation with persistent panel data: an application to production functions. Econometric reviews, 19(3), 321-340. [CrossRef]
- Boldeanu, D. M., & Pugna, I. B. (2014). The analysis of the influence factors affecting the performance of pharmaceutical companies. Theoretical & Applied Economics, 21(7).
- Bolton, P., & Scharfstein, D. S. (1990). A theory of predation based on agency problems in financial contracting. The American economic review, 93-106.
- Bradley, M., Jarrell, G. A., & Kim, E. H. (1984). On the existence of an optimal capital structure: Theory and evidence. The Journal of finance, 39(3), 857-878.
- Brander, J. A., & Lewis, T. R. (1986). Oligopoly and financial structure: The limited liability effect. The American Economic Review, 956-970.
- Campello, M., Graham, J. R., & Harvey, C. R. (2010). The real effects of financial constraints: Evidence from a financial crisis. Journal of financial Economics, 97(3), 470-487. [CrossRef]
- Campello, M. (2003). Capital structure and product markets interactions: evidence from business cycles. Journal of financial economics, 68(3), 353-378. [CrossRef]
- Campbell, J. Y., Hilscher, J., & Szilagyi, J. (2008). In search of distress risk. The Journal of Finance, 63(6), 2899-2939. [CrossRef]
- Chandra, T., Junaedi, A. T., Wijaya, E., Suharti, S., Mimelientesa, I., & Ng, M. (2019). The effect of capital structure on profitability and stock returns: Empirical analysis of firms listed in Kompas 100. Journal of Chinese Economic and Foreign Trade Studies.
- Chander, S., & Aggarwal, P. (2008). Determinants of corporate profitability: an empirical study of Indian drugs and pharmaceutical industry. Paradigm, 12(2), 51-61. [CrossRef]
- Chen, S., Ganum, M. P., Liu, L. Q., Martinez, M. L., & Peria, M. M. S. M. (2019). Debt Maturity and the Use of Short-Term Debt: Evidence from Sovereigns and Firms. International Monetary Fund.
- Chevalier, J. A., & Scharfstein, D. S. (1995). Liquidity constraints and the cyclical behavior of markups. The American Economic Review, 85(2), 390-396.
- Choe, H., Masulis, R. W., & Nanda, V. (1993). Common stock offerings across the business cycle: Theory and evidence. Journal of Empirical finance, 1(1), 3-31.
- Chong, H. Y., & Chan, T. H. (2014). Market Structure and Competition: Assessment of Malaysian pharmaceutical Industry based on the Modified Structure-Conduct-Performance Paradigm.
- Compustat Daily Updates - Fundamentals Annual. (2021, August 1). [financial variables for pharmaceutical firms (SIC code 2834) 1999 - 2020]. Retrieved from https://wrds-web.wharton.upenn.edu/wrds/.
- Ding, N., Bhat, K., & Jebran, K. (2020). Debt choice, growth opportunities, and corporate investment: evidence from China. Financial Innovation, 6(1), 1-22.
- Fama, E. F., & French, K. R. (2012). Capital structure choices. Critical Finance Review, 1(1), 59-101.
- Fosu, S. (2013). Capital structure, product market competition and firm performance: Evidence from South Africa. The quarterly review of economics and finance, 53(2), 140-151. [CrossRef]
- Frank, M. Z., & Goyal, V. K. (2008). Trade-off and pecking order theories of debt. Handbook of empirical corporate finance, 135-202.
- Fudenberg, D., & Tirole, J. (1986). A" signal-jamming" theory of predation. The RAND Journal of Economics, 366-376. [CrossRef]
- Graham, J. R., Leary, M. T., & Roberts, M. R. (2015). A century of capital structure: The leveraging of corporate America. Journal of financial economics, 118(3), 658-683. [CrossRef]
- Gill, A., Biger, N., & Mathur, N. (2011). The effect of capital structure on profitability: Evidence from the United States. International Journal of Management, 28(4), 3.
- Grabowski, H. G., & Vernon, J. M. (1992). Brand loyalty, entry, and price competition in biopharmaceutical s after the 1984 Drug Act. The Journal of law and economics, 35(2), 331-350.
- Grullon, G., Larkin, Y., & Michaely, R. (2018). Are US industries becoming more concentrated? Forthcoming. Review of Finance.
- Gugler, K. (2004). Marginal q, Tobin's q, Cash Flow and Investment. Southern Economic Journal 70(3), 215–531.
- Habib, H., Khan, F., & Wazir, M. (2016). Impact of debt on profitability of firms: Evidence from non-financial sector of Pakistan. City University Research Journal, 6(01).
- Jawade, A. (2014). Capital structure and its impact on profitability: An empirical study for pharmaceutical companies with special reference to their market capitalization. Abhinav National Monthly Refereed Journal of Research in Commerce and Management, 3(6), 20-28.
- Jensen, M. C., & Meckling, W. H. (1976). Theory of the firm: Managerial behavior, agency costs, and ownership structure. Journal of financial economics, 3(4), 305-360. [CrossRef]
- Kebewar, M. (2013). Does debt affect profitability? An empirical study of French trade sector. An Empirical Study of French Trade Sector (January 23, 2013).
- Kraus, A. & Robert H. Litzenberger, R. H. (1973). A State Preference Model of Optimal Financial Leverage. Journal of Finance 38: 4, 911–922.
- Lim, H., & Rokhim, R. (2020). Factors affecting the profitability of pharmaceutical company: Indonesian evidence. Journal of Economic Studies. [CrossRef]
- Lemmon, M. L., & Zender, J. F. (2010). Debt capacity and tests of capital structure theories. Journal of Financial and Quantitative Analysis, 45(5), 1161-1187. [CrossRef]
- Leary, M. T., & Roberts, M. R. (2005). Do firms rebalance their capital structures? The Journal of finance, 60(6), 2575-2619.
- Lo, A. W., & Naraharisetti, S. (2013). New financing methods in the biopharma industry: A case study of Royalty Pharma, Inc. Inc.(December 15, 2013).
- Loderer, C. F., & Waelchli, U. (2010). Firm age and performance. Available at SSRN 1342248.
- Margaritis, D., & Psillaki, M. (2010). Capital structure, equity ownership and firm performance. Journal of banking & finance, 34(3), 621-632. [CrossRef]
- Mathur, N., Tiwari, S. C., Ramaiah, T. S., & Mathur, H. (2021). Capital structure, competitive intensity and firm performance: an analysis of Indian pharmaceutical companies. Managerial Finance. [CrossRef]
- Modigliani, F., & Miller, M. H. (1963). Corporate income taxes and the cost of capital: a correction. The American economic review, 53(3), 433-443.
- Mohammadzadeh, M., Rahimi, F., Rahimi, F., Aarabi, S. M., & Salamzadeh, J. (2013). The effect of capital structure on the profitability of pharmaceutical companies in the case of Iran. Iranian Journal of pharmaceutical research: IJPR, 12(3), 573.
- Mohd-Ashhari, Z., & Faizal, D. R. (2018). Determinants and performance of cash holding evidence from small business in Malaysia. International Journal of Economics, Management and Accounting, 26(2), 457-473.
- Morellec, E., Nikolov, B., & Schürhoff, N. (2018). Agency conflicts around the world. The Review of Financial Studies, 31(11), 4232-4287. [CrossRef]
- Muradoğlu, Y. G., & Sivaprasad, S. (2012). Capital structure and abnormal returns. International Business Review, 21(3), 328-341. [CrossRef]
- Myers, S. C., & Majluf, N. S. (1984). Corporate financing and investment decisions when firms have information that investors do not have. Journal of financial economics, 13(2), 187-221. [CrossRef]
- Myers, S. C. (2001). Capital structure. Journal of Economic Perspectives, 15(2), 81-102.
- Myers, S. C., & Rajan, R. G. (1998). The paradox of liquidity. The Quarterly Journal of Economics, 113(3), 733-771.
- Panigrahi, C. M. A. (2019). Validity of Altman's 'z' score model in predicting financial distress of pharmaceutical companies. NMIMS journal of economics and public policy, 4(1).
- Pervan, M., Pervan, I., & Ćurak, M. (2019). Determinants of firm profitability in the Croatian manufacturing industry: evidence from dynamic panel analysis. Economic research-Ekonomska istraživanja, 32(1), 968-981. [CrossRef]
- PHAM, C. D. (2020). The effect of capital structure on financial performance of Vietnamese listing pharmaceutical enterprises. The Journal of Asian Finance, Economics, and Business, 7(9), 329-340. [CrossRef]
- Ranajee, R., & Pathak, R. (2019). Corporate cash holding during crisis and beyond: what matters the most. International Journal of Managerial Finance. [CrossRef]
- Rasiah, D., & Kim, P. K. (2011). A theoretical review on the use of the static trade-off theory, the pecking order theory, and the agency cost theory of capital structure.
- Roodman, D. (2009). How to do xtabond2: An introduction to difference and system GMM in Stata. The stata journal, 9(1), 86-136. [CrossRef]
- Rossi, M. (2016). The impact of age on firm performance: a literature review. Corporate Ownership & Control, 13(2), 217-223. [CrossRef]
- Sadiq, M. N., & Sher, F. (2016). Impact of capital structure on the profitability of firms evidence from automobile sector of Pakistan. Global Journal of Management and Business Research.
- Selarka, E. (2014). Corporate governance, product market competition and firm performance: evidence from India. In Corporate governance in emerging markets (pp. 55-77). Springer, Berlin, Heidelberg.
- Singh, N. P., & Bagga, M. (2019). The effect of capital structure on profitability: An empirical panel data study. Jindal Journal of Business Research, 8(1), 65-77. [CrossRef]
- Scott, J. H. (1977). Bankruptcy, secured debt, and optimal capital structure. The Journal of finance, 32(1), 1-19.
- Sheluntcova, M. (2014). Capital Structure of Private pharmaceutical Companies in Russia. International Journal of Economics & Management, 8(2).
- Stiglitz, J. E. (1972). Some aspects of the pure theory of corporate finance: bankruptcies and take-overs. The Bell Journal of economics and management Science, 458-482. [CrossRef]
- Stulz, R. (1990). Managerial discretion and optimal financing policies. Journal of financial Economics, 26(1), 3-27. [CrossRef]
- Tailab, M. (2014). The effect of capital structure on profitability of energy American firms. International Journal of Business and Management Invention, 3(12).
- Thakor, R. T., & Lo, A. W. (2015). Competition and R&D financing decisions: Theory and evidence from the biopharmaceutical industry (No. w20903). National Bureau of Economic Research.
- Titman, S. (1984). The effect of capital structure on a firm's liquidation decision. Journal of financial economics, 13(1), 137-151. [CrossRef]
- Tyagi, S., & Nauriyal, D. K. (2016). Profitability determinants in Indian drugs and the pharmaceutical industry: An analysis of pre and post TRIPS period. Eurasian Journal of Business and Economics, 9(17), 1-21. [CrossRef]
- Wang, F. S., & Wu, N. H. (2014, August). Empirical research on the influence of capital structure on profitability based on data from the pharmaceutical industry. In 2014 International Conference on Management Science & Engineering 21st Annual Conference Proceedings (pp. 1393-1399). IEEE.
- Weill, L., Blazy, R. & Umbhauer, G. (2008). How Bankruptcy Punishment Influences the Ex-Ante Design of Debt Contracts? equilibrium, 2, 2.
- Welch, I. (2004). Capital structure and stock returns. Journal of political economy, 112(1), 106-131. [CrossRef]
- Wintoki, M. B., Linck, J. S., & Netter, J. M. (2012). Endogeneity and the dynamics of internal corporate governance. Journal of financial economics, 105(3), 581-606. [CrossRef]
- Wooldridge, J. M. (2012). Introductory econometrics: a modern approach (upper-level economics titles). Southwestern College Publishing, Nashville, ΤАTN, 41, 673-690.
- Yang, C. L., Chiang, M. H., & Chen, C. W. (2019). Financial leverage and competitive strategy of cross-listing firms. Australian Journal of Management, 44(2), 306-324. [CrossRef]
| 1 | Some of the assumptions of MM model are there are no taxes of any kind. Also, transaction costs for securities are nonexistent, and bankruptcy costs do not apply. Information is perfectly symmetrical, allowing investors equal insights to those of corporations, leading to rational investment behaviors. Borrowing costs are identical for both investors and corporations, and there are no additional expenses associated with issuing securities, such as underwriting fees, payments to bankers, advertising costs, or taxes on corporate dividends. |
| 2 | Static and dynamic trade-off theory are two types of trade-off theory. Using debt against equity offers both advantages and downsides, according to the static trade-off hypothesis. As a result, businesses should choose an optimal debt that balances these factors at the margin (Scott 1977). the dynamic trade-off hypothesis shows that, even in a trade-off environment with a fixed cost of issuing stock, firms can deviate from their goal capital structure by altering leverage. when it exceeds extreme boundaries because when a company makes money, it frequently pays down debt, lowering influence (Fischer, Heinkel, and Zechner, 1989) |
Disclaimer/Publisher’s Note: The statements, opinions and data contained in all publications are solely those of the individual author(s) and contributor(s) and not of MDPI and/or the editor(s). MDPI and/or the editor(s) disclaim responsibility for any injury to people or property resulting from any ideas, methods, instructions or products referred to in the content. |
© 2025 by the authors. Licensee MDPI, Basel, Switzerland. This article is an open access article distributed under the terms and conditions of the Creative Commons Attribution (CC BY) license (http://creativecommons.org/licenses/by/4.0/).
Copyright: This open access article is published under a Creative Commons CC BY 4.0 license, which permit the free download, distribution, and reuse, provided that the author and preprint are cited in any reuse.


