
Submitted:
24 March 2025
Posted:
24 March 2025
You are already at the latest version
Abstract
Willingness to pay (WTP) measurements often contain a hypothetical bias (HB) when participants’ responses result from ‘fictitious’ survey scenarios rather than actual purchasing behavior or field studies. This discrepancy usually leads to inaccurate WTP values, which affect pricing strategies. Our quantitative online survey with German consumers (N = 215) examines the HB of WTP for different mobile phone plans as an example of a widespread consumer good. The aim is to focus on the correlation between hypothetical and actual WTP and the influence of socio-demographic factors on the HB. We used the Certainty Approach to correct hypothetical WTP data to reflect a realistic payment behavior. The findings show that hypothetical WTP values are generally higher than current expenditure, which proves that HB significantly affects WTP measurements in the context of mobile communications products. The applied Certainty Approach successfully reduced this discrepancy. We found a moderate negative correlation between actual WTP and the extent of the HB, indicating that higher actual WTP is associated with lower bias. Moreover, socio-demographic factors such as age and income do not significantly influence the HB. This study suggests pricing strategies should consider HB-adjusted WTP values to avoid management decisions based on inflated hypothetical data.
Keywords:
willingness to pay
; hypothetical bias
; Certainty Approach
; pricing strategies
; mobile communications products
; quantitative online survey
; Germany
1. Introduction
Pricing and willingness to pay (WTP) function as overarching economic topics that are highly relevant across different industry, product, and service contexts. Studies dealing with the measurement of WTP often face the problem that the stated WTP data collected in hypothetical survey situations deviate from the actual payment behavior of consumers in real-world scenarios [1,2,3]. Researchers define this phenomenon as hypothetical bias (HB), which occurs when respondents answer differently than they behave [4]. In the context of WTP research, HB appears when hypothetical WTP values determined in ‘fictitious’ survey scenarios (e.g., surveys) deviate from actual WTP [1,5,6]. On the one hand, this behavior can be subconscious since estimating one’s own potential WTP for a specific product or service can be a cognitively challenging task [3,7]. On the other hand, this behavior can be strategically motivated, e.g., for prestige or so-called social desirability [2,4,8,9,10,11,12]. The case of conscious manipulation is described as strategic bias [13]. Consumers often tend to (subconsciously) overestimate their WTP [4,14,15].
Researchers have developed various methods to identify, quantify, and reduce HB. These include ex-ante and ex-post approaches [1,4,16] depending on whether the technique prevents HB or adjusts responses after data collection (more details in Section 2). The risk of HB is that it can result in misleading data and incorrect pricing strategies or market decisions. This paper mainly contributes to consumer research, where pricing decisions are crucial. The results are relevant to practical applications of businesses and economists as the research addresses a critical issue in pricing strategies by focusing on the impact of HB on WTP measurements.
We examine the extent of HB in a quantitative online survey measuring the WTP of German consumers for mobile phone plans and the influence of socio-demographic factors on HB. We use the practical example of mobile phone plans as a widespread everyday (partly digital) consumer good. The mobile industry is still a moving, innovative, and highly competitive market [17,18]. Mobile plans represent a specific consumer product with which the study participants are familiar but where consumer decision-making is difficult due to complex pricing structures (e.g., pre- vs. postpaid plans, one-time payments for devices or provision costs, etc.). Moreover, mobile plans are an example of a continuous service, which usually includes a contract [17]. Telecommunications products are quite similar across providers, making it difficult to differentiate their portfolios, resulting in fierce price competition [17]. The German mobile communications market, consisting of several large network operators and providers, is mainly characterized by a high level of market saturation and, consequently, predatory competition [19].
This paper aims to answer the following research questions (RQs) that all refer to mobile communications products in the German market: (RQ 1) Is there an HB in the measurement of WTP? (RQ 2) Does HB correlate with actual WTP? (RQ 3) Do socio-demographic factors influence the HB?
2. Research Background
WTP describes the maximum price consumers are willing to pay for a defined product or service [20,21]. Researchers apply a wide range of methods to determine WTP, which can be categorized into revealed (e.g., market data) and stated preferences (e.g., surveys), whereby the latter can be further divided into direct (e.g., Van Westendorp Method = Price Sensitivity Meter) and indirect (e.g., discrete-choice analysis) as well as into hypothetical and incentive aligned methods [20]. Figure 1 shows an overview of frequently used methods to measure WTP, whereby direct price inquiries (68 percent) and market data analyses (59 percent) are by far the most common [21].
There is an intense debate among researchers about which method provides low HB e.g., [10,22,23,24]. For example, some conclude that the bias in direct methods is higher [23], and others show a higher HB in indirect methods [21]. On top of that, researchers intensively discuss strategies to reduce HB, which can be divided into ex-ante and ex-post approaches depending on whether the technique prevents HB in advance or adjusts responses after data collection [13]. Widespread examples are the so-called Cheap Talk Script (= ex-ante) and the Certainty Approach (= ex-post). (Alternative ex-ante and ex-post methods can be found in [4,16] but are not discussed further in this study.) Cheap Talk Scripts aim to sensitize participants to the phenomenon of the HB before the survey, including a request to honestly state their WTP values, as in an actual payment decision scenario [5,15,25,26,27,28,29,30,31,32,33,34]. The Certainty Approach can adjust WTP data by assessing the certainty of consumers’ answers. Thus, the participants rate the confidence of their stated WTP on a scale of 1 to 10. Subsequently, only responses with a certainty of ≥8 are considered adjusted WTP values [5,28,29,34,35]. Furthermore, previous studies have examined different kind of factors that influence HB. For example, the product category or novelty can affect the strength of HB [6,36]. Thus, we decided to focus on a familiar consumer good.
3. Methodology
The research design consists of two steps: First, we analyzed current product portfolios by collecting 65 mobile postpaid plans of 13 mobile communications providers in the German market (as of June 2023). We included mobile network operators (MNOs = operating their own infrastructure), mobile virtual network operators (MVNOs = service providers without significant infrastructure), and sub-brands. The portfolios usually range from XS to XL products (= five product categories) to address different target groups, respectively, customer segments, varying in terms of data volume (in gigabyte = GB), price (in Euro/month), price per GB and mobile technology (4G/LTE vs. 5G). We labeled XS to XL products as A to E to keep objectivity within the questionnaire.
In the second step, we conducted a quantitative online survey with mobile customers in Germany (N = 215) in June 2023 to measure hypothetical WTP and current expenditure. We recruited the study participants through the university network (= convenient sample) and implemented the Certainty Approach (ex-post method) to adjust hypothetical WTP values by reducing HB. This enhances the accuracy of the results, providing a more realistic reflection of consumer behavior. Thus, the questionnaire contained questions on participants’ hypothetical WTP and current expenditure (based on actual current expenditure) on mobile phone plans, as well as a Certainty Approach to assess the confidence in the respondents’ answers. According to the stated average current expenditure per month for mobile phone usage (based on five proposed price ranges resulting from the portfolio analysis in step 1), we initially categorized the study participants into five different product/customer groups (see above XS to XL, respectively, A to E). Then, through corresponding questionnaire branches, we presented a plan appropriate to the current expenditure of the individual study participant and asked about the maximum amount the participant would be willing to pay for the proposed product. Accordingly, we applied a direct price inquiry based on predefined price ranges derived from current market offers. Therefore, we created five different mobile plans based on existing market offerings in advance to cover the range of products currently available on the German market. This product proposal consisted of information about the mobile technology (4G/LTE vs. 5G), the amount of included data volume (ranging from 5GB up to unlimited), and monthly price (ranging from ≤ 6.99 Euro to ≥ 45.00 Euro and more). To reduce the complexity of product variations and ensure that the mobile plans are comparable, we offered all presented products without device subsidy (e.g., smartphone), with a standardized contract duration of 24 months and including a phone and SMS flat. Subsequently, the Certainty Approach was implemented to measure how sure the respondent would pay the stated amount in an actual purchase scenario (ranging from a scale of 1 = very unsure to 10 = very sure). In the following, the respondents had to state in concrete numbers what they currently pay for their monthly mobile usage. At the end of the questionnaire, we collected socio-demographic data such as gender, age, or personal monthly net income in Euro. By this, we searched for possible influences of socio-demographic factors on HB to get an understanding of how diverse customer groups may be affected. The data analysis process includes descriptive statistics, correlation, and regression analyses using the SPSS Statistics software.
4. Results
Regarding socio-demographic factors, the final convenient sample comprises 66 percent female participants. About 38 percent of the sample is between 15 and 25 years old. Thus, female and young participants are overrepresented.
The study shows that the hypothetical WTP values are, on average, 18 percent higher than the real willingness to pay (= according to actual current expenditure) across different customer groups. This proves the existence of an HB as consumers overestimate their WTP, which is consistent with previous studies (see section 1). Deviations in lower-cost plans were the greatest: We measured +31 percent for product A and +34 percent for product B, while higher actual WTP tends to lead to lower HB (deviation of -11 percent for product D and -28 percent for product E). This indicates that hypothetical WTP values of customers in the discount segment A/B, respectively XS/S, need more adjustment. In parallel, higher actual WTP values are associated with lower HB. In other words, the more consumers are willing to pay, the more accurate their stated WTP values are, respectively, the more realistic their self-assessment of WTP. This is proven by a moderate negative correlation by Pearson (r = -0.417; p<0.001) between actual WTP and the degree of HB (which is consistent with [15]). Figure 2 shows the correlation between the average deviation in percent (between hypothetical and ‘real’ WTP data) and the average ‘real’ WTP in Euro (based on current expenditure) per product/customer segment. We found that socio-demographic factors (gender, age, income) do not significantly influence HB.
In the next step, we conducted a linear regression analysis to examine further whether the deviation (in percent) between the ‘real’ and the hypothetical willingness to pay is related to the level of real willingness to pay (based on current expenditure). The deviation in percent is defined as the dependent and the amount of the real willingness to pay as the independent variable. The corresponding dot chart (Figure 3) shows a considerable scattering of data points at low levels of current expenditure (<20.00 Euro), which might reflect greater variability or uncertainty in customer responses for smaller expenditure levels. Regarding high willingness to pay values (>60.00 Euro), the deviations are relatively small, often close to 0 percent. The regression line has a slight negative slope (−0.01), indicating that the deviation decreases slightly as the ‘real’ willingness to pay (= current expenditure) increases. The R2 value of 0.174 indicates that only about 17.4 percent of the deviation can be explained by the level of real willingness to pay (based on current expenditure). Despite the weak overall relationship (R2 = 0.174), the regression coefficient (−0.01) is statistically significant (p<0.001), indicating a consistent but marginal effect of real willingness to pay on the deviation. In terms of model fit, this is considered weak, meaning that while a linear relationship exists, the regression model does not capture much of the variance in deviation.
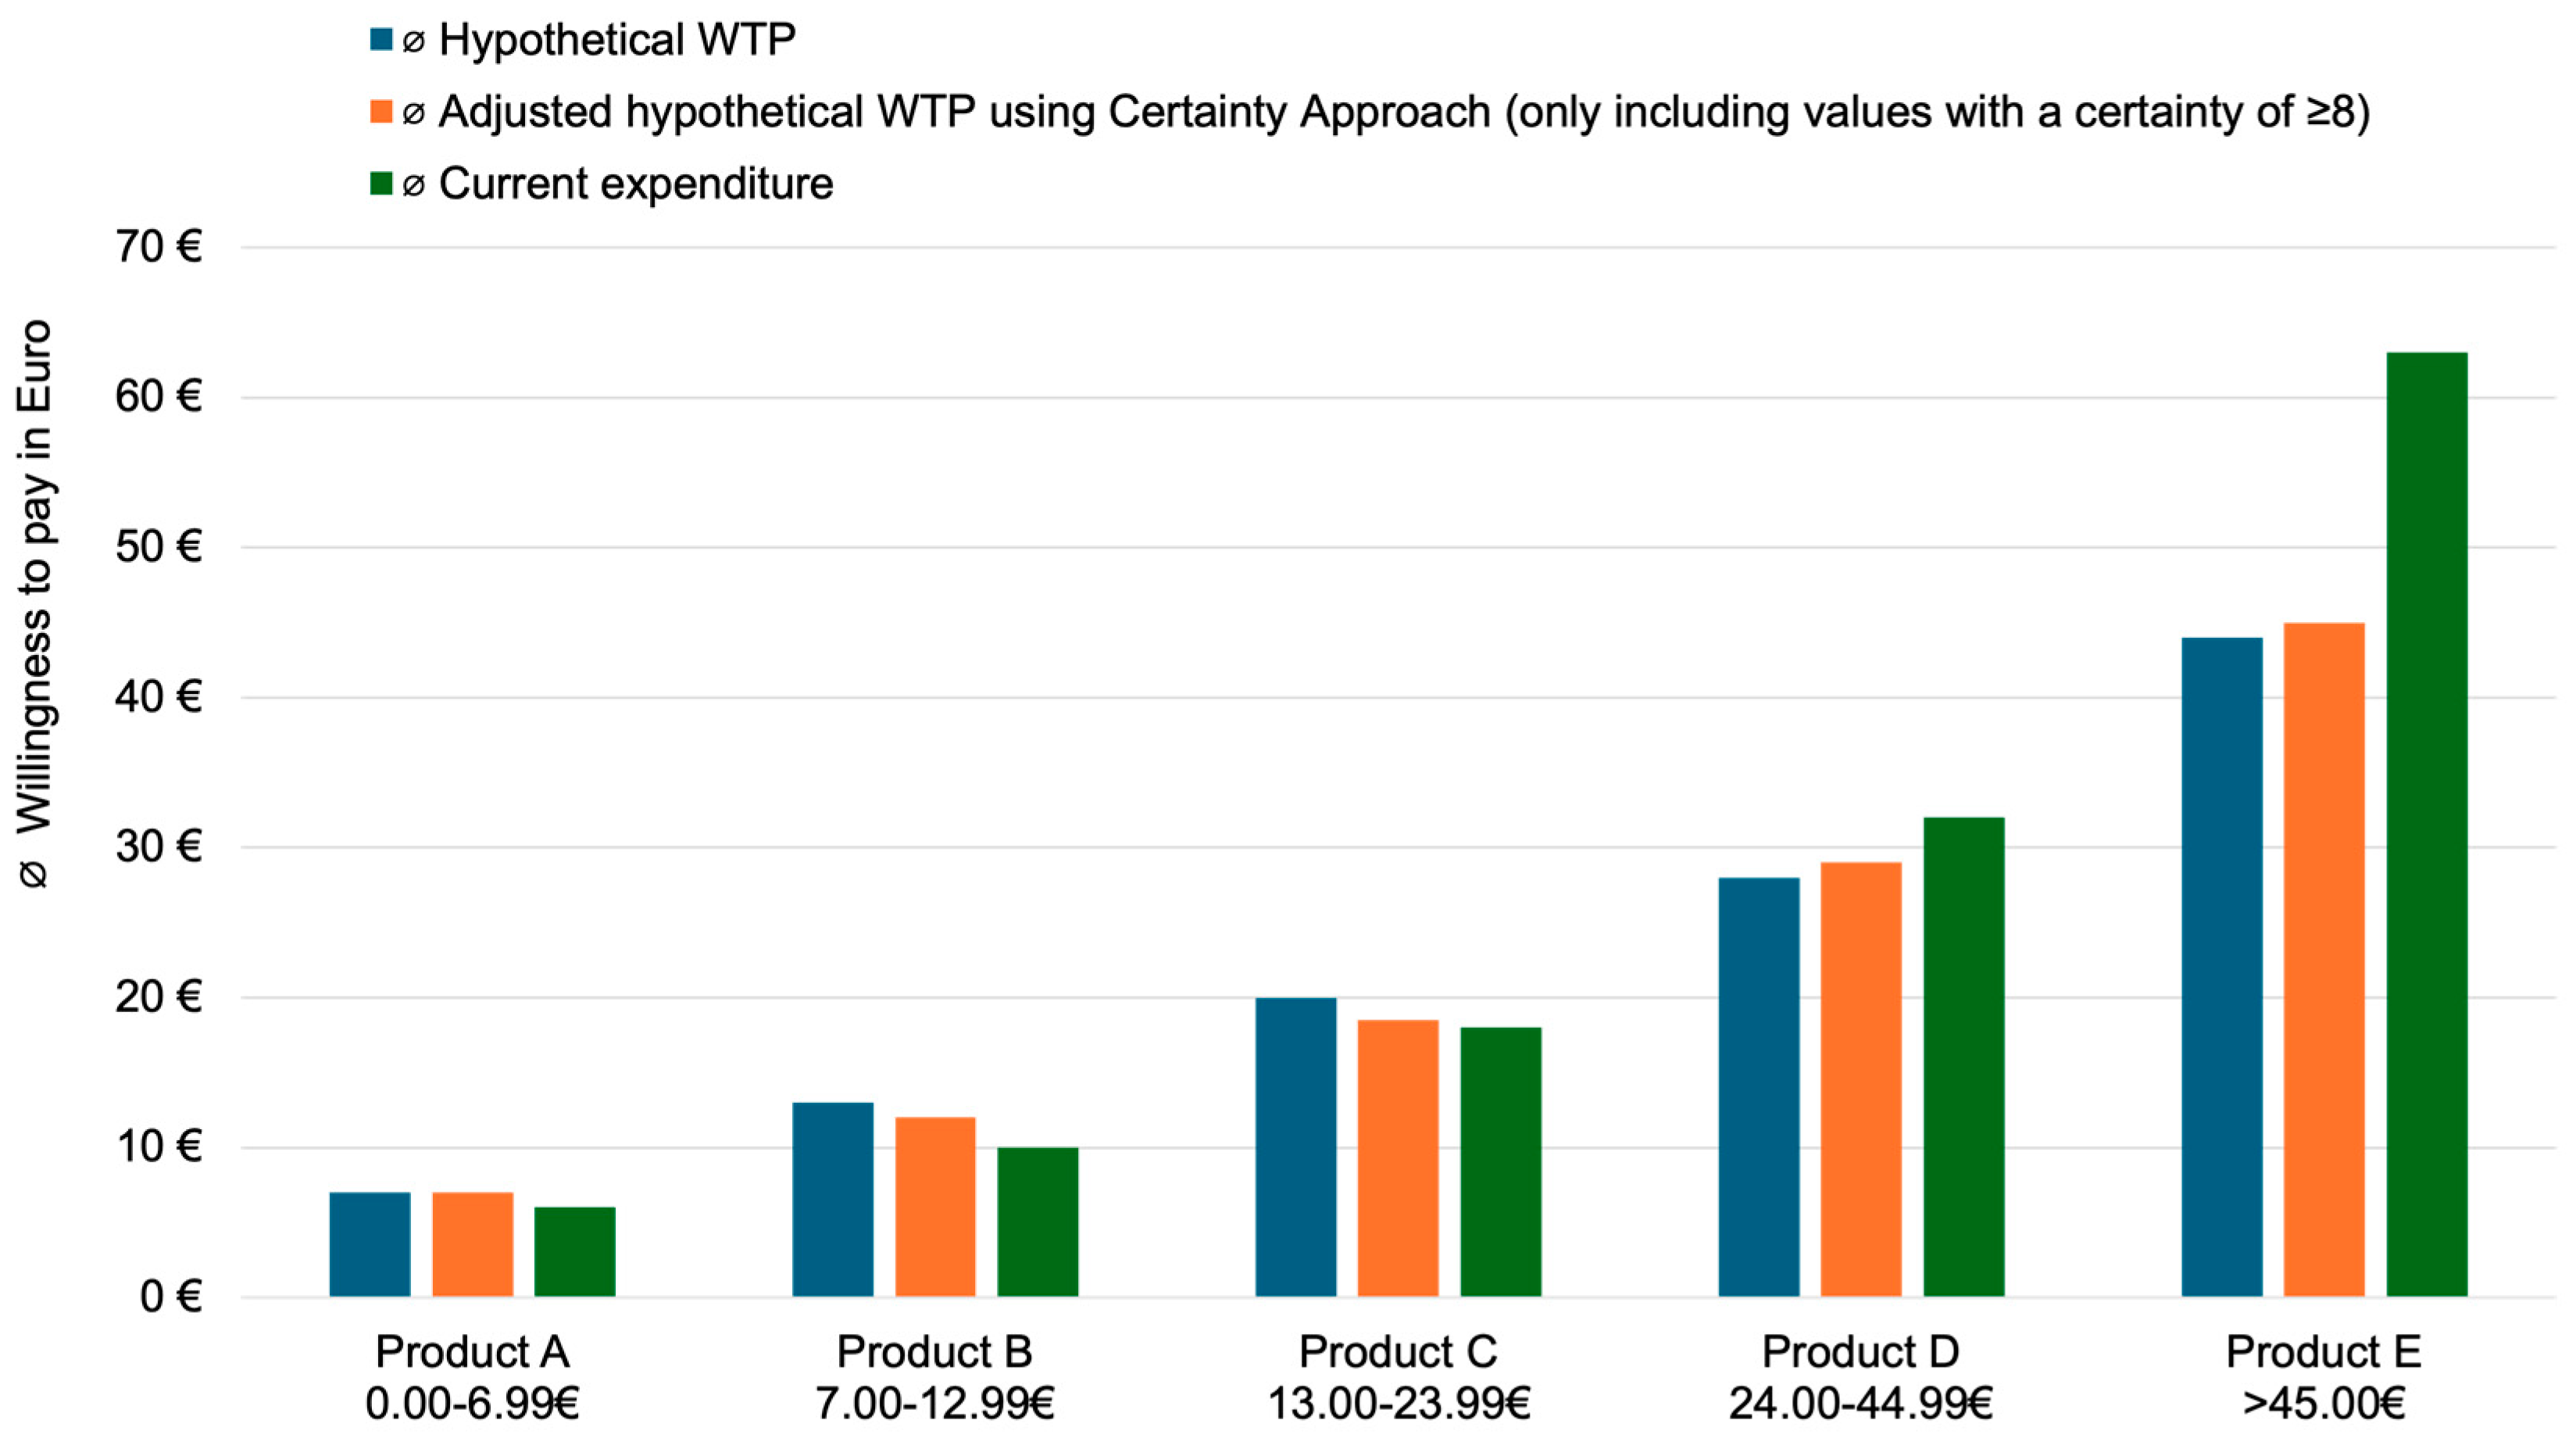
By applying the Certainty Approach, we were able to adjust the hypothetical WTP values closer to the real values (= actual current expenditure). Thus, the Certainty Approach proved to be an effective method to mitigate HB. This is especially the case for lower-cost plans, which hardly affect customer group E. Figure 4 illustrates the comparison of the average hypothetical WTP (= blue bars), the adjusted average hypothetical WTP using the Certainty Approach (= orange bars), and the average ‘real’ WTP (= green bars, based on actual current expenditure). Hypothetical WTP values (slightly) exceed actual WTP for lower product categories (A, B, C). Within higher groups (D/E) ‘real’ WTP (current expenditure) surpasses hypothetical data. Maybe premium customers (XL) acted strategically (see section 1) out of fear of raising market prices. To sum up, the Certainty Approach adjusts the data well and brings the WTP values closer to the current expenditure, but this is only the case for lower-priced plans. As represented by product E, current expenditure is still clearly underestimated (see Figure 4).
5. Discussion
HB poses a significant challenge in reliably measuring WTP, even for products with which consumers are familiar in their everyday lives, such as mobile phone plans. We identified the presence of HB when examining WTP for mobile plans, and it is even more pronounced in low-price plans. The main result of the paper is the quantification of HB in measuring WTP for mobile plans across different customer/product categories. Socio-demographics (gender, age, and income) do not significantly influence HB. However, we discovered a moderate negative correlation between actual WTP and the extent of HB. This means that as consumers’ current expenditure increases, the accuracy of their self-reported WTP improves, which has implications for how WTP data should be interpreted.
The findings provide clear, practical implications by highlighting the importance of considering and mitigating the HB in WTP surveys to obtain accurate, reliable data and optimize pricing strategies. In this case, the applied Certainty Approach offers a promising, effective ex-post solution by correcting the WTP data to mitigate the widespread phenomenon of HB. Although the adjusted data reflect actual payment behavior better, we could not eliminate HB. The study provides valuable guidance for more precise pricing strategies. Thus, we suggest companies (in the mobile communication sector) to focus (only) on adjusted WTP data in their pricing models. This can significantly enhance decision-making processes in the context of consumer behavior analysis by avoiding overestimating consumers’ WTP and inflated pricing decisions.
Regarding limitations, the current data is based on a convenient sample (N = 215), which might not be large enough to generalize the findings to a broader population. We achieved a wide distribution across different income groups, but female and young survey participants are overrepresented. Secondly, the results are limited to the German mobile market and rely on self-reported data, which can introduce bias (e.g., current expenditure for mobile usage). Thirdly, the subsequent regression analysis revealed a weak relationship, indicating that other factors beyond real willingness to pay might play a significant role in explaining the measured deviations.
Thus, future research could explore additional variables, such as customer preferences or product characteristics. Moreover, future studies should further examine and refine techniques for identifying, measuring, and reducing (or even eliminating) HB. Moreover, future studies should examine the impact of the HB across different socio-demographics/target groups (diverse gender, age, and income) and product categories to include a broader demographic representation to obtain generalizable results. Lastly, studies investigating HB in other industry contexts or product categories could be insightful, especially exploring (alternative) ex-ante/ex-post methods to reduce HB in (online) surveys.
References
- Beghin, J.C.; Gustafson, C.R. Consumer valuation of and attitudes towards novel foods produced with new plant engineering techniques: a review. Sustainability 2021, 13, 11348. [Google Scholar] [CrossRef]
- Berger, J. Signaling can increase consumers’ willingness to pay for green products. Theoretical model and experimental evidence. Journal of Consumer Behaviour 2019, 18, 233–246. [Google Scholar] [CrossRef]
- Cunningham, M.L.; Regan, M. A.; Ledger, S. A.; Bennett, J. M. To buy or not to buy? Predicting willingness to pay for automated vehicles based on public opinion. Transportation Research Part F: Traffic Psychology and Behaviour 2019, 65, 418–438. [Google Scholar] [CrossRef]
- Loomis, J. Strategies for overcoming hypothetical bias in stated preference surveys. Journal of Agricultural and Resource Economics 2014, 39, 34–46. [Google Scholar]
- Fifer, S.; Rose, J.; Greaves, S. Hypothetical bias in stated choice experiments: Is it a problem? And if so, how do we deal with it? Transportation Research Part A: Policy and Practice 2014, 61, 164–177. [Google Scholar] [CrossRef]
- Backhaus, K.; Wilken, R.; Voeth, M.; Sichtmann, C. An empirical comparison of methods to measure willingness to pay by examining the hypothetical bias. International Journal of Market Research 2005, 47, 541–560. [Google Scholar] [CrossRef]
- Brown, T.C.; Champ, P.A.; Bishop, R.C.; McCollum, D.W. Which response format reveals the truth about donations to a public good. Land Economics 1996, 72, 152166. [Google Scholar] [CrossRef]
- Ajzen, I. The theory of planned behavior: Frequently asked questions. Human Behavior and Emerging Technologies 2020, 2, 1–11. [Google Scholar] [CrossRef]
- Ketelsen, M.; Janssen, M; Hamm, U. Consumers’ response to environmentally-friendly food packaging – A systematic review. Journal of Cleaner Production 2020, 254, 120123. [Google Scholar] [CrossRef]
- Kouakou, C. R. C.; Poder, T. G. Willingness to pay for a quality-adjusted life year: a systematic review with meta-regression. The European Journal of Health Economics 2022, 23, 277–299. [Google Scholar] [CrossRef]
- Gupta, S; Odgen, D. T. To buy or not to buy? A social dilemma perspective on green buying. Journal of Consumer Marketing 2009, 26, 376–391. [Google Scholar] [CrossRef]
- Ethier, R.G.; Poe, G.L.; Schulze, W.D.; Clark, J. A comparison of hypothetical phone and mail contingent valuation responses for green-pricing electricity programs. Land Economics 2000, 76, 54–67. [Google Scholar] [CrossRef]
- Colombo, S.; Budziński, W.; Czajkowski, M.; Glenk, K. The relative performance of ex-ante and ex-post measures to mitigate hypothetical and strategic bias in a stated preference study. Journal of Agricultural Economics 2022, 73, 845–873. [Google Scholar] [CrossRef]
- Harrison, G. W.; Rutström, E. E. Experimental evidence on the existence of hypothetical bias in value elicitation methods. In Handbook of Experimental Economics Results, 1st ed.; Plott, C. R., Smith, V. L., Eds.; Elsevier, 2008; Volume 1, pp. 752–767.
- Murphy, J. J.; Stevens, T.; Weatherhead, D. Is cheap talk effective at eliminating hypothetical bias in a provision point mechanism? Environmental & Resource Economics 2005, 30, 327–343. [Google Scholar]
- Penn, J. M.; Hu, W. Understanding Hypothetical Bias: An Enhanced Meta-Analysis. American Journal of Agricultural Economics 2018, 100, 1186–1206. [Google Scholar] [CrossRef]
- Karjaluoto, H.; Jayawardhena, C.; Leppäniemi, M.; Pihlsträm, M. How value and value and trust influence loyalty in wireless telecommunications industry. Telecommunications Policy 2012, 36, 636–649. [Google Scholar] [CrossRef]
- Sichtmann, C. An analysis of antecedents and consequences of trust in a corporate brand. European Journal of Marketing 2007, 41. [Google Scholar] [CrossRef]
- Oldenburg, A. G. Entwicklung von innovativen Strategieoptionen in gesättigten Märkten. Eine Analyse und Handlungsempfehlungen basierend auf dem Mobilfunkmarkt in Deutschland [Development of innovative strategy options in saturated markets. An analysis and recommendations for action based on the mobile communications market in Germany], 1st ed.; Springer Gabler: Wiesbaden, Germany, 2021; Volume 1. (in German) [Google Scholar]
- Kloss, D.; Kunter, M. The Van Westendorp Price-Sensitivity Meter as a direct measure of willingness-to-pay. European Journal of Management 2016, 16, 45–54. [Google Scholar] [CrossRef]
- Hofstetter, R.; Miller, K. Bessere Preisentscheidungen durch Messung der Zahlungsbereitschaft [Better pricing decisions by measuring willingness to pay]. Marketing Review St. Gallen 2009, 26, 32–37. (In German) [Google Scholar] [CrossRef]
- Kilduff, A.; Tregeagle, D. Willingness-to-pay for produce: a meta-regression analysis comparing the stated preferences of producers and consumers. Horticulturae 2022, 8, 290. [Google Scholar] [CrossRef]
- O’Brien, D.; Wellbrock, C.-M.; Kleer, N. Content for Free? Drivers of Past Payment, Paying Intent and Willingness to Pay for Digital Journalism – A Systematic Literature Review. Digital Journalism 2020, 8, 643–672. [Google Scholar] [CrossRef]
- Schmidt, J.; Bijmolt, T. H. A. Accurately measuring willingness to pay for consumer goods: a meta-analysis of the hypothetical bias. Journal of the Academy of Marketing Science 2020, 48, 499–518. [Google Scholar] [CrossRef]
- Doyon, M.; Saulais, L.; Ruffieux, B.; Bweli, D. Hypothetical bias for private goods: does cheap talk make a difference? Theoretical Economics Letters 2015, 6, 749–756. [Google Scholar] [CrossRef]
- Andor, M. A.; Frondel, M.; Vance, C. Mitigating hypothetical bias. Evidence on the effects of correctives from a large field study. Ruhr Economic Papers, No. 480, 2014, RWI: Essen. [CrossRef]
- Bosworth, R.; Taylor, L. Hypothetical bias in choice experiments: is cheap talk effective at eliminating bias on the intensive and extensive margins of choice? The B.E. Journal of Economic Analysis & Policy 2012, 12, 1–28. [Google Scholar]
- Champ, P.; Moore, R.; Bishop, R. A comparison of approaches to mitigate hypothetical bias. Agricultural and Resource Economics Review 2009, 38, 166–180. [Google Scholar] [CrossRef]
- Blumenschein, K.; Blomquist, G. C.; Johannesson, M.; Horn, N.; Freeman, P. eliciting willingness to pay without bias: evidence from a field experiment. The Economic Journal 2008, 118, 114–137. [Google Scholar] [CrossRef]
- List, J. A.; Sinha, P.; Taylor, M. H. Using choice experiments to value non-market goods and services: evidence from field experiments. The B.E. Journal of Economic Analysis & Policy 2006, 6, 1–37. https://www.degruyter.com/document/doi/10.2202/1538-0637.1132/html.
- Brown, T. C.; Ajzen, I.; Hrubes, D. Further tests of entreaties to avoid hypothetical bias in referendum contingent valuation. Journal of Environmental Economics and Management 2003, 46, 353–361. [Google Scholar] [CrossRef]
- Lusk, J. L. Effects of cheap talk on consumer willingness-to-pay for golden rice. American Journal of Agricultural Economics 2003, 85, 840–856. [Google Scholar] [CrossRef]
- Cummings, R.; Taylor, L. Unbiased value estimates for environmental goods: a cheap talk design for the contingent valuation method. American Economic Review 1999, 89, 649–665. [Google Scholar] [CrossRef]
- Champ, P. A.; Bishop, R. C.; Brown, T. C.; McCollum, D. W. Using donation mechanisms to value nonuse benefits from public goods. Journal of Environmental Economics and Management 1997, 33, 151–162. [Google Scholar] [CrossRef]
- Bobinac, A. Mitigating hypothetical bias in willingness to pay studies: post-estimation uncertainty and anchoring on irrelevant information. The European journal of health economics: HEPAC: health economics in prevention and care 2019, 20, 75–82. [Google Scholar] [CrossRef] [PubMed]
- Hofstetter, R.; Miller, K. M.; Krohmer, H.; Zhang, Z. J. How do consumer characteristics affect the bias in measuring willingness to pay for innovative products? Journal of Product Innovation Management 2023, 30, 1042–1053. [Google Scholar] [CrossRef]
Figure 1.
Frequency of methods used to determine WTP (based on [21], newly illustrated).
Figure 1.
Frequency of methods used to determine WTP (based on [21], newly illustrated).
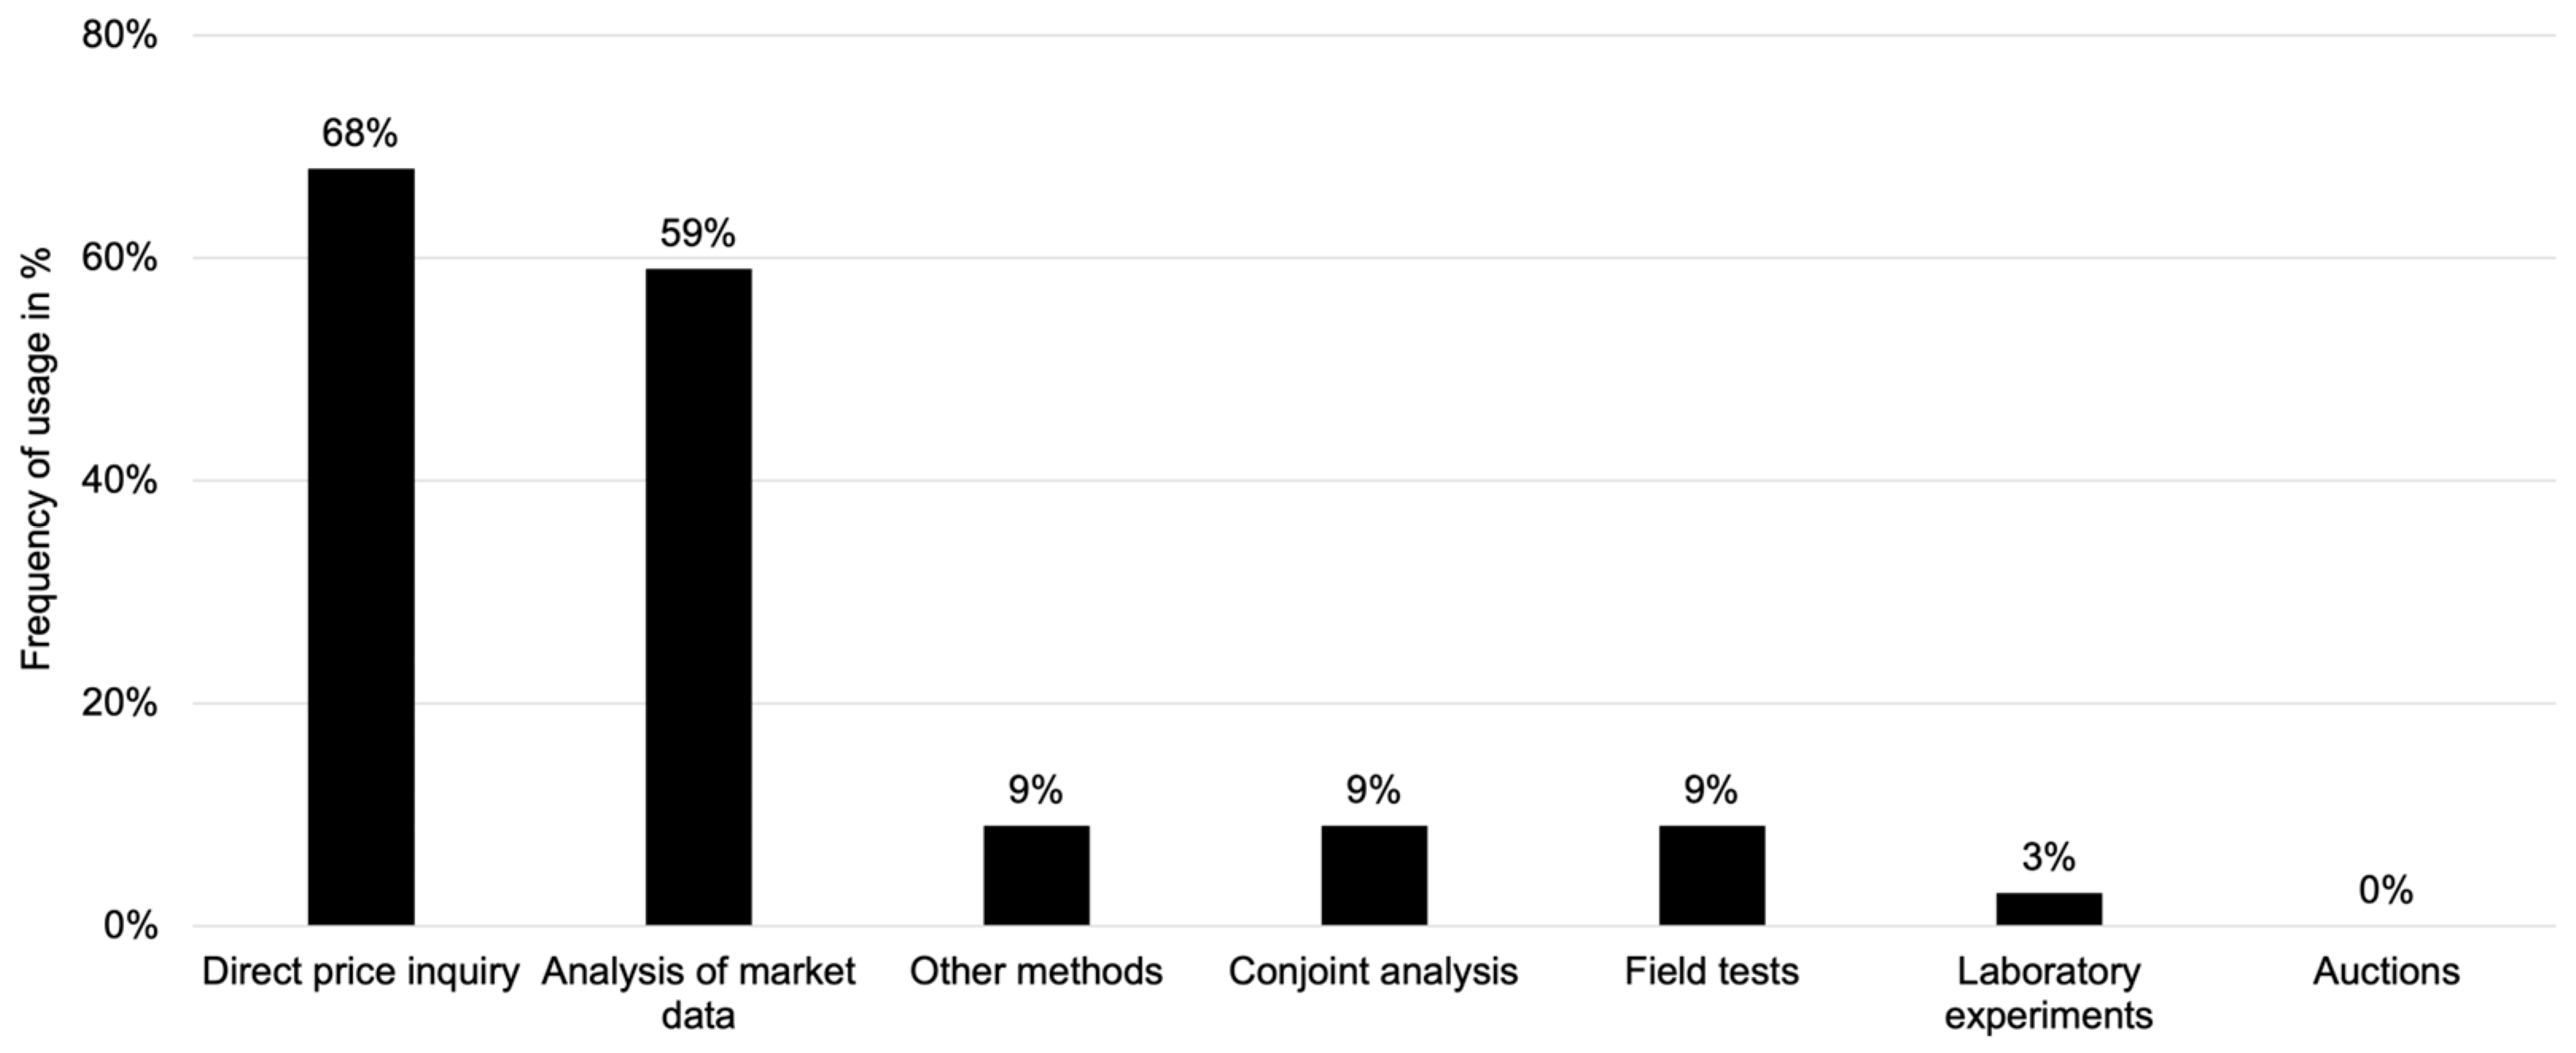
Figure 2.
Correlation between the average deviation in percent and the average ‘real’ WTP (based on current expenditure) per product/customer segment.
Figure 2.
Correlation between the average deviation in percent and the average ‘real’ WTP (based on current expenditure) per product/customer segment.
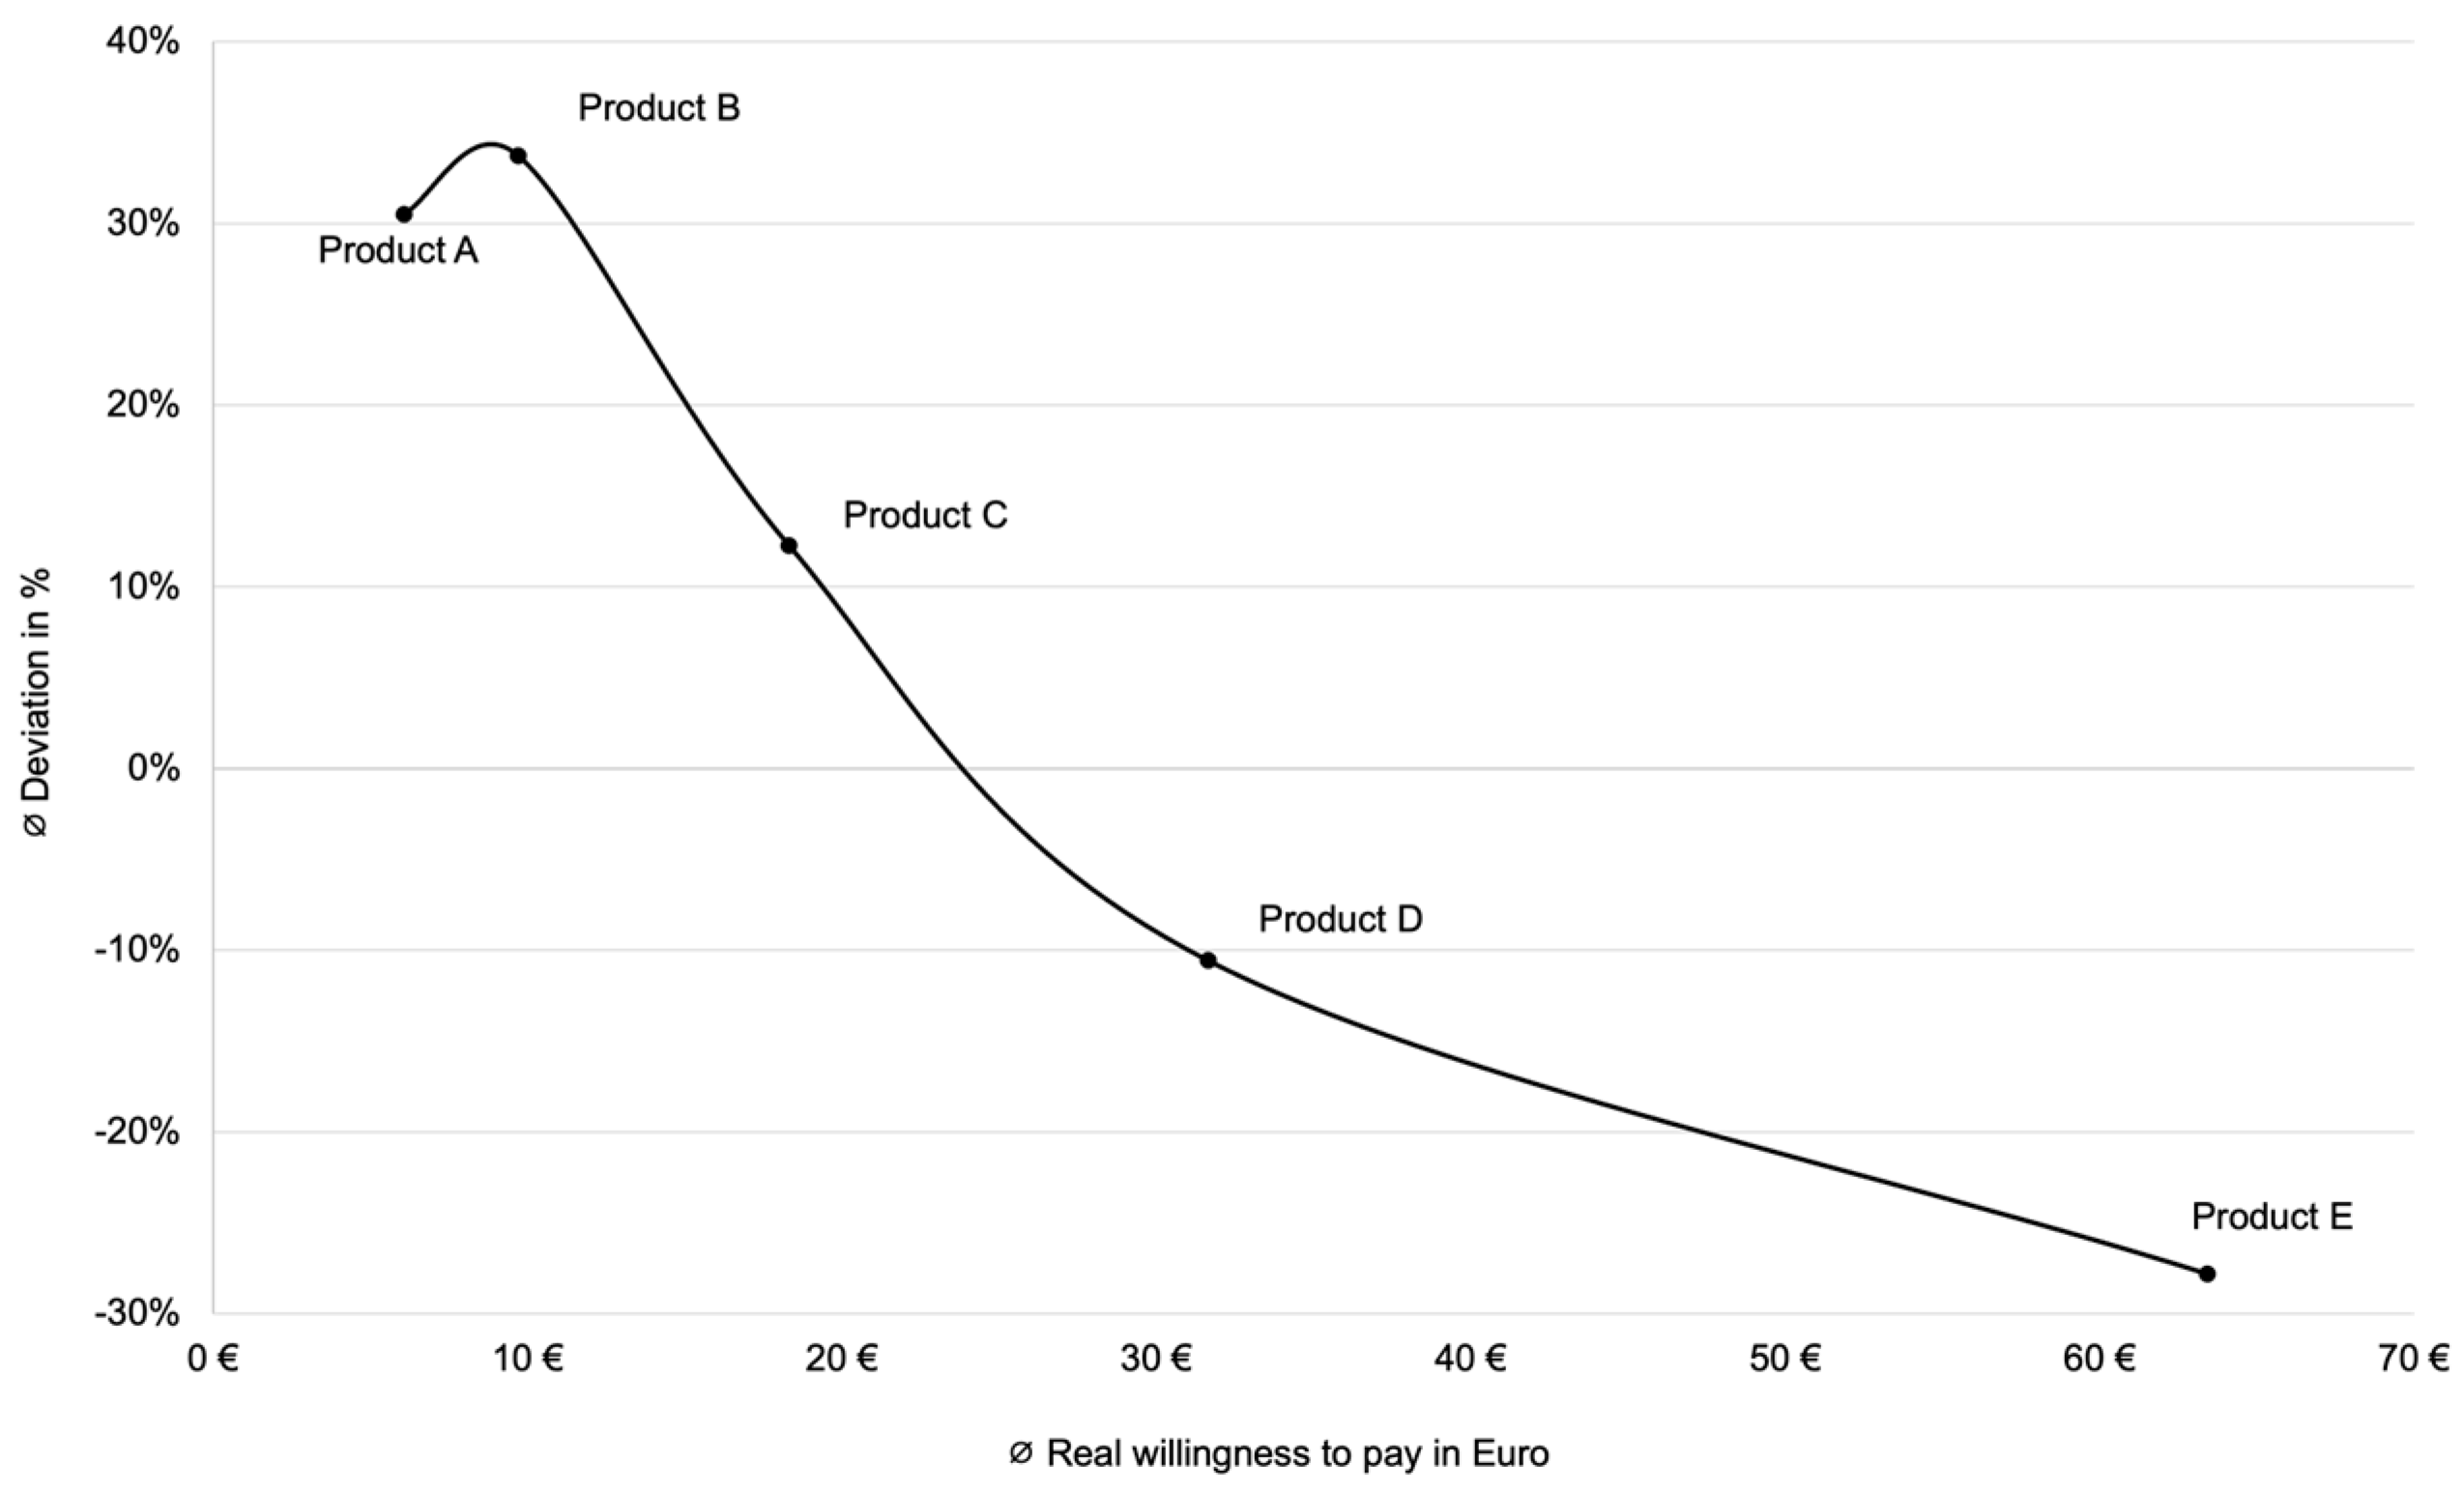
Figure 3.
Scatter plot of the regression analysis between the average deviation in percent and the average ‘real’ WTP (based on current expenditure) per product/customer segment.
Figure 3.
Scatter plot of the regression analysis between the average deviation in percent and the average ‘real’ WTP (based on current expenditure) per product/customer segment.
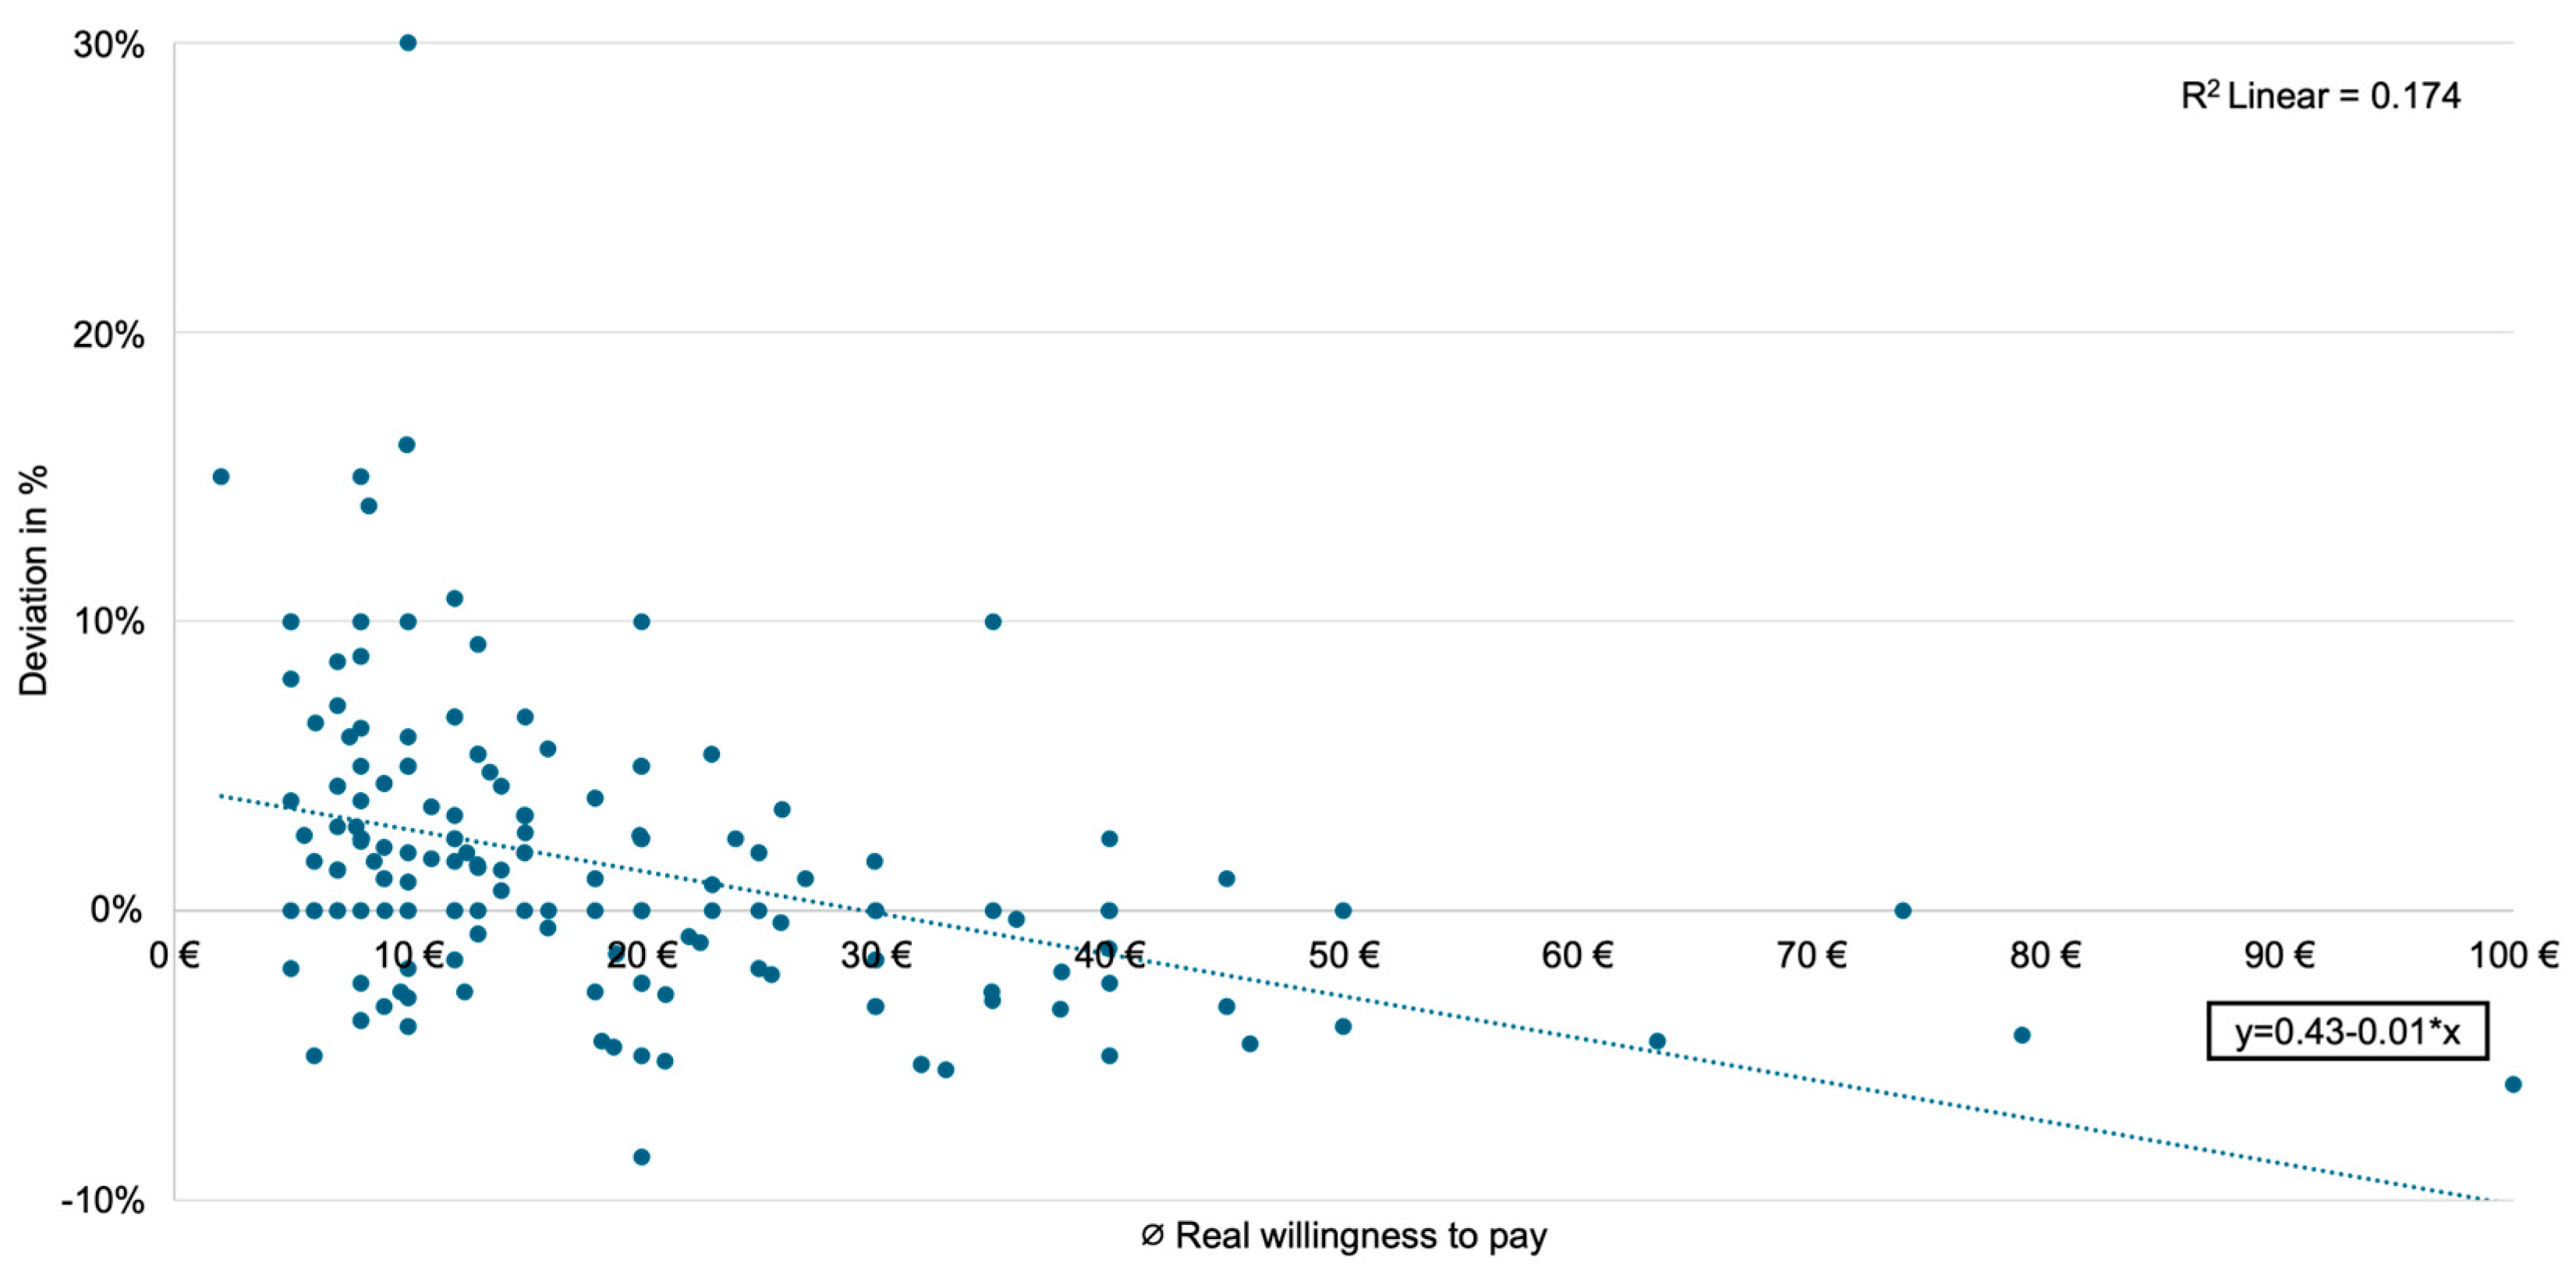
Figure 4.
Comparison of the averages of hypothetical WTP, ‘real’ WTP (based on current expenditure), and adjusted hypothetical WTP using the Certainty Approach.
Figure 4.
Comparison of the averages of hypothetical WTP, ‘real’ WTP (based on current expenditure), and adjusted hypothetical WTP using the Certainty Approach.
Disclaimer/Publisher’s Note: The statements, opinions and data contained in all publications are solely those of the individual author(s) and contributor(s) and not of MDPI and/or the editor(s). MDPI and/or the editor(s) disclaim responsibility for any injury to people or property resulting from any ideas, methods, instructions or products referred to in the content. |
© 2025 by the authors. Licensee MDPI, Basel, Switzerland. This article is an open access article distributed under the terms and conditions of the Creative Commons Attribution (CC BY) license (http://creativecommons.org/licenses/by/4.0/).
Copyright: This open access article is published under a Creative Commons CC BY 4.0 license, which permit the free download, distribution, and reuse, provided that the author and preprint are cited in any reuse.


