Submitted:
19 March 2025
Posted:
20 March 2025
You are already at the latest version
Abstract
Background/Objectives: Agility is crucial in game sports, requiring both motor and cognitive skills. Athletes must perceive and process information to adapt movements, yet traditional agility tests often lack cognitive and multidirectional demands. Additionally, modern test systems are mostly stationary. This study evaluated the novel and portable “Functional Agility Square Test” (FAST) for validity, reliability, and usefulness. Methods: To assess discriminant validity, 22 game sports (GS) and 22 non-game sports (NGS) athletes participated in one session. Test-retest reliability was examined with 36 GS athletes (20 female) across three sessions. Participants performed cognitive (FAST_COG), preplanned (FAST_MOT), and randomized (FAST_SAT) reactive change-of-direction tasks, each repeated three times per session. Results: Results showed significantly lower response times (RTs) in GS compared to NGS (p < .05). Mean RTs indicated moderate relative reliability (ICC .50–.74), while medians showed moderate to good reliability (ICC .59–.83). Usefulness was evident from the first session (FAST_MOT) or from the third session (FAST_SAT) based on median RTs. Conclusions: Thus, the FAST seems to be valid, reliable, and sensitive for GS-based agility assessment. Its portable setup enables ecologically valid field testing. Future research should further increase task complexity to better simulate game conditions.
Keywords:
testing
; cognition
; team sports
; agility
1. Introduction
Game sports take place in enriched and dynamic environments. Athletes need to screen and adapt to these sporting surroundings by perceiving and processing sensory cues such as the routes of teammates and opponents or instructions from their coaches/teammates. Accordingly, agility - the ability to perform whole-body movements with a change of velocity or direction in response to a stimulus [1] - is a key skill in team sports. Agility performance is influenced by motor-related aspects such as linear sprint speed, leg muscle quality, core strength, and cognitive-related aspects, like visual scanning, knowledge of the situations, pattern recognition, and anticipation [1,2,3,4,5].
Most commonly, test setups for change of direction (COD) or agility testing in team sports use a Y-shape, including one preplanned or reactive reaction at a 45° angle. However, in game and training situations, athletes of multidirectional sports must visually scan their environment, process information from all directions, and adapt their movements to respond effectively to situational demands [6,7]. This requires executing reactive changes of direction at various angles, including lateral, diagonal, and backward movements, while adjusting running patterns and body positions to meet the complex requirements of the game [8,9,10]. In addition, decision-making behavior in games is much more complex than a reaction that merely involves a decision to initiate a change of direction to the left or the right [11]. More recent agility tests carried out with stationary systems increase the possible degrees of directional changes and therefore, these systems enable agility tests with multidirectional movements [12,13,14,15,16,17]. Furthermore, these tests offer, in addition to simple coded agility tests, such as the ‘Star Run’, cognitively demanding test settings with customized color-coded signals to instruct different movement tasks [13] or dual-task exercises in which cognitive and motor tasks are combined [16]. Despite increased motor (various running directions) and cognitive (higher order cognitive demands) degrees of freedom, these tests demonstrated good to excellent reliability [13,14,15].
While those mentioned above stationary, lab-based systems enable the assessment of multidirectional agility, they lack portability. Therefore, they cannot be used simultaneously in varying sports facilities, such as the soccer court or sports hall. Mobile light-based training and testing systems are emerging, allowing for more variable and ecologically valid test setups. The portability of the sensors allows for a sports-specific alignment in the test setups, related to angles, distances and surfaces [18,19,20,21,22]. Further, light-based agility systems have been reported as reliable and discriminant valid measurement systems for agility testing [23,24,25]. Therefore, light-based tests seem appropriate portable alternatives for the aforementioned stationary testing methods but validated tests using assessable light-based training systems are sparse.
To overcome these shortcomings, we developed the “Functional Agility Square Test” (FAST). This light-based agility test aims to test the reactive agility of team sports athletes in a mobile and ecologically valid manner. The primary aim of the present investigation was to examine the discriminant validity, reliability (reproducibility) and usefulness (sensitivity to identify changes in performance) of the FAST in samples of healthy athletes. A group comparison between game and non-game athletes was performed to measure discriminant validity. This subtype of validity refers to the extent to which a test or a measure accurately distinguishes between constructs or variables that are theoretically expected to be distinct [23]. Since game sports athletes are habituated to reactive multidirectional runs, we hypothesized that game sports athletes outperform non-game sports athletes in the FAST. To analyze the FAST’s test-retest reliability and usefulness, a group of healthy game sports athletes performed the FAST three times with at least one week break between the sessions. The test-retest reliability describes the reproducibility of test scores from the same person in two or more test sessions [26]. Furthermore, usefulness describes the sensitivity of a test to detect performance changes [14,15]. As response times are often skewed [27] the measure of central tendency should be considered for reporting response times. Therefore, the secondary aim of this study was to investigate possible differences of mean and median response times as standard measures of central tendency.
2. Materials and Methods
2.1. Experimental Approach
This study combined a between subject and a within-subject experimental design for assessing the discriminant validity, test-retest reliability and usefulness of the FAST. In the between-subject design, two groups of female game sports (GS) and non-game sports athletes (NGS) were tested once to determine discriminant validity. To assess test-retest reliability, a sample of male and female GS was tested at three time points with at least one week of break in between.
2.2. Functional Agility Square Test (FAST)
All testing were performed indoors in a lab of the affiliated university. All FAST conditions were executed with the Fitlight System (Sport Corp., Ontario, Canada) using the application for mobile devices (App Version 2.5.7a) with the Wifi Light System (Version 1.31). The Fitlight System has shown high reliability in COD and reactive agility testing [24,28]. The test setup (Figure 1A) consists of a small square (0.60 m x 0.60 m), which was used as the setup for the FAST_cognitive (FAST_COG) and as the starting position for the following conditions. Furthermore, a larger square (3.5 m x 3.5 m) was used for FAST_motor (FAST_MOT) and the “Simple Agility Test” (FAST_SAT). The Fitlights were positioned in the corners of the square [13,15]. The sensors were placed upright in approximately 6 cm high cones in the latter set-up. In addition to these lights, synchronized lights were placed in each corner 70 cm apart and the LED facing the center position, to ensure that the participants were able to recognize the lights correctly (Figure 1B). In every condition, one corner of the square lit up green and beeped. The remaining Fitlights lit up red and did not present sound. The Fitlights were deactivated through a step near the Fitlight which activated the proximity sensor (up to 80 cm). Participants were instructed to deactivate the targeted light as fast as possible. In each condition a sequence of eight lights (each corner two times) had to be deactivated per trial. Between each stimulus, a delay of approximately two seconds was set to provide sufficient time to return to the center of the square.
The first condition was the FAST_COG, aiming for the assessment of response times (RT) with limited motor demands. In this condition, four Fitlights were placed on the floor on the corners of the small square. The participants stood in the middle of the square and had to eliminate the appearing and beeping lights through a swipe movement with their left or right foot as fast as possible. The starting position for the further conditions was the aforementioned smaller square placed in the middle of the larger square. The FAST_MOT was used for the assessment of preplanned agility with limited cognitive demands. Therefore, the athletes were aware of the light order (clockwise starting with the frontal left light) and each light was illuminated twice. In contrast, the FAST_SAT aimed to assess reactive agility, so that the order of lights lightning up was randomized, using the same number of activated lights (in total 8 lights for each run and each corner twice). Participants were instructed to deactivate the target light with a step next to the light as fast as possible and then return to the starting position as quickly as possible and wait for the next stimulus for the FAST_MOT and FAST_SAT.
A warm-up (approximately 10 minutes) consisting self-paced jogging or stationary bike riding and individually needed additional exercises, was carried out before the measurements. Each test condition of the FAST was performed three times (Figure 2). There was a one-minute break between the trials of the FAST_COG and a two-minute break between each of the trials of the FAST_MOT and FAST_SAT, respectively. The order of the test conditions was randomized for each measurement. To quantify FAST performance, the mean and median RT (time between activation and deactivation of the target light) in milliseconds was extracted for each trial. Trials with measurement errors (e.g., response times < 100 ms or not correctly deactivated stimuli) were deleted before further data analysis. Following Sekulic et al. (2014), a “reactive agility index” (RAI) was calculated as the difference between the best FAST_MOT and the best FAST_SAT performance [29]. For the validity and reliability study, the best of the three trials of each condition was included for statistical analysis.
2.3. Participants
For validation purposes, the appropriate sample size was estimated with G*Power, Version 3.1.9.7 [30], to achieve a statistical power of .9 at an alpha significance level of .05. We based the assumed effect size on Sekulic et al. (2014) who reported significant differences between agility-saturated and non-agility-saturated female athletes in a shorten agility task. The power calculation revealed a required sample size of 19 participants for each group. In total 22 female GS and 22 female NGS athletes were included. The demographics of the participants are displayed in Table 1.
The guidelines supplied by Bujang and Baharum (2017) were utilized to estimate the necessary sample size to compute Intraclass-Correlation-Coefficients (ICC) for test-retest reliability. A minimum estimate of 0.5 was predicted to indicate at least considerable reliability [31]. The needed number of participants was 11, based on statistical tables with an alpha level of .05 and a statistical power of 0.8, assuming the null hypothesis of no agreement between evaluations [32]. In total, the study involved 36 (20 female) healthy GS athletes. All athletes participated in game sports at a regional level and performed their given sports for ~ 14 years. The demographics of the participants are displayed in Table 1.
Participants were informed about the study and provided their written informed consent. In the case of underage participants (younger than 18 years), a written declaration of consent was obtained from their legal representatives. Participants were excluded from the study if they no longer actively practiced their sport or had recent injuries to the lower extremities. The associated university’s ethics committee approved the study, and the investigation was carried out following the Declaration of Helsinki.
2.4. Testing
For evaluating the discriminant validity, the GS and NGS athletes performed three trials of the FAST_COG, FAST_MOT and FAST_SAT in one session. Testing were carried out as described above (for schematic overview see Figure 2). To evaluate the test-retest reliability, participants performed the measurements at three time points with at least one week break between the sessions (Figure 2). All tests for each participant were carried out at the same time of day to prevent errors resulting from circadian rhythm. The FAST_COG was not included in the test-retest reliability analysis, as this test condition was a scientific approach to categorize the subcomponents of agility, and less meaningful for further practical applied sports investigation.
2.5. Statistical Analysis
All statistical tests for discriminant validity analysis were performed with SPSS (version 29). First, Shapiro-Wilks test was used to test all variables for normal distribution. All variables, except the mean values of the FAST_COG, were normally distributed. For validity examination, differences between GS and NGS were analyzed with the independent T-test for normally distributed data and for the mean values of FAST_COG with the Mann-Whitney U test. The alpha level for significance was set at p < .05 for all statistical tests.
Customized scripts for MATLAB (Mathworks 2023a) were used to assess test-retest reliability between the measurements with Intraclass-Correlation-Coefficients (ICC) calculations based on a two-way mixed effects model, single ratings and absolute agreement. Additionally, the coefficient of variation (CoV) was calculated. ICC scores were classified as follows: poor (< 0.50), moderate (0.50–0.75), good (0.75–0.90), and excellent (≥ 0.90) reliability [31], and CoV < 5% were classified as acceptable [33,34].
For assessing the usefulness (sensitivity to identify training-induced changes in performance) of the test battery, the typical error (TE) and smallest worthwhile change (SWC) were calculated [35]. Tests are categorized as “good” if the SWC value is greater than the TE value, “OK” if the SWC and TE are equal, and “marginal” if the TE is greater than the SWC value [14,35]. The SWC was calculated by multiplying the between-subject standard deviation by 0.5 (SWC 0.5) for testing for performance changes with a medium effect [15,35]. The TE was calculated by dividing the standard deviation of the change scores of the three trials per condition, per day by √2 [15,36].
3. Results
3.1. Discriminant Validity
Table 2 presents the mean and median RTs for all test conditions (FAST_COG, FAST_MOT, FAST_SAT) and groups (GS and NGS). For both mean and median RTs, significant differences between the two groups in all three FAST conditions have been observed. Statistical analysis revealed significant differences in FAST_COG (MEAN p = .023; MEDIAN p = .009), FAST_MOT (MEAN p = .013; MEDIAN = .018) and FAST_SAT (MEAN p = .010; MEDIAN p = .023) with lower RTs of GS than NGS in all conditions. Conversely, RAI showed no significant differences between the groups, regardless of whether comparing the mean or median values.
3.2. Test-Retest Reliability
The results of the test-retest reliability are displayed in Table 3 for the mean RTs, and in Table 4 for median RTs. For the analysis of reliability of mean values, the FAST_MOT and FAST_SAT showed moderate (ICC .50 - .74) reliability across the three sessions. The CoV remained below 5 % for the FAST_SAT between session one and two (CoV 4.89) but exceeded the 5 % for the FAST_SAT (CoV 5.55) session two and three and FAST_MOT across all three sessions (CoV 5.68–7.28). The RAI showed poor to moderate (ICC .44 - .56) reliability. CoVs of RAI exceeded 5 % (CoV 25.17 - 25.37) across the three measurements. For median values, the FAST_MOT and FAST_SAT showed moderate to good (ICC .59–.83) reliability across the three sessions. The CoV remained below 5 % for the FAST_MOT and FAST_SAT from session two onwards (CoV 4.48–4.54). RAI showed poor to moderate (ICC .44 - .57) reliability across the three sessions. CoV values of the RAI exceeded 5 % (CoV 23.87–23.98) across all sessions.
3.3. Usefulness
The results of the usefulness analysis are displayed in Table 5. As for reliability analysis, usefulness was analyzed with regards to both the mean and median values of the FAST RTs. For the analysis of mean values of the FAST_MOT, the TE exceeds the SWC 0.5 in session one and session two. In session three the TE is lower than the SWC 0.5 and therefore, usefulness can be assumed. For the FAST_SAT the TE exceeds the SWC 0.5 in all three sessions and therefore, usefulness cannot be assumed. For the analysis of median values, the TE of the FAST_MOT is lower than the SWC 0.5 in all three sessions and therefore, usefulness can be assumed. For the FAST_SAT, the TE exceeds the SWC 0.5 in sessions one and two. In session three the TE is smaller than the SWC 0.5 and therefore, usefulness can be assumed from session three on.
4. Discussion
This study investigated the discriminant validity, test-retest reliability and usefulness of the newly developed FAST. Three main findings emerged. First, significant differences were found between GS and NGS athletes in all three test conditions investigated with the FAST with GS outperforming NGS, independent of using means or medians. Second, differences between the usage of mean and median values were observed. While the mean values demonstrate moderate relative and limited absolute reliability, the FAST conditions revealed moderate to good and acceptable absolute reliability when extracting medians. Third, the usefulness of the FAST can be assumed for both tests from the beginning (FAST_MOT) or at the latest from the third session on (FAST_SAT) when considering median RTs. Therefore, we assume that the FAST is a valid and reliable agility test for team sports which overcomes current shortcomings of stationarity, lab-based tests and their ecological validity.
4.1. Discriminant Validity
As hypothesized, GS showed significantly faster RTs than NGS in the FAST pre-planned and reactive tasks. Therefore, it can be stated that the FAST is a valid test for the assessment of agility in team sports. Previous studies showed similar results for agility tests [21,29]. Our findings align with the study of Sekulic and colleagues (2014) who showed, that their shorter version of their agility test was able to distinguish between female athletes of agility-saturated and female athletes of non-agility-saturated sports [29]. Even though the FAST has longer partial and total distances, significant differences were found between female athletes of different sports categories. As we included only female athletes for validation purposes, our chosen running distances could have impacted the significant differences between the two groups. Additionally, Mackala and colleagues (2020) compared individual and team sports athletes in preplanned CODs and reactive agility across four spatial configurations, finding that team sport athletes performed significantly better in three tested conditions. One of these setups (universal reactive agility) is comparable to the FAST and showed significantly better performance of team sports athletes [21]. To ensure that the sample was as homogeneous as possible for validation purposes, only female athletes were included to overcome the already proven influence of gender on performance in reactive agility tests [29,37,38,39].
While previous studies reported significant differences between GS and NGS in reactive tasks only [29], we also observed group differences in the pre-planned COD runs. Hence, it might be speculated that the spatial configuration of the FAST probably depicts situations more similar to game sports due to the orientation of the stimuli and running directions within and outside the field of vision. Since NGS are less dependent on active scanning of their sporting environment [21] and the FAST_MOT also includes a reactive component, the experiences in the ever-changing environment may have influenced the behavior of the GS [40]. Based on the current findings, the FAST seems to picture the team sports requirements in female athletes.
4.2. Reliability
Overall, the FAST showed moderate to good reliability in the FAST_MOT and FAST_SAT over three test sessions. For the analysis of relative and absolute reliability, the FAST showed divergent results when looking at the mean and median values. Mean RT values revealed only moderate reliability. When looking at the medians, moderate to good reliability was observed. In contrast to previously reported reliability studies on agility tests, the reliability of the FAST conditions was relatively low. This might be related to the running courses of the tests, which are more complex than most previously investigated agility tests, often performed in the Y-shape [23]. In the FAST, each trial is composed of eight runs towards the outer lights and eight runs back towards the middle position. Accordingly, each of the turns could potentially lead to measurement errors and therefore influence the RT results. These could be explained by e.g. stepping towards the wrong side of the lights and therefore not deactivating the sensor at the first attempt, chasing towards the false light (in FAST_SAT) or slight slipping during the cutting movements [29]. These errors in the measurement can affect the reliability and can also explain the differences in the repeatability of the two test conditions, since the more complex test (FAST_SAT) has more scope for movement than the more simple test (FAST_MOT) and therefore shows lower ICC values [19,41,42]. Therefore, the test complexity could have impacted the reliability of mean and median RTs.
Studies incorporating comparable agility tasks showed higher ICC values for reactive agility testing like Smith et al. (2024) (time to target, ICC = .935). Smith et al. (2024) used the same test equipment (Fitlight System) and a square setup with the starting position in the center of the square. However, the participants ran further distances per run, as a) the square had a diagonal of 7 m (vs. 5 m in the FAST) and b) an average of 15 lights (vs. in total 8 in the FAST) were approached. Thus, Smith et al. (2024) were concerned with long-lasting exhaustive agility runs (60 s) compared to shorter ones (on average 26 s FAST_MOT; 29 s FAST_SAT) in the FAST and therefore different load profiles between the studies. Furthermore, a different form of deactivation of the sensors was chosen, since in previous studies, participants were asked to deactivate the lights with their hands [10,19,20,21,22,28]. For the FAST, we asked participants to deactivate the lights with their feet placed next to the Fitlight, since cutting movements are part of the standard game load without reaching with the hand to the ground [43,44]. It remains speculative whether the reliability values were impacted by the chosen type of deactivation because, as far as the authors are aware, the selected deactivation method (stepping/cutting movement near to the Fitlight) was used for the first time in a light-based agility configuration.
Another aspect that interacts with the reliability of a test is the degree of ecological validity [45]. To give the athletes no restrictions in the execution of their movements, the participants were given the option of choosing running forwards, backwards or sideways to the respective target lights [10]. This approach led to the observation that some participants changed their running strategies within a session or between sessions, which could potentially affect day-to-day reliability. For example, some players partially rotated during conditions, so the preorientation varied before starting a run. These changes in running strategies were observed in some athletes, however, other athletes have not changed their running strategies, and the orientation remained always the same. In other established agility tests, which show good to excellent reliability, the running directions are predetermined or there is only one [23]. From this, it can be concluded that running behavior should be examined more closely in future studies, or the body orientation should be specified. These instructions could ensure a better comparability of the results but would limit the ecological validity.
4.3. Usefulness
Regarding usefulness, for the mean values usefulness could only be attested for the FAST_MOT from the third session onwards. The median RTs usefulness could be established for both test conditions (FAST_MOT and FAST_SAT) from the third appointment at the latest. The RAI showed only poor reliability and as the TE exceeded the SWC 0.5, the usefulness cannot be assumed for this evaluated parameter. Calculated indices were previously used to describe the differences in performance between preplanned and reactive COD runs and therefore to estimate speed and perceptual abilities of athletes [29,39,46,47]. These ratios were suggested to use for recommendations regarding training content [29]. The results of this study propose to be careful to rely only on the results of the ratio of two tests to prescribe training recommendations due to the low reliability and low sensitivity for performance change (usefulness). Following Gabett and colleagues (2008), a further calculation of the ratio of pre-planned and reactive COD runs could also be computed to categorize athletes in relation to the average team results. The resulting ratio allows classification into four categories: “slow thinker/fast thinker”, “slow mover/fast thinker” [48]. This classification could also prescribe specific training content with different foci related to agility’s motor and cognitive subcomponents. However, interventional studies are needed to test the efficiency of such approaches.
4.4. Median Analysis in Agility Research
Apart from the analysis of validity, reliability, and usefulness of the FAST, the present study demonstrated that the results between mean and median values can lead to different estimates of reliability and usefulness. In our study, mean RTs of the FAST showed only maximal moderate reliability, and usefulness could only be proven for the FAST_MOT from the third session onwards. In contrast, for the median RTs moderate to good reliability could be attested and usefulness could be established from the first session on for the FAST_MOT and from the third session on for the FAST_SAT. Therefore reporting both, mean and median could lead to a better understanding of the data and the distribution of RTs in agility tests [49]. However, in most published studies for agility research, mean values are reported to represent the central tendency. However, outliers impact mean values more and can be distorted in non-normally distributed data [50,51]. Even when values resulting from technical errors have been excluded, the RTs for each stimulus per condition of all participants were not normally distributed and showed a right-skewed distribution. Although the mean is the most used measure of central tendency, individual RTs are often not examined in detail. Instead, the mean value of individual responses per trial is calculated, and then a group mean is derived from these trial means. Since individual stimulus responses are likely to be skewed, reporting median values rather than mean values [50,51,52] would be advisable. Therefore, future studies should consider analyzing RTs in more detail and then decide which metric of the central tendency is the most suitable or report mean and median RTs for a more transparent inside in the data distribution.
4.5. Limitations & Directions for Further Research
The results of the study should be interpreted with several limitations in mind. Firstly, although RTs have already been selected as parameters in this study, which provide a more detailed statement than total times [53], this is the only parameter used to describe agility performance. Further analyses of reaction times (time from stimuli presentation to movement initialization), decision accuracy, acceleration and deceleration velocities [53] or visual screening behavior [40] could be used to make detailed statements about the behavior. Secondly, all measurements occurred indoors on the surface of the affiliated university’s SpeedCourt system (GlobalSpeed GmbH, Hembach, Germany). This synthetic sports hall surface only mirrors the natural sports surface of some included indoor sports athletes like handball or basketball athletes. For other participants which perform outdoor sports, like soccer players, the surface was kind of unusual. It could have led to adapted running behavior due to unknown ground conditions or missing experiences on the ground when changing direction quickly [54,55].
As the Fitlight system allows custom configurations, the complexity of the requirements for the athletes can be increased to advance further approximations to the sporting environment. Different stimuli can be programmed for processing, allowing the testing of simple reactions and choice reactions, inhibition and further complex tasks. This would enable the mapping of athletes’ decision-making behavior in more complex situations [13]. To enhance ecological validity further, future tests could be conducted outside the laboratory in the athletes’ actual sports environment, which is possible due to the portability of the measurement equipment. This approach would encourage more natural running behavior, as the athletes would perform the test on the same surface where they typically train and compete.
5. Conclusions
In the present study, we showed that the newly developed FAST can discriminate between GS and NGS athletes and is therefore a valid test battery for game sport specific agility. In addition, we were able to show that the level of reliability varies depending on the consideration of mean or median RT values, which results in different classifications of test-retest reliability (moderate to good) and varying statements about usefulness. As a result, it should be considered in future whether the use of mean and median values should be used to describe performance.
Author Contributions
Conceptualization, Romina Müller, Daniel Büchel and Jochen Baumeister; Data curation, Romina Müller and Daniel Büchel; Formal analysis, Romina Müller and Daniel Büchel; Investigation, Romina Müller; Methodology, Romina Müller, Daniel Büchel and Jochen Baumeister; Project administration, Romina Müller, Daniel Büchel and Jochen Baumeister; Resources, Romina Müller, Daniel Büchel and Jochen Baumeister; Software, Romina Müller and Daniel Büchel; Supervision, Romina Müller, Daniel Büchel and Jochen Baumeister; Validation, Romina Müller and Daniel Büchel; Visualization, Romina Müller; Writing–original draft, Romina Müller, Daniel Büchel and Jochen Baumeister; Writing–review & editing, Romina Müller and Daniel Büchel.
Funding
This research received no external funding.
Institutional Review Board Statement
The study was conducted in accordance with the Declaration of Helsinki, and approved by the Ethics Committee of Paderborn University (63/2023 and 14 December 2023).
Informed Consent Statement
Informed consent was obtained from all subjects involved in the study.
Data Availability Statement
The data that support the findings of this study are available from the corresponding author upon reasonable request.
Acknowledgments
I acknowledge support for the publication costs by the Open Access Publication Fund of Paderborn University. The author (R.M.) would like to express her gratitude to Paderborn University for supporting this research through the Gender Research Scholarship. The authors thank all participants for their time, effort, and valuable contribution to the study.
Conflicts of Interest
The authors declare no conflicts of interest.
Abbreviations
The following abbreviations are used in this manuscript:
| FAST | Functional Agility Square Test |
| GS | Game Sports |
| NGS | Non-Game Sports |
| FAST_COG | FAST Cognitive |
| FAST_MOT | FAST Motor |
| FAST_SAT | FAST Simple Agility Test |
| RT | Response Time |
| ICC | Intraclass-Correlation-Coefficients |
| COD | Change of Direction |
| RAI | Reactive Agility Index |
| SD | Standard Deviation |
| CoV | Coefficient of Variation |
| TE | Typical Error |
| SWC | Smallest Worthwhile Change |
| LB | Lower Bound |
| UB | Upper Bound |
| SEM | Standard Error of Measurement |
References
- Sheppard, J.M.; Young, W.B. Agility Literature Review: Classifications, Training and Testing. J. Sports Sci. 2006, 24, 919–932. [Google Scholar] [CrossRef] [PubMed]
- Paul, D.J.; Gabbett, T.J.; Nassis, G.P. Agility in Team Sports: Testing, Training and Factors Affecting Performance. Sports Med. 2016, 46, 421–442. [Google Scholar] [CrossRef]
- Young, W.; Dos’Santos, T.; Harper, D.; Jefferys, I.; Talpey, S. Agility in Invasion Sports: Position Stand of the IUSCA. Int. J. Strength Cond. 2022, 2. [Google Scholar] [CrossRef]
- Young, W.B.; James, R.; Montgomery, I. Is Muscle Power Related to Running Speed with Changes of Direction? J. Sports Med. Phys. Fitness 2002, 42, 282–288. [Google Scholar] [PubMed]
- Young, W.B.; Dawson, B.; Henry, G.J. Agility and Change-of-Direction Speed Are Independent Skills: Implications for Training for Agility in Invasion Sports. Int. J. Sports Sci. Coach. 2015, 10, 159–169. [Google Scholar] [CrossRef]
- Casanova, F.; Oliveira, J.; Williams, M.; Garganta, J. Expertise and Perceptual-Cognitive Performance in Soccer: A Review Perícia e Rendimento Perceptivo-Cognitivo No Futebol: Uma Revisão Da Literatura. Rev. Port. Ciênc. Desporto 2009, 9, 115–122. [Google Scholar] [CrossRef]
- Williams, A.M. Perceptual Skill in Soccer: Implications for Talent Identification and Development. J. Sports Sci. 2000, 18, 737–750. [Google Scholar] [CrossRef] [PubMed]
- Bloomfield, J.; Polman, R.; O’Donoghue, P. Physical Demands of Different Positions in FA Premier League Soccer. J. Sports Sci. Med. 2007, 6, 63–70. [Google Scholar]
- Taylor, J.B.; Wright, A.A.; Dischiavi, S.L.; Townsend, M.A.; Marmon, A.R. Activity Demands During Multi-Directional Team Sports: A Systematic Review. Sports Med. 2017, 47, 2533–2551. [Google Scholar] [CrossRef]
- Willberg, C.; Kohler, A.; Zentgraf, K. Construct Validity and Applicability of a Team-Sport-Specific Change of Direction Test. J. Hum. Kinet. 2023, 85, 115–126. [Google Scholar] [CrossRef]
- Huijgen, B.C.H.; Leemhuis, S.; Kok, N.M.; Verburgh, L.; Oosterlaan, J.; Elferink-Gemser, M.T.; Visscher, C. Cognitive Functions in Elite and Sub-Elite Youth Soccer Players Aged 13 to 17 Years. PLOS ONE 2015, 10, e0144580. [Google Scholar] [CrossRef] [PubMed]
- Born, D.-P.; Zinner, C.; Düking, P.; Sperlich, B. Multi-Directional Sprint Training Improves Change-Of-Direction Speed and Reactive Agility in Young Highly Trained Soccer Players. J. Sports Sci. Med. 2016, 15, 314–319. [Google Scholar]
- Büchel, D.; Gokeler, A.; Heuvelmans, P.; Baumeister, J. Increased Cognitive Demands Affect Agility Performance in Female Athletes - Implications for Testing and Training of Agility in Team Ball Sports. Percept. Mot. Skills 2022, 129, 1074–1088. [Google Scholar] [CrossRef]
- Düking, P.; Born, D.-P.; Sperlich, B. The SpeedCourt: Reliability, Usefulness, and Validity of a New Method to Determine Change-of-Direction Speed. Int. J. Sports Physiol. Perform. 2016, 11, 130–134. [Google Scholar] [CrossRef]
- Friebe, D.; Hülsdünker, T.; Giesche, F.; Banzer, W.; Pfab, F.; Haser, C.; Vogt, L. Reliability and Usefulness of the Skillcourt as a Computerized Agility and Motor-Cognitive Testing Tool. Med. Sci. Sports Exerc. 2023; Publish Ahead of Print. [Google Scholar] [CrossRef]
- Friebe, D.; Sieland, J.; Both, H.; Giesche, F.; Haser, C.; Hülsdünker, T.; Pfab, F.; Vogt, L.; Banzer, W. Validity of a Motor-Cognitive Dual-Task Agility Test in Elite Youth Football Players. Eur. J. Sport Sci. 2024, 24, 1056–1066. [Google Scholar] [CrossRef] [PubMed]
- Hülsdünker, T.; Friebe, D.; Giesche, F.; Vogt, L.; Pfab, F.; Haser, C.; Banzer, W. Validity of the SKILLCOURT® Technology for Agility and Cognitive Performance Assessment in Healthy Active Adults. J. Exerc. Sci. Fit. 2023, 21, 260–267. [Google Scholar] [CrossRef]
- Ballmann, C.G.; Rogers, R.R. American Football Headgear Impairs Visuomotor Drill Performance in Division I NCAA Football Athletes. J. Funct. Morphol. Kinesiol. 2024, 9, 169. [Google Scholar] [CrossRef]
- Jansen, M.; Elferink-Gemser, M.; Hoekstra, A.; Faber, I.; Huijgen, B. Design of a Tennis-Specific Agility Test (TAT) for Monitoring Tennis Players. J. Hum. Kinet. 2021, 80, 239–250. [Google Scholar] [CrossRef] [PubMed]
- Lima, R.; Rico-González, M.; Pereira, J.; Caleiro, F.; Clemente, F. Reliability of a Reactive Agility Test for Youth Volleyball Players. Pol. J. Sport Tour. 2021, 28, 8–12. [Google Scholar] [CrossRef]
- Mackala, K.; Vodičar, J.; Žvan, M.; Križaj, J.; Stodolka, J.; Rauter, S.; Šimenko, J.; Čoh, M. Evaluation of the Pre-Planned and Non-Planed Agility Performance: Comparison between Individual and Team Sports. Int. J. Environ. Res. Public. Health 2020, 17, 975. [Google Scholar] [CrossRef]
- Rauter, S.; Coh, M.; Vodicar, J.; Zvan, M.; Krizaj, J.; Simenko, J.; Szmajda, L.; Mackala, K. Analysis of Reactive Agility and Change-of-Direction Speed between Soccer Players and Physical Education Students. Hum. Mov. 2018, 19, 68–74. [Google Scholar] [CrossRef]
- Morral-Yepes, M.; Moras, G.; Bishop, C.; Gonzalo-Skok, O. Assessing the Reliability and Validity of Agility Testing in Team Sports: A Systematic Review. J. Strength Cond. Res. 2020, 36, 2035–2049. [Google Scholar] [CrossRef]
- Smith, E.M.; Sherman, D.A.; Duncan, S.; Murray, A.; Chaput, M.; Murray, A.; Bazett-Jones, D.M.; Norte, G.E. Test–Retest Reliability and Visual Perturbation Performance Costs During 2 Reactive Agility Tasks. J. Sport Rehabil. 2024, 1–8. [Google Scholar] [CrossRef]
- Wilke, J.; Vogel, O.; Ungricht, S. Can We Measure Perceptual-Cognitive Function during Athletic Movement? A Framework for and Reliability of a Sports-Related Testing Battery. Phys. Ther. Sport 2020, 43, 120–126. [Google Scholar] [CrossRef] [PubMed]
- Vilagut, G. Test-Retest Reliability. In Encyclopedia of Quality of Life and Well-Being Research; Michalos, A.C., Ed.; Springer Netherlands: Dordrecht, 2014; pp. 6622–6625. ISBN 978-94-007-0753-5. [Google Scholar]
- Rousselet, G.A.; Wilcox, R.R. Reaction Times and Other Skewed Distributions: Problems with the Mean and the Median. Meta-Psychol. 2020, 4. [Google Scholar] [CrossRef]
- Čoh, M.; Vodičar, J.; Žvan, M.; Šimenko, J.; Stodolka, J.; Rauter, S.; Maćkala, K. Are Change-of-Direction Speed and Reactive Agility Independent Skills Even When Using the Same Movement Pattern? J. Strength Cond. Res. 2018, 32, 1929–1936. [Google Scholar] [CrossRef] [PubMed]
- Sekulic, D.; Krolo, A.; Spasic, M.; Uljevic, O.; Peric, M. The Development of a New Stop’n’go Reactive-Agility Test. J. Strength Cond. Res. 2014, 28, 3306. [Google Scholar] [CrossRef]
- Faul, F.; Erdfelder, E.; Lang, A.-G.; Buchner, A. G*Power 3: A Flexible Statistical Power Analysis Program for the Social, Behavioral, and Biomedical Sciences. Behav. Res. Methods 2007, 39, 175–191. [Google Scholar] [CrossRef]
- Koo, T.K.; Li, M.Y. A Guideline of Selecting and Reporting Intraclass Correlation Coefficients for Reliability Research. J. Chiropr. Med. 2016, 15, 155–163. [Google Scholar] [CrossRef]
- Bujang, M.A.; Baharum, N. A Simplified Guide to Determination of Sample Size Requirements for Estimating the Value of Intraclass Correlation Coefficient: A Review. 2017. [Google Scholar]
- Atkinson, G.; Nevill, A.M. Statistical Methods For Assessing Measurement Error (Reliability) in Variables Relevant to Sports Medicine. Sports Med. 1998, 26, 217–238. [Google Scholar] [CrossRef]
- Hopkins, W.G.; Schabort, E.J.; Hawley, J.A. Reliability of Power in Physical Performance Tests. Sports Med. 2001, 31, 211–234. [Google Scholar] [CrossRef] [PubMed]
- Hopkins, W.G. How to Interpret Changes in an Athletic Performance Test. Sportscience 2004, 8, 1–7. [Google Scholar]
- Hopkins, W.G. Measures of Reliability in Sports Medicine and Science. Sports Med. 2000, 30, 1–15. [Google Scholar] [CrossRef] [PubMed]
- Popowczak, M.; Domaradzki, J.; Rokita, A.; Zwierko, M.; Zwierko, T. Predicting Visual-Motor Performance in a Reactive Agility Task from Selected Demographic, Training, Anthropometric, and Functional Variables in Adolescents. Int. J. Environ. Res. Public. Health 2020, 17, 5322. [Google Scholar] [CrossRef]
- Zwierko, M.; Jedziniak, W.; Popowczak, M.; Rokita, A. Reactive Agility in Competitive Young Volleyball Players: A Gender Comparison of Perceptual-Cognitive and Motor Determinants. J. Hum. Kinet. 2023, 85, 87–96. [Google Scholar] [CrossRef]
- Zwierko, T.; Nowakowska, A.; Jedziniak, W.; Popowczak, M.; Domaradzki, J.; Kubaszewska, J.; Kaczmarczyk, M.; Ciechanowicz, A. Contributing Factors to Sensorimotor Adaptability in Reactive Agility Performance in Youth Athletes. J. Hum. Kinet. 2022, 83, 39–48. [Google Scholar] [CrossRef]
- Bekris, E.; Gissis, I.; Ispyrlidis, I.; Mylonis, E.; Axeti, G. Combined Visual and Dribbling Performance in Young Soccer Players of Different Expertise. Res. Sports Med. 2018, 26, 43–50. [Google Scholar] [CrossRef] [PubMed]
- Altmann, S.; Ringhof, S.; Neumann, R.; Woll, A.; Rumpf, M.C. Validity and Reliability of Speed Tests Used in Soccer: A Systematic Review. PLOS ONE 2019, 14, e0220982. [Google Scholar] [CrossRef]
- Tajik, M.; Azarbayjani, M.A.; Peeri, M. A Review of Reactive and Non-Reactive Agility Tests Concerning Neurologic Aspects. Thrita 2022, 11. [Google Scholar] [CrossRef]
- Dos’Santos, T.; Thomas, C.; McBurnie, A.; Comfort, P.; Jones, P.A. Biomechanical Determinants of Performance and Injury Risk During Cutting: A Performance-Injury Conflict? Sports Med. 2021, 51, 1983–1998. [Google Scholar] [CrossRef]
- Young, W.; Rayner, R.; Talpey, S. It’s Time to Change Direction on Agility Research: A Call to Action. Sports Med. - Open 2021, 7, 12. [Google Scholar] [CrossRef] [PubMed]
- Parada, F.J. Understanding Natural Cognition in Everyday Settings: 3 Pressing Challenges. Front. Hum. Neurosci. 2018, 12, 386. [Google Scholar] [CrossRef]
- Altmann, S.; Neumann, R.; Härtel, S.; Kurz, G.; Stein, T.; Woll, A. Agility Testing in Amateur Soccer: A Pilot Study of Selected Physical and Perceptual-Cognitive Contributions. PLOS ONE 2021, 16, e0253819. [Google Scholar] [CrossRef]
- Fiorilli, G.; Mitrotasios, M.; Iuliano, E.; Pistone, E.M.; Aquino, G.; Calcagno, G.; DI Cagno, A. Agility and Change of Direction in Soccer: Differences According to the Player Ages. J. Sports Med. Phys. Fitness 2017, 57, 1597–1604. [Google Scholar] [CrossRef] [PubMed]
- Gabbett, T.J.; Kelly, J.N.; Sheppard, J.M. Speed, Change of Direction Speed, and Reactive Agility of Rugby League Players. J. Strength Cond. Res. 2008, 22, 174–181. [Google Scholar] [CrossRef]
- McGrath, S.; Zhao, X.; Qin, Z.Z.; Steele, R.; Benedetti, A. One-sample Aggregate Data Meta-analysis of Medians. Stat. Med. 2019, 38, 969–984. [Google Scholar] [CrossRef] [PubMed]
- Khorana, A.; Pareek, A.; Ollivier, M.; Madjarova, S.J.; Kunze, K.N.; Nwachukwu, B.U.; Karlsson, J.; Marigi, E.M.; Williams, R.J. Choosing the Appropriate Measure of Central Tendency: Mean, Median, or Mode? Knee Surg. Sports Traumatol. Arthrosc. 2023, 31, 12–15. [Google Scholar] [CrossRef]
- Petrie, A.; Sabin, C. Medical Statistics at a Glance, 2nd ed.; Wiley-Blackwell: Malden, Mass, 2007; ISBN 978-1-4051-2780-6. [Google Scholar]
- Field, A. Discovering Statistics Using IBM SPSS Statistics; 5th edition.; SAGE Publications: Thousand Oaks, CA, 2017; ISBN 978-1-5264-1952-1. [Google Scholar]
- Nimphius, S.; Callaghan, S.J.; Bezodis, N.E.; Lockie, R.G. Change of Direction and Agility Tests: Challenging Our Current Measures of Performance. Strength Cond. J. 2018, 40, 26–38. [Google Scholar] [CrossRef]
- Krolo, A.; Gilic, B.; Foretic, N.; Pojskic, H.; Hammami, R.; Spasic, M.; Uljevic, O.; Versic, S.; Sekulic, D. Agility Testing in Youth Football (Soccer)Players; Evaluating Reliability, Validity, and Correlates of Newly Developed Testing Protocols. Int. J. Environ. Res. Public. Health 2020, 17, 294. [Google Scholar] [CrossRef]
- Lambrichts, Y.; Jaspers, A.; Meeus, N. Surface Traction Properties Affect Agility Performance and Perception in Female Soccer Players. Sport Perform. Sci. Rep. 2024, 228, 1–5. [Google Scholar]
Figure 1.
Schematic representation of the Functional Agility Square Test (FAST). (A) Smaller square (0.6 m x 0.6 m, diagonal of 0.85 m) shows the setup of the FAST cognitive (FAST_COG) and starting position for FAST motor (FAST_MOT) and FAST “Simple Agility Test” (FAST_SAT). Outer square (3.5 m x 3.5 m, diagonal of 5.0 m) shows the setup of the FAST_MOT and FAST_SAT (B) Realistic demonstration of FAST_MOT and FAST_SAT setup with the participant standing in the middle position. In each corner two lights were placed with the front one facing the side to step and the rear one facing the center position. Each condition was performed three times.
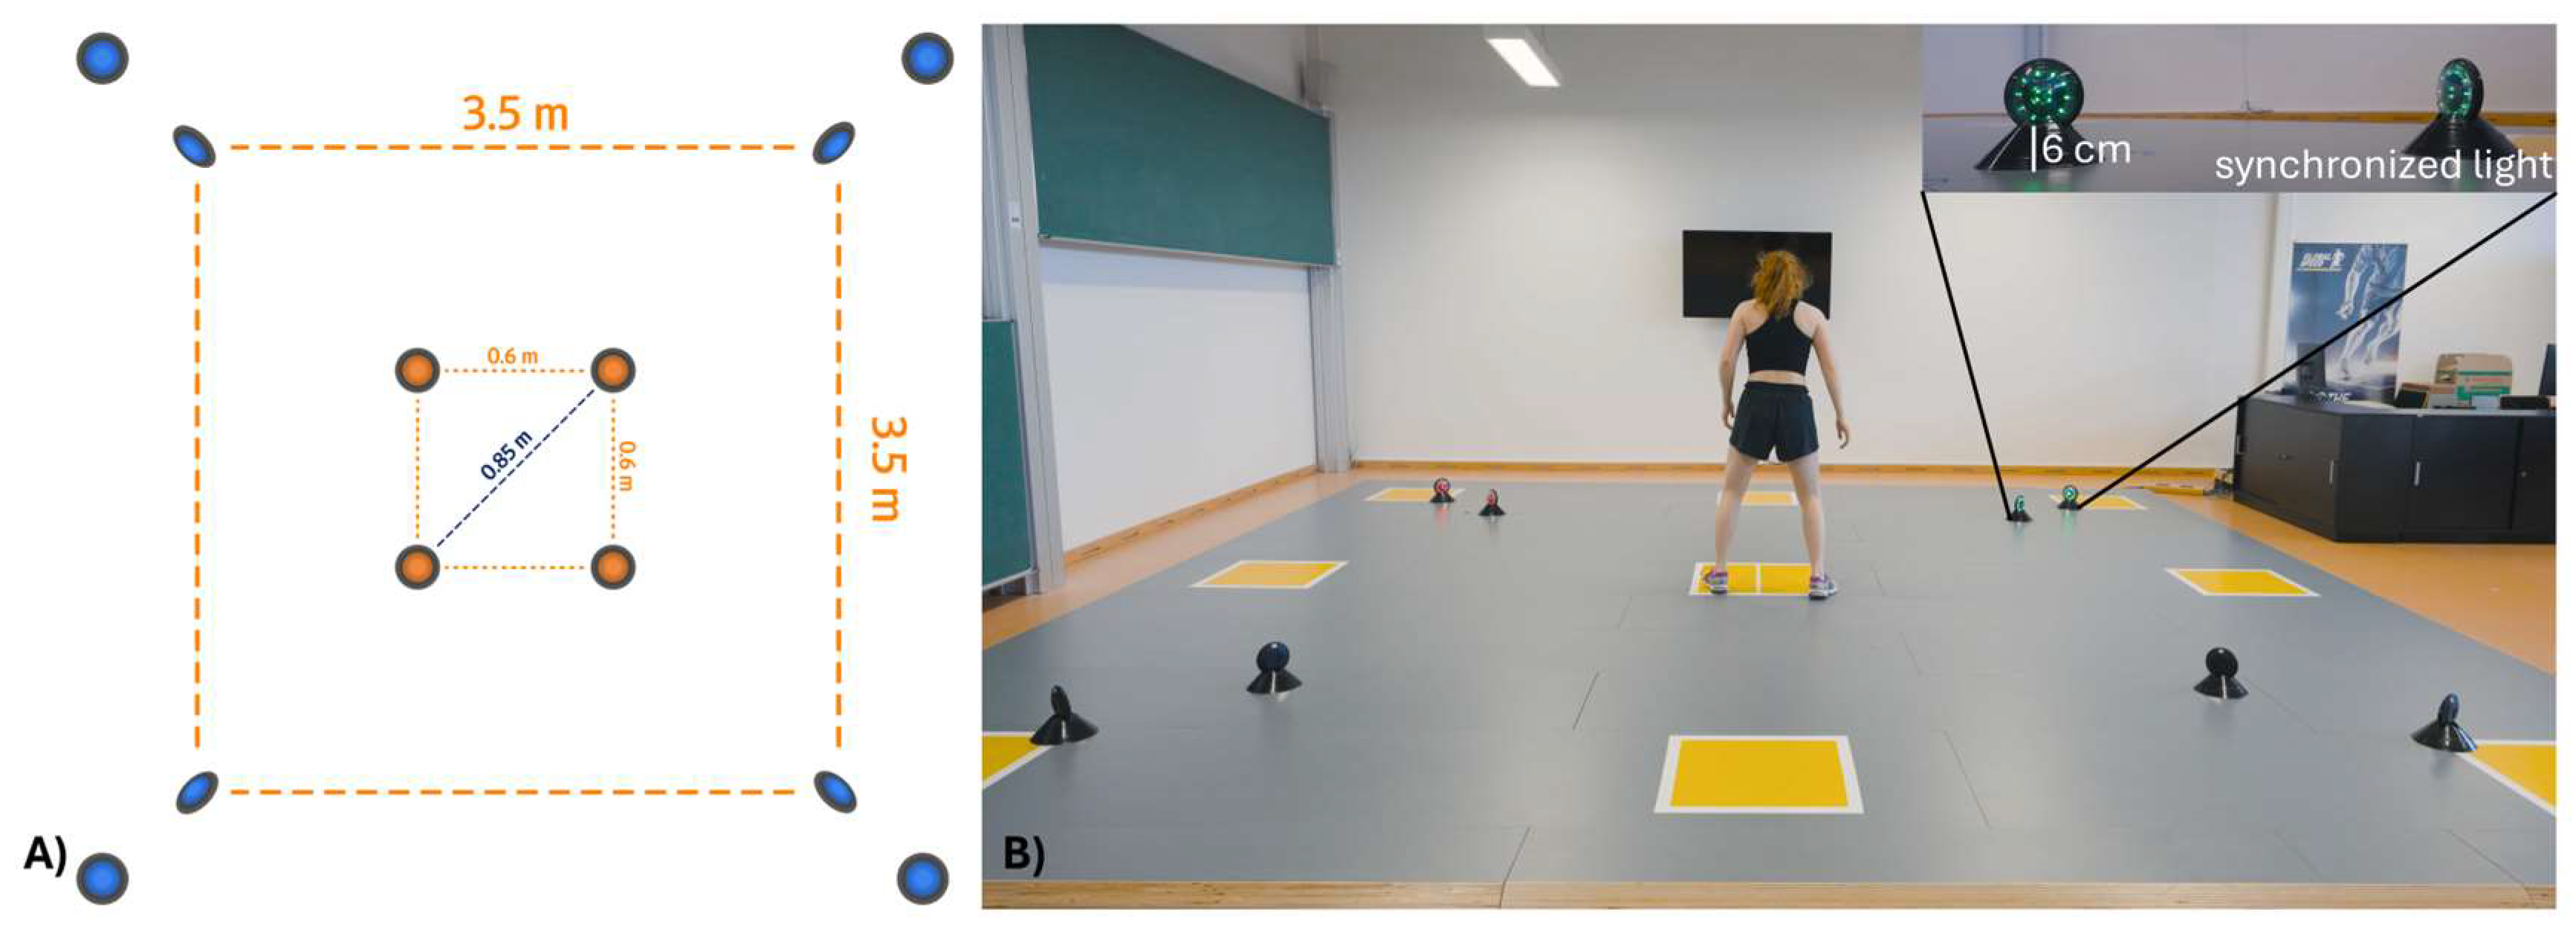
Figure 2.
Overview of the experimental protocol. For validation purpose participants performed the cognitive (FAST_COG), motor (FAST_MOT), and “Simple Agility Test” (FAST_SAT) three times in one session. For reliability testing, participants came in on three days with at least 7 days break between the sessions. Reliability sessions consisted of three trials of the FAST_MOT and the FAST_SAT in a randomized order.
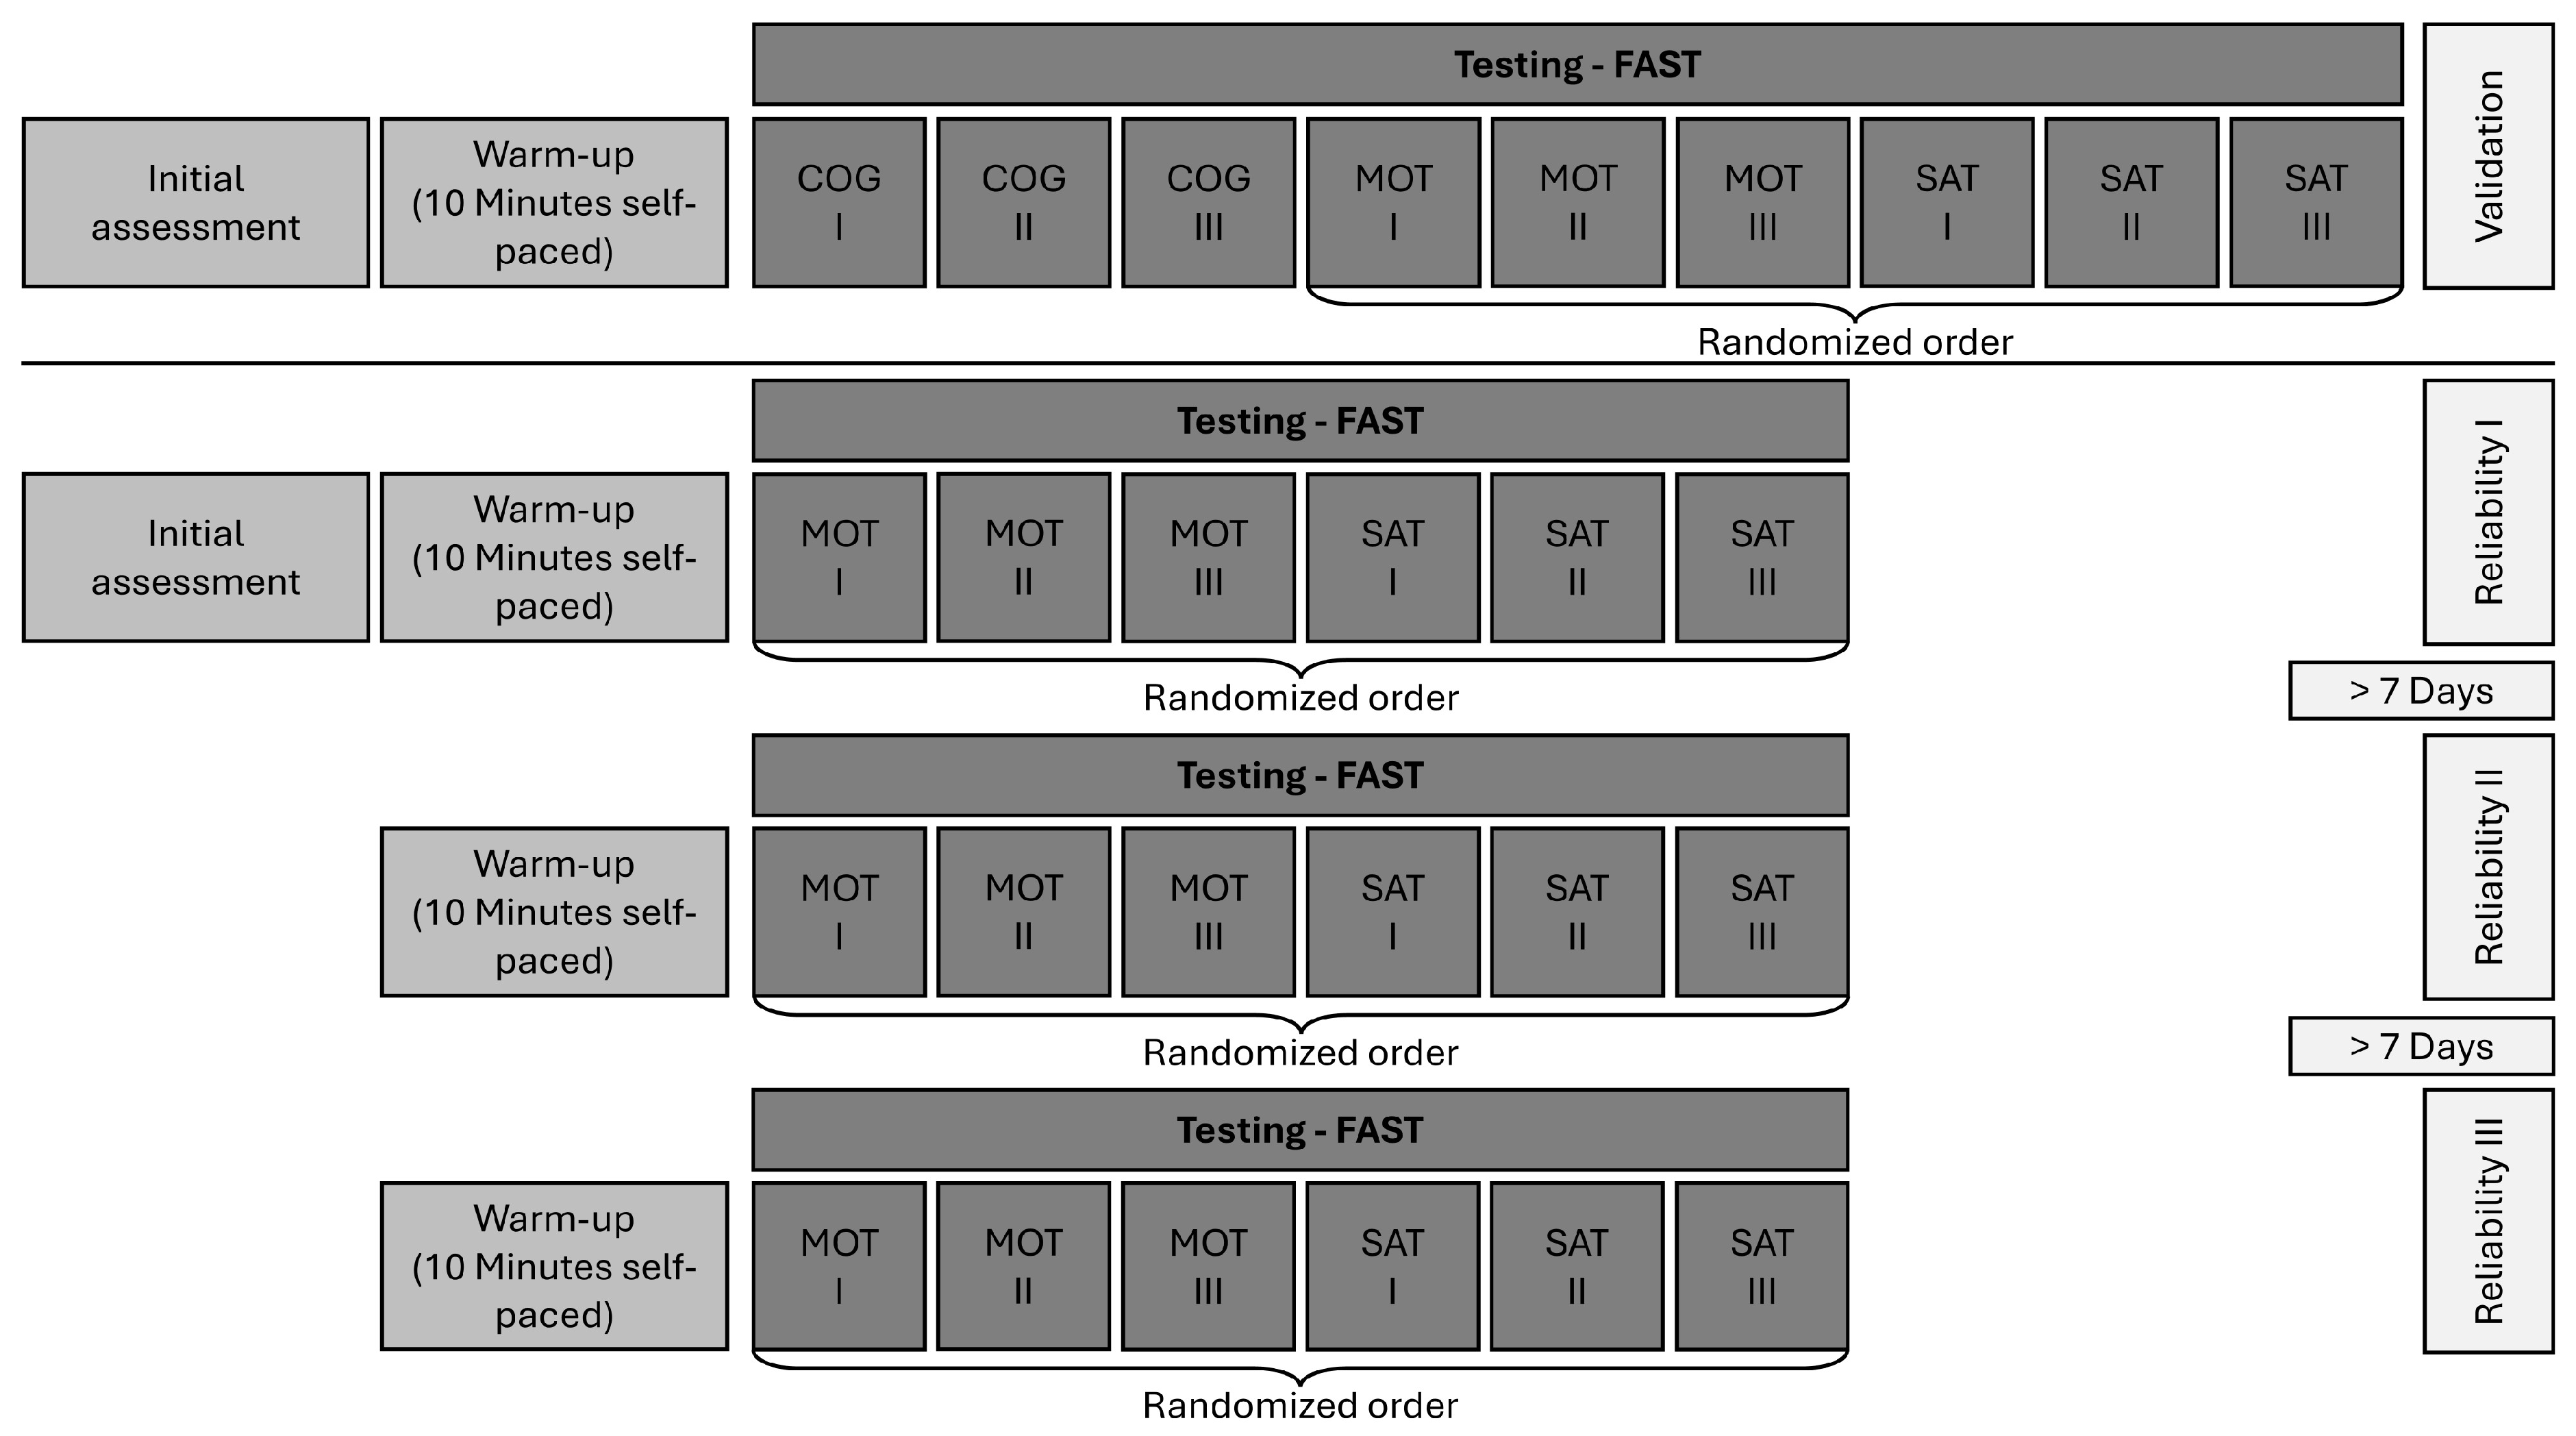

Table 1.
Overview of demographic information of the sample of game sports (n = 22) and non-game sports (n = 22) athletes included in discriminant validity analysis in the first three columns. For reliability demographic information of the sample of athletes (n = 36) included in test-retest reliability analysis are displayed in the last column.
| Validation | Reliability | |||
| Game sports | Non-Game sports | Game sports | ||
| mean ± SD | p | mean ± SD | ||
| Female/Male | 22/0 | 22/0 | 20/16 | |
| Age (years) | 23.4 ± 3.0 | 23.7 ± 3.4 | .709 | 23.39 ± 2.93 |
| Height (cm) | 169.4 ± 5.3 | 166.3 ± 6.8 | .098 | 175.36 ± 8.41 |
| Weight (kg) | 63.2 ± 8.7 | 59.8 ± 11.2 | .267 | 69.09 ± 10.10 |
| Sporting experience (years) | 15.8 ± 3.5 | 11.8 ± 5.7 | .009 * | 14.23 ± 5.51 |
| Sports | Soccer (18) Handball (3) Ultimate Frisbee (1) |
Track & Field (6) Dance (3) Fitness (3) Gymnastics (3) Swimming (2) CrossFit (1) Equestrian sports (1) Kickboxing (1) Rhythmic gymnastics (1) |
Soccer (13/14) Handball (4/0) Basketball (0/1) American Football (0/1) Ultimate Frisbee (1/0) Volleyball (0/1) Tennis (0/1) |
|
* Significantly different (p < .05).
Table 2.
Comparison of mean and median motor response times between game sports (GS; n = 22) and non-game sports athletes (NGS; n = 22) in the cognitive (COG), motor (MOT), simple agility test (SAT) of the Functional Agility Square Test (FAST) and the reactive agility index (RAI).
Table 2.
Comparison of mean and median motor response times between game sports (GS; n = 22) and non-game sports athletes (NGS; n = 22) in the cognitive (COG), motor (MOT), simple agility test (SAT) of the Functional Agility Square Test (FAST) and the reactive agility index (RAI).
| MEAN | MEDIAN | ||||||
| mean | SD | p | mean | SD | p | ||
| FAST_COG | GS | 523.15 | 45.44 | .023MWU * | 529 | 42.77 | .009 * |
| NGS | 575.78 | 78.09 | 573.55 | 73.02 | |||
| FAST_MOT | GS | 1097.37 | 89.79 | .013 * | 1094.45 | 90.67 | .018 * |
| NGS | 1179.11 | 139.06 | 1173.36 | 144.78 | |||
| FAST_SAT | GS | 1458.71 | 101.62 | .010 * | 1410.82 | 82.62 | .023 * |
| NGS | 1546.23 | 137.21 | 1480.05 | 134.17 | |||
| RAI | GS | 361.34 | 110.86 | .438 | 316.36 | 99.17 | .382 |
| NGS | 367.12 | 131.79 | 306.68 | 112.13 | |||
Abbreviations. FAST_COG: Functional Agility Square Test Cognitive; FAST_MOT: Functional Agility Square Test Motor; FAST_SAT: Functional Agility Square Test Simple Agility Test; GS: game sports; MWU: Mann-Whitney U Test; NGS: non-game sports; RAI: Reactive Agility Index; * significantly different (p < .05).
Table 3.
Test-Retest Reliability for mean response times in milliseconds for Motor (FAST_MOT), Simple Agility Test (FAST_SAT) and Reactive Agility Index (RAI) of three sessions of game sports athletes (n = 36).
Table 3.
Test-Retest Reliability for mean response times in milliseconds for Motor (FAST_MOT), Simple Agility Test (FAST_SAT) and Reactive Agility Index (RAI) of three sessions of game sports athletes (n = 36).
| MEAN | ||||||||||
| Session I RT | Session II RT |
ICC [LB UB] |
SEM [LB UB] |
CoV(%) [LB UB] | Session II RT | Session III RT |
ICC [LB UB] |
SEM [LB UB] |
CoV(%) [LB UB] | |
| FAST_MOT | 1088.69 | 1058.70 | 0.60 [0.35-0.77] |
78.17 [99.95–58.90] |
7.28 [9.31-5.49] |
1058.70 | 1032.85 | 0.74 [0.54-0.86] |
59.36 [78.48–43.77] |
5.68 [7.50-4.19] |
| FAST_SAT | 1427.67 | 1389.99 | 0.57 [0.29–0.75] |
68.91 [88.05–51.94] |
4.89 [6.25–3.69] |
1389.99 | 1369.75 | 0.50 [0.22–0.71] |
76.63 [96.18–58.49] |
5.55 [6.97–4.24] |
| RAI | 338.98 | 331.29 | 0.56 [0.28–0.75] |
85.03 [108.35–64.22] |
25.37 [32.33-19.16] |
331.29 | 336.90 | 0.44 [0.13–0.67] |
84.10 [104.77–64.56] |
25.17 [31.36–19.32] |
Abbreviations. CoV: Coefficient of Variation; FAST_MOT: Functional Agility Square Test “Motor”; FAST_SAT: Functional Agility Square Test “Simple Agility Test”; ICC: Intraclass Correlation Coefficient; LB: Lower Bound; RAI: Reactive Agility Index; RT: Response Time; SEM: standard error of measurement; UB: Upper Bound.
Table 4.
Test-Retest Reliability for median response times for Motor (FAST_MOT), Simple Agility Test (FAST_SAT) and Reactive Agility Index (RAI) of three sessions of game sports athletes (n = 36).
Table 4.
Test-Retest Reliability for median response times for Motor (FAST_MOT), Simple Agility Test (FAST_SAT) and Reactive Agility Index (RAI) of three sessions of game sports athletes (n = 36).
| MEDIAN | ||||||||||
| Session I RT | Session II RT |
ICC [LB UB] |
SEM [LB UB] |
CoV(%) [LB UB] | Session II RT | Session III RT |
ICC [LB UB] |
SEM [LB UB] |
CoV(%) [LB UB] | |
| FAST_MOT | 1058 | 1059 | 0.71 [0.51-0.84] |
60.47 [79.22–44.84] |
5.61 [7.35-4.16] |
1059 | 1033 | 0.83 [0.67-0.91] |
47.20 [65.38-33.88] |
4.48 [6.21-3.22] |
| FAST_SAT | 1362 | 1358 | 0.77 [0.59–0.87] |
43.65 [57.79–32.16] |
3.20 [4.24–2.36] |
1358 | 1356 | 0.59 [0.33–0.76] |
61.12 [77.87–46.16] |
4.54 [5.78–3.43] |
| RAI | 287 | 275 | 0.57 [0.30-0.75] |
68.06 [86.72–51.40] |
23.87 [30.41–18.02] |
275 | 321 | 0.44 [0.14–0.67] |
70.20 [87.56–58.83] |
23.98 [29.91–18.39] |
Abbreviations. CoV: Coefficient of Variation; FAST_MOT: Functional Agility Square Test “Motor”; FAST_SAT: Functional Agility Square Test “Simple Agility Test”; ICC: Intraclass Correlation Coefficient; LB: Lower Bound; RAI: Reactive Agility Index; RT: Response Time; SEM: standard error of measurement; UB: Upper Bound.
Table 5.
Measures of Usefulness of the Motor (FAST_MOT) and Simple Agility Test (FAST_SAT) of the three sessions for mean and median response times.
Table 5.
Measures of Usefulness of the Motor (FAST_MOT) and Simple Agility Test (FAST_SAT) of the three sessions for mean and median response times.
| MEAN | MEDIAN | ||||||
| Parameter | Session I | Session II | Session III | Session I | Session II | Session III | |
| FAST_MOT | TE SWC 0.5 Rating |
134.7 104.3 Marginal |
89.9 73.3 Marginal |
55.1 61.3 Good |
56.8 63.9 Good |
46.6 57.5 Good |
40.4 58.9 Good |
| FAST_SAT | TE SWC 0.5 Rating |
122.3 76.4 Marginal |
104.1 67.5 Marginal |
78.7 70.9 Marginal |
82.2 55.8 Marginal |
78.7 59.3 Marginal |
44.4 54.5 Good |
Abbreviations. FAST_MOT: Function Agility Square Test “Motor”; FAST_SAT: Functional Agility Square Test “Simple Agility Test”; SWC 0.5: Smallest Worthwhile Change 0.5; TE: Typical Error.
Disclaimer/Publisher’s Note: The statements, opinions and data contained in all publications are solely those of the individual author(s) and contributor(s) and not of MDPI and/or the editor(s). MDPI and/or the editor(s) disclaim responsibility for any injury to people or property resulting from any ideas, methods, instructions or products referred to in the content. |
© 2025 by the authors. Licensee MDPI, Basel, Switzerland. This article is an open access article distributed under the terms and conditions of the Creative Commons Attribution (CC BY) license (http://creativecommons.org/licenses/by/4.0/).
Copyright: This open access article is published under a Creative Commons CC BY 4.0 license, which permit the free download, distribution, and reuse, provided that the author and preprint are cited in any reuse.


