Submitted:
19 March 2025
Posted:
20 March 2025
You are already at the latest version
Abstract
(1) Background: This study aims to analyze the defoliation and boll opening performance of 123 upland cotton germplasm resources after spraying defoliant, using multispectral data to select relevant vegetation indices and identify germplasm re-sources sensitive to defoliants, providing methods for cotton variety improvement and high-quality parental resources. (2) Methods: 123 historical upland cotton germplasm resources from Xinjiang were selected, and the defoliation and boll opening of cotton leaves were investigated at 0, 4, 8, 12, 16, and 20 days after defoliant application. Sim-ultaneously, multispectral digital images were collected using drones to obtain 12 vegetation indices. Based on defoliation rate, the optimal vegetation index was selected, and defoliant-sensitive germplasm resources were identified. (3) Results: The most significant difference in defoliation rate of cotton germplasm resources occurred 16 days after application. Cluster analysis grouped the 123 breeding materials into three categories, with Class I showing the best defoliation effect. Among the 12 vegetation indices, the Plant Senescence Reflectance Index (PSRI) has the highest correlation coef-ficient with the defoliation rate; and when the PSRI value is higher, the defoliation ef-fect of the material is better. Using drone multispectral technology, 15 defoli-ant-sensitive cotton materials were identified, with defoliation rates exceeding 85%, boll opening rates ranging from 76.67% to 98.04%, and PSRI values between 0.1607 and 0.1984.(4) Conclusions: The study found that vegetation indices with sensitive re-sponses can serve as effective indicators for evaluating the sensitivity of cotton breed-ing materials to defoliants. The combined analysis of traditional survey methods and PSRI classification demonstrates that using drone multispectral technology as a sub-stitute for manual methods in large-scale, rapid monitoring and selection of cotton breeding materials with excellent defoliation effects is feasible.
Keywords:
Cotton
; UAV
; Multispectral
; Defoliation rate
; Vegetation index
1. Introduction
Cotton is an important global economic crop. Xinjiang is the largest cotton-producing area in China. In 2024, the national cotton output was 6.164 million tons. Among them, the cotton output in Xinjiang was 5.686 million tons, accounting for 92.2% of the national total cotton output [1].With rising costs and the development of agricultural mechanization, the area planted with machine-harvested cotton in Xinjiang has expanded, forming a new planting model that integrates equipment and technology. The mechanization rate of plowing, sowing, and harvesting has reached 97%, effectively ensuring a high cotton yield [2].During the cotton harvesting stage, there are issues such as increased labor costs, low harvesting efficiency, and extended harvesting time due to labor shortages [3]. With the development of mechanized cotton-picking technology, machine-picked cotton has greatly alleviated the labor pressure.The mature mechanized cotton-picking technology has promoted the rapid development of the whole-process mechanization and precision agriculture of cotton production in China. Popularizing machine-picked cotton has become the trend of the future development of the cotton industry, and chemical defoliation and ripening is one of the key technologies to ensure the smooth completion of machine-picked cotton[4].
In the early stages of cotton harvesting, defoliants are used to promote ripening and address the problem of late-maturing cotton with excessive green growth. Scientific and reasonable field management measures, along with the correct use of defoliants, are fundamental to achieving high yield and quality cotton [5]. During the mechanized cotton harvesting process, the application of defoliants for defoliation and ripening is an indispensable key step. The innovation of machine-harvested cotton germplasm resources and the breeding of new varieties are critical for the development of the industry. Defoliant sensitivity, as an important breeding index, has placed higher demands on breeding work. Currently, agricultural monitoring is gradually achieving an integrated approach that combines space, air, and ground, focusing on comprehensive monitoring of resources, environment, and crop growth status, aimed at providing strong support for the smart development of agriculture. Unmanned Aerial Vehicle (UAV) remote sensing, with its advantages of short cycle, simple operation, dynamic data acquisition and low cost [6], has become a new trend and research hotspot in agricultural monitoring. In recent years, remote sensing technology has been applied in the inversion research of physiological and biochemical parameters such as crop biomass [7], chlorophyll content [8], and water and nitrogen content [9].In terms of characterizing leaf changes, spectral reflectance and vegetation indices have their own characteristics. The spectral reflectance index based on the green and red wavelength regions can more precisely reveal the continuous changes in pigment composition and its quantity during the leaf senescence process[10].In the study of cotton defoliation and ripening, the evaluation of defoliation effect mainly relies on the traditional manual fixed-point investigation [11], which is time-consuming, inefficient and the results are accidental.In contrast, unmanned aerial vehicle remote sensing has the advantages of high resolution and real-time monitoring, and its application in agricultural monitoring is increasingly widespread [12], which provides new thinking and research directions for the monitoring of cotton defoliation rate and material screening.
At present, there are relatively few studies on using unmanned aerial vehicle (UAV) remote sensing technology to monitor the defoliation effect of cotton and screen materials. In this experiment, 123 upland cotton germplasm resources after spraying defoliant were screened for defoliation sensitivity, and combined with UAV multispectral data, the feasibility of UAV multispectral technology in monitoring and classifying and screening germplasm resources was evaluated. The study compared the two methods to select defoliation-sensitive cotton germplasm resources, filling the gap in the application of drone multispectral technology and vegetation indices for evaluating cotton defoliation sensitivity. This provides a theoretical basis and technical reference for screening cotton germplasm resources with sensitivity to defoliants suitable for mechanical harvesting.
2. Materials and Methods
2.1. Materials and Geographical Location
In this experiment, 123 cotton germplasm resources were selected, all of which were collected and provided by the Key Laboratory of Crop Breeding and Biotechnology of Xinjiang (Table 1). These materials include 48 from the Northwest Inland Cotton Area, 19 from the Yellow River Basin Cotton Area, 14 from the Yangtze River Basin Cotton Area, 8 from overseas, 20 from self-bred materials by Xinjiang regional seed companies, 11 from self-bred materials by the research team, and 3 other materials. The experiment was conducted in 2024 at the HuYangHe City Experimental Base of the Agricultural Science Research Institute of the Seventh Division of the Xinjiang Production and Construction Corps (Latitude 44°20'–47°04', Longitude 83°51'–85°51').
2.2. Experimental Design and Treatments
The experiment was designed with two treatments: one with defoliant spraying (DT) and one without defoliant spraying (CK), each with two replicates. Protective rows were also set up. The plot length was 2 meters, with 30 membranes per zone, and each membrane covering three rows. Mechanical mulching with hole punching and manual seeding were applied. One membrane was planted with one cotton material. Drip irrigation was applied beneath the film, and other field management was the same as in the field. The defoliant was a 540 g/L thiabendazole · diuron suspension (containing 180 g/L diuron and 360 g/L thiabendazole) and a special additive (produced by Bayer CropScience, Germany).On September 5, the defoliant treatment was carried out. When the treatment group (DT) unmanned aerial vehicle sprayed the defoliant for the first time, 13 - 15 ml of 540 g/L thidiazuron + diuron suspension concentrate was used per mu, with an additive added at a ratio of 1:4. The dosage of ethephon was 70 - 100 ml per mu, and it was sprayed with 30 - 40 L of water. On September 13, the defoliant was sprayed for the second time, and 10 - 12 ml of 540 g/L thidiazuron + diuron suspension concentrate was used per mu, with an additive added at a ratio of 1:4. The control group (CK) did not spray the defoliant but sprayed the same amount of clear water.
2.3. Investigation Contents and Measurement Methods
2.3.1. Field Data Acquisition in Datian
Select 5 consecutive and uniformly growing cotton plants in each plot for tagging. According to "Descriptors and Data Standard for Cotton Germplasm Resources" edited by Du Xiongming[13] et al., investigate the agronomic traits. Before and after the spraying of defoliant, investigate the number of cotton plant leaves and boll opening numbers of the CK and DT groups at the fixed points and plants on the 0th day of spraying defoliant and 4 days, 8 days, 12 days, 16 days, and 20 days after spraying defoliant. When conducting the investigation of the ground defoliation rate, cotton leaves smaller than 2 cm² are not calculated. When conducting the last field data investigation, investigate the number of effective bolls.
2.3.2. UAV Multispectral Data Acquisition
The DJI Phantom 4 quadcopter multispectral unmanned aerial vehicle is used for the acquisition of digital images. Before and after spraying the defoliant, conduct a manual investigation, and simultaneously carry out image acquisition work. The shooting time period is between 12:30 and 14:00. The flight altitude of the unmanned aerial vehicle is set at 20 m. The DJI GO software is used to plan the fixed-point flight route for the target cotton field, and the flight speed is set at 1 m/s, with an image overlap rate of 80%. Before the flight, a multispectral sensor is used to shoot the radiation calibration plate to facilitate the subsequent radiation calibration of the images. Digital image data were collected at the same intervals as the manual investigation, with UAV data acquisition performed at 0d, 4d, 8d, 12d, 16d, and 20d after the first spraying of defoliant.
2.4. Data Processing
The data were statistically analyzed using EXCEL 2010, IBM SPSS Statistics 20 software, GraphPsd Prism software, and R 4.3.1 software; Pix4D software was used for UAV digital image stitching and preprocessing, and the ArcGIS software platform was used for extracting multispectral image data.
2.4.1. Calculation of Defoliation Rate and Boll Opening Rate
The defoliation rate (RD) was calculated using the following formula:
RD(%)=(N0-N1)/N0×100%,
In the equation, N0 is the number of leaves before the defoliant treatment, and N1 is the number of leaves after the defoliant treatment.
The boll shedding rate (RB) was calculated using the formula:
RB(%)=B1/B0×100%,
In the equation, B1 is the number of bolls that are opening, and B0 is the number of effective bolls.
2.4.2. Unmanned Aerial Vehicle Data Processing
The processing of UAV high-definition digital images is carried out using Pix4D software. The UAV digital images containing location information (including latitude and longitude coordinates and altitude information) are imported into Pix4D to complete image stitching. The output result is to generate a multispectral image. Set to automatically perform image stitching. After the stitching is successful, the reflectance image of the test site is obtained through the index calculator, and 5 TIFF format files of different bands and a digital orthophoto image (Figure 1) are obtained. The ArcGIS software platform is used for analysis. The image is imported into ArcMAP 10.2 software to create a layer to extract the average reflectance of each cotton material research area as the reflectance of the sample in this band. Finally, the vegetation index is calculated (Figure 2).
2.4.3. Vegetation Index
Vegetation index is a key parameter for evaluating the growth status of crops. Through in-depth discussion and analysis of the existing literature, this study screened out 12 vegetation indices closely related to the leaf abscission characteristics (Table 2). These vegetation indices cover multiple aspects from chlorophyll content to vegetation water status, and can reflect the growth status of cotton and its leaf abscission characteristics, thereby providing a scientific basis for the subsequent material screening and variety improvement.
3. Results and Analysis
3.1. Descriptive Statistical Analysis of Phenotypic Traits of 123 Upland Cotton Germplasm Resources
The agronomic traits of 123 upland cotton germplasm resources were statistically analyzed. The results showed that the plant height of the germplasm materials was 59.20 - 120.80 cm, the height of the first fruiting branch was 5.80 - 38.00 cm, the number of fruiting branches was 5.80 - 13.75, the number of effective fruiting branches was 3.60 - 12.00, and the number of bolls per plant was 4.80 - 14.20. The coefficient of variation of each trait exceeded 10% (Table 3). The coefficient of variation and extreme values of the agronomic traits of cotton germplasm materials indicated that there were significant differences in each trait among different materials, revealing the rich genetic variation in the 123 upland cotton germplasm resources, which provided a basis for the comparison and screening of planting materials.
3.2. The Effect of Defoliants on the Defoliation Rate and Boll Opening Rate of Cotton Germplasm Resources
To study the defoliation effect of cotton after the application of defoliants, the defoliation rate after the application of defoliants was statistically analyzed (Figure 3-a), and a significant t-test was conducted on the defoliation rate at the corresponding time points (Figure 3-b). The results show that the defoliation rate continues to rise with the increase of days after application, indicating that the defoliant effectively promotes the defoliation process of cotton. Extreme value analysis shows that the defoliation effects of 123 germplasm resources are significantly different, and the defoliation rate change in the treatment group at the T4 period (16 d) is the most significant, providing a basis for the in-depth analysis of subsequent defoliation-sensitive materials. In addition, the analysis of the change in the boll opening rate of cotton after spraying defoliants (Figure 3-c) and the significant t-test of the boll opening rate at different investigation times (Figure 3-d) found that the boll opening rate shows an increasing trend over time, and the boll opening rate in the experimental area where defoliants are sprayed increases more rapidly. Compared with the control CK group, the boll opening rate in the experimental area treated with defoliants increased significantly, indicating that spraying defoliants has a significant promoting effect on the boll opening of upland cotton germplasm resources.
3.3. Screening of Defoliation-Sensitive Varieties Based on Defoliation Rate
The change trend of the defoliation rate of cotton materials after spraying defoliant shows (Figure 3) that a significant difference in the defoliation rate occurs in the T4 period, which is convenient for screening materials with good defoliation effects. Therefore, a cluster analysis of the defoliation rate in the T4 period (Figure 4) is conducted, and 123 germplasm resources are divided into three categories. Among them, category I belongs to the defoliation-sensitive germplasm resources, with 37 copies (Table 4), accounting for approximately 30%, and the defoliation rate is between 84.76% and 95.12%; category II belongs to the moderately defoliation-sensitive intermediate materials, with 53 copies, accounting for approximately 48%, and the defoliation rate is between 72.22% and 84.10%; category III belongs to the defoliation-insensitive germplasm resources, with 27 copies, accounting for approximately 22%, and the defoliation rate is between 53.50% and 71.34%.
3.4. Screening of Defoliation-Sensitive Materials of Cotton Based on Multispectral
3.4.1. Changes in Multispectral Reflectance Values
Through the stitching and processing of unmanned aerial vehicle (UAV) multispectral images, the values of five bands were extracted, and their variation is shown in Figure 5. It is found that the values of the red, green, and blue bands show an upward trend with the shedding of cotton leaves, while the values of the near-infrared (nir) and red-edge (red_edge) bands show a downward trend with the shedding of cotton leaves. Through the investigation of field experiment data, it is found that there is a significant difference in the defoliation situation at 16 days (T4) after the application of the defoliant. Therefore, the multispectral values at 16 days (T4) after the application of the pesticide are selected for the subsequent study.
3.4.2. Analysis of the Correlation Between Multi-Spectral Bands and Vegetation Indexes and Defoliation Rate
A correlation analysis was conducted on the defoliation rate, multispectral bands, and vegetation indices on the 16th day after pesticide application (Figure 6). PSRI shows a significant positive correlation with the defoliation rate, and the highest correlation coefficient reaches 0.52; an increase in the PSRI value indicates an increase in canopy pressure, the beginning of vegetation senescence, and the maturity of plant fruits. This index is commonly used to monitor vegetation health, vegetation physiological stress, and crop yield analysis. SIPI has a significant positive correlation with the defoliation rate, reaching 0.51; SIPI can monitor vegetation health, detect plant physiological stress, and analyze crop yield. Among them, MSRI, RVI, NDVI, SAVI, TVI, MVI, MCARI, EVI, and GNDVI show a significant negative correlation with the defoliation rate, and the correlation coefficient reaches more than -0.40. These several vegetation indices have a significant correlation with the defoliation rate and can be used as relevant indicators to evaluate the defoliation of cotton.
3.4.3. PSRI Clustering Screening for Defoliation-Sensitive Upland Cotton Germplasm Resources
Relevance analysis found that the correlation between PSRI and defoliation rate is the highest. Therefore, 123 germplasm resources are divided into three categories using the PSRI value (Figure 7). Among them, 24 germplasm resources with excellent defoliation effect are classified as Type I (Table 5), accounting for approximately 19.5%, with PSRI values ranging from 0.1607 to 0.1984; 43 germplasm resources with a general defoliation effect are classified as Type II, accounting for approximately 35.0%, with PSRI values ranging from 0.1358 to 0.1588; 56 germplasm resources with a poor defoliation effect are classified as Type III, accounting for approximately 45.5%, with PSRI values ranging from 0.0763 to 0.1350.
3.5. Defoliation Rate Classification and PSRI Classification Screening Materials Consistency Evaluation
During the field investigation of the cotton defoliation rate, due to human factors such as the movement and touching of the investigators, the leaves often fall unnaturally, thereby affecting the accuracy of the investigation data. To solve this problem, this study adopted two methods: artificial investigation and vegetation index PSRI classification to screen out cotton materials that are sensitive to defoliation reactions. Through comparative analysis, 15 defoliation-sensitive materials (Table 6) were screened out, accounting for 62.50% of the 24 materials in PSRI classification type I. Their defoliation rates range from 85.81% to 95.12%, their boll opening rates range from 76.67% to 98.04%, and their PSRI values range from 0.1607 to 0.1984. Among these 15 materials, 7 showed good defoliation effects (>85%) and high boll opening rates (>90%), specifically including Liaomian 9, Xinluzao 10, Yuan 247-31, J206-5, Xinluzao 11, Guomian 614, and Xinluzao 73, which can be used for the subsequent genetic improvement and breeding of cotton varieties.It is demonstrated that using unmanned aerial vehicle multispectral technology for large-scale screening of cotton breeding materials with excellent defoliation effects is feasible.
4. Discussion
The main cotton-producing areas in Xinjiang generally adopt mechanized harvesting, but the residue of leaves will increase the impurity rate of seed cotton and reduce the fiber quality. Cotton varieties sensitive to defoliants have a good defoliation effect, with rapid leaf shedding, promoting boll opening, reducing mechanical harvesting impurities. The defoliation effect is crucial to the mechanical harvesting efficiency and cotton quality. Therefore, it is necessary to screen breeding materials sensitive to defoliants. In this study, different cotton germplasm resources were treated with defoliants and control experiments. The results showed that defoliants can effectively promote cotton leaf shedding and boll opening, significantly improving the defoliation and boll opening speed of cotton. This indicates that defoliants can effectively promote cotton leaf shedding and boll opening, which is consistent with the research results of Chen Beibei et al. [25] and Gao Lili et al. [26].
On the traditional investigation method, the evaluation of cotton defoliation effect relies on manual investigation, including counting the number of cotton plant leaves and bolls before and after pesticide application. This method is time-consuming and error-prone. Moreover, when evaluating large cotton fields, due to vision limitations and subjective factors, it is difficult to accurately assess. The combination of high spatial resolution remote sensing and intelligent agricultural machinery provides a strong technical support for the acquisition of precise cultivated land information [27]. The method of using unmanned aerial vehicle (UAV) remote sensing as a data acquisition platform for crop monitoring can combine other auxiliary information. Previous studies have used UAV-related technologies to obtain relevant information such as crop water content [28], crop nitrogen content [29], radiation use efficiency [30], crop height information, and crop chlorophyll content. Currently, the monitoring research related to green leaves based on UAV is mainly focused on aspects such as leaf area index, biomass, and vegetation coverage. This study integrates UAV multispectral technology and vegetation index to evaluate the defoliation sensitivity of cotton, effectively overcoming the shortcomings of the traditional screening method, and providing a reference for the application of UAV multispectral technology in the field of cotton defoliation effect evaluation research.
Vegetation index is calculated through the reflectance of specific bands. It helps to reduce the interference of external factors such as soil and climate, thereby improving the accuracy and sensitivity of the target parameters. The shedding of cotton leaves is usually closely related to indicators such as chlorophyll content, leaf water status, and leaf area index (LAI); during the process of leaf shedding, chlorophyll degrades, and the photosynthetic capacity weakens, resulting in a decrease in the reflectance of the near-infrared band and an increase in the reflectance of the red light band. The shedding of cotton leaves leads to a reduction in the number of green leaves in the canopy. Researchers such as Yi Qiuxiang [31] used remote sensing technology to monitor this change. For example, Li Yabing [32] diagnosed the premature senescence degree of cotton through different color spaces and eigenvalues, and achieved a good fitting effect. Yan Chunyu [33] and the team used a quad-rotor unmanned aerial vehicle to collect multispectral images of cotton before and after spraying, combined with the maximum entropy and vegetation index threshold method to extract cotton leaf information, used the support vector machine to classify the cotton after spraying, and constructed a model through the comparison of field data to verify the application potential of unmanned aerial vehicle remote sensing technology in monitoring cotton defoliation. Previous studies have also confirmed the accuracy of the vegetation index as an indicator for monitoring changes in the cotton canopy. This study found that there is a significant positive correlation between PSRI and SIPI in the vegetation index and the defoliation rate, with the correlation coefficients exceeding 0.50; while MSRI, RVI, NDVI, SAVI, TVI, MVI, MCARI, EVI, and GNDVI show a significant negative correlation with the defoliation rate; indicating that the vegetation index can indicate the situation of cotton defoliation by reflecting the changes in the vegetation canopy.
Looking forward to the future, with the continuous progress of unmanned aerial vehicle (UAV) remote sensing technology, data analysis methods, and artificial intelligence algorithms, the application of UAV technology in the field of precision agriculture is expected to provide more efficient solutions and promote agricultural production towards refined and intelligent management. Compared with the traditional manual observation and sampling methods, UAV remote sensing technology can achieve large-scale, real-time, and non-contact monitoring of the growth status of cotton plants. Traditional methods may be limited by the insufficient representativeness of samples and human errors, while UAV multispectral data provides a high spatial resolution and high-frequency data acquisition capability. Using this technology can effectively make up for the deficiencies of traditional investigation methods. UAV-related technologies provide a powerful technical support for screening sensitive materials suitable for cotton defoliation. To verify the stability and reliability of these screened sensitive materials, multi-point field experiments should be conducted in future studies to further evaluate their defoliation effect and boll opening rate performance. At the same time, continue to explore more vegetation indices and remote sensing technologies to improve a more accurate and efficient screening method for cotton defoliation-sensitive materials; this not only helps to promote the progress of cotton genetic improvement and breeding work, but also provides a strong technical support for the sustainable development of cotton production.
5. Conclusions
The test results show that the defoliant can significantly increase the defoliation rate and boll opening rate of cotton. After spraying the defoliant, there are significant differences in the leaf spectral characteristics of different cotton varieties. Through the comparison and screening of two methods, artificial investigation and the vegetation index PSRI, 15 cotton materials sensitive to defoliation were determined. The defoliation rate and boll opening rate are between 85.81% - 95.12% and 76.67% - 98.04% respectively, and the PSRI value is within the range of 0.1607 - 0.1984, which verifies the effectiveness of the unmanned aerial vehicle multispectral technology in screening cotton breeding materials sensitive to defoliation. The vegetation index related to the defoliation rate is screened out, which can be used as an effective indicator to evaluate the defoliation effect of cotton. Through the correlation analysis between the traditional investigation method and the classification of PSRI (Plant Senescence Reflectance Index), it is further indicated that it is feasible to use the unmanned aerial vehicle multispectral technology to replace manual rapid monitoring and screening of cotton breeding materials with excellent defoliation effect. Among these materials, the defoliation rate of 7 materials exceeds 85.00%, and the boll opening rate exceeds 90%, including Liaomian 9, Xinluzao 10, etc., showing good defoliation and boll opening characteristics, and are suitable as the preferred materials for germplasm resource improvement.
Author Contributions
Conceptualization, Qin Chen; Data curation, Hu Zhang; Formal analysis, Yuantao Guo; Funding acquisition, Quanjia Chen; Investigation, Yuantao Guo, Hu Zhang, Qiyu Chang and Jinsheng Wang; Methodology, Yuantao Guo and Hu Zhang; Project administration, Quanjia Chen; Resources, Qingtao Zeng; Supervision, Haijiang Xu and Qin Chen; Visualization, Jinsheng Wang; Writing – original draft, Yuantao Guo; Writing – review & editing, Wenju Gao and Qin Chen.
Funding
the National Key R&D Program of China (2024YFD1200300); National Natural Science Foundation of China Regional Fund Project (32260503); "Tianshan Talent" Young Science and Technology Top-notch Talent Project - Grassroots Scientific and Technological Backbone Talent (2022TSYCJC0061).
Data Availability Statement
Data can be obtained according to the requirements.
Conflicts of Interest
The authors declare that they have no competing interests.
References
- Zhang, Y. The Technological Power Behind Cotton Yield Increase in Xinjiang[N]. China Agricultural Mechanization Herald, 2025-02-20(004). (In Chinese)
- Liang, Le. The Technological Code for High Yield of Xinjiang Cotton [N]. Science and Technology Daily, 2024-12-25 (007). (In Chinese)
- Tian R Y, Mao Y Q, Jia W M. Analysis on Costs and Benefits of Manual and Mechanical Harvesting of Cotton in Xinjiang. Agriculture and Technology 2015, 35, 249. (In Chinese) [Google Scholar]
- Li H, B. Comparative Analysis of Defoliation Effects of Different Formula Defoliants on Cotton. Xinjiang Agricultural Reclamation Science and Technology (In Chinese). 2013, 39–40. [Google Scholar]
- Liang F R, Long Y L, Du X, et al. Research Progress on Cotton Defoliation and Ripening Agents and Their Application Technologies. China Cotton 2024, 51, 1–7. (In Chinese) [Google Scholar]
- Xiang Biyin. Application Research of Low-altitude Remote Sensing Images from UAVs. Low Carbon World (In Chinese). 2017, 89–90.
- Haldar D, Dave V, Misra A, et al. Radar Vegetation Index for assessing cotton crop condition using RISAT-1 data. Geocarto International 2020, 35, 364–375. [Google Scholar] [CrossRef]
- Xie Q, Dash J, Huete A, et al. Retrieval of crop biophysical parameters from Sentinel-2 remote sensing imagery. International Journal of Applied Earth Observation and Geoinformation 2019, 80, 187–195. [Google Scholar] [CrossRef]
- Ma Yanchuan. Estimation of Water and Nitrogen Parameters in Cotton Canopy Based on Hyperspectral Remote Sensing [D]. Chinese Academy of Agricultural Sciences, 2020. (In Chinese).
- Junker L V, Ensminger I. Relationship between leaf optical properties, chlorophyll fluorescence and pigment changes in senescing Acer saccharum leaves. Tree Physiology 2016, 36, 694–711. [Google Scholar] [CrossRef]
- Chen Bing, Zhang Guolei, Wang Jing, et al. Study on Defoliation and Ripening Effects of Cotton under Mechanized Harvesting with Equal Row Spacing and Dense Planting [J/OL]. Journal of Northwest Agriculture 2019, 28, 1594–1601. (In Chinese) [Google Scholar]
- Maes W H, Steppe K. Perspectives for remote sensing with unmanned aerial vehicles in precision agriculture[J/OL]. Trends in Plant Science 2019, 24, 152–164. [Google Scholar] [CrossRef]
- Du Xiongming, et al. Descriptive Specifications and Data Standards for Cotton Germplasm Resources [M]. 2005. (In Chinese).
- Rouse Jr J W, Haas R H, Deering D W, et al. Monitoring the vernal advancement and retrogradation (green wave effect) of natural vegetation[R]. 1974.
- Daughtry C S T, Gallo K P, Goward S N, et al. Spectral estimates of absorbed radiation and phytomass production in corn and soybean canopies. Remote Sensing of Environment 1992, 39, 141–152. [Google Scholar] [CrossRef]
- Pearson R L, Miller L D. Remote mapping of standing crop biomass for estimation of the productivity of the shortgrass prairie, Pawnee National Grasslands, Colorado. 1972.
- Huete A, R. A soil-adjusted vegetation index (SAVI). Remote sensing of environment 1988, 25, 295–309. [Google Scholar] [CrossRef]
- Miura T, Huete A R, Yoshioka H. Evaluation of sensor calibration uncertainties on vegetation indices for MODIS. IEEE Transactions on Geoscience and Remote Sensing 2000, 38, 1399–1409. [Google Scholar] [CrossRef]
- Meyer G E, Neto J C. Verification of color vegetation indices for automated crop imaging applications. Computers and electronics in agriculture 2008, 63, 282–293. [Google Scholar] [CrossRef]
- Daughtry C S T, Walthall C L, Kim M S, et al. Estimating corn leaf chlorophyll concentration from leaf and canopy reflectance. Remote sensing of Environment 2000, 74, 229–239. [Google Scholar] [CrossRef]
- Chen J M, Cihlar J. Retrieving leaf area index of boreal conifer forests using Landsat TM images. Remote sensing of Environment 1996, 55, 153–162. [Google Scholar] [CrossRef]
- Jin Y E, Liu C S, Zhang W Z. Method for Estimating Surface Moisture Content Using GMS and AVHRR Data from Meteorological Satellites. Journal of Applied Meteorological Science (In Chinese). 1998, 70–77. (In Chinese)
- Penuelas J, Baret F, Filella I. Semi-empirical indices to assess carotenoids/chlorophyll a ratio from leaf spectral reflectance. Photosynthetica 1995, 31, 221–230. [Google Scholar]
- Merzlyak M N, Gitelson A A, Chivkunova O B, et al. Non-destructive optical detection of pigment changes during leaf senescence and fruit ripening. Physiologia plantarum 1999, 106, 135–141. [Google Scholar] [CrossRef]
- Chen B B, Li P, Li Z Y, et al. Screening of Defoliant Formulas for Machine-Picked Cotton Fields in Southern Xinjiang. Journal of Tarim University 2017, 29, 64–69. (In Chinese) [Google Scholar]
- Gao L L, Li G, Xu X X, et al. Comparative Study on Defoliation Efficacy of Four Cotton Defoliants. Journal of Xinjiang Agricultural University 2016, 39, 35–39. (In Chinese) [Google Scholar]
- Zhuang J Y, Bao W J, Su W Z. Current Status and Prospects of Agricultural Remote Sensing Applications. Agricultural Outlook 2024, 20, 68–74. (In Chinese) [Google Scholar]
- Cozzolino D, Fassio A, Gimenez A. The use of near-infrared reflectance spectroscopy (NIRS) to predict the composition of whole maize plants. Journal of the Science of Food & Agriculture 2001, 81, 142–146. [Google Scholar]
- Serrano L, Filella I, Peñuelas J. Remote sensing of biomass and yield of winter wheat under different nitrogen supplies. Crop Science 2000, 40, 723–731. [Google Scholar] [CrossRef]
- Tewes A, Schellberg J. Towards remote estimation of radiation use efficiency in maize using UAV-based low-cost camera imagery. Agronomy 2018, 8, 16. [Google Scholar] [CrossRef]
- Yi Q, X. Estimation of Cotton Leaf Area Index Based on Sentinel-2 Multispectral Data. Transactions of the Chinese Society of Agricultural Engineering 2019, 35, 189–197, (In Chinese with English abstract). [Google Scholar]
- Li Y B, Mao S C, Wang X H, et al. Study on Digital Imaging Indices for Diagnosing Cotton Premature Senescence Severity. Cotton Science (In Chinese). 2006, 160–163.
- Yan C Y, Li W H, Lan Y B, et al. Monitoring Cotton Defoliation Effects and Prescription Map Generation Based on UAV Multispectral Remote Sensing. Journal of Nanjing Agricultural University 2022, 45, 799–808. (In Chinese) [Google Scholar]
Figure 1.
Flowchart of UAV Multispectral image acquisition.
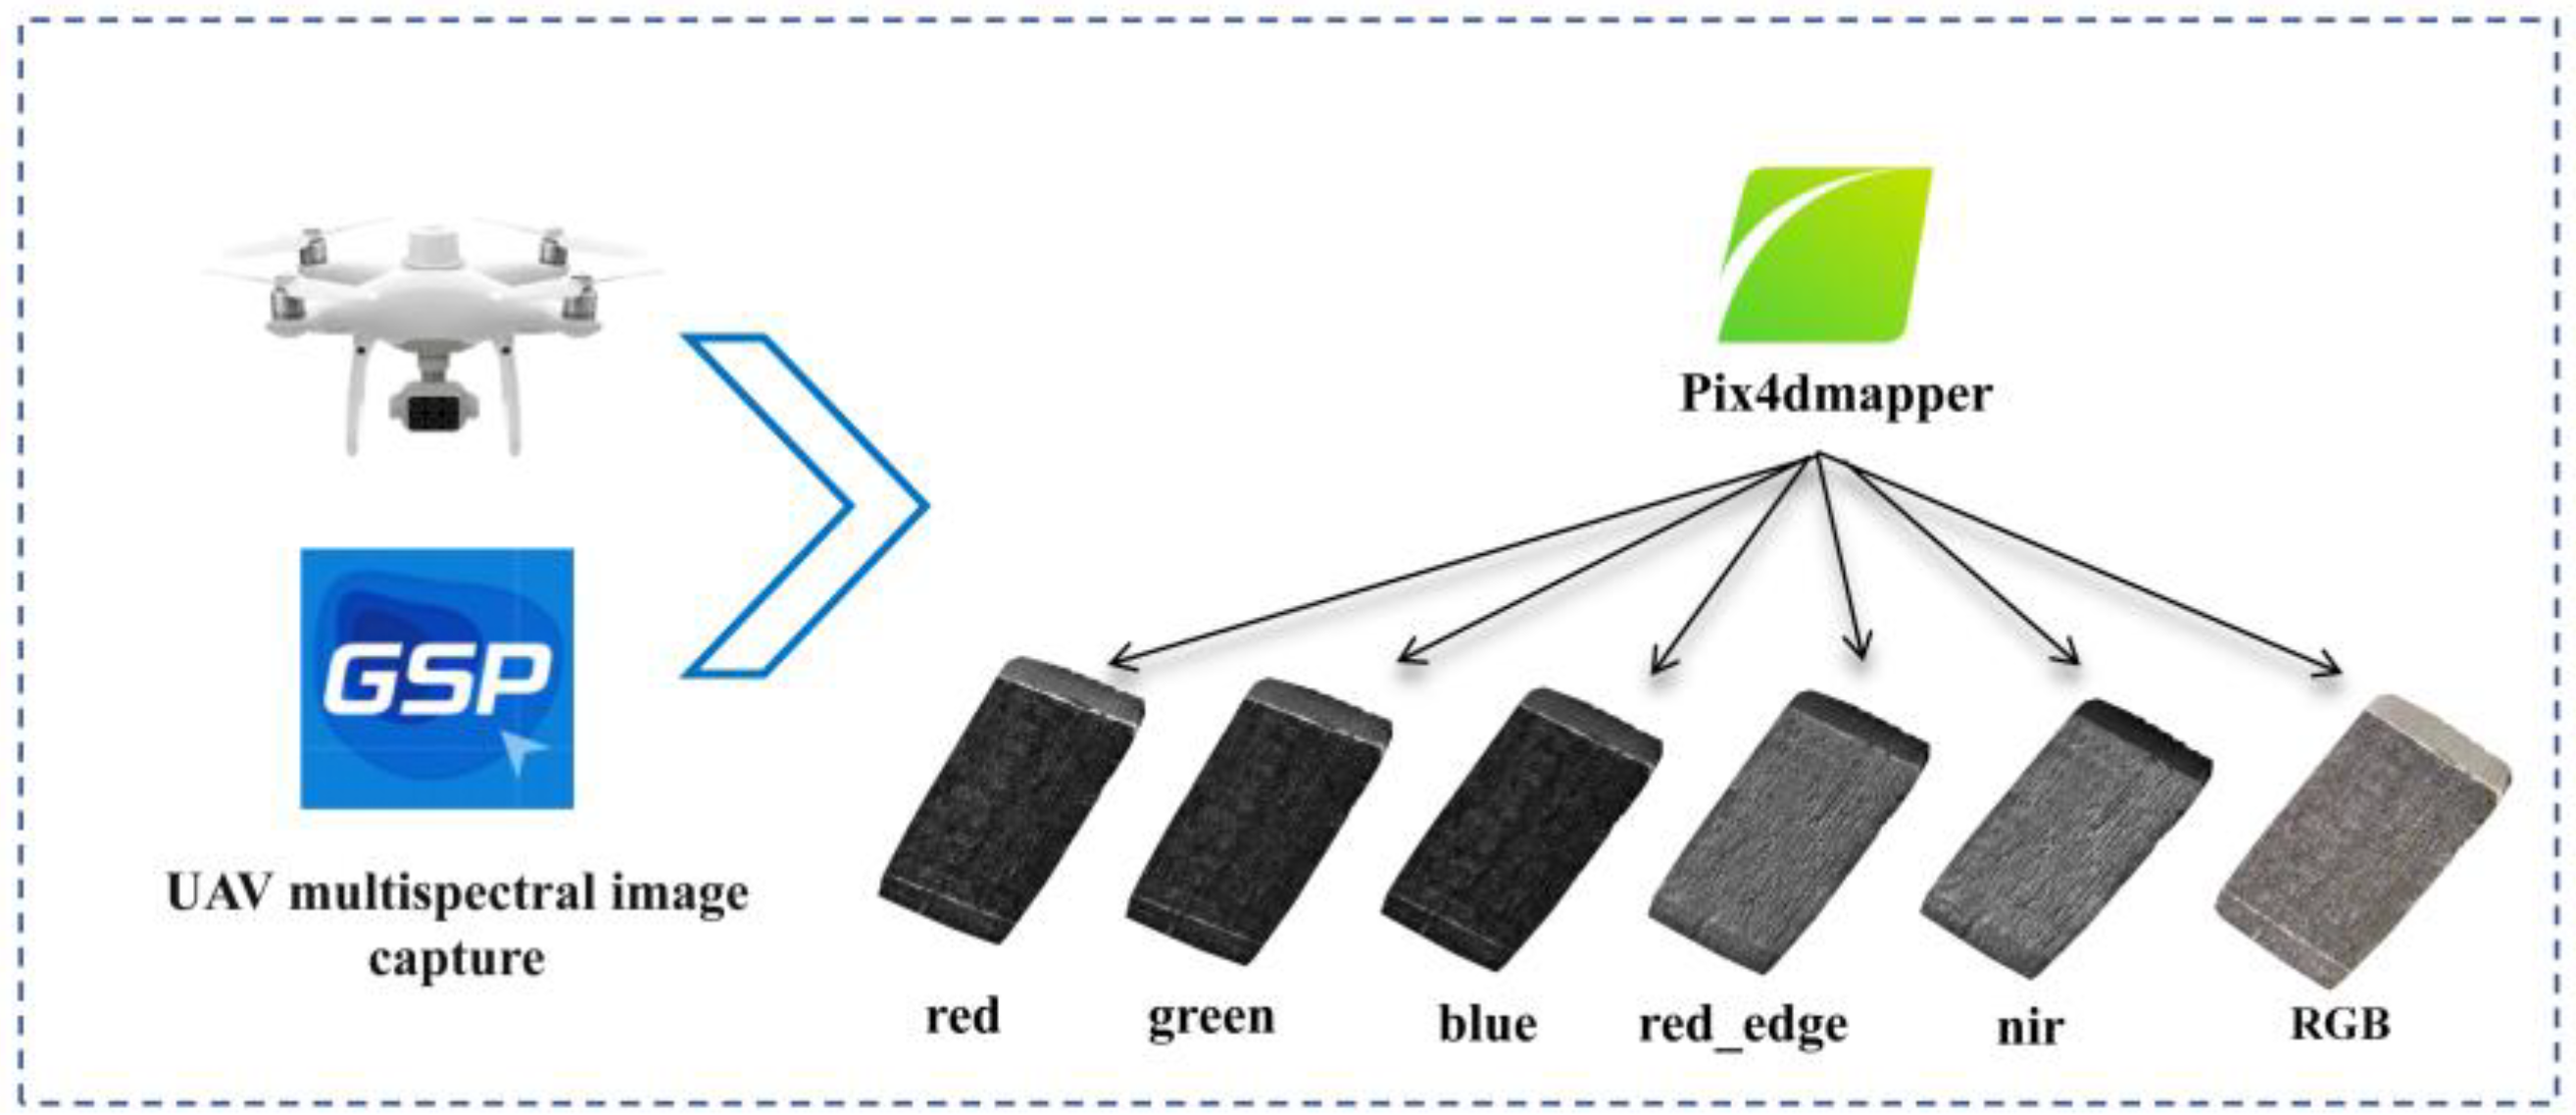
Figure 2.
Flowchart for extracting UAV Multispectral image data.
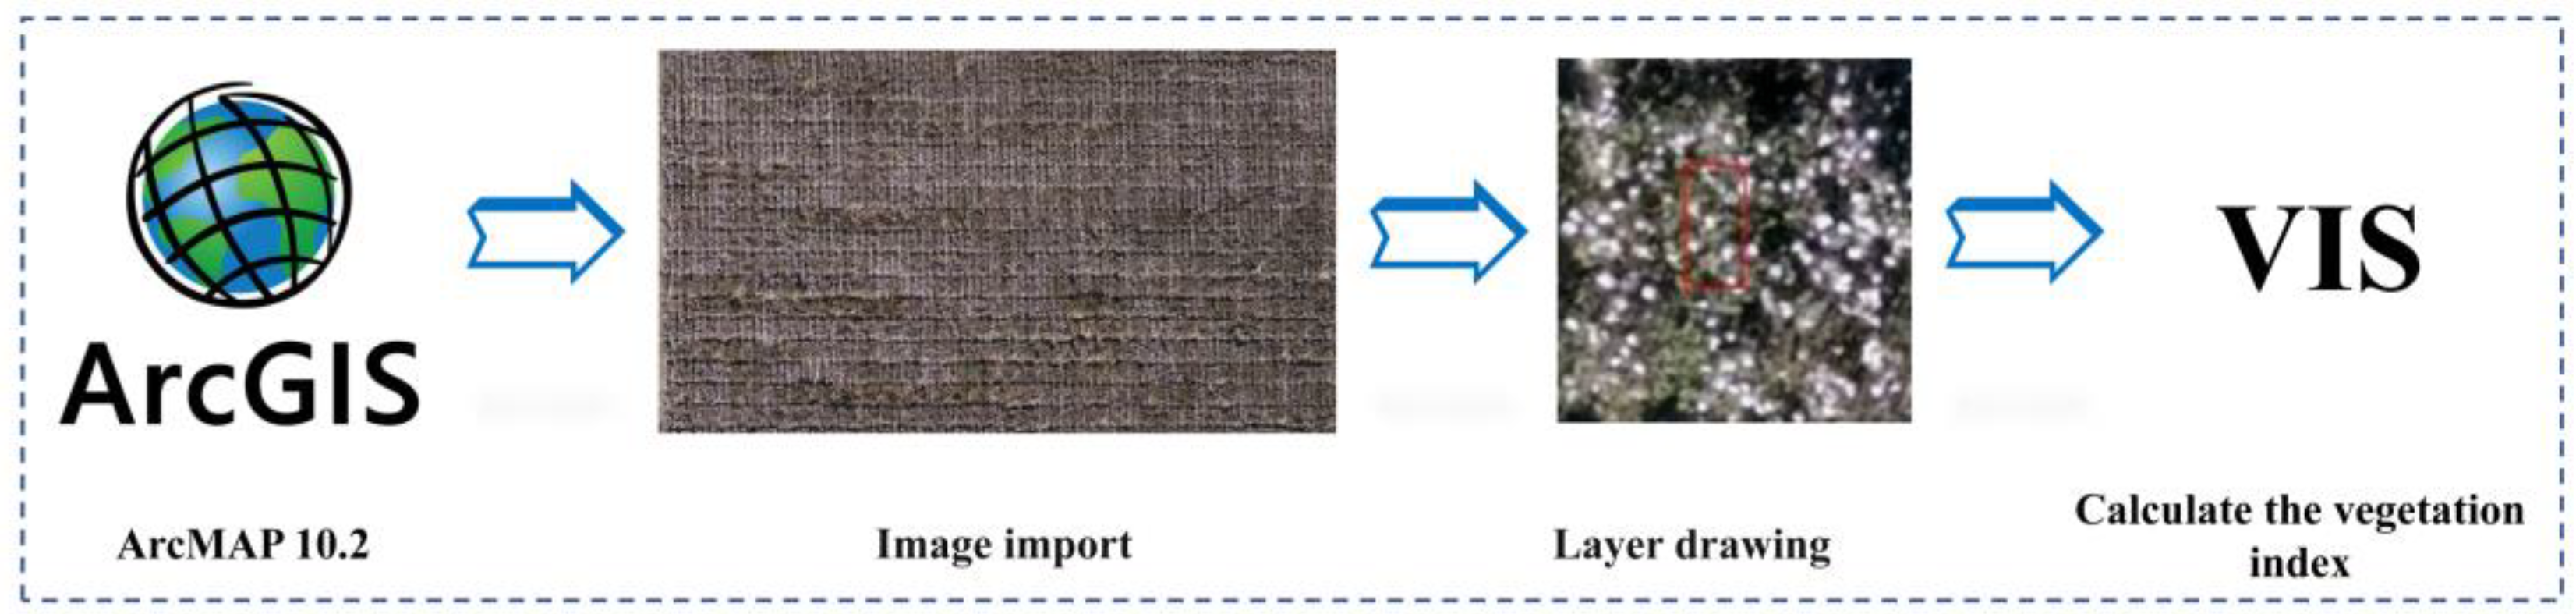
Figure 3.
Changes in defoliation rate and boll opening rate of cotton materials. T0, T1, T2, T3, T4, T5 respectively indicate 0 days, 4 days, 8 days, 12 days, 16 days, and 20 days after spraying the defoliant; ns indicates not significant, * represents P < 0.05; ** represents P < 0.01; *** represents P < 0.001; The significance test method is the two-tailed t-test. (a): Changes in the average defoliation rate in different time periods; (b): Analysis of the difference in the defoliation rate in different time periods; (c): Changes in the average boll opening rate in different time periods; (d): Analysis of the difference in the boll opening rate in different time periods.
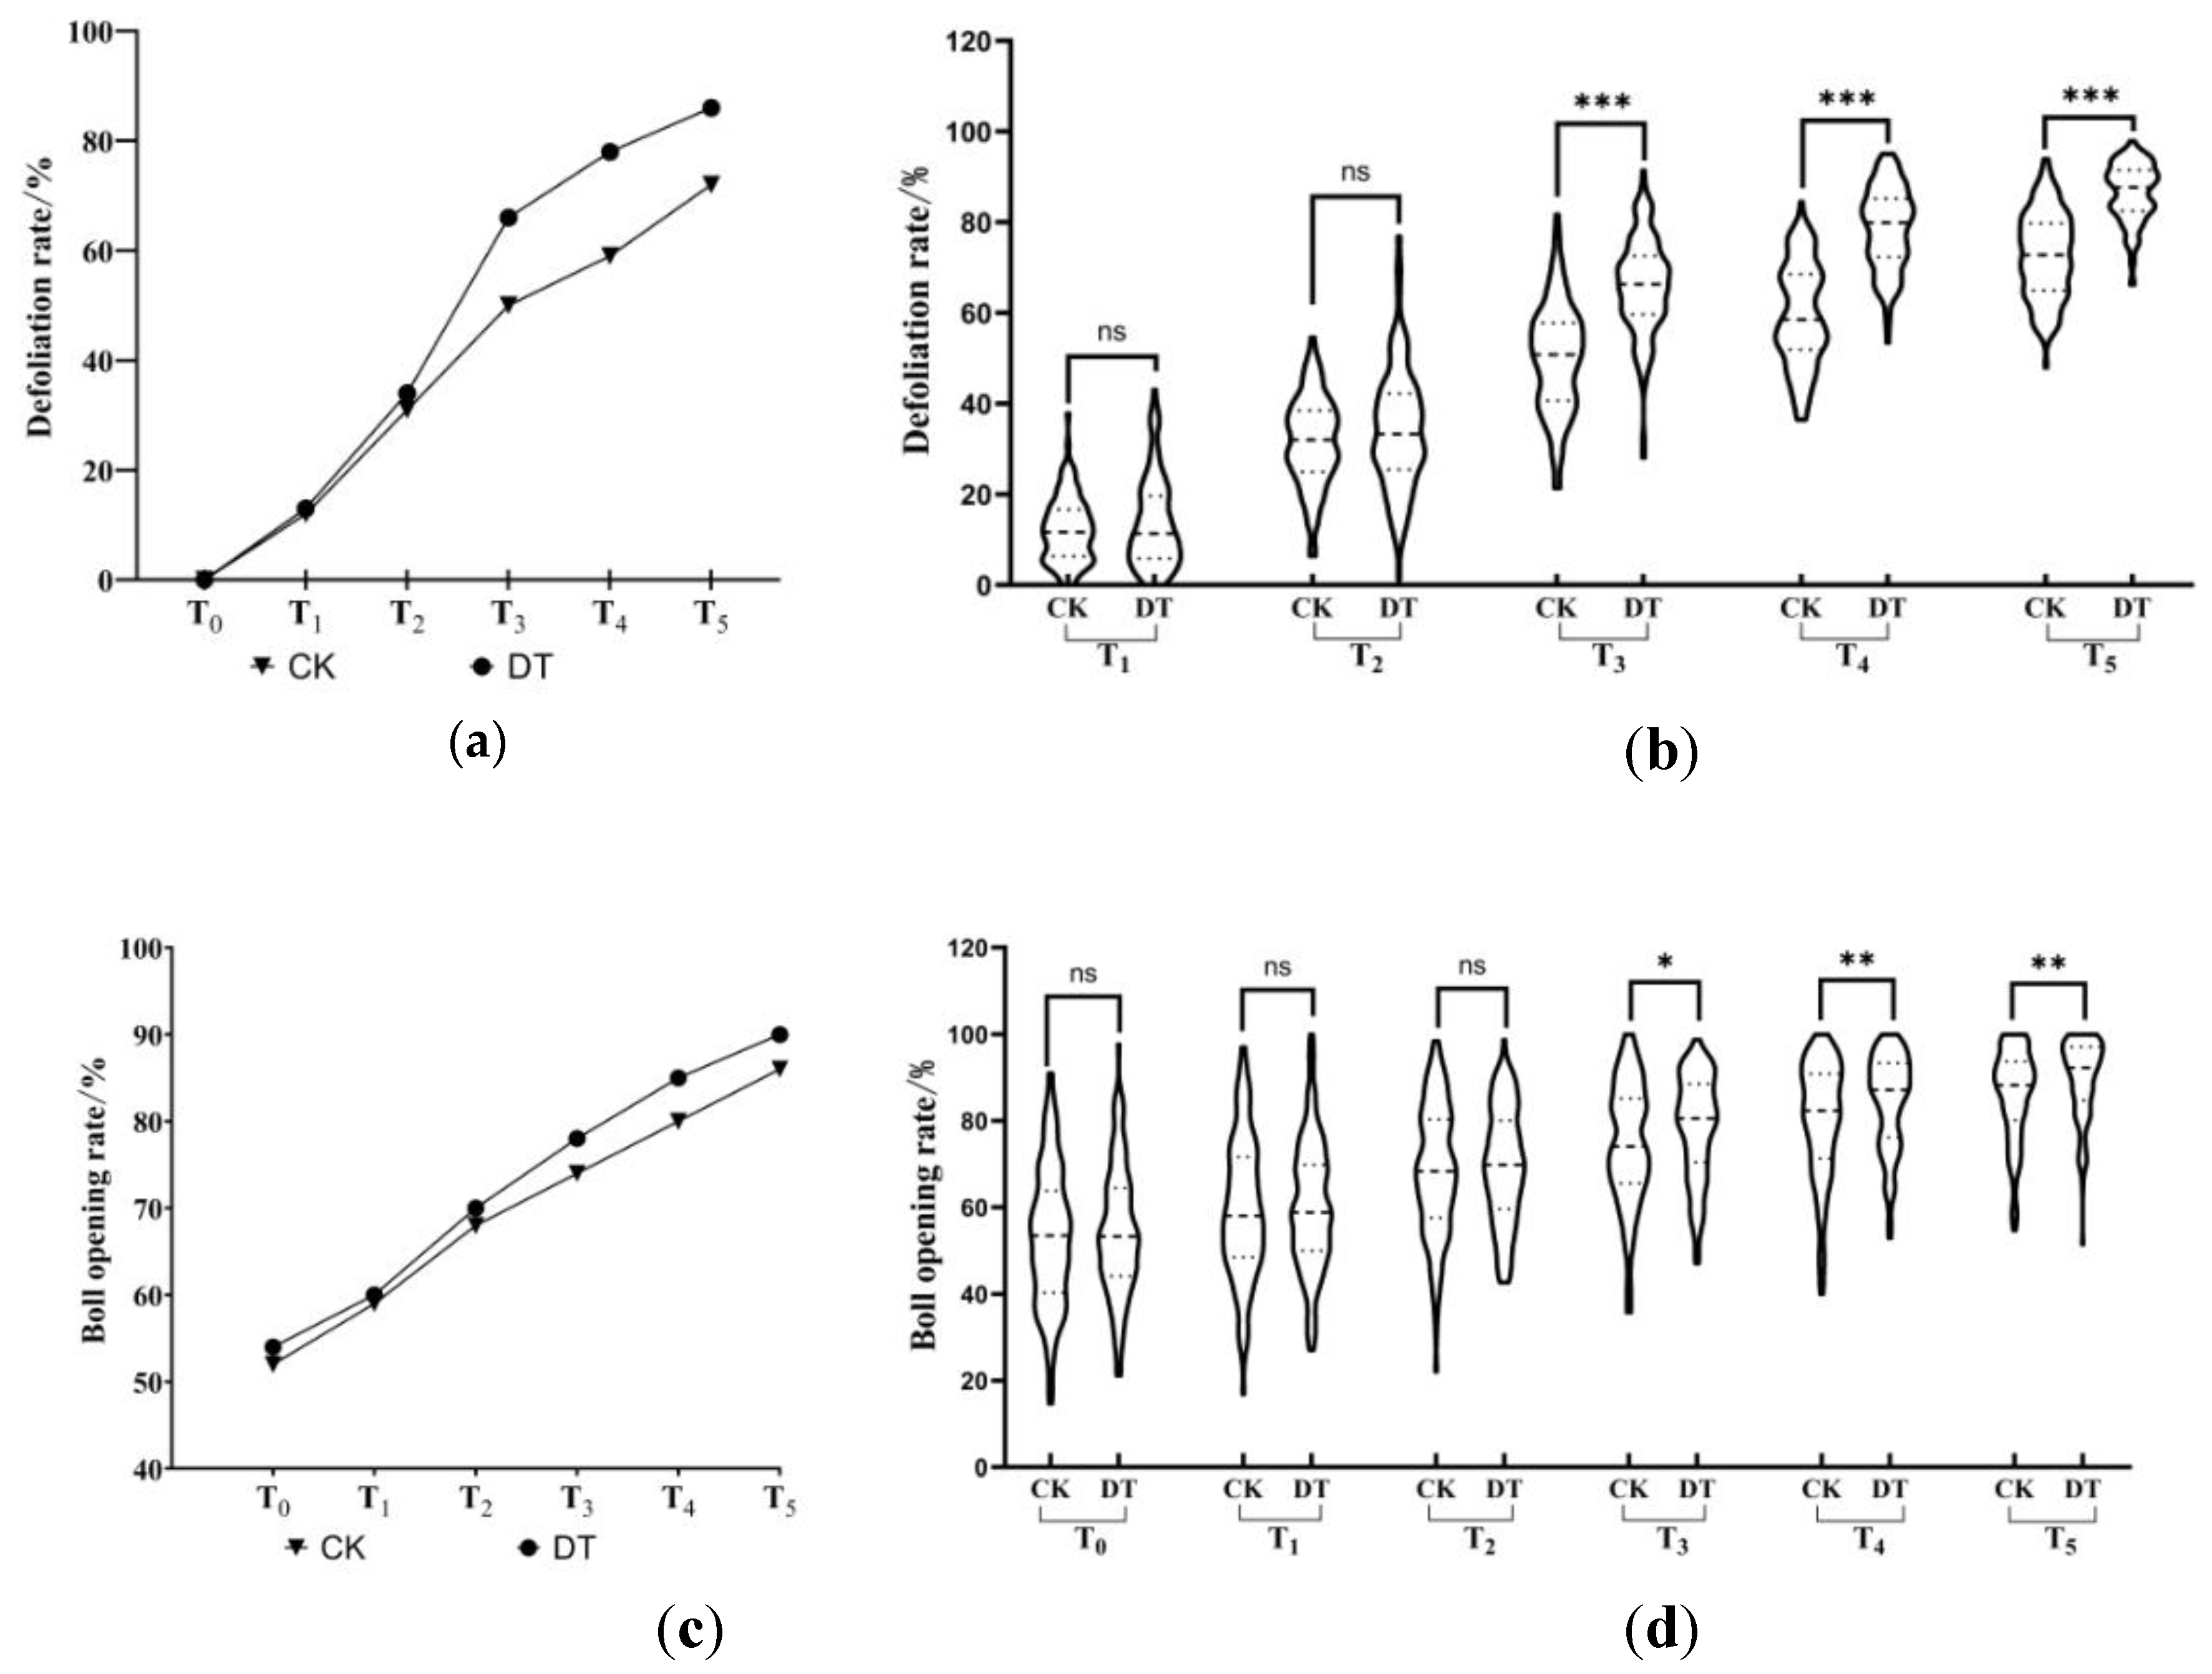
Figure 4.
Clustering diagram of defoliation rate. Category I refers to defoliation-sensitive germplasm resources, Category II refers to moderately defoliation-sensitive germplasm resources, and Category III refers to defoliation-insensitive germplasm resources.
Figure 4.
Clustering diagram of defoliation rate. Category I refers to defoliation-sensitive germplasm resources, Category II refers to moderately defoliation-sensitive germplasm resources, and Category III refers to defoliation-insensitive germplasm resources.
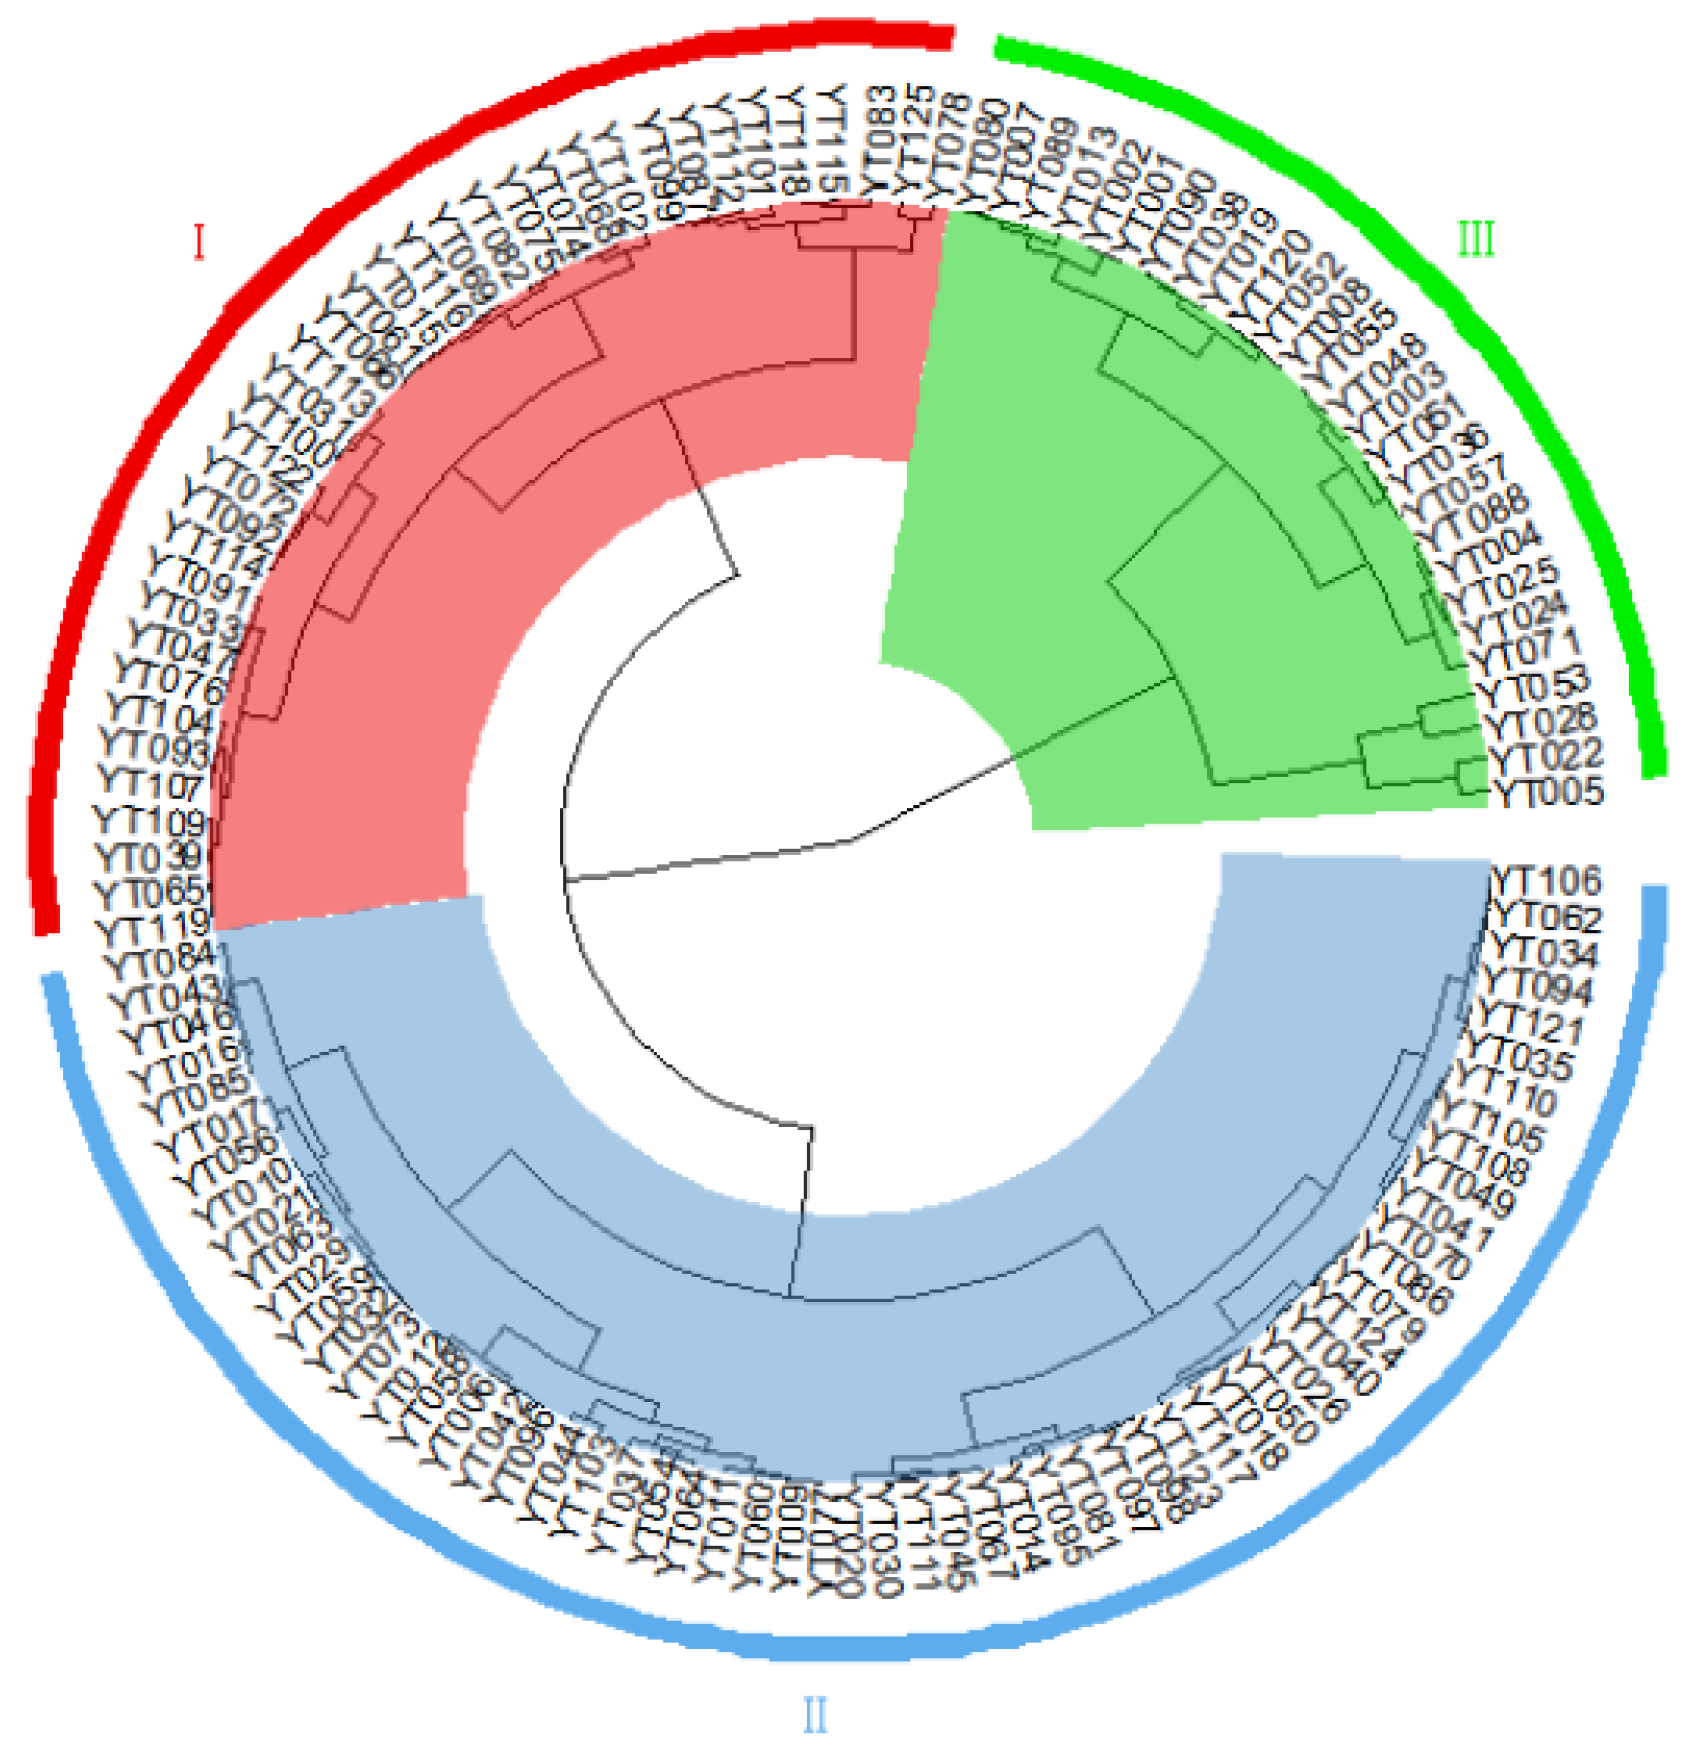
Figure 5.
Changes in multispectral of defoliant treatment and control in different time periods.
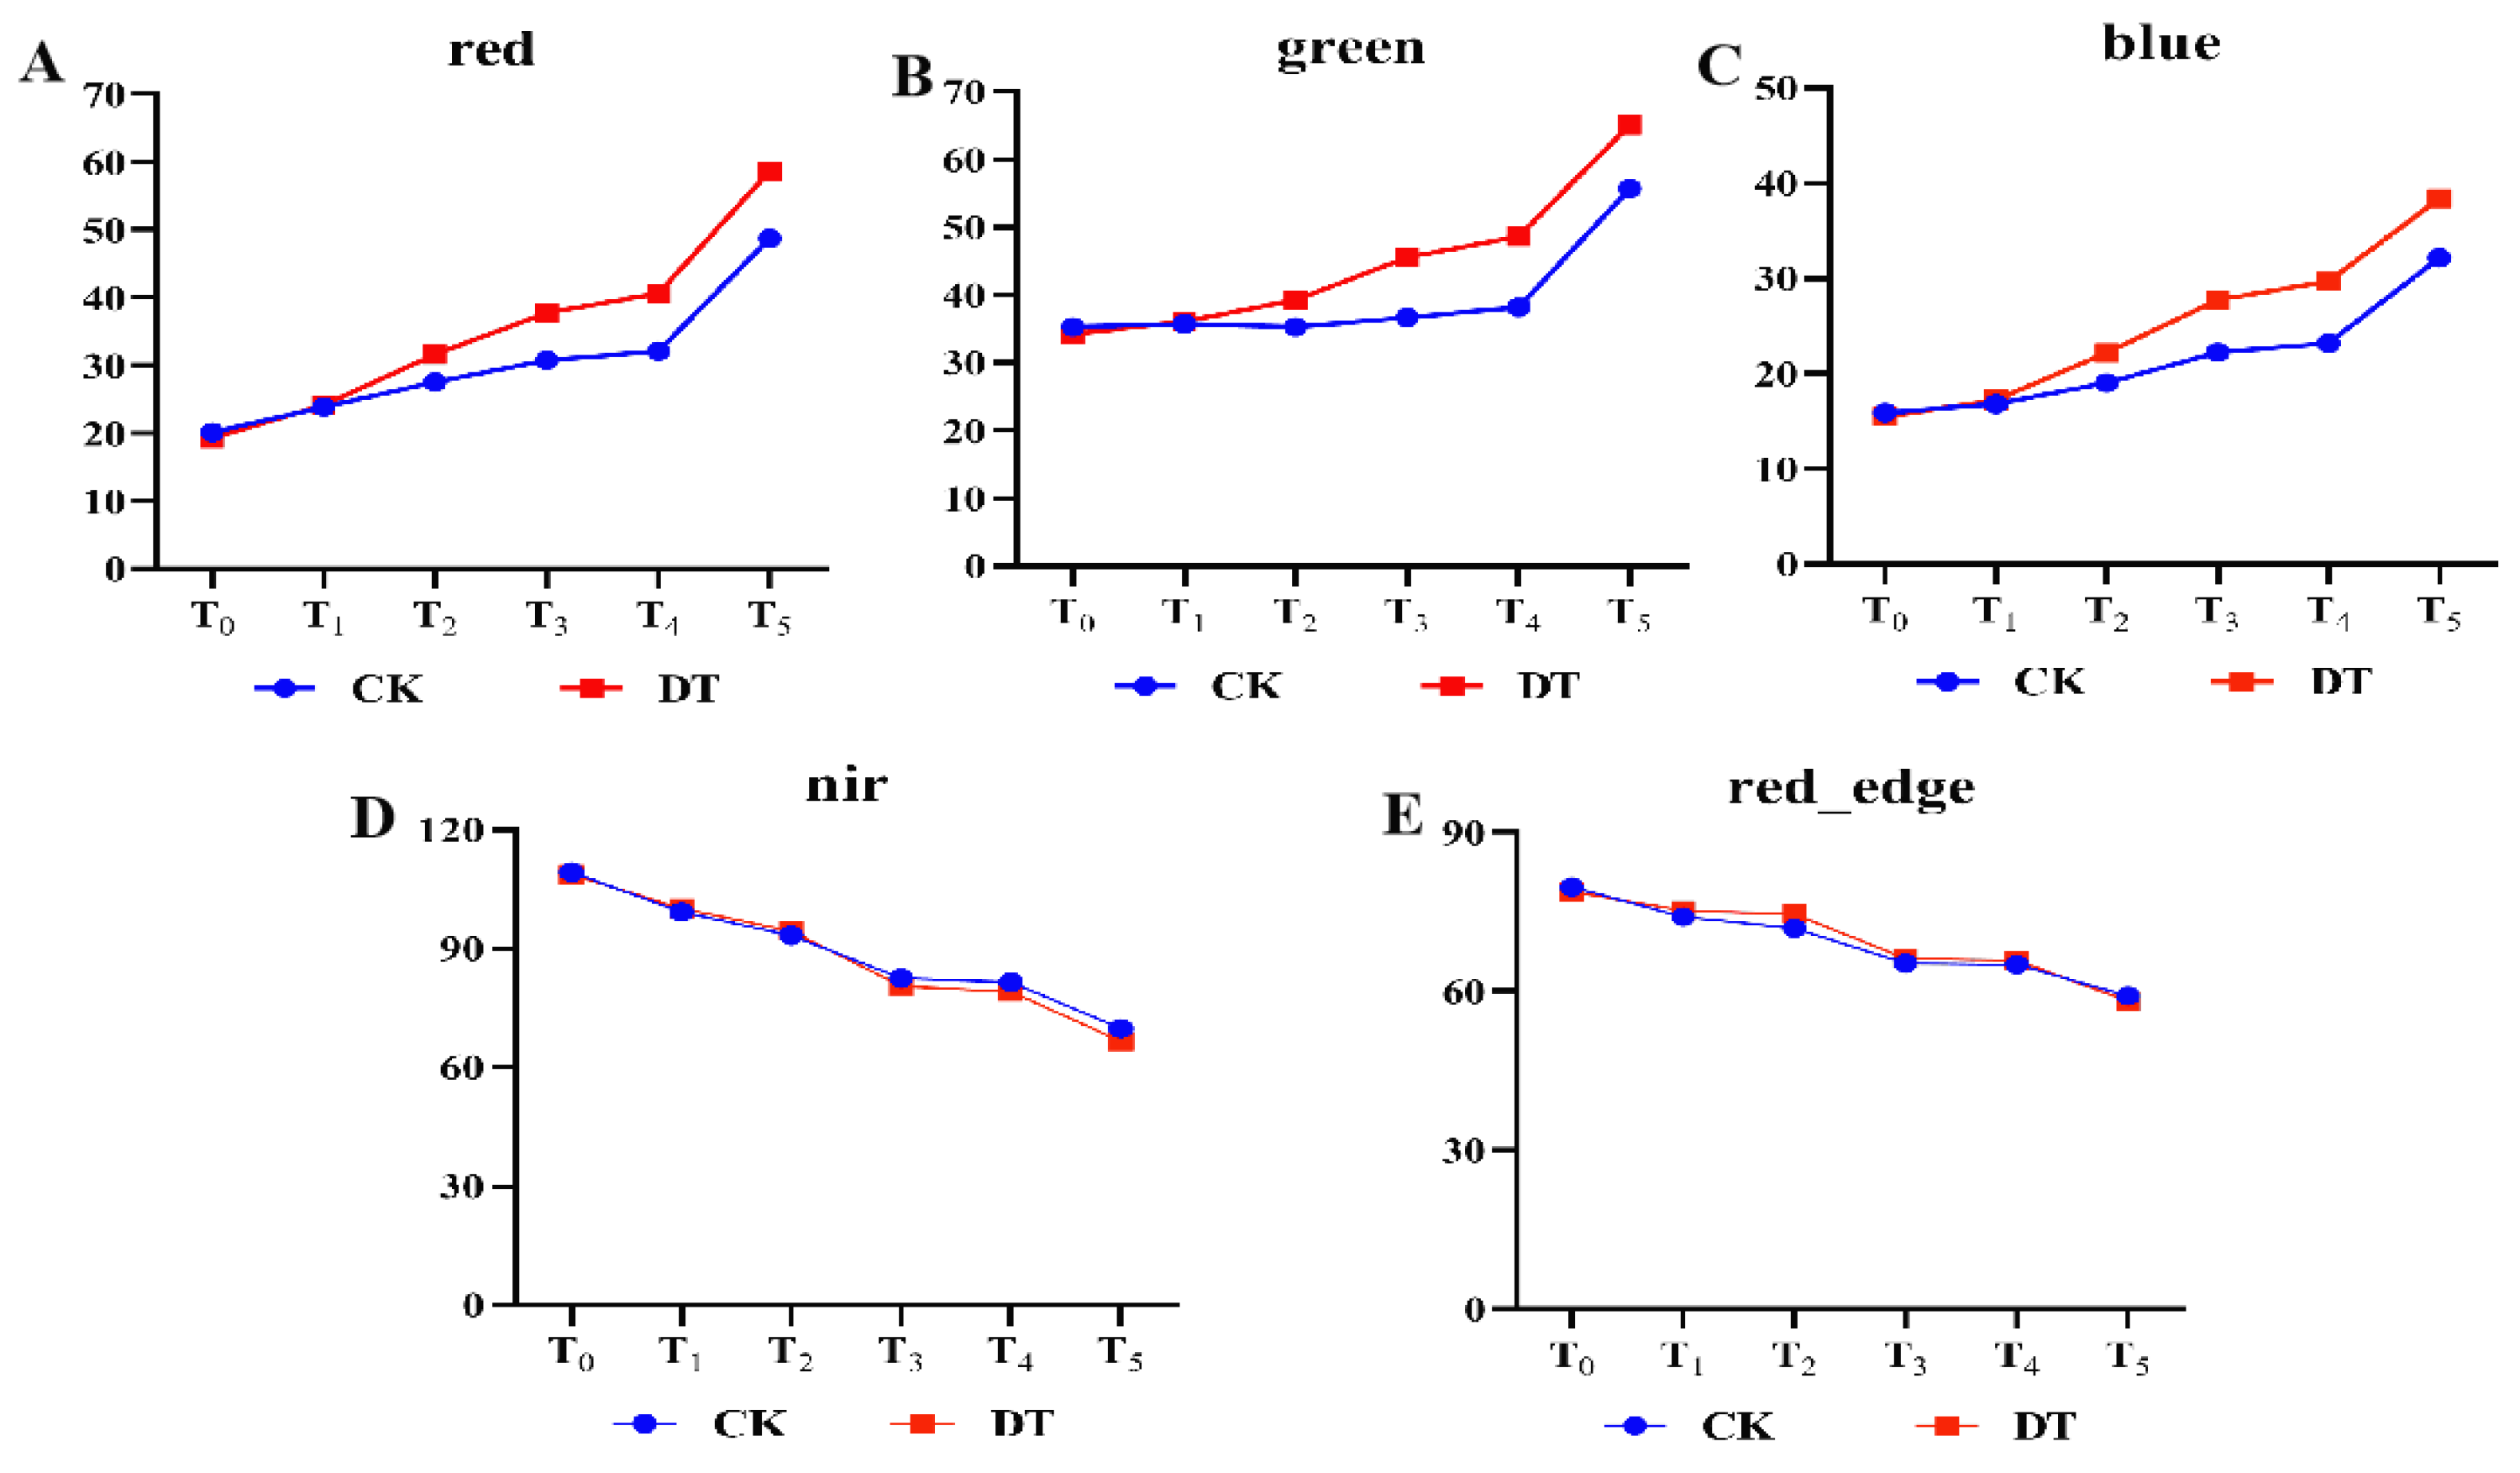
Figure 6.
Correlation analysis between defoliation rate and multispectral bands/vegetation indices at 16 days after defoliant application. RD denotes defoliation rate; * indicates P<0.05; ** indicates P<0.01; *** indicates P<0.001.
Figure 6.
Correlation analysis between defoliation rate and multispectral bands/vegetation indices at 16 days after defoliant application. RD denotes defoliation rate; * indicates P<0.05; ** indicates P<0.01; *** indicates P<0.001.
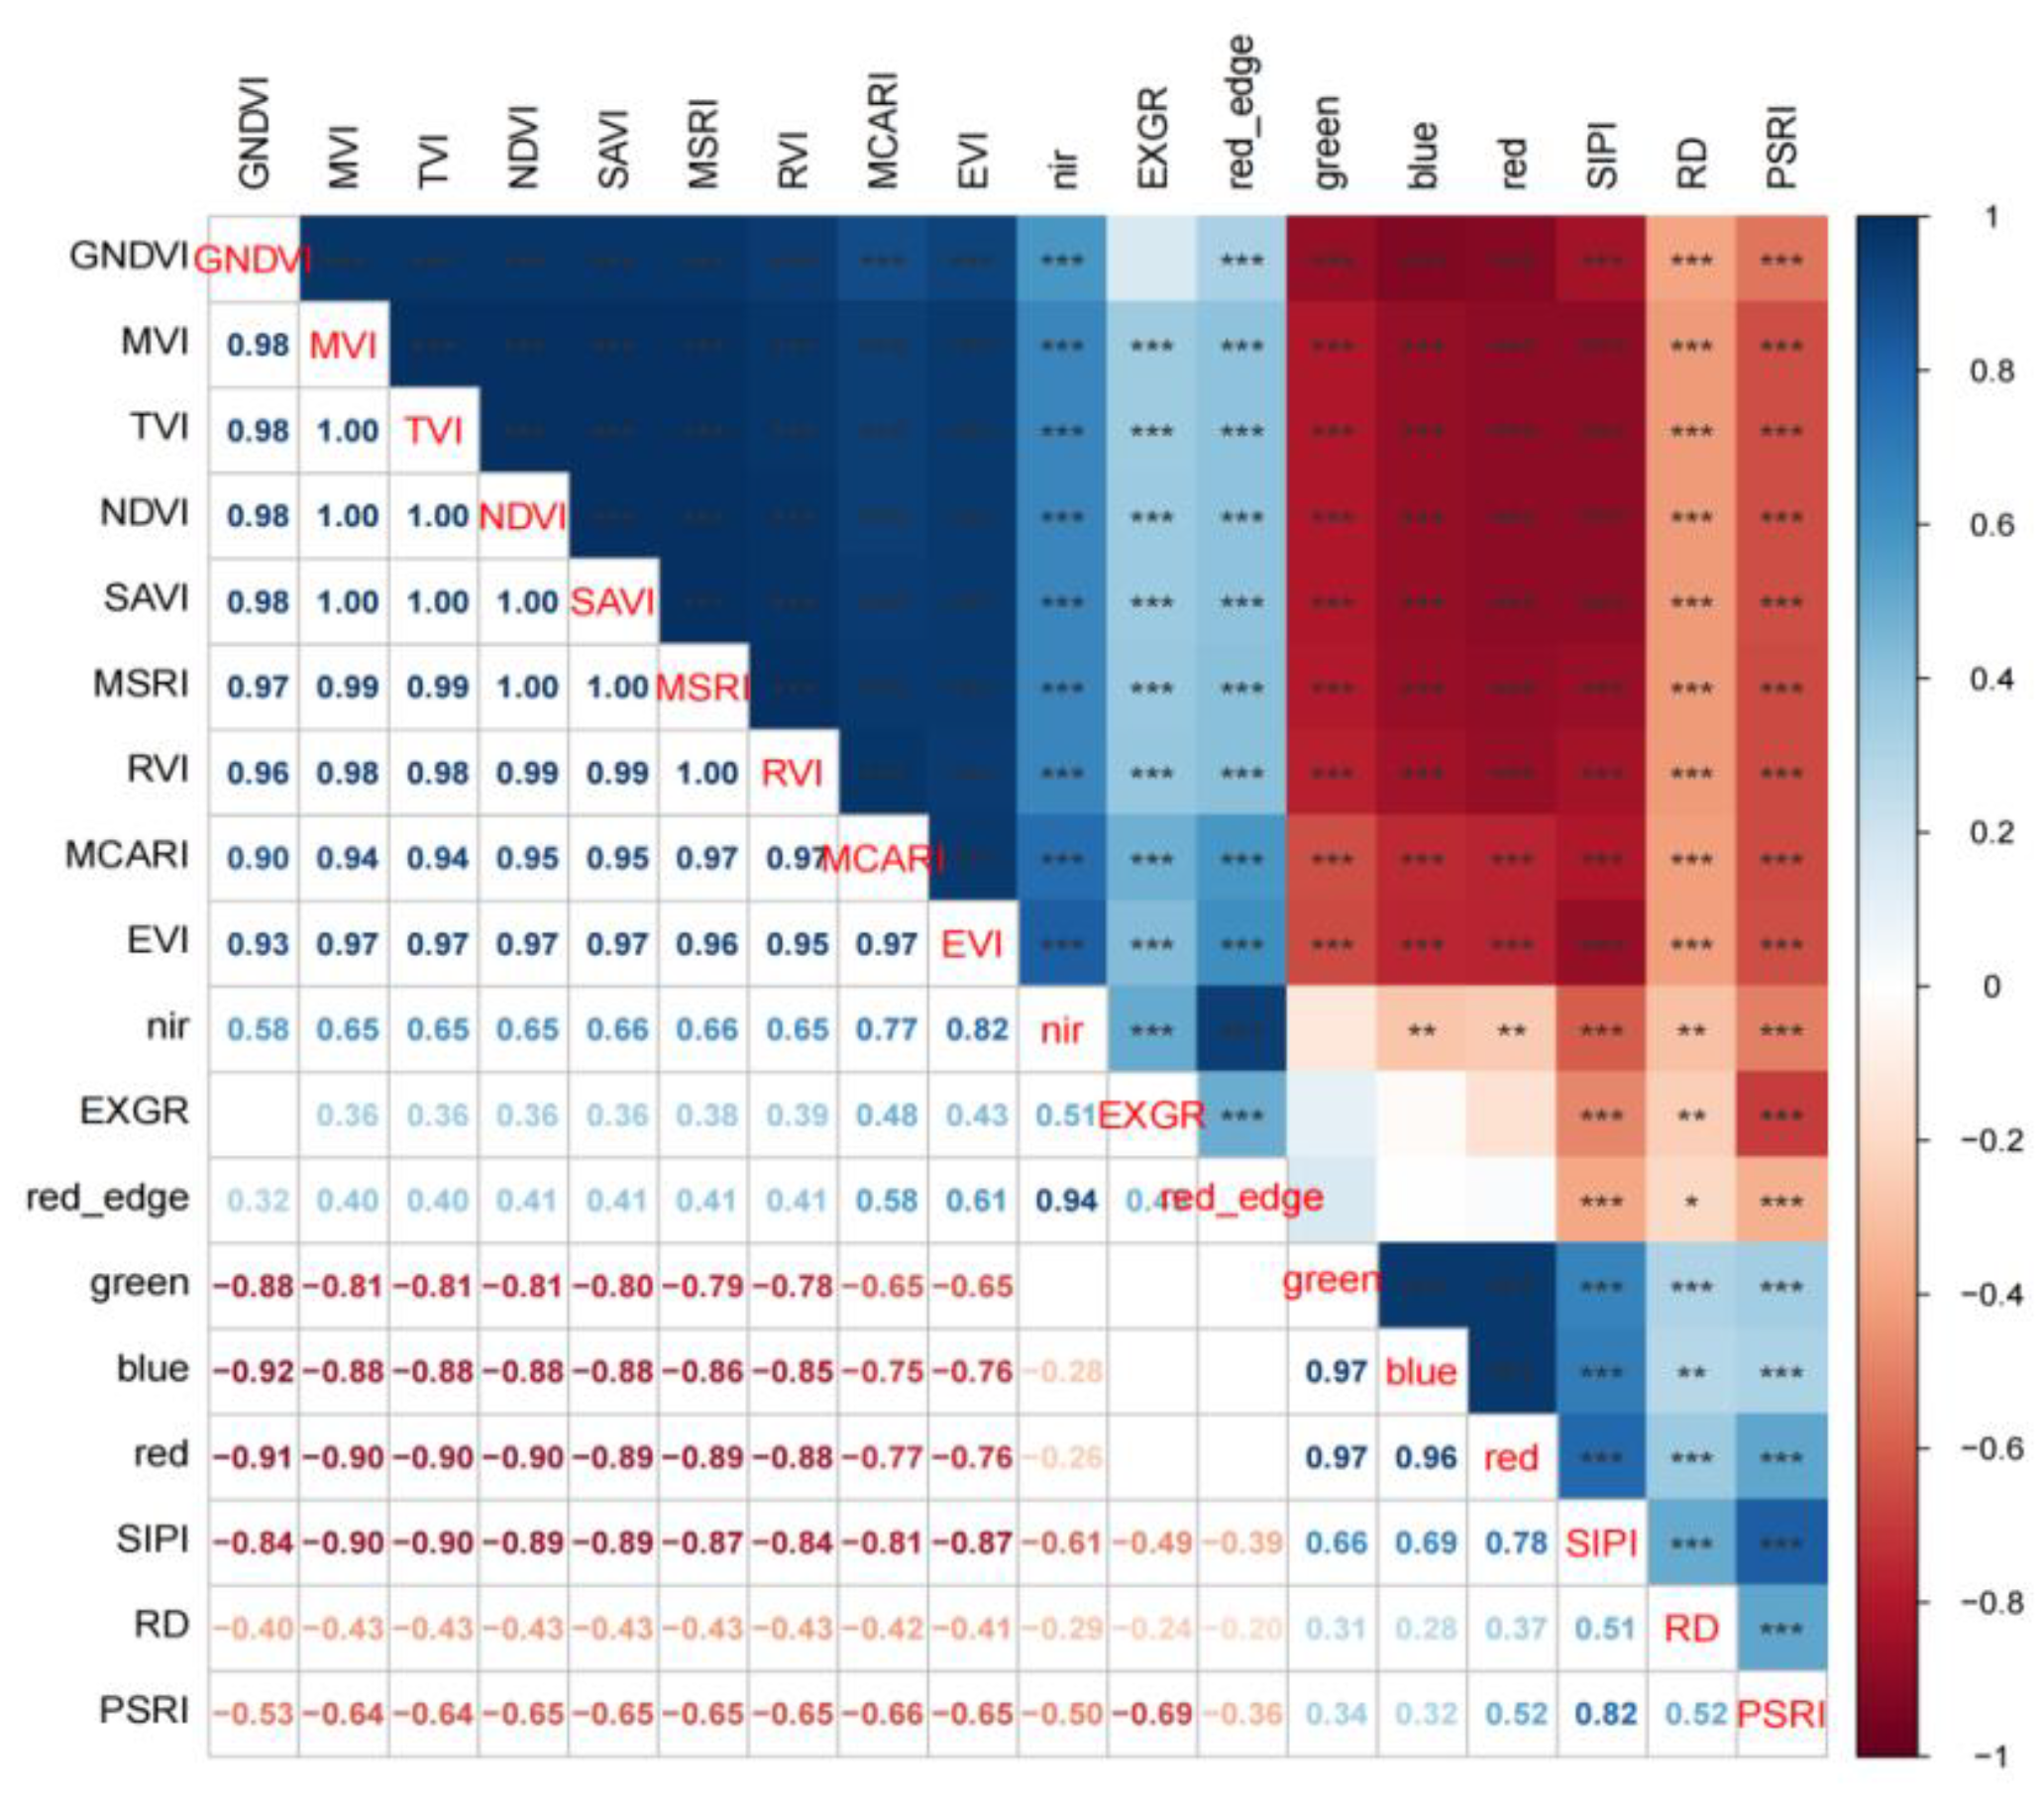
Figure 7.
PSRI clustering diagram. Type I is the germplasm resource with excellent defoliation conditions, Type II is the germplasm resource with average defoliation conditions, and Type III is the germplasm resource with poor defoliation conditions.
Figure 7.
PSRI clustering diagram. Type I is the germplasm resource with excellent defoliation conditions, Type II is the germplasm resource with average defoliation conditions, and Type III is the germplasm resource with poor defoliation conditions.
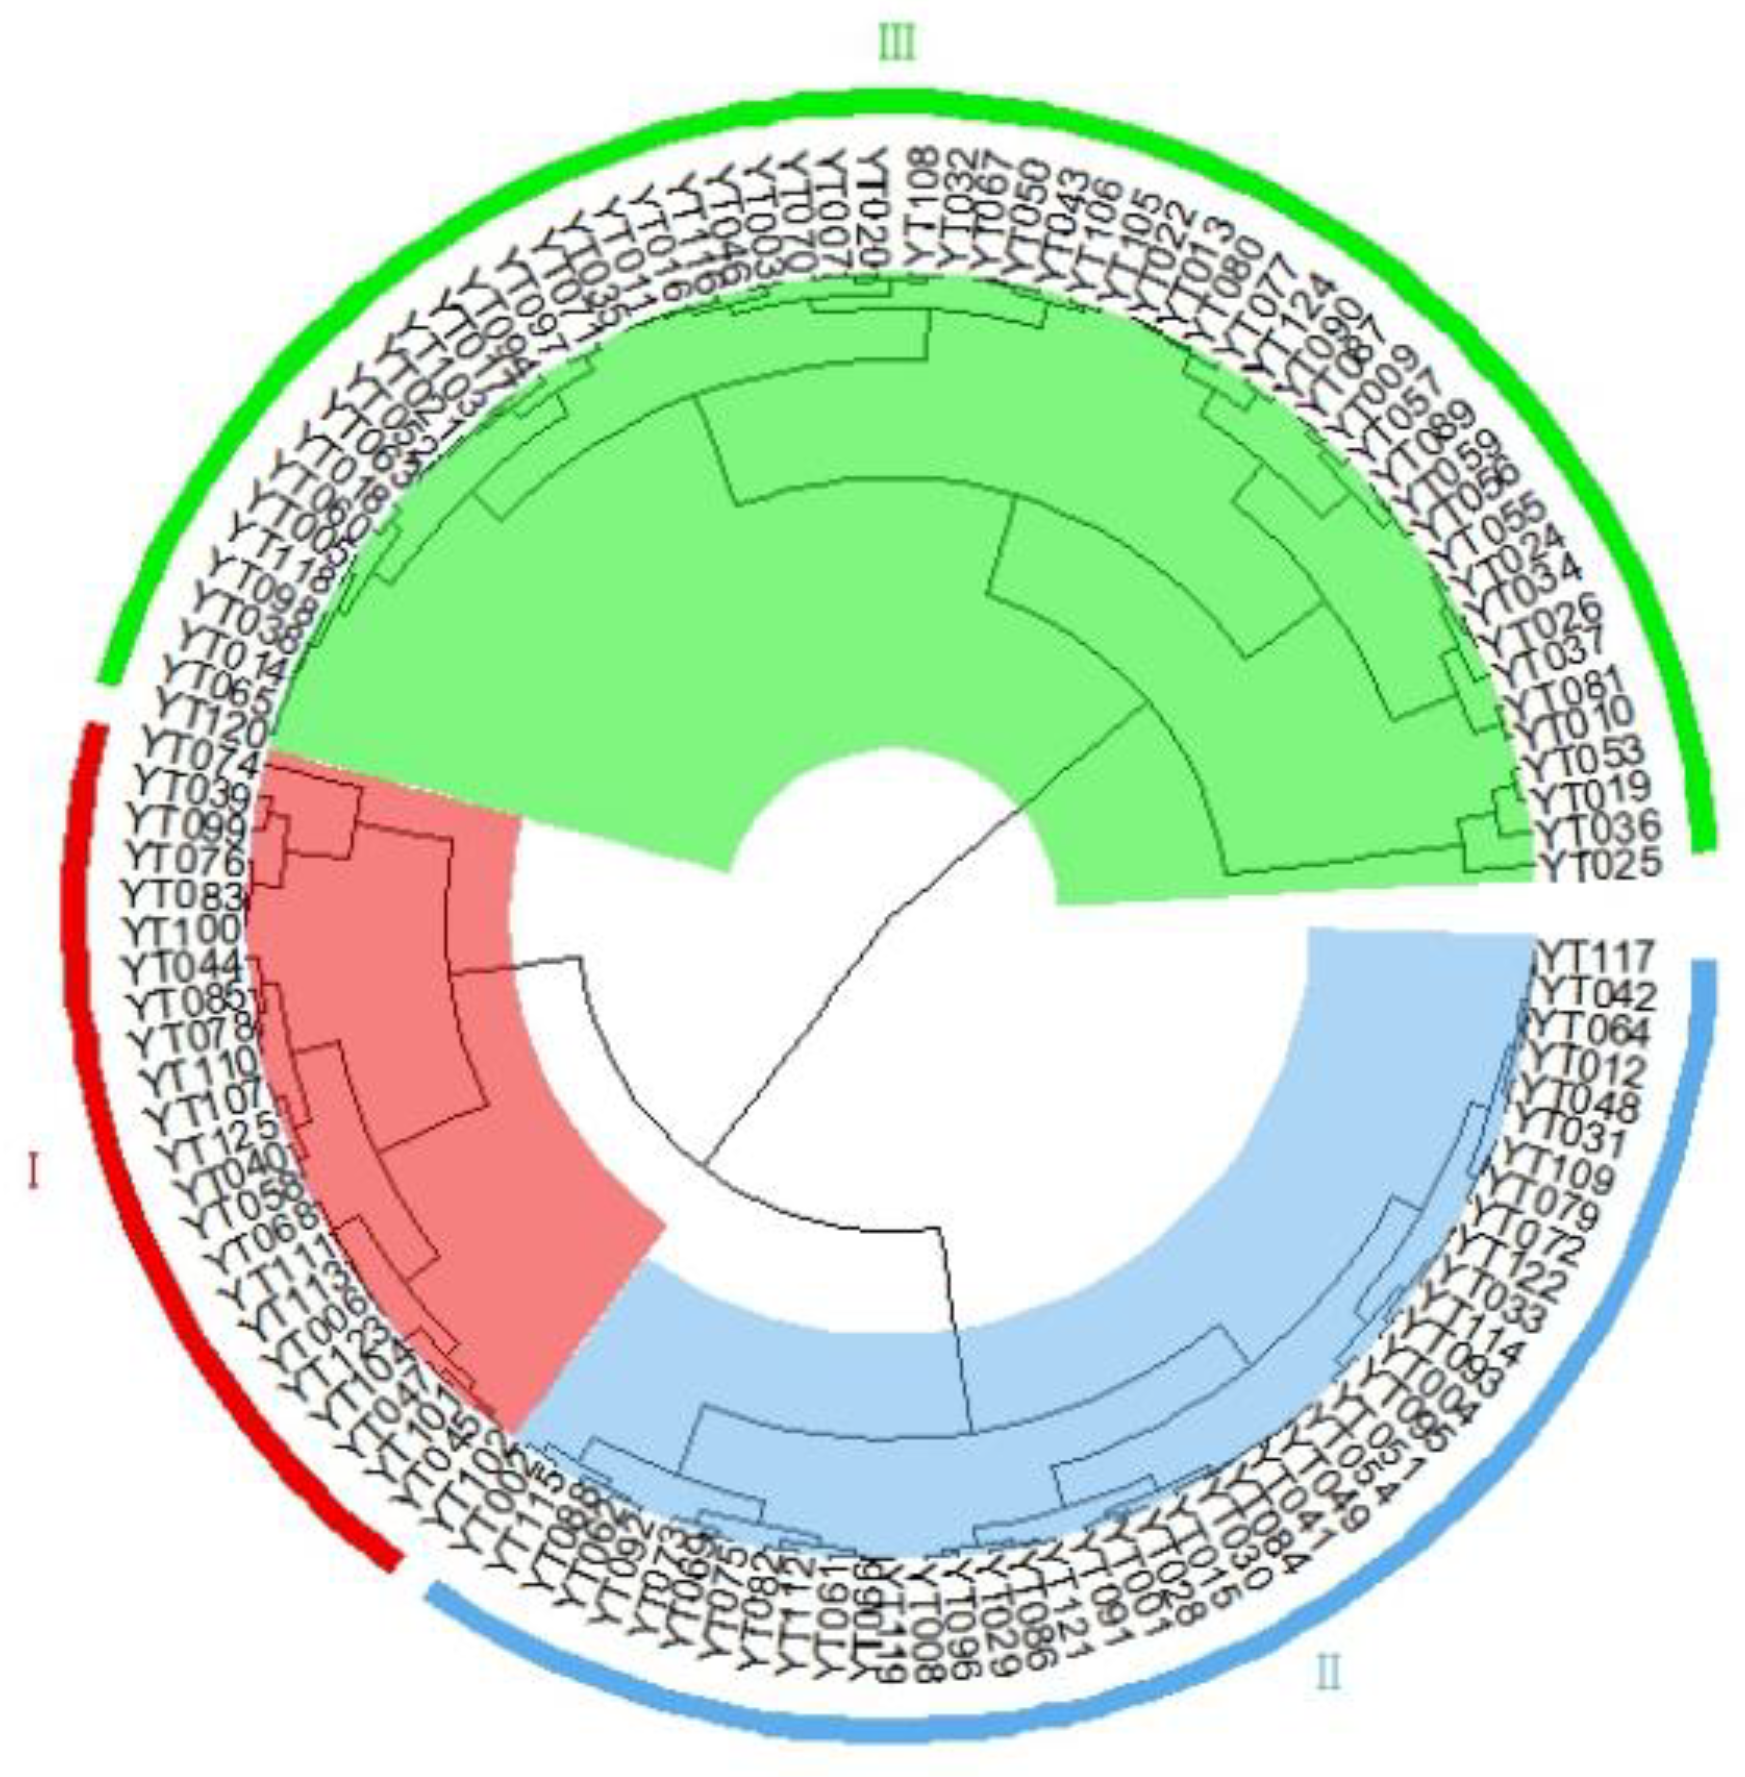

Table 1.
Names of 123 cotton breeding materials for the test.
| No. | Material Name | No. | Material Name | No. | Material Name | No. | Material Name | No. | Material Name |
| YT001 | Liaomian 25 | YT028 | Xinluzao 74 | YT053 | Ari971 | YT078 | Simian 2 | YT103 | Source Cotton 8 |
| YT002 | Liaomian 35 | YT029 | Xinluzao 75 | YT054 | BP52 | YT079 | Simian 3 | YT104 | J206-5 |
| YT003 | Shengmian 6 | YT030 | Xinluzao 76 | YT055 | Si-1470 | YT080 | Xinluzao 42 | YT105 | Guanmian 678 |
| YT004 | Xinmian 3 | YT031 | Xinluzao 78 | YT056 | J02-247 | YT081 | Xinluzao 33 | YT106 | Baijin 3045 |
| YT005 | Xinshi K18 | YT032 | Xinluzao 79 | YT057 | Z37less | YT082 | Xinluzao 23 | YT107 | Guanmian 614 |
| YT006 | Xinshi K24 | YT033 | Xinluzao 84 | YT058 | Bamian 1 | YT083 | Xinluzao 10 | YT108 | Kang 41 |
| YT007 | Chuangmian 512 | YT034 | Xinluzhong 38 | YT059 | Changkangmian | YT084 | Xinluzao 8 | YT109 | Feng Haimian |
| YT008 | Longmian 10 | YT035 | Xinluzhong 50 | YT060 | Chuan 169-6 | YT085 | Tu 83 - 161 | YT110 | Fengze 7 |
| YT009 | Jinken 1441 | YT036 | Mutant1 | YT061 | Jingzhou Degenerated Cotton | YT086 | Xinluzao 47 | YT111 | Huimin 52 |
| YT010 | Jinken 1565 | YT037 | Mutant2 | YT062 | Jing 55173 | YT087 | Xinluzao 48 | YT112 | Huimin 4 |
| YT011 | Jinken 1643 | YT038 | Mutant3 | YT063 | Jinmian 36 | YT088 | Xinluzao 49 | YT113 | Guanmian V5 |
| YT012 | Jiumian NE01 | YT039 | Mutant4 | YT064 | Jinzimian King | YT089 | Xinluzao 52 | YT114 | Genesis 8 |
| YT013 | W8225 | YT040 | Mutant5 | YT065 | Jiangsu Cotton 1 | YT090 | Xinluzao 61 | YT115 | Hexin Seed Industry 14 |
| YT014 | Xinniumian 206 | YT041 | Mutant6 | YT066 | Jimian 8 | YT091 | Xinluzhong 6 | YT116 | Guanmian 648 |
| YT015 | Zhongmiansuo 115 | YT042 | Mutant7 | YT067 | Jijiaohongye Mian | YT092 | Xinluzhong 14 | YT117 | Genesis 5 |
| YT016 | Xinluzao 27 | YT043 | Mutant8 | YT068 | Han 241 | YT093 | Xinluzhong 36 | YT118 | Zhongya Huijin 6 |
| YT017 | Xinluzao 50 | YT044 | Mutant9 | YT069 | Ganmian 12 | YT094 | Xinluzhong 41 | YT119 | Fengdekang 4 |
| YT018 | Xinluzao 51 | YT045 | Mutant10 | YT070 | Ferganskaya 175 | YT095 | Xinluzhong 54 | YT120 | Genesis 7 |
| YT019 | Xinluzao 54 | YT046 | R22-46 | YT071 | Miaohua in Judian Township, Lijiang County, Yunnan | YT096 | Zhongmiansuo 17 | YT121 | Genesis 8 |
| YT020 | Xinluzao 55 | YT047 | Xinluzao 11 | YT072 | Daihongdai | YT097 | Zhongmiansuo 12 | YT122 | Genesis 3 |
| YT021 | Xinluzao 57 | YT048 | Zhongmian Institute 43 | YT073 | Kuche 96515 | YT098 | Zhong 203016 | YT123 | Xiangsui Seed Industry 2 |
| YT022 | Xinluzao 60 | YT049 | 70-1437 | YT074 | Liaomian 9 | YT099 | Yuan 247 - 31 | YT124 | Jike Huayu 1 |
| YT024 | Xinluzao 64 | YT050 | 73-184 | YT075 | Zhongmiansuo 23 | YT100 | Yumian 1 | YT125 | Xinluzao 73 |
| YT025 | Xinluzao 68 | YT051 | AC321 | YT076 | Shaan 416 | YT101 | Xinluzhong 68 | ||
| YT026 | Xinluzao 69 | YT052 | Ari3697 | YT077 | Shen 547 | YT102 | Xinluzhong 75 |
Table 2.
Summary of Vegetation Indices.
| No. | Vegetation index | Abbreviation | Formula | Source |
| 1 | Normalized Difference Vegetation Index | NDVI | [14] | |
| 2 | Normalized Green Difference Vegetation Index | GNDVI | [15] | |
| 3 | Transformed Vegetation Index | TVI | [14] | |
| 4 | Ratio Vegetation Index | RVI | [16] | |
| 5 | Soil adjusted vegetation index | SAVI | [17] | |
| 6 | Enhanced Vegetation Index | EVI | [18] | |
| 7 | Excess Green Minus Red | EXGR | [19] | |
| 8 | Modified Chlorophyll Absorption Reflectance Index | MCARI | [20] | |
| 9 | Modified second ratio index | MSRI | [21] | |
| 10 | Moisture Vegetation Index | MVI | [22] | |
| 11 | Structure Independent Pigment Index | SIPI | [23] | |
| 12 | Plant Senescence Reflectance Index | PSRI | [24] |
Table 3.
Descriptive statistics of agronomic traits of germplasm resources.
| Traits | Average | Standard deviation | Min | Max | Coefficient of variation(%) |
| Plant height (cm) | 87.30 | 9.64 | 59.20 | 120.80 | 11.04 |
| Height of the first fruiting branch (cm) | 20.41 | 4.70 | 5.80 | 38.00 | 23.00 |
| Number of fruiting branches | 10.17 | 1.19 | 5.80 | 13.75 | 11.66 |
| Number of effective fruiting branches | 6.58 | 1.15 | 3.60 | 12.00 | 17.47 |
| Number of bolls per plant | 8.19 | 1.65 | 4.80 | 14.20 | 20.16 |
Table 4.
Defoliant-sensitive germplasm resources.
| No. | Material Name | Defoliation Rate (%) | Lint Percentage (%) | No. | Material Name | Defoliation Rate (%) | Lint Percentage (%) |
| YT078 | Simian 2 | 95.12 | 82.72 | YT119 | Fengdekang 4 | 88.11 | 100.00 |
| YT125 | Xinluzao 73 | 94.23 | 98.04 | YT065 | Jiangsu Cotton 1 | 88.10 | 75.29 |
| YT083 | Xinluzao 10 | 93.43 | 93.24 | YT039 | Mutant 4 | 88.03 | 78.48 |
| YT115 | Hexin Seed Industry 14 | 93.08 | 93.42 | YT109 | Fenghaimian | 87.91 | 86.25 |
| YT118 | Zhongya Huijin 6 | 93.05 | 97.89 | YT091 | Xinluzhong 6 | 87.57 | 89.81 |
| YT112 | Huimin 4 | 92.82 | 96.59 | YT076 | Shan 416 | 87.43 | 76.67 |
| YT087 | Xinluzao 48 | 92.67 | 81.91 | YT047 | Xinluzao 11 | 87.41 | 91.43 |
| YT099 | Yuan 247-31 | 92.57 | 94.20 | YT033 | Xinluzao 84 | 87.35 | 88.24 |
| YT101 | Xinluzhong 68 | 92.15 | 87.04 | YT102 | Xinluzhong 75 | 86.52 | 88.00 |
| YT113 | Guamian V5 | 90.97 | 88.06 | YT074 | Xinluzhong 75 | 85.95 | 97.08 |
| YT031 | Xinluzao 78 | 90.59 | 86.60 | YT068 | Han 241 | 85.81 | 86.32 |
| YT100 | Yumian 1 | 90.48 | 84.88 | YT082 | Xinluzao 23 | 85.28 | 91.57 |
| YT122 | Genesis 3 | 89.73 | 90.65 | YT075 | Zhongmiansuo 23 | 85.16 | 80.85 |
| YT114 | Genesis 8 | 89.47 | 96.15 | YT116 | Guanmian 648 | 84.95 | 95.51 |
| YT092 | Xinluzhong 14 | 89.36 | 61.84 | YT069 | Ganmian 12 | 84.92 | 81.36 |
| YT072 | Daihongdai | 89.17 | 77.17 | YT066 | Jimian 8 | 84.82 | 95.35 |
| YT104 | J206-5 | 88.56 | 91.86 | YT061 | Jingzhou Degenerated Cotton | 84.80 | 90.00 |
| YT093 | Xinluzhong 36 | 88.32 | 88.31 | YT015 | Zhongmiansuo 115 | 84.76 | 89.29 |
| YT107 | Guomian 614 | 88.31 | 94.20 |
Table 5.
PSRI screening of germplasm resources sensitive to defoliants.
| No. | Material Name | Defoliation Rate (%) | Lint Percentage (%) | PSRI | No. | Material Name | Defoliation Rate (%) | Lint Percentage (%) | PSRI |
| YT006 | New Stone K24 | 75.34 | 84.54 | 0.1696 | YT085 | Tu 83 - 161 | 72.49 | 92.31 | 0.1640 |
| YT039 | Mutant4 | 88.03 | 78.48 | 0.1795 | YT099 | Yuan 247 - 31 | 92.57 | 94.20 | 0.1819 |
| YT040 | Mutant5 | 83.23 | 73.42 | 0.1628 | YT100 | Yumian 1 | 90.48 | 84.88 | 0.1852 |
| YT044 | Mutant9 | 78.34 | 70.83 | 0.1662 | YT101 | Xinluzhong 68 | 92.15 | 87.04 | 0.1723 |
| YT045 | Mutant10 | 79.51 | 58.46 | 0.1738 | YT102 | Xinluzhong 75 | 86.52 | 88.00 | 0.1733 |
| YT047 | Xinluzao 11 | 87.41 | 91.43 | 0.1720 | YT104 | J206-5 | 88.56 | 91.86 | 0.1756 |
| YT058 | Bamian 1 | 75.76 | 95.10 | 0.1632 | YT107 | Guanmian 614 | 88.31 | 94.20 | 0.1607 |
| YT068 | Han 241 | 85.81 | 86.32 | 0.1690 | YT110 | Fengze 7 | 82.46 | 96.15 | 0.1650 |
| YT074 | Liaomian 9 | 85.95 | 97.08 | 0.1984 | YT111 | Huimin 52 | 79.37 | 98.57 | 0.1700 |
| YT076 | Shan 416 | 87.43 | 76.67 | 0.1859 | YT113 | Guanmian V5 | 90.97 | 88.06 | 0.1694 |
| YT078 | Simian 2 | 95.12 | 82.72 | 0.1649 | YT123 | Xiangsui Seed Industry 2 | 83.62 | 95.89 | 0.1697 |
| YT083 | Xinluzao 10 | 93.43 | 93.24 | 0.1852 | YT125 | Xinluzao 73 | 94.23 | 98.04 | 0.1609 |
Table 6.
The defoliation-sensitive materials jointly screened by the defoliation rate and PSRI.
| No. | Material Name | Defoliation Rate (%) | Lint Percentage (%) | PSRI | No. | Material Name | Defoliation Rate (%) | Lint Percentage (%) | PSRI |
| YT074 | Liaomian 9 | 85.95 | 97.08 | 0.1984 | YT101 | Xinluzhong 68 | 92.15 | 87.04 | 0.1723 |
| YT076 | Shaan 416 | 87.43 | 76.67 | 0.1859 | YT047 | Xinluzao 11 | 87.41 | 91.43 | 0.1720 |
| YT083 | Xinluzao 10 | 93.43 | 93.24 | 0.1852 | YT113 | Guanmian V5 | 90.97 | 88.06 | 0.1694 |
| YT100 | Yumian 1 | 90.48 | 84.88 | 0.1852 | YT068 | Han 241 | 85.81 | 86.32 | 0.1690 |
| YT099 | Yuan 247 - 31 | 92.57 | 94.20 | 0.1819 | YT078 | Simian 2 | 95.12 | 82.72 | 0.1649 |
| YT039 | Mutant4 | 88.03 | 78.48 | 0.1795 | YT107 | Guanmian 614 | 88.31 | 94.20 | 0.1607 |
| YT104 | J206-5 | 88.56 | 91.86 | 0.1756 | YT125 | Xinluzao 73 | 94.23 | 98.04 | 0.1609 |
| YT102 | Xinluzhong 75 | 86.52 | 88.00 | 0.1733 |
Disclaimer/Publisher’s Note: The statements, opinions and data contained in all publications are solely those of the individual author(s) and contributor(s) and not of MDPI and/or the editor(s). MDPI and/or the editor(s) disclaim responsibility for any injury to people or property resulting from any ideas, methods, instructions or products referred to in the content. |
© 2025 by the authors. Licensee MDPI, Basel, Switzerland. This article is an open access article distributed under the terms and conditions of the Creative Commons Attribution (CC BY) license (http://creativecommons.org/licenses/by/4.0/).
Copyright: This open access article is published under a Creative Commons CC BY 4.0 license, which permit the free download, distribution, and reuse, provided that the author and preprint are cited in any reuse.


