
Submitted:
15 January 2025
Posted:
16 January 2025
You are already at the latest version
Abstract
Vegetation serves as a vital carbon sink, crucial for regulating CO2 and O2 levels in the atmosphere. However, the declining health of vegetation can contribute to a rise in greenhouse gas emissions. Utilizing remote sensing satellite imagery, we can effectively monitor global changes in vegetation health in near-real time. While various indices have been proposed for monitoring specific biochemical properties of vegetation, they often fail to detect health deterioration caused by multiple stressors like excessive heat, salinity, and water scarcity. All of the stress caused by these stressors may not be adequately identified by indices primarily sensitive to single-leaf parameters. Thus, this study introduces a novel vegetation health indicator that identifies vegetation stress-induced changes in chlorophyll, water, and protein content. This index was validated through lab-based spectroscopy experiments and global sensitivity analysis using physical models. Results from spectroscopy experiments highlight the limitations of the Normalized Difference Vegetation Index (NDVI) and the Normalized Difference Moisture Index (NDMI) in detecting specific stressors. However, the proposed index demonstrates proficiency in detecting a broader spectrum of stresses. Global sensitivity analysis indicates promising results, showing the sensitivity to chlorophyll and water content variations in the proposed index. Further analysis, focusing on the phenology of corn crops using Sentinel-2 data, demonstrates the usefulness of our new index (SVHI) in distinguishing characteristic vegetation changes while effectively differentiating non-vegetated areas like water bodies.
Keywords:
Vegetation Health Index
; Vegetation Index
; Global Sensitivity Analysis
; Radiative transfer Model
; Spectroscopy
; Leaf Water Content
1. Introduction
Plant stress is defined as any adverse condition or substance that hinders or disrupts its metabolism, growth, or development [1]. Plant stress can be classified into two distinct types: biotic and abiotic stress. Any living organism, such as insects, pathogens, and other herbivores, causes biotic stress. Abiotic stress is instigated by external non-biological factors in the plant’s environment, encompassing water availability, temperature fluctuations, salinity levels, and other pertinent factors. As noted by [2], abiotic stress caused by limiting photosynthesis leads to increased Reactive Oxygen Species (ROS) production. This heightened ROS presence can diminish the protein levels within plants [3]. Abiotic stresses in plants can cause damage and reduced growth and sometimes may lead to the death of plant tissues [4]. These stresses occur on molecular and cellular levels, but the changes derived in plants can appear over an extensive range of spatio-temporal scales [4].
Under normal physiological conditions, a significant portion (approximately %) of the light energy absorbed by chlorophyll during photosynthesis is converted into chemical energy through photosynthetic quantum conversion [5]. This process is crucial for the plant’s energy production, resulting in the formation of glucose (a sugar). Additionally, some absorbed energy is dissipated through alternative pathways, such as heat emission (around %) and chlorophyll fluorescence ( %) [5]. However, under abiotic stress conditions, the efficiency of photosynthetic quantum conversion declines, meaning the plant’s capacity to use light energy for photosynthesis is diminished. As a result, there is an increase in both heat emission and chlorophyll fluorescence [6,7].
The alteration of absorbed energy pathways during abiotic stress conditions leads to stress-induced damage to the plant’s photosynthetic apparatus [8]. Monitoring these changes allows researchers to assess the impact of stress on plants and better understand how they respond to adverse environmental conditions. For instance, water stress negatively affects various physiological functions in plants, particularly their photosynthetic capacity [9]. Prolonged water stress significantly reduces plant growth and productivity. This stress directly impacts photosynthesis by causing stomatal closure, which decreases the availability of CO2 [10,11], and induces changes in photosynthetic metabolism [12].
Remote sensing satellite images are valuable tools for detecting vegetation stress, as each vegetation element absorbs energy at different wavelengths. Researchers can assess vegetation health by monitoring the absorption features of key leaf components, such as chlorophyll and water. Optical remote sensing in the visible near-infrared (VNIR) and shortwave infrared (SWIR) regions has been extensively used to detect these absorption features, particularly those related to chlorophyll and leaf water content. Spectral features like the red edge are also crucial for tracking changes in the biochemical properties of plants. Physiological stressors often simultaneously affect both chlorophyll and water content in leaf tissue, making it challenging to disentangle these two interdependent factors [13]. Several studies have documented significantly reduced chlorophyll content across various crops under drought stress conditions [14,15].
2. Previous Work
In recent decades, numerous vegetation indices have been developed using spectral absorbance information to serve specific purposes [16,17,18]. However, these indices have been applied in many different contexts due to their sensitivity to various vegetation parameters. For instance, several indices used to monitor vegetation stress or health, such as the Normalized Difference Vegetation Index (NDVI) [19,20,21,22], the Normalized Difference Moisture Index (NDMI) [23,24], the Global Vegetation Moisture Index (GVMI) [25], and the Enhanced Vegetation Index (EVI) [26,27], are predominantly sensitive to a single leaf parameter. A single leaf parameter typically refers to a specific attribute or characteristic of a leaf that can be measured or modeled, such as leaf chlorophyll content or leaf water content. However, the best indicator of vegetation health would be the one that is sensitive to multiple parameters simultaneously [28]. For instance, the NDMI correlates with canopy water content and is particularly useful for detecting vegetation moisture stress in vegetation [29]. It is important to note that high NDMI values may result from water bodies or vegetation with high moisture concentrations. According to [30], NDMI is more effective than NDVI in detecting subtle disturbances in vegetation. Based on radiative transfer theory, canopy reflectance in the NIR and red bands can be used to estimate the Leaf Area Index (LAI) [31]. Since NDVI also uses bands in the NIR and red regions, there is a direct relationship between NDVI and LAI. However, NDVI tends to saturate at higher LAI values. While NDVI can capture variations in LAI across time and space [28], it does not fully represent the overall health of the vegetation.
Vegetation indices are commonly used in two major applications: (1) estimating biochemical and biophysical parameters and (2) serving as proxies for vegetation traits. When estimating or retrieving biochemical and biophysical parameters, the vegetation index should be susceptible to the specific parameter of interest. Any additional sensitivity to other parameters can introduce uncertainties into the results [28]. Conversely, when monitoring vegetation health or stress, selecting an index that is not limited to a single parameter but sensitive to a combination of factors [32] is essential. The limitations of commonly used vegetation indices for health monitoring highlight the need to develop a more robust indicator for vegetation health.
In this contribution, we introduce a novel vegetation health indicator that is sensitive to vegetation chlorophyll, vegetation water content, and leaf protein content. The proposed indicator offers valuable insights into assessing overall vegetation stress. It leverages the spectral absorption features used in the widely adopted NDVI and NDMI indices, which are sensitive to leaf chlorophyll and water content, respectively. Additionally, it incorporates reflectance near 700 , associated with the red edge, which is known to be sensitive to plant chlorophyll stress [33]. The objectives of this study are threefold: (1) to introduce a novel parameter for monitoring vegetation health; (2) to validate the proposed index using lab-based spectroscopy experiment on the leaves of Saraca asoca and physical model-based Global Sensitivity Analysis (GSA) utilizing the PROSPECT-leaf model, SAIL homogeneous canopy model, and INFORM heterogeneous canopy model; and (3) to evaluate the capability of the index for spatio-temporal analysis of corn crops during the growing season. We utilize Sentinel-2 satellite data, which provide global reflectance images across multiple bands in the VNIR and SWIR channels at spatial resolutions of 10, 20, and 60 meters. The combined datasets from Sentinel-2A and 2B further enhance the temporal resolution to 5 days, offering a vast archive of imagery for global vegetation health monitoring.
3. Methodology
This section outlines the formulation of the proposed index, followed by a detailed description of the approach used for its validation.
3.1. Proposed Algorithm
This section is divided into two parts: the first part explains the theoretical foundation for developing the new index, while the second part provides details on its formulation.
3.1.1. Theoretical Basis of the Index
Absorption, reflection, and transmission are the three primary phenomena that occur when electromagnetic radiation (EMR) interacts with vegetation. In optical satellite remote sensing, most of the EMR interacts with vegetation canopies composed mainly of leaves. The biochemical pigments and internal structure of the leaves influence how different wavelengths of EMR are affected. Chlorophyll pigments absorb the blue and red regions of the EM spectrum in the leaves, and this absorbed energy is used for photosynthesis. The amount of chlorophyll also regulates the position of the red edge on the electromagnetic spectrum [34]. In stressed plants, chlorophyll content is reduced, causing the red edge to shift toward shorter wavelengths [35]. This shift has also been linked to stress induced by heavy metals [36,37]. A study by [38] has shown that reflectance near 700 is a sensitive indicator of both the red edge position and chlorophyll concentration. Therefore, the band centered at 700 is particularly useful for detecting changes in chlorophyll content.
Leaves are composed of multiple layers of different cells, including the upper epidermis, palisade mesophyll, spongy mesophyll, and lower epidermis [39]. Blue and red wavelengths are absorbed by chlorophyll in the palisade mesophyll layer. In contrast, Near-Infrared (NIR) electromagnetic radiation penetrates the palisade mesophyll and interacts with the spongy mesophyll. The spongy mesophyll consists of loosely packed, irregularly shaped cells that contain air spaces. The scattering of NIR radiation between the cell walls and these air spaces results in high NIR reflectance in healthy leaves [40]. However, when leaves experience stress, the mesophyll cells may absorb a portion of the incoming NIR radiation, decreasing NIR reflectance.
In addition to other pigments, leaves contain a significant amount of water. This water absorbs most of the energy in the shortwave-infrared (SWIR) region of the electromagnetic spectrum, effectively stretching the O-H bond. The specific absorption coefficients of pure liquid water at and are notably high. According to [41], the absorption spectra of leaf water and pure liquid water are very similar in the near-infrared (NIR) and SWIR regions. At , the electromagnetic radiation is not only absorbed by the water in the leaves but also strongly absorbed by the proteins present within them [41]. Factors such as heat, drought, salinity, and water stress can induce oxidative stress, increasing ROS [42]. This increase in ROS can damage plant proteins [2]. Consequently, energy absorption at will decrease under these stressed conditions.
3.1.2. Sentinel-2 Based Vegetation Health Index (SVHI)
The significant absorption of the EMR at specific wavelengths reveals the availability and quantity of essential pigments, such as chlorophyll, carotenoids, and water content, which are critical to governing photosynthesis in plants. The presence of these pigments offers valuable insights into vegetation health. A wide range of vegetation indices have been developed based on these absorption characteristics. Some of the most commonly used indices include the NDVI [43], EVI [44], Ratio Vegetation Index (RVI) [45], Soil Adjusted Vegetation Index (SAVI) [17], and NDMI [16], among others. These indices primarily leverage either chlorophyll-related or leaf water-related absorption features.
As discussed in Section 2, NDVI and NDMI have limitations in comprehensively detecting vegetation stress due to their primary emphasis on specific aspects of vegetation. To overcome this constraint, we propose a novel indicator in this study incorporating chlorophyll absorption features, leaf water content, and leaf protein content. By integrating these features, we aim to make the index more efficient at detecting vegetation stress. The proposed index, SVHI, is formulated as the normalized difference of X and Y, expressed as:
In this formulation, X exhibits a high value for healthy vegetation and a low value for stressed vegetation, while Y shows a high value for stressed vegetation and a low value for healthy vegetation. We formulate SVHI similarly to indices like NDVI and NDMI as a normalized difference measure with bounded values ranging from to and reduced sensitivity to topographical variations [46].
Based on the sensitivity of vegetation to different wavelengths, and considering the availability of these wavelength bands in multispectral satellite systems, X is calculated as four times the reflectance at , while Y is calculated as the sum of the reflectance values at , , , and . Thus, the index can be expressed as,
In this study, we utilize Sentinel-2 data, as it is the only operational multispectral satellite that provides all the required bands in the necessary wavelength regions for formulating the proposed index. Hence, we have termed this index the Sentinel-2 based Vegetation Health Index (SVHI), which can be expressed as:
This index utilizes the reflectance from five bands of Sentinel-2: (Red), (Red-Edge 1), (NIR), (SWIR 1), and (SWIR 2). The SVHI ranges from to , with high positive values indicating healthy vegetation, while negative values represent either dried vegetation or non-vegetation areas [47,48]. A detailed explanation of the significance of these wavelength regions is provided in Section 3.1.1. Furthermore, we performed a physical model-based sensitivity analysis and a spectroscopy lab experiment to validate the proposed index. Details of these experiments are presented in the following sections.
3.2. Physical Model-Based Validation
This section presents an overview of the radiative transfer models employed in this study, followed by a detailed explanation of the procedure used to conduct a global sensitivity analysis of the vegetation indices.
3.2.1. PROSAIL and PROINFORM
The PROSAIL [49] and PROINFORM models combine the PROSPECT (leaf optical properties model) [50] with SAIL (canopy reflectance model) [51,52] and INFORM (INvertible FOrest Reflectance Model) [53,54], respectively.
The PROSPECT-4 model simulates leaf reflectance and hemispherical transmittance based on leaf biochemical and structural parameters. It consists of four key parameters: chlorophyll a+b content (Cab), dry matter content (Cm), equivalent water thickness (Cw), and leaf structure (N). The PROSPECT-5 model extends this by adding two parameters: Carotenoids (Car) and brown pigments (Cbrown). The outputs from the PROSPECT model serve as inputs for the SAIL and INFORM models.
The SAIL model simulates canopy reflectance based on eight parameters: Leaf Area Index (LAI), leaf angle distribution (LAD) [55], soil coefficient, the ratio of diffuse to direct solar radiation, hot-spot size [56], solar zenith angle (SZA), sensor viewing angle, and relative azimuth angle. Since LAI and LAD are the only two parameters defining canopy structure, SAIL is limited to simulating the reflectance of homogeneous canopies [57].
The hybrid radiative transfer model INFORM integrates the strengths of geometric-optical radiative transfer and turbid-medium models. In this model, geometric shapes, such as tree crowns, are treated not as opaque entities but as a turbid medium. While this model is more complex, it offers a more realistic representation of forest canopies [54].
INFORM combines the SAILH [51] model, which simulates radiative transfer in the canopy layer of turbid mediums, with the FLIM [58] model to account for geometric factors such as leaf clumping, tree crowns, and crown geometry. When used with PROSPECT (PROINFORM), the model effectively simulates forest dynamics by incorporating leaf-level and canopy-level variables. The canopy-level variables include crown diameter (CD), tree height (H), stem density (SD), leaf angle distribution (LAD), understory leaf area index , and single tree leaf area index .
3.2.2. Global Sensitivity Analysis
Evaluating the sensitivity of vegetation indices to various plant properties is essential for relative comparisons. In this study, we utilized physics-based canopy reflectance models, specifically, PROSPECT-4 and PROSPECT-5 combined with SAIL (PROSAIL) and INFORM (PROINFORM) to generate theoretical reflectance values by varying different vegetation properties (Table 1).
Global Sensitivity Analysis (GSA) [59,60] was performed using the Automated Radiative Transfer Models Operator (ARTMO) [61]. The GSA toolbox in ARTMO operates on input variables of Radiative Transfer Models (RTM) using Sobol’s first-order and total-order sensitivity indices. We employed default Sobol sampling [62,63] for the input variable space of the RTM. After conducting 2000 simulations per variable [57], no significant fluctuations were observed. Therefore, we selected 2000 samples per variable, resulting in a total of 12000, 16000, 20000, 24000, 28000, and 32000 simulations for PROSPECT-4, PROSPECT-5, PROSPECT4+SAIL, PROSPECT5+SAIL, PROSPECT4+INFORM, and PROSPECT5+INFORM, respectively [64]. The total number of parameters selected for the analysis was based on the criteria established by [57].
During the simulations, we provided the minimum and maximum possible values for each parameter in the models, as detailed in Table 1. Additionally, we conducted simulations by varying the maximum value of a parameter while keeping the other parameters constant. These simulated reflectances were first converted to the spectral resolution of Sentinel-2 using the sensor-specific band settings. Following this conversion, vegetation indices such as the SVHI, NDVI, and NDMI were calculated, followed by the execution of GSA.
This analysis aimed to compare the sensitivity of the vegetation indices to different vegetation parameters and to understand the behavior of SVHI concerning variations in chlorophyll a+b content (Cab) and equivalent water thickness (Cw) at different levels.
3.3. Experimental Validation of SVHI
We conducted a lab-based spectroscopy experiment to validate our proposed index, which was carried out in two parts: (a) analysis of the effect of water content and (b) analysis of the effect of chlorophyll content. The instrument used for this experiment was an ASD FieldSpec3 spectroradiometer, which measures contiguous reflectance across the wavelength range of [65]. The spectral resolution was 1 for the and 3 for the range. This instrument provides reflectance measurements in 2151 narrow bands/channels. During each observation, the height of the sensor was kept constant at 4 from the leaf surface, and a 1000 halogen bulb served as the radiation source.
In the first experiment, 15 fresh, green, mature leaves of the Saraca asoca (Ashoka tree) were collected. Spectroscopic measurements and fresh weights were recorded for each leaf. Reflectance was measured at five distinct locations on each leaf simultaneously. The leaves were then placed in a dark room for the next four days, during which the measurements of weights and reflectances were repeated at the same time each day. After four days, the leaves were exposed to direct sunlight for one week until no weight loss was observed. Following this period, the dry weight of the leaves was measured. The measured dry weights were subsequently used to calculate the %leaf water content during each observation. The %LWC is expressed as,
where and represent the fresh weight and dry weight of the leaves, respectively. This percentage of leaf water content (LWC) is not bounded between 0 and 100. An LWC greater than 100% indicates that the mass of water content in the leaves exceeds the mass of dried leaves. Typically, fresh leaves will always exhibit an LWC higher than 100%.
In the second experiment, green healthy, stressed, and dead leaves from the same tree were collected. Five spectra were measured from different parts of each leaf. All measured spectra from both experiments were resampled to Sentinel-2 resolution using ENVI 5.6 software. These resampled spectra were then utilized to calculate SVHI, NDVI, and NDMI. To enhance the absorption features associated with different leaf conditions, we removed the continuum lines from all spectra using the method described by [66]. These spectra have been generated to illustrate the change in absorption characteristics for different conditions of leaves, including healthy, water-stressed, chlorophyll-stressed, and dead/dry leaves.
3.4. Spatio-Temporal Estimation of SVHI Using Sentinel-2
To assess the spatio-temporal evolution of SVHI, we conducted on-field tests across different growth periods of corn during a crop season. The study area is located between Webster and Boone cities in the state of Iowa, USA, which is predominantly used for agricultural practices. Corn is the most cultivated crop in this region, followed by soybeans, as indicated by the Crop Data Layer (CDL) [67]. The study area also features various land use and land cover (LULC) types, including natural vegetation (predominantly found along riverbanks), water bodies, and developed structures such as roads and settlements. Like much of the American Midwest, Iowa has a typical humid continental climate. It experiences long, humid, and warm summers, while winters are windy, cold, and snowy. The region has a fairly consistent precipitation pattern throughout the year.
This study focused on the phenological stages of corn, explicitly spanning from May to October 2021. We used the Sentinel-2 surface reflectance product to calculate vegetation indices during corn phenology. The Sentinel-2 Level 2A product, which provides surface reflectance data, is open access and globally available through platforms like [68,69]. Before conducting the analysis, all cloudy pixels in the selected scenes were masked out. To map the corn fields in the study area, we used the CDL, accessible at [67]. Figure 1 presents the study area map, illustrating the extent of corn cultivation. Additionally, we prepared the phenology chart of the corn crop for Webster City based on the Iowa Crop Weekly Progress Report for 2021 [70], shown in Figure 2.
4. Results and Discussions
In this section, we present an analysis of the sensitivity of the proposed index using physics-based models. Additionally, we describe the results of a lab-based spectroscopy experiment conducted with the leaves of Saraca asoca, which investigates the impact of chlorophyll and water content on SVHI. Finally, the utility of the proposed index is demonstrated through its application in analyzing the phenology of corn crops using Sentinel-2 satellite imagery.
4.1. Physical Model-Based GSA
Figure 3 highlights the varying sensitivities of NDVI, NDMI, and SVHI at both leaf and canopy scales. As shown, NDVI exhibits zero sensitivity towards Cw, while NDMI shows zero sensitivity to Cab. However, SVHI demonstrates substantial sensitivity to both Cab and Cw, making it more responsive to changes in these parameters. When considering the canopy reflectance, LAI is the most influential parameter for all indices. In homogeneous canopies, LAI primarily defines canopy structure, with higher LAI resulting in greater absorption in the visible and SWIR bands, leading to reduced canopy reflectance. In contrast, in heterogeneous canopies like forests, vegetation indices display additional sensitivity to structural parameters such as crown density, stem density, and leaf angle distribution, which intensifies anisotropy [28].
At the canopy scale, we focus on Canopy Chlorophyll Content (CCC) and Canopy Water Content (CWC) rather than individual leaf-level parameters such as Cab and Cw. CCC is computed as the product of Cab and LAI, expressed as:
Similarly, CWC is expressed as the product of Cw and LAI as:
As observed in previous sections, SVHI is sensitive to leaf water and chlorophyll content, so we expect it to exhibit high sensitivity to changes in CCC and CWC. These canopy-level variables represent a combined sensitivity of Cab and Cw with LAI, respectively. Therefore, any variations in CCC and CWC, which reflect the overall chlorophyll and water status of the entire canopy, should be effectively captured by SVHI.
Figure 4 and Figure 5 illustrate the change in sensitivity of SVHI at both the leaf and canopy scales for varying levels of Cab and Cw. At the leaf scale, SVHI is primarily sensitive to Cab, Cw, Cm, and Cbrown. Notably, the sensitivity to Cm increases as Cw decreases, indicating that SVHI becomes more responsive to dry matter content as leaves dry out. Similarly, SVHI becomes more sensitive to Cbrown as Cab levels decline. A similar pattern was observed in homogeneous canopy models, with SVHI showing heightened sensitivity towards LAI. However, in heterogeneous canopy models, as Cab and Cw decrease, the sensitivity of SVHI shifts further towards structural parameters such as crown density, stem density, and leaf angle distribution.
4.2. Influence of Water Content and Chlorophyll on VI
This section presents the results from the lab-based spectroscopy experiments conducted on the leaves of Saraca asoca. It is divided into two subsections: in the first part, we examine the effect of water content, and in the second, we investigate the impact of chlorophyll content.
4.2.1. Analysis of the Effect of Water Content
The indices NDVI, NDMI, and SVHI were calculated by averaging the resampled spectra from 75 observations of 15 green leaves on a daily basis. The resulting box plot, shown in Figure 6, displays these indices alongside their corresponding daily mean %LWC. All three indices demonstrate a decrease in value as the %LWC declines. Notably, the rate of decrease is more pronounced for SVHI (0.10) and NDMI (0.09) compared to NDVI (0.02) during the initial reduction in water content (refer to Table 2).
In our observations, the rate of decrease in the index value is highest for the SVHI within the % LWC ranges of 150 to 85, 85 to 52, and 52 to 32 (highlighted in bold in Table 2). Conversely, within the % LWC range of 32 to 4, the NDVI exhibits the steepest reduction in values, while the NDMI shows the lowest rate of decrease. This pronounced reduction in NDVI values within the % LWC ranges of 32 to 4 can be attributed to chlorosis, a process resulting from chlorophyll breakdown during the complete dehydration of the leaf [71].
In this setup, the effectiveness of an index is evaluated based on its sensitivity to variations in LWC. To assess whether the indices show significant differences with changes in LWC, we conducted Tukey’s HSD test on the indices calculated under consecutive LWC conditions. This test analyzes pairwise significant differences using a pairwise p-value threshold of and mean differences based on the respective critical mean as threshold [72]. Figure 6 illustrates the response of the indices at various %LWC levels. All indices display a decreasing trend in their values as the %LWC declines.
According to Tukey’s HSD test, SVHI and NDMI exhibit significantly different means, with p-values substantially lower than for all pairs of %LWC (refer to Figure S1 and Table S1 in the supplementary document). In contrast, NDVI shows a mean difference that is considerably less than the critical mean, with a p-value of for observations between 150% LWC and 85% LWC (see Figure S1 and Table S1 in the supplementary document). This finding indicates that NDVI is less effective in detecting the initial water stress condition than SVHI and NDMI.
As noted in previous literature [73], we also observed that NDVI is indirectly correlated with leaf water content. However, our experiment demonstrates that NDVI exhibits an insignificant response during the early stages of water stress, particularly when LWC decreases from 150% to 85%. This suggests that NDVI can only detect water stress when there is a substantial reduction in water content within the vegetation. In contrast, our findings indicate that both SVHI and NDMI effectively identify initial water stress conditions.
Figure 7 displays the reflectance spectra of leaves at various levels of %LWC, with the continuum removed. The red line representing 4% LWC exhibits minimal absorption features in the SWIR region. However, as the %LWC increases (indicated by lines in shades of blue), the depth of these absorption features in the SWIR region becomes significantly more pronounced. This illustrates the relationship between leaf water stress and absorption characteristics in the SWIR region. In contrast, the continuous changes in reflectance and absorption in the visible and near-infrared (VNIR) wavelength region are less pronounced than those in the shortwave infrared (SWIR) region. A slight linear increase in reflectance is observed in the red band, which appears to be absent in the blue and green wavelength regions.
To investigate the relationship between %LWC and the reflectance of B11 and B12 of Sentinel-2, we created a scatter plot comparing %LWC with the %change in SWIR reflectance relative to NIR. The percentage change can be estimated as follows:
Instead of directly utilizing SWIR reflectance, we have employed relative absorption in SWIR with respect to NIR. This approach minimizes the potential errors introduced by variations in leaf angle in the reflectance during laboratory measurements. The results of our experiment demonstrated a strong correlation between %LWC and the changes in reflectance in B11 and B12, relative to B8 of Sentinel-2 (see Figure 8). The Pearson correlation coefficient was approximately , indicating a strong relationship between the changes in reflectance in B11 and B12 and the water content in the leaves. This suggests that B11 and B12 can be effectively utilized to detect changes in vegetation water stress.
4.2.2. Analysis of the Effect of Chlorophyll
In this experiment, NDVI, NDMI, and SVHI were calculated using the average spectra of leaves in different conditions, including healthy, stressed, and dead/dry leaves. Figure 9 presents a comparative plot for all three indices. These indices were computed based on reflectances measured during a lab experiment in a dark room with a controlled source of illumination. The distance between the sensor and the leaf was 4 , minimizing the absorption of SWIR radiance by atmospheric water vapor. However, this absorption effect is present in satellite-based SWIR reflectance measurements. As a result, NDMI and SVHI values tend to be lower in lab experiments than in satellite measurements. NDVI is unaffected by this issue since it does not use the SWIR band.
In terms of behavior, both SVHI and NDVI show a gradual decrease as leaves transition from healthy to stressed and eventually to dead states. In contrast, NDMI exhibits no significant change between healthy and stressed leaves, only showing differences in dead/dry leaves due to their notably lower % LWC.
Figure 10 displays reflectance curves (with continuum removed) for leaves under various stress conditions. This figure clearly illustrates the red-edge position shifting toward shorter wavelengths as the leaves experience stress. The depth of the curve at the red wavelength is highest for healthy leaves and decreases progressively as the leaves become stressed and eventually dead. Additionally, absorption features are visible in the SWIR regions, but the depth of these absorptions diminishes when the leaves dry out and die.
Interestingly, this curve does not show distinguishable absorption features in the SWIR region that can be used to detect chlorophyll stress in the leaves. This indicates that chlorophyll-related stresses cannot be observed using SWIR reflectance alone. Instead, chlorophyll stress is best monitored using reflectance in the red and red-edge channels. NDMI, which does not use bands in the visible range of the electromagnetic spectrum, is, therefore, unable to detect chlorophyll stress, as demonstrated in Figure 9.
On the other hand, NDVI and the proposed SVHI make use of reflectance from the red and red-edge parts of the spectrum, enabling them to detect chlorophyll stress effectively. From the analysis of leaf water content and chlorophyll stress, it becomes clear that SVHI, unlike NDVI and NDMI, is sensitive to variations in both leaf water content and chlorophyll content.
In plants, ROS are consistently produced, primarily within chloroplasts, mitochondria, and peroxisomes [74]. The regulation of ROS production and removal is critical for maintaining cellular homeostasis [75]. However, several abiotic stress factors, including intense light, drought, extreme temperatures (both high and low), and mechanical stress, can disturb the delicate balance between ROS generation and scavenging mechanisms [76].
Typically, ROS production increases linearly with the severity of stress conditions [77]. Under stress, the disruption of cellular homeostasis leads to enhanced production of ROS, such as hydrogen peroxide (), singlet oxygen (), superoxide radicals (), and hydroxyl radicals () [74]. This excessive ROS accumulation can result in the oxidation of proteins in plant tissues [2,3].
Proteins in plants exhibit significant absorption of electromagnetic radiation at [41]. Under stress, a reduction in protein content leads to decreased absorption and increased reflectance at this wavelength. Since SVHI incorporates this wavelength in its formulation, it is sensitive to reductions in leaf protein content under stressful environmental conditions. Higher leaf protein content will result in increased SVHI values, whereas a decline in protein content will cause a corresponding decrease in SVHI.
Establishing a direct relationship between SVHI and changes in leaf protein content would require extensive chemical and cellular analyses, which are beyond the scope of this study. Therefore, we approach this relationship from a theoretical perspective rather than through direct experimental validation, as was done for leaf water and chlorophyll content.
4.3. Spatio-Temporal Analysis over Corn Crop
In the following section, we will explore the use of SVHI in monitoring crop phenology.
4.3.1. Analysis over Phenology of Corn Crop
This study analyzed the phenology of a corn-dominated region in Iowa. The three indices SVHI, NDVI, and NDMI were computed for six distinct dates, capturing the entire growing season of the corn crop as shown in Figure 11.
On May 26, 2021, the corn crop was in the planting stage, and the reflectance measurements were predominantly from bare soil. By October 18, 2021, the corn had reached the harvesting stage, with reflectances measured either from bare soil, where harvesting had already occurred or from dried, non-green corn plants that were ready for harvest. Consequently, the vegetation index values were notably low in both images.
On June 13, the corn crop entered the emerging stage, resulting in an increase in the values of all indices. The images acquired on July 15 and August 14 showed the corn in the silking and doughing stages, respectively, corresponding to a further rise in index values. However, by September 16, as the corn reached the mature stage, there was a reduction in the values of all indices.
We found that all three vegetation indices are capable of characterizing the phenological stages of corn. However, upon analyzing the indices for August 14th, we observed that NDVI exhibits similar values for both natural vegetation and corn. In contrast, SVHI and NDMI clearly differentiate between the two. This discrepancy arises because, at this stage, the greenness and chlorophyll content of corn are comparable to that of natural vegetation. However, the plant water content in corn at this mature stage is significantly higher than that in natural vegetation. Consequently, SVHI and NDMI yield higher values for corn crops than for natural vegetation at this stage, while NDVI fails to capture this distinction.
Interestingly, the zoomed image on the right side of Figure 11 from September 16th, 2021, illustrates that the lake (highlighted in the blue box) and the river are not discernible in the NDMI. In contrast, these features remain clearly distinguishable in both SVHI and NDVI. This phenomenon occurs because NDMI captures higher values for moisture concentration in both surface water bodies and vegetation moisture content. Consequently, NDMI exhibits similar values for healthy vegetation and water bodies, indicating that it cannot be used alone to define the moisture status and health of vegetation accurately. Conversely, SVHI and NDVI show lower values for water bodies, allowing them to differentiate healthy vegetation from surface water effectively.
4.3.2. Temporal Analysis of SVHI over Corn Crop
Three temporal scatterplots comparing NDVI, NDMI, and SVHI for the period from May to October 2021 are presented in Figure 12. A strong correlation is observed between SVHI and both NDVI () and NDMI (), indicating that SVHI captures information related to both the greenness and moisture content of the vegetation. During the reproductive stage of corn (July and August), highlighted in orange in Figure 12, NDVI becomes saturated, resulting in minimal changes in NDVI values during this period. In contrast, SVHI and NDMI do not exhibit this saturation effect. This suggests that SVHI offers a broader range of information than NDVI during this critical phenological stage.
In numerous experiments, vegetation indices have typically been selected to represent either vegetative greenness, such as NDVI or EVI (Enhanced Vegetation Index), or water sensitivity, such as NDMI or NDWI (Normalized Difference Water Index). In certain instances, NDVI has been used in conjunction with canopy temperature. However, given the varying sensitivities of these indices to greenness and water content in plants, our findings indicate that SVHI serves as a more reliable indicator of vegetation health.
5. Conclusions
In this study, we propose a vegetation health index, the Sentinel Vegetation Health Index (SVHI), which effectively accounts for the sensitivity of vegetation chlorophyll concentration and moisture content. SVHI also incorporates the shift in the red edge position due to vegetation stress and leaf protein content variations. To assess the robustness of SVHI, we conducted three types of investigations: 1) validation through lab-based spectroscopy measurements, 2) validation using physical model-based global sensitivity analysis, and 3) spatio-temporal analysis over corn crops.
The spectroscopy experiment conducted on the leaves of Saraca asoca demonstrates that chlorophyll-related stress is not distinguishable using NDMI. Conversely, early stress associated with leaf water content is insignificant in NDVI. However, the proposed SVHI effectively captures these stresses. Global sensitivity analysis reveals a strong dependency of SVHI on both chlorophyll and water content in leaves. Additionally, a study of corn crop phenology indicates that SVHI can more effectively differentiate characteristic changes in vegetation, distinctly separating vegetated areas from non-vegetated ones, such as water bodies. The temporal scatterplot over corn crops reveals that SVHI is highly correlated with NDVI and NDMI.
We conclude that the specific bands B11 and B12 in Sentinel-2 imagery can reliably detect changes in vegetation water stress. The high correlation with %LWC suggests that monitoring the changes in these bands can provide valuable insights into the water status of vegetation, which is crucial for assessing plant health and water stress. This novel vegetation index has significant potential for global application in mapping and monitoring various vegetation types, including crops and forests. With the extensive archives of global open-access datasets from Sentinel-2, there is a remarkable opportunity to monitor the health of global vegetation at high resolution. The upcoming Sentinel-2C and 2D satellites are set to succeed the currently operational Sentinel-2A and 2B satellites, ensuring the continuous availability of Sentinel-2 datasets well into the future.
While the proposed index does not facilitate daily monitoring of vegetation health changes at small scales due to the temporal resolution limitations of the Sentinel-2 satellite series, there is potential to develop similar indices using satellites with exceptionally high temporal resolutions. Additionally, exploring Synthetic Aperture Radar (SAR) datasets could provide opportunities to monitor vegetation health and degradation under all weather conditions, especially in regions that experience persistent cloud cover throughout the year. Since the proposed index (SVHI) is specifically designed to map vegetation health and stress, it may not be particularly effective in estimating most vegetation biochemical and biophysical parameters such as chlorophyll content, vegetation water content, or leaf area index (LAI). However, despite these minor limitations, this index has significant potential for various applications, such as forest fire detection, assessing vegetation health, drought monitoring, and crop phenology mapping.
References
Supplementary Materials
The following supporting information can be downloaded at the website of this paper posted on Preprints.org
Author Contributions
Conceptualization: SK and SSG; Investigation: SK, SSG, DM, AB, AP, and LK; Methodology: SK and SSG; Software: SK; Validation: SK, SSG, and DM; Writing-original draft: all; Writing-review & editing: all; Supervision: AB, AP, and LK; All authors have read and agreed to the published version of the manuscript.
Funding
Not applicable
Institutional Review Board Statement
Not applicable
Informed Consent Statement
Not applicable
Data Availability Statement
The JavaScript code to calculate SVHI on the Google Earth Engine platform can be accessed through https://github.com/SandeepKr5/SVHI.
Acknowledgments
The authors would like to express their gratitude to Dr. Bo-Cai Gao from the Remote Sensing Division of the Naval Research Laboratory, Washington, DC, USA, for the fruitful discussions. This research was conducted as part of the funded project titled “Modeling of Forest Disturbances Using Multi-Sensor Remote Sensing Data and GIS,” supported by the DST-sponsored Geospatial Information Science and Engineering (GISE) Hub at IIT Bombay.
Conflicts of Interest
The authors declare no conflict of interest.
References
- Lichtenthaler, H.K. The stress concept in plants: an introduction. Annals of the new York Academy of sciences 1998, 851, 187–198. [Google Scholar] [CrossRef]
- Sharma, P.; Jha, A.B.; Dubey, R.S.; Pessarakli, M. Reactive oxygen species, oxidative damage, and antioxidative defense mechanism in plants under stressful conditions. Journal of botany 2012, 2012, 217037. [Google Scholar] [CrossRef]
- Dumanović, J.; Nepovimova, E.; Natić, M.; Kuča, K.; Jaćević, V. The significance of reactive oxygen species and antioxidant defense system in plants: A concise overview. Frontiers in plant science 2021, 11, 552969. [Google Scholar] [CrossRef] [PubMed]
- Coatsworth, P.; Gonzalez-Macia, L.; Collins, A.S.P.; Bozkurt, T.; Güder, F. Continuous monitoring of chemical signals in plants under stress. Nature Reviews Chemistry 2023, 7, 7–25. [Google Scholar] [CrossRef] [PubMed]
- Lichtenthaler, H.K. Vegetation stress: an introduction to the stress concept in plants. Journal of plant physiology 1996, 148, 4–14. [Google Scholar] [CrossRef]
- Lichtenthaler, H.K.; Rinderle, U. The role of chlorophyll fluorescence in the detection of stress conditions in plants. CRC Critical Reviews in Analytical Chemistry 1988, 19, S29–S85. [Google Scholar] [CrossRef]
- Schweiger, J.; Lang, M.; Lichtenthaler, H.K. Differences in fluorescence excitation spectra of leaves between stressed and non-stressed plants. Journal of Plant Physiology 1996, 148, 536–547. [Google Scholar] [CrossRef]
- Lang, M.; Lichtenthaler, H.K.; Sowinska, M.; Heisel, F.; Miehé, J.A. Fluorescence imaging of water and temperature stress in plant leaves. Journal of plant physiology 1996, 148, 613–621. [Google Scholar] [CrossRef]
- Osakabe, Y.; Osakabe, K.; Shinozaki, K.; Tran, L.S.P. Response of plants to water stress. Frontiers in plant science 2014, 5, 86. [Google Scholar] [CrossRef]
- Flexas, J.; Bota, J.; Galmés, J.; Medrano, H.; Ribas-Carbó, M. Keeping a positive carbon balance under adverse conditions: responses of photosynthesis and respiration to water stress. Physiologia Plantarum 2006, 127, 343–352. [Google Scholar] [CrossRef]
- Chaves, M.M.; Flexas, J.; Pinheiro, C. Photosynthesis under drought and salt stress: regulation mechanisms from whole plant to cell. Annals of botany 2009, 103, 551–560. [Google Scholar] [CrossRef]
- Lawlor, D.W.; Cornic, G. Photosynthetic carbon assimilation and associated metabolism in relation to water deficits in higher plants. Plant, cell & environment 2002, 25, 275–294. [Google Scholar] [CrossRef]
- Hazrati, S.; Tahmasebi-Sarvestani, Z.; Modarres-Sanavy, S.A.M.; Mokhtassi-Bidgoli, A.; Nicola, S. Effects of water stress and light intensity on chlorophyll fluorescence parameters and pigments of Aloe vera L. Plant Physiology and Biochemistry 2016, 106, 141–148. [Google Scholar] [CrossRef]
- Gholamin, R.; Khayatnezhad, M.; et al. The effect of end season drought stress on the chlorophyll content, chlorophyll fluorescence parameters and yield in maize cultivars. Sci. Res. Essays 2011, 6, 5351–5357. [Google Scholar]
- Farooq, M.; Wahid, A.; Kobayashi, N.; Fujita, D.; Basra, S. Plant drought stress: effects, mechanisms and management. Sustainable agriculture 2009, 153–188. [Google Scholar]
- Gao, B.C. NDWI—A normalized difference water index for remote sensing of vegetation liquid water from space. Remote sensing of environment 1996, 58, 257–266. [Google Scholar] [CrossRef]
- Huete, A.R. A soil-adjusted vegetation index (SAVI). Remote sensing of environment 1988, 25, 295–309. [Google Scholar] [CrossRef]
- Gitelson, A.A. Wide dynamic range vegetation index for remote quantification of biophysical characteristics of vegetation. Journal of plant physiology 2004, 161, 165–173. [Google Scholar] [CrossRef]
- Wen, Z.; Wu, S.; Chen, J.; Lü, M. NDVI indicated long-term interannual changes in vegetation activities and their responses to climatic and anthropogenic factors in the Three Gorges Reservoir Region, China. Science of the Total Environment 2017, 574, 947–959. [Google Scholar] [CrossRef] [PubMed]
- Fokeng, R.M.; Fogwe, Z.N. Landsat NDVI-based vegetation degradation dynamics and its response to rainfall variability and anthropogenic stressors in Southern Bui Plateau, Cameroon. Geosystems and Geoenvironment 2022, 1, 100075. [Google Scholar] [CrossRef]
- Pettorelli, N.; Vik, J.O.; Mysterud, A.; Gaillard, J.M.; Tucker, C.J.; Stenseth, N.C. Using the satellite-derived NDVI to assess ecological responses to environmental change. Trends in ecology & evolution 2005, 20, 503–510. [Google Scholar] [CrossRef]
- Roerink, G.J.; Menenti, M.; Soepboer, W.; Su, Z. Assessment of climate impact on vegetation dynamics by using remote sensing. Physics and Chemistry of the Earth, Parts A/B/C 2003, 28, 103–109. [Google Scholar] [CrossRef]
- Wilson, N.R.; Norman, L.M. Analysis of vegetation recovery surrounding a restored wetland using the normalized difference infrared index (NDII) and normalized difference vegetation index (NDVI). International Journal of Remote Sensing 2018, 39, 3243–3274. [Google Scholar] [CrossRef]
- Gu, Y.; Hunt, E.; Wardlow, B.; Basara, J.B.; Brown, J.F.; Verdin, J.P. Evaluation of MODIS NDVI and NDWI for vegetation drought monitoring using Oklahoma Mesonet soil moisture data. Geophysical Research Letters 2008, 35. [Google Scholar] [CrossRef]
- Swathandran, S.; Aslam, M.M. Assessing the role of SWIR band in detecting agricultural crop stress: A case study of Raichur district, Karnataka, India. Environmental monitoring and assessment 2019, 191, 442. [Google Scholar] [CrossRef] [PubMed]
- Paliwal, A.; Laborte, A.; Nelson, A.; Singh, R. Salinity stress detection in rice crops using time series MODIS VI data. International journal of remote sensing 2019, 40, 8186–8202. [Google Scholar] [CrossRef]
- Samanta, A.; Ganguly, S.; Hashimoto, H.; Devadiga, S.; Vermote, E.; Knyazikhin, Y.; Nemani, R.R.; Myneni, R.B. Amazon forests did not green-up during the 2005 drought. Geophysical research letters 2010, 37. [Google Scholar] [CrossRef]
- Wang, S.; Yang, D.; Li, Z.; Liu, L.; Huang, C.; Zhang, L. A global sensitivity analysis of commonly used satellite-derived vegetation indices for homogeneous canopies based on model simulation and random forest learning. Remote Sensing 2019, 11, 2547. [Google Scholar] [CrossRef]
- Hardisky, M.A.; Klemas, V.; Smart, R. The influence of soil salinity, growth form, and leaf moisture on-the spectral radiance of Spartina alterniflora Canopies. Photogrammetric Engineering and Remote Sensing 1983, 49, 77–83. [Google Scholar]
- Wilson, E.H.; Sader, S.A. Detection of forest harvest type using multiple dates of Landsat TM imagery. Remote Sensing of Environment 2002, 80, 385–396. [Google Scholar] [CrossRef]
- Knyazikhin, Y.; Martonchik, J.; Diner, D.; Myneni, R.; Verstraete, M.; Pinty, B.; Gobron, N. Estimation of vegetation canopy leaf area index and fraction of absorbed photosynthetically active radiation from atmosphere-corrected MISR data. Journal of Geophysical Research: Atmospheres 1998, 103, 32239–32256. [Google Scholar] [CrossRef]
- Zhang, L.; Jiao, W.; Zhang, H.; Huang, C.; Tong, Q. Studying drought phenomena in the Continental United States in 2011 and 2012 using various drought indices. Remote sensing of environment 2017, 190, 96–106. [Google Scholar] [CrossRef]
- Collins, W. Remote sensing of crop type and maturity. Photogrammetric Engineering and Remote Sensing 1978, 44, 43–55. [Google Scholar]
- Gates, D.M.; Keegan, H.J.; Schleter, J.C.; Weidner, V.R. Spectral properties of plants. Applied optics 1965, 4, 11–20. [Google Scholar] [CrossRef]
- Rock, B.; Hoshizaki, T.; Miller, J. Comparison of in situ and airborne spectral measurements of the blue shift associated with forest decline. Remote Sensing of Environment 1988, 24, 109–127. [Google Scholar] [CrossRef]
- Horler, D.; Barber, J.; Barringer, A. Effects of heavy metals on the absorbance and reflectance spectra of plants. International Journal of Remote Sensing 1980, 1, 121–136. [Google Scholar] [CrossRef]
- Horler, D.; Dockray, M.; Barber, J.; Barringer, A. Red edge measurements for remotely sensing plant chlorophyll content. Advances in Space Research 1983, 3, 273–277. [Google Scholar] [CrossRef]
- Gitelson, A.A.; Merzlyak, M.N.; Lichtenthaler, H.K. Detection of red edge position and chlorophyll content by reflectance measurements near 700 nm. Journal of plant physiology 1996, 148, 501–508. [Google Scholar] [CrossRef]
- Mader, S.S. Concepts of Biology. McGraw-Hill Education, 2014. [Google Scholar]
- Kupfer, J.A.; Emerson, C.W. Remote Sensing. In Encyclopedia of Social Measurement; Kempf-Leonard, K., Ed.; Elsevier: New York, 2005; pp. 377–383. [Google Scholar] [CrossRef]
- Jacquemoud, S.; Ustin, S. Spectroscopy of Leaf Molecules. In Leaf Optical Properties; Cambridge University Press, 2019; pp. 48–73. [Google Scholar] [CrossRef]
- Chauhan, J.; Singh, P.; Choyal, P.; Mishra, U.N.; Saha, D.; Kumar, R.; Anuragi, H.; Pandey, S.; Bose, B.; Mehta, B.; et al. Plant photosynthesis under abiotic stresses: Damages, adaptive, and signaling mechanisms. Plant Stress, 1002. [Google Scholar] [CrossRef]
- Rouse Jr, J.W.; Haas, R.H.; Deering, D.; Schell, J.; Harlan, J.C. Monitoring the vernal advancement and retrogradation (green wave effect) of natural vegetation. Technical report, 1974.
- Liu, H.Q.; Huete, A. A feedback based modification of the NDVI to minimize canopy background and atmospheric noise. IEEE transactions on geoscience and remote sensing 1995, 33, 457–465. [Google Scholar] [CrossRef]
- Pearson, R.L.; Miller, L.D. Remote mapping of standing crop biomass for estimation of the productivity of the shortgrass prairie. Remote sensing of environment 1972, VIII, 1355. [Google Scholar]
- Matsushita, B.; Yang, W.; Chen, J.; Onda, Y.; Qiu, G. Sensitivity of the enhanced vegetation index (EVI) and normalized difference vegetation index (NDVI) to topographic effects: a case study in high-density cypress forest. Sensors 2007, 7, 2636–2651. [Google Scholar] [CrossRef] [PubMed]
- Kumar, S.; Ghosh, S.S.; Mandal, D.; Porwal, A.; Bhattacharya, A. A Sentinel-2 Vegetation Health Index. In Proceedings of the 2023 IEEE India Geoscience and Remote Sensing Symposium (InGARSS). IEEE; 2023; pp. 1–4. [Google Scholar]
- Kumar, S.; Nihar, A.; Verma, A.; Ghosh, S.S.; Bhattacharya, A. Crop Residue Burning and its Impact on air Quality: A Case Study on Northern India. In Proceedings of the IGARSS 2024-2024 IEEE International Geoscience and Remote Sensing Symposium. IEEE; 2024; pp. 863–866. [Google Scholar]
- Jacquemoud, S.; Verhoef, W.; Baret, F.; Bacour, C.; Zarco-Tejada, P.J.; Asner, G.P.; François, C.; Ustin, S.L. PROSPECT+ SAIL models: A review of use for vegetation characterization. Remote sensing of environment 2009, 113, S56–S66. [Google Scholar] [CrossRef]
- Jacquemoud, S.; Baret, F. PROSPECT: A model of leaf optical properties spectra. Remote sensing of environment 1990, 34, 75–91. [Google Scholar] [CrossRef]
- Verhoef, W. Light scattering by leaf layers with application to canopy reflectance modeling: The SAIL model. Remote sensing of environment 1984, 16, 125–141. [Google Scholar] [CrossRef]
- Verhoef, W. Earth observation modeling based on layer scattering matrices. Remote sensing of environment 1985, 17, 165–178. [Google Scholar] [CrossRef]
- Atzberger, C. Development of an invertible forest reflectance model: The INFOR-model. In Proceedings of the A decade of trans-european remote sensing cooperation. Proceedings of the 20th EARSeL Symposium Dresden, Germany, 2000, Vol.
- Schlerf, M.; Atzberger, C. Inversion of a forest reflectance model to estimate structural canopy variables from hyperspectral remote sensing data. Remote sensing of environment 2006, 100, 281–294. [Google Scholar] [CrossRef]
- Campbell, G. Derivation of an angle density function for canopies with ellipsoidal leaf angle distributions. Agricultural and forest meteorology 1990, 49, 173–176. [Google Scholar] [CrossRef]
- Kuusk, A. A fast, invertible canopy reflectance model. Remote Sensing of Environment 1995, 51, 342–350. [Google Scholar] [CrossRef]
- Morcillo-Pallarés, P.; Rivera-Caicedo, J.P.; Belda, S.; De Grave, C.; Burriel, H.; Moreno, J.; Verrelst, J. Quantifying the robustness of vegetation indices through global sensitivity analysis of homogeneous and forest leaf-canopy radiative transfer models. Remote Sensing 2019, 11, 2418. [Google Scholar] [CrossRef]
- Rosema, A.; Verhoef, W.; Noorbergen, H.; Borgesius, J. A new forest light interaction model in support of forest monitoring. Remote Sensing of Environment 1992, 42, 23–41. [Google Scholar] [CrossRef]
- Sobol’, I.M. On sensitivity estimation for nonlinear mathematical models. Matematicheskoe modelirovanie 1990, 2, 112–118. [Google Scholar]
- Saltelli, A.; Ratto, M.; Andres, T.; Campolongo, F.; Cariboni, J.; Gatelli, D.; Saisana, M.; Tarantola, S. Global sensitivity analysis: the primer, John Wiley & Sons, 2008. [CrossRef]
- Verrelst, J.; Rivera, J.; Alonso, L.; Moreno, J. ARTMO: An Automated Radiative Transfer Models Operator toolbox for automated retrieval of biophysical parameters through model inversion. In Proceedings of the Proceedings of the EARSeL 7th SIG-Imaging Spectroscopy Workshop, Edinburgh, UK, 2011; pp. 11–13.
- Sobol’, I.M. On the distribution of points in a cube and the approximate evaluation of integrals. USSR Computational Mathematics and Mathematical Physics 1967, 7, 784–802. [Google Scholar] [CrossRef]
- Sobol, I.; Levitan, Y.L. A pseudo-random number generator for personal computers. Computers & Mathematics with Applications 1999, 37, 33–40. [Google Scholar] [CrossRef]
- Saltelli, A. Making best use of model evaluations to compute sensitivity indices. Computer physics communications 2002, 145, 280–297. [Google Scholar] [CrossRef]
- Guha, A.; Vinod Kumar, K.; Porwal, A.; Rani, K.; Sahoo, K.; Aneesh Kumar, S.; Singaraju, V.; Singh, R.; Khandelwal, M.; Raju, P.; et al. Reflectance spectroscopy and ASTER based mapping of rock-phosphate in parts of Paleoproterozoic sequences of Aravalli group of rocks, Rajasthan, India. Ore Geology Reviews 2019, 108, 73–87. [Google Scholar] [CrossRef]
- Dhoundiyal, S.; Porwal, A.; Niveditha, C.; Thangjam, G.; Aranha, M.; Kumar, S.; Paul, D.; Kalimuthu, R. A novel algorithm for mapping carbonates using CRISM hyperspectral data. Icarus 2023, 397, 115504. [Google Scholar] [CrossRef]
- CroplandCROS. USDA’s National Agricultural Statistics Service. Last accessed 18 January 2024.
- Planetary Computer. Sentinel-2 Level-2A. Last accessed 17 January 2024.
- Google Earth Engine. Sentinel-2 MSI: MultiSpectral Instrument, Level-2A. Last accessed 18 January 2024.
- USDA. National Agricultural Statistics Service, 2021. Last accessed 17 January 2024.
- Seelig, H.D.; Hoehn, A.; Stodieck, L.; Klaus, D.; Adams Iii, W.; Emery, W. The assessment of leaf water content using leaf reflectance ratios in the visible, near-, and short-wave-infrared. International Journal of Remote Sensing 2008, 29, 3701–3713. [Google Scholar] [CrossRef]
- Abdi, H.; Williams, L.J. Tukey’s honestly significant difference (HSD) test. Encyclopedia of research design 2010, 3, 1–5. [Google Scholar]
- Chuvieco, E.; Riaño, D.; Aguado, I.; Cocero, D. Estimation of fuel moisture content from multitemporal analysis of Landsat Thematic Mapper reflectance data: applications in fire danger assessment. International journal of remote sensing 2002, 23, 2145–2162. [Google Scholar] [CrossRef]
- Apel, K.; Hirt, H. Reactive oxygen species: metabolism, oxidative stress, and signal transduction. Annu. Rev. Plant Biol. 2004, 55, 373–399. [Google Scholar] [CrossRef] [PubMed]
- Sahu, P.K.; Jayalakshmi, K.; Tilgam, J.; Gupta, A.; Nagaraju, Y.; Kumar, A.; Hamid, S.; Singh, H.V.; Minkina, T.; Rajput, V.D.; et al. ROS generated from biotic stress: Effects on plants and alleviation by endophytic microbes. Frontiers in Plant Science 2022, 13, 1042936. [Google Scholar] [CrossRef] [PubMed]
- Prasad, T.K.; Anderson, M.D.; Martin, B.A.; Stewart, C.R. Evidence for chilling-induced oxidative stress in maize seedlings and a regulatory role for hydrogen peroxide. The Plant Cell 1994, 6, 65–74. [Google Scholar] [CrossRef] [PubMed]
- Hussain, H.A.; Hussain, S.; Khaliq, A.; Ashraf, U.; Anjum, S.A.; Men, S.; Wang, L. Chilling and drought stresses in crop plants: implications, cross talk, and potential management opportunities. Frontiers in plant science 2018, 9, 393. [Google Scholar] [CrossRef] [PubMed]
Figure 1.
(a) The administrative boundary of USA with highlighting IOWA state, (b) False Colour Composite (R:NIR, G:Red, B:Green) Map of parts of Iowa state, and (c) LULC map of the study area.
Figure 1.
(a) The administrative boundary of USA with highlighting IOWA state, (b) False Colour Composite (R:NIR, G:Red, B:Green) Map of parts of Iowa state, and (c) LULC map of the study area.
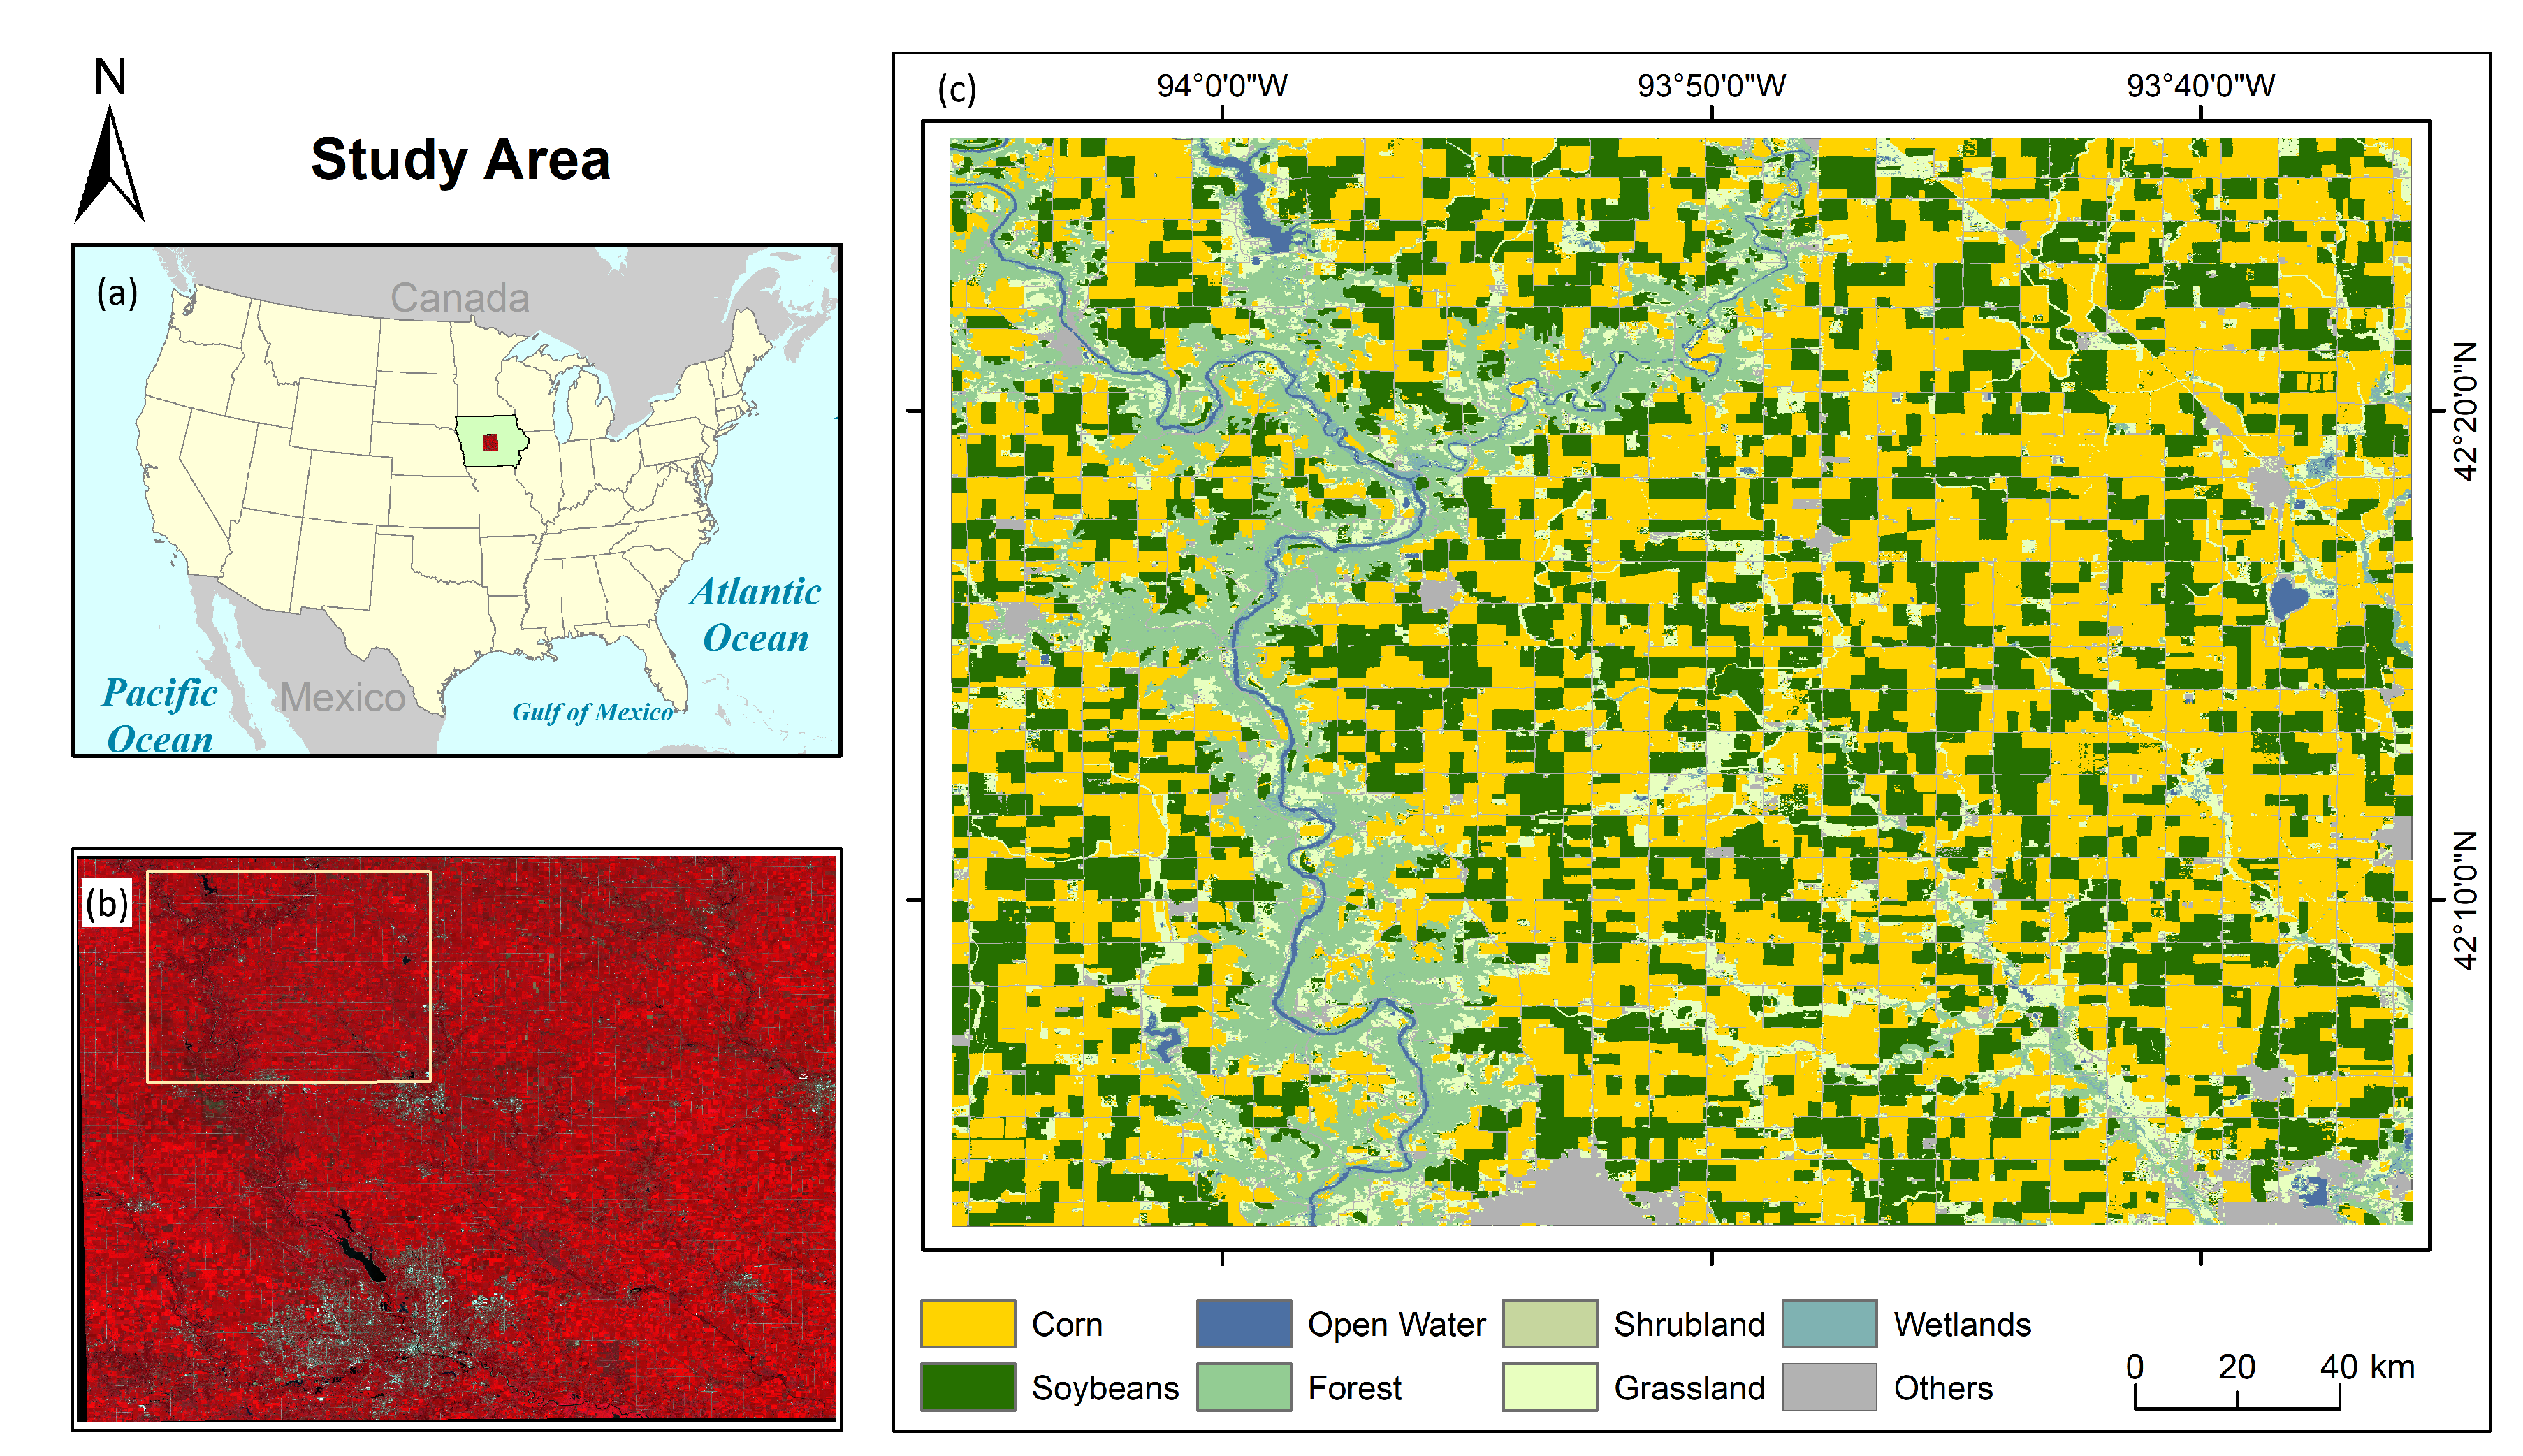
Figure 2.
This figure shows phenology of Corn crop in Webster city, Iowa, USA.
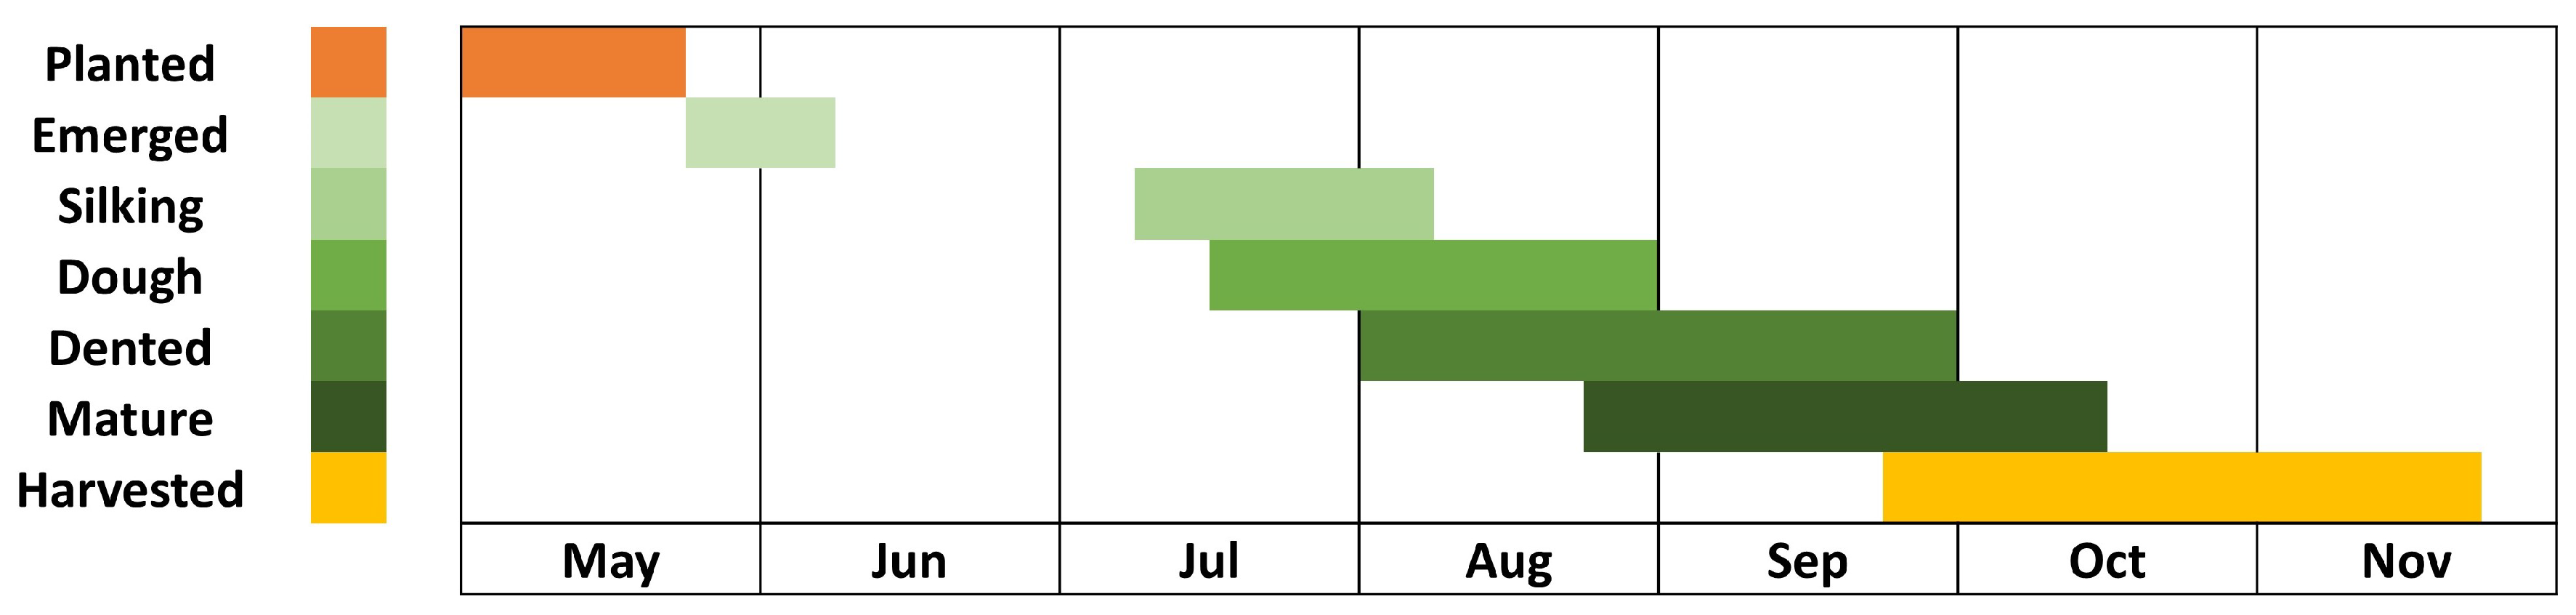
Figure 3.
Global sensitivity analysis of NDVI, NDMI, and SVHI using leaf and canopy models.
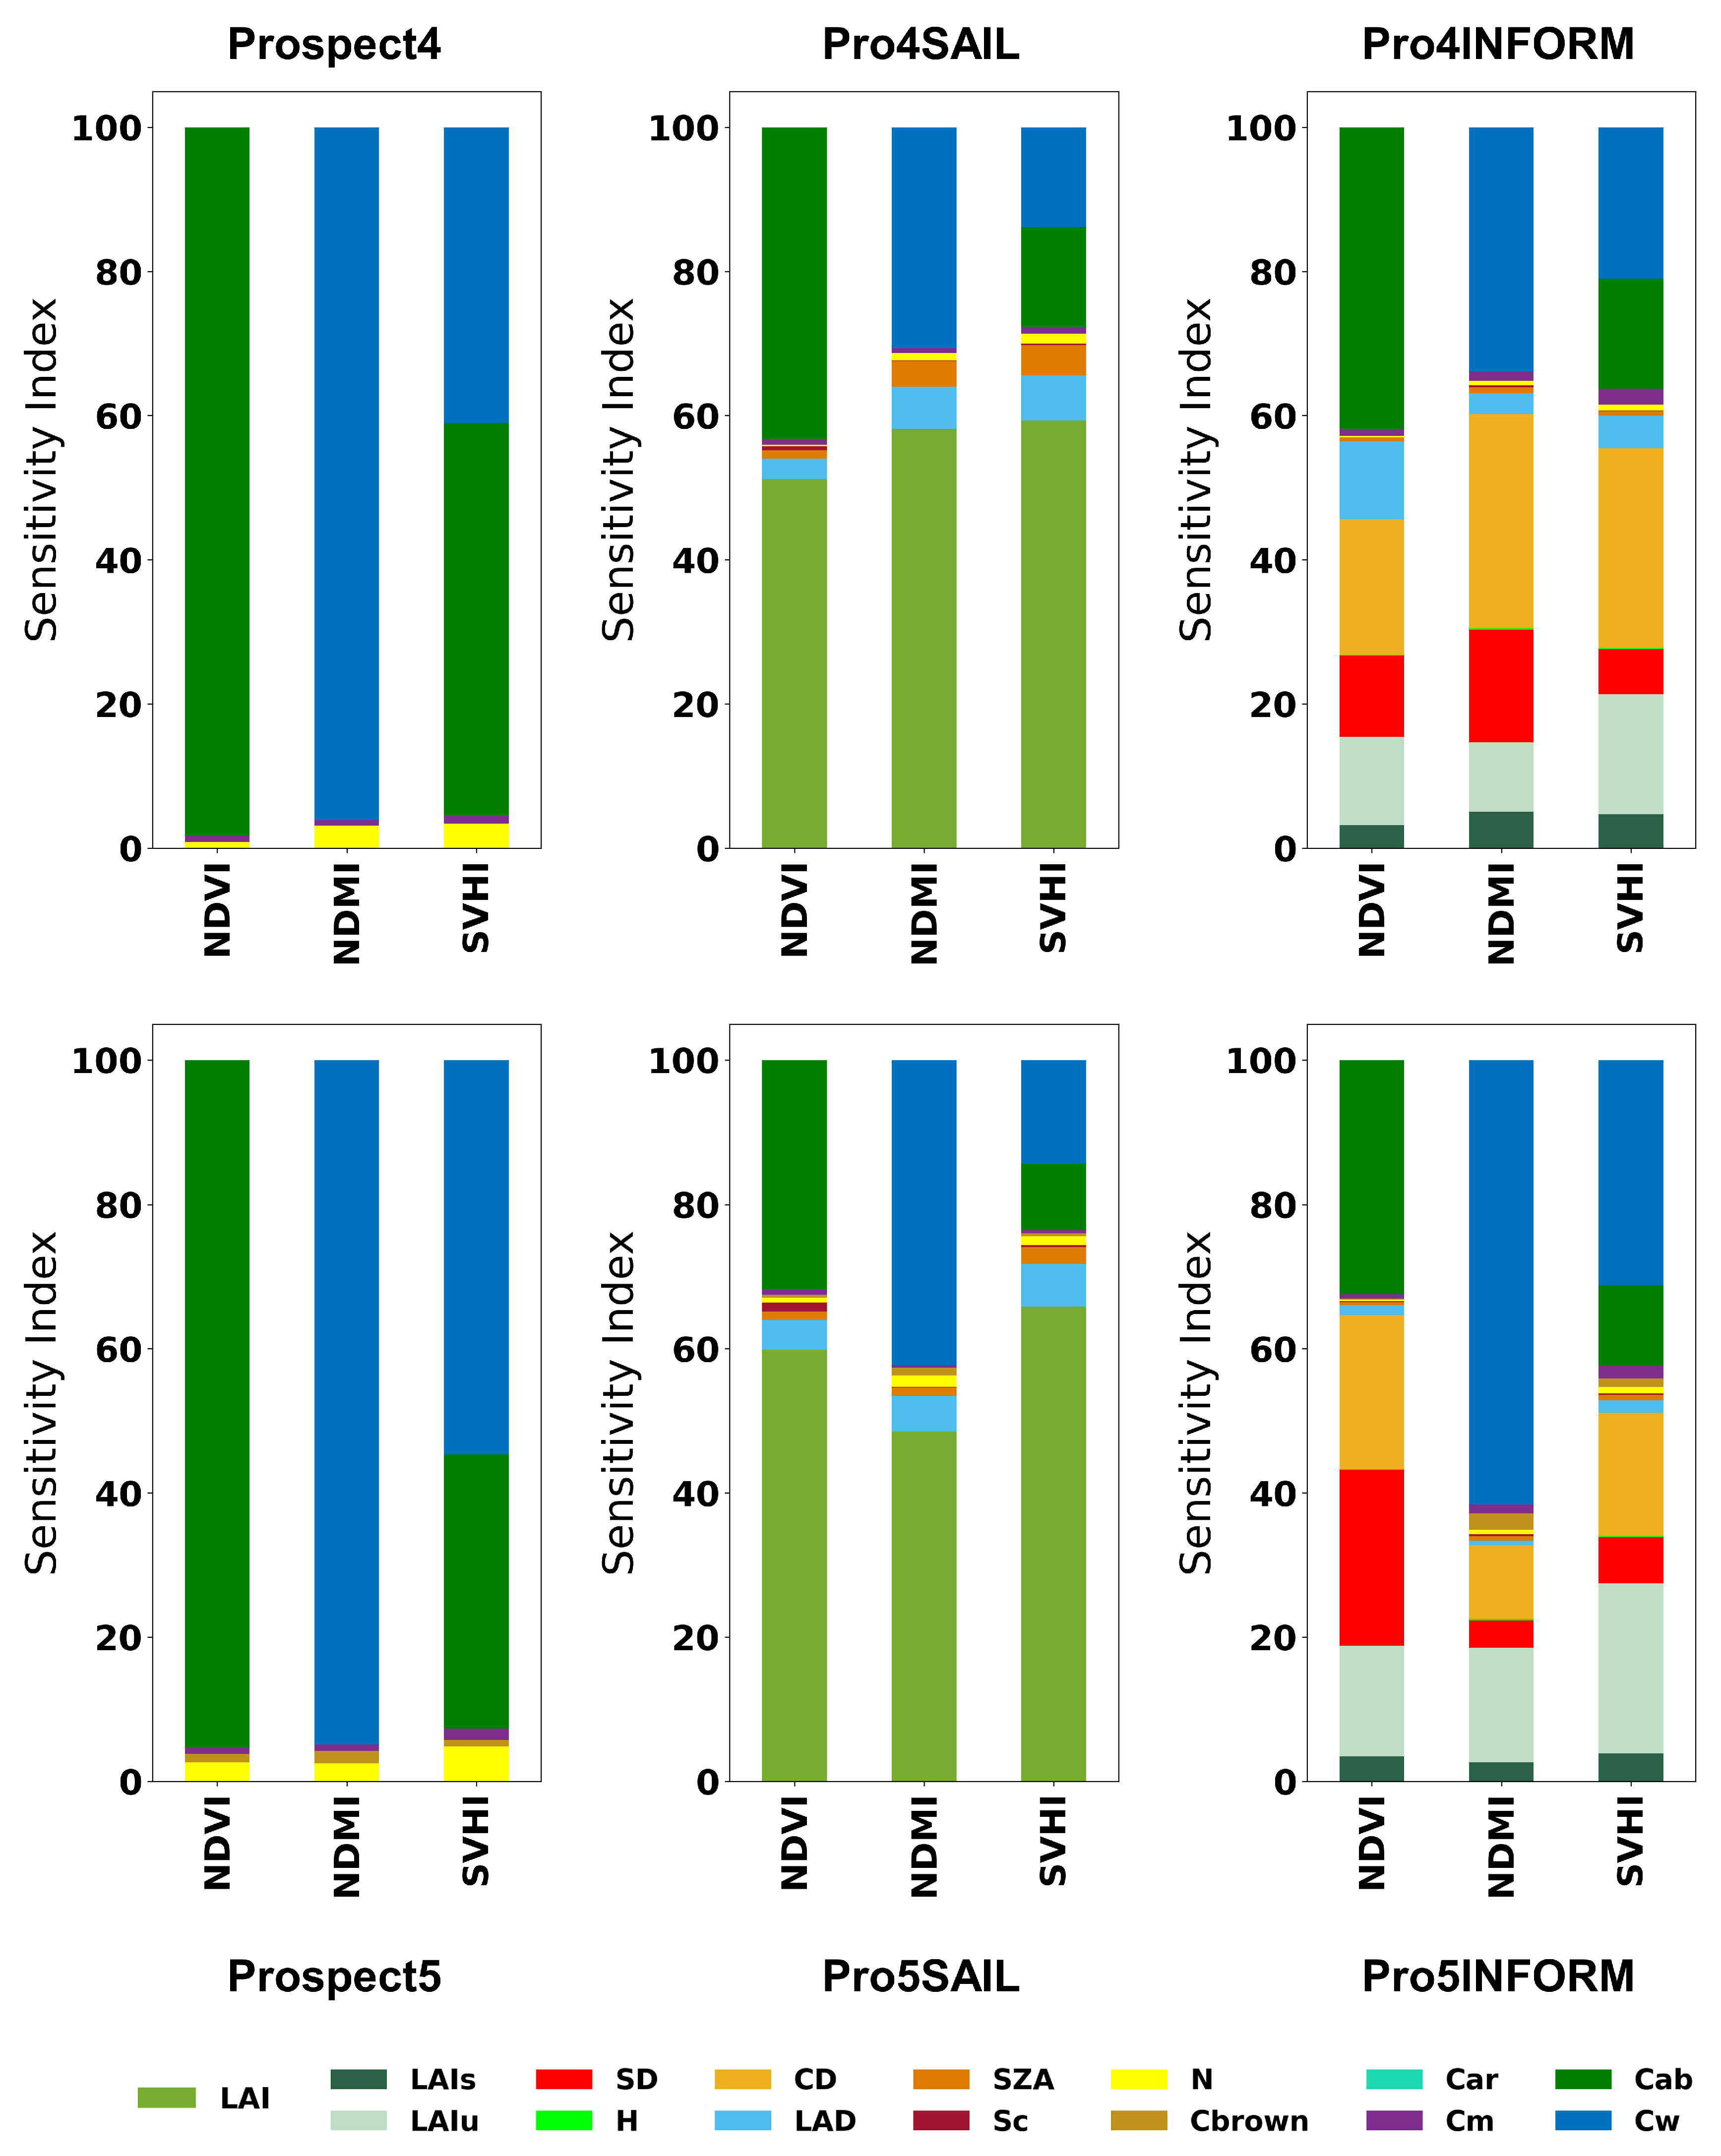
Figure 4.
Global sensitivity analysis of SVHI using Prospect4, Prospect4SAIL, and Prospect4INFORM models at varying level of Cab and Cw.
Figure 4.
Global sensitivity analysis of SVHI using Prospect4, Prospect4SAIL, and Prospect4INFORM models at varying level of Cab and Cw.
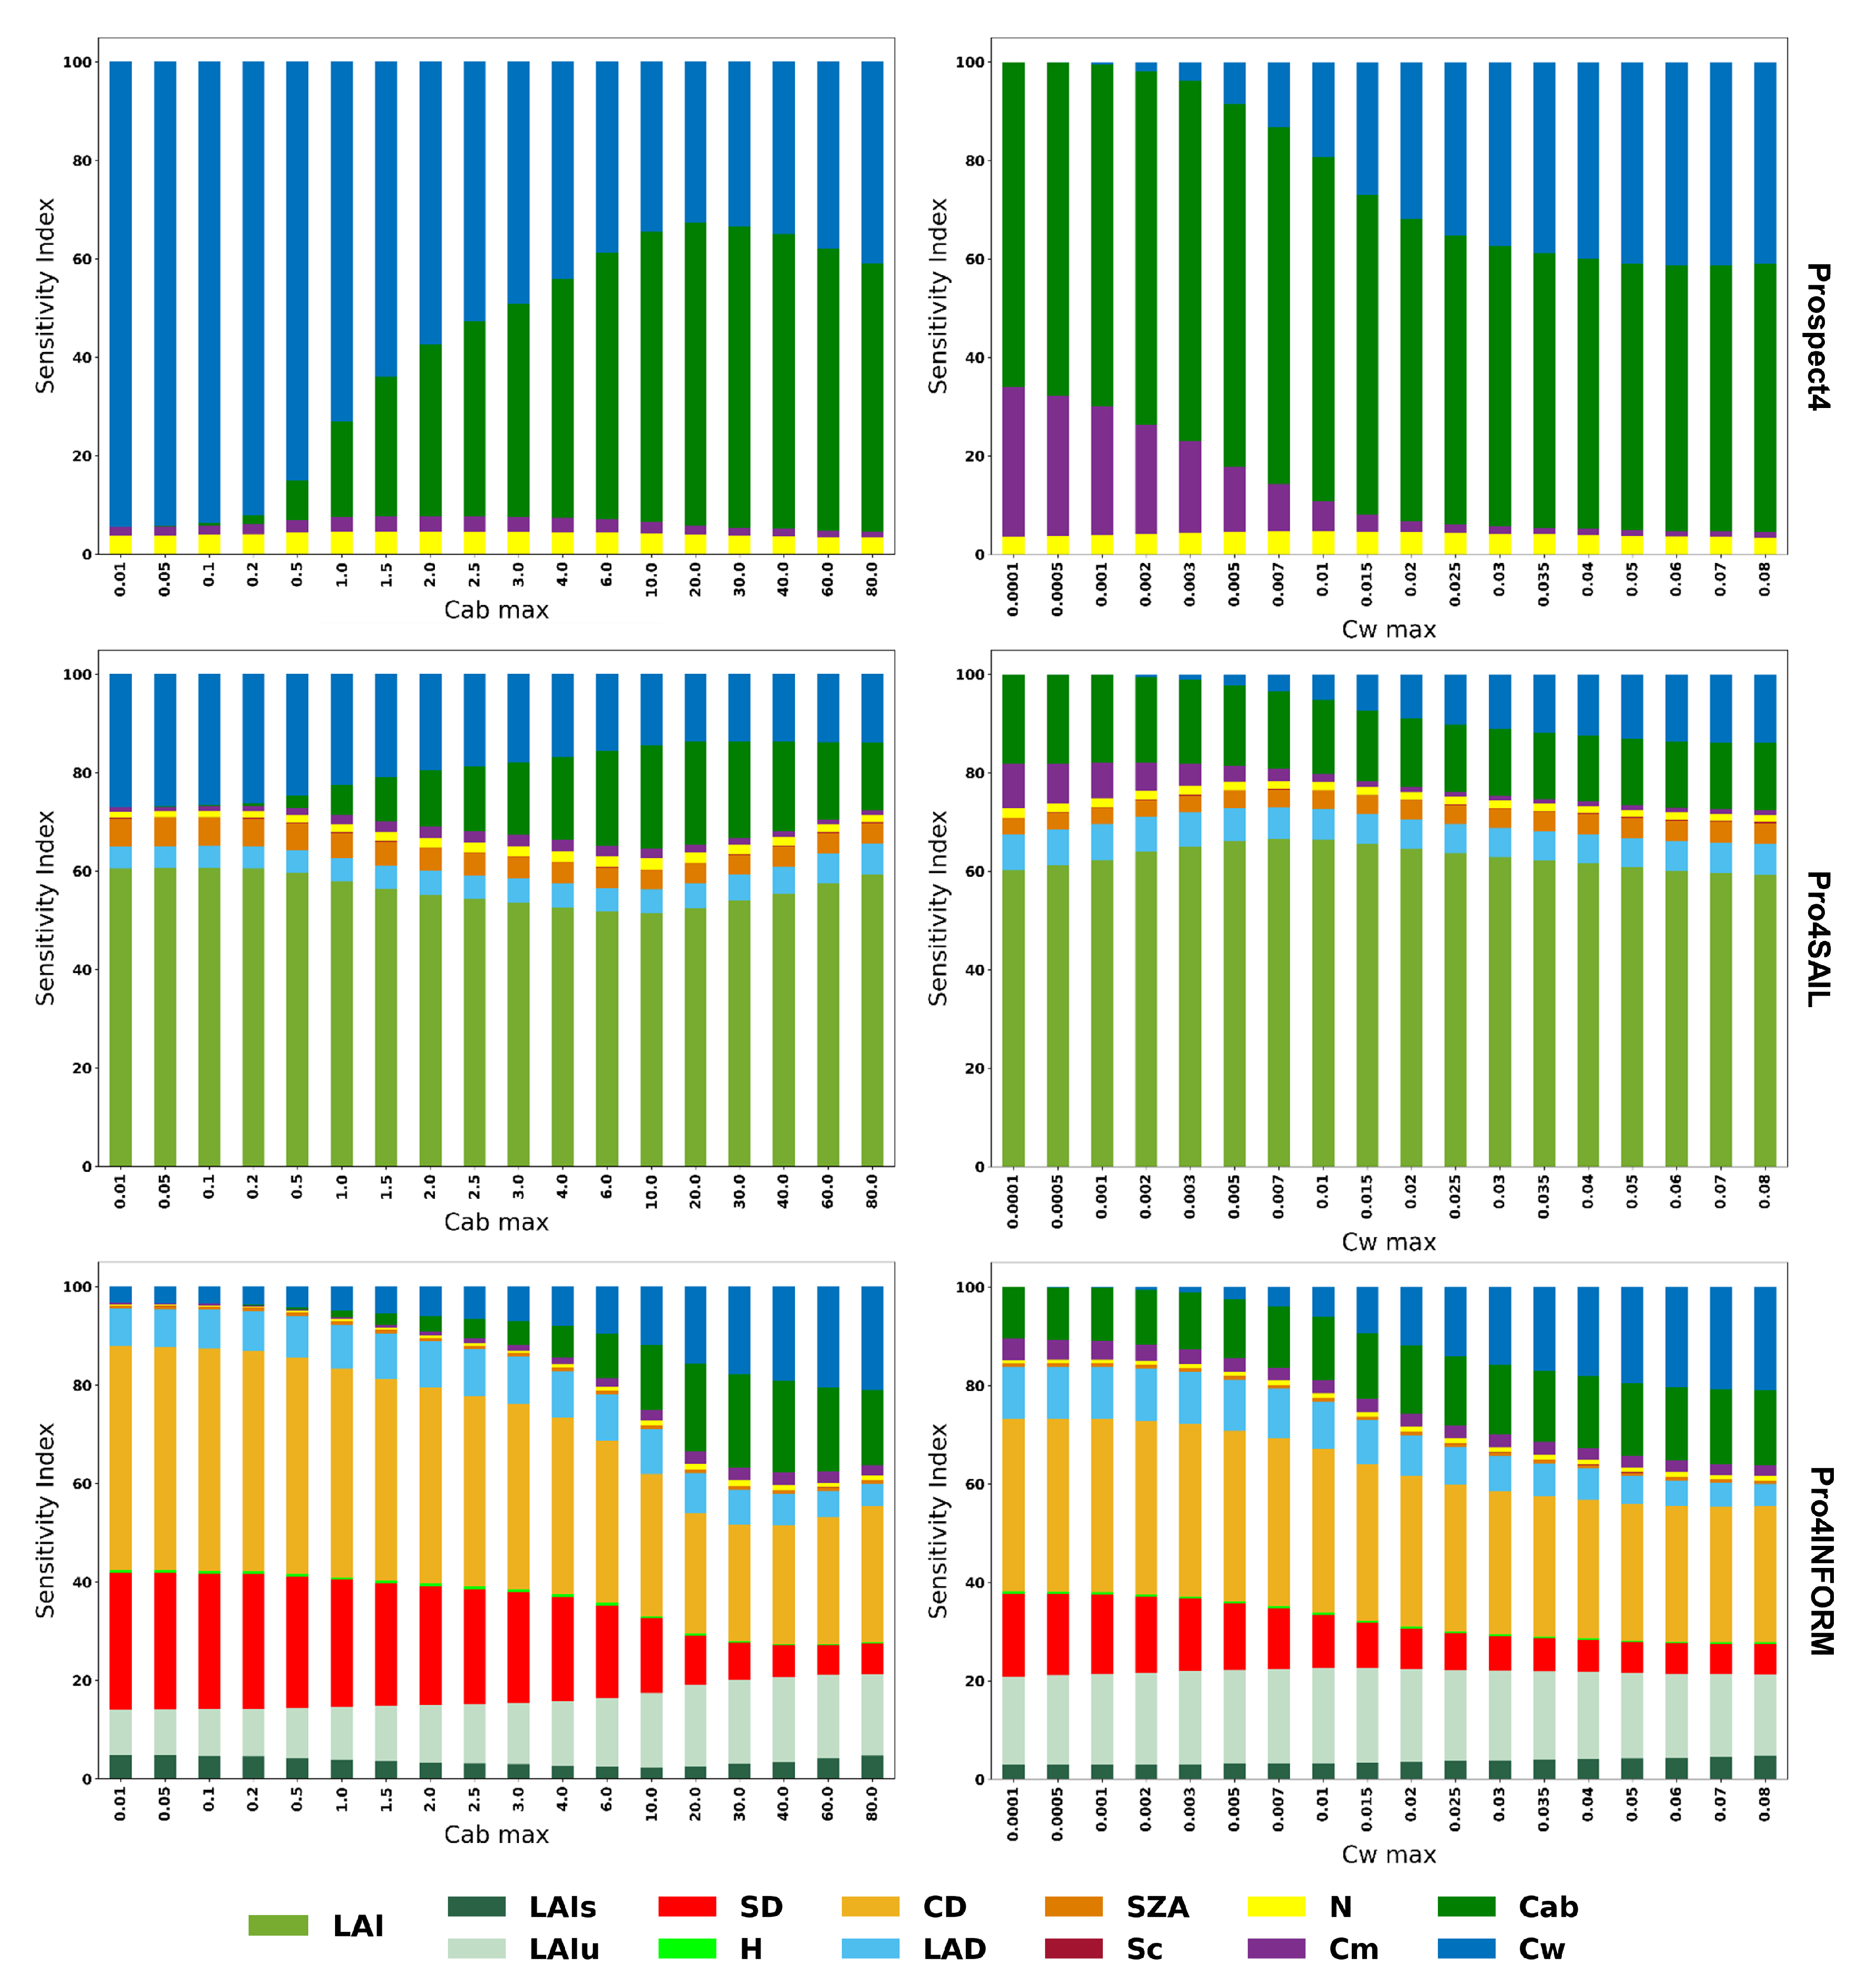
Figure 5.
Global sensitivity analysis of SVHI using Prospect5, Prospect5SAIL, and Prospect5INFORM models at varying level of Cab and Cw.
Figure 5.
Global sensitivity analysis of SVHI using Prospect5, Prospect5SAIL, and Prospect5INFORM models at varying level of Cab and Cw.
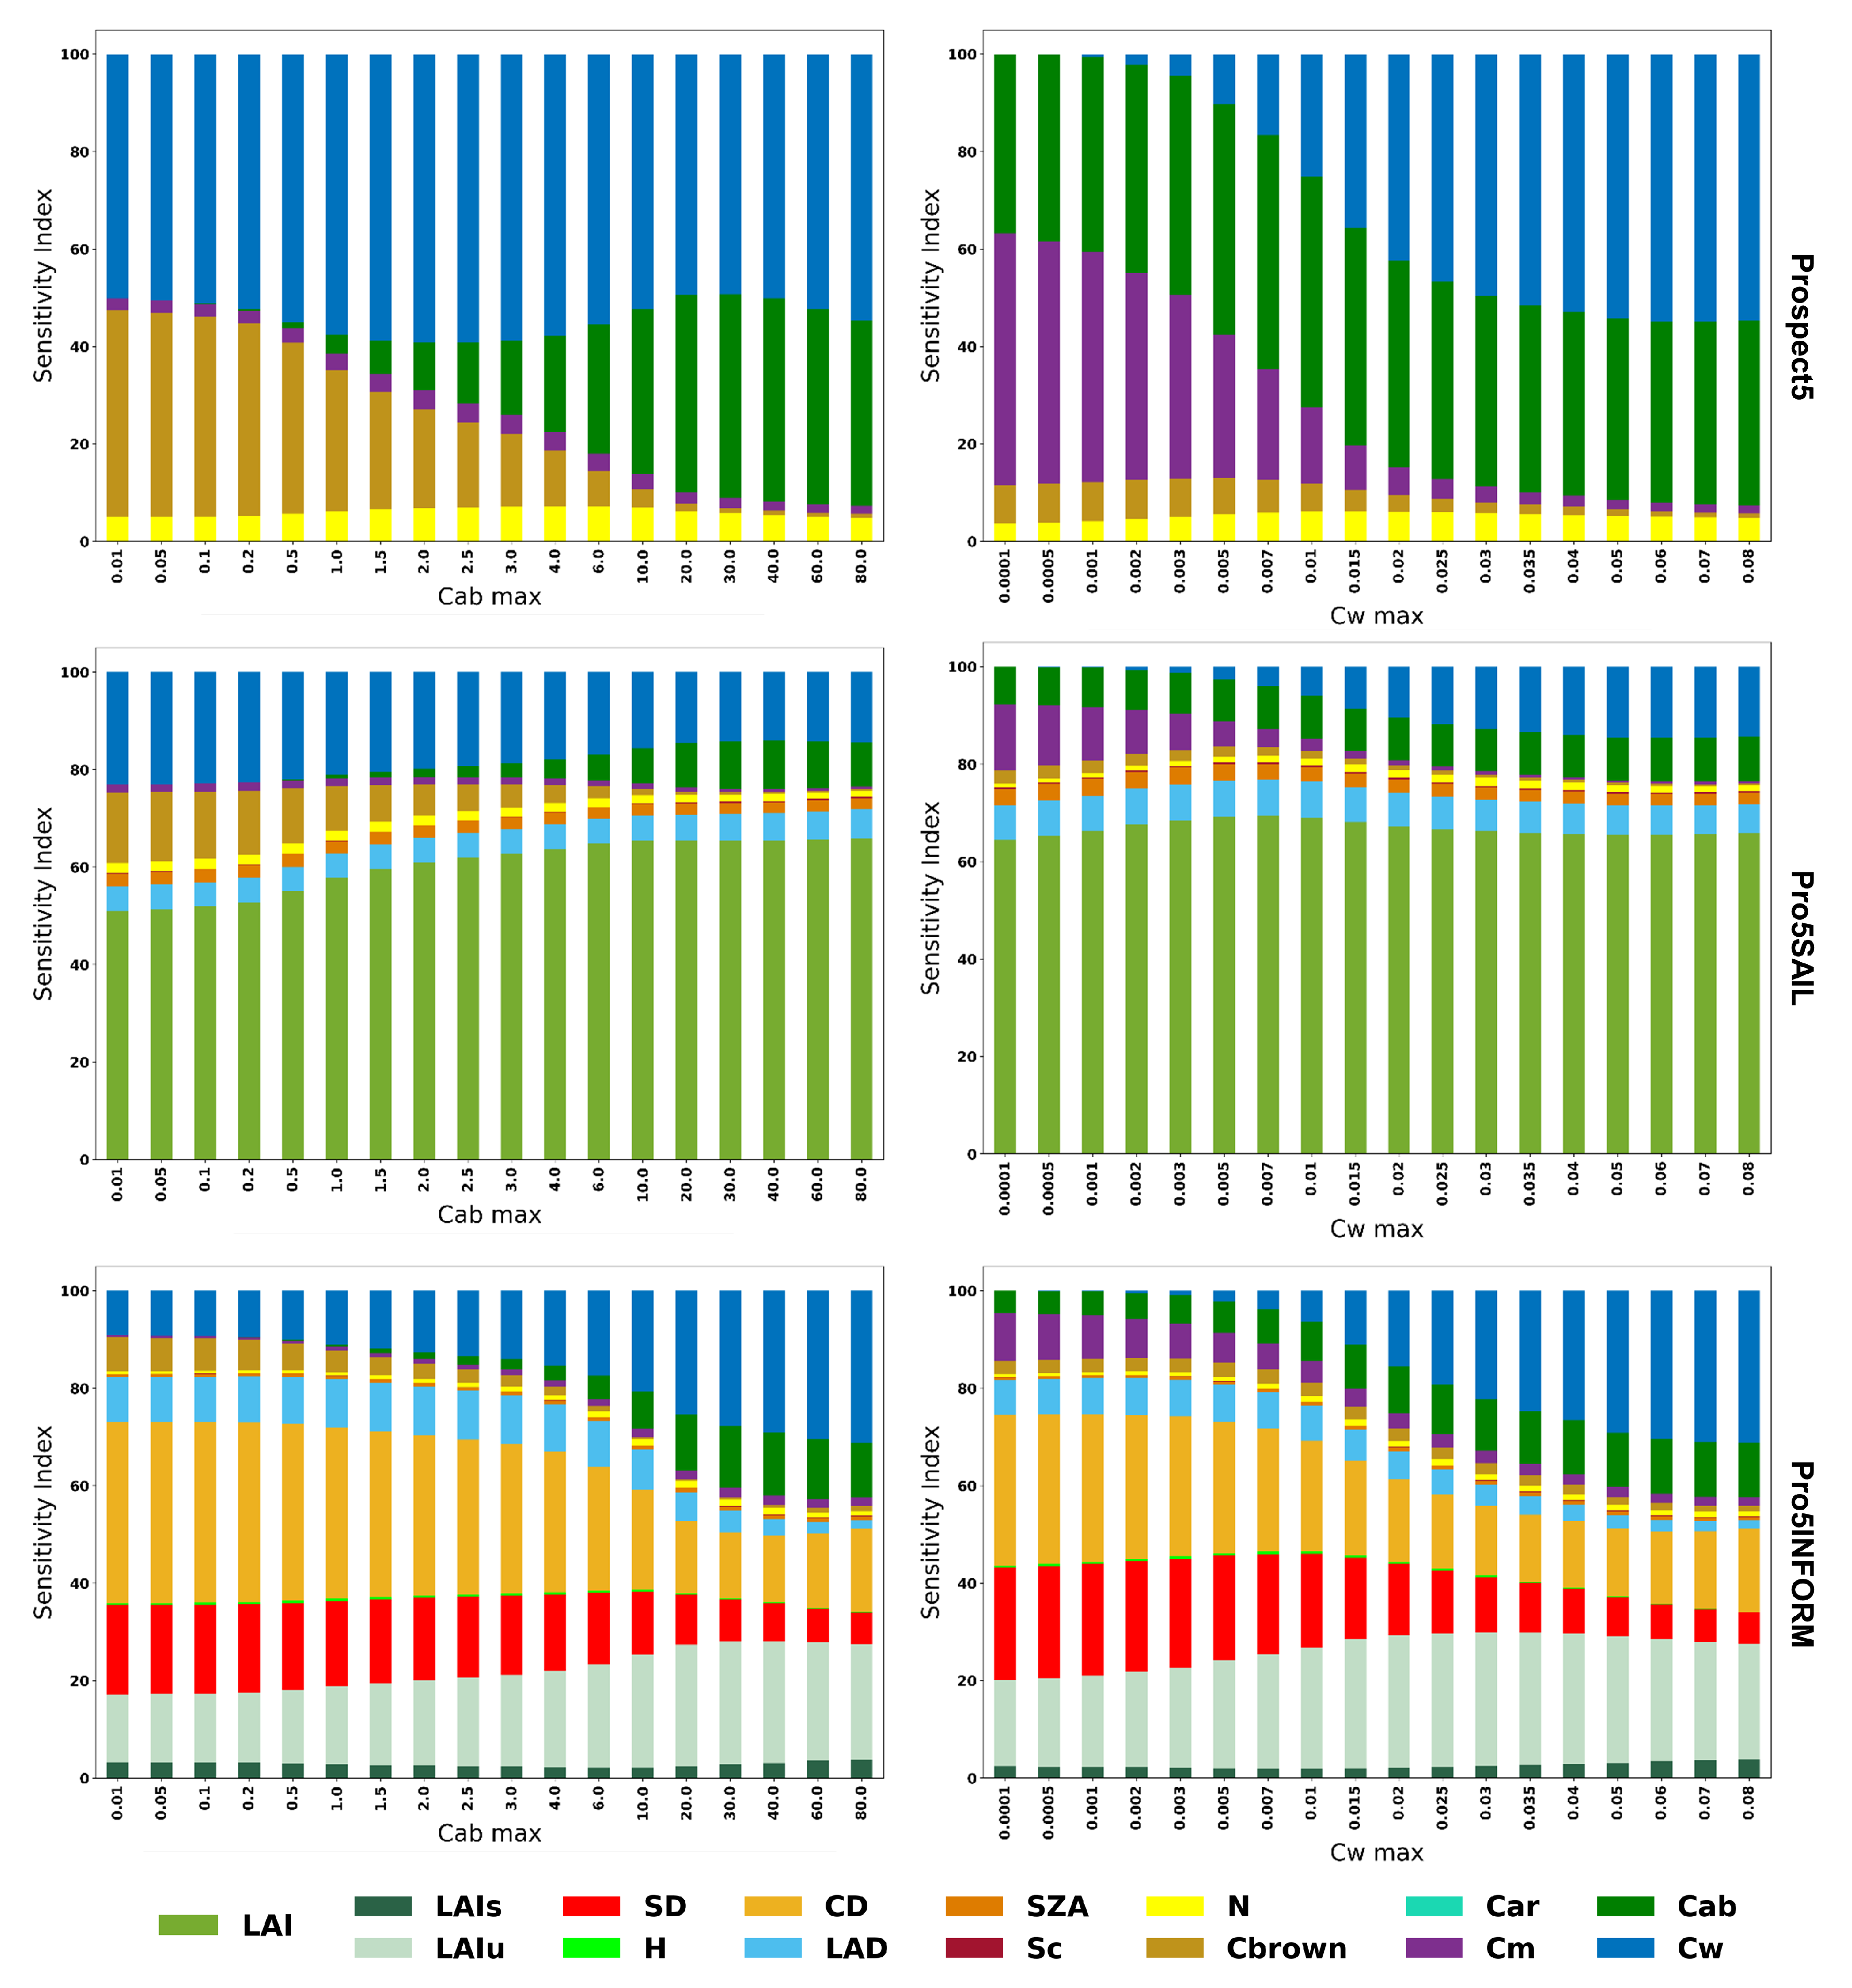
Figure 6.
Response of (a) SVHI, (b) NDVI, and (c) NDMI towards leaf water content. The red box shows the two observations are statistically similar according to Tukey’s HSD test at p-value significance level. The x-axis represents the average %LWC of leaves on each observation day. In each box plot, the black horizontal line represents the median, and the green shape represents the mean of respective observations.

Figure 7.
Continuum removed spectra of leaves at different %LWC
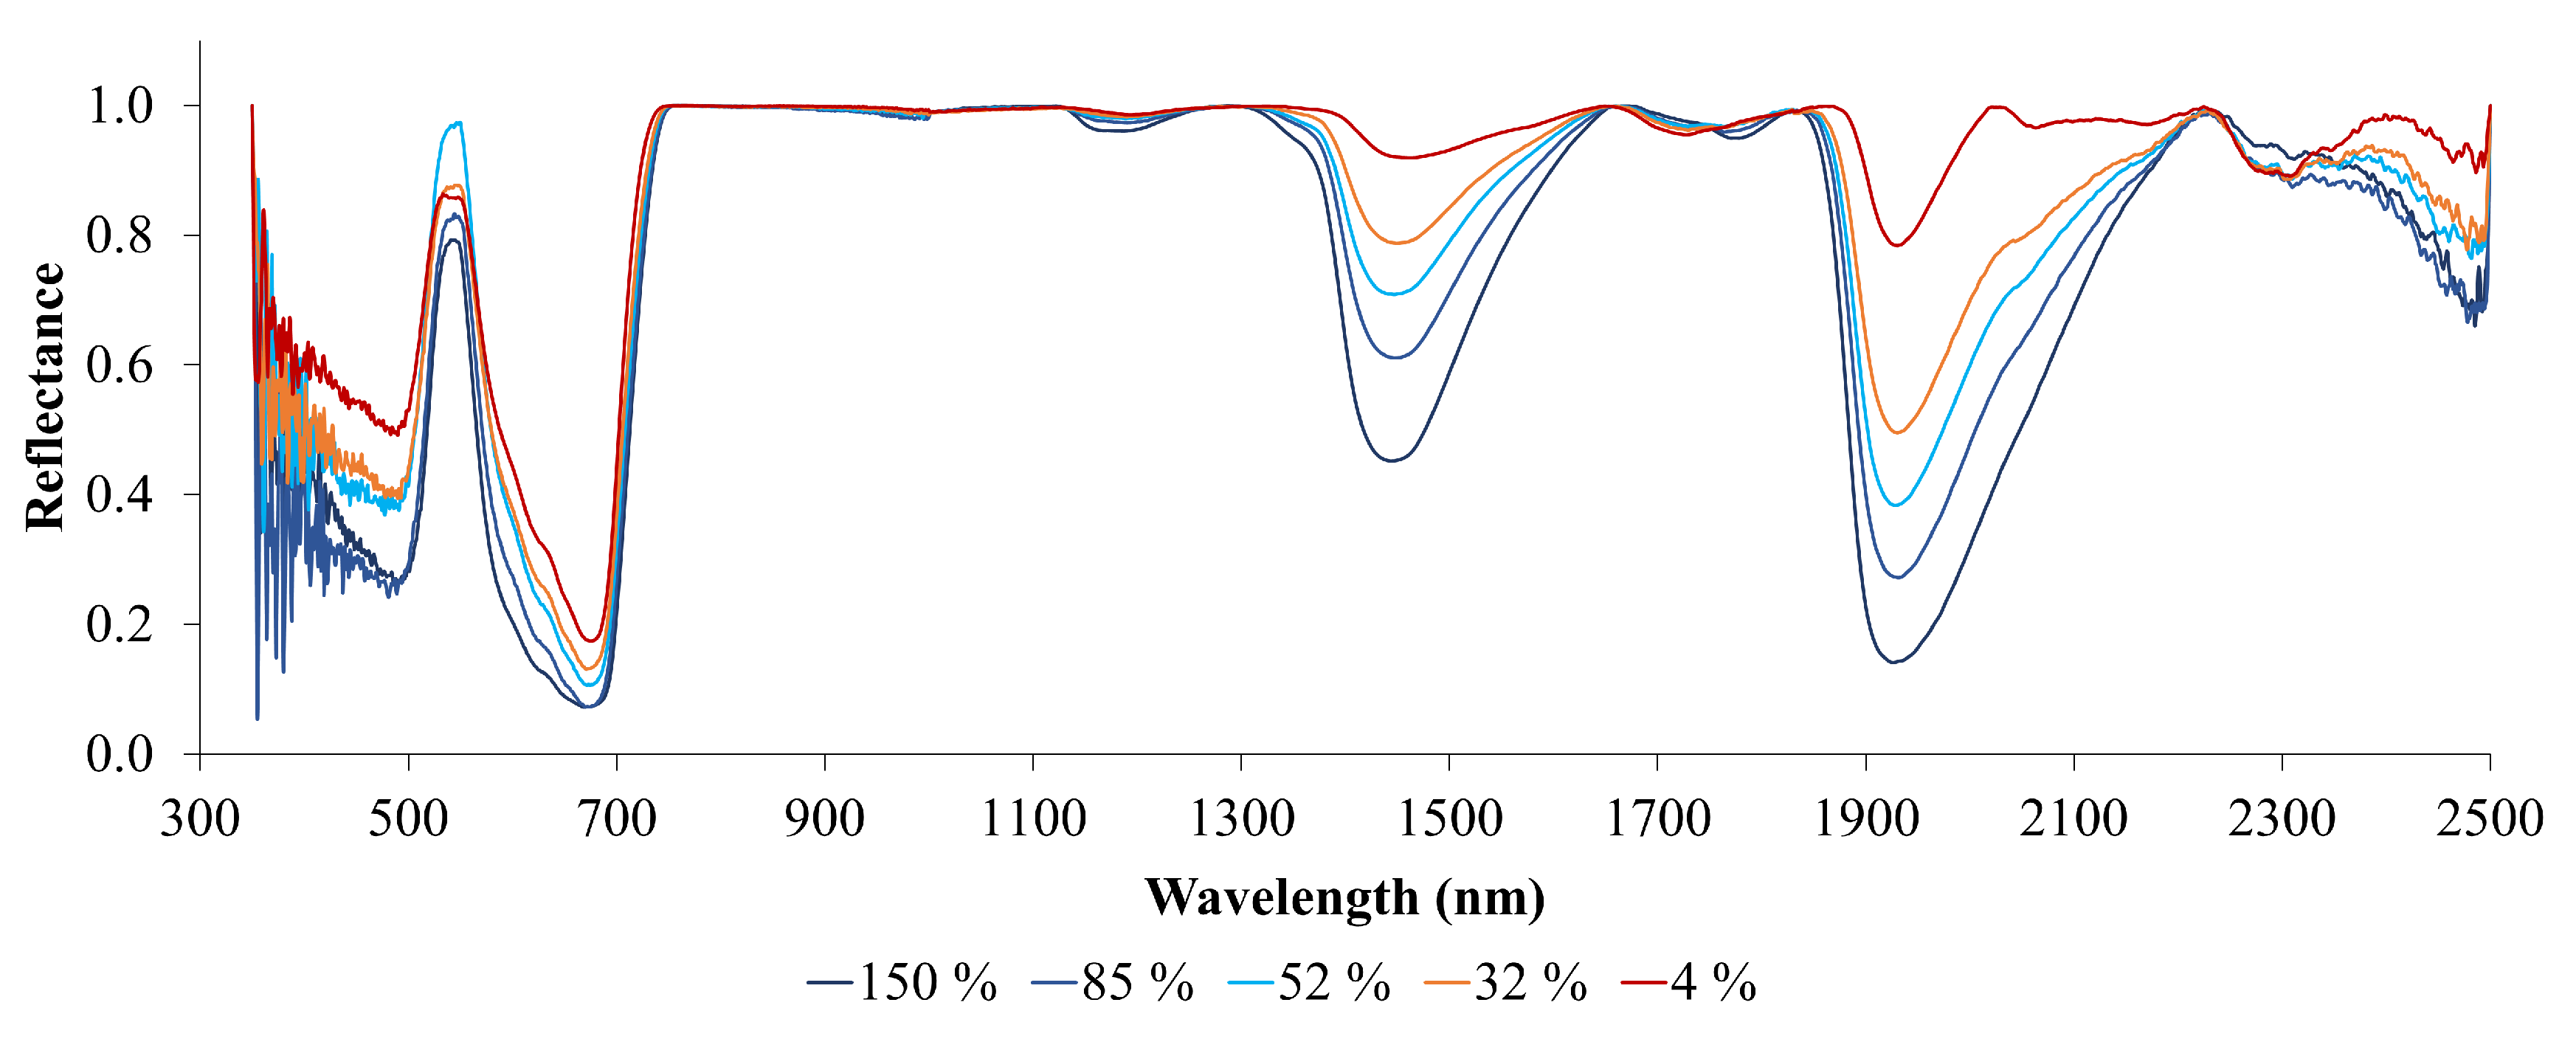
Figure 8.
Relationship between Sentinel-2 SWIR bands and %LWC.
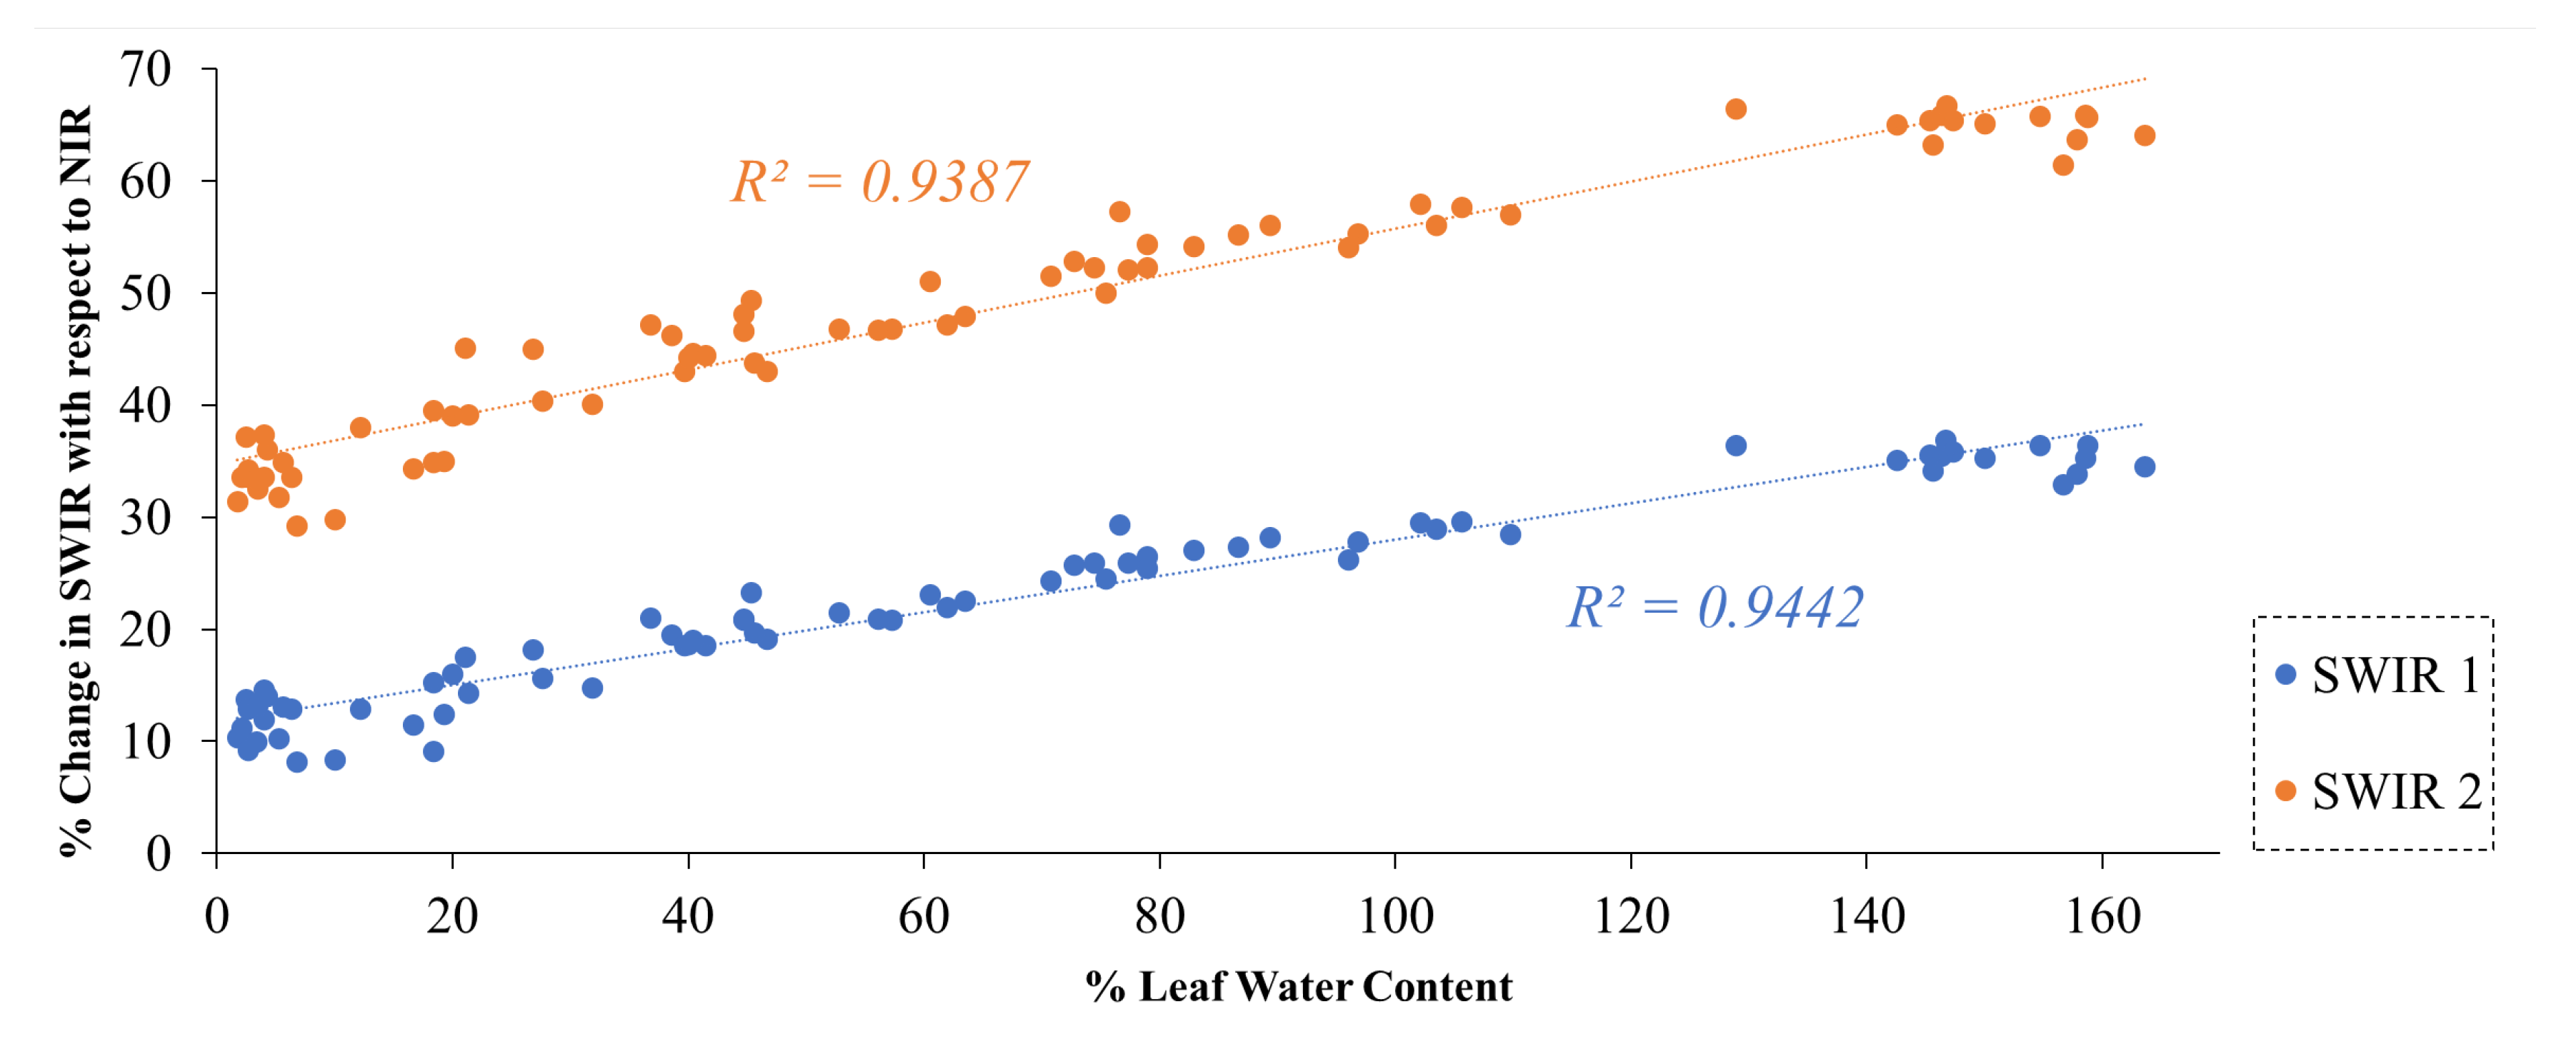
Figure 9.
Response of NDVI, NDMI, and SVHI towards stressed leaves.
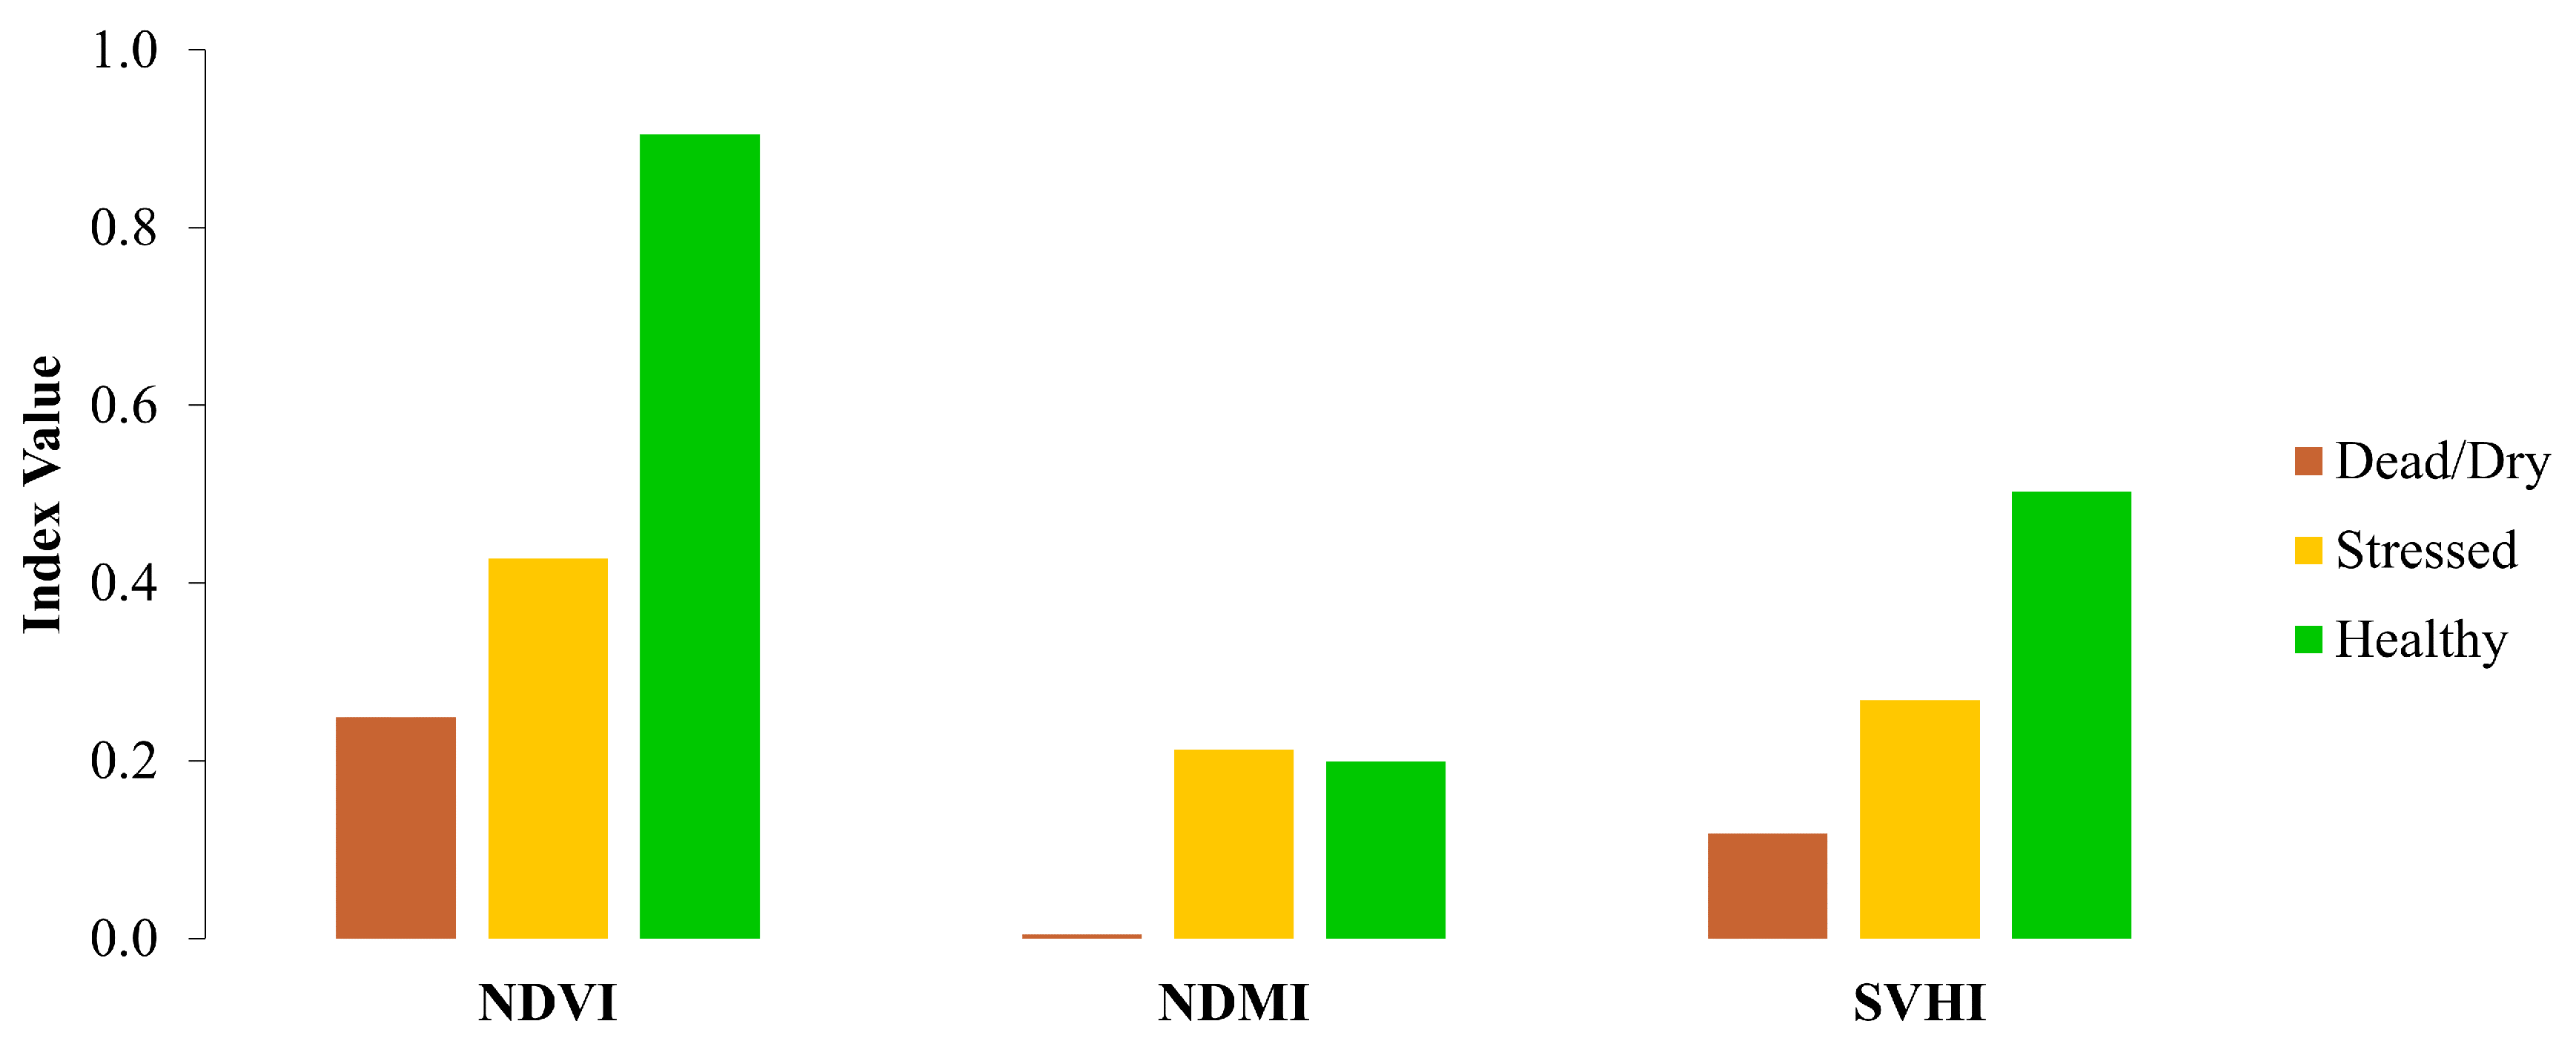
Figure 10.
Continuum removed spectra of different stress conditions of leaves.
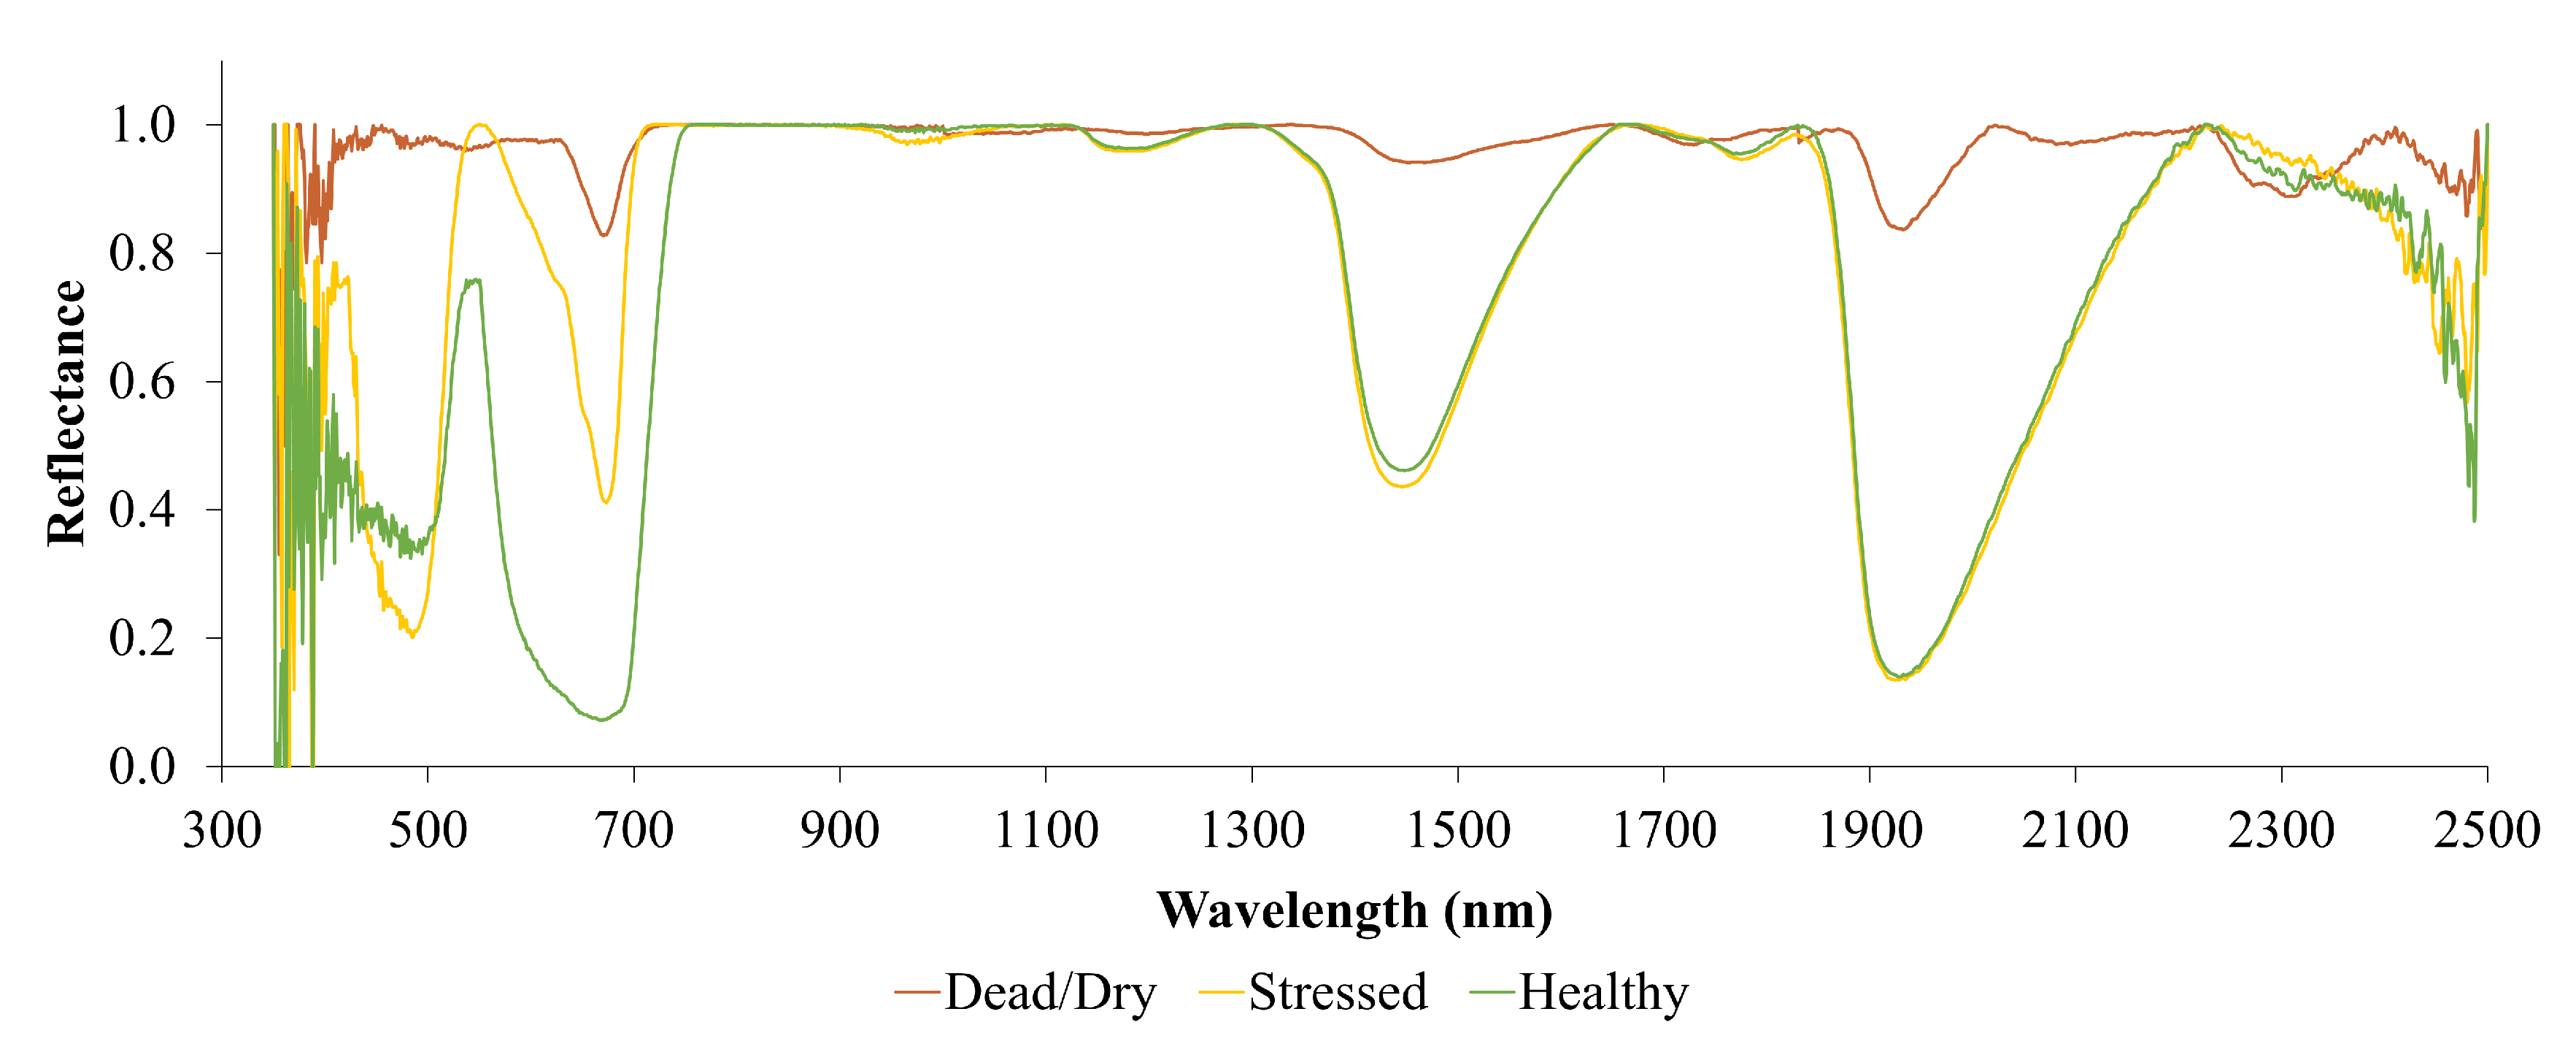
Figure 11.
Spatio-temporal variability of SVHI, NDVI, and NDMI over an agricultural region in Iowa, USA for 2021 crop season. The blue box highlights the lake, which is apparently differentiable in both the SVHI, and NDVI but not in NDMI.
Figure 11.
Spatio-temporal variability of SVHI, NDVI, and NDMI over an agricultural region in Iowa, USA for 2021 crop season. The blue box highlights the lake, which is apparently differentiable in both the SVHI, and NDVI but not in NDMI.
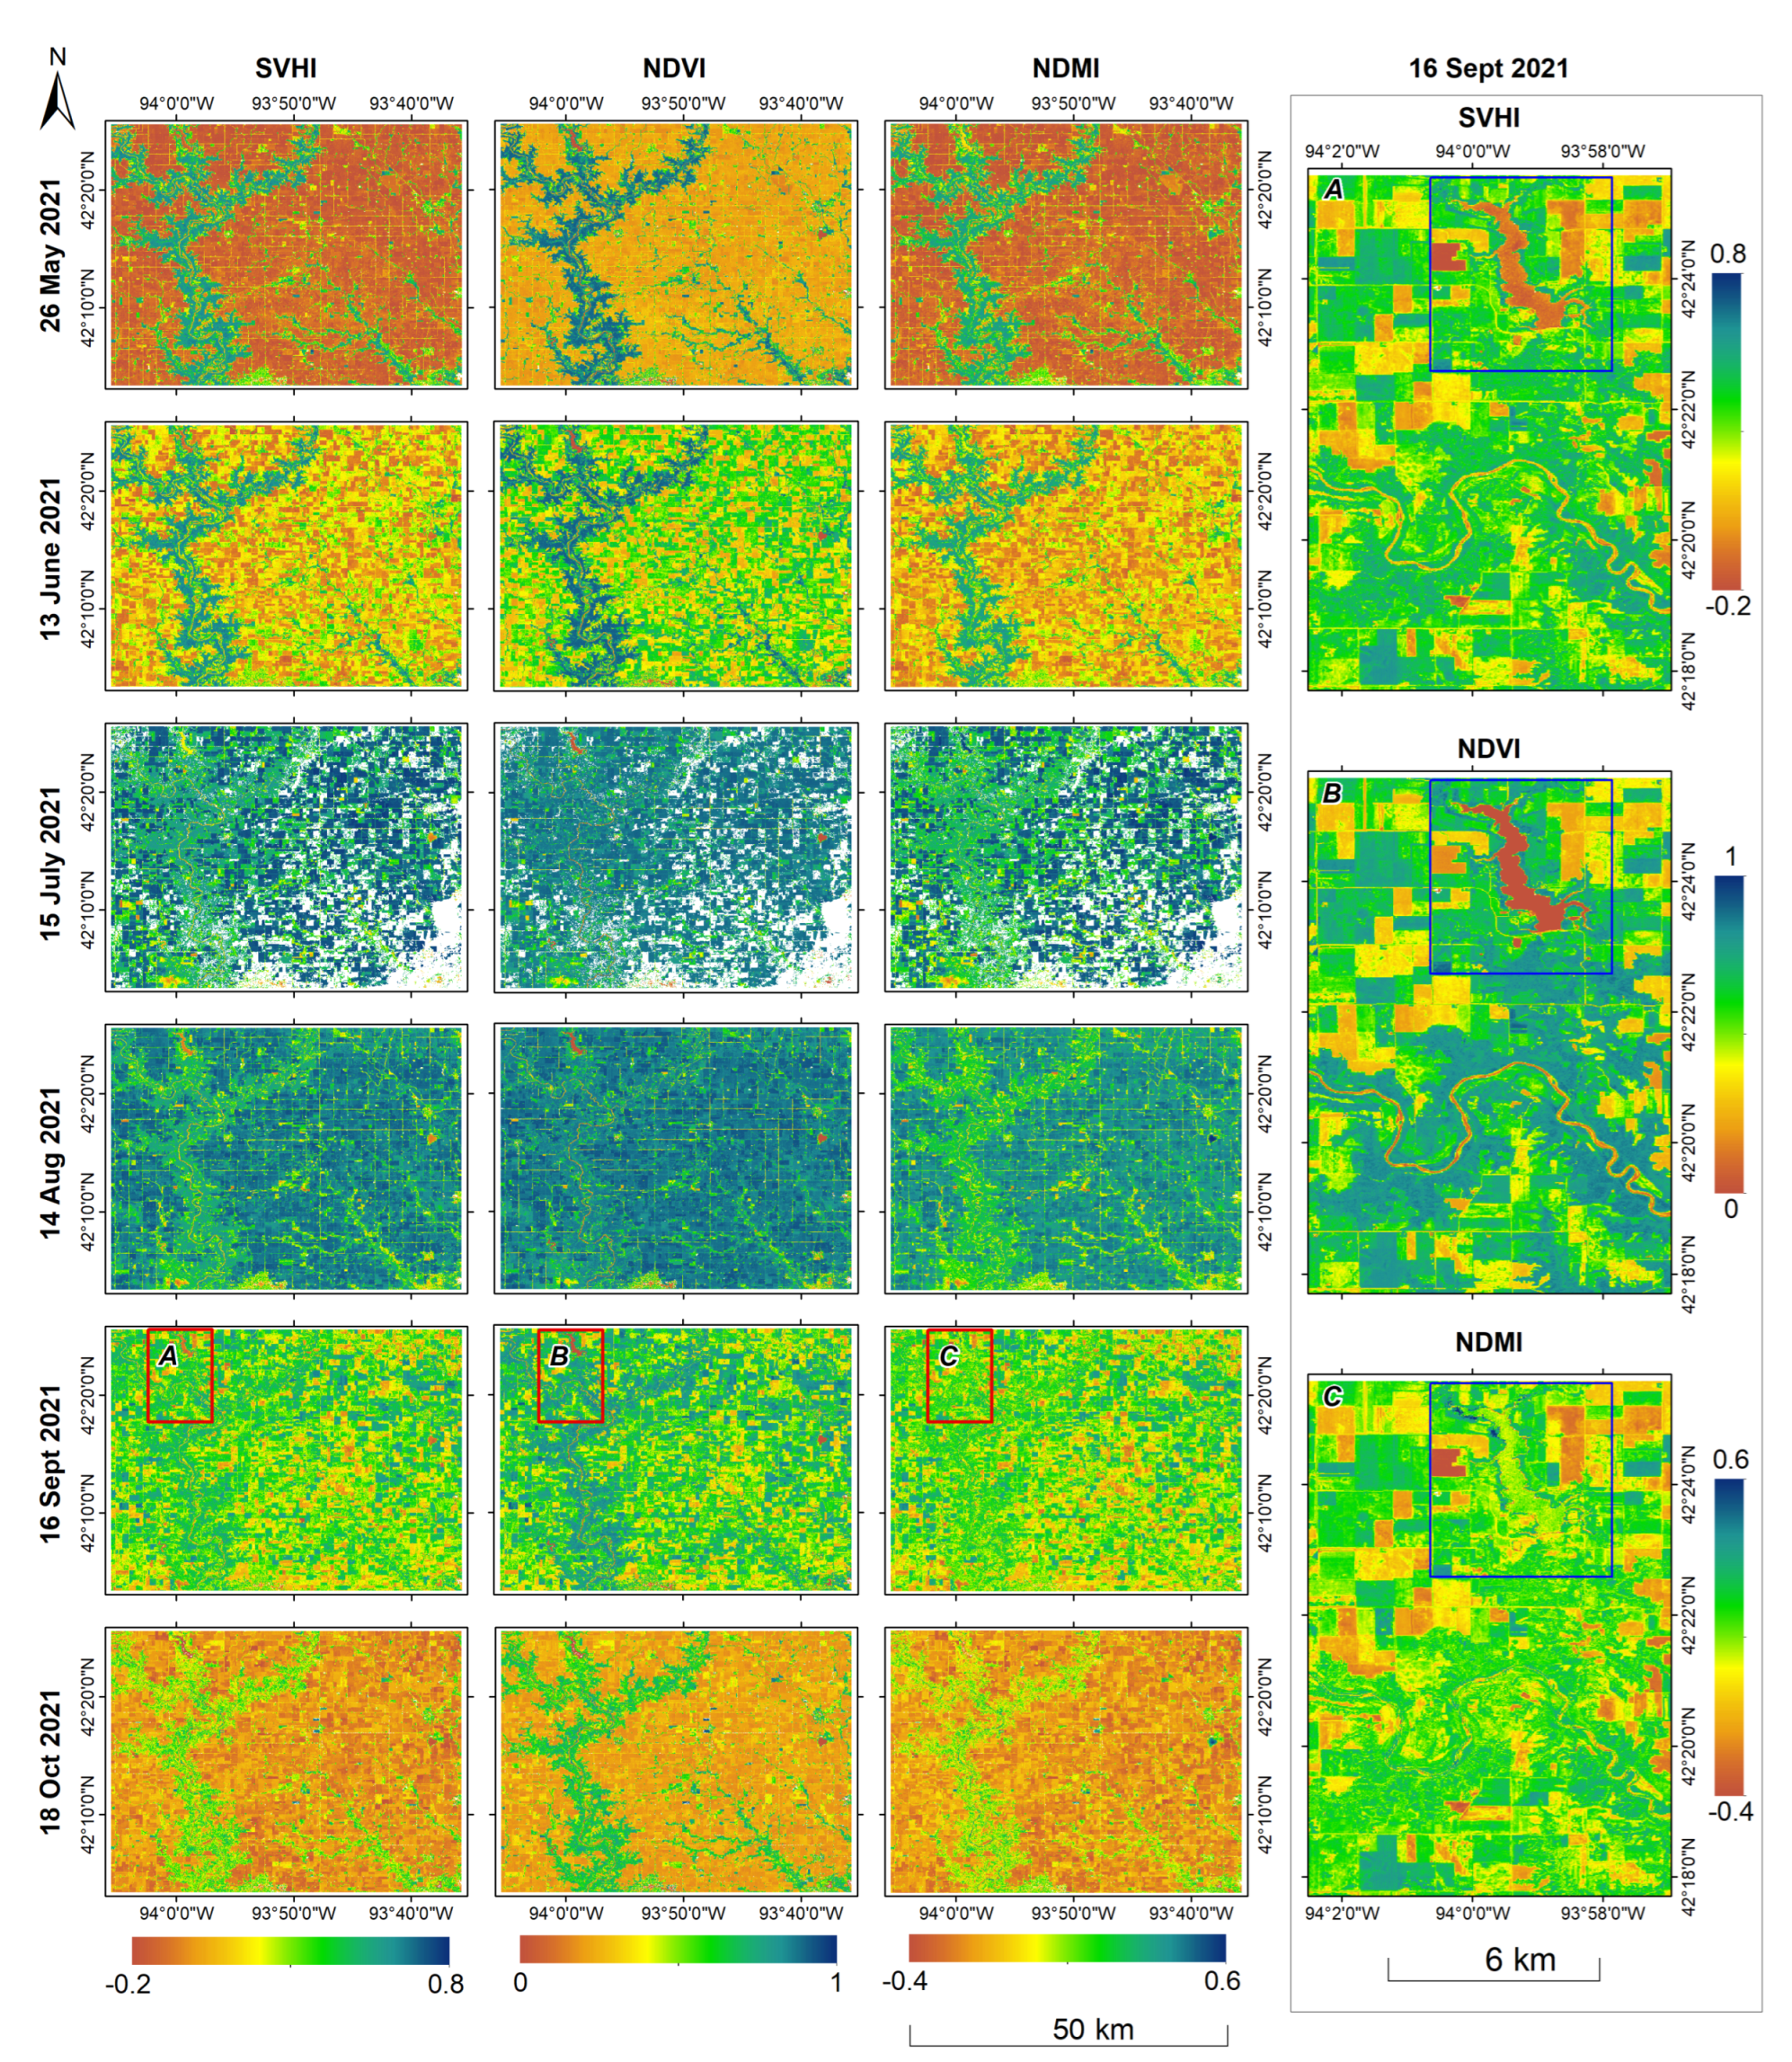
Figure 12.
Temporal scatterplot of different vegetation indices over corn crop, (a) SVHI vs NDVI, (b) SVHI vs. NDMI, and (c) NDMI vs. NDVI.
Figure 12.
Temporal scatterplot of different vegetation indices over corn crop, (a) SVHI vs NDVI, (b) SVHI vs. NDMI, and (c) NDMI vs. NDVI.
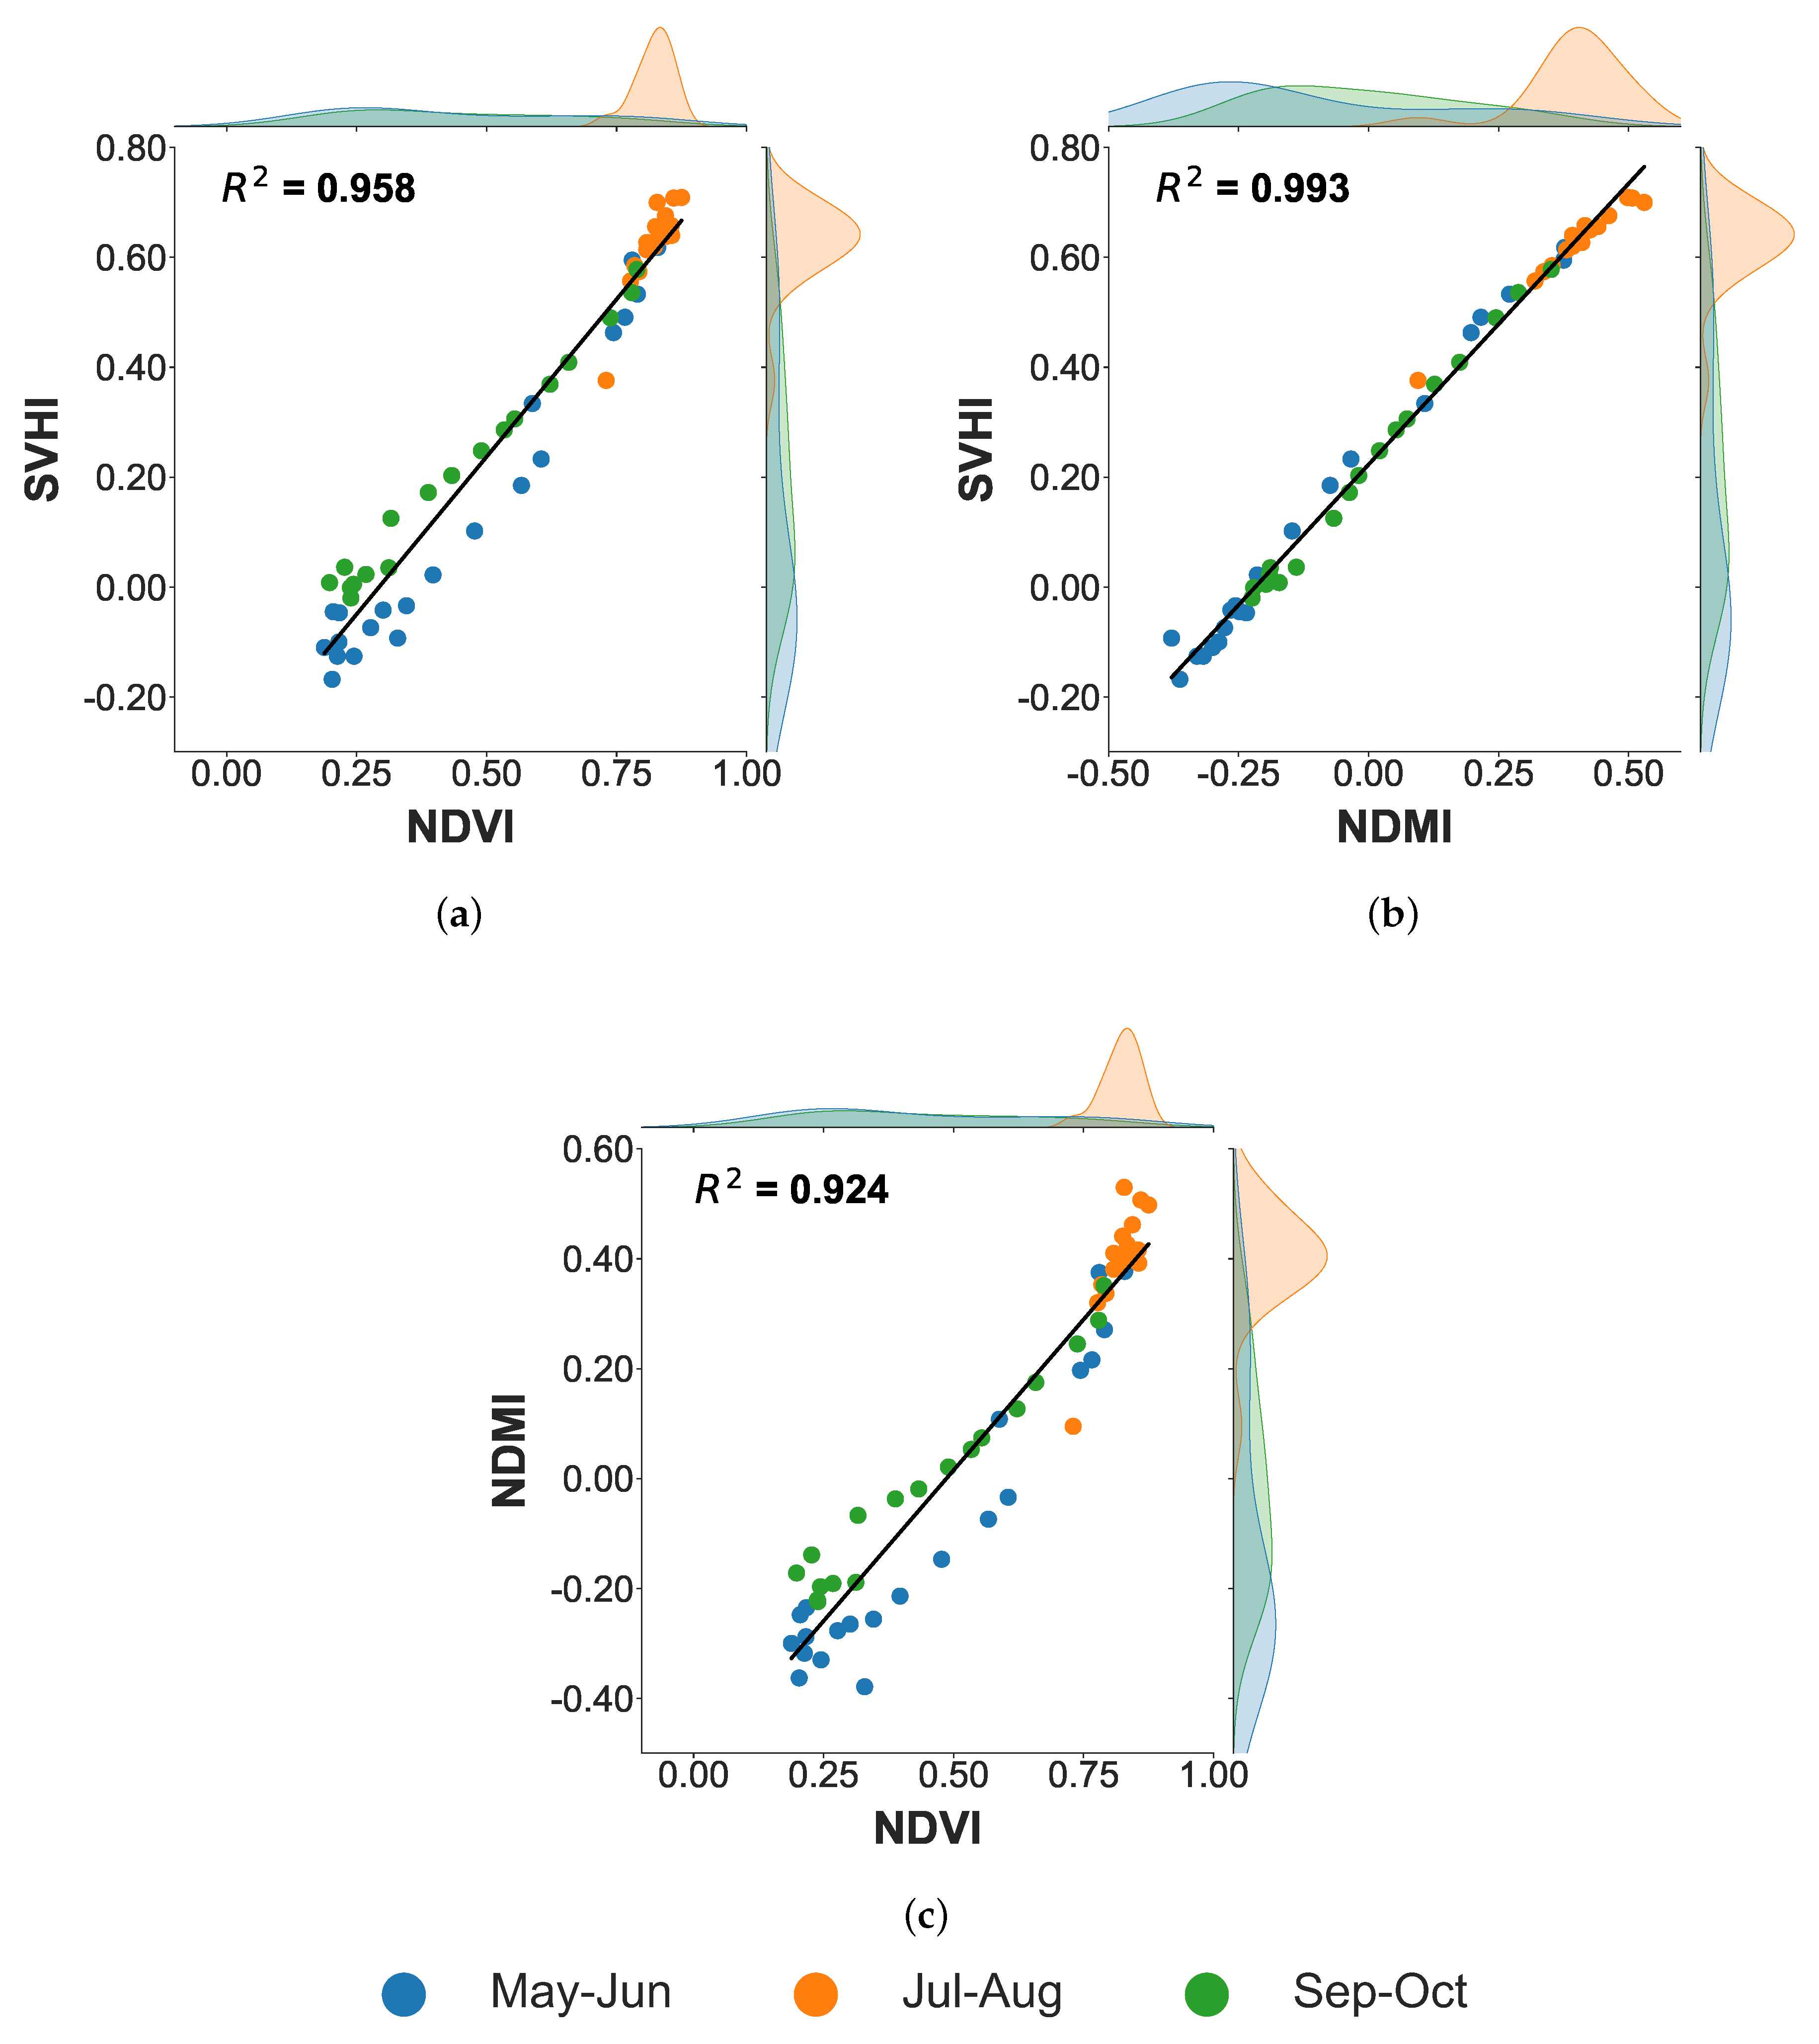

Table 1.
Parameters considered in the reflectance simulation from PROSAIL and PROINFORM are listed here. The default values were selected for the parameters not listed in the table.
Table 1.
Parameters considered in the reflectance simulation from PROSAIL and PROINFORM are listed here. The default values were selected for the parameters not listed in the table.
| Input | Description | Unit | Min | Max |
|---|---|---|---|---|
| Leaf: PROSPECT4 & 5 | ||||
| N | Leaf structure parameter | [-] | 1 | 2.6 |
| Cab | Chlorophyll a+b content | 0 | 80 | |
| Cm | Dry matter content | 0.001 | 0.02 | |
| Cw | Equivalent water thickness | 0 | 0.08 | |
| Leaf: only PROSPECT5 | ||||
| Cbrown | Brown pigments | 0 | 1 | |
| Car | Carotenoids | 0 | 25 | |
| Canopy: SAIL and INFORM | ||||
| LAD | Leaf angle distribution | [ ] | 0 | 90 |
| SZA | Solar zenith angle | [ ] | 0 | 60 |
| Sc | Soil coefficient | [-] | 0 | 1 |
| Canopy: only SAIL | ||||
| LAI | Total leaf area index | 0 | 10 | |
| Canopy: only INFORM | ||||
| Single tree leaf area index | 0 | 10 | ||
| Leaf area index of understory | 0 | 5 | ||
| SD | Sem density | 0.5 | 1500 | |
| H | Tree height | [ ] | 0.5 | 30 |
| CD | Crown diameter | [ ] | 0.1 | 10 |
Table 2.
The Slope is estimated to quantify the rate of reduction in the values of vegetation indices as LWC decreases. The scenarios with the maximum rate of reduction are highlighted in bold.
Table 2.
The Slope is estimated to quantify the rate of reduction in the values of vegetation indices as LWC decreases. The scenarios with the maximum rate of reduction are highlighted in bold.
| 150% - 85% | 85% - 52% | 52% - 32% | 32% - 4% | |
|---|---|---|---|---|
| NDVI | 0.02 | 0.13 | 0.18 | 0.21 |
| NDMI | 0.09 | 0.10 | 0.15 | 0.10 |
| SVHI | 0.10 | 0.14 | 0.21 | 0.18 |
Disclaimer/Publisher’s Note: The statements, opinions and data contained in all publications are solely those of the individual author(s) and contributor(s) and not of MDPI and/or the editor(s). MDPI and/or the editor(s) disclaim responsibility for any injury to people or property resulting from any ideas, methods, instructions or products referred to in the content. |
© 2025 by the authors. Licensee MDPI, Basel, Switzerland. This article is an open access article distributed under the terms and conditions of the Creative Commons Attribution (CC BY) license (http://creativecommons.org/licenses/by/4.0/).
Copyright: This open access article is published under a Creative Commons CC BY 4.0 license, which permit the free download, distribution, and reuse, provided that the author and preprint are cited in any reuse.


