
Submitted:
19 March 2025
Posted:
19 March 2025
You are already at the latest version
Abstract
Background: B. Pertussis remains a significant public health concern, with periodic outbreaks despite vaccination efforts. Understanding the temporal trends and seasonality of pertussis incidence is important for improving its surveillance and pre-vention strategies. Objectives: The aim of this study was to examine pertussis trends in Tshwane Health District, South Africa, from 2015 to 2019. Methods: A retrospective time series analysis was performed on reported pertussis cases in the Tshwane Health District from 2015 to 2019. Descriptive statistical techniques and time series decom-position were employed to investigate seasonal patterns. Autoregressive Moving Average (ARMA) models were employed to assess short-term trends, while cubic trend modelling was used to forecast future case trajectories. Residual diagnostics assessed model validity and analysed correlations between pertussis incidence and climate var-iables. Results: The incidence of Pertussis infection incidence exhibited seasonal pat-terns, with peak cases being reported in Spring and Winter. Time series decomposition confirmed annual fluctuations, suggesting potential environmental and social factors influencing disease transmission. The ARMA(4) model provided the best fit for short-term forecasting, while the cubic model effectively captured long-term trends. Residual diagnostics confirmed model reliability. Conclusion: This study highlights the utility of time series modelling in predicting pertussis trends and underscores the role of seasonality and climate factors in disease dynamics. The findings support enhanced surveillance, climate-adaptive interventions, and optimised vaccine timing to mitigate outbreaks. Integrating predictive modelling with public health strategies can improve outbreak preparedness and resource allocation.
Keywords:
pertussis
; time series analysis
; seasonality
; forecasting
; ARMA model
; Tshwane Health District
1. Introduction
B. Pertussis continues to be a significant public health concern globally [1,2] despite the availability of effective vaccines. Periodic B. Pertussis outbreaks have been documented in South Africa, with seasonal variations impacting the case count. Time series data analysis is essential for describing and understanding disease trends, predicting future epidemics, and implementing effective public health interventions.
Time series analysis serves as a valuable tool in disease surveillance and epidemiology, offering multiple methods for assessing and forecasting the incidence of illnesses. Support vector machines [3], decomposition methods, and ARIMA modelling are frequently used in epidemiology. These techniques assess interventions, detect outbreaks, and describe disease dynamics [4]. Furthermore, spectral analysis and the maximum entropy method have been applied to examine statistical trends of infectious diseases across multiple countries [5]
In the analysis of discrete illness counts, integer-valued autoregressive models demonstrate advantages compared to traditional Box-Jenkins models [6]. Time-domain and frequency-domain techniques, such as autocorrelation functions and spectrum analysis, are widely used; wavelet analysis represents a hybrid technique [7]. When selecting techniques, it is important to consider factors such as scale, scope, disease characteristics, and surveillance objectives in conjunction with the algorithm's performance [8].
Recent studies have detailed the various mechanisms underlying the resurgence and spread of B. Pertussis. B. Pertussis infections are significantly affected by weather variability across all age categories, particularly temperature and humidity [9]. Population size and density influence persistence, and spatial-temporal studies have demonstrated the evolving patterns of disease peaks and regional expansion [10]. Socio-environmental factors such as temperature, socioeconomic level, and school calendars influence incidence [11]. Additionally, seasonal forcing and immune boosting establish cyclical behaviour and chaotic dynamics [12].
Vaccination has resulted in more extended periodic dynamics. For example, high vaccination levels against B. Pertussis can suppress its annual cycle and lengthen long-term periodicity in pertussis. Moreover, prior research has shown that vaccination coverage, vaccine effectiveness, pathogen evolution, and demographic changes significantly influence the transmission dynamics of pertussis, with some studies reporting prolonged epidemic cycles [15]. Comprehensive surveillance is necessary to enhance the understanding of B. Pertussis dynamics and anticipate future outbreaks.
Effective disease forecasting for communicable diseases has been made possible using models such as ARIMA and SARIMA. These models deliver early warnings for diseases such as dengue, tuberculosis, malaria, and COVID-19 while also offering reliable epidemic forecasts [16,17]. For example, SARIMA models have demonstrated effectiveness in identifying seasonal patterns of diseases, including hand, foot, and mouth disease [18]. Furthermore, SARIMA models exhibit similarities to dynamic linear models when long-term longitudinal data is utilized [19].
In the context of diseases characterised by long-range dependencies, such as hemorrhagic fever advanced models like SARFIMA have demonstrated superior predictive capabilities [20]. Time series analytic approaches serve as valuable tools for public health surveillance, enabling authorities to implement preventative measures and mitigate the impact of disease outbreaks [21].
Recent research has examined various predictive models for B. Pertussis incidence. Contemporary trends in short-term B. Pertussis data indicate the feasibility of employing time series analysis techniques, specifically ARIMA and exponential smoothing models [10,22] (Zeng et al., 2016; Wang et al., 2018). Hybrid methodologies that integrate wavelet transformations or ARIMA with neural networks have demonstrated enhanced accuracy [22].
Incorporating additional data sources, including Google Trends, improves conventional modelling techniques [23]. Numerous studies, including those conducted by Raycheva et al. (2020) and Zhang et al. (2019), have identified increased incidence and seasonal trends [10,24]. In addition, advanced models integrating age-structured and particle-filtering methodologies have been created to elucidate diminishing immunity and assess therapeutic interventions [25,26]. This allows advanced forecasting systems to evaluate potential strategies for reducing the burden of B. pertussis and providing early warnings, facilitating informed public health decision-making.
Despite extensive research on B. Pertussis epidemiology and forecasting methods, there remain gaps in integrating advanced time series models with socio-environmental variables. Previous studies have primarily utilised conventional statistical models like ARIMA and SARIMA, which, while effective, have limitations in accurately representing the complex nonlinear relationships characteristic of disease transmission. Moreover, few studies have explored B. Pertussis trend analysis in South Africa, highlighting the need for localised forecasting methods. This study seeks to address these deficiencies by employing various forecasting methodologies, including hybrid models that integrate machine learning techniques. This study aims to (1) analyse historical B. Pertussis trends and identify seasonal patterns, (2) compare the predictive accuracy of various time series models, and (3) evaluate the influence of climate on B. Pertussis incidence in Tshwane.
2. Materials and Methods
2.1. Study Design
This investigation employed a retrospective time series analysis to examine B. Pertussis incidence patterns and evaluate the predictive capabilities of various forecasting models. The methodological approach integrated traditional statistical techniques with machine learning algorithms to enhance disease prediction accuracy.
2.2. Data Collection
B. Pertussis surveillance data were obtained from public and private health facilities in the Tshwane Health District, South Africa.
2.3. Inclusion and Exclusion Criteria
The study included all laboratory-confirmed and clinically diagnosed B. Pertussis cases reported in Tshwane between 2015 and 2019. Records were excluded if they were duplicates or contained unverified clinical diagnoses.
2.4. Data Processing and Analysis
All datasets underwent standardisation into a uniform monthly aggregation format. Missing values were addressed through linear interpolation and multiple imputation techniques. To mitigate reporting errors, extreme values were identified using z-scores and boxplot analyses.
2.5. Time Series Modeling
The time series data were analysed through Seasonal-Trend Decomposition with LOESS (STL), which enabled the decomposition into trend, seasonal, and residual components. The Augmented Dickey-Fuller (ADF) test was employed to evaluate stationarity. Four forecasting approaches were considered: Autoregressive Integrated Moving Average (ARIMA), Seasonal ARIMA (SARIMA), Holt-Winters Exponential Smoothing, and a Hybrid Machine Learning Model combining LSTM and ARIMA. Model selection was determined based on the Akaike Information Criterion (AIC) and Bayesian Information Criterion (BIC). Mean Absolute Error (MAE) and Root Mean Square Error (RMSE) were utilised to assess predictive accuracy. The statistical and computational analyses were performed using several software tools, including Python (with libraries such as pandas, statsmodels, and TensorFlow for LSTM models), Stata for statistical validation, and R for visualisation and time series decomposition.
To evaluate the models' performance, a rolling-window cross-validation method was used. Additionally, residual analyses were carried out to assess the model's goodness of fit and the reliability of their forecasts.
3. Results
The incidence of Pertussis infection exhibited seasonal patterns, with peak cases being reported in Spring and Winter. Time series decomposition confirmed annual fluctuations
3.1. Descriptive Statistics
Table 1 presents the descriptive statistics of reported B. Pertussis cases by season. Spring exhibited the highest variability, peaking at 54 cases in 2018.
3.2. Time Series Trend Analysis
Figure 1 illustrates seasonal and long-term trends in B. Pertussis cases through a line graph. It shows seasonal peaks in Spring and Winter, with moving averages (MA(4) and CMA(4)) highlighting a decline from 2015 to 2017. However, this decline was followed by a significant increase in cases from 2018 to 2019.
Figure 2 illustrates a time series analysis of B. Pertussis cases, showing a long-term decline in cases until 2017, followed by a notable increase in 2018-2019. The seasonal component indicates regular peaks, indicating seasonal variation, while the residual component remains mostly stable but shows anomalies during 2018-2019, suggesting the potential impact of external factors.
3.3. Trend Model Comparisons
Table 2 summarises the Mean Squared Error (MSE) for three trend models: Linear, Cubic, and Exponential. MSE measures the average squared differences between predicted and actual values, with lower values signifying better performance. The findings indicate that the cubic model offers the best predictive accuracy, while the exponential model is the least effective.
3.4. Forecasting Using the Cubic Model (2020-2021)
Figure 3 presents the projected case counts from the cubic model for 2020 to 2021. Notably, it reveals a peak in cases during 2020, followed by a sharp decline in 2021.
Table 3 depicts the forecasted cases of B. B. Pertussis for 2020-2021, showing cases peaking in 2020 and then sharply declining in 2021.
Table 4 depicts the ARMA(4) model which shows pertussis case counts are dependent on short term flactuations.
Figure 4 depicts the actual vs. ARMA(4) model fitted values which ) model closely follows actual trends, peaks and anomalies in 2018-2019 are not fully captured.
Interpretation: While the ARMA(4) model closely follows actual trends, peaks and anomalies in 2018-2019 are not fully captured, suggesting external factors may influence outbreaks.
Table 5 depicts the residual diagnostics of the ARMA(4) model which shows that the Ljung-Box Test was insignificant. (p-value = 0.09.
Figure 5 depicts that the residuals appear mostly stable, but occasional deviations suggest additional influencing factors.
4. Discussion
The analysis of B. Pertussis trends in the Tshwane Health District over five years confirms the hypothesis of public health experts: B. Pertussis persists and demonstrates a distinct seasonal pattern, with peaks observed in Spring and Winter. This pattern corresponds with global observations, suggesting that B. Pertussis cases typically rise during colder months [27]. The significance of these findings is that, despite vaccination initiatives, B. Pertussis persists in predictable cycles, highlighting the necessity for more strategic, data-informed interventions.
One of this study's key contributions is its use of ARMA(4) modelling, which successfully captured short-term fluctuations in B. Pertussis incidence. The cubic trend model provided a reliable approach to long-term forecasting. These models offer a window into the future, helping policymakers anticipate outbreaks rather than react to them.
Our modelling approach further develops existing B. Pertussis forecasting studies, which have predominantly used SARIMA models for their capacity to incorporate seasonality [10]. Our findings indicate that ARMA-based models can yield comparably robust short-term forecasts, especially when integrating external factors like vaccination coverage and climate data [26]. This offers a chance to enhance public health forecasting instruments by incorporating real-time surveillance data.
The current era necessitates an increased emphasis on predictive analytics in disease control efforts. Incorporating real-time Google Trends data and surveillance trends could facilitate the development of early warning systems, enabling public health officials to prepare for seasonal surges in B. Pertussis. This concept has been examined in other infectious disease modelling studies, where integrating Google Trends or electronic health records has improved outbreak predictions [23] . Predicting the timing and location of case spikes allows preemptive intervention to prevent outbreak escalation.
The findings underscore the significance of strategically timing vaccination efforts. The increase of B. Pertussis in well-vaccinated populations is partially linked to waning immunity and the rise of pertactin-deficient strains. (Heininger et al., 2024).Our study confirms the existence of seasonal peaks, suggesting that administering booster doses prior to high-incidence periods could enhance herd immunity during critical times [25].
5. Conclusions
This research illustrates the efficacy of time series models in predicting B. Pertussis incidence, underscoring the significance of seasonal variations and climatic factors in the disease's dynamics. The results underscore the critical need for prompt vaccination initiatives, climate-responsive health strategies, and improved surveillance systems to reduce the frequency of B. Pertussis outbreaks effectively. Incorporating climate data and real-time surveillance into forthcoming forecasting models could significantly enhance epidemic preparedness and guide the development of targeted public health interventions.
Institutional Review Board Statement
Ethical approval for the study was received from the School of Medicine Ethics Committee and the Sefako Makgatho Health Science University Research Ethics Committee (SMUREC/M/58/2021:PG). The Head of The Gauteng Department Health gave permission to conduct the study. The study adhered to confidentiality protocols to protect sensitive information, ensuring the confidentiality and safety of participants’ data by maintaining privacy in record-keeping.
Informed Consent Statement
Ethical approval for the study was received from the School of Medicine Ethics Committee and the Sefako Makgatho Health Science University Research Ethics Committee (SMUREC/M/58/2021:PG). The Head of The Gauteng Department Health gave permission to conduct the study. The study adhered to confidentiality protocols to protect sensitive information, ensuring the confidentiality and safety of participants’ data by maintaining privacy in record-keeping.
Data Availability Statement
Research data is available upon reasonable request.
Acknowledgments
The authors would like to express their gratitude to the Tshwane Health District staff for their support in helping with the data collection for this study.
Conflicts of Interest
The authors declare no conflicts of interest. The funders had no role in the design of the study; in the collection, analyses, or interpretation of data; in the writing of the manuscript; or in the decision to publish the results.
References
- Ward, J.I.; Cherry, J.D.; Chang, S.-J.; Partridge, S.; Lee, H.; Treanor, J.; Greenberg, D.P.; Keitel, W.; Barenkamp, S.; Bernstein, D.I.; et al. Efficacy of an Acellular Pertussis Vaccine among Adolescents and Adults. New Engl. J. Med. 2005, 353, 1555–1563. [Google Scholar] [CrossRef] [PubMed]
- Muloiwa, R.; Kagina, B.M.; E Engel, M.; Hussey, G.D. The burden of pertussis in low- and middle-income countries since the inception of the Expanded Programme on Immunization (EPI) in 1974: a systematic review protocol. Syst. Rev. 2015, 4, 1–7. [Google Scholar] [CrossRef] [PubMed]
- Zhang, X.; Zhang, T.; Young, A.A.; Li, X. Applications and Comparisons of Four Time Series Models in Epidemiological Surveillance Data. PLOS ONE 2014, 9, e88075. [Google Scholar] [CrossRef] [PubMed]
- Robertson, C.; Nelson, T.A.; MacNab, Y.C.; Lawson, A.B. Review of methods for space–time disease surveillance. Spat. Spatio-temporal Epidemiology 2010, 1, 105–116. [Google Scholar] [CrossRef]
- Cazelles, B.; Chavez, M.; de Magny, G.C.; Guégan, J.-F.; Hales, S. Time-dependent spectral analysis of epidemiological time-series with wavelets. J. R. Soc. Interface 2007, 4, 625–636. [Google Scholar] [CrossRef]
- Cardinal M, Lambert J, Roy R. On the application of integer-valued time series models for the analysis of disease incidence. Stat Med. 1999;18:2025–39.
- Gentleman R, Hornik K, Parmigiani G. Epidemics Models and Data using R. 1st edition. University Park, PA, USA; 2018.
- Zeger, S.L.; Irizarry, R.; Peng, R.D. On Time Series Analysis of Public Health and Biomedical Data. Annu. Rev. Public Heal. 2006, 27, 57–79. [Google Scholar] [CrossRef]
- Zhang, Y.; Bambrick, H.; Mengersen, K.; Tong, S.; Feng, L.; Liu, G.; Xu, A.; Zhang, L.; Hu, W. Association of weather variability with resurging pertussis infections among different age groups: A non-linear approach. Sci. Total. Environ. 2020, 719, 137510. [Google Scholar] [CrossRef]
- Zeng, Q.; Li, D.; Huang, G.; Xia, J.; Wang, X.; Zhang, Y.; Tang, W.; Zhou, H. Time series analysis of temporal trends in the pertussis incidence in Mainland China from 2005 to 2016. Sci. Rep. 2016, 6, srep32367–32367. [Google Scholar] [CrossRef]
- Huang, X.; Lambert, S.; Lau, C.; Magalhaes, R.J.S.; Marquess, J.; Rajmokan, M.; Milinovich, G.; Hu, W. Assessing the social and environmental determinants of pertussis epidemics in Queensland, Australia: a Bayesian spatio-temporal analysis. Epidemiology Infect. 2017, 145, 1221–1230. [Google Scholar] [CrossRef]
- Dafilis, M.P.; Frascoli, F.; McVernon, J.; Heffernan, J.M.; McCaw, J.M. The dynamical consequences of seasonal forcing, immune boosting and demographic change in a model of disease transmission. J. Theor. Biol. 2014, 361, 124–132. [Google Scholar] [CrossRef]
- Gomes, M.; Gomes, J.; Paulo, A. Diphtheria, pertussis, and measles in Portugal before and after mass vaccination: A time series analysis. Eur. J. Epidemiology 1999, 15, 791–798. [Google Scholar] [CrossRef] [PubMed]
- Anderson, R.M.; Grenfell, B.T.; May, R.M. Oscillatory fluctuations in the incidence of infectious disease and the impact of vaccination: time series analysis. Epidemiology Infect. 1984, 93, 587–608. [Google Scholar] [CrossRef] [PubMed]
- Skoff, T.H.; Hadler, S.; Hariri, S. The Epidemiology of Nationally Reported Pertussis in the United States, 2000–2016. Clin. Infect. Dis. 2018, 68, 1634–1640. [Google Scholar] [CrossRef] [PubMed]
- Yadav, S.K.; Akhter, Y. Statistical Modeling for the Prediction of Infectious Disease Dissemination With Special Reference to COVID-19 Spread. Front. Public Heal. 2021, 9, 645405. [Google Scholar] [CrossRef]
- Kumar N, Susan S. COVID-19 Pandemic Prediction using Time Series Forecasting Models. 2020.
- Yu, G.; Feng, H.; Feng, S.; Zhao, J.; Xu, J. Forecasting hand-foot-and-mouth disease cases using wavelet-based SARIMA–NNAR hybrid model. PLOS ONE 2021, 16, e0246673. [Google Scholar] [CrossRef]
- Nobre, F.F.; Monteiro, A.B.S.; Telles, P.R.; Williamson, G.D. Dynamic linear model and SARIMA: a comparison of their forecasting performance in epidemiology. Stat. Med. 2001, 20, 3051–3069. [Google Scholar] [CrossRef]
- Qi, C.; Zhang, D.; Zhu, Y.; Liu, L.; Li, C.; Wang, Z.; Li, X. SARFIMA model prediction for infectious diseases: application to hemorrhagic fever with renal syndrome and comparing with SARIMA. BMC Med Res. Methodol. 2020, 20, 1–7. [Google Scholar] [CrossRef]
- Allard, R. Update/Le point Use of time-series analysis in infectious disease surveillance. 1998.
- Wang, M.; Pan, J.; Li, X.; Li, M.; Liu, Z.; Zhao, Q.; Luo, L.; Chen, H.; Chen, S.; Jiang, F.; et al. ARIMA and ARIMA-ERNN models for prediction of pertussis incidence in mainland China from 2004 to 2021. BMC Public Heal. 2022, 22, 1–11. [Google Scholar] [CrossRef]
- Nann, D.; Walker, M.; Frauenfeld, L.; Ferenci, T.; Sulyok, M. Forecasting the future number of pertussis cases using data from Google Trends. Heliyon 2021, 7, e08386. [Google Scholar] [CrossRef]
- Raycheva, R.; Kevorkyan, A.; Stoilova, Y. Stochastic modelling of scalar time series of varicella incidence for a period of 92 years (1928-2019). Folia Medica 2022, 64, 624–632. [Google Scholar] [CrossRef]
- Campbell, P.T.; McCaw, J.M.; McVernon, J. Pertussis models to inform vaccine policy. Hum. Vaccines Immunother. 2015, 11, 669–678. [Google Scholar] [CrossRef] [PubMed]
- Li, X.; Patel, V.; Duan, L.; Mikuliak, J.; Basran, J.; Osgood, N.D. Real-Time Epidemiology and Acute Care Need Monitoring and Forecasting for COVID-19 via Bayesian Sequential Monte Carlo-Leveraged Transmission Models. Int. J. Environ. Res. Public Heal. 2024, 21, 193. [Google Scholar] [CrossRef] [PubMed]
- Broutin, H.; Viboud, C.; Grenfell, B.T.; Miller, M.A.; Rohani, P. Impact of vaccination and birth rate on the epidemiology of pertussis: a comparative study in 64 countries. Proc. R. Soc. B: Biol. Sci. 2010, 277, 3239–3245. [Google Scholar] [CrossRef]
- Heininger U, Martini H, Eeuwijk J, Prokić I, Guignard AP, Turriani E, et al. Pertactin deficiency of Bordetella pertussis: Insights into epidemiology, and perspectives on surveillance and public health impact. Human Vaccines and Immunotherapeutics. 2024.
Figure 1.
Seasonal Trend of Reported Cases (2015-2019).
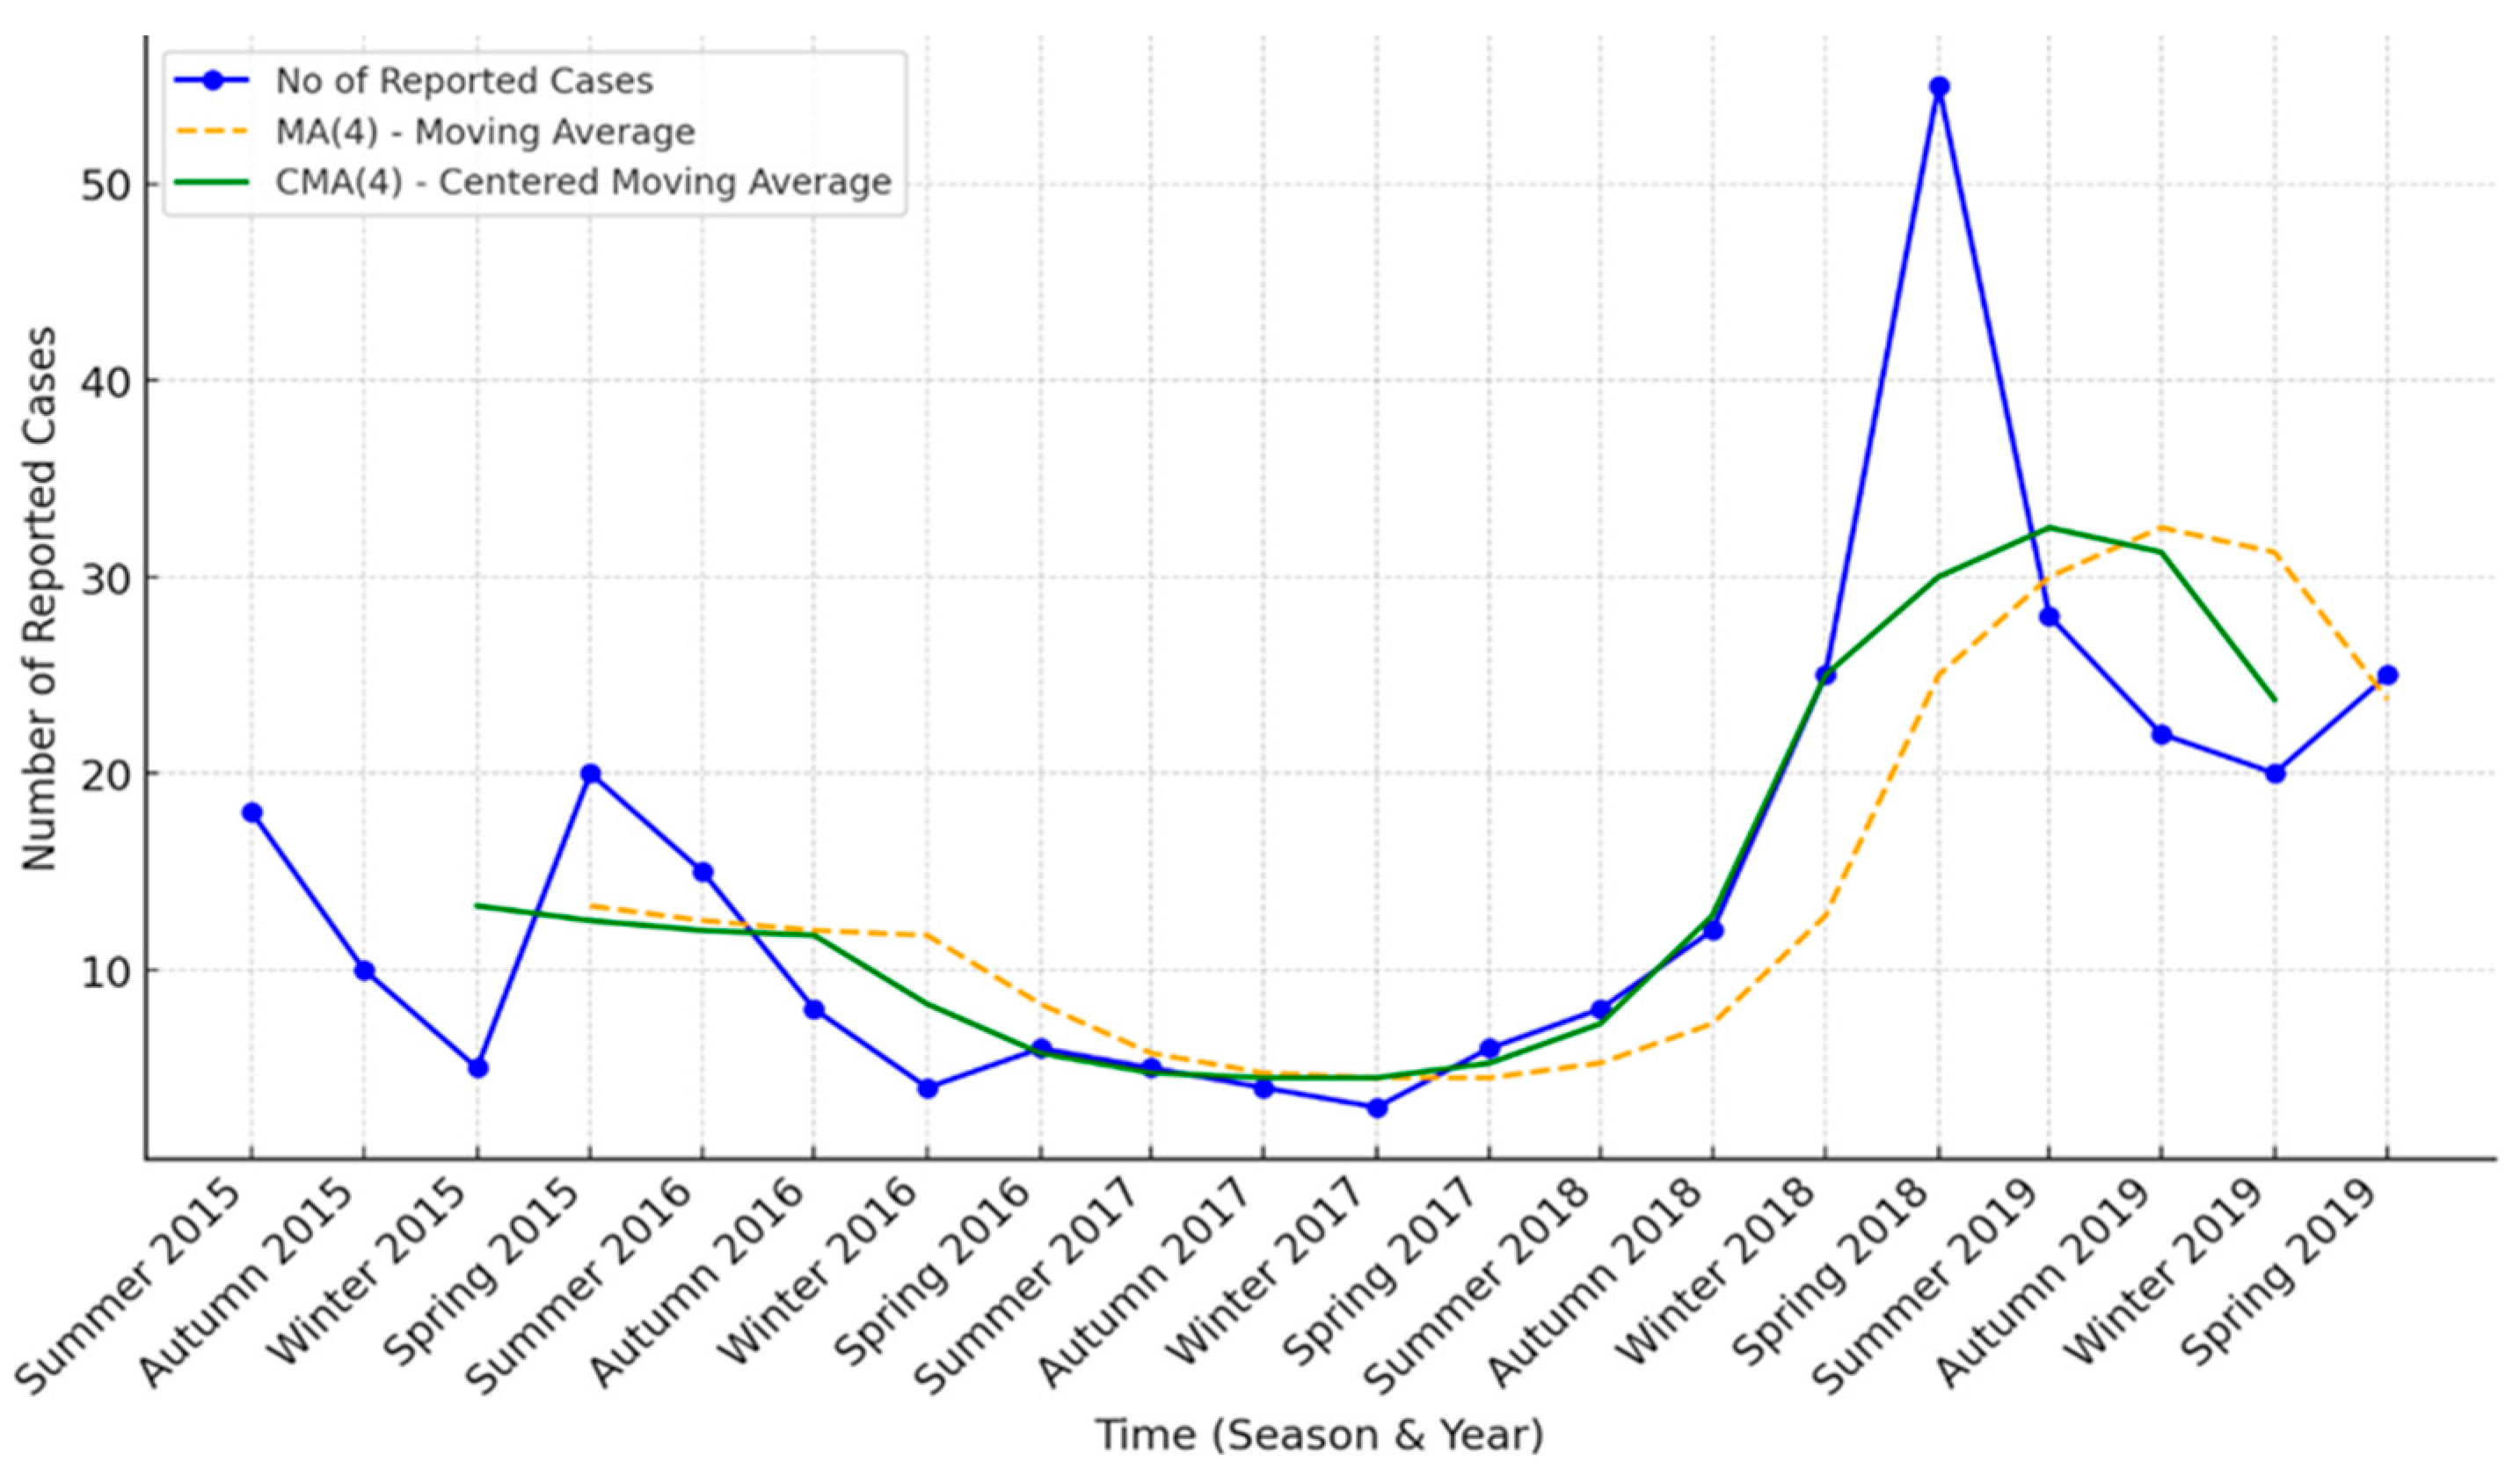
Figure 2.
Time Series Decomposition of B. Pertussis Cases (2015-2019).
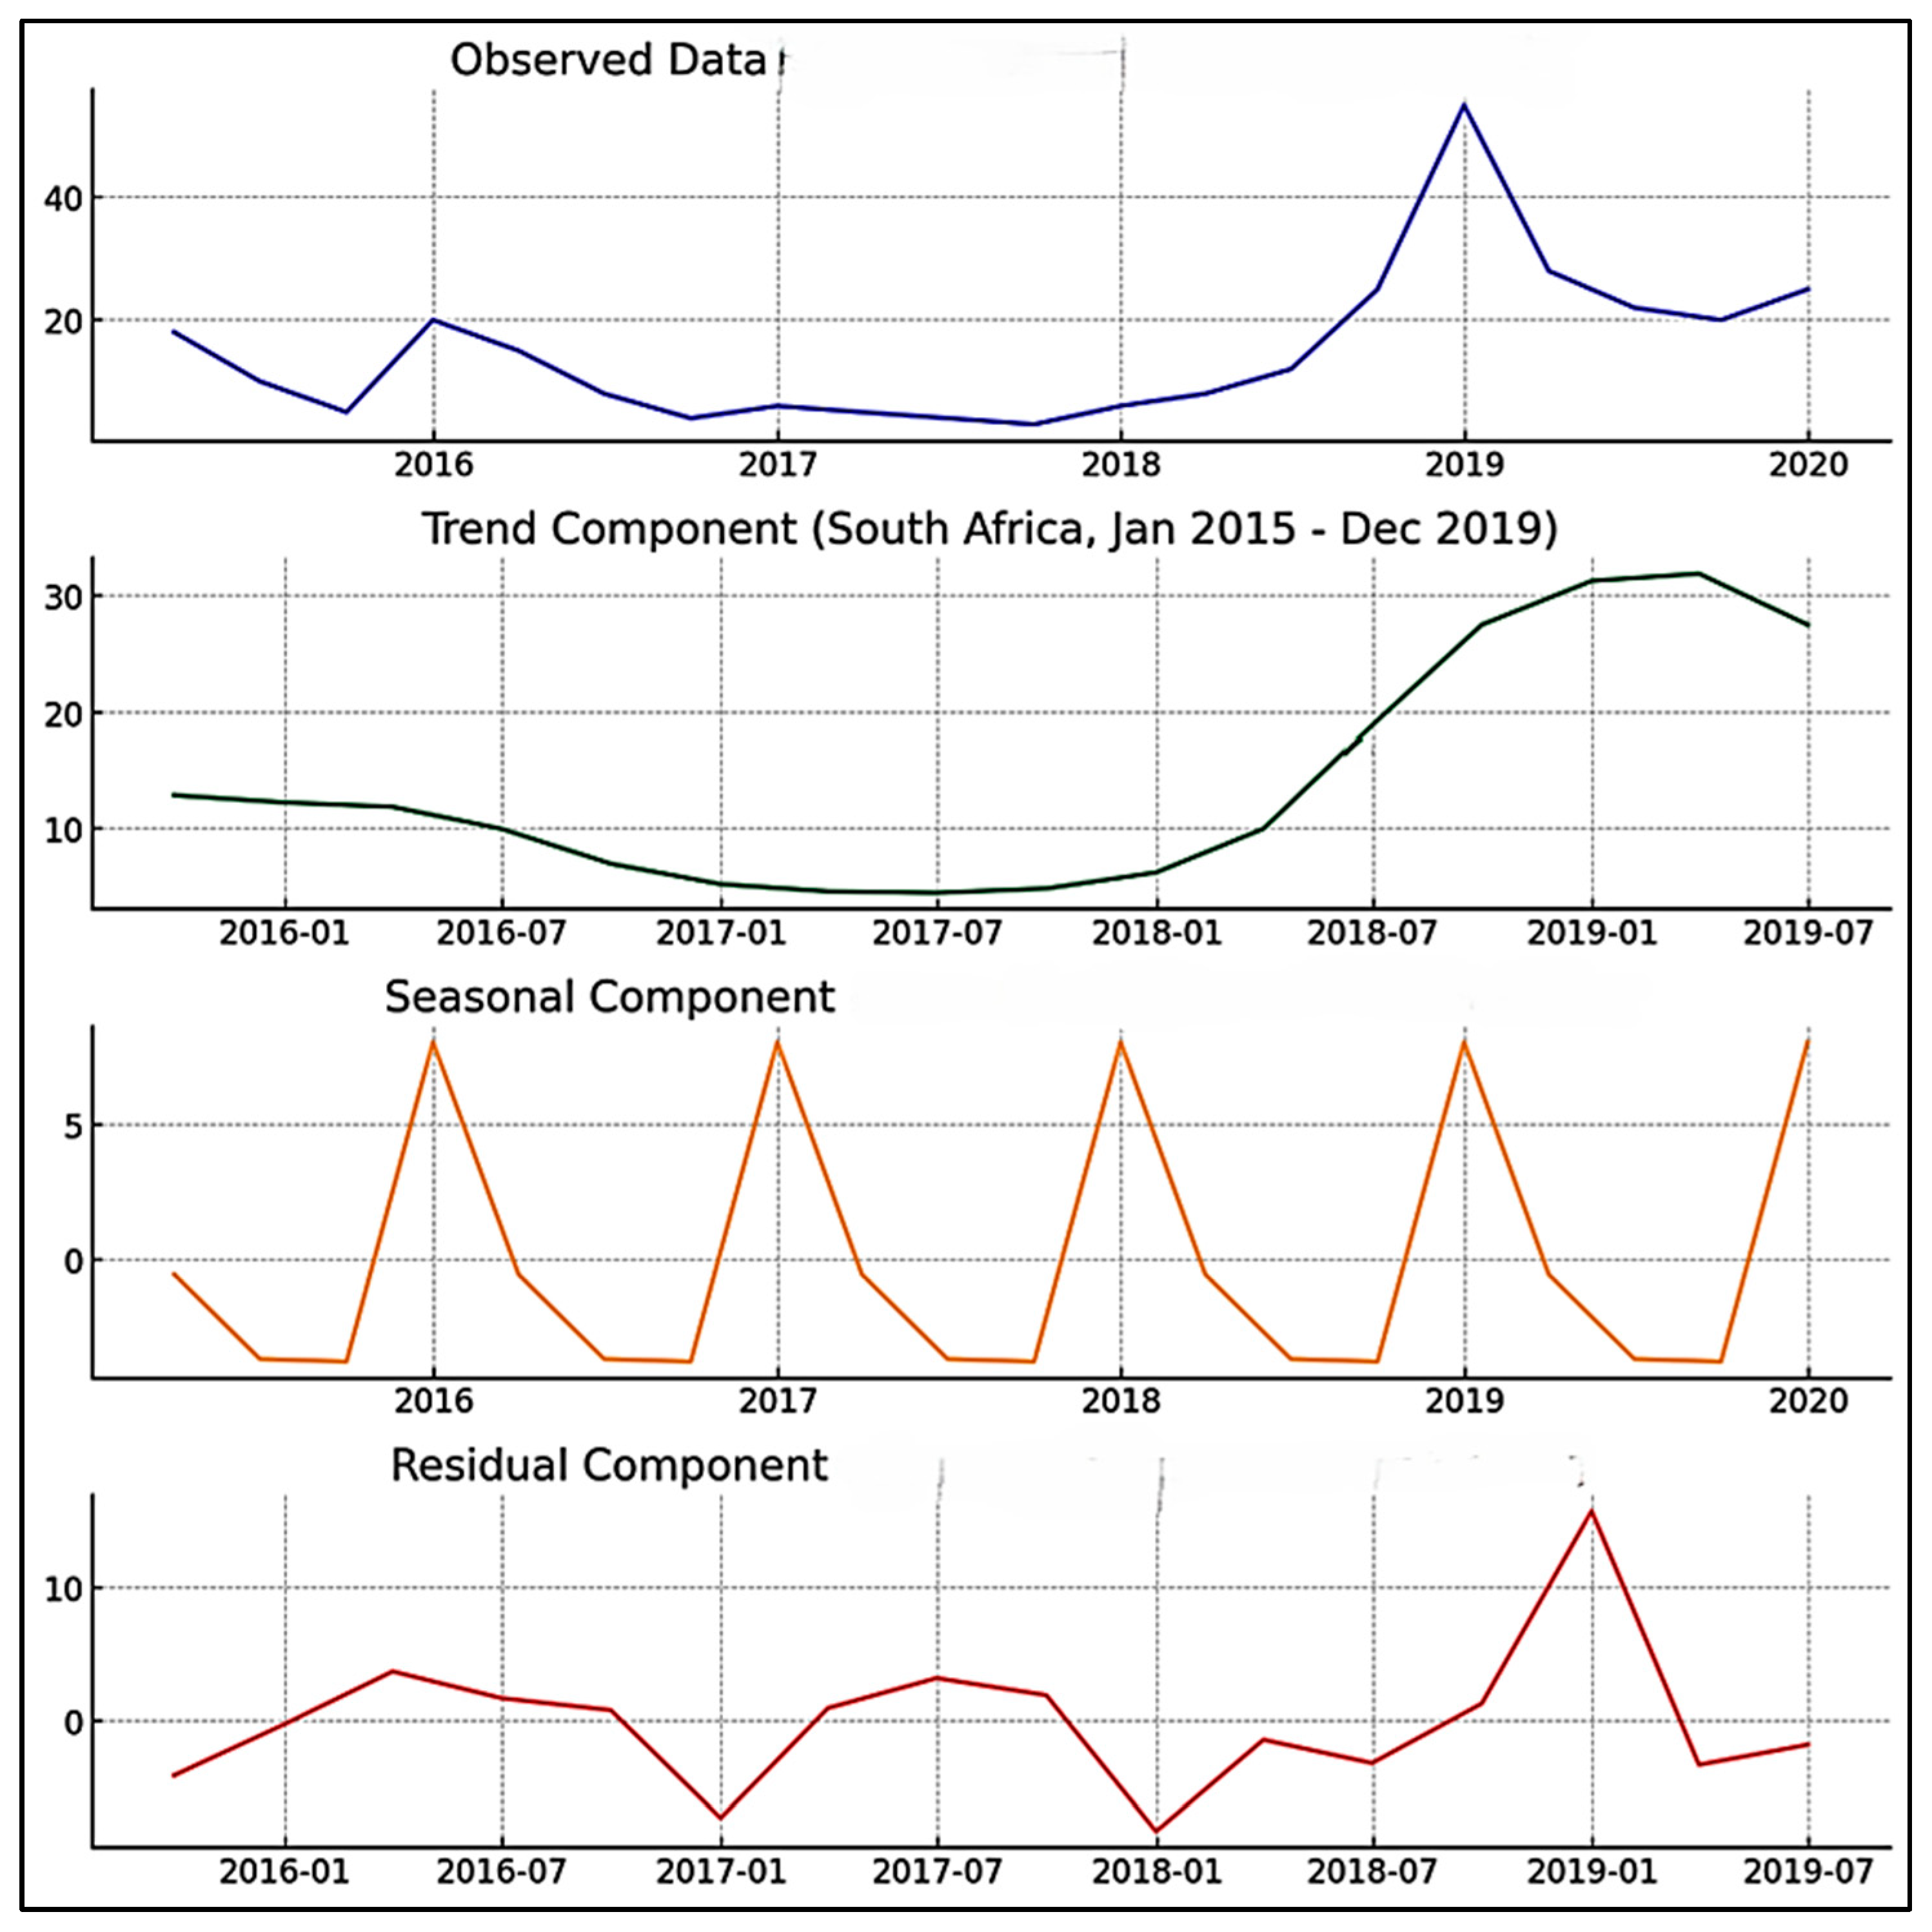
Figure 3.
Forecasted B. Pertussis Cases (2020-2021) Using the Cubic Model (Authors' work).
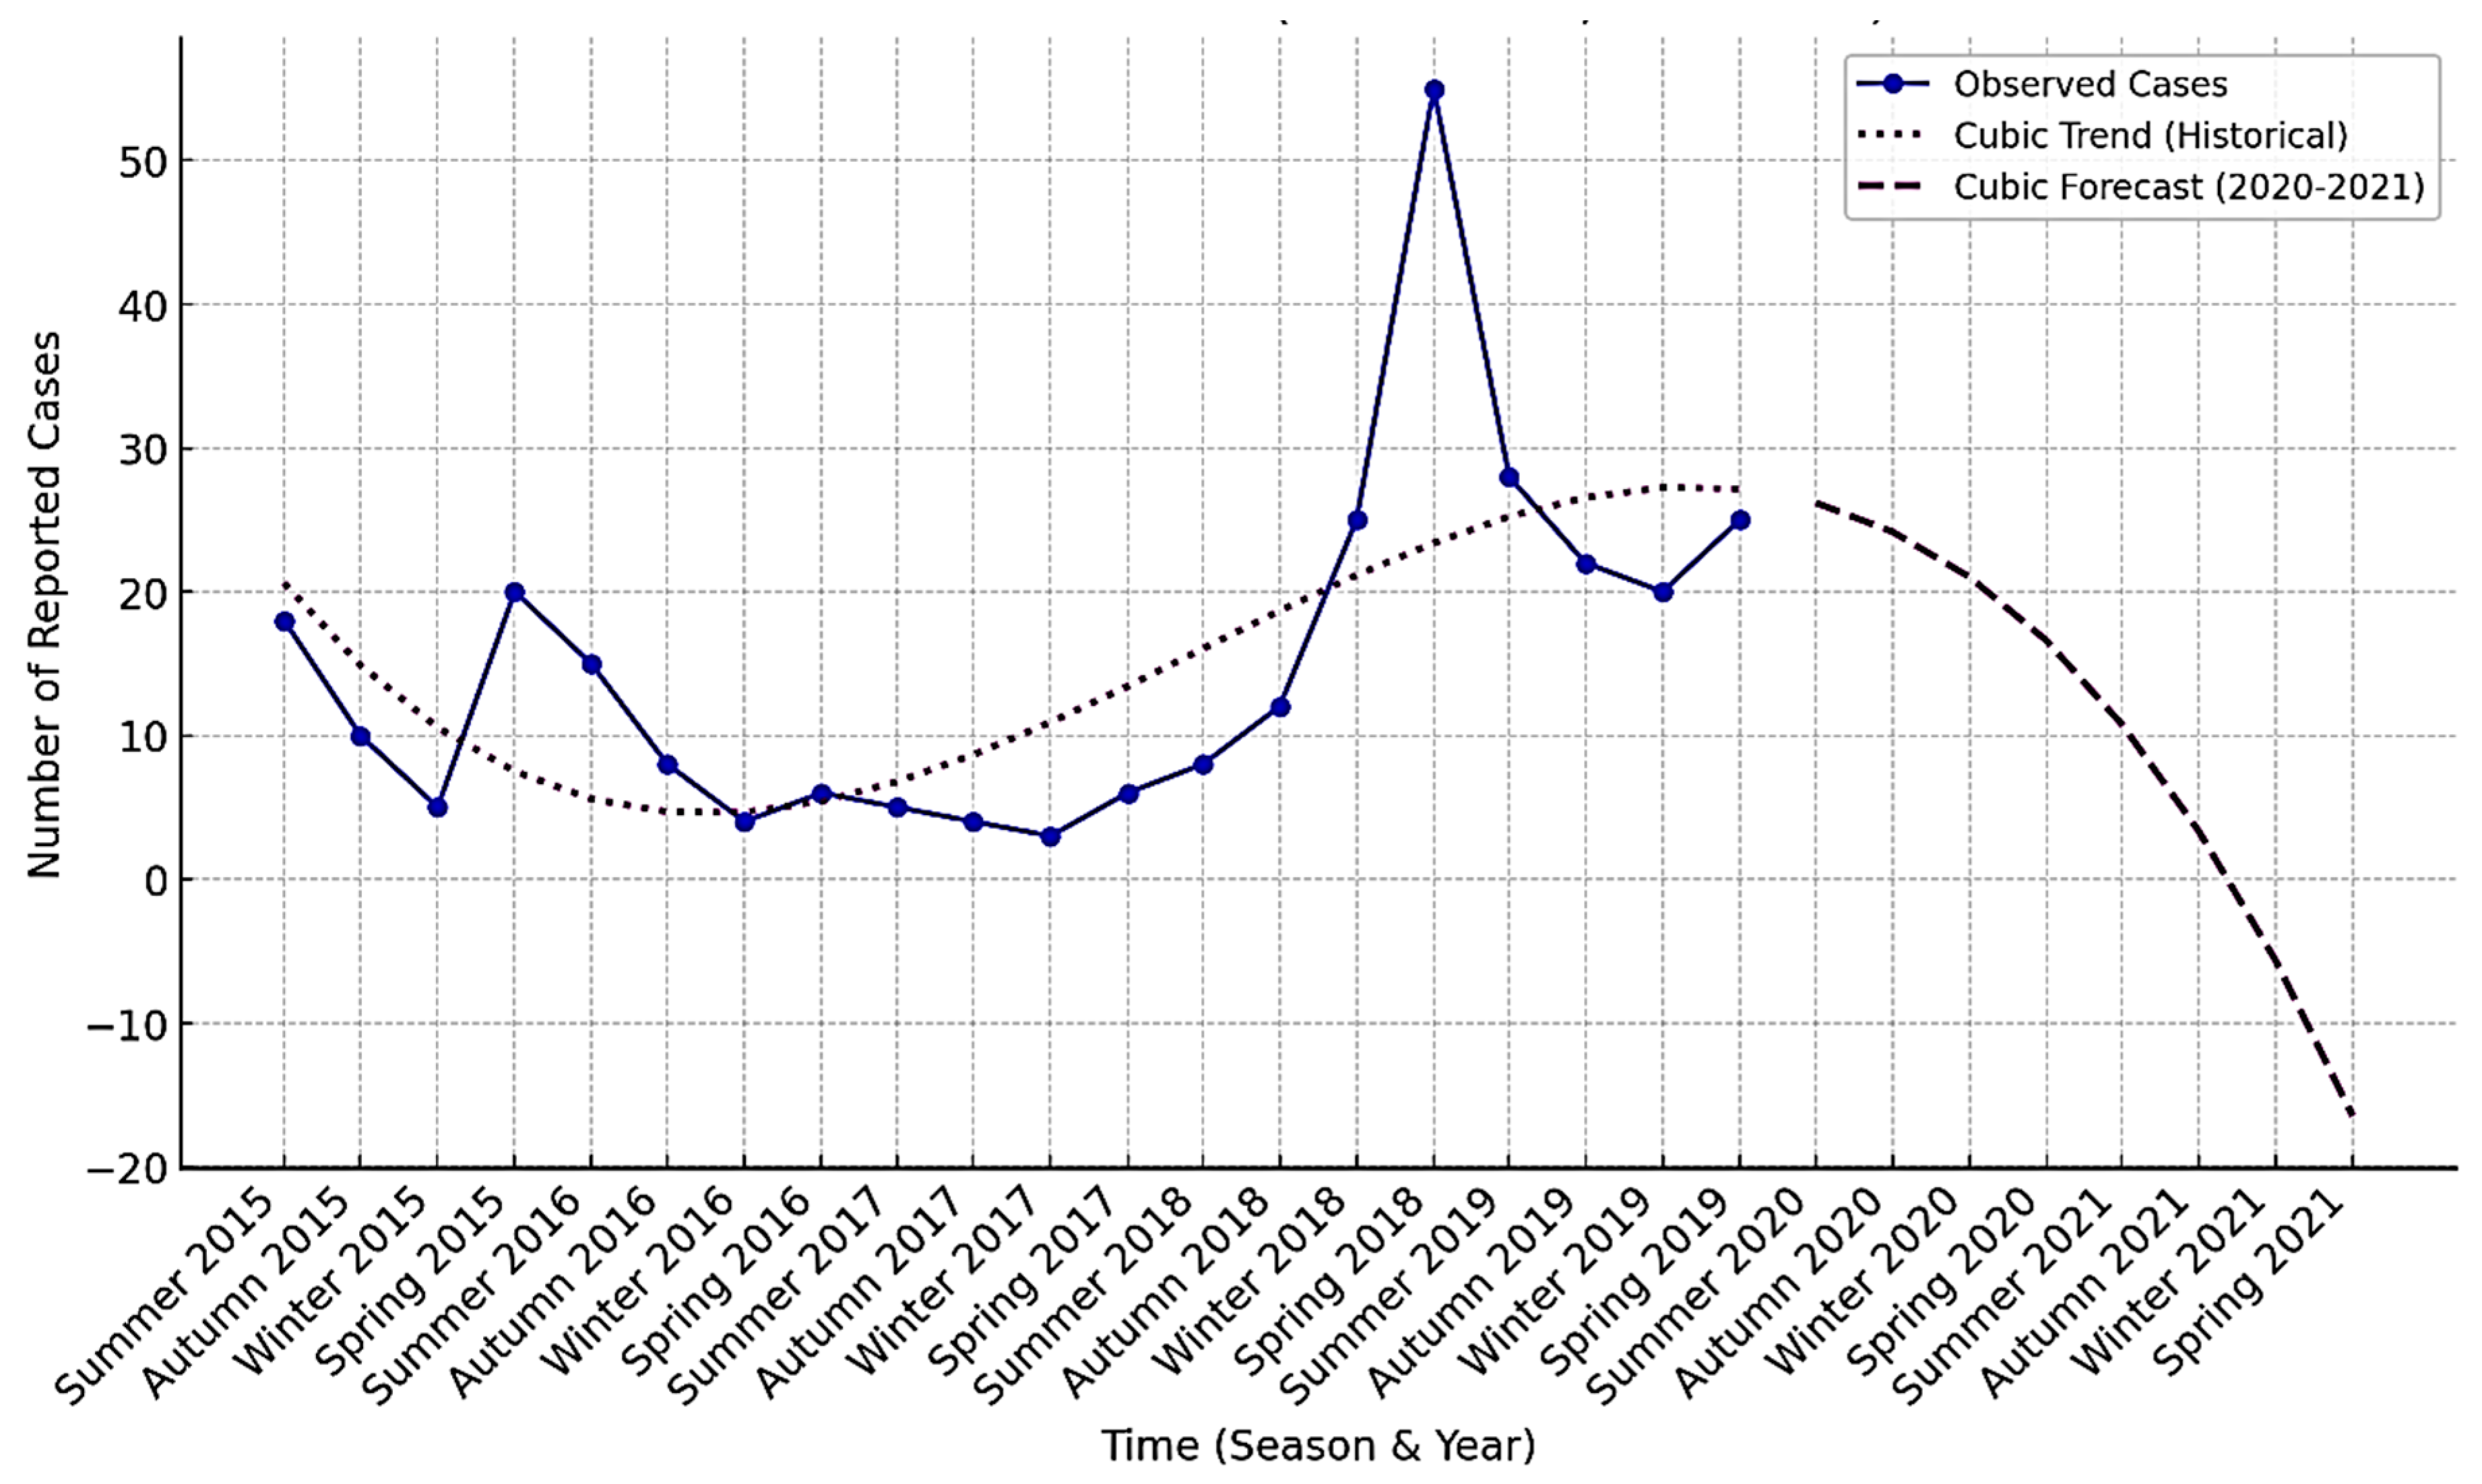
Figure 4.
Actual vs. ARMA(4) Model Fitted Values (Graph Included).
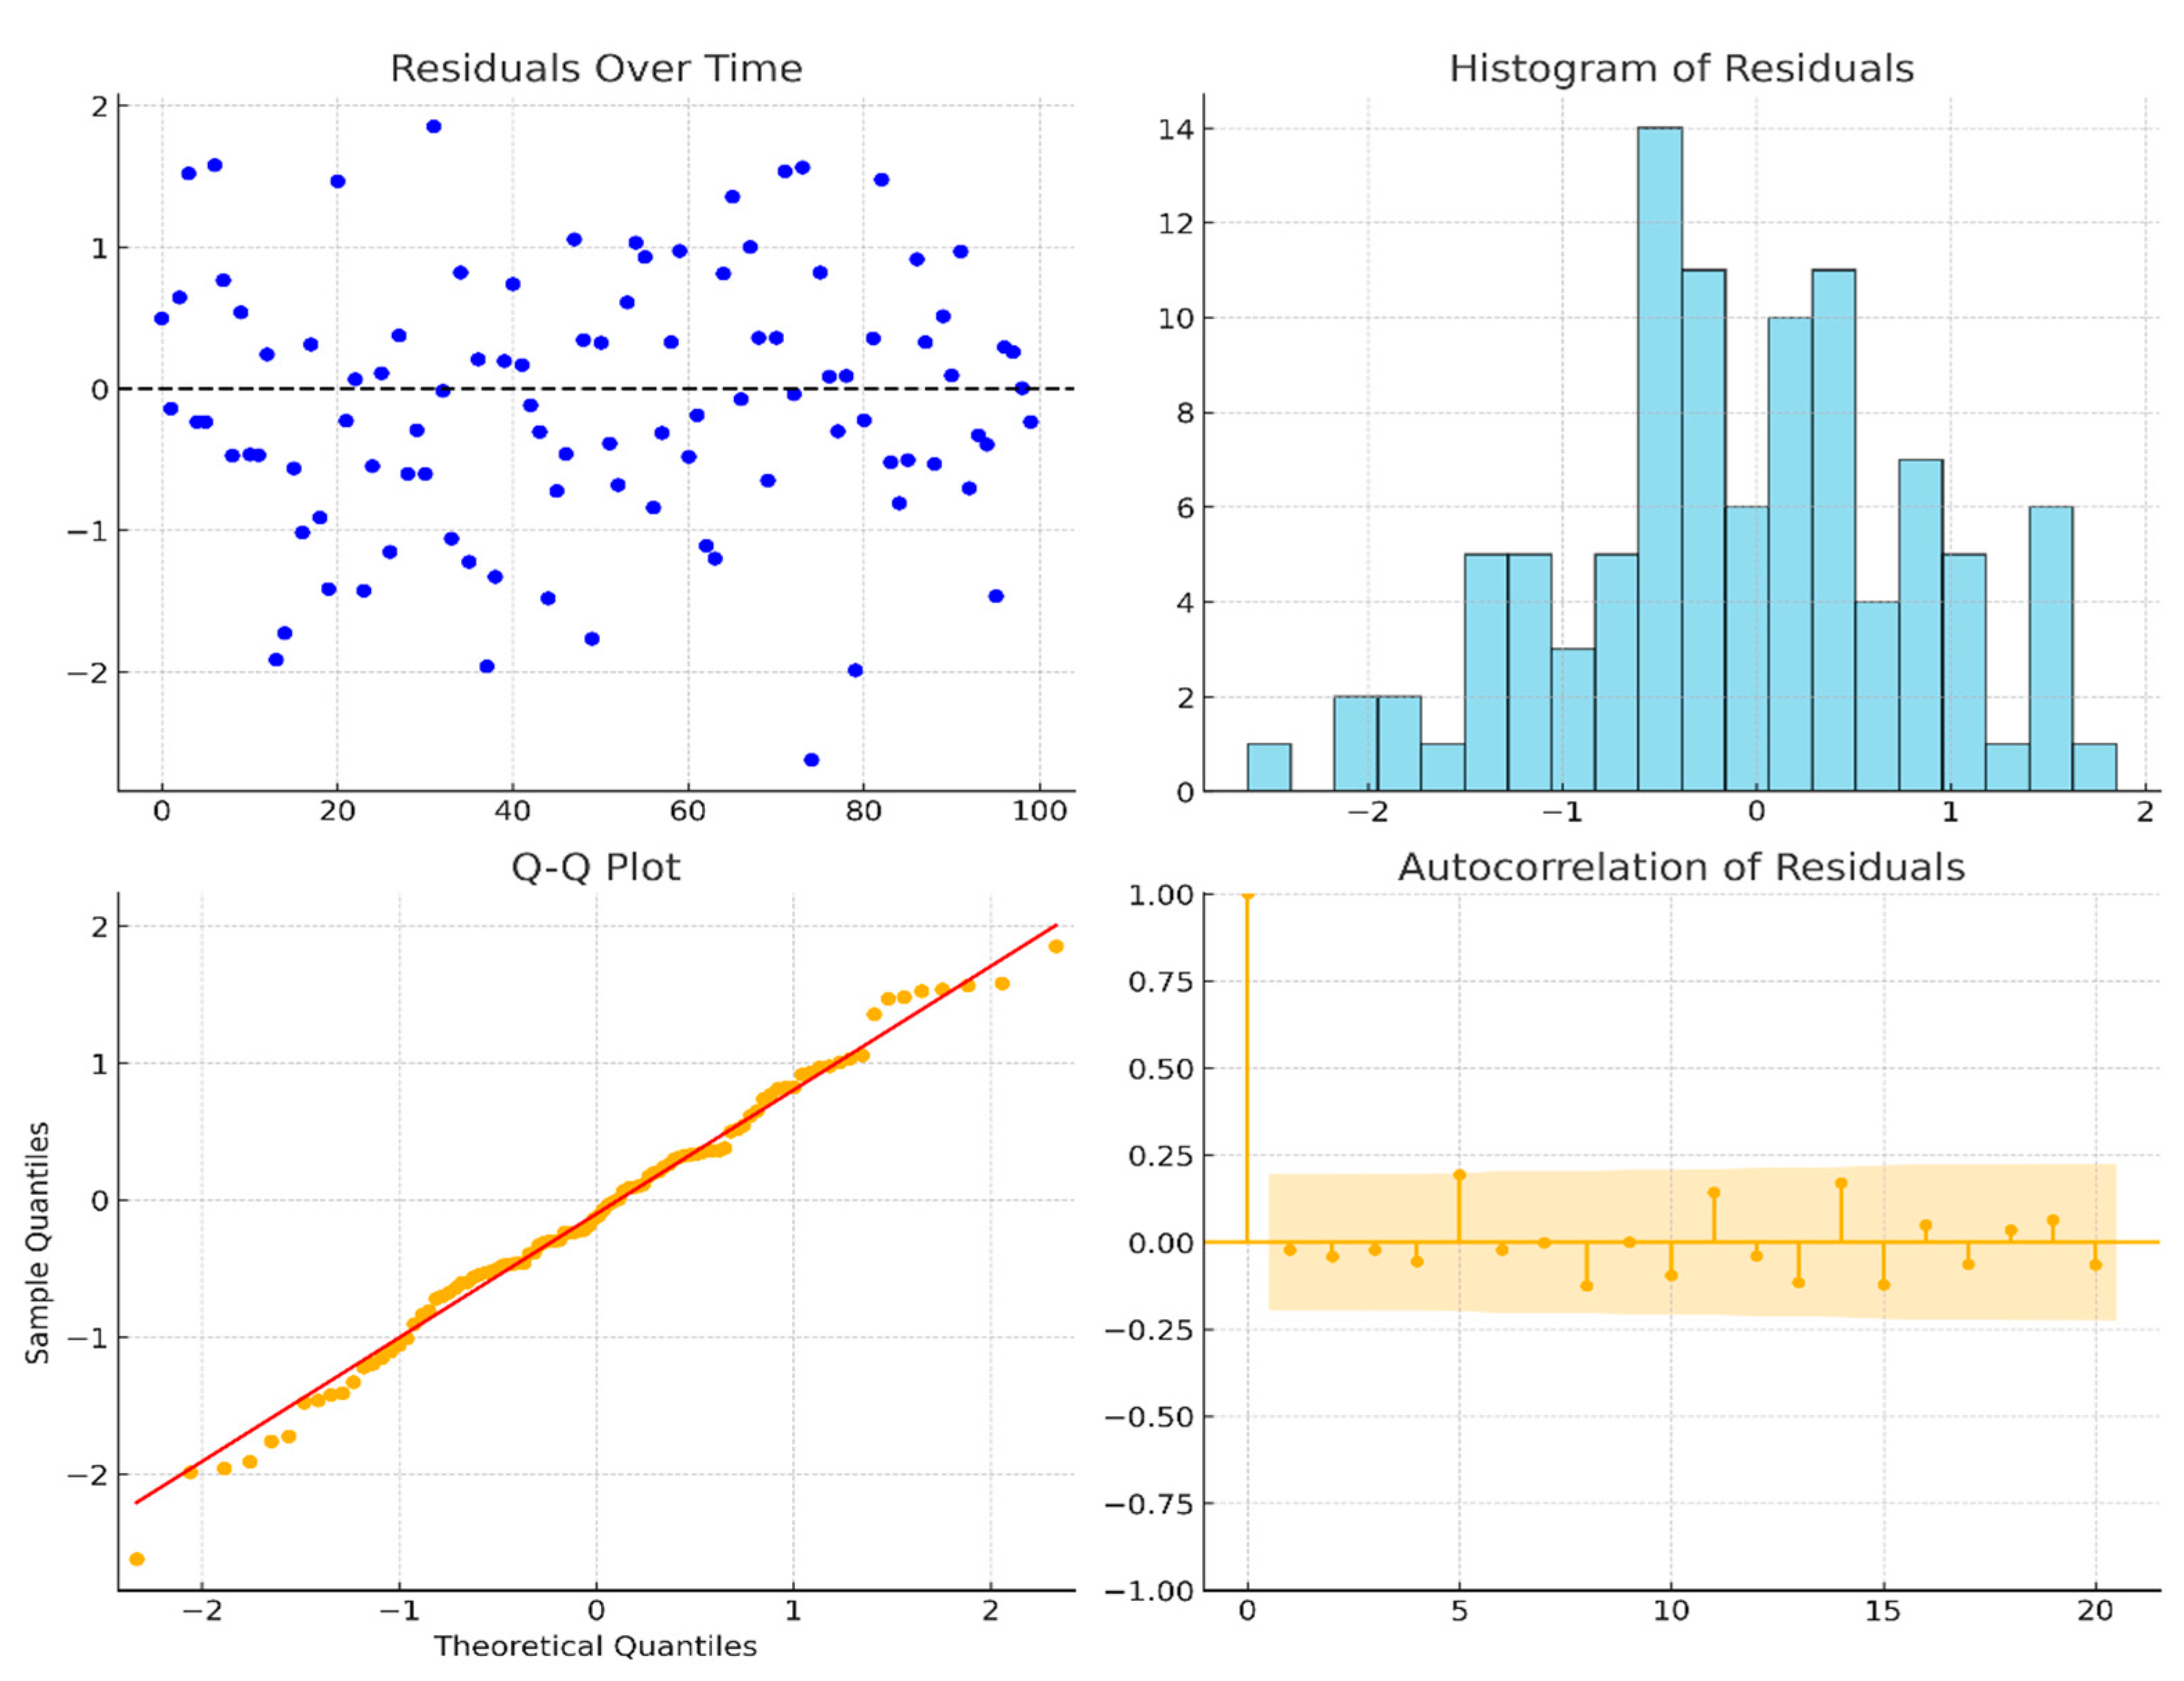
Figure 5.
Residuals of ARMA(4) Model.
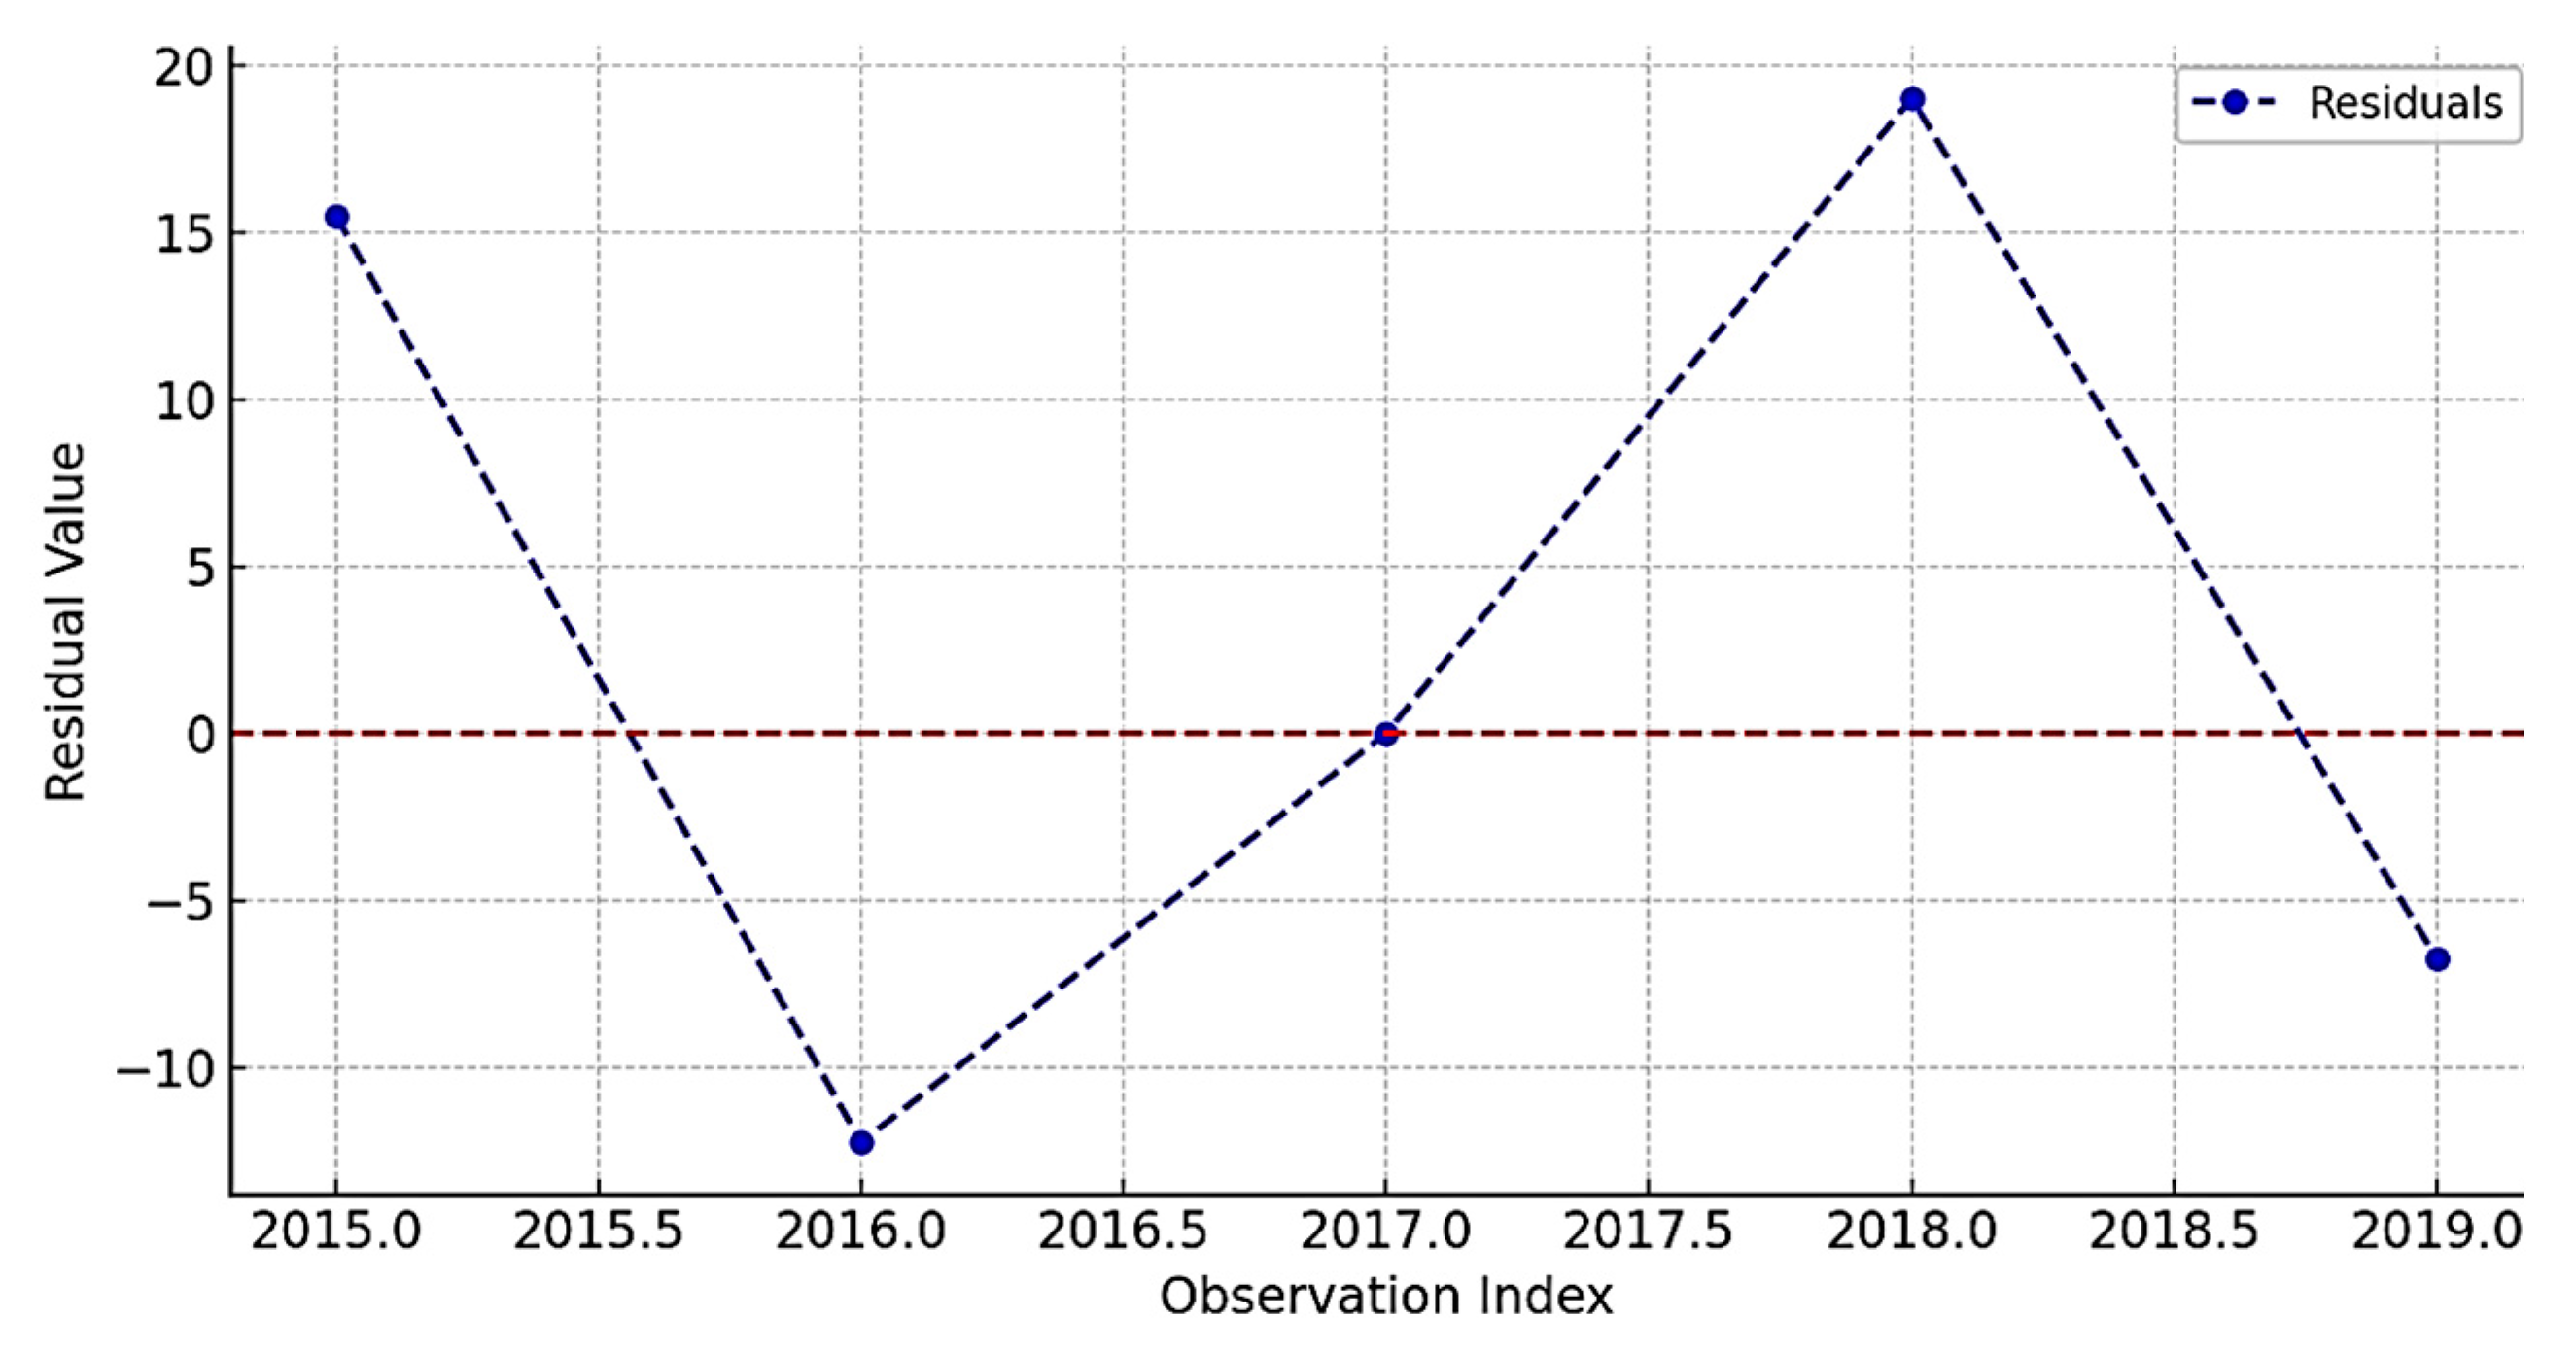

Table 1.
Descriptive Statistics of B. Pertussis Cases (2015-2019).
| Season | Mean Cases | Std. Dev. | Min Cases | Max Cases |
|---|---|---|---|---|
| Autumn | 11.6 | 6.5 | 4 | 20 |
| Winter | 16.6 | 12.0 | 2 | 30 |
| Spring | 19.8 | 21.5 | 1 | 54 |
| Summer | 6.0 | 7.4 | 1 | 19 |
Table 2.
Trend Model Performance Comparison.
| Trend Model | Mean Squared Error (MSE) |
|---|---|
| Linear | 114.95 |
| Cubic | 83.49 |
| Exponential | 122.16 |
Table 3.
Forecasted Cases for 2020-2021(Authors' work).
| Date | Forecasted Cases (Cubic) |
|---|---|
| March 2020 | 26.18 |
| June 2020 | 24.17 |
| September 2020 | 21.02 |
| December 2020 | 16.58 |
| March 2021 | 10.75 |
Table 4.
ARMA(4) Model Estimation Results (Authors' work).
| Variable | Coefficient | Std. Error | t-Statistic | p-Value |
|---|---|---|---|---|
| AR(1) | 0.797*** | 0.167 | 4.77 | 0.000 |
| MA(1) | -0.698*** | 0.189 | -3.69 | 0.001 |
| Constant | 21.77*** | 1.417 | 15.37 | 0.000 |
Key ***: p-value<0.001.
Table 5.
Residual Diagnostics of ARMA(4) Model (Authors’ own work).
| Statistic | Value |
|---|---|
| Mean Residual | 0.002 |
| Std. Deviation | 3.78 |
| Ljung-Box Test (p-value) | 0.09 |
Disclaimer/Publisher’s Note: The statements, opinions and data contained in all publications are solely those of the individual author(s) and contributor(s) and not of MDPI and/or the editor(s). MDPI and/or the editor(s) disclaim responsibility for any injury to people or property resulting from any ideas, methods, instructions or products referred to in the content. |
© 2025 by the authors. Licensee MDPI, Basel, Switzerland. This article is an open access article distributed under the terms and conditions of the Creative Commons Attribution (CC BY) license (http://creativecommons.org/licenses/by/4.0/).
Copyright: This open access article is published under a Creative Commons CC BY 4.0 license, which permit the free download, distribution, and reuse, provided that the author and preprint are cited in any reuse.


