

Submitted:
18 March 2025
Posted:
19 March 2025
You are already at the latest version
Abstract
Rural public transport networks face significant challenges, often characterized by suboptimal service quality. With advancements in technology, various applications have been explored to address these issues. Autonomous Demand Responsive Transits (ADRTs) represent a promising solution that has been investigated over recent years. Their potential to enhance the overall quality of transport systems and promote sustainable transportation is well-recognized. In our research study, we evaluated the viability of ADRTs for rural networks. Our methodology focused on two primary areas: the suitability of ADRTs (considering vehicle type, service offerings, trip purposes, demographic groups, and land use) and the broader impacts of ADRTs (including passenger performance, social impacts, and environmental impacts). We examined demographic heterogeneity and assessed the influence of demographic factors (age, gender, education, occupation, household income level and disability status) on the implementation of ADRTs in rural settings. The study further delineates the varied perceptions across these socio-demographic strata, underscoring the necessity for demographic-specific trials. Consequently, we advocate for the implementation of ADRT services tailored to accommodate the diverse needs of these demographic cohorts.
Keywords:
autonomous mobility
; shared autonomous vehicles
; first mile and last mile
; regional public transport
; mobility-on-demand
1. Introduction
The first-mile/last-mile (FMLM) problem constitutes a significant challenge for rural public transport (PT) systems, characterized by inefficiencies in connecting commuters between their origin and destination points. These inefficiencies often result in increased travel times and diminished quality of service, subsequently leading to reduced user satisfaction and lower PT usage rates (1). While urban areas may offer adequate transport connections, suburban and rural networks frequently lack such options, resulting in a dependency on private vehicles for FMLM travel (2). This dependency necessitates park-and-ride facilities, which, however, limit accessibility for transport-disadvantaged groups such as children, senior citizens, and individuals with disabilities who may have limited access to private cars (3).
Offering shared vehicle services has been one way of mitigating this issue. These shared services aim to provide a more inclusive and efficient solution, thereby improving the accessibility and convenience of PT for all users. Over the past few decades, shared mobility has been the subject of extensive discourse, resulting in the formulation of numerous business and economic models that have substantially mitigated the FMLM problem. Traditional ridesharing models have been operational over the past few decades (4). However, on-demand ride services have introduced a novel paradigm by leveraging smartphone technology to dynamically allocate passenger requests and address demand in real-time. Furthermore, microtransit augments traditional fixed-route transit systems with flexible routing options (5).
With the continuous advancement of technology, Shared Autonomous Vehicles (SAVs) is increasingly regarded as the future of shared mobility, offering a promising solution to the FMLM problem in public transit networks (5-7). It is also noteworthy that the FMLM characteristics vary from city to city across the world, and thus SAV implementations have different impacts on each city (8). Coupling SAVs with PT is known as SAV-PT systems, and they are favoured by many researchers due to their benefits to the passengers and PT operators, thereby improving the transport system performance (9). Additionally, SAV-PT systems lead to sustainable transport through cost-effective and reliable options for passengers alongside the reduction of traffic congestion (8, 10-12).
Autonomous Demand Responsive Transit (ADRT) is similar to a driverless on-demand service offering, where SAVs are used as the vehicle type (7, 13). ADRTs are a form of SAV-PT systems, where SAVs are operated within the branches of the PT trunk lines, through an on-demand service offering (12, 14-17). ADRTs have the potential to improve travel behaviour characteristics such as quality of service for passengers (18, 19), low demand-side costs (16, 20), low operational cost (21, 22), increased safety (23, 24) and a positive impact on the environment (25, 26). Moreover, ADRTs provide broader benefits, such as fostering multimodality for first and last mile trips as an alternative to solitary driving and enhancing the flexibility of access and egress for PT (12), providing cost-effective substitutes for feeder bus services and land-intensive parking infrastructure (1, 27), and reducing car ownership (28, 29).
Apart from these benefits, it is also noteworthy that the implementation of ADRTs may cause problems with the transport system if incorrect operational strategies are employed. Due to its complexity, identifying the optimum operational strategies has become increasingly difficult. Previous researchers have identified the challenges among different stakeholders (1). Duan, Si (30) highlighted the challenges of four stakeholders: legislators (government regulation, legal liabilities, automation standards, testing and certification), manufacturers (system fails, cyber security, and initial cost), operators (fleet management, dynamic service pricing, operating cost, road infrastructure requirements, cyber infrastructure requirements, and parking infrastructure and charging requirements), and users (penetration rate, public acceptance, travelling preference changing, and integration with transportation systems). Mo, Cao (10) evaluated four stakeholders: passengers (levels of service and mode choice), ADRT operators (financial viability and supply), PT operators (financial viability and supply), and transport authority (transport efficiency and vehicle kilometers travelled).
Previous literature has predominantly focused on either objective attributes or psychological factors (6). To name some, impacts of autonomous buses: technology deployment, user acceptance, safety, social and economic aspects, regulations, policies, and legal issues (31), benefits of AVs in the PT system: travel time, traffic congestion, cost, environmental factors along with barriers based on technology, regulatory, awareness and safety concerns (32), SAV service impacts: traffic & safety, travel behaviour, economy, transport supply, land-use, environment, and governance (8), service attributes and impacts of SAVs: urban mobility, infrastructure and land-use, travel behaviour, environment (33), and predictors of AV public acceptance and intention to use: demographic (gender, age, education, employment, household income and structure), psychological (perceived usefulness, ease of use, benefits, risks, awareness, personal innovativeness, environmental concerns), mobility behaviour characteristics (vehicle ownership, driving license, exposure to in-vehicle tech, in-vehicle time, commute mode choice, driving frequency, crash history, trip purpose, daily travel times, mobility impairment) (34).
It is evident that the range of attributes examined in studies on SAV-PT is extensive. Notably, the most investigated attributes include demographic factors, travel behaviour patterns, and psychological factors. Among these, psychological factors (age, gender, education, and household income) are particularly well-studied and validated (6, 35, 36). Literature indicates that younger individuals, men, and those with higher education and income levels are more inclined to prefer SAV-PT services (34, 37). Conversely, the older population tends to exhibit resistance to change. To overcome the challenges, literature also provides various recommendations, such as conducting pilot trials and awareness programs to enhance knowledge levels (36, 38).
Daily travel patterns are a significant indicator of acceptance of SAV-PT systems among users. It is evident that individuals who rely on PT and other multimodal services are more inclined to use SAV-PT services, whereas the preference among private car users for their daily commute is significantly lower (39, 40). This presents a challenge in attracting private car users to adopt SAV-PT services for their FMLM transport to trunk lines, as the ADRT services are more likely to be implemented in those branches of the networks (6). Various perceptions and attitudes of users towards SAV-PT systems have been modelled theoretically through theory of reasoned action, technology acceptance model, theory of planned behaviour, and the unified theory of acceptance and use of technology, which explains the determinants and predictors of AV adoption intention (34).
Socio-demographic analysis offers valuable insights into passenger preferences and behaviours through stated preference surveys in SAV-PT studies (41). Statistical methods, such as descriptive statistics and logistic regressions, facilitate visualisation and provide robust predictions. However, a critical consideration is the heterogeneity within the sample. The preferences of a subset of the sample do not necessarily represent those of the entire sample (6). Moreover, the geographical application of SAV-PT systems is critically important, as the majority of research in this field has concentrated on urban environments, with significantly less attention given to rural areas (41-43). It has also been found that residing in either urban or rural areas does not significantly influence the willingness to use SAVs (44). However, this is highly contingent upon the demographic composition of the population in these areas, as certain demographic cohorts exhibit a lower propensity towards the adoption of shared or novel mobility services (36, 45)
Drawing from the literature review, it is evident that greater emphasis is needed on ADRTs, as they complement the primary PT systems for FMLM connectivity. A significant portion of existing studies have focused on the acceptance of SAV-PT services, primarily due to their novelty and the users’ lack of familiarity (46-54). Additionally, numerous researchers have explored the impacts of these services through stated preference analysis, simulation and mathematical modelling (19, 23, 55-57). However, our literature review highlights the necessity of assessing public sentiment regarding various suitability and wider impact attributes of ADRTs in rural areas through a stated preference analysis, which have not been previously researched (6, 41).
The novelty of our research is twofold: (1) we develop and validate a preference sub-questionnaire to assess the socio-psychological suitability scenarios and the impact of ADRTs in rural areas and (2) we examine the heterogeneity among demographics and evaluate the influence of demographics and socio-psychological factors on ADRT implementation in rural settings. To the best of our knowledge, this is the first study that systematically identifies different suitability scenarios for ADRT systems. These scenarios encompass a range of vehicle types, service offerings, trip purposes, demographic groups, and land use patterns, specifically targeting demographics in rural settings. Our research emphasizes the broader impacts and externalities associated with ADRTs. We meticulously analyse the variations among demographic groups for each attribute, providing critical insights that inform both practical applications and policy frameworks for the implementation of ADRTs in low-demand transport networks.
2. Materials and Methods
2.1. Variable Selection
Variable selection for this study was conducted in two stages: (1) a comprehensive literature review, and (2) refinement through expert interviews. Given the research scope encompassing the suitability scenarios and impacts of ADRTs, relevant areas were assessed and listed. Attributes were then filtered and refined through expert interviews (Table 1).
To discuss the suitability scenarios of ADRTs, the research aimed to capture suitability from a demand-side perspective. Due to the limited literature, we examined similar public transport services, such as conventional demand-responsive transit and shared mobility services and further complemented our study with existing SAV-PT literature. Additionally, novel concepts for ADRT operations were incorporated based on expert interviews conducted with 18 transport experts (from academia, consulting, user peak bodies, and state transport authorities) in Australia to identify suitability attributes for this present study (58).
It is noteworthy that the impacts of ADRTs have been extensively studied by previous researchers (8). Most existing studies have assessed monetary impacts through simulation and mathematical modelling, while other stated preference studies have focused on socio-economic and environmental impacts. We considered impact attributes related to passenger performance, social, and environment. For passenger performance, the direct benefits identified in the literature were incorporated following confirmation in expert interviews. For social and environmental, expert interviews recommended evaluating broader social benefits and environmental externalities. It is also important to note that these attributes are specifically tailored for ADRT operations in low-demand areas, such as peri-urban or rural settings.

Table 1.
Study Attributes.
| Attributes | Source |
| Suitable vehicle types for ADRTs | (37, 52, 59, 60) |
| Suitable service offerings for ADRTs | (6, 8, 16, 30, 61) |
| Suitable trip purposes for ADRTs | (6, 37, 38, 62-64) |
| Suitable demographic groups for ADRTs | (3, 6, 65) |
| Suitable land use for ADRTs | (65-67) |
| Impacts on passenger performance from ADRTs | (6, 18, 37, 40, 68) |
| Social impacts from ADRTs | (3, 69, 70) |
| Environmental impacts from ADRTs | (29, 36, 71, 72) |
2.2. Survey Design
A questionnaire survey consists of four integrated layers: objectives, questions, words, and layout (73). All four of these layers should be considered in whole when formulating a questionnaire survey. Therefore, our survey instrument was designed with the primary objective of assessing the suitability and impacts of ADRTs from the perspective of rural residents. The questionnaire was structured into four distinct sections: Part A - Respondents and their households, Part B - Respondents’ current trip details, Part C - Suitability of ADRTs and Part D - Impacts of ADRTs. The comprehensive survey comprised 54 questions, using a combination of Likert scales, multiple-choice options, and open-ended inquiries. This analysis focuses on a subset of questions from Parts A and D. To evaluate the suitability and impacts of ADRTs, five multi-point Likert-scale questions were employed. These questions offered respondents a spectrum of response options: strongly disagree, somewhat disagree, neither agree nor disagree, somewhat agree, and strongly agree.
2.3. Study Setting
This study was conducted in various rural and peri-urban localities within the South-East Queensland (SEQ) region of Australia, as illustrated in Figure 1. These regions fall under the Lockyer Valley Regional Council, Moreton Bay Regional Council, Sunshine Coast Regional Council, Scenic Rim Regional Council, and Redland City Council. The selected cities in these regions for the present study had a population density of less than 200 persons per sqkm to represent the unquestionably rural and less-peri-urban areas (74). The PT system in these regional areas includes bus and rail services in some regions, connecting to Brisbane and other major cities. However, the service may be infrequent due to the lower transport demand associated with rural conditions (75, 76). The most common daily trip purposes among rural and peri-urban SEQ residents are personal purposes (50% daily) and work (25.3% daily), while they most frequently use a car (58% daily) or walk (45.3% daily) as their mode of transport. Other popular transit modes include taxi (57% fortnightly or less), train/tram (56.7% fortnightly or less), and bus (51.7% fortnightly or less) (3).
2.4. Participant Recruitment
Following the preparation of the questionnaire survey, ethics approval was secured from the Human Research Ethics Committee at the Queensland University of Technology (QUT). Subsequent to obtaining this approval, data collection was executed via Qualtrics in October 2024. The inclusion criteria required participants to be 18 years or older and to reside in a rural/regional area of SEQ. The survey was distributed to the sample population via a survey link. This link was disseminated by Qualtrics through their selected vendors in the study areas. The survey included a brief description of the project, participant requirements, and a consent form for participation. Participants were informed that their involvement was entirely voluntary and that they could withdraw at any time. Participants were also compensated for their time and participation in the study. A total of 357 responses were gathered through Qualtrics using random convenience sampling. Post data collection, the dataset underwent a cleaning process to rectify the following issues: unengaged respondents, outlier detection, missing data and multicollinearity (63, 77, 78), and the final sample consisted of 273 responses.
2.5. Analytical Approach
The five-point Likert scale questions in Parts C and D of the questionnaire were coded, with “strongly disagree” assigned a value of 1, and subsequent responses were coded incrementally up to “strongly agree,” which was assigned a value of 5 (79). The reliability of each response variable was assessed, with a threshold of 0.7 or higher required to justify the retention of the response variable (80). The data collected through the questionnaire (Parts C and D) were ordinal, representing the ranking of attributes. Although the differences between ranks do not convey quantitative measures, the median is an appropriate measure of central tendency for Likert scale ordinal data types. Parametric tests such as the t-test, F-test, and ANOVA are unsuitable for ordinal data due to their non-normal distribution. To assess the normality of the variables, Kolmogorov-Smirnov and Shapiro-Wilk tests were conducted with the null hypothesis H0: the data do not violate the assumption of normality. However, p-values were determined to be less than 0.01, resulting in the rejection of the null hypothesis and confirming the non-normal distribution of the data. This outcome thereby justifies the application of non-parametric tests (81).
According to Kothari (82), non-parametric tests are crucial for examining the heterogeneity in perceived variables across various socio-demographic variables. The selection of an appropriate non-parametric test depends primarily on the number of groups to be compared and the nature of the samples from the population. The Mann-Whitney U test and Wilcoxon W test are suitable for two independent and paired/dependent samples, respectively. For more than two independent samples on an ordinal scale, the Kruskal-Wallis H test is more appropriate (83-85). This test has been employed in AV perception studies to evaluate socio-demographic variables (41, 86). Consequently, the Kruskal-Wallis H test was deemed suitable for comparing the means of each demographic variable against the main variables. To further model the relationship between the main variables and demographic variables, ordinal logistic regression was conducted (36, 41)
3. Results and Discussion
3.1. Socio-Demographic Profile of Respondents
From the sample of 273 respondents, women constituted 65.5%, nearly twice the proportion of men (34.1%), with 0.5% identifying as non-binary. The age distribution was relatively uniform across all groups, with the 36-50 age group representing the highest proportion at 28.2%, followed by the 19-35 age group at 26.7%, the 51-65 age group at 25.3%, and those aged 66 or higher at 19.8%. Regarding education levels, most respondents (33%) had attained a trade apprenticeship or Technical and Further Education (TAFE) qualification, while 20.9% reported holding an undergraduate degree. Employment status varied, with 39.9% of respondents being fully employed and 24.5% employed on a part-time or casual basis. A smaller proportion of respondents were students (5.5%), while retired individuals and homemakers/unemployed accounted for 30%. In terms of household income, 37% of respondents reported an income of $104,000 or more, whereas the lowest income bracket, under $15,600, was reported by 2.6% of respondents. The demographics of the respondents are presented in Table 2.
3.2. Current Travel Patterns of Respondents
The distribution of the current travel patterns of the respondents (a) trip modes and frequencies, (b) trip purposes and frequencies, (c) valid driver’s license, (d) disabilities affecting mobility, (e) commuting hours and trip mode satisfaction are presented in Figure 2. Most frequent trip modes were identified as car and walk, while mobility scooter, school bus, motorcycle, truck and e-bicycle/e-scooter were identified as the least frequent. PT and rideshare options, including public buses, trains, and Uber/rideshare services, exhibited a similar frequency distribution. On the other hand, charter/ courtesy bus, light rail/ tram and ferry were similar. Most participants (95.2%) held valid driver’s licenses, while a minority (12.1%) reported disabilities that impacted their mobility. More than half of the respondents reported that their daily commuting hours was either less than 30 mins (27.8%) or between 30 mins and 1 hour (35.2%). A significant proportion (73.3%) of respondents expressed satisfaction with their current mode of transport.
3.3. General Perception of ADRTs
The questionnaire assessed respondents’ familiarity with ADRT concepts and previous experience of riding in an AV as presented in Figure 3a,b. However, only a small percentage (2.6%) reported high levels of familiarity, while 39.2% have a moderate or slight level of familiarity, and 87.2% indicated they had not ridden in an AV. Figure 3c illustrates the relationship between socio-demographic variables and familiarity with ADRTs. Findings reveal a positive correlation, showing that individuals with higher education levels and greater household incomes tend to have increased familiarity with ADRTs in rural areas. Men and younger individuals reported higher levels of familiarity. Additionally, those with an undergraduate degree or higher education level demonstrated greater familiarity. The results indicated that respondents’ familiarity with ADRTs was associated with a proportion who had previously ridden in an AV and had experience with AVs.
According to the chi-squared test results (Table 3), gender had a strong significance associated with both familiarity with ADRTs (P<0.001) and having ridden an AV (P<0.001). Additionally, education level showed a significant association with familiarity with ADRTs (P<0.05) while occupational status (P<0.05) and disability status (P<0.05) were significantly associated with having ridden an AV. However, age, household income and driver’s license status did not show any significant association between familiarity with ADRTs or experience with AVs.
Gender and education levels were significant with ADRT familiarity, showing that men and individuals with high education levels had better familiarity with ADRTs. Similarly, men and working professionals have reported previous experience with AVs.
3.4. Perceived Suitability of ADRTs
The perceived suitability of ADRTs was measured across five dimensions: vehicle type, service offerings, trip purpose, demographic groups, and land use (Table 4). Participants were presented with questions on a five-point Likert scale ranging from strongly disagree to strongly agree, to determine which options were deemed suitable for ADRTs. Cronbach’s alpha values show that each of the retained response variable showed a high internal consistency, and removing these variables would not significantly improve reliability (80).
3.4.1. Vehicle Type
The most relevant vehicle classification for ride-sharing was proposed by Greifenstein (37), encompassing four distinct categories: micro (1-2 passengers), small (3-6 passengers), mid-sized (7-20 passengers), and large (20+ passengers). Building upon this framework and considering PT perspectives, we have delineated three categories: small shuttles (accommodating up to 6 passengers), minibus shuttles (accommodating 6-20 passengers), and conventional-sized buses (accommodating up to 60 passengers). Findings indicated that small shuttles were deemed the most suitable, with a high mean score of 3.56, followed by minibus shuttles with a mean score of 3.45. The standard-sized conventional bus was the least preferred option, with a mean of 2.90. This underscores the pronounced preference among respondents for small vehicle operations, while larger vehicle sizes are comparatively less favoured. Smaller shuttle sizes are favoured due to their flexibility and reduced infrastructure adaptation requirements for charging and parking. It is also noteworthy that larger vehicle automation faces significant barriers, such as navigating tight spaces, increased energy demands, and high safety risks associated with higher momentum. Additionally, larger vehicles are less cost-effective and comparatively harder to integrate into dynamic routing systems than smaller vehicles (87).
3.4.2. Service Offerings
We evaluated various potential service styles for ADRT operations in a rural setting. Most respondents supported ADRTs operating 24/7 (M=3.62). Operating as a connector to existing fixed-route bus services and integrating with other transport offerings received similar support, with a mean of 3.51. Interestingly, using ADRTs as connectors to longer-distance services (M=3.40) was the next preferred option, followed by accommodating them as a multipurpose service (M=3.34). Operating ADRTs as a private taxi service had a very low preference, with a mean of 3.30, while completely replacing conventional buses was the least preferred option, with the lowest mean of 2.65. Our findings underscore the passengers’ strong preference for ADRT services with high availability. It is crucial to consider the key availability criteria for DRT services: response time, service span, and service coverage, and comfort & convenience criteria: reliability, travel time, and no-shows (88).
Our results indicate a preference for the integrated operation of ADRT systems within the existing PT framework, rather than their complete replacement or independent operation. This finding aligns with previous simulation and optimization research, which recommends moderate levels of AV penetrations to improve financial feasibility and reduce empty vehicle kilometers travelled, and waiting times of passengers (12, 42, 43, 89-93). The comparatively lower perceived suitability score for ADRTs as a multipurpose service is due to logistical complexities in prioritizing passengers versus goods. While existing research has investigated ADRTs with bus, train, and taxi operations, it is also imperative to assess the usability of multipurpose services. Due to the innovative nature of multipurpose services that combine passenger and goods transport for rural ADRT operations, rural residents have limited knowledge of the concept and necessitates further exploration to develop cost-effective services. Replacing conventional buses is least favoured due to challenges such as scalability, infrastructure adaptation, and low cost-effectiveness on high-capacity routes (94)
3.4.3. Trip Purpose
The results indicated a strong preference for special events or gatherings (M=3.45), university (M=3.41), alongside shopping and leisure trips with an average of 3.40. Interestingly, the least preferred trip purposes were school and emergency, with low mean scores of 2.87 and 2.50. Our findings suggest that rural residents prefer ADRTs for trips that are planned and enjoyable for which they perceive ADRT to be suitable. Especially for trips involving high-concentrated, short-term demand at specific locations and times, such as special events, gatherings, and university trips, ADRTs are suitable due to benefits such as reduced parking hassles, congestion, and availability for late-night trips with better affordability. Shopping and leisure trips are perceived as equally suitable, as ADRTs offer convenience and do not require personal vehicles, expensive taxis, or rigid public transport schedules. The low scores for school and emergency trips are attributed to the higher perceived risks and uncertainties associated in such critical contexts (95).
3.4.4. Demographic Groups
The most suitable demographic groups were working professionals (M = 3.56), leisure travellers (M = 3.50), tourists (M = 3.48), middle-income individuals (M = 3.47), and university students (M = 3.45). Both low-income and high-income individuals had a mean score of 3.39. The least suitable groups were senior citizens (M = 3.21), school children (M = 2.72) and individuals with cognitive (M = 2.77), physical (M = 2.91), and sensory disabilities (M = 2.92). The close scores of leisure travellers and tourists indicate ADRTs’ app-based and point-to-point service offering, providing greater convenience, yet may vary by trip length. The results for middle-income individuals and university students align well with past literature (96). Additionally, low-income individuals prefer ADRTs as an alternative to car ownership or traditional taxis yet could be limited by sensitivity to pricing (87). High-income individuals, on the other hand, might appreciate the service, yet prefer private vehicle usage.
Findings indicate a notably low preference among respondents for services targeting mobility-disadvantaged groups. This finding is particularly concerning, as extensive literature has consistently advocated for the utilization of services such as ADRT systems to support these groups (11, 38). However, rural residents have not perceived these services favourably. Senior citizens and school children are perceived lower due to safety and security concerns, absence of human intervention and supervision, issues of accountability, and parental trust in technology, fears about age related needs, uncertainty lack of trust (97-100). Regarding disabled individuals, cognitively disabled individuals are perceived as least suitable due to the lack of human intervention. Although physical and sensory disabilities are perceived as slightly more suitable than cognitive, there remains a need for universal design (101). Despite the documented advantages of ADRT systems, it remains crucial to enhance the awareness and understanding of rural residents. Our findings suggest that even though such services are deployed in low-demand areas to improve service quality, their success may be compromised due to the lack of acceptance among the target population.
3.4.5. Land Use
University precincts were perceived as the most suitable land use (M = 3.74), followed by tourist destinations and town centres (M = 3.52 each). Industrial/business parks and residential neighbourhoods had mean scores of 3.47 and 3.31, respectively. The least suitable were agricultural lands, with a mean score of 2.97. High preference has been accorded to land uses with contained settings. Universities, characterized by young, tech-savvy early adopters, potentially drive this preference. Moreover, the developed infrastructure facilitates the smooth operation of AVs, providing enhanced parking and charging facilities (102, 103). Conversely, high demand also serves as a driving factor, contributing to the elevated preference for tourist destinations and town centers, which feature concentrated activity nodes. Additionally, the off-season in universities is a critical factor to consider for effective fleet management. Among the least preferred land uses, common factors include low population density, infrequent travel demand, substantial distances between destinations, inadequate road infrastructure, car ownership predominating travel behaviours, and limited community acceptance.
3.5. Perceived Impacts of ADRTs
Perceived impacts of ADRTs were evaluated across three dimensions: passenger performance, social impacts, and environmental impacts (Table 5).
3.5.1. Passenger Performance
The highest impacting passenger performance factor was improved accessibility (M = 3.48), followed by improved quality of service (M = 3.22) and user experience (M = 3.21). However, safety (M = 2.77) and security (M = 2.70) were perceived as the least impactful factors. Our findings align well with previous research, as ADRTs are perceived to improve accessibility, user experience, and quality of service in rural areas. However, safety remains a concern, as respondents are skeptical about the ability of AVs to handle complex rural scenarios. Security is also perceived as less suitable, with unsupervised vehicle operations viewed as vulnerable, particularly for women and seniors. Our findings regarding the impacts of passenger performance in rural areas are consistent with previous literature (1).
3.5.2. Social Impacts
Highest mean score from the social impacts was observed for the influence on urban planning and development (M = 3.36) followed by benefits to local business and economic activity (M = 3.22). social inclusion for disadvantaged groups (M = 3.18) and promotion of social equity in transport access (M = 3.19) also scored relatively high. Community interaction and social cohesion (M = 3.06) and public health and well-being (M = 3.01) were moderately perceived by the respondents. Creation of new job opportunities (M = 2,70) and enhancement of personal safety and security in public spaces (M = 2.81) were least impactful. The influence on urban planning and development, alongside benefits to local business and economic activity, is significant, as it aligns with our findings for suitable land uses in universities, town centers, and tourist destinations. Social equity for various demographics, such as leisure travelers and tourists, is supported by our suitability results. However, social inclusion for disadvantaged groups remains debatable. Public health and well-being, on the other hand, were perceived as slightly less impactful. Although ADRTs help to enhance access to healthcare services, reduce emissions, and alleviate driving stress, skepticism remains regarding their scale to replace a sufficient number of private cars (93). Regarding employment, autonomy will generate tech-related jobs but eliminate driver roles, which is concerning.
3.5.3. Environmental Impacts
The highest perceived environmental impacts were reducing noise pollution (M = 3.53) and reducing air pollution (M = 3.51). Moderately perceived impacts included GHG reduction (M = 3.38) and heat reduction in built-up areas (M = 3.22). However, ADRTs were not expected to improve wildlife habitats in rural areas, as indicated by a low mean score of 2.86. Aligning with the past literature (71, 104), the reductions in noise pollution, air pollution, and GHG emissions are favoured by rural residents. Due to the smooth operations of electric engines, they help promote a quieter environment and reduced smog. However, it is important to consider fleet size, as GHG savings depend on the AV penetration rate. Heat reduction was perceived as impactful, where in concentrated nodes like town centers, universities, and tourist destinations, fewer personal vehicles leading to more greenery and reduced heat from engines. Improving wildlife habitats, on the other hand, was least favoured, as rural residents did not perceive ADRTs as beneficial for rural biodiversity. Overall, environmental impacts indicate that rural residents perceived urban-centric environmental benefits much higher than rural ecological gains.
3.6. Heterogenity in Perceptions of Suitability and Impacts of ADRTs
The significant influence of income suggests varying preferences for small shuttle and standard-sized shuttle buses among different income levels. Middle- and high-income groups exhibit a preference for small shuttles, whereas conventional-sized buses are perceived less favourably by both high-income and low-income groups. Other demographic groups do not show significant differences, indicating a broad acceptance of the three vehicle types across diverse groups. For suitable service offerings, completely replacing conventional buses is significantly influenced by gender, suggesting gender-specific preferences. While men support ADRT service offerings, women favour traditional buses due to their perceived safety and familiarity. The less familiarity among women with ADRT services will also have some impact towards this skepticism. However, all other service offerings did not show differences across demographic groups, highlighting their general applicability.
Leisure trips were significantly influenced by age, showing differences in perceptions, while all other trip purposes and demographics remained insignificant, indicating a wide range of applicability in rural areas. Younger groups support ADRTs for leisure trips, as they are likely leisure travellers or tourists who value flexibility in their journeys. However, the older population perceives less need for ADRTs in rural settings. The results suggest that there is a difference among gender groups regarding the suitability of people with sensory disabilities, as women are more concerned about accessibility challenges. It is the same among education levels for the suitability of university students, as higher-educated respondents perceived ADRTs to be more suited for university students. The difference in perceptions between people with disabilities and those without is significant, as university students, working professionals, and high-income individuals have varied perceptions within the disability status group. The disability status also shows different perceptions about the suitability of ADRTs within university precincts. This heterogeneity necessitates the inclusive design to bridge perceptual divides. However, other demographics remain the same for all land uses.
Gender has a significant difference in perception for passenger performance impacts, improved quality of service, user experience, safety, and security. Improved security is an impact that had different perceptions among gender, age, and occupation groups. Results showed that women and older population potentially valued human interventions in ADRT services. Safety concern is confirmed in the literature that marginal effects of safety concern are greater than those of green travel pattern and past experience with AV systems (105, 106). Safety concerns for women extend beyond the ride itself to include the booking process, the location, and the design of pickup and drop-off points (107). This requires careful consideration, and these security concerns should be addressed through effective policy implications.
The creation of new job opportunities was a social impact perceived differently by gender groups, while enhancing community interaction and social cohesion was perceived differently by different age groups. Influencing urban planning and development showed heterogeneity among people with different education levels and disability status. The two social impacts, improving public health and well-being and promoting social equity in transport access, had different perceptions among respondents from different age groups and education levels. Similarly, enhancing personal safety and security in public places had differences among gender, age, and education groups. The results suggest that men and the younger generation envision the social benefits in ADRT services, while older cohorts see less impact.
While GHG emission reductions had differences among the disability status group, improving wildlife habitats was perceived differently among gender and age groups. When considering environmental impacts, the differences among demographics are pronounced, as they perceive less relevance in rural areas, aligning with ADRTs’ urban bias. The Kruskal-Wallis H Test results for each main variable against the grouping variables are presented in Table 6.
3.7. Effect of Demographics on Perceptions
The ordinal logistic regression results for the suitability and impacts of ADRTs are presented in Table 7, highlighting significant response variables and their corresponding significant predictor variables. The regression analysis identified several significant predictors for the suitability of ADRTs among university students. Notably, younger and middle-aged individuals perceive ADRTs as more suitable for university settings. Interestingly, retirees and those with education levels up to Year 10 and TAFE also share this perception, suggesting optimism about accessibility in controlled campus settings. These demographic groups similarly believe that ADRTs will positively influence urban planning and development, as well as improve public health and well-being. Middle-aged respondents support the efficient land use planning, while less-educated and those with disabilities envision inclusive, transit-oriented development. Wide confidence intervals (0.373-1.865 for disability) suggest strong belief among ADRTs planning benefits. The potential of ADRTs to reduce car dependency, thereby lowering driving stress and environmental impacts, has demonstrated significant benefits among younger and middle-aged groups in terms of improved public health and well-being.
Rural residents with education levels up to trade apprentice/ TAFE believe that ADRTs will enhance personal safety and security in public spaces. Additionally, individuals with a Year 10 education level perceive ADRTs as promoting social equity in transport access. Women do not perceive ADRTs as enhancing personal safety and security in public places or improving wildlife habitats. On the other hand, men and individuals aged 19-65 believe that ADRTs will improve wildlife habitats. The results align with literature: age and education influence technology acceptance (98, 108, 109), gender shapes safety perceptions (110), and disability status underscores inclusion needs (101).
Table 7.
Significant Ordinal Logistic Regression Variables to Socio-Demographic Predictor Variables.
Table 7.
Significant Ordinal Logistic Regression Variables to Socio-Demographic Predictor Variables.
| Response Variable | Model Sig. | Predictor Variable | Std. Error | Wald | Wald Sig. | 95% CI | ||
| Lower bound | Upper bound | |||||||
| Suitability of ADRTs (University students) |
0.012 | Age (19-35) | 0.546 | 3.815 | 0.050 | -0.004 | 2.137 | |
| Age (36-50) | 0.547 | 7.204 | 0.007 | 0.396 | 2.538 | |||
| Age (51-65) | 0.475 | 5.444 | 0.020 | 0.1777 | 2.041 | |||
| Occupation (Retired) | 0.462 | 5.639 | 0.018 | 0.192 | 2.004 | |||
| Education level (Year 10) |
0.457 | 5.913 | 0.015 | -2.006 | -0.216 | |||
| Education level (Trade apprentice/ Tafe) |
0.387 | 10.014 | 0.002 | -1.981 | -0.466 | |||
| Disability (Yes) |
0.376 | 5.091 | 0.024 | 0.112 | 1.587 | |||
| Impacts of ADRTs (Positive influence on urban planning and development) |
0.017 | Age (36-50) | 0.545 | 4.663 | 0.031 | 0.109 | 2.243 | |
| Education level (Year 10) |
0.459 | 8.421 | 0.004 | -2.230 | -0.432 | |||
| Education level (Trade apprentice/ Tafe) |
0.384 | 5.468 | 0.019 | -1.653 | -0.145 | |||
| Disability (Yes) | 0.381 | 8.640 | 0.003 | 0.373 | 1.865 | |||
| Impacts of ADRTs (Improve public health and well-being) |
0.009 | Age (19-35) | 0.549 | 4.913 | 0.027 | 0.141 | 2.292 | |
| Age (36-50) | 0.548 | 7.253 | 0.007 | 0.402 | 2.548 | |||
| Education level (Year 10) |
0.456 | 5.520 | 0.019 | -1.964 | -0.178 | |||
| Education level (Trade apprentice/ Tafe) |
0.384 | 8.500 | 0.004 | -1.872 | -0.367 | |||
| Impacts of ADRTs (Enhance personal safety and security in public space) |
0.002 | Gender (Man) | 0.263 | 3686.049 | <0.001 | 15.433 | 16.642 | |
| Education level (Trade apprentice/ Tafe) |
0.374 | 4.166 | 0.041 | -1.497 | -0.030 | |||
| Impacts of ADRTs (Promote social equity in transport access) |
0.026 | Education level (Year 10) |
0.461 | 8.447 | 0.004 | -2.246 | -0.437 | |
| Impacts of ADRTs (Improve wildlife habitats) |
0.019 | Gender (Man) | 0.267 | 3613.159 | <0.001 | 15.526 | 16.572 | |
| Age (19-35) | 0.554 | 5.872 | 0.015 | 0.257 | 2.430 | |||
| Age (36-50) | 0.556 | 11.383 | <0.001 | 0.787 | 2.968 | |||
| Age (51-65) | 0.478 | 3.852 | 0.050 | 0.001 | 1.874 | |||
| Education level (Trade apprentice/ Tafe) |
0.386 | 6.634 | 0.010 | -1.750 | -0.238 | |||
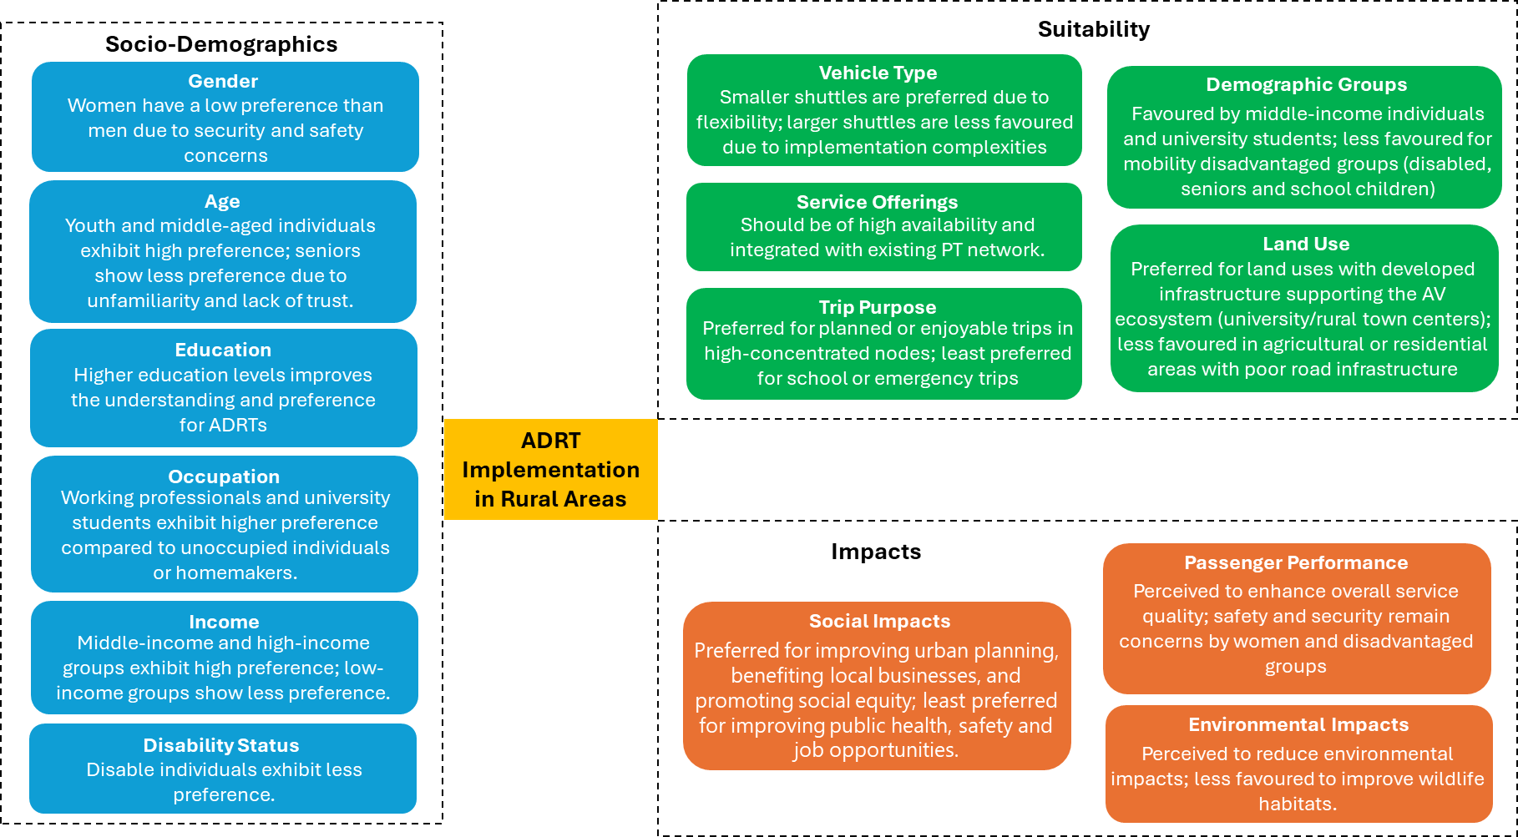
The key findings from the survey analysis regarding perceptions of ADRTs, categorized by socio-demographic factors, suitability, and impact criteria, are summarized in Figure 4.
Our findings suggest that subsidies should be provided to low-income users. Additionally, conducting awareness campaigns or forming partnerships with employers can help attract higher-income users, thereby addressing heterogeneity. Gender-sensitive integration is crucial, as rural females prioritize security in operations. Moreover, pilot studies should be conducted to assess the gender-specific uptake of these services in rural settings. Prioritizing women’s safety through cameras and emergency features is essential in these services, and corresponding safety regulations should be developed (111). Pilot trials should also be conducted in areas such as retirement villages to familiarize the service with the seniors. Regulators should mandate interoperability standards for ADRT integration and avoid complete automation of existing buses.
Given the high acceptance among younger populations, it is important to incentivize ADRTs in university precincts and tourist destinations while preserving conventional options for critical trips. This approach should also target professionals and students with app-driven ADRTs. Policymakers should mandate universal design standards and subsidize fares for mobility-disadvantaged groups to bridge equity gaps. Enhancing the knowledge of these groups through awareness programs is also crucial. When deploying the services, the main factor of success will be to operate them in concentrated nodes and avoid rural overextension. Therefore, it is vital to prioritize ADRT operations in high-scoring lands such as rural town centers, university precincts and tourist destinations. If ADRT services are deployed in low-demand areas, it is essential to link these services to urban climate goals with renewable energy incentives. Policy developments should consider the heterogeneity among demographics when implementing ADRT services.
5. Conclusions and Future Research Directions
We aimed to evaluate the suitability and impacts of ADRT systems within a rural transport network. To this end, we developed a questionnaire to identify suitability criteria across five aspects: vehicle type, service offering, trip purpose, demographic group, and land use. The questionnaire also encompassed broader impact criteria for ADRTs, including passenger performance, social impacts, and environmental impacts. These criteria, primarily identified through a literature review, were refined via expert interviews The questionnaire was distributed among a sample population of rural residents in SEQ, yielding 273 responses. These responses were analysed using descriptive statistics, the Kruskal-Wallis H test, and ordinal logistic regression to elucidate perceptions across suitability and impact variables against demographic groups. The results highlighted the heterogeneity among different groups, suggesting a user-centric implementation. The findings indicated that income drives vehicle preference, gender influences safety perceptions and service replacements, age affects leisure trip suitability, and disability status highlights accessibility gaps in rural settings. This heterogeneity affirms that the success of ADRTs hinges on tailoring deployment to diverse needs rather than adopting a uniform approach.
The primary limitation of this research study is the smaller sample size. Due to complexities in data collection, the inclusion criteria were restricted to a few selected regional councils in the SEQ region, serving as the study population. Consequently, the final sample size was limited to 273 responses, encompassing only rural residents with internet access who subscribed to the Qualtrics data collection vendors. However, there are other populations outside this sample who may hold different views. To reduce a systematic error from selection bias, the collected data sample was compared with the median population statistics of the selected study areas. It is also important to note that to reduce the error from a measurement bias, variable selection was conducted through a two-step process involving a comprehensive literature review followed by expert interviews. Nonetheless, there may be other variables that are more pertinent to low-demand areas than those selected in our study.
While this research lays a robust foundation, several avenues warrant further exploration to refine ADRT suitability and impacts. Longitudinal studies are needed to track how perceptions evolve as ADRT scales up. Real world pilots in different low-demand land uses should collect disaggregated data by gender, age, education, income, and disability status to validate statistical predictors and assess behavioural shifts, addressing the static nature of this cross-sectional analysis. Intersectional analysis examining interactions between demographic groups could uncover compounded effects missed by current models. In conclusion, this study affirms ADRT’s role as a transformative yet context-dependent transit solution. Future research should build on these insights with dynamic, interdisciplinary approaches, ensuring ADRT evolves into an equitable, sustainable cornerstone of modern mobility systems.
Author Contributions
Conceptualization, S.J., A.B. and J.B.; Methodology, S.J., A.B. and J.B.; Software, S.J.; Validation, S.J. and J.B.; Formal Analysis, S.J.; Investigation, S.J.; Resources, J.B.; Data Curation, S.J.; Writing—Original Draft Preparation, S.J.; Writing—Review & Editing, S.J., A.B. and J.B.; Visualization, S.J.; Supervision, A.B. and J.B.; Project Administration, J.B.
Funding
This research received no external funding.
Data Availability Statement
De-identified data is available upon request.
Acknowledgments
The first author gratefully acknowledges the scholarship support provided by the QUT to carry out this PhD research. The authors extend their heartfelt gratitude to the survey participants for their invaluable contributions and for sharing their insights and experiences.
Conflicts of Interest
The authors declare no conflict of interest.
Abbreviations
The following abbreviations are used in this manuscript:
| ADRT | Autonomous Demand Responsive Transit |
| AV | Autonomous Vehicle |
| DRT | Demand Responsive Transit |
| FMLM | First-Mile/Last-Mile |
| GHG | Greenhouse Gas |
| PT | Public Transport |
| SAV | Shared Autonomous Vehicle |
| SEQ | South-East Queensland |
| TAFE | Technical and Further Education |
References
- Lau ST, Susilawati S. Shared autonomous vehicles implementation for the first and last-mile services. Transportation Research Interdisciplinary Perspectives. 2021;11. [CrossRef]
- Zuo T, Wei H, Chen N. Promote transit via hardening first-and-last-mile accessibility: Learned from modeling commuters’ transit use. Transportation Research Part D: Transport and Environment. 2020;86:102446. [CrossRef]
- Golbabaei F. Challenges and opportunities in the adoption of autonomous demand responsive transit (ADRT) by adult residents of South East Queensland: Queensland University of Technology; 2023.
- Stocker A, Shaheen S. Shared Automated Vehicles: Review of Business Models. Transportation Sustainability Research Center, University of California, Berkeley: Cooperative Mobility Systems and Automated Driving; 2017. Contract No.: 2017-09.
- Shaheen S, Chan N. Mobility and the sharing economy: Potential to facilitate the first-and last-mile public transit connections. Built Environment. 2016;42(4):573-88. [CrossRef]
- Dong Z, Chen C, Ouyang J, Yan X, Liao C, Chen X, et al. Understanding commuter preferences for shared autonomous electric vehicles in first-mile-last-mile scenario. Transportation Research Part D: Transport and Environment. 2025;140. [CrossRef]
- Jayatilleke S, Bhaskar A, Bunker J. Autonomous bus adoption in public transport networks: A systematic literature review on potential and prospects. Australasian Transport Research Forum Perth, Australia2023.
- Narayanan S, Chaniotakis E, Antoniou C. Shared autonomous vehicle services: A comprehensive review. Transportation Research Part C: Emerging Technologies. 2020;111:255-93. [CrossRef]
- Ohnemus M, Perl A. Shared autonomous vehicles: Catalyst of new mobility for the last mile? Built Environment. 2016;42(4):589-602.
- Mo B, Cao Z, Zhang H, Shen Y, Zhao J. Competition between shared autonomous vehicles and public transit: A case study in Singapore. Transportation Research Part C: Emerging Technologies. 2021;127. [CrossRef]
- Krueger R, Rashidi TH, Rose JM. Preferences for shared autonomous vehicles. Transportation Research Part C: Emerging Technologies. 2016;69:343-55.
- Shen Y, Zhang H, Zhao J. Integrating shared autonomous vehicle in public transportation system: A supply-side simulation of the first-mile service in Singapore. Transportation Research Part A: Policy and Practice. 2018;113:125-36. [CrossRef]
- Basu R, Araldo A, Akkinepally AP, Nahmias Biran BH, Basak K, Seshadri R, et al. Automated Mobility-on-Demand vs. Mass Transit: A Multi-Modal Activity-Driven Agent-Based Simulation Approach. Transportation Research Record: Journal of the Transportation Research Board. 2018;2672(8):608-18.
- Militão AM, Tirachini A. Optimal fleet size for a shared demand-responsive transport system with human-driven vs automated vehicles: A total cost minimization approach. Transportation Research Part A: Policy and Practice. 2021;151:52-80. [CrossRef]
- Cyganski R, Heinrichs M, von Schmidt A, Krajzewicz D. Simulation of automated transport offers for the city of Brunswick. Procedia computer science. 2018;130:872-9. [CrossRef]
- Leich G, Bischoff J. Should autonomous shared taxis replace buses? A simulation study. Transportation Research Procedia 2019;41:450–60. [CrossRef]
- Peer S, Müller J, Naqvi A, Straub M. Introducing shared, electric, autonomous vehicles (SAEVs) in sub-urban zones: Simulating the case of Vienna. Transport Policy. 2024;147:232-43. [CrossRef]
- Zhang W, Jenelius E, Badia H. Efficiency of Connected Semi-Autonomous Platooning Bus Services in High-Demand Transit Corridors. IEEE Open Journal of Intelligent Transportation Systems. 2022;3:435-48. [CrossRef]
- Hatzenbühler J, Cats O, Jenelius E. Transitioning towards the deployment of line-based autonomous buses: Consequences for service frequency and vehicle capacity. Transportation Research Part A: Policy and Practice. 2020;138:491-507. [CrossRef]
- Ongel A, Loewer E, Roemer F, Sethuraman G, Chang F, Lienkamp M. Economic Assessment of Autonomous Electric Microtransit Vehicles. Sustainability. 2019;11(3). [CrossRef]
- Hatzenbühler J, Cats O, Jenelius E. Network design for line-based autonomous bus services. Transportation. 2021;49(2):467-502. [CrossRef]
- Liu X, Qu X, Ma X. Improving flex-route transit services with modular autonomous vehicles. Transportation Research Part E: Logistics and Transportation Review. 2021;149. [CrossRef]
- Oikonomou MG, Orfanou FP, Vlahogianni EI, Yannis G, editors. Impacts of Autonomous Shuttle Services on Traffic, Safety and Environment for Future Mobility Scenarios, 2020 IEEE 23rd International Conference on Intelligent Transportation Systems (ITSC); 2020; Rhodes, Greece: IEEE.
- Rosell J, Allen J. Test-riding the driverless bus: Determinants of satisfaction and reuse intention in eight test-track locations. Transportation Research Part A: Policy and Practice. 2020;140:166-89. [CrossRef]
- Hasan U, Whyte A, AlJassmi H. A Microsimulation Modelling Approach to Quantify Environmental Footprint of Autonomous Buses. Sustainability. 2022;14(23). [CrossRef]
- Moorthy A, De Kleine R, Keoleian G, Good J, Lewis G. Shared Autonomous Vehicles as a Sustainable Solution to the Last Mile Problem: A Case Study of Ann Arbor-Detroit Area. SAE International Journal of Passenger Cars - Electronic and Electrical Systems. 2017;10(2):328-36. [CrossRef]
- Zhang W, Guhathakurta S. Parking spaces in the age of shared autonomous vehicles: How much parking will we need and where? Transportation Research Record. 2017;2651(1):80-91.
- Fagnant DJ, Kockelman KM, Bansal P. Operations of Shared Autonomous Vehicle Fleet for Austin, Texas, Market. Transportation Research Record: Journal of the Transportation Research Board. 2019;2563(1):98-106.
- Fagnant DJ, Kockelman KM. The travel and environmental implications of shared autonomous vehicles, using agent-based model scenarios. Transportation Research Part C: Emerging Technologies. 2014;40:1-13. [CrossRef]
- Duan X, Si H, Xiang P. Technology into reality: Disentangling the challenges of shared autonomous electric vehicles implementation from stakeholder perspectives. Energy. 2025;316. [CrossRef]
- Azad M, Hoseinzadeh N, Brakewood C, Cherry CR, Han LD. Fully Autonomous Buses: A Literature Review and Future Research Directions. Journal of Advanced Transportation. 2019;2019:1-16. [CrossRef]
- Hasan U, Whyte A, Al Jassmi H. A Review of the Transformation of Road Transport Systems: Are We Ready for the Next Step in Artificially Intelligent Sustainable Transport? Applied System Innovation. 2019;3(1). [CrossRef]
- Golbabaei F, Yigitcanlar T, Bunker J. The role of shared autonomous vehicle systems in delivering smart urban mobility: A systematic review of the literature. International Journal of Sustainable Transportation. 2020;15(10):731-48. [CrossRef]
- Golbabaei; Golbabaei;, Yigitcanlar T, Paz A, Bunker J. Individual Predictors of Autonomous Vehicle Public Acceptance and Intention to Use: A Systematic Review of the Literature. Journal of Open Innovation: Technology, Market, and Complexity. 2020;6(4).
- Bala H, Anowar S, Chng S, Cheah L. Review of studies on public acceptability and acceptance of shared autonomous mobility services: past, present and future. Transport Reviews. 2023;43(5):970-96. [CrossRef]
- Golbabaei F, Yigitcanlar T, Paz A, Bunker J. Perceived Opportunities and Challenges of Autonomous Demand-Responsive Transit Use: What Are the Socio-Demographic Predictors? Sustainability. 2023;15(15). [CrossRef]
- Greifenstein M. Factors influencing the user behaviour of shared autonomous vehicles (SAVs): A systematic literature review. Transportation Research Part F: Traffic Psychology and Behaviour. 2024;100:323-45. [CrossRef]
- Golbabaei F, Paz A, Yigitcanlar T, Bunker J. Navigating autonomous demand responsive transport: stakeholder perspectives on deployment and adoption challenges. International Journal of Digital Earth. 2023;17(1). [CrossRef]
- Rahimi A, Azimi G, Jin X. Examining human attitudes toward shared mobility options and autonomous vehicles. Transportation Research Part F: Traffic Psychology and Behaviour. 2020;72:133-54. [CrossRef]
- Nordhoff S, de Winter J, Payre W, van Arem B, Happee R. What impressions do users have after a ride in an automated shuttle? An interview study. Transportation Research Part F: Traffic Psychology and Behaviour. 2019;63:252-69. [CrossRef]
- Usman M, Li W, Bian J, Chen A, Ye X, Li X, et al. Small and rural towns’ perception of autonomous vehicles: insights from a survey in Texas. Transportation Planning and Technology. 2023;47(2):200-25. [CrossRef]
- Imhof S, Frölicher J, von Arx W. Shared Autonomous Vehicles in rural public transportation systems. Research in Transportation Economics. 2020;83. [CrossRef]
- Sieber L, Ruch C, Hörl S, Axhausen KW, Frazzoli E. Improved public transportation in rural areas with self-driving cars: A study on the operation of Swiss train lines. Transportation Research Part A: Policy and Practice. 2020;134:35-51. [CrossRef]
- Wang S, Jiang Z, Noland RB, Mondschein AS. Attitudes towards privately-owned and shared autonomous vehicles. Transportation Research Part F: Traffic Psychology and Behaviour. 2020;72:297-306. [CrossRef]
- Wang N, Tang H, Wang Y-J, Huang GQ. Antecedents in rural residents’ acceptance of autonomous vehicles. Transportation Research Part D: Transport and Environment. 2024;132:104244. [CrossRef]
- Cao W, Chen Y, Wang K. Revolutionizing commutes: Unraveling the factors shaping Chinese consumers’ acceptance of shared autonomous vehicles (SAVs) with an integrated UTAUT2 model. Research in Transportation Business & Management. 2024;57. [CrossRef]
- Golbabaei F, Yigitcanlar T, Paz A, Bunker J. Understanding Autonomous Shuttle Adoption Intention: Predictive Power of Pre-Trial Perceptions and Attitudes. Sensors (Basel). 2022;22(23). [CrossRef]
- Debbaghi F-Z, Rombaut E, Vanhaverbeke L. Exploring the influence of a virtual reality experience on user acceptance of shared autonomous vehicles: A quasi-experimental study in Brussels. Transportation Research Part F: Traffic Psychology and Behaviour. 2024;107:674-94. [CrossRef]
- Cheng Y-H, Lai Y-C. Exploring autonomous bus users’ intention: Evidence from positive and negative effects. Transport Policy. 2024;146:91-101. [CrossRef]
- Mason J, Classen S. Develop and Validate a Survey to Assess Adult’s Perspectives on Autonomous Ridesharing and Ridehailing Services. Future Transportation. 2023;3(2):726-38. [CrossRef]
- Dolins S, Karlsson M, Strömberg H, editors. AVs Have a Sharing Problem: Examining User Acceptance of Shared, Autonomous Public Transport in Sweden. 2023 IEEE 26th International Conference on Intelligent Transportation Systems (ITSC); 2023 24-28 Sept. 2023.
- Chng S, Anowar S, Cheah L. Understanding Shared Autonomous Vehicle Preferences: A Comparison between Shuttles, Buses, Ridesharing and Taxis. Sustainability. 2022;14(20). [CrossRef]
- Liu M, Wu J, Zhu C, Hu K, Du Y. Factors Influencing the Acceptance of Robo-Taxi Services in China: An Extended Technology Acceptance Model Analysis. Journal of Advanced Transportation. 2022;2022:1-11. [CrossRef]
- Classen S, Mason JR, Hwangbo SW, Sisiopiku V. Predicting Autonomous Shuttle Acceptance in Older Drivers Based on Technology Readiness/Use/Barriers, Life Space, Driving Habits, and Cognition. Front Neurol. 2021;12:798762.
- Gurumurthy KM, Kockelman KM. Analyzing the dynamic ride-sharing potential for shared autonomous vehicle fleets using cellphone data from Orlando, Florida. Computers, Environment and Urban Systems. 2018;71:177-85. [CrossRef]
- Vicente AL. Traffic microsimulation of Autonomous Vehicles Flow in Ronda de Dalt of Barcelona: Universitat Politècnica de Catalunya; 2022.
- Tian Q, Wang DZW, Lin YH. Optimal deployment of autonomous buses into a transit service network. Transportation Research Part E: Logistics and Transportation Review. 2022;165. [CrossRef]
- Jayatilleke S, Bhaskar A, Bunker J. Unveiling the Challenges and Opportunities of Autonomous Bus Integration in Rural and Suburban Areas: An Expert Interview Study. [Manuscript submitted for publication]. 2025.
- Wang Z, Safdar M, Zhong S, Liu J, Xiao F. Public Preferences of Shared Autonomous Vehicles in Developing Countries: A Cross-National Study of Pakistan and China. Journal of Advanced Transportation. 2021;2021(1):5141798. [CrossRef]
- Földes D, Csiszár C, editors. Framework for planning the mobility service based on autonomous vehicles. 2018 Smart City Symposium Prague (SCSP); 2018 24-25 May 2018.
- Földes D, Csiszar C, editors. Framework for planning the mobility service based on autonomous vehicles. 2018 Smart City Symposium Prague (SCSP); 2018.
- Faroqi H, Mesbah M. Inferring trip purpose by clustering sequences of smart card records. Transportation Research Part C: Emerging Technologies. 2021;127:103131. [CrossRef]
- Kwak SK, Kim JH. Statistical data preparation: management of missing values and outliers. Korean J Anesthesiol. 2017;70(4):407-11. [CrossRef]
- Sari Aslam N, Ibrahim MR, Cheng T, Chen H, Zhang Y. ActivityNET: Neural networks to predict public transport trip purposes from individual smart card data and POIs. Geo-spatial Information Science. 2021;24(4):711-21. [CrossRef]
- Kim SW, Gwon GP, Hur WS, Hyeon D, Kim DY, Kim SH, et al. Autonomous Campus Mobility Services Using Driverless Taxi. IEEE Transactions on Intelligent Transportation Systems. 2017;18(12):3513-26. [CrossRef]
- Westerman H, Black J. Preparing for Fully Autonomous Vehicles in Australian Cities: Land-Use Planning—Adapting, Transforming, and Innovating. Sustainability. 2024;16(13).
- Miller J, How JP, editors. Demand estimation and chance-constrained fleet management for ride hailing. 2017 IEEE/RSJ International Conference on Intelligent Robots and Systems (IROS); 2017 24-28 Sept. 2017.
- Lai W-T, Chen C-F. Behavioral intentions of public transit passengers—The roles of service quality, perceived value, satisfaction and involvement. Transport policy. 2011;18(2):318-25.
- Transport and Infrastructure Council. T2 Cost Benefit Analysis. Canberra: Commonwealth Department of Infrastructure and Regional Development; 2018.
- Whitmore A, Samaras C, Hendrickson CT, Scott Matthews H, Wong-Parodi G. Integrating public transportation and shared autonomous mobility for equitable transit coverage: A cost-efficiency analysis. Transportation Research Interdisciplinary Perspectives. 2022;14. [CrossRef]
- Silva Ó, Cordera R, González-González E, Nogués S. Environmental impacts of autonomous vehicles: A review of the scientific literature. Science of The Total Environment. 2022;830:154615. [CrossRef]
- Silva I, Calabrese JM. Emerging opportunities for wildlife conservation with sustainable autonomous transportation. Frontiers in Ecology and the Environment. 2024;22(2). [CrossRef]
- Labaw PJ. Advanced questionnaire design. Cambridge, Mass.: Abt Books; 1980.
- Mortoja MG, Yigitcanlar T. Why is determining peri-urban area boundaries critical for sustainable urban development? Journal of Environmental Planning and Management. 2021;66(1):67-96.
- Sunshine Coast Council. Public transport 2024 [Available from: https://www.sunshinecoast.qld.gov.au/living-and-community/roads-and-transport/transport-options/public-transport.
- Lockyer Valley Regional Council. Getting Around 2024 [Available from: https://www.lockyervalley.qld.gov.au/our-region/about-the-lockyer-valley/getting-around.
- Kline R. Principles and Practice of Structural Equation Modeling2016.
- Hair JF, Risher JJ, Sarstedt M, Ringle CM. When to use and how to report the results of PLS-SEM. European Business Review. 2019;31(1):2-24. [CrossRef]
- Likert R. A technique for the measurement of attitudes. Archives of Psychology. 1932.
- Collins LM. Research Design and Methods. In: Birren JE, editor. Encyclopedia of Gerontology (Second Edition). New York: Elsevier; 2007. p. 433-42.
- McCrum-Gardner E. Which is the correct statistical test to use? British Journal of Oral and Maxillofacial Surgery. 2008;46(1):38-41. [CrossRef]
- Kothari C. Research methodology: Methods and techniques. New Age International. 2004.
- Gupta A, Gupta N. Research methodology: SBPD publications; 2022.
- Pandey P, Pandey MM. Research methodology: Tools and techniques2015.
- Kadkhodaei M, Shad R, Ziaee SA. Affecting factors of double parking violations on urban trips. Transport Policy. 2022;120:80-8. [CrossRef]
- Khan SK, Shiwakoti N, Stasinopoulos P, Chen Y, Warren M. The impact of perceived cyber-risks on automated vehicle acceptance: Insights from a survey of participants from the United States, the United Kingdom, New Zealand, and Australia. Transport Policy. 2024;152:87-101. [CrossRef]
- Wu X, Cao J, Douma F. The impacts of vehicle automation on transport-disadvantaged people. Transportation Research Interdisciplinary Perspectives. 2021;11. [CrossRef]
- Kittelson & Associates B, P., Group, K., Institute, T. A. M. T., & Arup. Transit Capacity and Quality of Service Manual. Washington D.C.; 2013. Report No.: 978-0-309-28344-1.
- Gurumurthy KM, Kockelman KM, Zuniga-Garcia N. First-Mile-Last-Mile Collector-Distributor System using Shared Autonomous Mobility. Transportation Research Record: Journal of the Transportation Research Board. 2020;2674(10):638-47. [CrossRef]
- Wen J, Chen YX, Nassir N, Zhao J. Transit-oriented autonomous vehicle operation with integrated demand-supply interaction. Transportation Research Part C: Emerging Technologies. 2018;97:216-34. [CrossRef]
- Scheltes A, de Almeida Correia GH. Exploring the use of automated vehicles as last mile connection of train trips through an agent-based simulation model: An application to Delft, Netherlands. International Journal of Transportation Science and Technology. 2017;6(1):28-41. [CrossRef]
- Salazar M, Lanzetti N, Rossi F, Schiffer M, Pavone M. Intermodal Autonomous Mobility-on-Demand. IEEE Transactions on Intelligent Transportation Systems. 2020;21(9):3946-60.
- Fielbaum A, Pudāne B. Are shared automated vehicles good for public- or private-transport-oriented cities (or neither)? Transportation Research Part D: Transport and Environment. 2024;136:104373. [CrossRef]
- Milford M, Anthony S, Scheirer W. Self-Driving Vehicles: Key Technical Challenges and Progress Off the Road. IEEE Potentials. 2020;39(1):37-45. [CrossRef]
- Lazányi K. Perceived Risks of Autonomous Vehicles. Risks. 2023;11(2):26. [CrossRef]
- Islam MR, Abdel-Aty M, Lee J, Wu Y, Yue L, Cai Q. Perception of people from educational institution regarding autonomous vehicles. Transportation Research Interdisciplinary Perspectives. 2022;14:100620. [CrossRef]
- Günthner T, Proff H. On the way to autonomous driving: How age influences the acceptance of driver assistance systems. Transportation research part F: traffic psychology and behaviour. 2021;81:586-607. [CrossRef]
- Thomas E, McCrudden C, Wharton Z, Behera A. Perception of autonomous vehicles by the modern society: A survey. IET Intelligent Transport Systems. 2020;14(10):1228-39. [CrossRef]
- Srour Zreik R, Harvey M, Brewster SA, editors. Age Matters: Investigating Older Drivers’ Perception of Level 3 Autonomous Cars as a Heterogeneous Age Group. Adjunct Proceedings of the 15th International Conference on Automotive User Interfaces and Interactive Vehicular Applications; 2023.
- Hassan HM, Ferguson MR, Vrkljan B, Newbold B, Razavi S. Older adults and their willingness to use semi and fully autonomous vehicles: A structural equation analysis. Journal of transport geography. 2021;95:103133. [CrossRef]
- Golbabaei F, Dwyer J, Gomez R, Peterson A, Cocks K, Bubke A, et al. Enabling mobility and inclusion: Designing accessible autonomous vehicles for people with disabilities. Cities. 2024;154:105333. [CrossRef]
- Nourinejad M, Bahrami S, Roorda MJ. Designing parking facilities for autonomous vehicles. Transportation Research Part B: Methodological. 2018;109:110-27. [CrossRef]
- Kumakoshi Y, Hanabusa H, Oguchi T. Impacts of shared autonomous vehicles: Tradeoff between parking demand reduction and congestion increase. Transportation Research Interdisciplinary Perspectives. 2021;12:100482. [CrossRef]
- Patel RK, Etminani-Ghasrodashti R, Kermanshachi S, Rosenberger JM, Pamidimukkala A, Foss A. Identifying individuals’ perceptions, attitudes, preferences, and concerns of shared autonomous vehicles: During- and post-implementation evidence. Transportation Research Interdisciplinary Perspectives. 2023;18:100785. [CrossRef]
- Lavieri PS, Garikapati VM, Bhat CR, Pendyala RM, Astroza S, Dias FF. Modeling individual preferences for ownership and sharing of autonomous vehicle technologies. Transportation research record. 2017;2665(1):1-10. [CrossRef]
- Nazari F, Noruzoliaee M, Mohammadian AK. Shared versus private mobility: Modeling public interest in autonomous vehicles accounting for latent attitudes. Transportation Research Part C: Emerging Technologies. 2018;97:456-77. [CrossRef]
- Schuß M, Wintersberger P, Riener A. Security Issues in Shared Automated Mobility Systems: A Feminist HCI Perspective. Multimodal Technologies and Interaction. 2021;5(8):43. [CrossRef]
- Eby DW, Molnar LJ, Zakrajsek JS, Ryan LH, Zanier N, Louis RMS, et al. Prevalence, attitudes, and knowledge of in-vehicle technologies and vehicle adaptations among older drivers. Accident Analysis & Prevention. 2018;113:54-62. [CrossRef]
- Lee C, Seppelt B, Reimer B, Mehler B, Coughlin JF, editors. Acceptance of vehicle automation: Effects of demographic traits, technology experience and media exposure. Proceedings of the Human Factors and Ergonomics Society Annual Meeting; 2019: SAGE Publications Sage CA: Los Angeles, CA.
- Greenwood PM, Lenneman JK, Baldwin CL. Advanced driver assistance systems (ADAS): Demographics, preferred sources of information, and accuracy of ADAS knowledge. Transportation research part F: traffic psychology and behaviour. 2022;86:131-50.
- Kim S, Anjani S, van Lierop D. How will women use automated vehicles? Exploring the role of automated vehicles from women’s perspective. Transportation Research Interdisciplinary Perspectives. 2024;27:101228. [CrossRef]
Figure 1.
Study Area within SEQ, Australia.
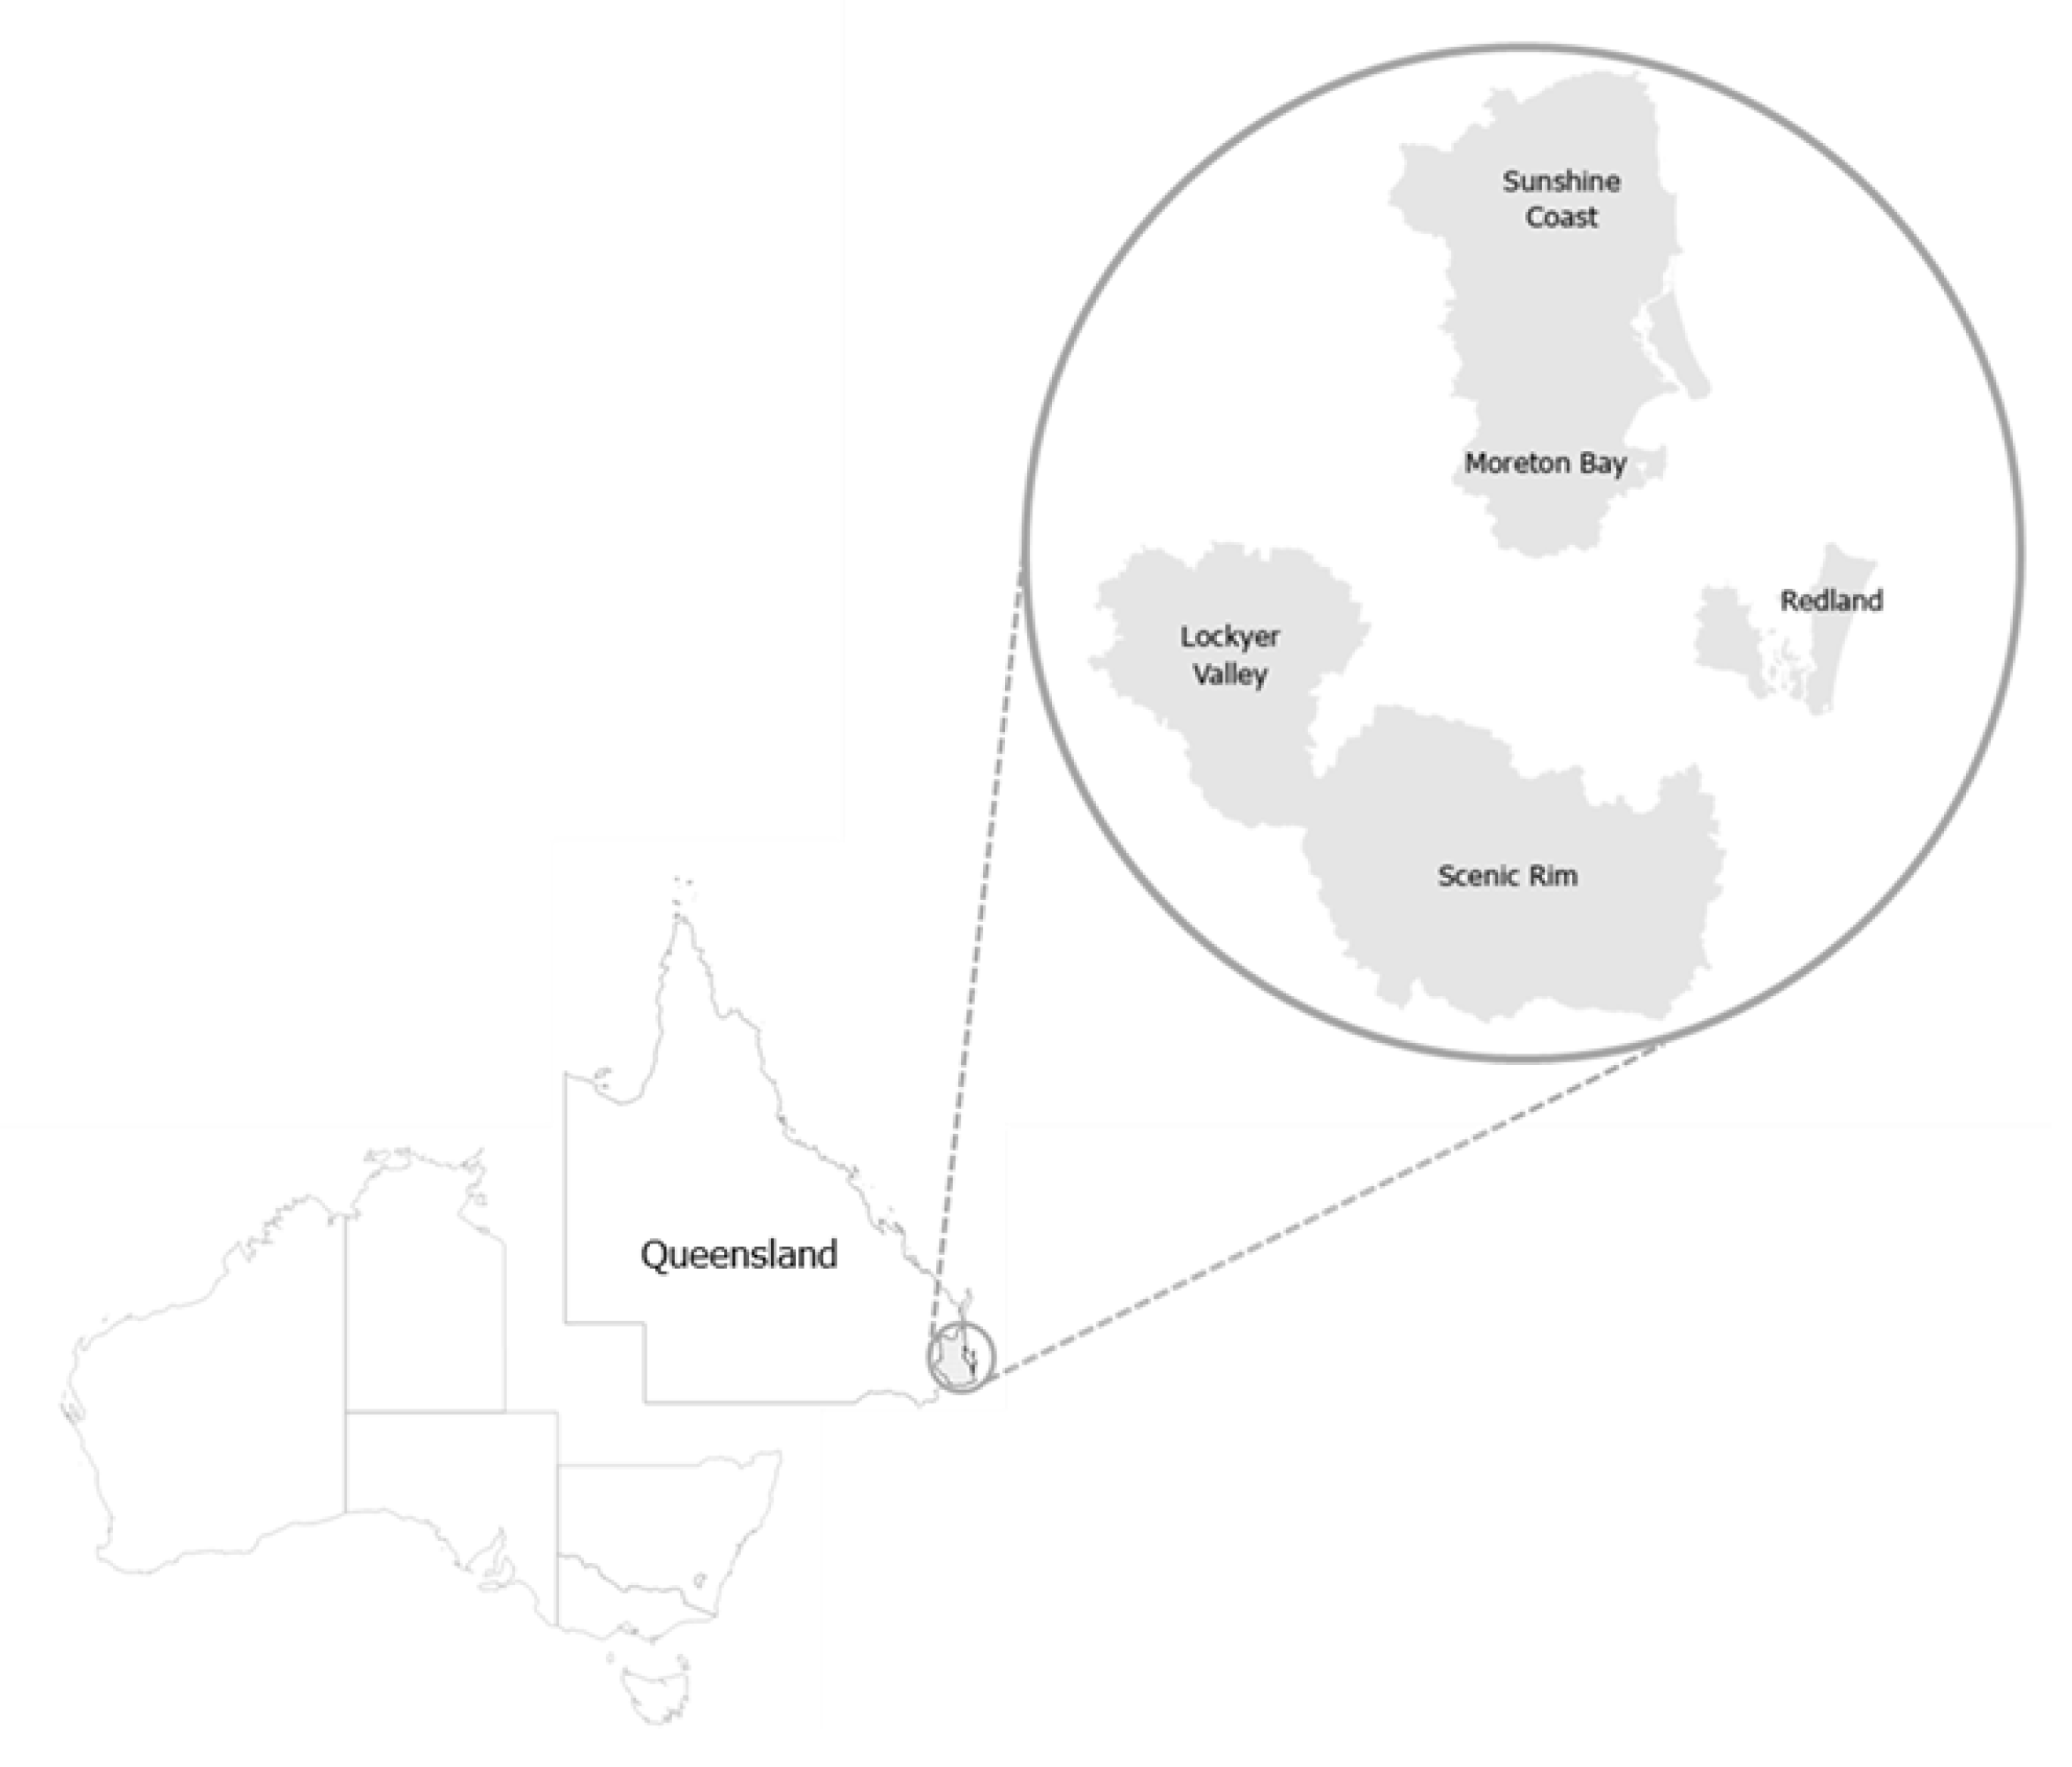
Figure 2.
Current Travel Patterns of Respondents.
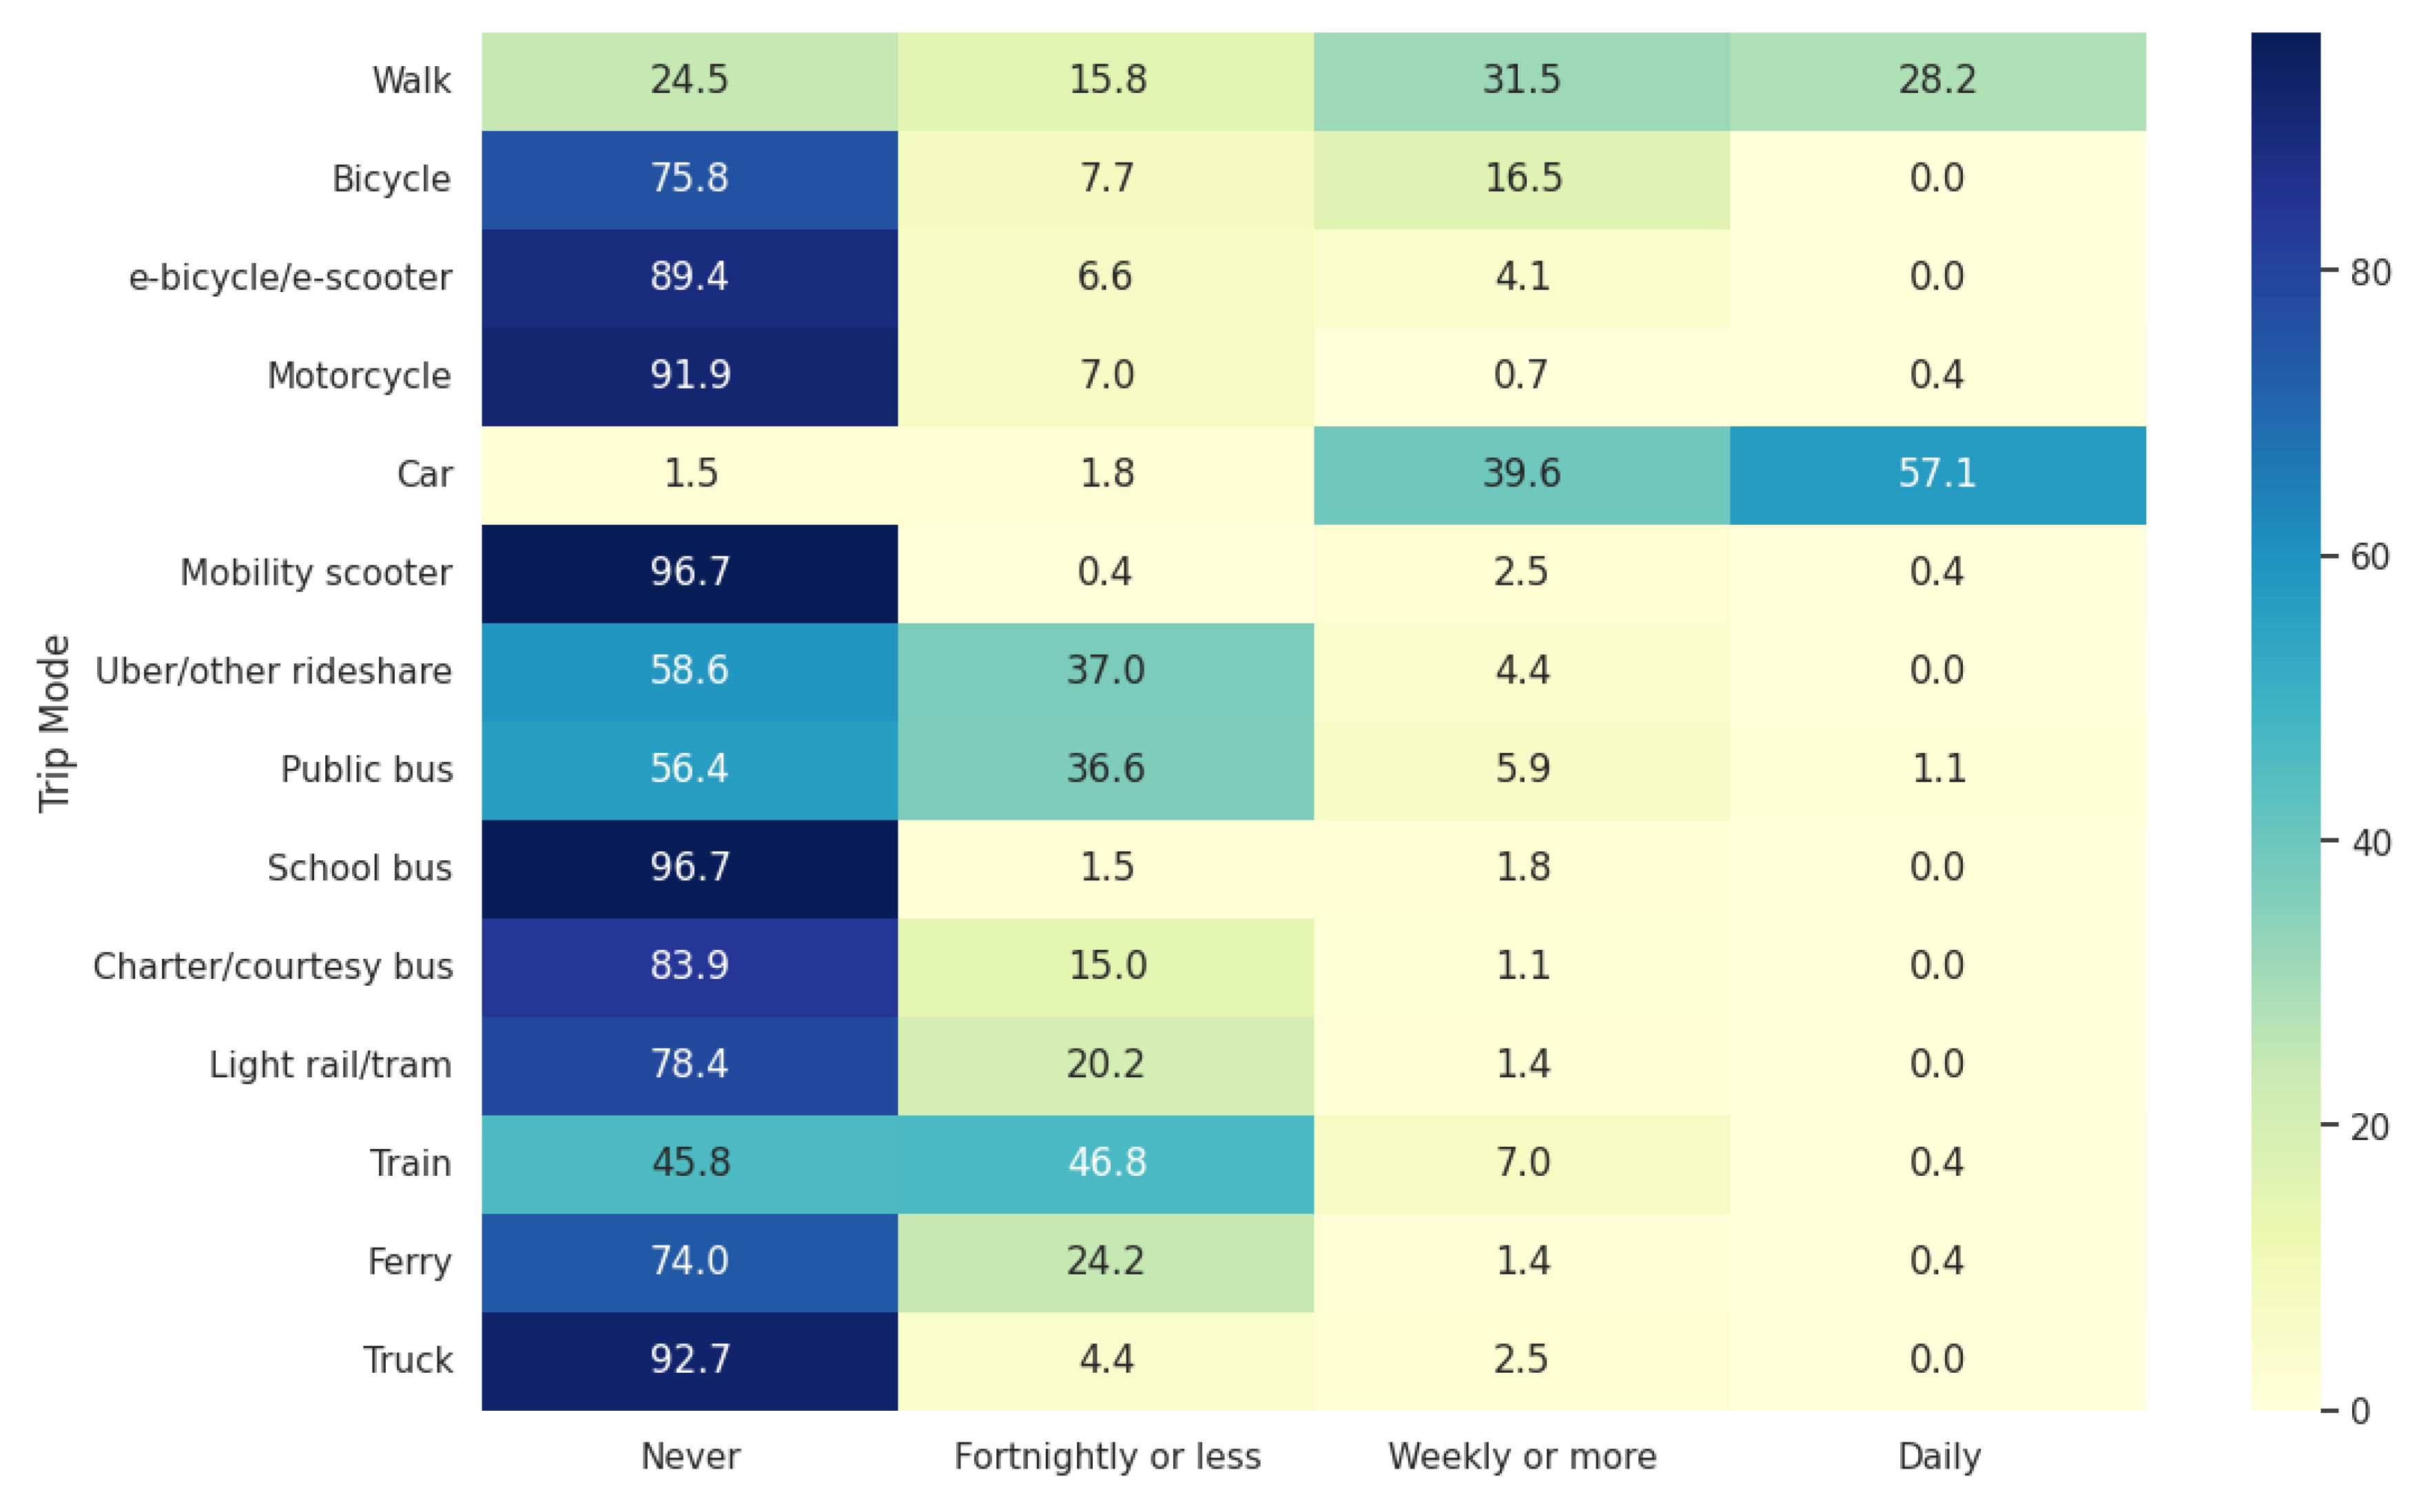
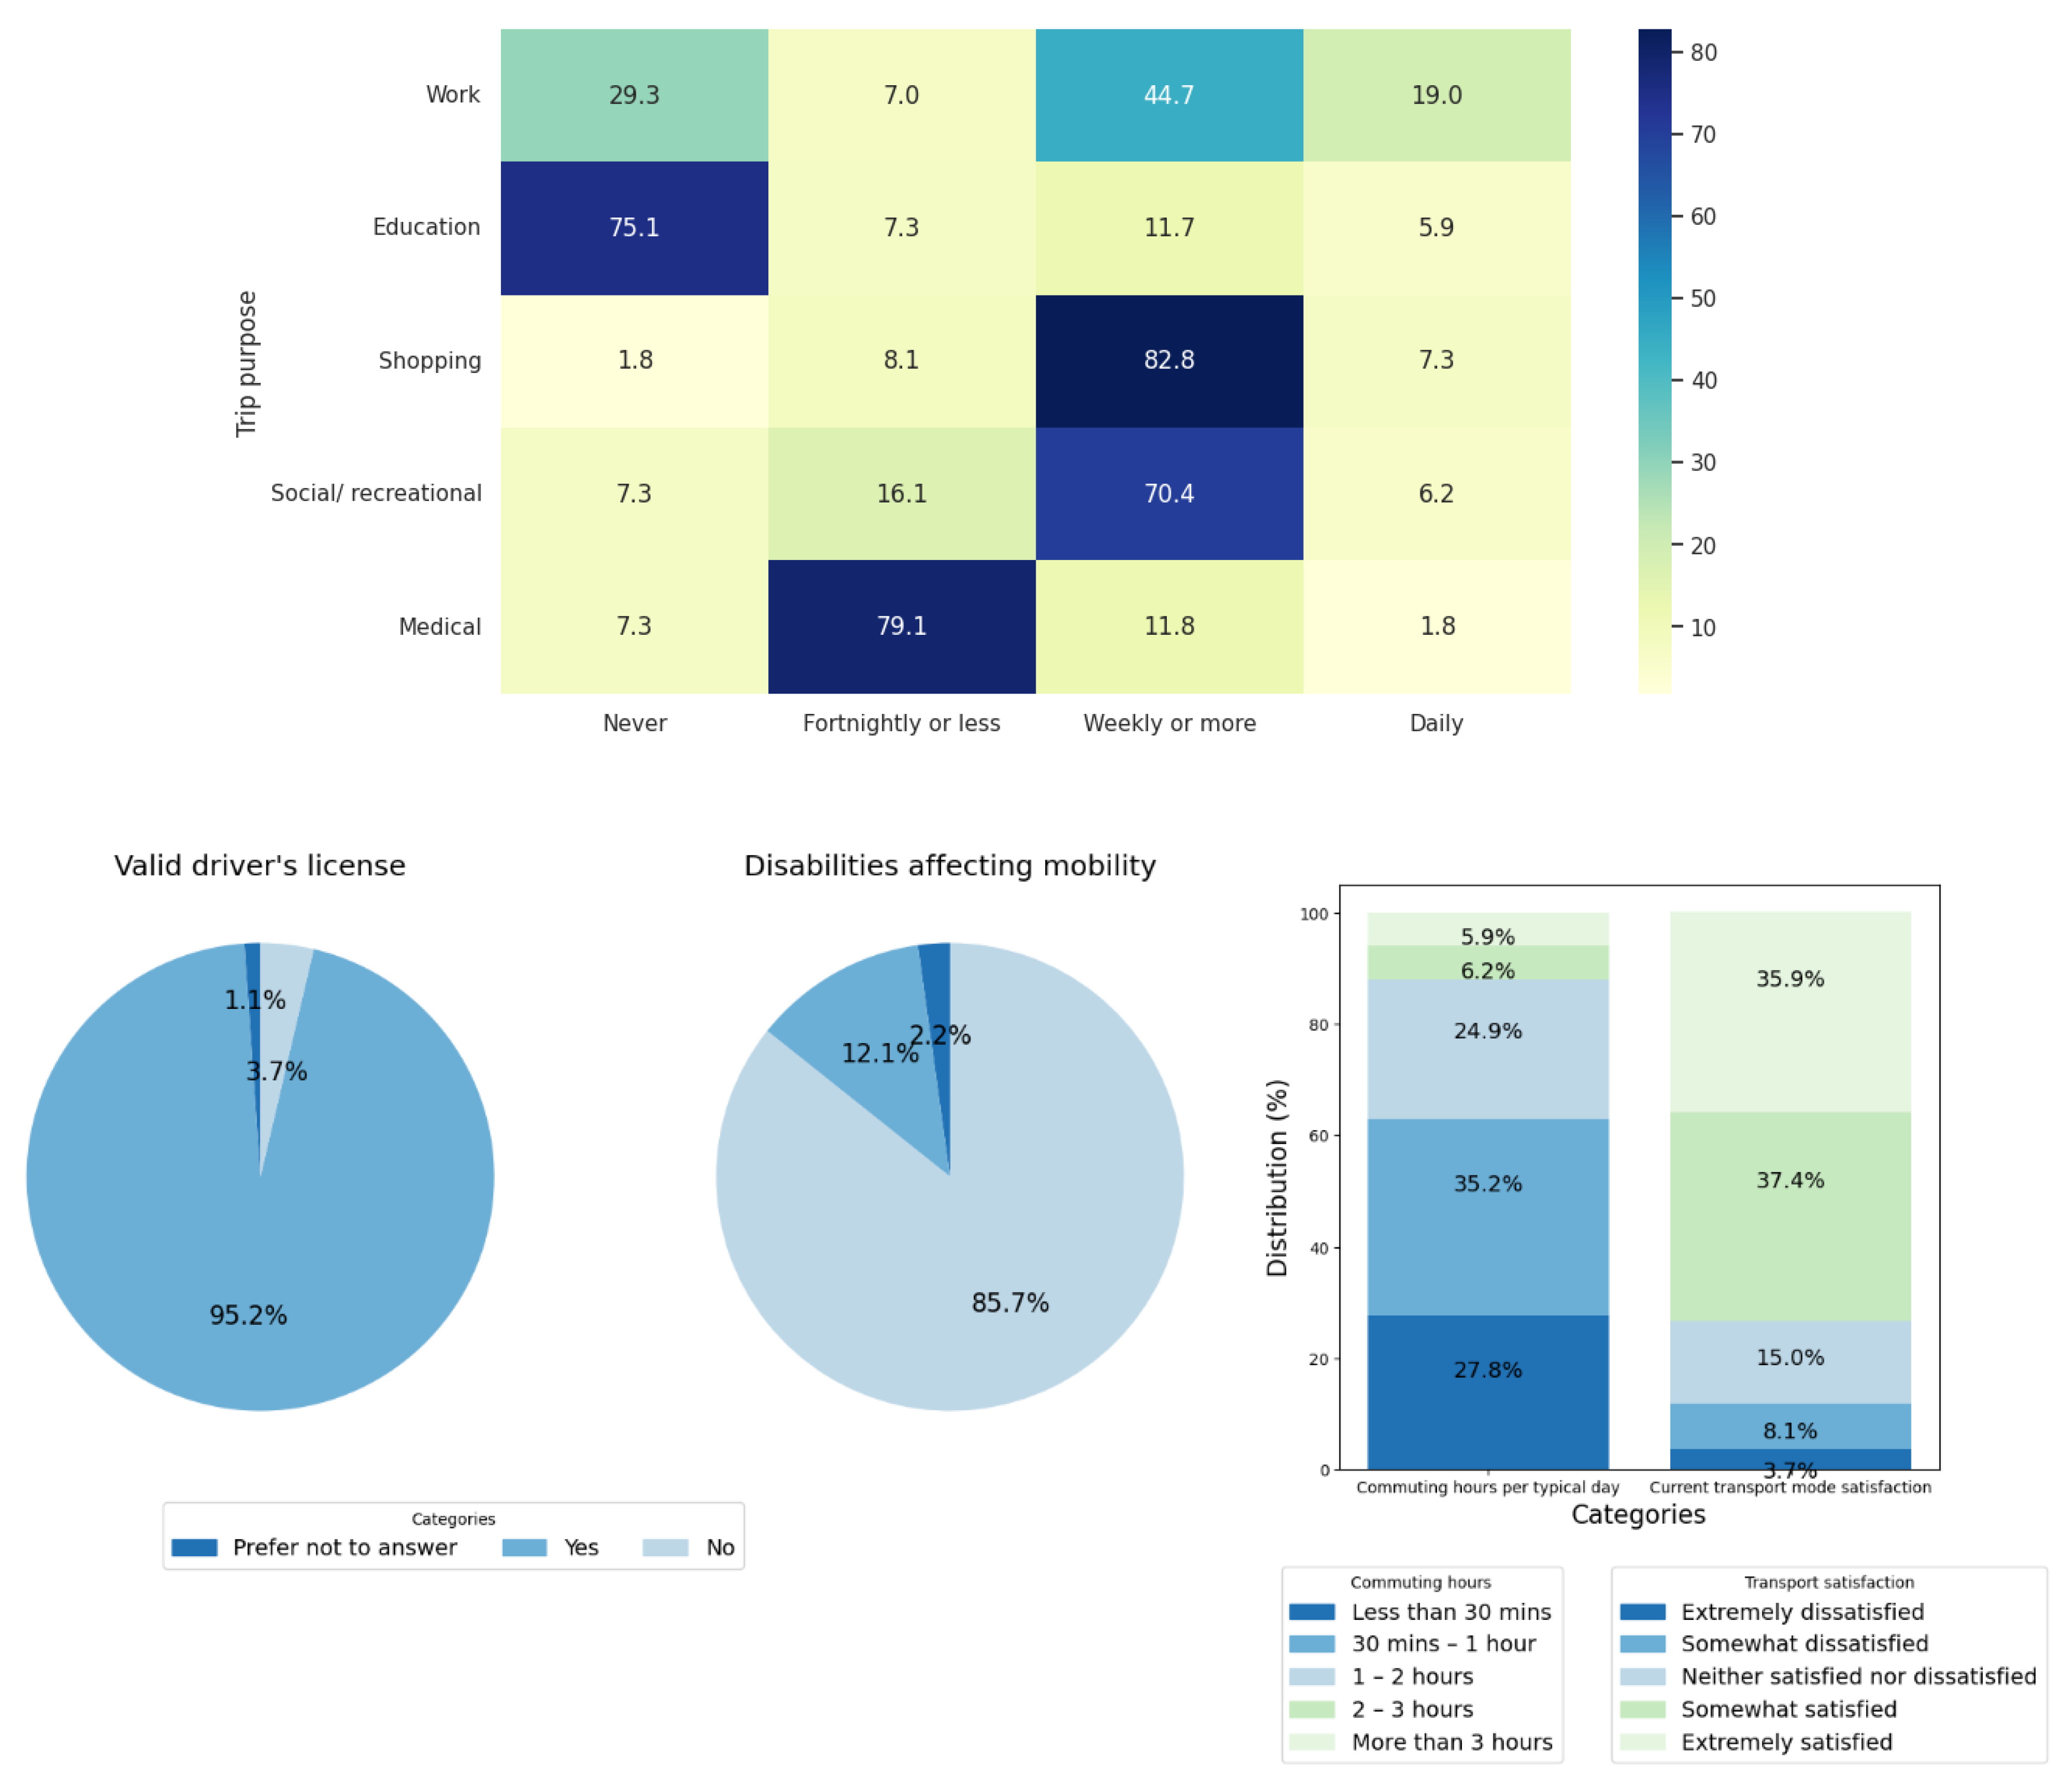
Figure 3.
Knowledge and Experience of Respondents on ADRT Systems.
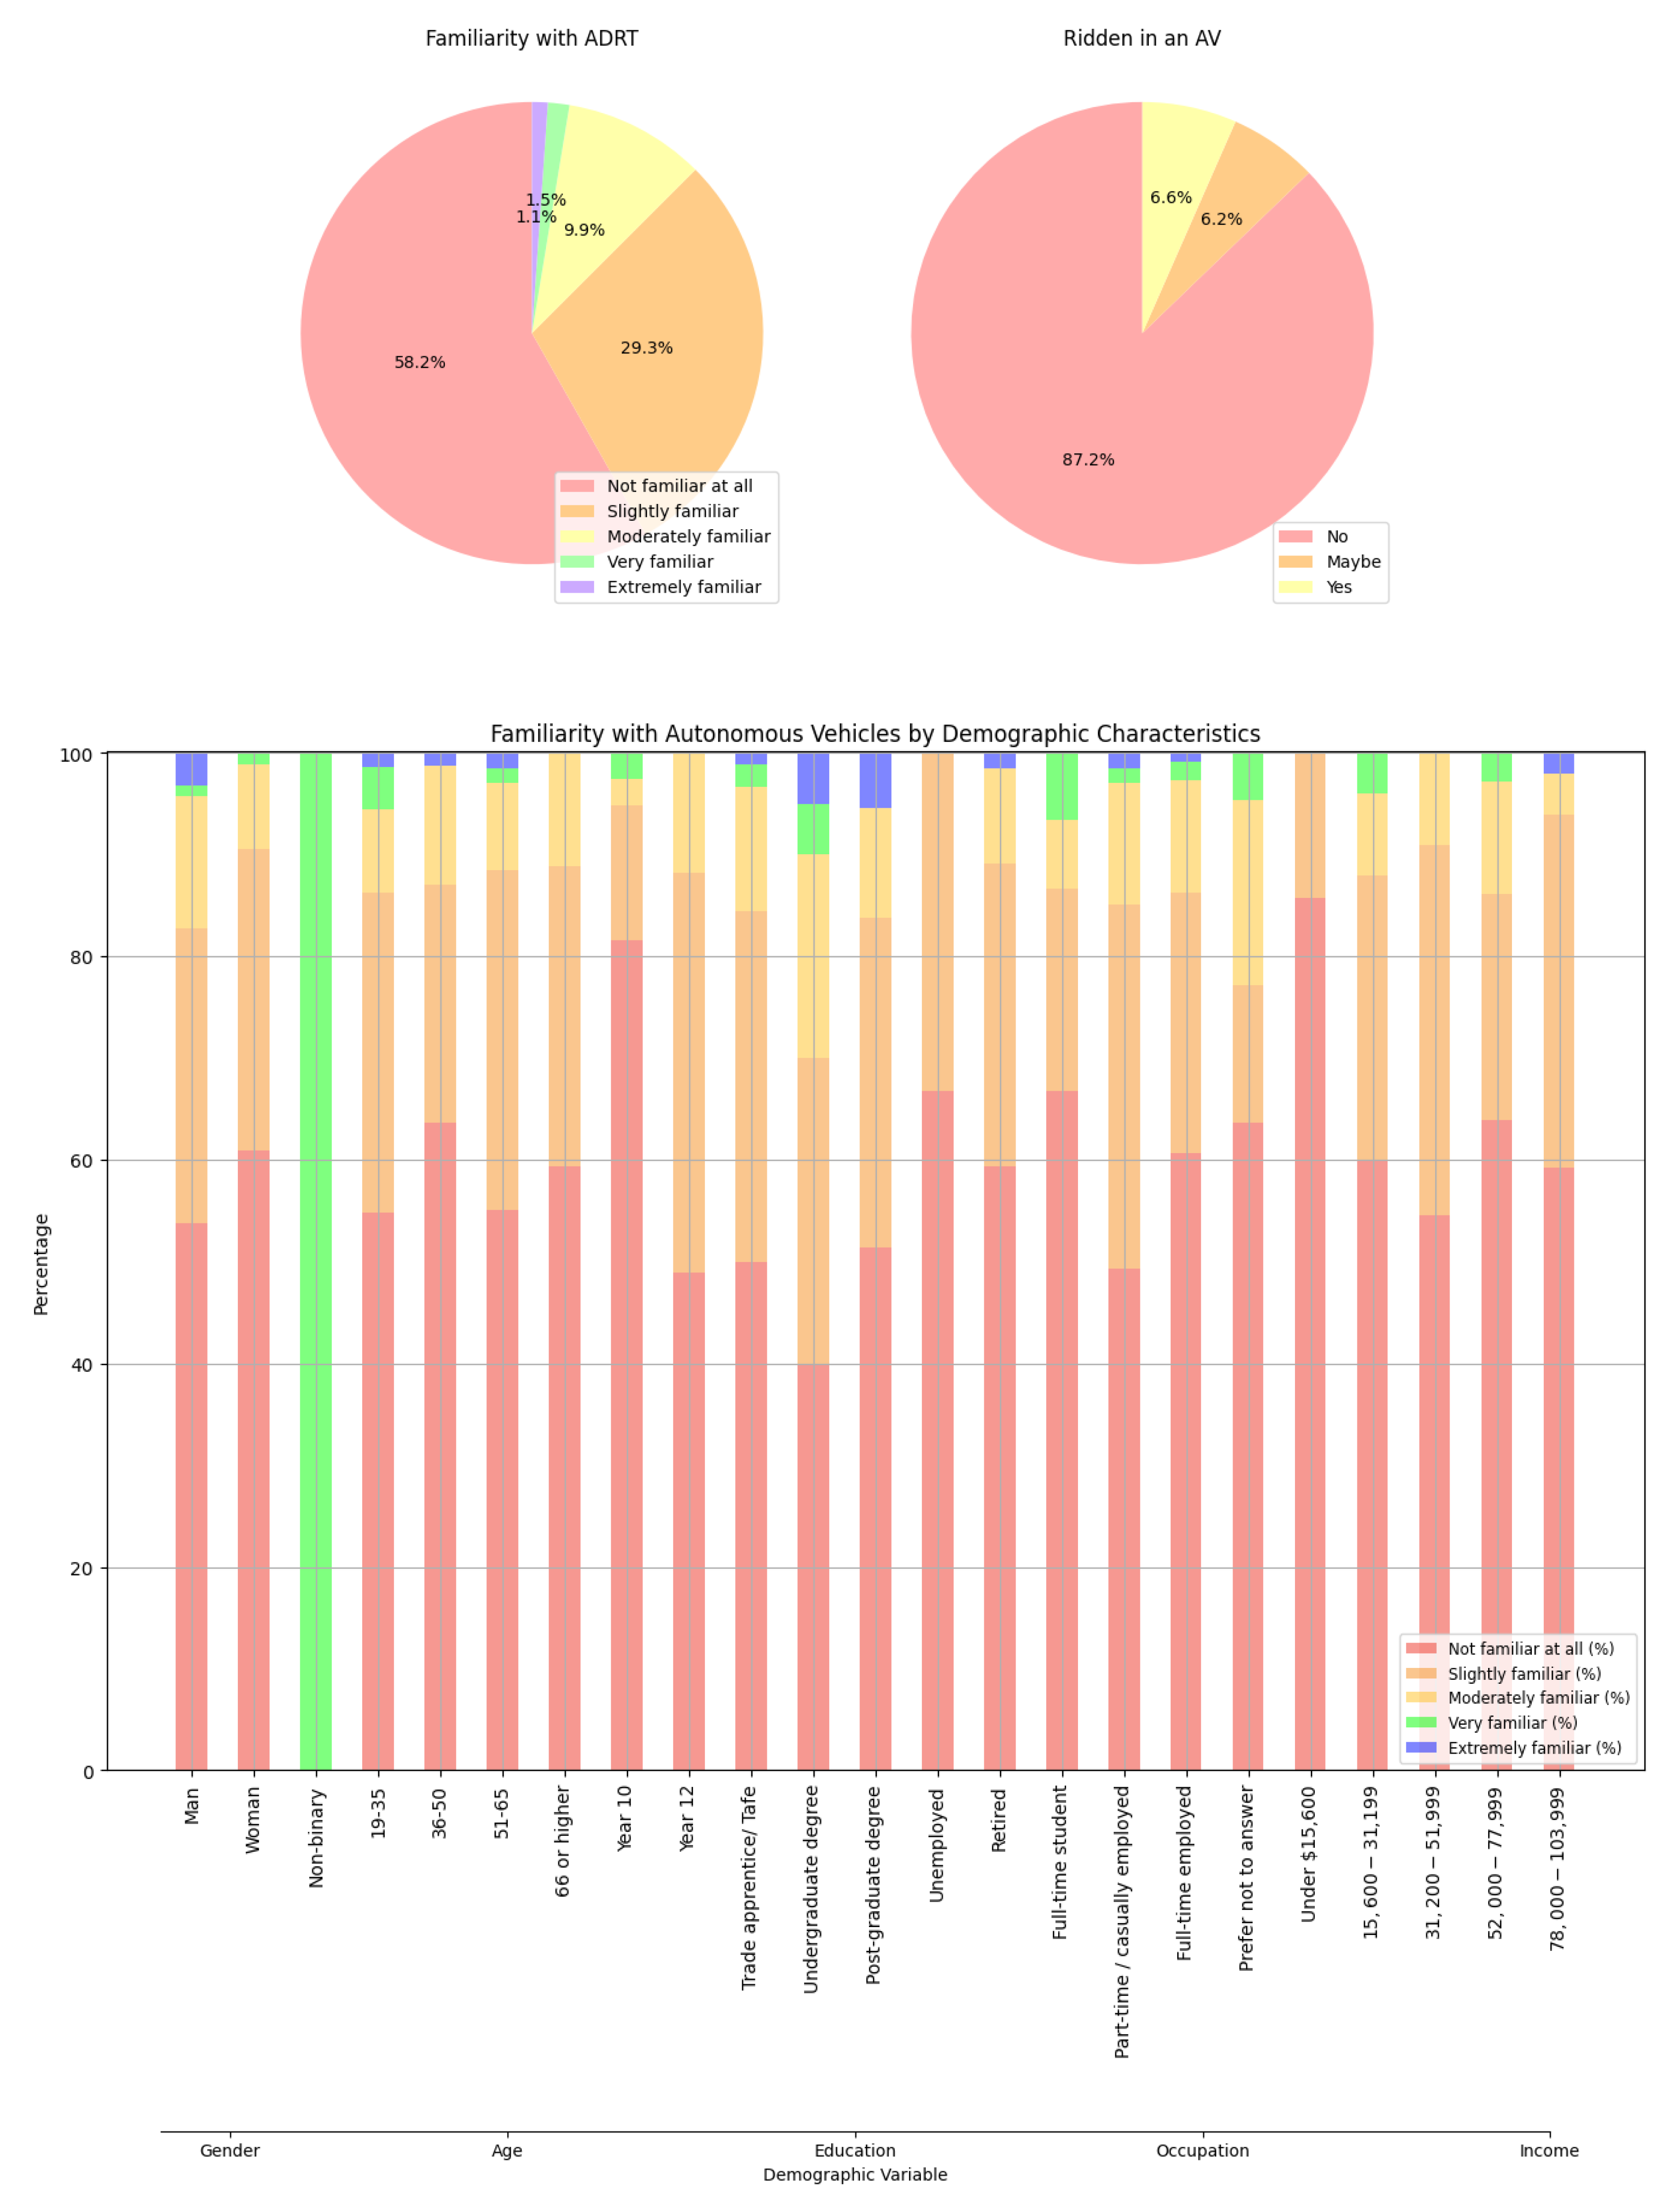
Figure 4.
Summary of Findings4. Practice and Policy Implications.
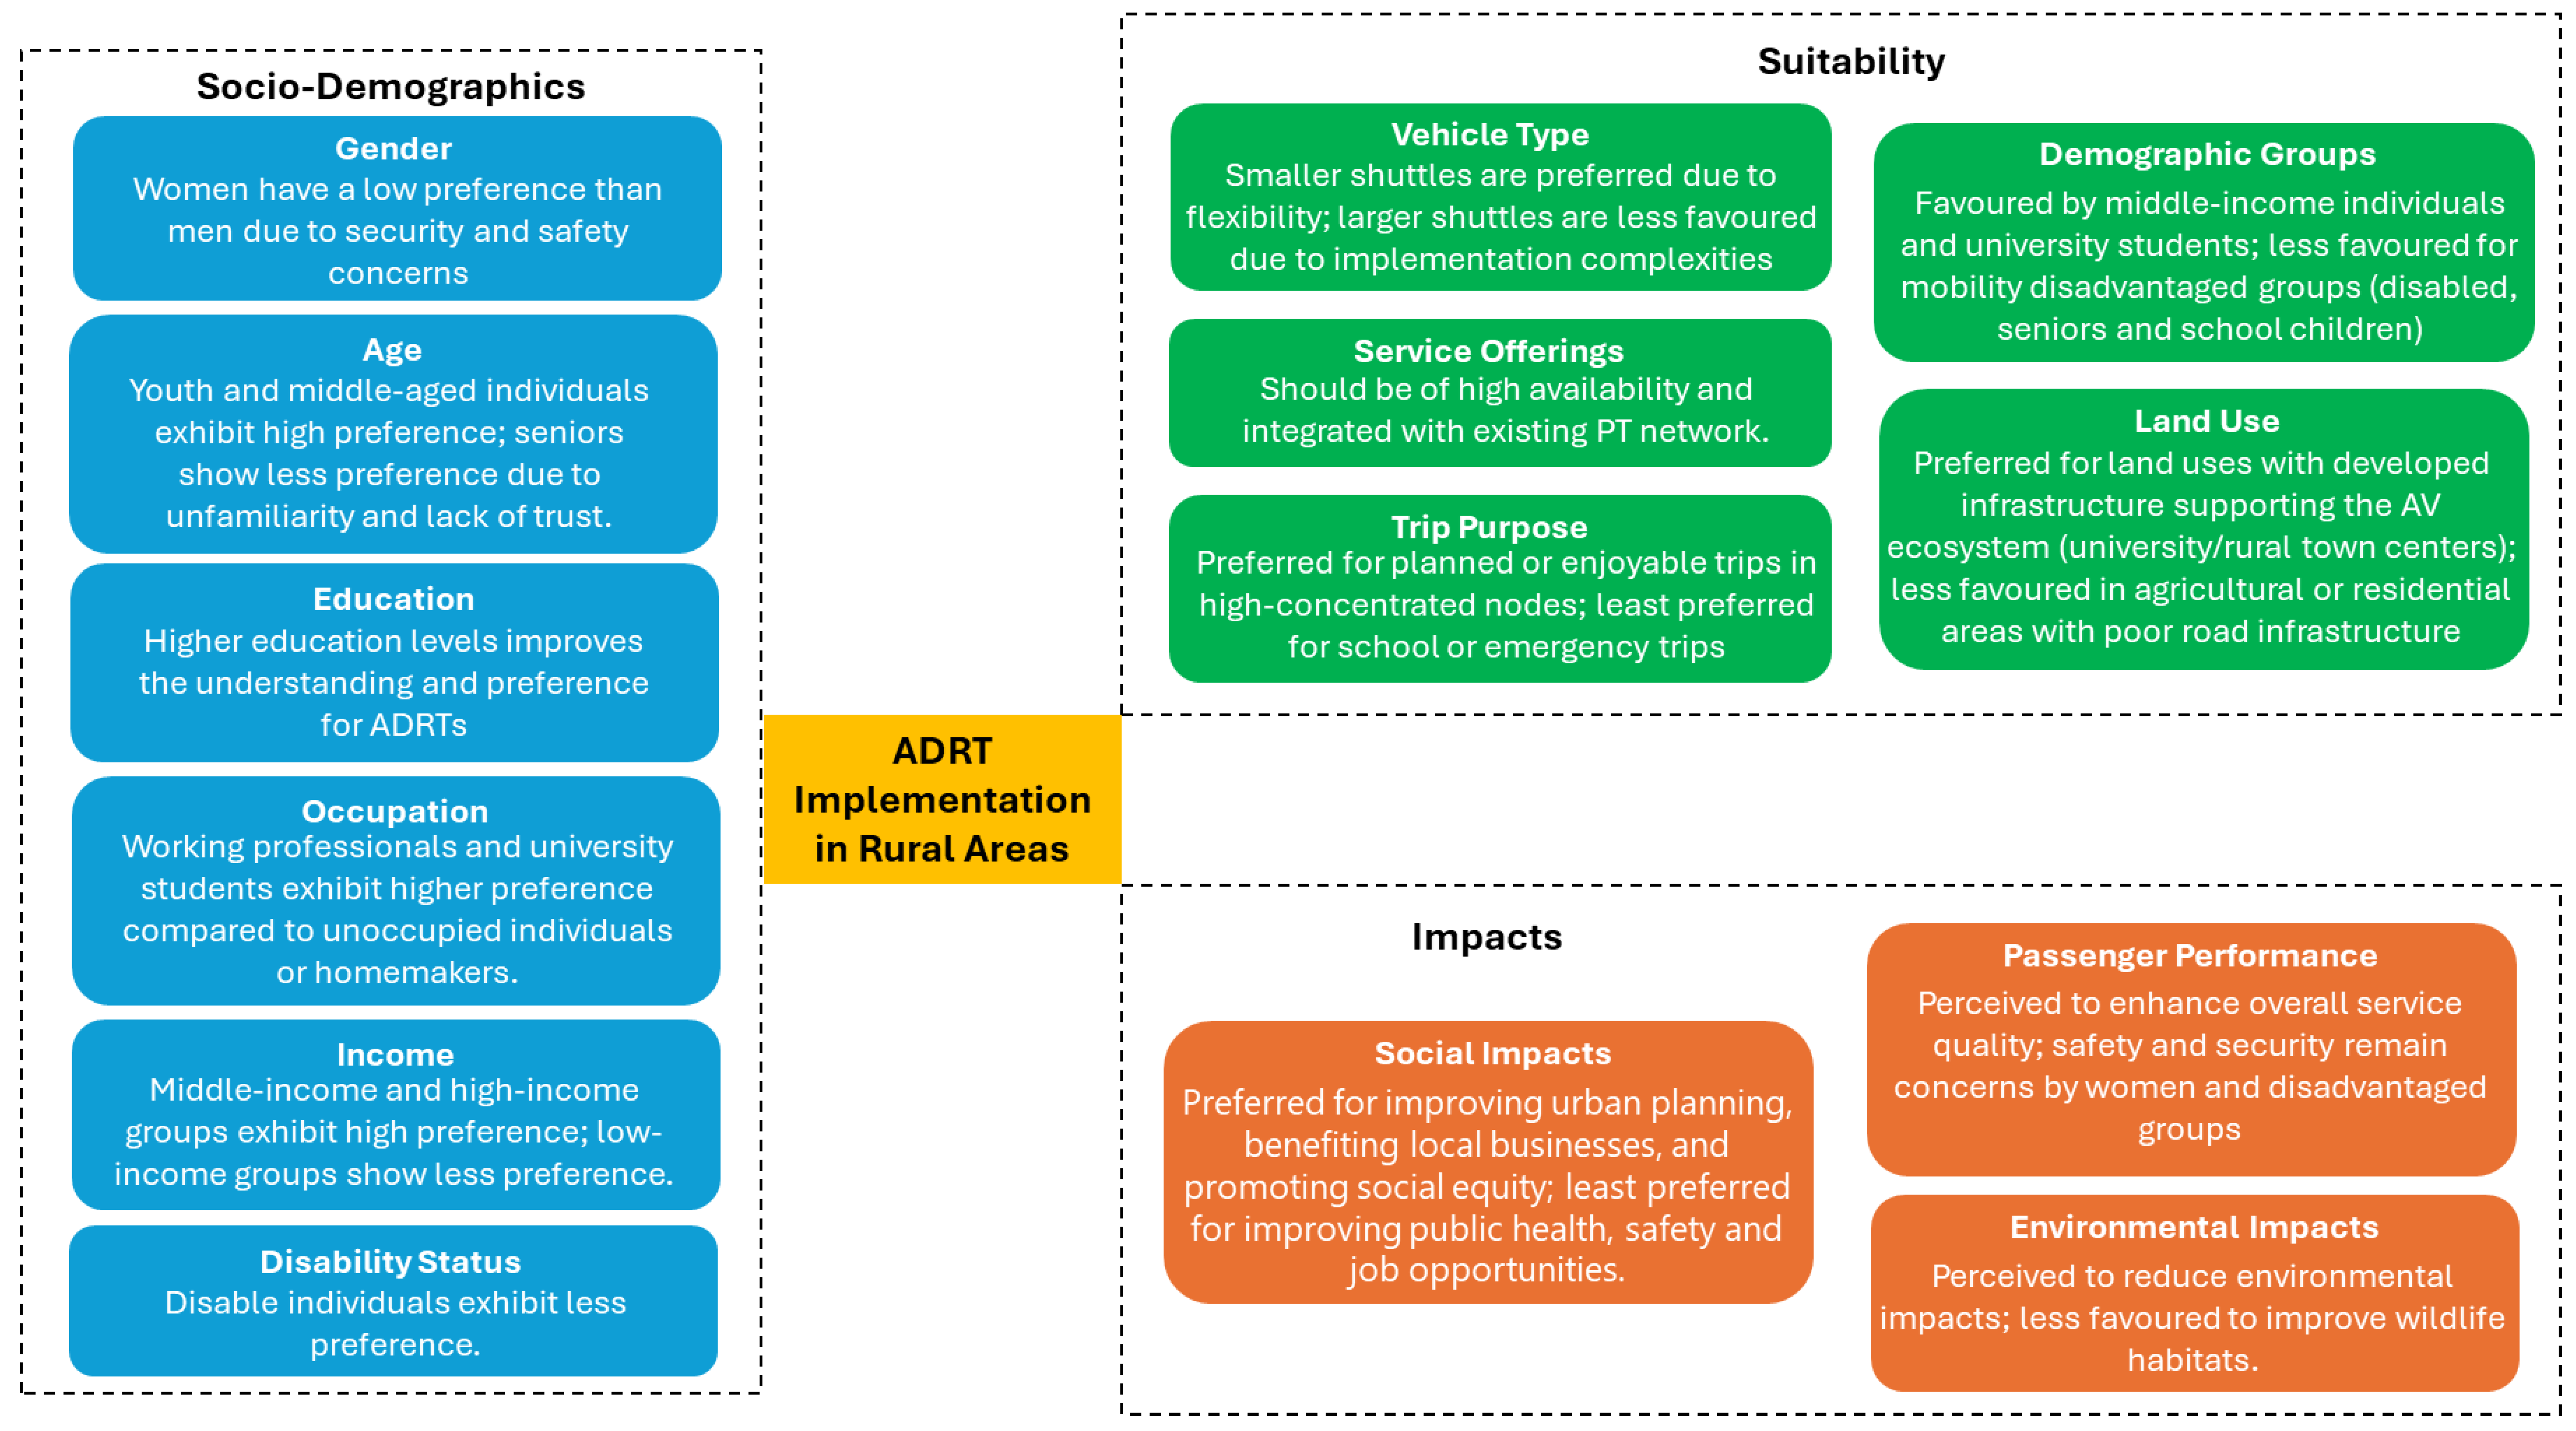
Table 2.
Socio-demographic Profile.
| Predictor variable | Category | N=273 n(%) |
| Gender | Man | 93 (34.1) |
| Woman | 179 (65.6) | |
| Non-binary | 1 (0.4) | |
| Age | 19-35 | 73 (26.7) |
| 36-50 | 77 (28.2) | |
| 51-65 | 69 (25.3) | |
| 66 or higher | 54 (19.8) | |
| Education Level |
Year 10 | 38 (13.9) |
| Year 12 | 51 (18.7) | |
| Trade apprentice/ Tafe | 90 (33.0) | |
| Undergraduate degree | 57 (20.9) | |
| Post-graduate degree | 37 (13.6) | |
| Employment status | Unemployed/ Homemaker | 18 (6.6) |
| Retired | 64 (23.4) | |
| Full-time/ Part-time student | 15 (5.5) | |
| Part-time / casually employed | 67 (24.5) | |
| Full-time employed | 109 (39.9) | |
| Annual Household income | Prefer not to answer | 22 (8.1) |
| Under $15,600 | 7 (2.6) | |
| $15,600 - $31,199 | 25 (9.2) | |
| $31,200 - $51,999 | 33 (12.1) | |
| $52,000 - $77,999 | 36 (13.2) | |
| $78,000 - $103,999 | 49 (17.9) | |
| $104,000 or more | 101 (37.0) |
Table 3.
Chi-Squared Test Results on Knowledge and Experience of Respondents.
| Variable | Gender | Age | Occupational Level | Education Level | Household Income | Disability Status | Driver’s License Status |
| X2 and Significance | |||||||
| Familiarity with ADRTs | 75.101 P = <0.001 |
8.880 P = 0.713 |
10.515 P = 0.838 |
26.693 P = 0.045 |
17.291 P = 0.836 |
8.175 P = 0.417 |
8.974 P = 0.345 |
| Ridden in an AV | 19.211 P = <0.001 |
2.544 P = 0.864 |
16.505 P = 0.036 |
9.429 P = 0.307 |
13.583 P = 0.328 |
11.310 P =0.023 |
7.994 P = 0.092 |
Table 4.
Perceived Suitability of ADRTs in Rural Areas.
| Response Variable | Mean | Std. Dev. | Strongly Agree | Somewhat Agree | Neutral | Somewhat Disagree | Strongly Disagree | Cronbach’s alpha if item deleted |
| Vehicle Type | ||||||||
| Small shuttle | 3.56 | 1.136 | 56 | 104 | 75 | 14 | 24 | 0.816 |
| Minibus shuttle | 3.45 | 1.203 | 55 | 93 | 73 | 24 | 28 | 0.705 |
| Standard sized conventional bus | 2.90 | 1.304 | 40 | 48 | 81 | 53 | 51 | 0.870 |
| Service offering | ||||||||
| Completely replace conventional buses | 2.65 | 1.303 | 24 | 59 | 57 | 64 | 69 | 0.922 |
| Operate as a connector to existing fixed route bus services | 3.51 | 1.170 | 51 | 111 | 64 | 20 | 27 | 0.904 |
| Connector to longer distance services | 3.40 | 1.205 | 53 | 86 | 78 | 28 | 28 | 0.902 |
| Operate as private taxi services | 3.30 | 1.236 | 51 | 77 | 79 | 35 | 31 | 0.905 |
| Accommodate as a multipurpose service | 3.34 | 1.199 | 50 | 80 | 82 | 34 | 27 | 0.905 |
| Integrated with other transport offerings | 3.51 | 1.164 | 59 | 89 | 80 | 22 | 23 | 0.901 |
| Operate 24/7 | 3.62 | 1.238 | 79 | 81 | 68 | 19 | 26 | 0.916 |
| Trip Purpose | ||||||||
| Work | 3.38 | 1.145 | 43 | 96 | 83 | 25 | 26 | 0.906 |
| School | 2.87 | 1.249 | 26 | 71 | 66 | 62 | 48 | 0.915 |
| University | 3.41 | 1.201 | 52 | 93 | 71 | 30 | 27 | 0.901 |
| Shopping | 3.40 | 1.149 | 43 | 101 | 75 | 29 | 25 | 0.905 |
| Medical | 3.22 | 1.238 | 46 | 75 | 77 | 43 | 32 | 0.907 |
| Leisure | 3.40 | 1.162 | 47 | 91 | 85 | 23 | 27 | 0.904 |
| Emergency | 2.50 | 1.237 | 20 | 39 | 73 | 66 | 75 | 0.934 |
| Special events or gatherings | 3.45 | 1.153 | 48 | 99 | 81 | 18 | 27 | 0.904 |
| Demographic Group | ||||||||
| School children | 2.72 | 1.279 | 21 | 67 | 64 | 56 | 65 | 0.953 |
| University students | 3.45 | 1.172 | 48 | 104 | 72 | 21 | 28 | 0.949 |
| Working professionals | 3.56 | 1.130 | 55 | 105 | 74 | 16 | 23 | 0.949 |
| Senior citizens | 3.21 | 1.284 | 48 | 76 | 71 | 40 | 38 | 0.900 |
| Tourists | 3.48 | 1.173 | 49 | 108 | 68 | 20 | 28 | 0.984 |
| Leisure travellers | 3.50 | 1.141 | 49 | 106 | 76 | 16 | 26 | 0.984 |
| People with physical disabilities | 2.92 | 1.308 | 34 | 65 | 73 | 46 | 55 | 0.984 |
| People with sensory disabilities | 2.91 | 1.304 | 35 | 61 | 75 | 48 | 54 | 0.984 |
| People with cognitive disabilities | 2.77 | 1.250 | 24 | 57 | 82 | 51 | 59 | 0.984 |
| Low-income individuals | 3.39 | 1.126 | 47 | 80 | 105 | 15 | 26 | 0.984 |
| Middle-income individuals | 3.47 | 1.091 | 47 | 93 | 96 | 15 | 22 | 0.984 |
| High-income individuals | 3.39 | 1.155 | 49 | 83 | 93 | 22 | 26 | 0.984 |
| Land Use | ||||||||
| Residential neighbours | 3.31 | 1.204 | 41 | 100 | 65 | 37 | 30 | 0.910 |
| Industrial/ business parks | 3.47 | 1.160 | 52 | 98 | 74 | 25 | 24 | 0.903 |
| University precincts | 3.74 | 1.171 | 77 | 106 | 55 | 11 | 24 | 0.901 |
| Agricultural land areas | 2.97 | 1.212 | 33 | 60 | 83 | 60 | 37 | 0.942 |
| Tourist destinations | 3.52 | 1.176 | 57 | 99 | 70 | 22 | 25 | 0.904 |
| Town centres | 3.52 | 1.234 | 65 | 93 | 63 | 24 | 28 | 0.905 |
Table 5.
Perceived Impacts of ADRTs in Rural Areas.
| Response Variable | Mean | Std. Dev. | Strongly Agree | Somewhat Agree | Neutral | Somewhat Disagree | Strongly Disagree | Cronbach’s alpha if item deleted |
| Impact on Passenger Performance | ||||||||
| Improve quality of service | 3.22 | 1.127 | 28 | 93 | 97 | 22 | 33 | 0.884 |
| Improve user experience | 3.21 | 1.097 | 30 | 82 | 102 | 33 | 26 | 0.882 |
| Improve accessibility | 3.48 | 1.108 | 48 | 102 | 76 | 28 | 19 | 0.901 |
| Improve safety | 2.77 | 1.158 | 22 | 43 | 107 | 52 | 49 | 0.891 |
| Improve security | 2.70 | 1.136 | 19 | 43 | 96 | 68 | 47 | 0.899 |
| Social Impacts | ||||||||
| Create new job opportunities | 2.70 | 1.211 | 20 | 58 | 69 | 73 | 53 | 0.944 |
| Improve social inclusion for disadvantaged groups | 3.18 | 1.184 | 36 | 77 | 93 | 33 | 34 | 0.928 |
| Enhance community interaction and social cohesion | 3.06 | 1.097 | 24 | 68 | 113 | 36 | 32 | 0.925 |
| Benefit local businesses and economic activity | 3.22 | 1.112 | 28 | 91 | 95 | 30 | 29 | 0.929 |
| Influence urban planning and development | 3.36 | 1.112 | 36 | 100 | 88 | 23 | 26 | 0.930 |
| Improve public health and well-being | 3.01 | 1.096 | 26 | 56 | 117 | 43 | 31 | 0.928 |
| Enhance personal safety and security in public spaces | 2.81 | 1.185 | 28 | 76 | 118 | 21 | 30 | 0.932 |
| Promote social equity in transport access | 3.19 | 1.084 | 39 | 102 | 85 | 19 | 28 | 0.928 |
| Environmental Impacts | 3.41 | 1.201 | 52 | 93 | 71 | 30 | 27 | 0.901 |
| Reduce GHG emissions | 3.38 | 1.132 | 39 | 102 | 85 | 19 | 28 | 0.911 |
| Reduce noise pollution | 3.53 | 1.088 | 50 | 102 | 86 | 14 | 21 | 0.910 |
| Reduce local air pollution | 3.51 | 1.095 | 47 | 106 | 82 | 16 | 22 | 0.904 |
| Reduce heat in built-up areas | 3.22 | 1.078 | 34 | 69 | 115 | 32 | 23 | 0.912 |
| Improve wildlife habitats | 2.86 | 1.105 | 20 | 47 | 125 | 38 | 43 | 0.942 |
Table 6.
Heterogeneity in opinions within independent variables categories.
| Variable | Gender | Age | Occupational Level | Education Level | Household Income | Disability Status | Driver’s License Status |
| Significance | |||||||
| Suitable vehicle types for ADRTs | |||||||
| Small shuttle | ns | ns | ns | ns | * | ns | ns |
| Minibus shuttle | ns | ns | ns | ns | ns | ns | ns |
| Standard-sized conventional bus | ns | ns | ns | ns | * | ns | ns |
| Suitable service offerings for ADRTs | |||||||
| Completely replace conventional buses | * | ns | ns | ns | ns | ns | ns |
| Operate as a connector to existing fixed route bus services | ns | ns | ns | ns | ns | ns | ns |
| Connector to longer distance services | ns | ns | ns | ns | ns | ns | ns |
| Operate as private taxi services | ns | ns | ns | ns | ns | ns | ns |
| Accommodate as a multipurpose service | ns | ns | ns | ns | ns | ns | ns |
| Integrated with other transport offerings | ns | ns | ns | ns | ns | ns | ns |
| Operate 24/7 | ns | ns | ns | ns | ns | ns | ns |
| Suitable trip purposes for ADRTs | |||||||
| Work | ns | ns | ns | ns | ns | ns | ns |
| School | ns | ns | ns | ns | ns | ns | ns |
| University | ns | ns | ns | ns | ns | ns | ns |
| Shopping | ns | ns | ns | ns | ns | ns | ns |
| Medical | ns | ns | ns | ns | ns | ns | ns |
| Leisure | ns | * | ns | ns | ns | ns | ns |
| Emergency | ns | ns | ns | ns | ns | ns | ns |
| Special events or gatherings | ns | ns | ns | ns | ns | ns | ns |
| Suitable demographic groups for ADRTs | |||||||
| School children | ns | ns | ns | ns | ns | ns | ns |
| University students | ns | ns | ns | * | ns | * | ns |
| Working professionals | ns | ns | ns | ns | ns | * | ns |
| Senior citizens | ns | ns | ns | ns | ns | ns | ns |
| Tourists | ns | ns | ns | ns | ns | ns | ns |
| Leisure travellers | ns | ns | ns | ns | ns | ns | ns |
| People with physical disabilities | ns | ns | ns | ns | ns | ns | ns |
| People with sensory disabilities | * | ns | ns | ns | ns | ns | ns |
| People with cognitive disabilities | ns | ns | ns | ns | ns | ns | ns |
| Low-income individuals | ns | ns | ns | ns | ns | ns | ns |
| Middle-income individuals | ns | ns | ns | ns | ns | ns | ns |
| High-income individuals | ns | ns | ns | ns | ns | * | ns |
| Suitable land use for ADRTs | |||||||
| Residential neighbours | ns | ns | ns | ns | ns | ns | ns |
| Industrial/ business parks | ns | ns | ns | ns | ns | ns | ns |
| University precincts | ns | ns | ns | ns | ns | * | ns |
| Agricultural land areas | ns | ns | ns | ns | ns | ns | ns |
| Tourist destinations | ns | ns | ns | ns | ns | ns | ns |
| Town centres | ns | ns | ns | ns | ns | ns | ns |
| Impacts on passenger performance from ADRTs | |||||||
| Improve quality of service | * | ns | ns | ns | ns | ns | ns |
| Improve user experience | * | ns | ns | ns | ns | ns | ns |
| Improve accessibility | ns | ns | ns | ns | ns | ns | ns |
| Improve safety | ** | ns | ns | ns | ns | ns | ns |
| Improve security | ** | * | * | ns | ns | ns | ns |
| Social impacts from ADRTs | |||||||
| Create new job opportunities | ** | ns | ns | ns | ns | ns | ns |
| Improve social inclusion for disadvantaged groups | ns | ns | ns | ns | ns | ns | ns |
| Enhance community interaction and social cohesion | ns | * | ns | ns | ns | ns | ns |
| Benefit local businesses and economic activity | ns | ns | ns | ns | ns | ns | ns |
| Influence urban planning and development | ns | ns | ns | * | ns | * | ns |
| Improve public health and well-being | ns | * | ns | * | ns | ns | ns |
| Enhance personal safety and security in public spaces | ** | * | ns | * | ns | ns | ns |
| Promote social equity in transport access | ns | * | ns | * | ns | ns | ns |
| Environmental impacts from ADRTs | |||||||
| Reduce GHG emissions | ns | ns | ns | ns | ns | * | ns |
| Reduce noise pollution | ns | ns | ns | ns | ns | ns | ns |
| Reduce local air pollution | ns | ns | ns | ns | ns | ns | ns |
| Reduce heat in built-up areas | ns | ns | ns | ns | ns | ns | ns |
| Improve wildlife habitats | * | * | ns | ns | ns | ns | ns |
Note: ns: not significant; *p < 0.05; **p < 0.01.
Disclaimer/Publisher’s Note: The statements, opinions and data contained in all publications are solely those of the individual author(s) and contributor(s) and not of MDPI and/or the editor(s). MDPI and/or the editor(s) disclaim responsibility for any injury to people or property resulting from any ideas, methods, instructions or products referred to in the content. |
© 2025 by the authors. Licensee MDPI, Basel, Switzerland. This article is an open access article distributed under the terms and conditions of the Creative Commons Attribution (CC BY) license (http://creativecommons.org/licenses/by/4.0/).
Copyright: This open access article is published under a Creative Commons CC BY 4.0 license, which permit the free download, distribution, and reuse, provided that the author and preprint are cited in any reuse.