Submitted:
18 March 2025
Posted:
19 March 2025
You are already at the latest version
Abstract
Medical organ segmentation is essential for accurately identifying the underlying causes of diseases and developing appropriate treatment plans. Current distribution methods primarily focus on the segmentation task, often neglecting the relationship between image distribution and segmentation. Effective image distribution aligns features and can also serve as a boundary constraint in the segmentation task. The high cost of annotating medical images limits the number of available labeled samples. Furthermore, effective methods for extracting organ positional information between image slices are lacking. This paper introduces a distribution-constrained semi-supervised segmentation method (DCSSM). We first design a Category Center of Mass Calculation Module to capture the positional correlation between image slices. Next, we use a public encoder and distribution network for pretraining, enabling segmentation of a large number of unlabeled samples with only a few labeled samples. We also design a lightweight multiscale feature extraction module and use it to build the segmentation network, achieving rapid feature extraction without compromising performance. Finally, the pretrained public encoder and distribution network align the features of the input images, with the aligned boundaries acting as constraints to guide mask generation in the segmentation network. The proposed method is evaluated through comparative and ablation experiments on the publicly available Synapse and skin lesion datasets, against eight baseline methods. We further validate the generalization ability of the proposed method by applying it to skin lesion segmentation datasets. Experimental results show that the proposed method achieves optimal performance across multiple evaluation metrics.
Keywords:
medical organ segmentation
; distribution network
; segmentation network
; multiscale feature extraction
1. Introduction
Organ segmentation technology, an emerging technique in medical imaging, has gained significant attention and importance [1]. It employs image processing techniques to identify organ regions in medical images, distinguishing between abnormal and normal tissues [2]. By accurately locating and identifying the occurrence and extent of diseases, it helps doctors better understand the condition, leading to more precise diagnostic and treatment plans. This has significant implications for the advancement of the medical field. The organ segmentation task typically involves isolating key regions of interest, such as organs, from the background or other tissues in medical images. These regions are then spatially aligned based on distribution tasks across different time points, modalities, or locations, enabling subsequent comparison, analysis, and fusion. However, existing segmentation methods often focus solely on local information within the image, neglecting the overall structure and context. This can result in the omission of distribution-related information during segmentation, affecting the accuracy and consistency of the results. Additionally, the high cost of annotating medical images results in a limited number of labeled samples for training, impacting the performance of machine learning models and limiting their generalization ability and accuracy [3]. Finally, traditional segmentation techniques also have limitations in extracting organ positional information and fail to accurately capture the complex relationships between organs.
To address the issues in existing medical image segmentation models, this paper proposes a distribution-constrained semi-supervised segmentation method. This method captures positional correlation information between image slices using a Category Center of Mass Calculation Module. It employs a public encoder and a custom-designed distribution network for pretraining. Next, a Lightweight Multiscale Feature Extraction Module is used to construct the segmentation network. Finally, the pretrained public encoder and registration network align the features of the input images, with the aligned boundaries acting as constraints to guide mask generation in the segmentation network. The main contributions of this paper are:
(1) By using the custom-designed distribution network for pretraining to refine the registration task, the model can segment a large number of unlabeled samples with only a few labeled samples, addressing the issue of high annotation costs.
(2) The lightweight multiscale feature extraction module used to construct the segmentation network enables rapid feature extraction while maintaining performance.
(3) The pretrained public encoder and distribution network align the features of the input images. This alignment process provides more accurate information, improving the model’s computational accuracy.
(4) Comparative and ablation experiments were conducted on the publicly available Synapse dataset, comparing the proposed method with eight baseline models. Extensive experiments were also conducted on multiple skin lesion datasets to validate the generalization ability of the proposed method. The results demonstrate the logical feasibility and structural effectiveness of the approach.
2. Related Work
Traditional medical image segmentation relies on mathematical principles, using feature extraction, description, and morphological theory as the basis for segmentation techniques. These models do not typically depend on large amounts of labeled data; instead, they use basic features such as image intensity, textures, edges, and regions for segmentation. Consequently, they are easy to understand, computationally efficient, and highly flexible. Common examples of these models include the snake model [4], thresholding methods [5], and others. As science and technology advance and medical standards improve, the demand for modeling and methods in the medical field has gradually increased. Traditional medical image segmentation methods perform poorly in tasks such as multi-organ and multi-structure segmentation, making it difficult to address the more complex and noise-prone medical tasks encountered today.
In recent years, the rapid development of artificial intelligence and deep learning technologies has significantly enhanced traditional medical image segmentation methods through integration of deep learning techniques. These methods leverage convolutional neural networks (CNNs) and their variants to learn, recognize, and extract features of target organs and tissue structures in medical images. The relationships between features and pixel values are used to delineate target regions and achieve segmentation [6,7]. Compared to traditional methods, modern medical image segmentation methods that combine deep learning show significant improvements in both accuracy and efficiency, with their variant models widely applied in the medical field.
The Segmentation Anything Model (SAM) [8,9], a typical deep learning-based segmentation method, offers interactive features and flexibility, enabling zero-shot learning and segmentation across various medical images. Roy et al. [10] evaluated the SAM model on an abdominal CT organ segmentation task, demonstrating its capability to segment without specific category samples. Wu et al. [11] proposed the Med-SA segmentation architecture, an adaptation of the original SAM model for medical use, which effectively improves the original model’s training performance across multiple datasets. Zhang et al. [12] further developed a medical image segmentation model, SAMed, based on SAM. By fine-tuning the SAM encoder with a low-rank adaptation strategy and combining a prompt encoder and mask decoder, the model is trained on labeled medical datasets. Through optimization strategies, this approach achieves significant results on multi-organ segmentation datasets. Chen et al. [13] proposed the SAM-OCTA segmentation model for segmenting regions like blood vessels. This model refines segmentation areas by fine-tuning the base model and using low-rank adaptation techniques. It also uses prompt point generation strategies for multi-task segmentation to handle optical coherence tomography angiography (OCTA) segmentation. Building on this, Wang et al. [14] enhanced the SAM-OCTA framework by using parallel boxes to process original low-resolution images, employing a traditional network to predict rough masks, which are then refined into fine boundary boxes. A merging strategy reduces computational resources, enabling fine-tuning of feature information in low-resolution images.
SegNet, a medical image segmentation technique, is a pixel-level segmentation method [15]. The innovation of this model lies in optimizing the encoder-decoder architecture, making it highly suitable for semantic segmentation tasks. Building on this, Gai et al. [16] proposed the GL-SegNet model. In this model, the embedded feature encoder uses multi-scale convolution (MSC) and pooling (MSP) modules to represent information by encoding global semantics in the shallow layers. Simultaneously, multi-scale feature fusion enriches local geometric details across layers, achieving efficient segmentation. Kibriya et al. [17] introduced a semantic segmentation model based on SegNet. Using the encoder-decoder structure, the model leverages the indices of the maximum pooling layers from the encoder for upsampling and as inputs to the decoder. This approach enables the model to segment melanoma in dermoscopy images. Later, Ahmed et al. [18] proposed the Twin-SegNet framework. This model introduced several innovations to the original SegNet, using partial channel re-calibration techniques to compute channel attention weights for feature exchange and gradient propagation [19], significantly enhancing generalization while maintaining high segmentation accuracy and boundary quality.
Mask R-CNN is a model for instance segmentation in modern medical image processing [20]. Its main advantage is overcoming the limitation of previous models, which could only perform single-object segmentation. The Mask R-CNN-based segmentation framework and its variants effectively address this issue. Building on this, Lu et al. [21] proposed an improved Mask R-CNN network that enhances detection of small objects and feature pyramid fusion by reusing low-level feature information. This improvement enables precise and effective segmentation based on the characteristics of the organs to be segmented. Later, Li et al. [22] proposed an automatic segmentation and detection model based on 3D-Mask R-CNN. This model uses the RoI Align method, an improvement over RoIPooling, to align proposed regions with feature maps. Yao et al. [23] introduced a transfer learning-based DenseSE-Mask R-CNN model that transfers tumor-related information from PET to MR images, providing prior knowledge and improving sensitivity to relevant information, thereby enhancing feature extraction and fusion for target images. Kiernan et al. [24] applied the Mask R-CNN to carotid intima-media thickness image segmentation. This network uses MimickNet B-mode as the primary framework, converting delayed-sum images into dynamically enhanced tissue contrast images. Singular value decomposition filtering is used to remove higher-order singular values and suppress random noise. This approach reduces speckle noise, providing the model with high accuracy and automation.
U-Net, a recently emerging image segmentation model, integrates skip connections, enabling better retention of global context information in images [25]. Building on this, Petit et al. [26] combined the U-shaped fully convolutional network with the Transformer attention mechanism, proposing the U-Transformer network. This network applies both self-attention and cross-attention modules to extract global structural features and filter out non-semantic features, improving segmentation accuracy for complex, low-contrast anatomical structures. Additionally, Wang et al. [27] proposed a hybrid Transformer U-Net model. By applying a local-global Gaussian-weighted self-attention mechanism, the model captures both local and global dependencies at different granularities, facilitating feature interaction. Later, Chen et al. [28] combined U-Net with Transformer and a multi-level attention mechanism to introduce the TransAttUnet segmentation model. This model uses Transformer self-attention and global spatial attention to capture long-range dependencies and spatial relationships between encoder features. To address the limitation of using Transformer solely as an auxiliary module, Zhou et al. [29] proposed the nnformer model. This model combines interleaved convolutions and self-attention operations, introducing a volume-based local and global self-attention mechanism to learn volumetric representations, making it highly complementary in ensemble learning. Cao et al. [30] proposed an improved deep neural network called RASNet, which captures multi-scale information using a multi-scale spatial perception module, retaining the target’s original shape. The model uses a decoding module with attention connections to suppress background noise and refine target boundary prediction, improving segmentation accuracy.
3. Method
DCSSM first inputs labeled and unlabeled volume data from each patient into the pretrained Category Center of Mass Calculation Module for center of mass calculation and into the pretrained Public Encoder for feature extraction. The category centers and features of both labeled and unlabeled data are multiplied in matrices and concatenated. The data is then distributed through the distribution network, and a loss is calculated using the True Label to optimize the distribution process. Finally, the self-designed Segmentation Network outputs predicted labels for the unlabeled data. The overall structure of GSTF is shown in Figure 1.
To better capture the sequential information of input volume data, we designed the Category Center of Mass Calculation Module, shown in Figure 2. First, the input volume data undergoes Pixel Selection on each slice based on corresponding labels. The coordinates of category pixels and slice numbers are merged into triplets. Then, K-means clustering is performed on each triplet, dynamically calculating the centroids of each category label. Finally, the centroids of each category are stored in the category vector and updated iteratively. As slices are input sequentially, different categories retain their centroids according to their appearance order, serving as the starting category vector for the next slice. The Category Center of Mass Calculation Module represents the spatial and slice position information of different category features and, to some extent, reflects the order of category appearance.
To better leverage the distribution-assisted segmentation effects, we designed a multi-stage fusion training method, with its steps shown in Figure 3. The first step involves using the same Public Encoder to perform feature extraction on both labeled and unlabeled data, followed by concatenation. The concatenated features are input into the Distribution Network, and the edge loss is calculated based on labeled data labels. The parameters of the Public Encoder and the Distribution Network are updated until convergence. Meanwhile, the features of the unlabeled data are input into the Segmentation Network for loss calculation, and its parameters are updated accordingly. The second step involves inputting labeled data into the pretrained Public Encoder and the self-designed Segmentation Network to obtain the predicted label. The segmentation loss is calculated using labeled data labels, and the parameters of the Segmentation Network are updated until convergence. In the third step, the pretrained Public Encoder, Distribution Network, and Segmentation Network predict labels for the unlabeled data. This process uses a large amount of unlabeled data features to initialize the Segmentation Network’s parameters and obtains a Public Encoder that bridges feature differences between labeled and unlabeled data, along with a well-distributed Distribution Network. Then, a small amount of labeled data is used to fine-tune the Segmentation Network and obtain the final model parameters. This training approach requires only a small amount of labeled data to achieve good distribution and segmentation performance, enabling collaborative optimization of both.
To achieve more efficient image segmentation, the structure of the Segmentation Network is shown in Figure 4. The Segmentation Network’s architecture is a U-shaped encoder-decoder structure. The input passes through a Patch Embedding layer for embedding segmentation, followed by a Deformable Convolution layer for feature extraction. Next, the self-designed Lightweight Multiscale Feature Extraction Module performs rapid multiscale feature extraction, followed by downsampling. The features then pass through three downsampling and upsampling stages, with each stage accompanied by a Lightweight Multiscale Feature Extraction Module, restoring the features to their initial resolution. Finally, a Deformable Convolution layer and a Softmax layer are applied to produce the final segmentation result.
The structure of the Lightweight Multiscale Feature Extraction Module is shown in Figure 5. The input passes through a Deformable Convolution (DConv) layer for feature extraction, which does not alter the feature dimensions. The features are then split into three parts along the channels and input into DConv layers with different kernel sizes for multiscale feature extraction. After activation with the GeLU function, the features undergo secondary extraction using the C2f module. Finally, the features from different scales are concatenated, restoring the feature dimensions to the input dimensions. The concatenated features are processed through another C2f module and a DConv layer to produce the final result. A residual connection is applied between the last DConv layer and the initial DConv layer to prevent overfitting and gradient vanishing.
4. Experiment
4.1. Dataset and Metrics
We evaluated the model using the well-known Synapse multi-organ segmentation dataset. This dataset includes 30 abdominal cases with annotations for 8 different organ types, totaling 3,779 axial CT slices. It features various small abdominal organs, with 18 cases for training and 12 for testing. We also evaluated the network’s generalization capability using skin lesion segmentation datasets, including ISIC 2017, ISIC 2018, and PH2. The ISIC 2017 dataset contains over 2,500 skin lesion images and is intended to facilitate research on skin cancer detection. It includes various types of skin lesions with detailed labeling information. The ISIC 2018 dataset, an extension of the ISIC family, contains over 10,000 skin lesion images, covering a wider range of lesion types and advancing automated skin cancer diagnostics. The PH2 dataset contains over 200 high-definition skin lesion images, focusing on the classification of benign and malignant lesions, and is suitable for small-scale research and algorithm testing.
We evaluated the model on the Synapse multi-organ segmentation dataset using the Dice similarity coefficient (DSC) and Hausdorff distance (HD), two metrics commonly used in image segmentation. The DSC measures the overlap between the predicted segmentation and the ground truth, while the HD evaluates boundary differences using the maximum surface distance at the 95th percentile. Higher DSC scores and lower HD values typically correspond to better segmentation performance. On the skin lesion segmentation dataset, we used SE, SP, and ACC, in addition to DSC, to evaluate the model. SE indicates the model’s ability to identify all actual positive samples, reflecting its capacity to capture positive samples. SP measures the model’s ability to identify all actual negative samples, reflecting its ability to exclude negative samples. ACC is the proportion of samples correctly classified by the model to the total number of samples, reflecting overall classification accuracy.
4.2. Implementation Details
The experiment was conducted on an RTX 4080 GPU with 16GB of memory, using the PyTorch framework for model training. Before feeding the data into the network, augmentation techniques such as rotation and flipping were applied, with an input image size of 224×224. The batch size was set to 4, and the Adam optimizer, using Adaptive Moment Estimation (Adam), was employed with an initial learning rate of 0.02. The loss function was defined as a weighted sum of Dice loss and focal loss, with a weight ratio of 0.7:0.3. The maximum number of training epochs was set to 200.
4.3. Results and Discussion
We conducted extensive comparison and ablation experiments on the Synapse multi-organ segmentation and skin lesion segmentation datasets. This section is organized as follows: Section 4.1 describes the comparison experimental results and analysis, Section 4.2 presents the comparison results on the skin lesion segmentation dataset and analysis, and Section 4.3 presents the ablation experiment results on the Synapse multi-organ segmentation dataset and analyzes the impact of each module on the model.
4.3.1. Results of Synapse Multi-Organ Segmentation
Table 1 presents the quantitative comparison of our proposed DCSSM method with 10 existing baseline methods on the Synapse dataset. The table demonstrates that the DCSSM method shows significant advantages in multi-organ segmentation tasks. First, DCSSM achieves outstanding overall segmentation performance, with a DSC of 82.89%, the highest among all methods, and an HD of 18.98, second only to HiFormer’s 14.70. This indicates that DCSSM excels in both segmentation accuracy and boundary fitting. Second, DCSSM shows remarkable improvement in segmenting small organs such as the gallbladder (67.01%) and pancreas (91.25%), highlighting its superior capability in handling challenging cases. Additionally, DCSSM demonstrates stable performance in segmenting common large organs such as the kidney (88.89%), spleen (83.11%), and liver (95.02%), leading or matching other methods. Its ability to control the boundary distance between predictions and ground truth further highlights the method’s superior performance. Overall, DCSSM stands out as the best-performing method in the table due to its exceptional accuracy, boundary handling, and robustness.
The results in Figure 6 demonstrate that the DCSSM method exhibits significant advantages in multi-organ segmentation tasks. Compared to other methods, DCSSM achieves more precise boundary alignment with the ground truth in segmenting large organs such as the liver, spleen, and stomach, resulting in higher boundary accuracy. Additionally, DCSSM performs better in segmenting small organs like the gallbladder and pancreas, providing more complete results and reducing missed detections and false positives, while other methods show noticeable errors or omissions in these small organs. For complex-shaped organs, such as the pancreas and kidneys, DCSSM outperforms other methods by preserving the overall shape and finer details, avoiding the common issues of over-smoothing or blurry edges. Moreover, DCSSM demonstrates superior noise suppression, as its segmentation results contain fewer background artifacts, while other methods exhibit artifacts or incorrect segmentation in some background regions. These findings indicate that DCSSM surpasses U-Net, MISSFormer, and UltraLightUNet in boundary fitting, small organ segmentation, complex structure recognition, and noise suppression, showcasing its stronger ability in multi-organ segmentation.
4.3.2. Results of Skin Lesion Segmentation
Table 2 presents the quantitative comparison results of our proposed DCSSM method with 11 baseline methods on the ISIC 2017, ISIC 2018, and PH2 datasets. As shown in the table, the DCSSM model demonstrated significant performance advantages across the three dermatological lesion segmentation benchmark datasets: ISIC 2017, ISIC 2018, and PH2. In terms of the core metric, DSC, DCSSM ranked first on all three datasets, with a significant advantage of 0.9321, 0.9113, and 0.9483, representing improvements of 0.68%, 0.11%, and 0.24%, respectively, over the next best method. Notably, DCSSM achieved a breakthrough in the DSC metric on the ISIC 2017 dataset. The model also excelled in SE metrics, achieving a peak sensitivity of 0.9549 on the PH2 dataset, an improvement of 4.44% over the conventional U-Net, demonstrating its ability to capture detailed features of the lesion area. Notably, DCSSM leads in the ACC dimension with 97.46%, 97.71%, and 96.91%, respectively, validating its ability to balance high sensitivity and specificity in complex skin images. Compared to Swin-Unet, the mainstream Transformer architecture, and MedT, the medical-specific model, DCSSM demonstrates greater robustness in cross-dataset testing, particularly overcoming the performance bottleneck of existing methods on key metrics in the ISIC 2018 dataset. Additionally, some visual representations of our proposed DCSSM on the ISIC 2017 dataset are shown in Figure 7. It is clear that DCSSM can capture the pathological structures finely and generate accurate contours. These experimental results indicate that DCSSM not only has strong multi-organ segmentation capabilities, but also effectively addresses segmentation challenges such as morphological changes and boundary blurring in skin lesions, showcasing its strong generalization capabilities.
4.3.3. Ablation Study
Table 3 shows the results of the model ablation experiments to demonstrate the effectiveness of its various modules, with the numbers after the "×" symbol representing the number of executions. The table shows that the ablation study of the DCSSM model mainly focuses on adjustments to the CCMCM feature blocks and the number of downsampling steps (SN_dn). For the CCMCM blocks, results with different numbers indicate that increasing the number of blocks generally improves the Dice Similarity Coefficient (DSC) for most organs. For example, the DSC of the Aorta increases from 88.72 to 89.72. However, using too many blocks (e.g., ×3) may lead to slight performance degradation in certain organs, such as the Kidney and Stomach, suggesting that excessive blocks could introduce redundancy or over-complexity. Regarding the impact of downsampling, increasing the number of downsampling steps from 2 to 5 slightly improves the DSC for certain organs, such as the Liver, but results in minor declines for others, such as the Pancreas and Stomach, possibly due to resolution loss caused by excessive downsampling. Overall, the complete DCSSM model achieves the best performance across all organ segmentation tasks, with DSC values such as 90.01 for the Aorta and 95.02 for the Liver, and a significantly reduced Hausdorff Distance (18.98), outperforming other variants. This demonstrates the effectiveness and robustness of the DCSSM model design, where an appropriate number of feature blocks and reasonable downsampling depth are key to performance improvement.
5. Conclusions
This paper proposes DCSSM, a distribution-constrained semi-supervised segmentation method for multi-organ segmentation, which incorporates a Category Center of Mass Calculation Module to capture positional correlations, a lightweight multiscale feature extraction module for efficient processing, and a public encoder with a distribution network for pretraining to align features and guide mask generation. The model demonstrated state-of-the-art performance on the Synapse dataset, achieving a Dice Similarity Coefficient of 82.89% and a Hausdorff Distance of 18.98, excelling in both small and large organ segmentation tasks, while maintaining robust boundary alignment and noise suppression. DCSSM was validated on skin lesion datasets, further confirming its generalization capabilities and robustness across various medical image segmentation tasks. Furthermore, ablation studies validated the effectiveness of the CCMCM module and optimized downsampling strategies, highlighting the importance of balancing feature representation and efficiency. By requiring minimal labeled data and delivering superior accuracy, DCSSM provides a scalable and effective solution for medical image segmentation, offering significant potential for clinical applications and further advancements in the field.
Acknowledgments
This research was funded by the Natural Science Foundation of Nanjing University of Chinese Medicine (XZR2021093), the Suzhou City Applied Basic Research (Health) Science and Technology Innovation General Program (SYW2024051) and Zhejiang Ocean University (JX6311040123).
References
- Zhao, X.; Zhang, P.; Song, F.; Ma, C.; Fan, G.; Sun, Y.; Feng, Y.; Zhang, G. Prior attention network for multi-lesion segmentation in medical images. IEEE Transactions on Medical Imaging 2022, 41, 3812–3823. [Google Scholar] [CrossRef] [PubMed]
- Archana, R.; Jeevaraj, P.E. Deep learning models for digital image processing: a review. Artificial Intelligence Review 2024, 57, 11. [Google Scholar] [CrossRef]
- Zhang, Y.; Chen, J.; Ma, X.; Wang, G.; Bhatti, U.A.; Huang, M. Interactive medical image annotation using improved Attention U-net with compound geodesic distance. Expert systems with applications 2024, 237, 121282. [Google Scholar] [CrossRef]
- Wang, X.; Fang, L. Survey of image segmentation based on active contour model. Pattern Recogn Artif Intell 2013, 26, 751–760. [Google Scholar]
- Houssein, E.H.; Emam, M.M.; Ali, A.A. An efficient multilevel thresholding segmentation method for thermography breast cancer imaging based on improved chimp optimization algorithm. Expert Systems with Applications 2021, 185, 115651. [Google Scholar] [CrossRef]
- Kayalibay, B.; Jensen, G.; van der Smagt, P. CNN-based segmentation of medical imaging data. arXiv 2017, arXiv:1701.03056. [Google Scholar]
- Yuan, F.; Zhang, Z.; Fang, Z. An effective CNN and Transformer complementary network for medical image segmentation. Pattern Recognition 2023, 136, 109228. [Google Scholar] [CrossRef]
- He, S.; Bao, R.; Li, J.; Grant, P.E.; Ou, Y. Accuracy of segment-anything model (sam) in medical image segmentation tasks. CoRR 2023. [Google Scholar]
- Mazurowski, M.A.; Dong, H.; Gu, H.; Yang, J.; Konz, N.; Zhang, Y. Segment anything model for medical image analysis: an experimental study. Medical Image Analysis 2023, 89, 102918. [Google Scholar] [CrossRef]
- Roy, S.; Wald, T.; Koehler, G.; Rokuss, M.R.; Disch, N.; Holzschuh, J.; Zimmerer, D.; Maier-Hein, K.H. Sam. md: Zero-shot medical image segmentation capabilities of the segment anything model. arXiv 2023, arXiv:2304.05396. [Google Scholar]
- Wu, J.; Ji, W.; Liu, Y.; Fu, H.; Xu, M.; Xu, Y.; Jin, Y. Medical sam adapter: Adapting segment anything model for medical image segmentation. arXiv 2023, arXiv:2304.12620. [Google Scholar] [CrossRef] [PubMed]
- Zhang, K.; Liu, D. Customized segment anything model for medical image segmentation. arXiv 2023, arXiv:2304.13785. [Google Scholar]
- Chen, X.; Wang, C.; Ning, H.; Li, S.; Shen, M. Sam-octa: Prompting segment-anything for octa image segmentation. arXiv 2023, arXiv:2310.07183. [Google Scholar] [CrossRef]
- Wang, H.; Ye, H.; Xia, Y.; Zhang, X. Leveraging SAM for Single-Source Domain Generalization in Medical Image Segmentation. arXiv 2024, arXiv:2401.02076. [Google Scholar]
- Abdollahi, A.; Pradhan, B.; Alamri, A.M. An ensemble architecture of deep convolutional Segnet and Unet networks for building semantic segmentation from high-resolution aerial images. Geocarto International 2022, 37, 3355–3370. [Google Scholar] [CrossRef]
- Gai, D.; Zhang, J.; Xiao, Y.; Min, W.; Chen, H.; Wang, Q.; Su, P.; Huang, Z. GL-Segnet: Global-Local representation learning net for medical image segmentation. Frontiers in Neuroscience 2023, 17, 1153356. [Google Scholar] [CrossRef]
- Kibriya, H.; Abdullah, I.; Kousar, F. Melanoma Lesion Segmentation and Classification Using SegNet. In Proceedings of the 2023 4th International Conference on Advancements in Computational Sciences (ICACS); IEEE, 2023; pp. 1–6. [Google Scholar]
- Ahmed, S.; Hasan, M.K. Twin-SegNet: Dynamically coupled complementary segmentation networks for generalized medical image segmentation. Computer Vision and Image Understanding 2024, 240, 103910. [Google Scholar] [CrossRef]
- Yuan, Y.; Wang, X.; Yang, X.; Heng, P.A. Effective Semi-Supervised Medical Image Segmentation with Probabilistic Representations and Prototype Learning. IEEE Transactions on Medical Imaging 2024. [Google Scholar] [CrossRef]
- He, K.; Gkioxari, G.; Dollár, P.; Girshick, R. Mask r-cnn. In Proceedings of the Proceedings of the IEEE international conference on computer vision, 2017; pp. 2961–2969.
- Wei, L.; Dan, L.; Min, S.; Yangdong, W. Application of Improved Mask R-CNN Network in Medical Image Recognition and Segmentation. Journal of Computer Engineering & Applications 2021, 57. [Google Scholar]
- Li, S.T.; Zhang, L.; Guo, P.; Pan, H.y.; Chen, P.z.; Xie, H.f.; Xie, B.k.; Chen, J.; Lai, Q.q.; Li, Y.z.; et al. Prostate cancer of magnetic resonance imaging automatic segmentation and detection of based on 3D-Mask RCNN. Journal of Radiation Research and Applied Sciences 2023, 16, 100636. [Google Scholar] [CrossRef]
- Yao, Y.; Chen, Y.; Gou, S.; Chen, S.; Zhang, X.; Tong, N. Auto-segmentation of pancreatic tumor in multi-modal image using transferred DSMask R-CNN network. Biomedical Signal Processing and Control 2023, 83, 104583. [Google Scholar] [CrossRef]
- Kiernan, M.J.; Al Mukaddim, R.; Mitchell, C.C.; Maybock, J.; Wilbrand, S.M.; Dempsey, R.J.; Varghese, T. Lumen segmentation using a Mask R-CNN in carotid arteries with stenotic atherosclerotic plaque. Ultrasonics 2024, 137, 107193. [Google Scholar] [CrossRef]
- Zhou, T.; Dong, Y.; Huo, B.; Liu, S.; Ma, Z. U-Net and its applications in medical image segmentation: a review. Journal of Image and Graphics 2021, 26, 2058–2077. [Google Scholar] [CrossRef]
- Petit, O.; Thome, N.; Rambour, C.; Themyr, L.; Collins, T.; Soler, L. U-net transformer: Self and cross attention for medical image segmentation. In Proceedings of the Machine Learning in Medical Imaging: 12th International Workshop, MLMI 2021, Held in Conjunction with MICCAI 2021, Strasbourg, France, 27 September 2021; Proceedings 12. Springer, 2021; pp. 267–276. [Google Scholar]
- Wang, H.; Xie, S.; Lin, L.; Iwamoto, Y.; Han, X.H.; Chen, Y.W.; Tong, R. Mixed transformer u-net for medical image segmentation. In Proceedings of the ICASSP 2022-2022 IEEE international conference on acoustics, speech and signal processing (ICASSP). IEEE; 2022; pp. 2390–2394. [Google Scholar]
- Chen, B.; Liu, Y.; Zhang, Z.; Lu, G.; Kong, A.W.K. Transattunet: Multi-level attention-guided u-net with transformer for medical image segmentation. IEEE Transactions on Emerging Topics in Computational Intelligence 2023. [Google Scholar] [CrossRef]
- Zhou, H.Y.; Guo, J.; Zhang, Y.; Han, X.; Yu, L.; Wang, L.; Yu, Y. nnformer: Volumetric medical image segmentation via a 3d transformer. IEEE Transactions on Image Processing 2023. [Google Scholar] [CrossRef]
- Cao, G.; Sun, Z.; Wang, C.; Geng, H.; Fu, H.; Yin, Z.; Pan, M. RASNet: Renal automatic segmentation using an improved U-Net with multi-scale perception and attention unit. Pattern Recognition 2024, 150, 110336. [Google Scholar] [CrossRef]
Figure 1.
Overall Architecture of DCSSM.
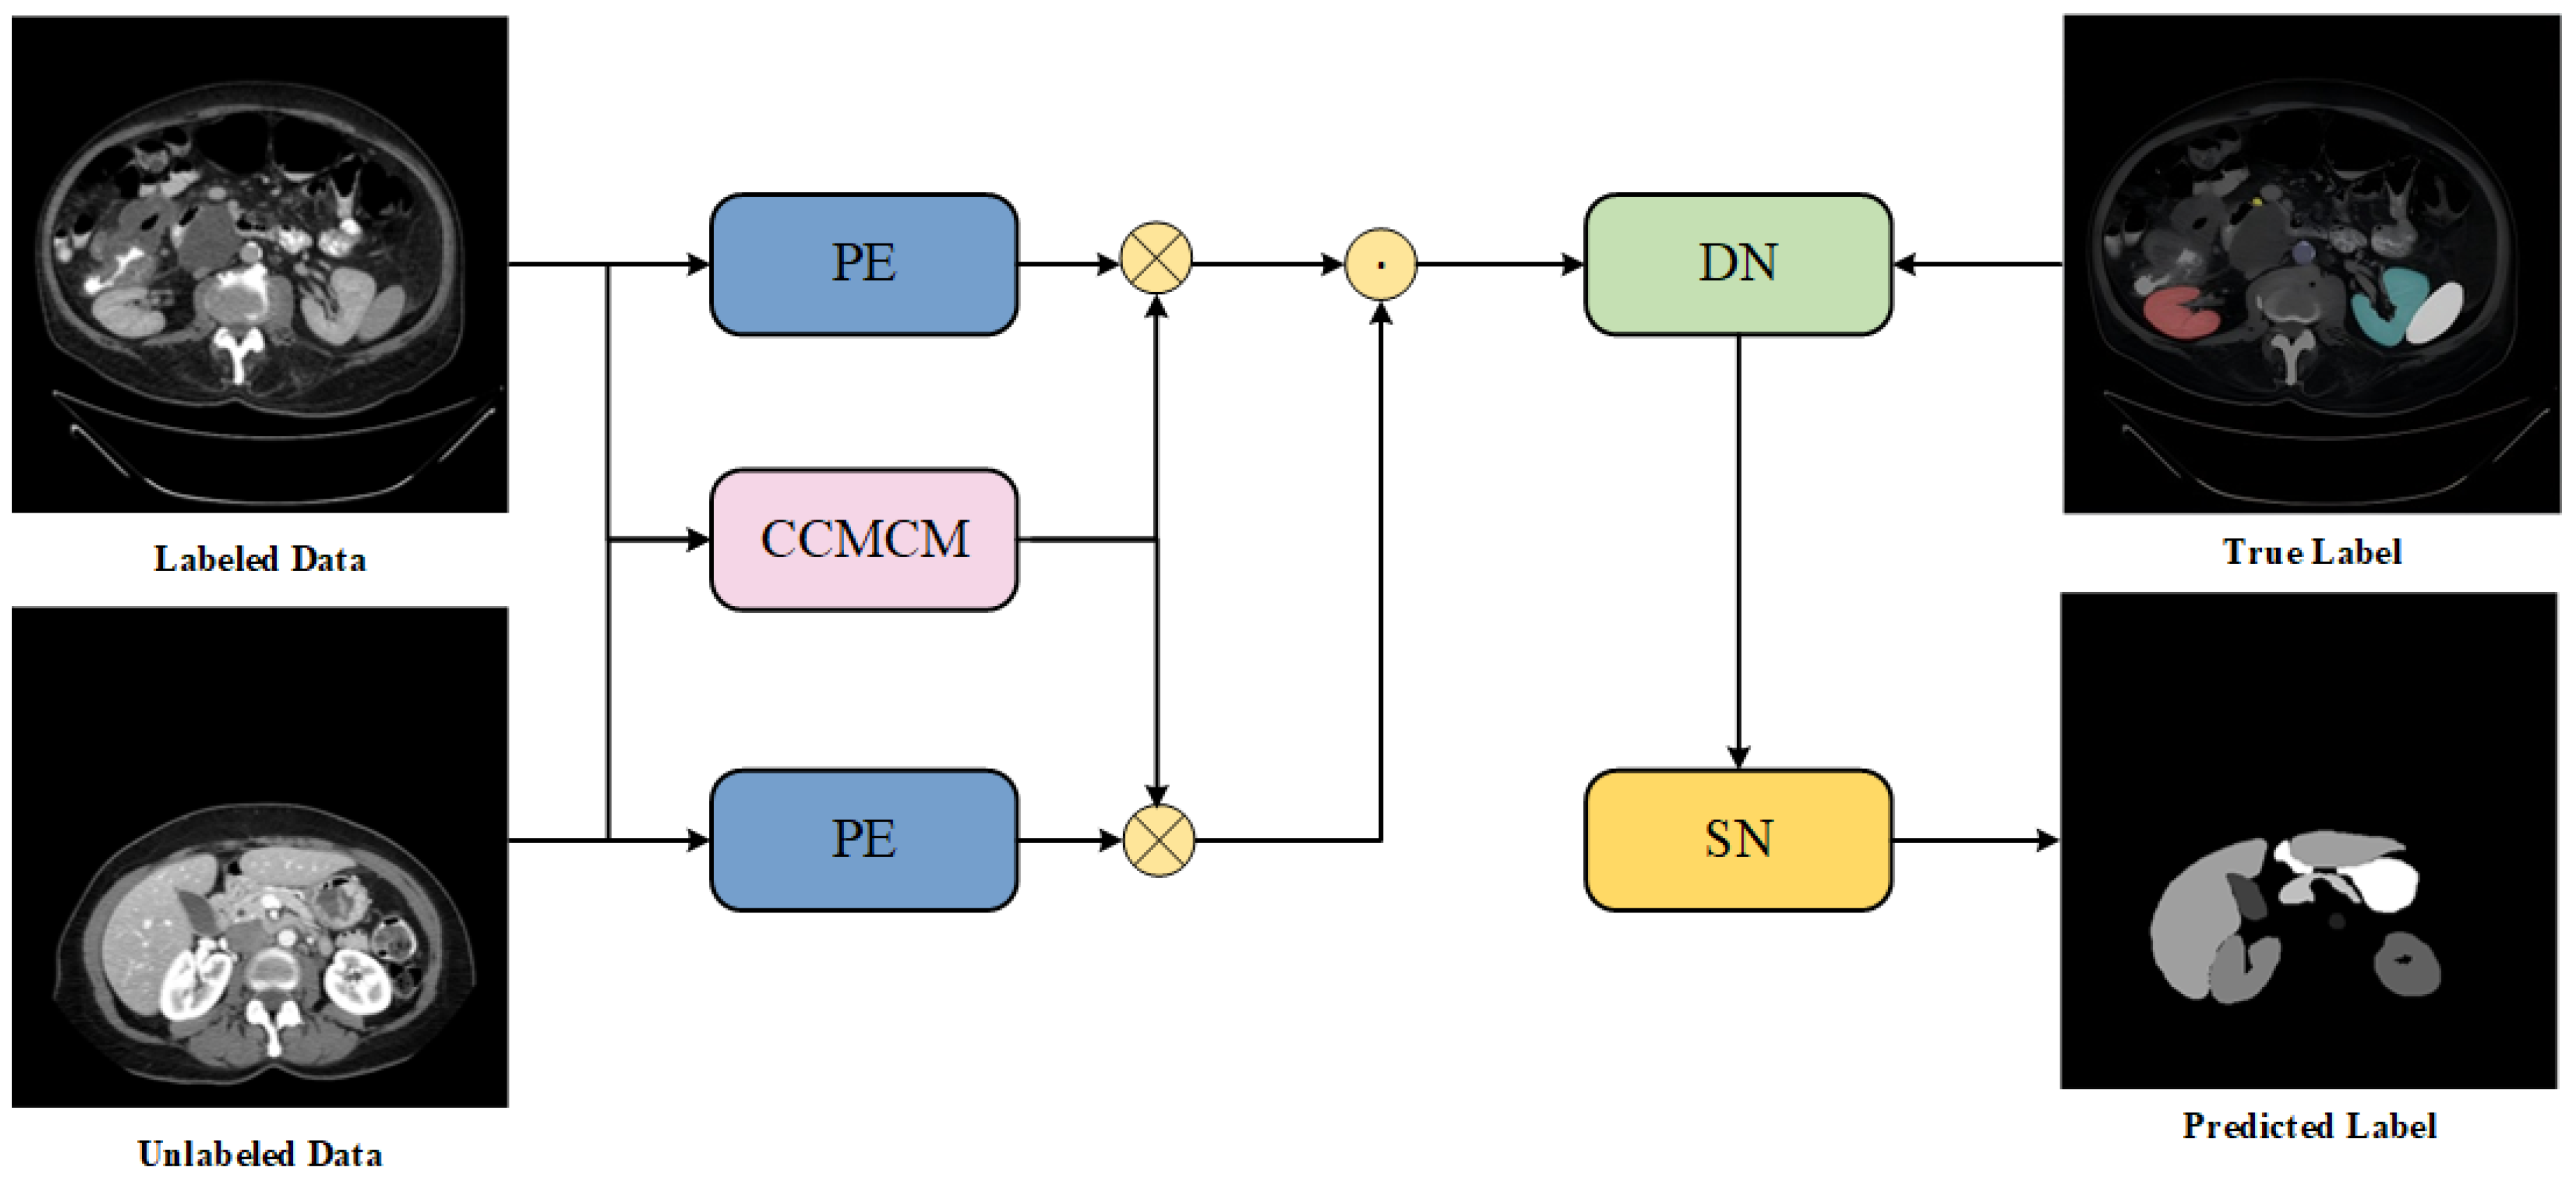
Figure 2.
Structure of the CCMCM Module.
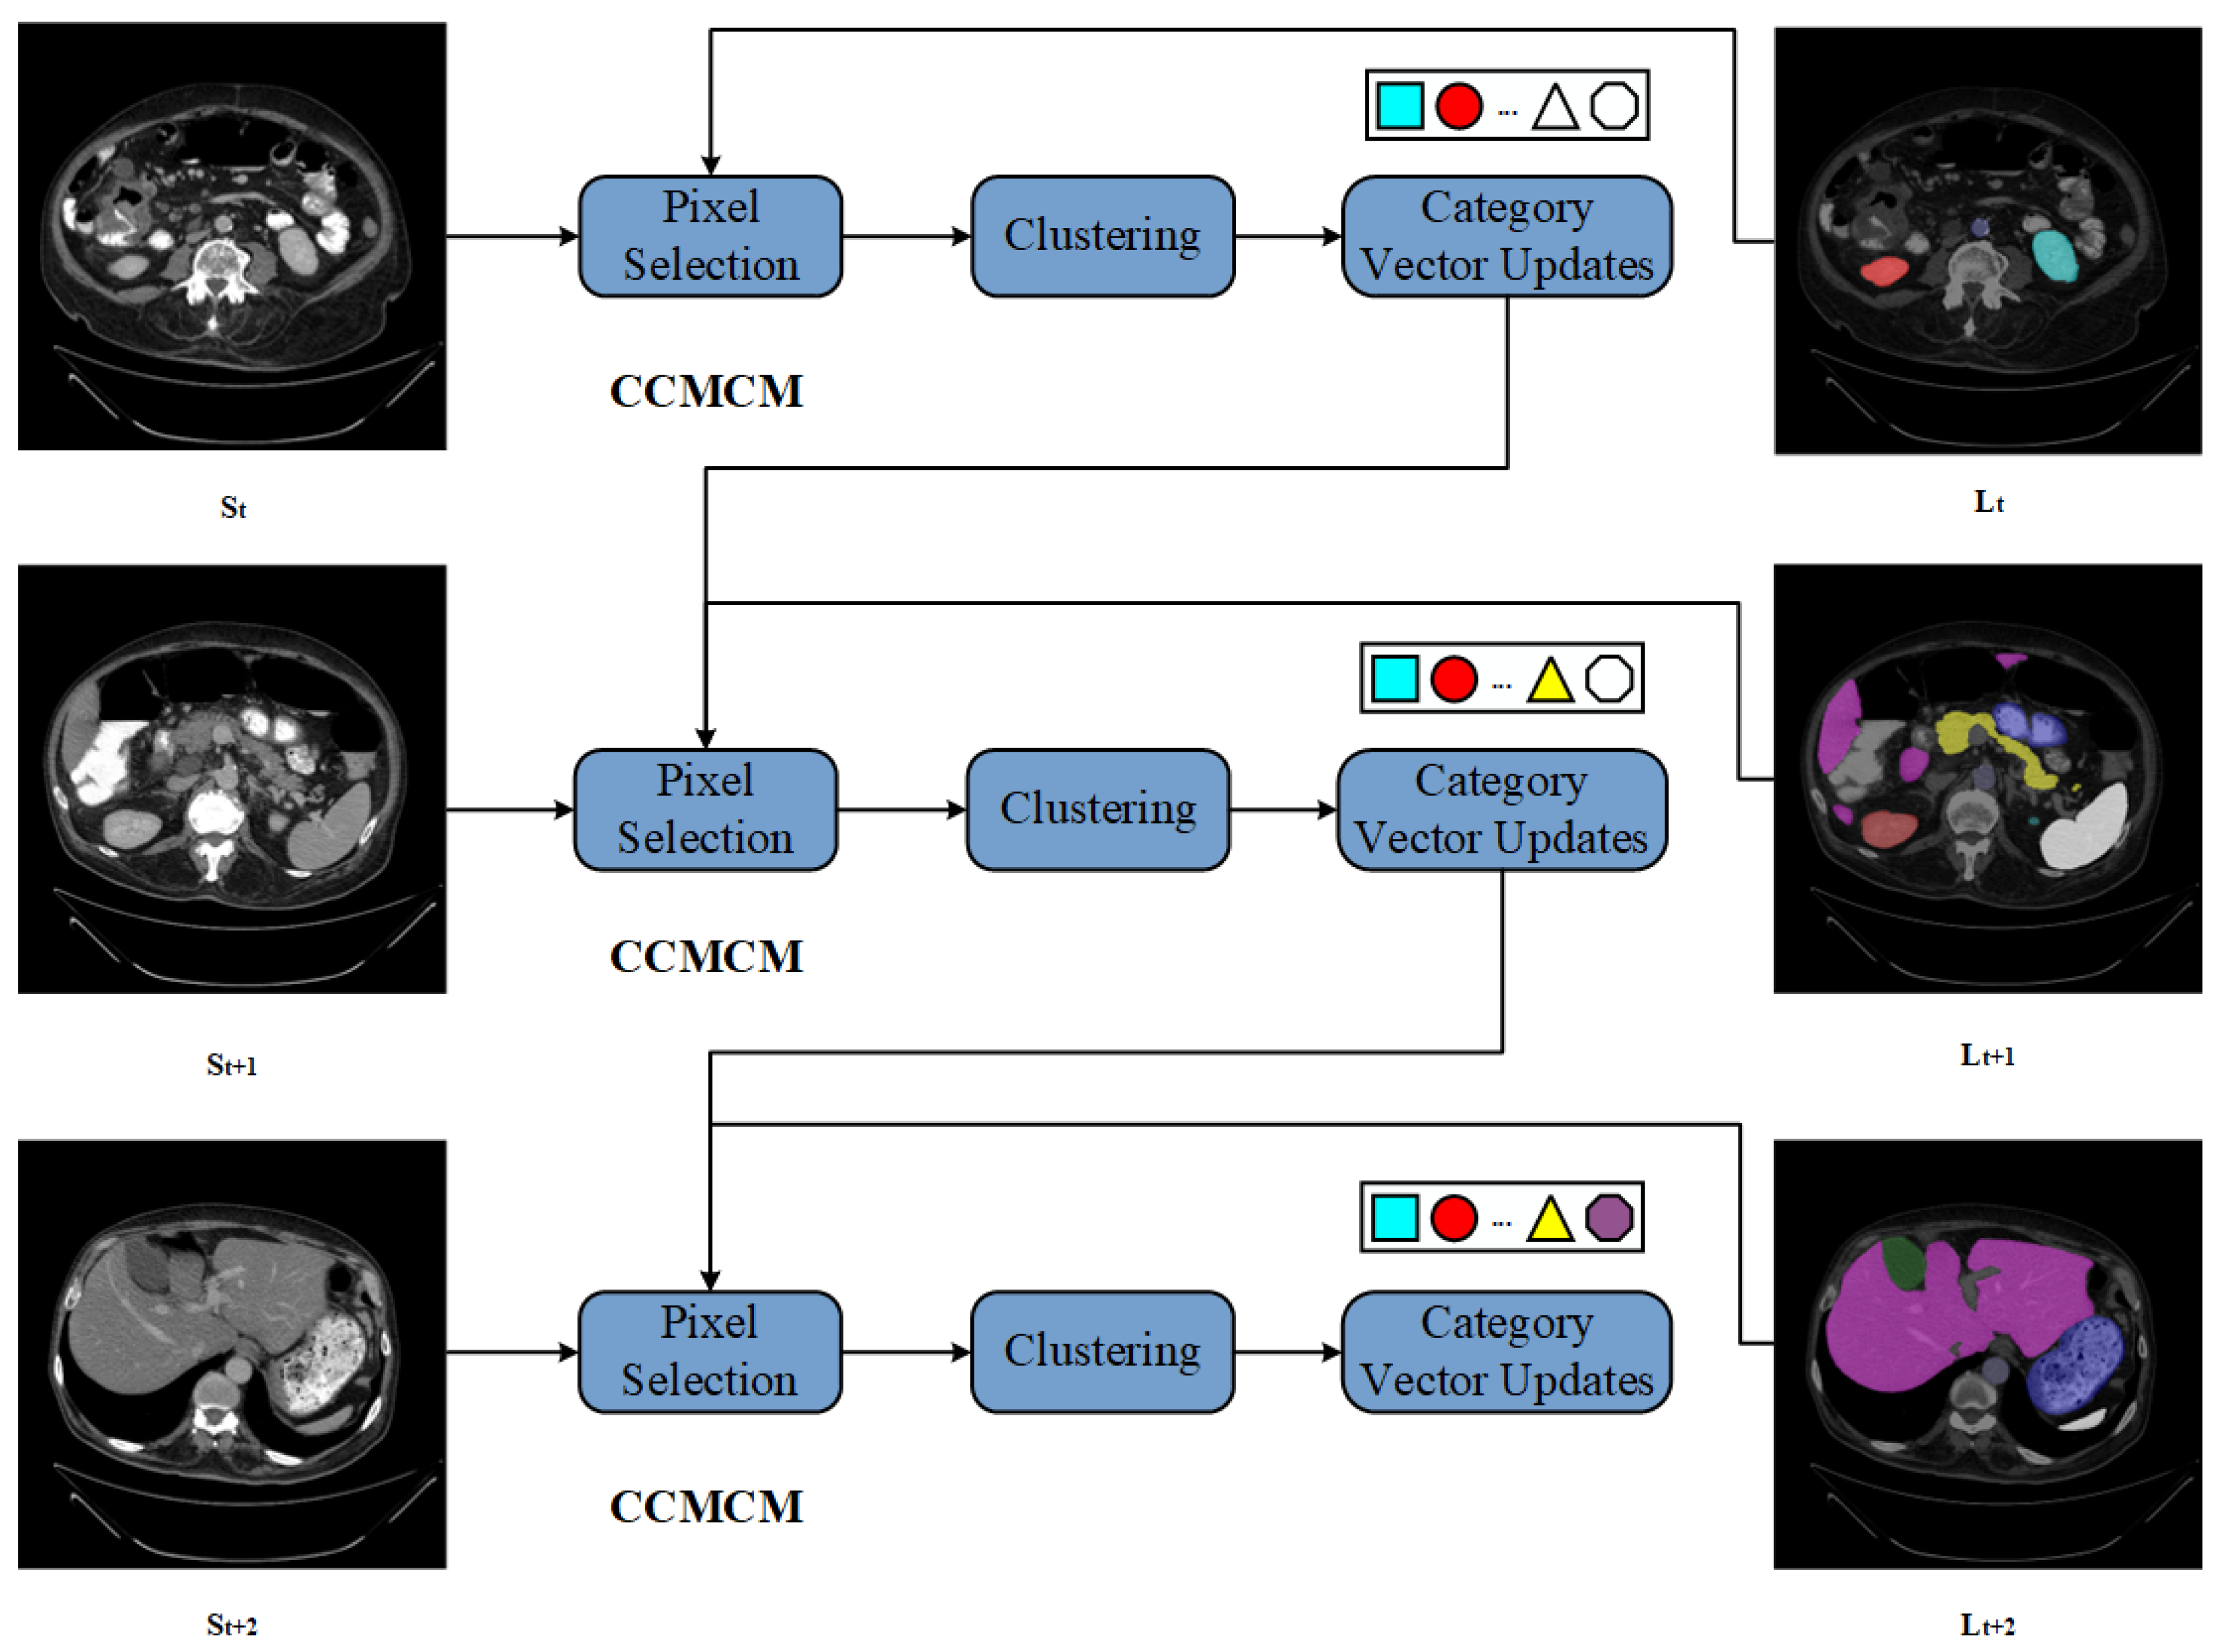
Figure 3.
Steps of the Multi-Stage Fusion Training Method.
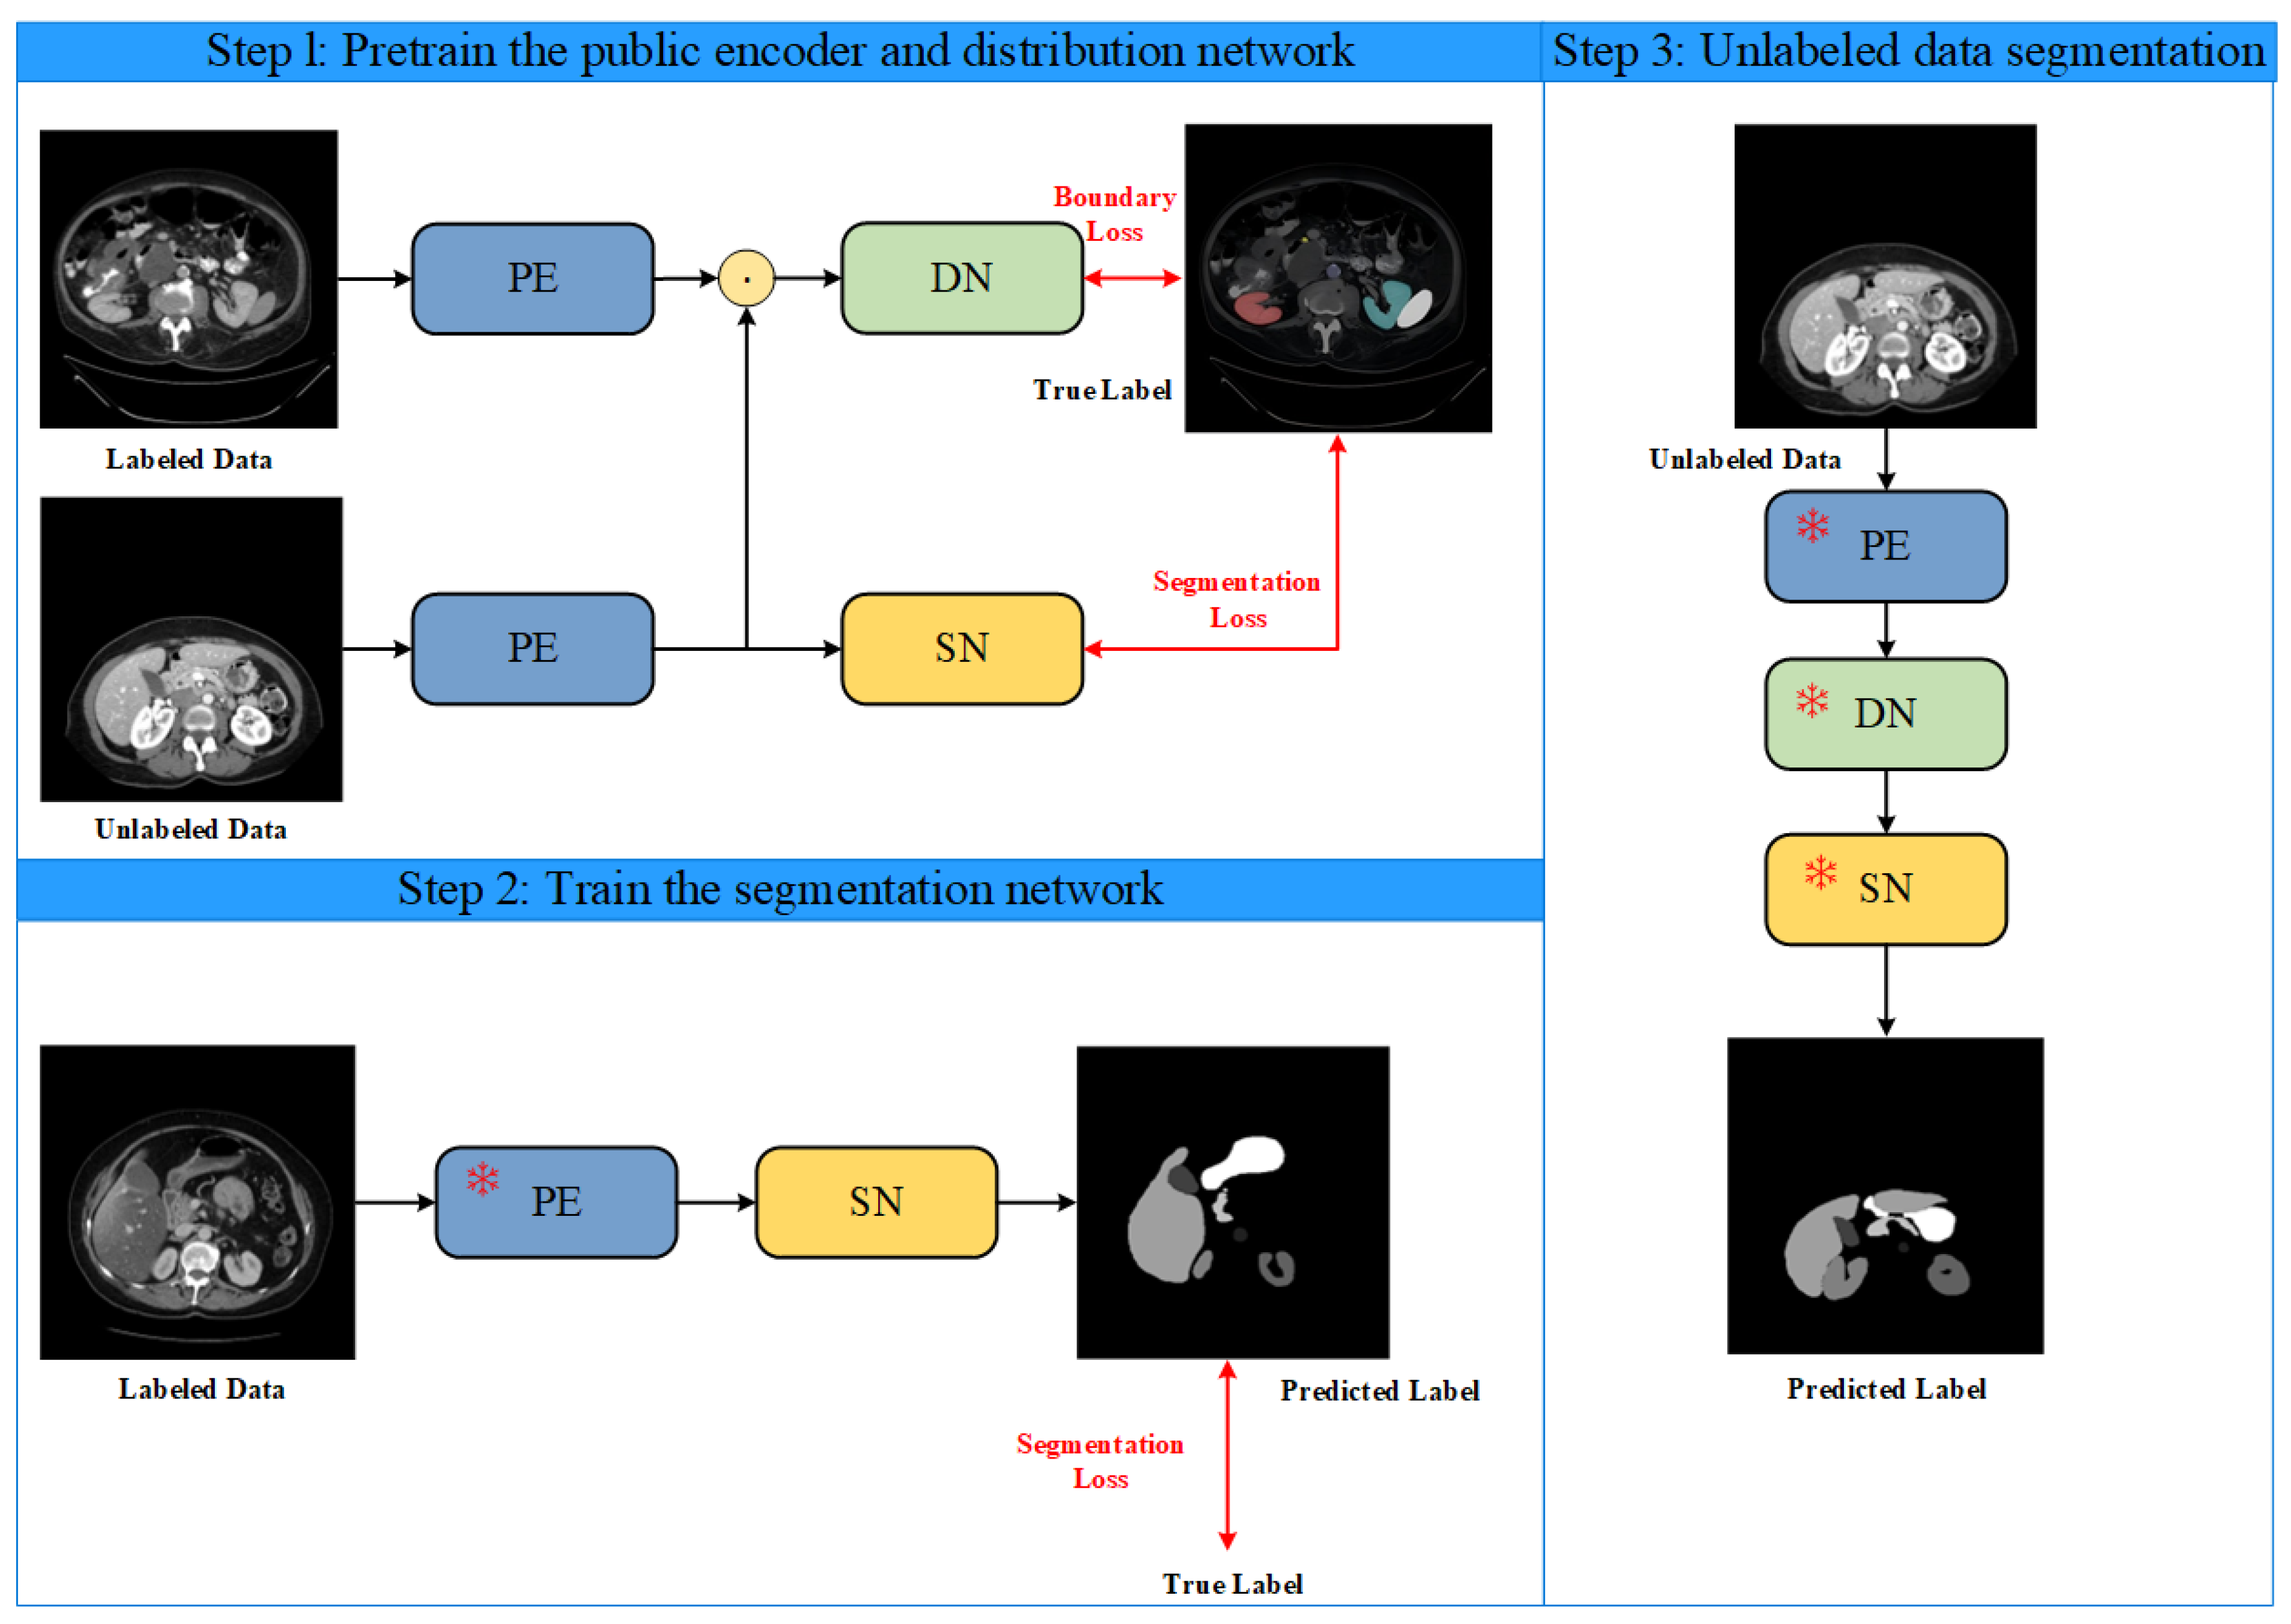
Figure 4.
Structure of the Segmentation Network.
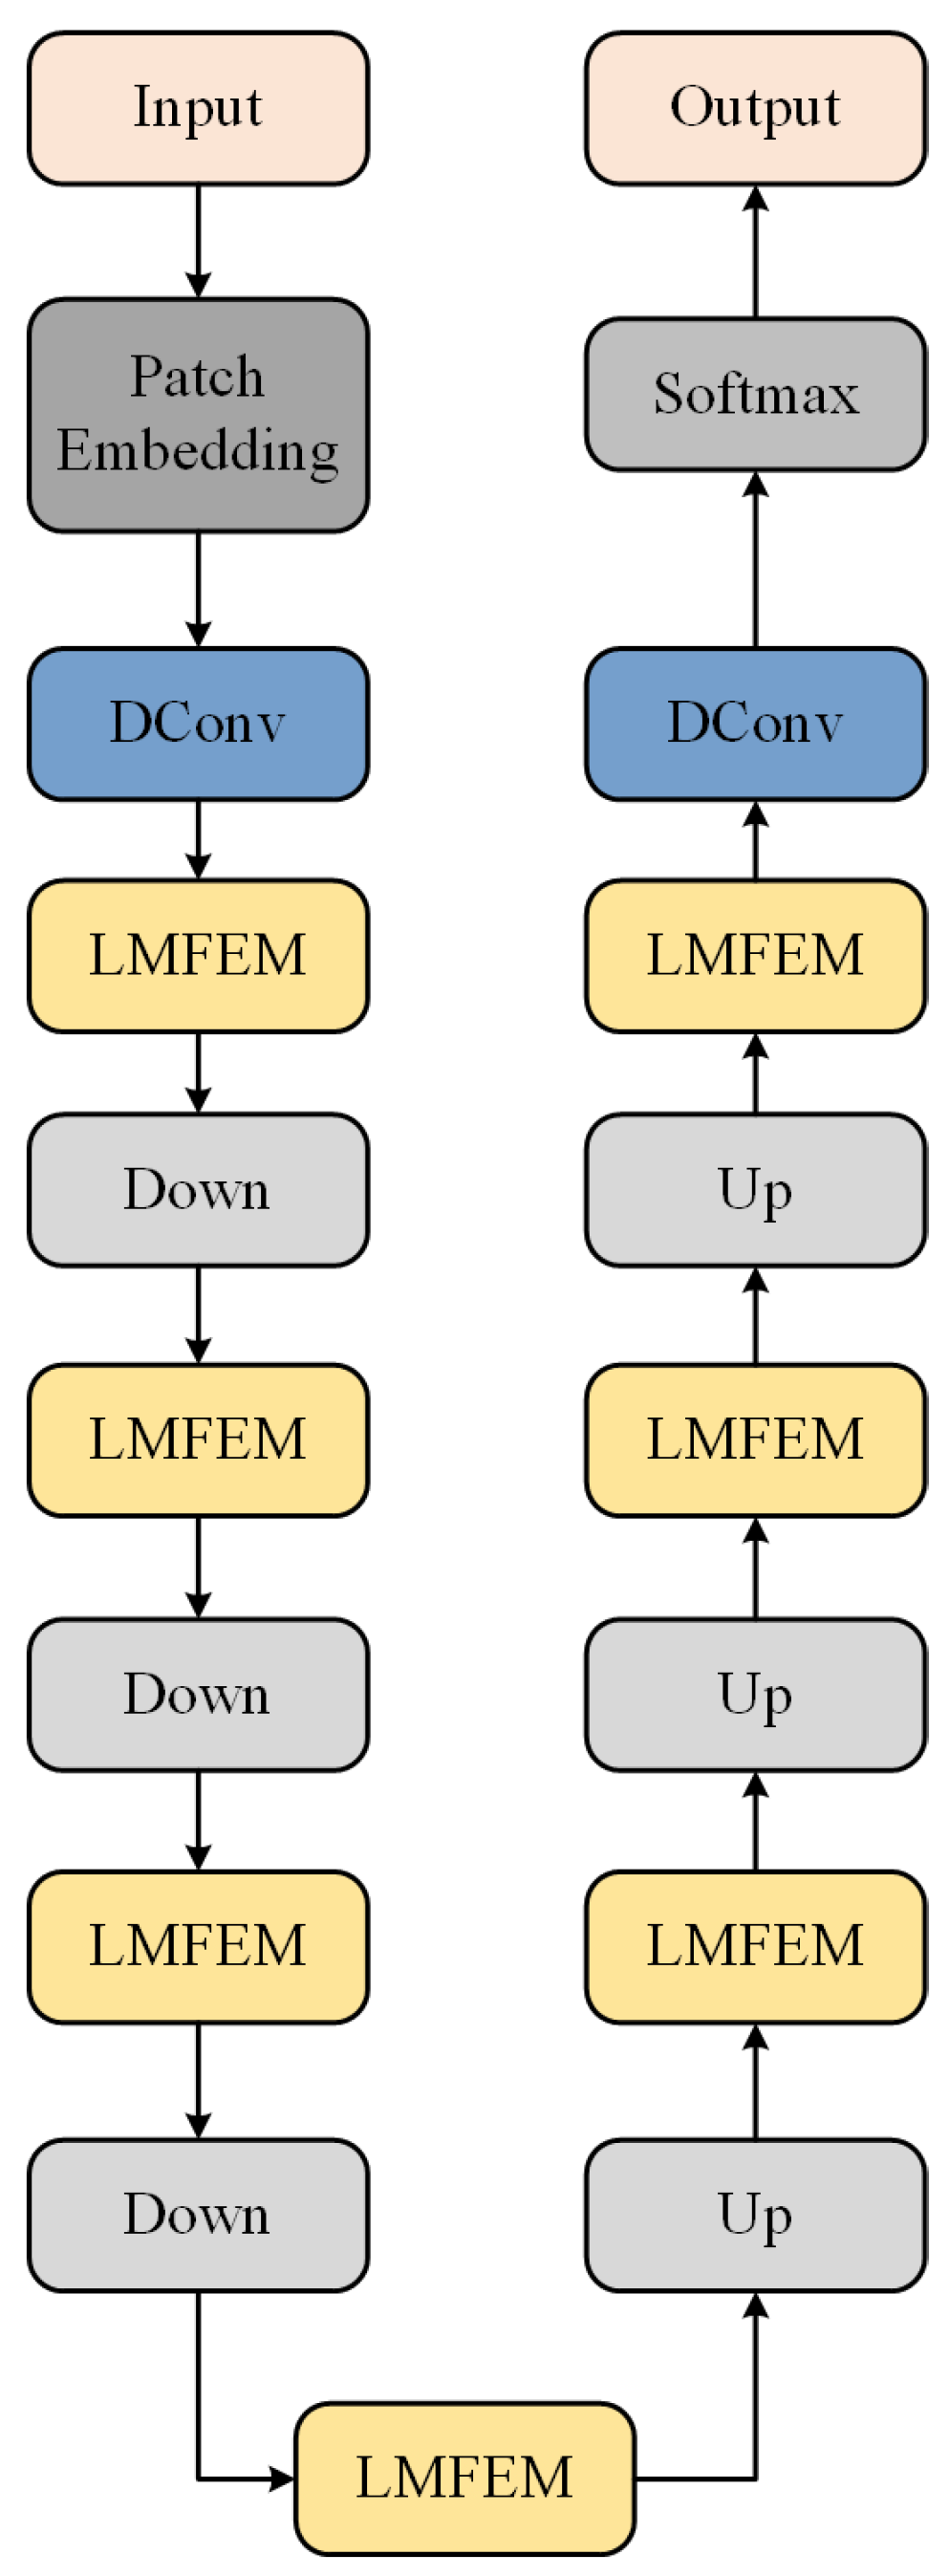
Figure 5.
Structure of the Segmentation Network.
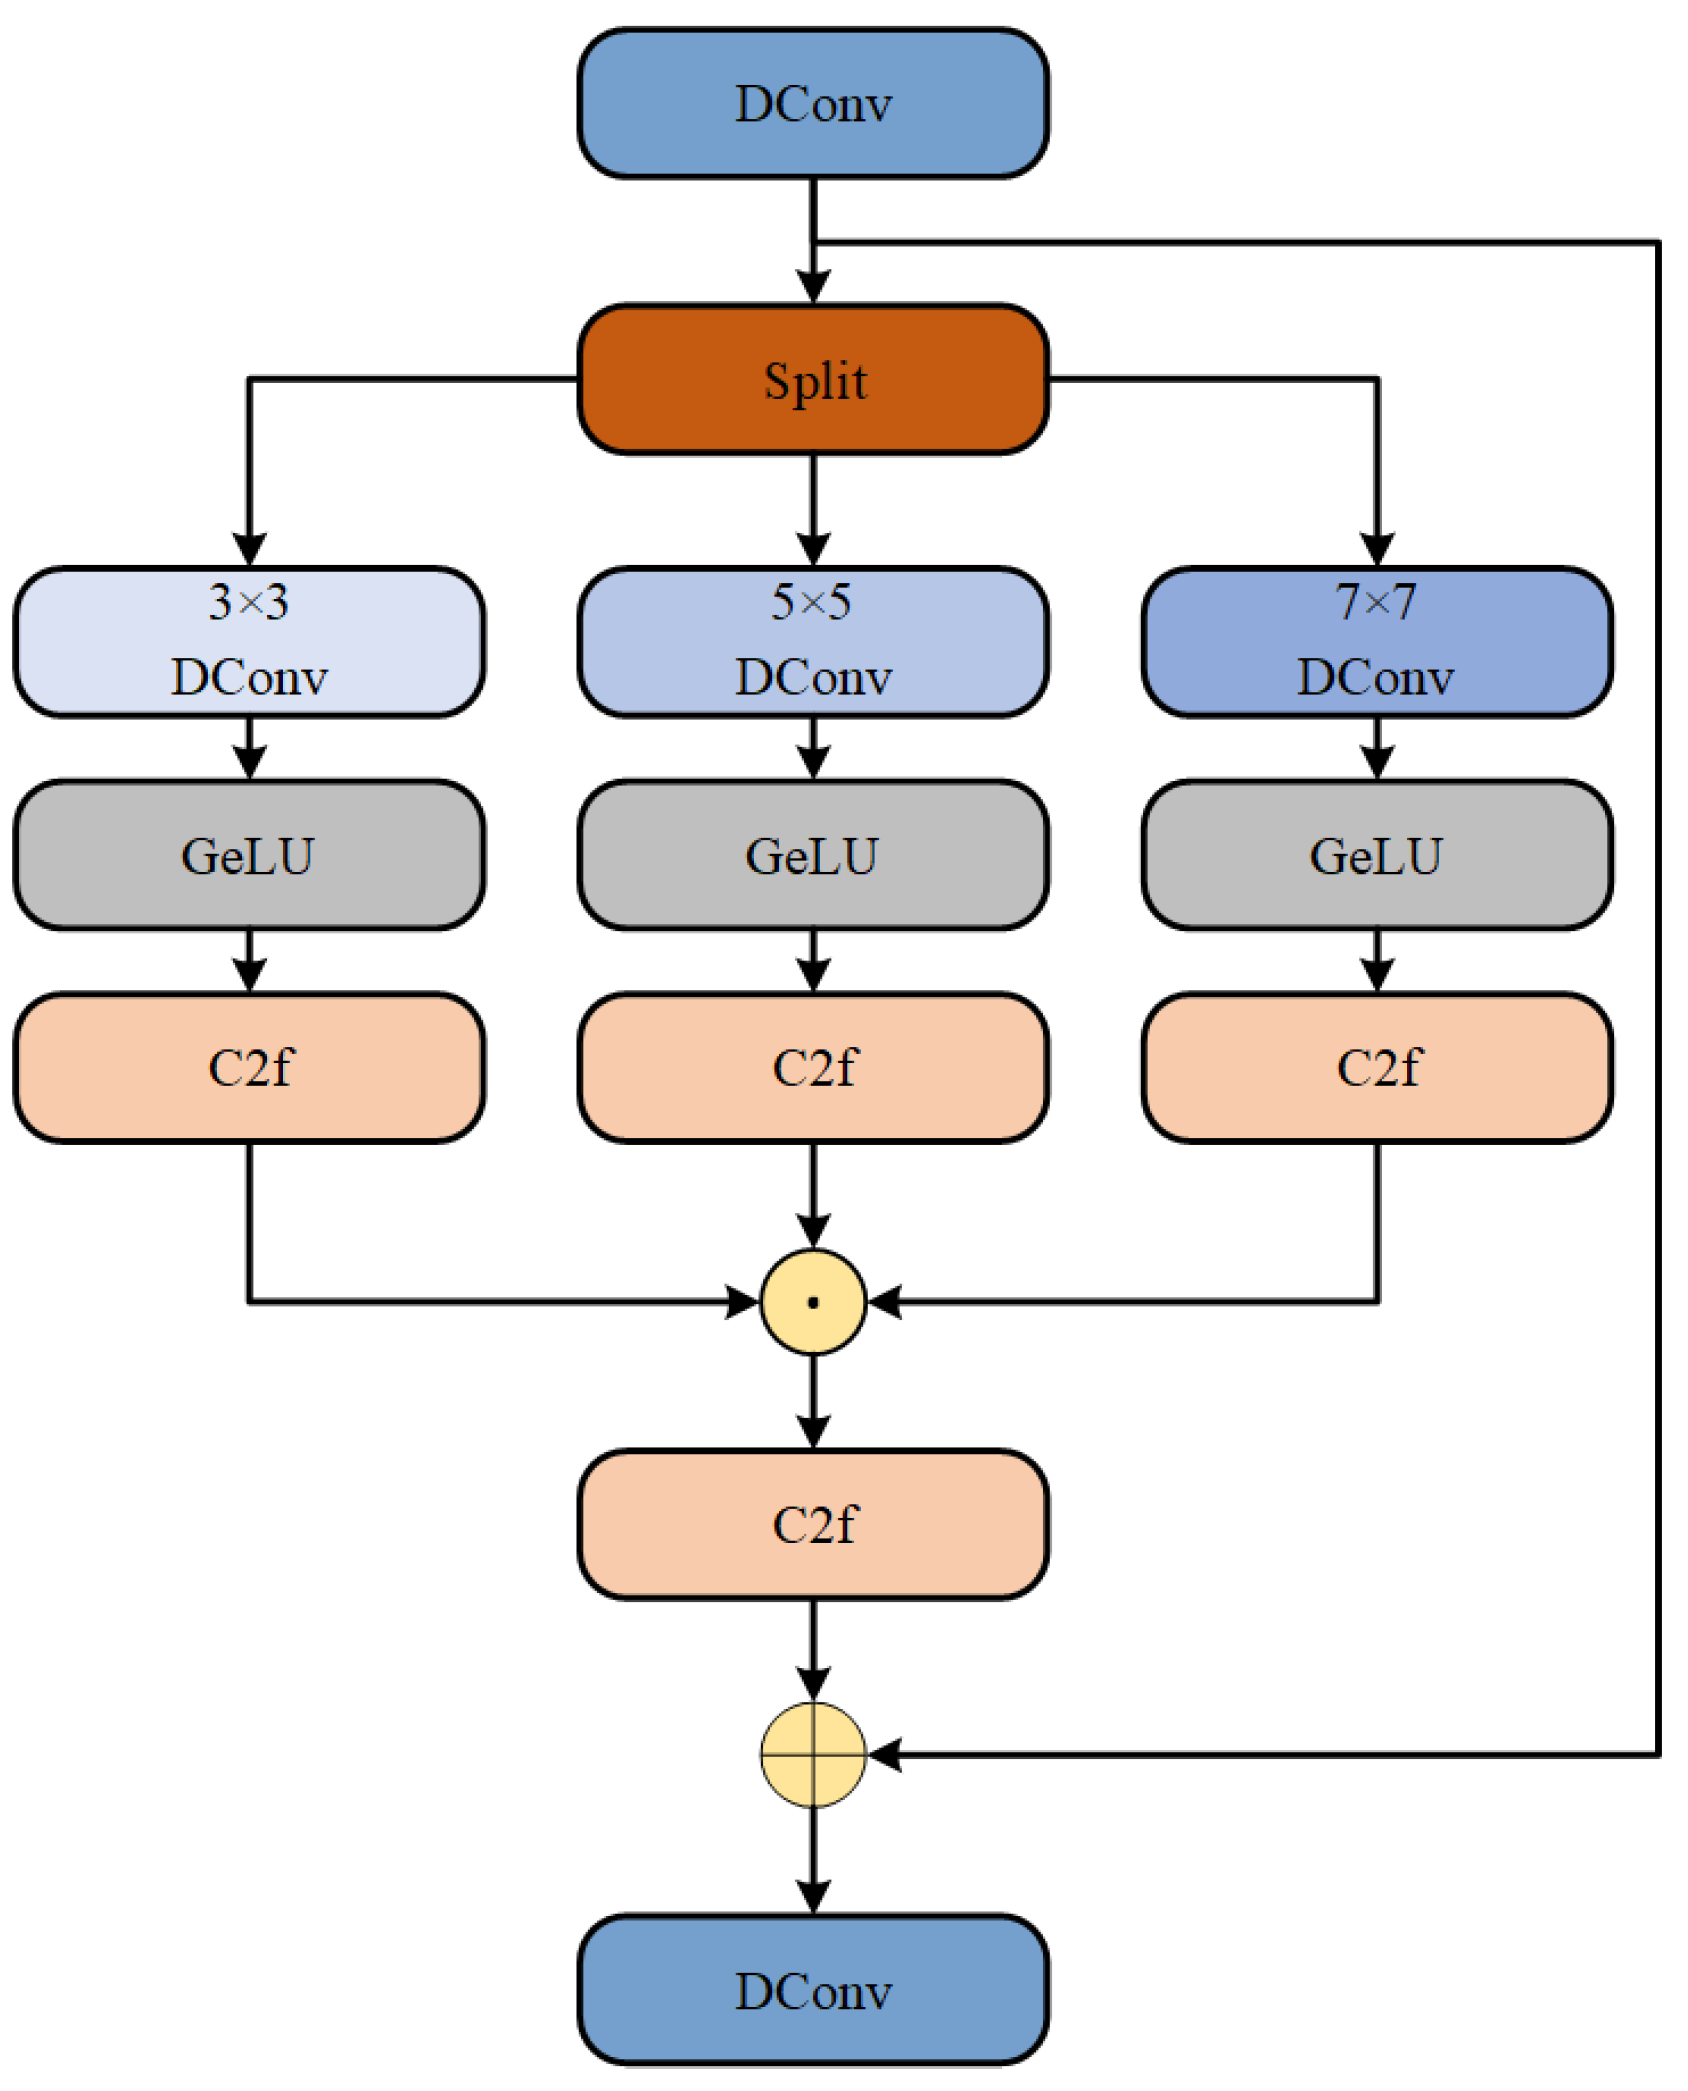
Figure 6.
Qualitative results of different methods on Synapse dataset.
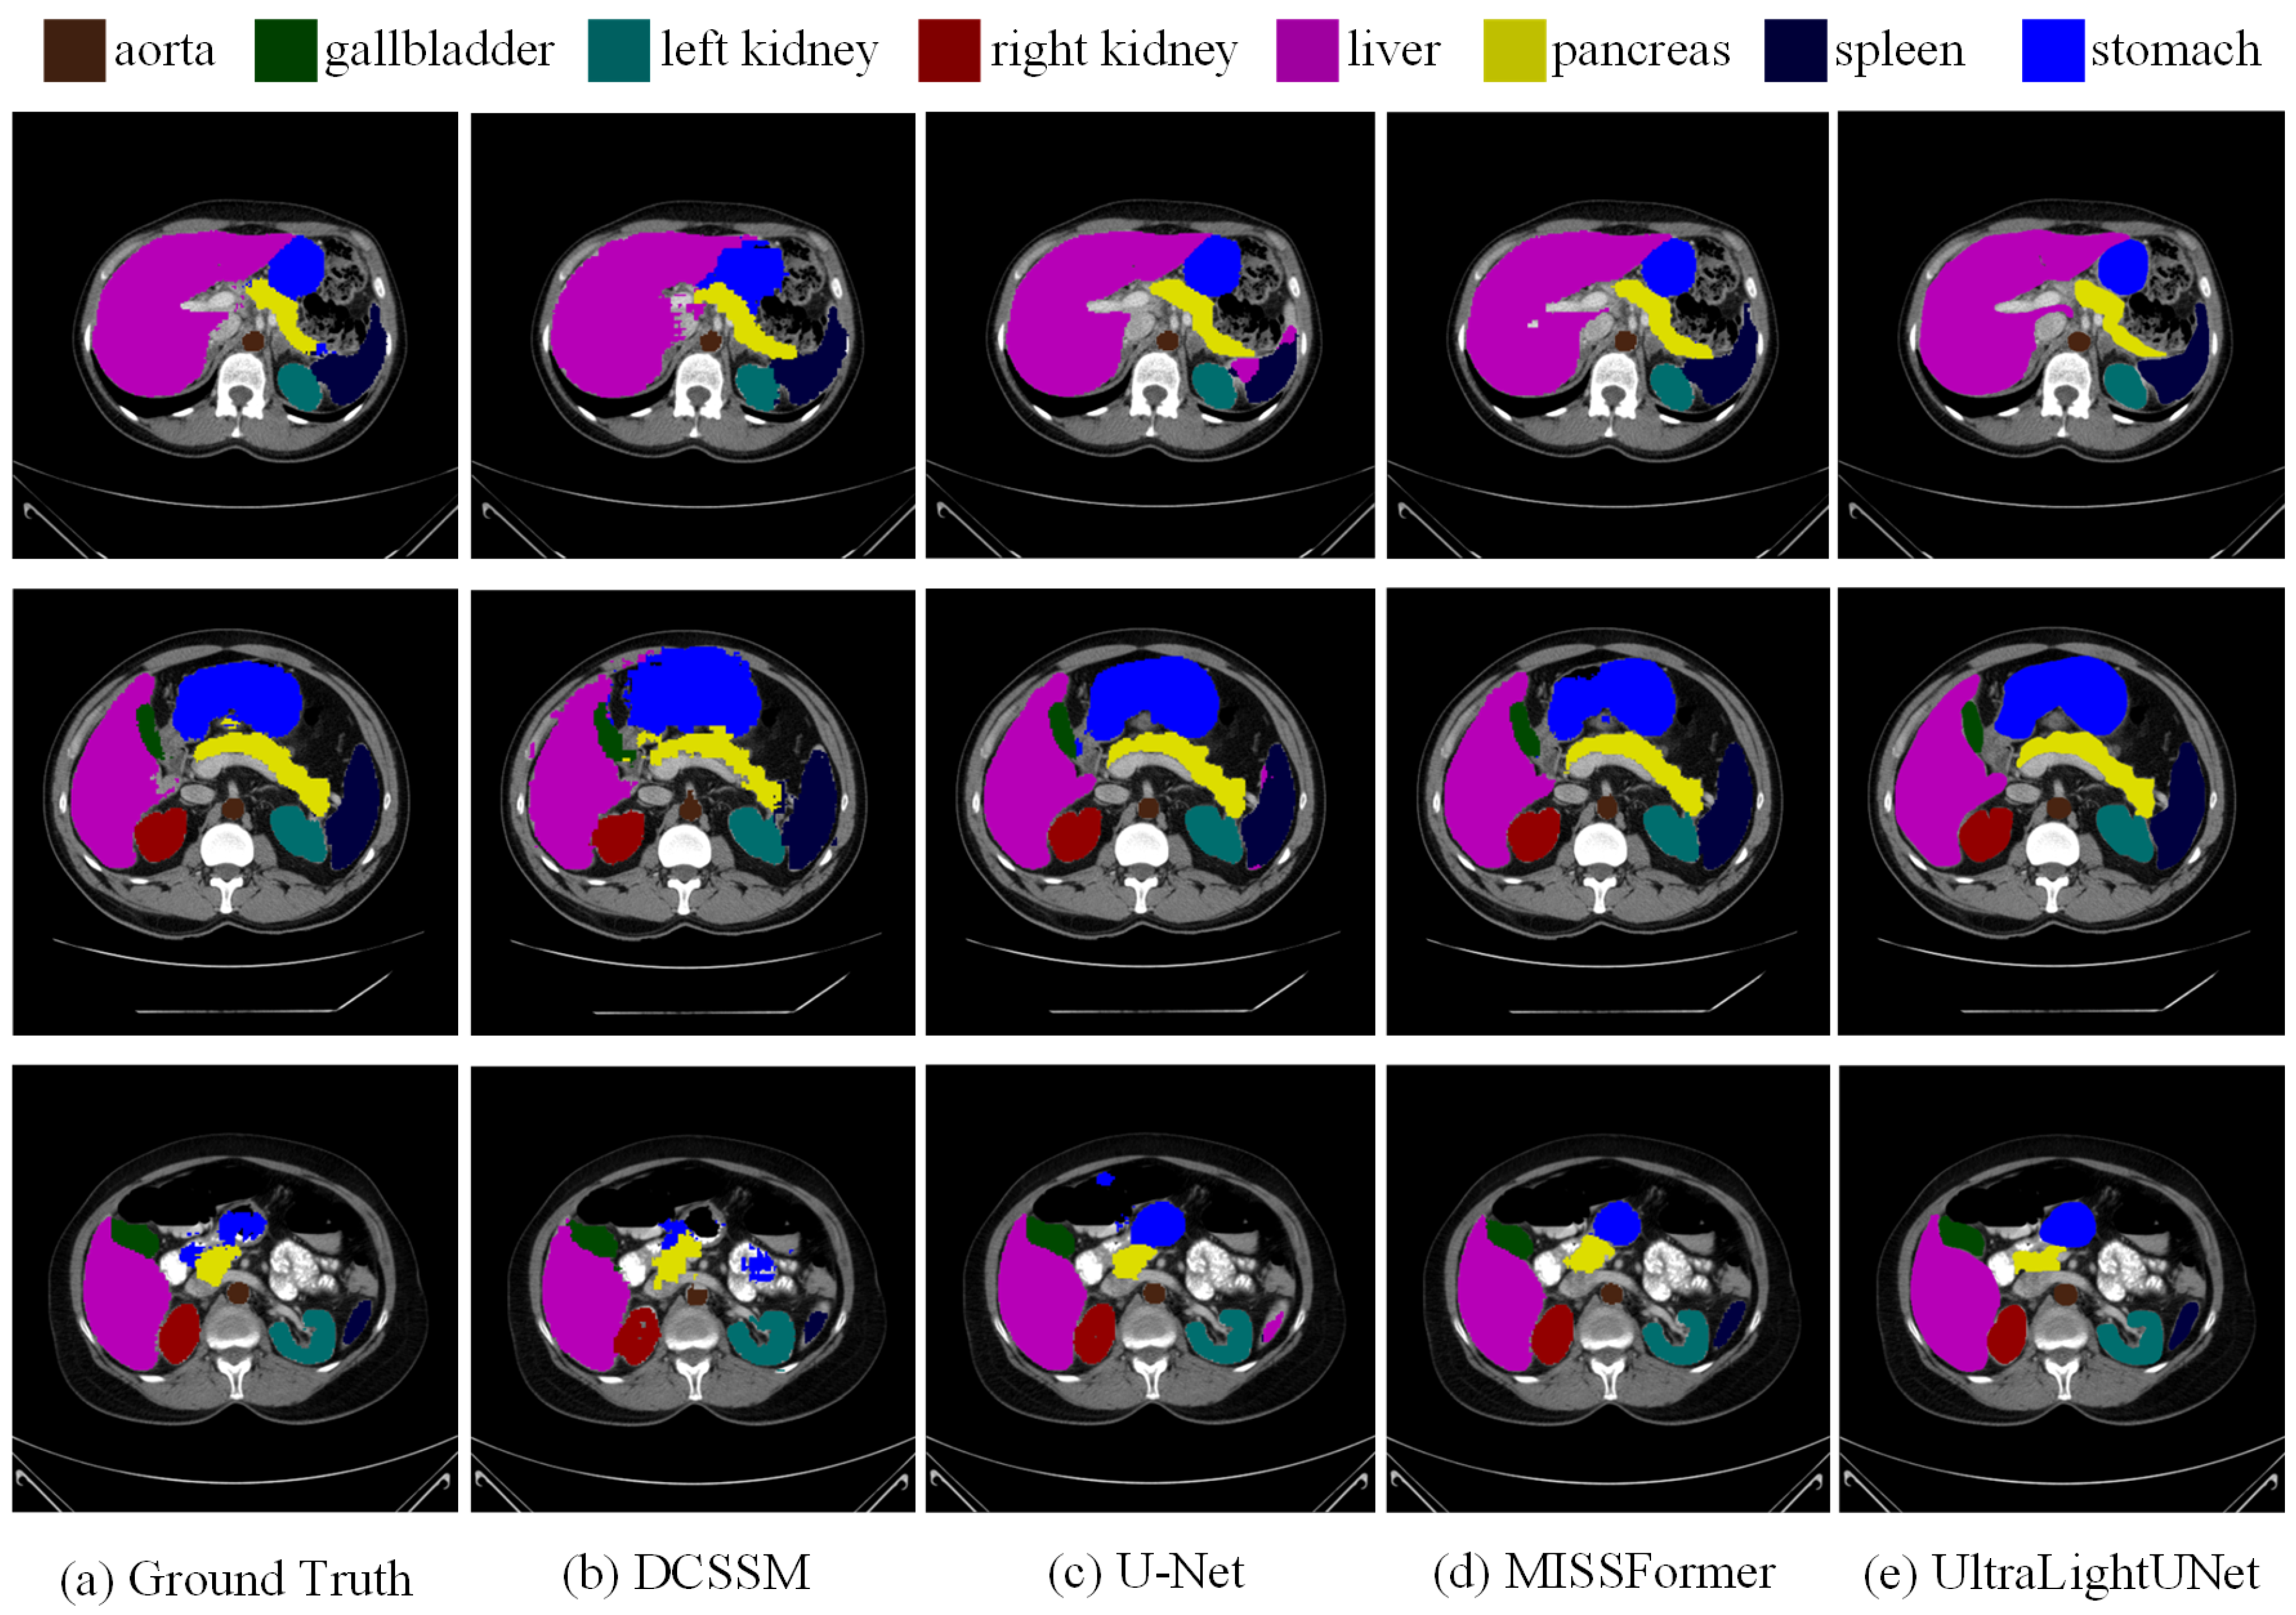
Figure 7.
Visual representations of proposed method on ISIC 2017 dataset. Ground truth boundaries are shown in green, and predicted boundaries are shown in red.
Figure 7.
Visual representations of proposed method on ISIC 2017 dataset. Ground truth boundaries are shown in green, and predicted boundaries are shown in red.
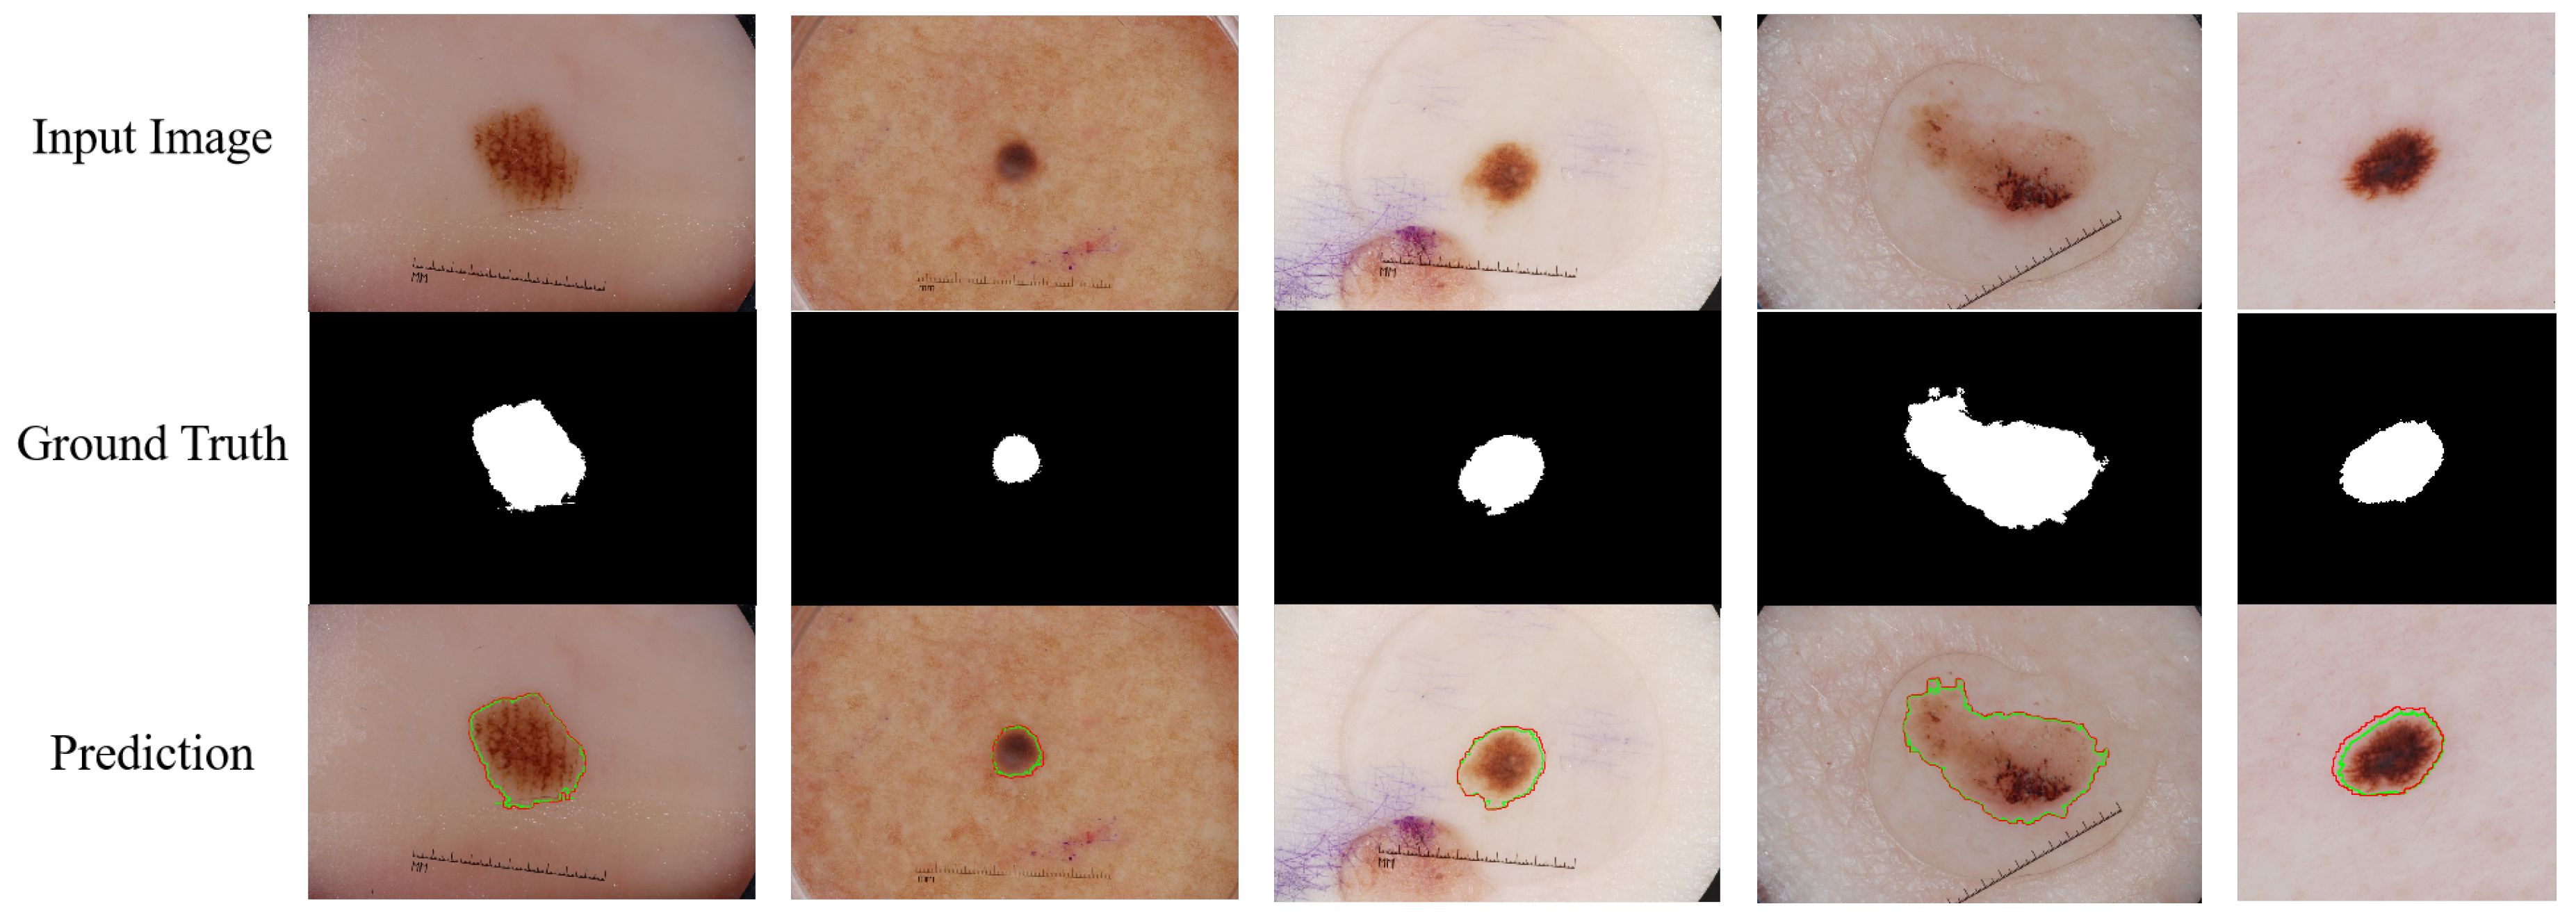

Table 1.
Quantitative comparison results of different methods on the Synapse dataset.
| Methods | DSC ↑ | HD↓ | DSC of each organ | |||||||
|---|---|---|---|---|---|---|---|---|---|---|
| Aorta | Gallbladder | Kidney(L) | Kidney(R) | Liver | Pancreas | Spleen | Stomach | |||
| DARR | 69.77 | - | 74.74 | 53.77 | 72.31 | 73.24 | 94.08 | 54.18 | 89.90 | 45.96 |
| R50-U-Net | 74.68 | 36.87 | 87.74 | 63.66 | 80.60 | 78.19 | 93.74 | 56.90 | 85.87 | 74.16 |
| U-Net | 76.85 | 39.70 | 89.07 | 69.72 | 77.77 | 68.60 | 93.43 | 53.98 | 86.67 | 75.58 |
| R50-Att.UNet | 75.57 | 36.97 | 55.92 | 63.91 | 79.20 | 72.71 | 93.56 | 49.37 | 87.19 | 74.95 |
| Att.UNet | 77.77 | 36.02 | 89.55 | 68.88 | 77.98 | 71.11 | 93.57 | 58.04 | 87.30 | 75.75 |
| MISSFormer | 81.96 | 18.20 | 86.99 | 68.65 | 85.21 | 82.00 | 94.41 | 65.67 | 91.92 | 80.81 |
| DeepLabv3 | 77.63 | 39.95 | 88.04 | 66.51 | 82.76 | 74.21 | 91.23 | 58.32 | 87.43 | 73.53 |
| TransDeepLab | 80.16 | 21.25 | 86.04 | 69.16 | 84.08 | 79.88 | 93.53 | 61.19 | 89.00 | 78.40 |
| HiFormer | 80.39 | 14.70 | 86.21 | 65.69 | 85.23 | 79.77 | 94.61 | 59.52 | 90.99 | 81.08 |
| UltraLightUNet | 82.43 | 17.46 | 88.96 | 72.30 | 86.08 | 80.88 | 94.98 | 65.12 | 91.94 | 79.19 |
| DCSSM | 82.89 | 18.98 | 90.01 | 72.01 | 88.89 | 83.11 | 95.02 | 67.93 | 91.25 | 79.38 |
Table 2.
Quantitative comparison results of different methods on ISIC 2017, ISIC 2018, and PH2 datasets.
Table 2.
Quantitative comparison results of different methods on ISIC 2017, ISIC 2018, and PH2 datasets.
| Methods | ISIC 2017 | ISIC 2018 | PH2 | |||||||||
|---|---|---|---|---|---|---|---|---|---|---|---|---|
| DSC | SE | SP | ACC | DSC | SE | SP | ACC | DSC | SE | SP | ACC | |
| U-Net | 0.8159 | 0.8172 | 0.9680 | 0.9164 | 0.8545 | 0.8800 | 0.9697 | 0.9667 | 0.8936 | 0.9125 | 0.9588 | 0.9233 |
| TransUNet | 0.8425 | 0.8383 | 0.9714 | 0.9227 | 0.8840 | 0.8734 | 0.9629 | 0.9324 | 0.9203 | 0.8945 | 0.9289 | 0.9276 |
| MCGUNet | 0.8927 | 0.8507 | 0.9755 | 0.9557 | 0.9053 | 0.8902 | 0.9657 | 0.9402 | 0.9203 | 0.9125 | 0.9276 | 0.9276 |
| Att-Unet | 0.8082 | 0.7998 | 0.9776 | 0.9145 | 0.8566 | 0.8674 | 0.9587 | 0.9145 | 0.9203 | 0.9125 | 0.9276 | 0.9276 |
| Swin-Unet | 0.9183 | 0.9142 | 0.9797 | 0.9548 | 0.9142 | 0.9044 | 0.9657 | 0.9364 | 0.9203 | 0.9125 | 0.9289 | 0.9276 |
| DAGAN | 0.8425 | 0.8363 | 0.9702 | 0.9216 | 0.8807 | 0.8779 | 0.9588 | 0.9324 | 0.9203 | 0.9031 | 0.9289 | 0.9276 |
| MedT | 0.8037 | 0.8640 | 0.9728 | 0.9193 | 0.8907 | 0.8546 | 0.9674 | 0.9242 | 0.9203 | 0.9065 | 0.9327 | 0.9276 |
| FAT-Net | 0.8500 | 0.8392 | 0.9725 | 0.9212 | 0.9021 | 0.8759 | 0.9587 | 0.9342 | 0.9203 | 0.9031 | 0.9289 | 0.9276 |
| TMU-Net | 0.9203 | 0.9011 | 0.9758 | 0.9532 | 0.9100 | 0.9021 | 0.9674 | 0.9342 | 0.9203 | 0.9268 | 0.9276 | 0.9276 |
| DeepLabv3 | 0.9126 | 0.8733 | 0.9791 | 0.9291 | 0.9101 | 0.9100 | 0.9639 | 0.9546 | 0.9203 | 0.9031 | 0.9678 | 0.9276 |
| HiFormer | 0.9253 | 0.9155 | 0.9830 | 0.9702 | 0.9102 | 0.9102 | 0.9119 | 0.9755 | 0.9460 | 0.9420 | 0.9722 | 0.9659 |
| DCSSM | 0.9321 | 0.9207 | 0.9824 | 0.9746 | 0.9113 | 0.9108 | 0.9106 | 0.9771 | 0.9483 | 0.9549 | 0.9728 | 0.9691 |
Table 3.
Ablation results of DCSSM on the Synapse dataset.
| Methods | DSC ↑ | HD↓ | DSC of each organ | |||||||
|---|---|---|---|---|---|---|---|---|---|---|
| Aorta | Gallbladder | Kidney(L) | Kidney(R) | Liver | Pancreas | Spleen | Stomach | |||
| CCMCM×0 | 81.27 | 20.73 | 88.72 | 66.73 | 86.25 | 83.28 | 93.82 | 67.61 | 90.92 | 76.62 |
| CCMCM×2 | 82.64 | 19.27 | 89.62 | 66.78 | 87.82 | 83.36 | 94.72 | 67.28 | 90.63 | 77.27 |
| CCMCM×3 | 82.80 | 19.45 | 89.72 | 66.15 | 87.66 | 81.37 | 94.32 | 63.34 | 90.44 | 77.14 |
| SN_dn×2 | 82.58 | 20.26 | 87.82 | 66.74 | 88.02 | 83.65 | 94.73 | 67.28 | 91.03 | 77.21 |
| SN_dn×4 | 82.79 | 21.24 | 89.17 | 66.89 | 87.76 | 83.33 | 94.53 | 65.53 | 91.21 | 77.31 |
| SN_dn×5 | 81.53 | 19.90 | 88.63 | 66.21 | 86.59 | 82.39 | 93.92 | 65.45 | 90.38 | 76.62 |
| DCSSM | 82.89 | 18.98 | 90.01 | 67.01 | 88.89 | 83.11 | 95.02 | 67.93 | 91.25 | 77.38 |
Disclaimer/Publisher’s Note: The statements, opinions and data contained in all publications are solely those of the individual author(s) and contributor(s) and not of MDPI and/or the editor(s). MDPI and/or the editor(s) disclaim responsibility for any injury to people or property resulting from any ideas, methods, instructions or products referred to in the content. |
© 2025 by the authors. Licensee MDPI, Basel, Switzerland. This article is an open access article distributed under the terms and conditions of the Creative Commons Attribution (CC BY) license (http://creativecommons.org/licenses/by/4.0/).
Copyright: This open access article is published under a Creative Commons CC BY 4.0 license, which permit the free download, distribution, and reuse, provided that the author and preprint are cited in any reuse.


