
Submitted:
17 March 2025
Posted:
19 March 2025
You are already at the latest version
Abstract
Antagonists of GHRH have experimental therapeutic value but as single agents are not likely to improve clinical outcomes, especially in advanced prostate cancer resistant to androgen deprivation therapy. Our objective is to identify anti-cancer drugs that in combination with MIA-602 or -690 GHRH antagonists increase cell death in all types of prostate cancer. We identified inhibitors of PI3Ka or PI3Kb that consistently increased cell death when combined with MIA-602/690. The PI3K family is critical in mediating upstream signals from receptors to downstream AKT/mTOR signaling pathways and has an important role in cancer progression. Results revealed that MIA-602/690 alone decreased androgen receptor and likely enhanced PI3K (negative feedback), which is then countered by addition of PI3K inhibitors. Furthermore, MIA-602/690 + PI3K inhibitor combination affected multiple signaling pathways, including apoptosis (anti-apoptotic Mcl-1L switch to pro-apoptotic Mcl-1S), proliferation (E2F1, cyclin A), PI3Ka/b, AKT, and ERK. Similar results were obtained with a more clinically relevant acetate salt form of MIA-602/690. Identification of PI3K as a drug target for prostate cancer is significant because PTEN (negative regulator of PI3K) loss of function occurs in 40-50% and PIK3CA mutation/amplification occurs in 60% of prostate cancer patients, leading to a poor prognosis. The ability of the MIA-602/690 + PI3K inhibitor combination to alter multiple signaling pathways may weaken the activation of adaptive mechanisms resulting from each drug and improve efficacy.
Keywords:
prostate cancer
; growth hormone-releasing hormone antagonist
; PI3K
; androgen receptor
; AKT
; ERK
; Mcl-1
1. Introduction
Prostate cancer (PCa) is initially responsive to androgen deprivation therapy (ADT) but can develop resistance, leading to the progression of castration resistant PCa (CRPC) [1,2]. New and more potent ADT drugs (e.g., androgen receptor [AR] antagonist enzalutamide) have been successfully used against CRPC; however, resistance eventually develops. A proposed mechanism of acquired resistance to ADT is an adaptive response where CRPC cells switch from being sensitive to the drug target (AR) to a CRPC cell type not dependent on the drug target (e.g., neuroendocrine PCa [NEPC]), reduction or loss of AR) [3,4,5]. There are no effective treatments for late stage advanced CRPC/NEPC resistant to current ADT strategies, suggesting new approaches are required [3,4,5].
A standard treatment for androgen sensitive PCa are gonadotropin-releasing hormone (GnRH) agonists such as goserelin and leuprolide, approved in the 1980s by the FDA [6]. This is based on the Nobel Prize discovery of Andrew Schally and others that hormones secreted from the hypothalamus stimulate the release of pituitary hormones (e.g., leutinizing hormone), which regulate androgen synthesis [7]. Since the 1990s, the Schally group has focused research on the role of growth hormone-releasing hormone (GHRH) in cancer, prompting efforts to develop synthetic antagonists of GHRH that can be used therapeutically [8]. GHRH is a neuropeptide secreted from the hypothalamus that regulates secretion of growth hormone (GH) from the pituitary, which then stimulates the liver to produce insulin growth factor 1 (IGF1), a potent mitogen for multiple cancers [9,10,11]. GHRH and its receptor GHRHR (member of the G protein-coupled receptor [GPCR] family) are also produced in multiple tissues and cancers to modulate cell proliferation and apoptosis, including PCa [9,10].
Early development of GHRH peptide antagonists improved upon pharmacokinetic properties, target binding, and anti-tumor effects [9,12]. More recently, the MIA series, especially MIA-602 and -690, have emerged as one of the most promising antagonists by binding to GHRH expressed on tumor cells, blocking GHRHR-mediated signaling pathways, and inhibiting tumor growth [13]. In PCa, GHRH peptide antagonists (including MIA-602) reduced growth of CRPC xenograft tumors, possibly by decreasing ERK and AKT signaling [14,15]. However, it is unlikely that the treatment of advanced CRPC/NEPC with GHRH antagonists as single agents will be sufficient for optimal efficacy. There are a few studies that have identified potential drugs that in combination with GHRH antagonists can improve efficacy, including DNA damaging agents (doxorubicin, 5-flourouracil, irinotecan, cisplatin), anti-mitotic docetaxel, and the EGFR inhibitor gefitinib [16,17,18,19,20,21]. We searched a series of anti-cancer drugs that in combination with MIA-602 or -690 GHRH antagonists increase PCa/CRPC/NEPC cell death.
In this report, we identified PI3K isoform inhibitors that when combined with MIA-602 or -690 can increase cell death in all types of PCa, including CRPC and NEPC. PI3K is a family of lipid kinases that are critical in mediating signals from receptor tyrosine kinase (RTK) and GPCR receptors to downstream AKT/mTOR signaling pathways [22]. Since loss of PTEN, a negative regulator of the PI3K pathway, occurs in 40% to 50% of patients with PCa and results in PI3K hyperactivation [23,24], there have been significant efforts to identify PI3K inhibitors that can improve efficacy [22,25,26,27]. Our results showed MIA-602 or -690 + PI3K isoform inhibitors altered multiple signaling pathways including apoptosis, proliferation, PI3Ka/b, AKT, ERK, and AR. Use of MIA-602 and -690 converted into a more clinically relevant acetate salt form had similar results. Overall, the MIA-602 or -690 + PI3K isoform inhibitor combination may improve therapeutic efficacy in PCa/CRPC/NEPC.
2. Materials and Methods
2.1. MIA-602 and MIA-690 GHRH Peptide Antagonists
GHRH antagonists MIA-602 (PhAc-Ada0, Tyr1, d-Arg2, 5FPhe6, Ala8, Har9, Tyr(Me)10, His11, Orn12, Abu15, His20, Orn21, Nle27, d-Arg28, Har29-NH2) and MIA-690 (PhAc-Ada0-Tyr1, d-Arg2, Cpa6, Ala8, Har9, 5FPhe10, His11, Orn12, Abu15, His20, Orn21, Nle27, d-Arg28, Har29-NH2) were synthesized and purified as previously described [13]. Changes from the bioactive wild type human GHRH (1-29) amino acid peptide are provided above. Dried preparations were resuspended in DMSO and small aliquots stored at ─20 °C. Abbreviations are as follows: PhAc, phenylacetate; Ada, 12-aminododecanoyl; 5FPhe, pentafluoro-phenylalanine; Har, homoarginine Tyr(Me), O-methyl-tyrosine; Orn, ornithine; Abu, alpha-aminobutanoyl; Nle, norleucine; and Cpa, 4-chloro-phenyalanine. Peptides were eluted from the resin with a solvent containing trifluoroacetic acid (TFA), which is not acceptable for human studies due to potential subcutaneous toxicity [28]. To remove residual TFA, peptides were passed through a carbonate ion-exchange resin column (VariPure IPE; Agilent, Santa Clara, CA, USA), diluted acetic acid added, and the samples lyophilized (referred to as MIA-602Ac [Ac, Acetate salt] and MIA-690Ac). GHRH antagonist activity was confirmed using the GH release assay in rats, as previously described [13].
2.2. Reagents
PI3K inhibitors alpelisib (PI3Ka), AZD8186 (PI3Kb/d), duvelisib (PI3Kd/g), AKT1-3 inhibitor AZD5363 (capivasertib), proteasome inhibitor ixazomib (MLN9708), mTOR inhibitor rapamycin were obtained from APExBIO (Houston, TX, USA); pan-PI3K inhibitor LY294002, NFkB inhibitor parthenolide from Sigma-Aldrich (St. Louis, MO, USA); anti-mitotic docetaxel, CDK inhibitor flavopiridol from Sanofi-Aventis (Bridgewater, NJ, USA); anti-mitotic cabazitaxel from LC Laboratories (Woburn, MA, USA); Bcl-2 inhibitor ABT-737 from Abbott Laboratories (Abbott Park, IL, USA); AR antagonist enzalutamide from Selleckchem (Houston, TX, USA); and Coomassie blue, trypan blue (0.4%) from Thermo Fisher Scientific (Waltham, MA, USA).
2.3. Cell Culture
Human AR+ androgen-sensitive PCa (LNCaP), AR+ CRPC (22Rv1), AR─ CRPC (PC3, DU145), AR─ NEPC (NCI-H660, LASCPC), and human non-cancer cells RWPE-1 (prostate epithelial) cells were obtained from the American Type Culture Collection (ATCC) and used within 6 months of resuscitation of original cultures. Molecular characteristics of PCa/CRPC/NEPC cell lines are summarized in Table 1. LNCaP, 22Rv1, PC3, and DU145 cells were maintained in RPMI 1640 medium (Thermo Fisher Scientific) and 5% fetal bovine serum (R&D Systems, Minneapolis, MN, USA). H660 and LASCPC cells were maintained in Advanced DMEM/F12, B27 supplement, Glutamax (Thermo Fisher Scientific), EGF, and bFGF (R&D Systems) [29,30]. RWPE-1 were maintained in Keratinocyte-SFM media (Thermo Fisher Scientific). All cells were grown with 100 U/ml penicillin, 100 μg/ml streptomycin, and 0.25 μg/ml amphotericin (Thermo Fisher Scientific).
2.4. Drug Treatments
Cells were cultured in media containing MIA-602, MIA-690 (5 mM, TFA and Ac forms), alpelisib (10 mM), AZD8186 (0.025-10 mM), duvelisib (10 mM), capivasertib (0.025-10 mM), docetaxel (0.25-1 nM), ABT-737 (1 mM), LY294002 (10 mM), cabazitaxel (1 nM), flavopiridol (100 nM), ixazomib (50 nM), rapamycin (0.05 nM), and parthenolide (0.5 mM). In all the experiments, floating and trypsinized attached cells were pooled for further analysis.
2.5. Trypan Blue Exclusion Assay to Measure Total Cell Death
Treated and control cells were harvested, resuspended in PBS, diluted 1:1 in 0.4% trypan blue, dead blue and live non-blue cells immediately counted using a hemacytometer, and the % dead blue cells determined from at least 2-3 independent experiments done in triplicate.
2.6. Cell Viability Assay and Determination of Synergy Combination Index (CI)
The CellTiter Aqueous colorimetric method from Promega (Madison, WI, USA) was used to determine cell viability of LNCaP and PC3 cells in media containing MIA-602/690 (TFA, Ac; 1, 2.5, 5 mM), alpelisib (1, 2.5, 5 mM), AZD8186 (5, 25 nM), or control (0.1% DMSO). Cell viability was normalized against DMSO control and the data expressed as a percentage of control from three independent experiments done in triplicate. Whether drug interactions were synergistic, additive, or antagonistic was determined using the CalcuSyn Version 2 software program from Biosoft (Cambridge, UK). This program is no longer available from Biosoft. CI ≤0.7 was synergistic.
2.7. Western Blot Analysis
Preparation of total protein lysates and western blot analysis was done as previously described [31]. The following antibodies were used: GHRHR (28692) from Abcam (Waltham, MA, USA); PI3Ka (C73F8), PI3Kb (C33D4), cl-PARP (9541), phospho (P)-AKT (Ser473; 587F11), AKT (9272), ERK1/2 (9102), P-ERK1/2 (9101) from Cell Signaling Technology (Danvers, MA, USA); and Mcl-1 (S-19), AR (441), cyclin A (H432), E2F1 (KH59), mouse anti-rabbit IgG-HRP (2357), m-IgG-Fc BP-HRP (525409) from Santa Cruz Biotechnology (Santa Cruz, CA, USA). Precision Plus Protein Dual Color Standards (Bio-Rad Laboratories, Hercules, CA, USA) was used to estimate molecular weights in kDa. Markers were used to cut blots in horizontal strips so high, medium, and low molecular weight targets could be analyzed separately with the appropriate antibodies. In some cases, after analysis, the strips were pretreated with methanol for 1 min, washed, treated with Ponceau S Staining Solution (Thermo Fisher Scientific) for 15 min to strip the antibody signal, and analyzed with a different antibody. After immunodetection, our preference for loading controls was staining of total proteins transferred to the membrane with Coomassie blue because drug treatments often affect the levels of typical housekeeping proteins such as actin or tubulin. Blot images were cropped for clarity of the presentation. Quantification of protein bands from images (Chem Doc MP Imaging System, BioRad Laboratories) was done using the UN-SCAN-IT digitizing software from Silk Scientific (Provo, UT, USA) (normalized to protein signal from Coomassie blue stain).
2.8. Statistics
Statistical differences between drug-treated and control cells were determined by two-tailed Student’s t-test (unequal variance) from 2-3 independent experiments done in duplicate or triplicate with P<0.05 considered significant. The experimental data was presented as mean ± standard deviation.
3. Results
3.1. Database Analysis of GHRHR and GHRH mRNA Expression in PCa
Since GHRHR and its ligand GHRH are expressed together in PCa specimens and likely stimulate proliferation [32], we analyzed their mRNA expression using known databases. In the Oncomine cancer microarray database (shut down January 17, 2022), GHRHR mRNA had a 1.65-fold higher expression in PCa compared to normal tissue (Figure 1A; LaTulippe Prostate Statistics). Interestingly, GHRHR expression appeared to be higher in metastatic compared to primary PCa and the location of higher GHRHR metastasis appeared to be at soft tissue compared to bone (Figure 1A). This observation requires further rigorous investigation to confirm or refute. In the Gene Expression Profiling Interactive Analysis database (gepia.cancer-pku.cn), GHRHR mRNA also appeared to be slightly higher in PCa compared to normal tissue (Figure 1B). However, there was no statistical difference in low vs. high GHRHR expression in relation to disease free survival (Figure 1B). In the OncoDB database (oncodb.org), GHRH expression was slightly higher in PCa compared to normal tissue (P=0.037) (Figure 1C). Overall, results from databases support higher expression of GHRHR and GHRH mRNA in PCa, although the differences are small.
3.2. Searching for a Drug Combination with MIA-602 and MIA-690 GHRH Antagonist Peptides to Increase Cell Death in PCa/CRPC/NEPC
Since GHRHR is expressed in PCa, the addition of GHRH antagonists should block key signals important for proliferation and survival. Results indicated the different sensitivities of PCa/CRPC/NEPC cells to MIA-602 and -690 (Figure 2). AR expressing LNCaP and 22Rv1 had greater cell death compared to CRPC PC3 and DU145, whereas NEPC cells H660 and LASCPC appeared to have some sensitivity to MIA-602 and -690. However, it is likely that the treatment of PCa/CRPC/NEPC with GHRH antagonists as single agents will not be sufficient for optimal efficacy.
We searched a series of anti-cancer drugs that in combination with GHRH antagonists can increase PCa/CRPC/NEPC cell death. Combination of the anti-mitotic docetaxel + MIA-602 or -690 increased cell death in LNCaP, 22Rv1, and PC3, supporting previous results (Figure 3A) [17]. However, the second-generation anti-mitotic cabazitaxel + MIA-602 or -690 did not enhance cell death in LNCaP (Supplementary Figure S1). Similarly, combination of the Bcl-2 inhibitor ABT-737, CDK inhibitor flavopiridol, and the proteasome inhibitor ixazomib + MIA-602 or -690 did not consistently enhance cell death in LNCaP, 22Rv1, and PC3 (Figure 3B and Supplementary Figure S1). However, combination of the pan-PI3K inhibitor LY294002 + MIA-602 or -690 consistently increased cell death in LNCaP, 22Rv1, and PC3 (Figure 3C).
3.3. PI3Ka or b Isoform Inhibitors + MIA-602 or -690 Increases Cell Death in PCa/CRPC/NEPC
Since LY294002 is a laboratory tool and cannot be used clinically, we identified PI3K isoform inhibitors that are FDA approved or in clinical studies that can be combined with MIA-602 or -690 [22,25,26,27]. In LNCaP and DU145, the PI3Kb inhibitor AZD8186 (PI3Kbi) but not the PI3Ka inhibitor alpelisib (PI3Kai) + MIA-602 or -690 was more effective at increasing cell death (Figure 4A,B). In contrast, PI3Kai + MIA-602 or -690 was more effective in 22Rv1 and PC3 at increasing cell death (Figure 4A, B). In NEPC cells, PI3Kai was more effective in H660 whereas both PI3Kai and PI3Kbi increased MIA-602 or -690 cell death in LASCPC (Figure 4C). The PI3Kd/g inhibitor duvelisib did not increase cell death + MIA-602 or -690 in DU145, H660, and LASCPC (Supplementary Figure S2).
The AKT1-3 inhibitor AZD5363 (capivasertib) or the mTOR inhibitor rapamycin (both are downstream mediators of PI3K signaling [22,25,26,27]), had little or no effect at increasing cell death + MIA-602 or -690 in DU145, H660, and LASCPC (Supplementary Figure S3 and S4). Similarly, the NFkB inhibitor parthenolide did not increase MIA-602 or -690 cell death in LASCPC (Supplementary Figure S4). Overall, we identified isoform inhibitors of PI3Ka or b as the best combination with MIA-602 or -690 that can increase cell death in PCa/CRPC/NEPC cells.
3.4. MIA-602/690 Alone and + PI3K Inhibitors Alters Multiple Signaling Pathways and AR Expression
The molecular characteristics of the PCa/CRPC/NEPC cell lines used in this study are summarized in Table 1. The negative regulator of PI3K signaling, PTEN, is mutated/deleted in LNCaP, PC3, and H660 [33,34], resulting in constitutively active (ca) AKT signaling. When PTEN activity appears normal, as in 22Rv1 and DU145 [33,35], basal AKT signaling is low. The LASCPC NEPC cells were derived from overexpression of N-Myc and AKT myristoylated (ca AKT signaling) [29].
Western blot analysis indicated MIA-602 + PI3Kai decreased PI3Ka and PI3Kb whereas MIA-602 alone decreased PI3Ka in 22Rv1 and PC3 (Figure 5A). MIA-602 + PI3Kai decreased AKT in 22Rv1 and PC3 and increased P-AKT in PC3 (24h, not at 72h). Changes in ERK (RTKs often cross-talk with GHRHR signaling [36,37]) were noted: 1) MIA-602 decreased P-ERK in 22Rv1 at 72h (counters increased P-ERK with PI3Kai); 2) MIA-602 alone and MIA-602 + PI3Kai decreased total ERK in 22Rv1 (72h); and 3) switch from P-ERK1 to P-ERK2 with MIA-602 and MIA-602 + PI3Kai in PC3 (24, 72h). No clear differences were noted in GHRHR and cl-PARP.
In LNCaP, MIA-602/690 alone and MIA-602/690 + PI3Kbi decreased Mcl-1L (anti-apoptosis) and increased Mcl-1S (pro-apoptosis); however, no clear difference in apoptosis marker cl-PARP were noted (Figure 5B). PI3Kbi alone and MIA-602/690 + PI3Kbi decreased proliferation markers E2F1 and cyclin A. The decrease in PI3Ka and PI3Kb was stronger in MIA-690 + PI3Kbi. Decreased P/T-AKT was stronger with PI3Kbi alone and MIA-602/690 + PI3Kbi. Interestingly, AR was strongly decreased with MIA-602/690 alone.
Treatment of LNCaP with MIA-602/690 alone over time (4-72h) resulted in similar effects on Mcl1L, Mcl1S, and AR (Figure 5C). There was a rapid and sustained decrease in PI3Ka and PI3Kb (4h) and decreased P-AKT occurred by 24h. No clear differences were noted in GHRHR.
A comparison of PI3Ka and PI3Kb protein levels in non-treated cells revealed that 1) PI3Ka is highest in PC3 and 22Rv1; and 2) PI3Kb is highest in LNCaP (Supplementary Figure S5). Although correlative, these results may provide information why PC3 and 22Rv1 respond better to PI3Kai and LNCaP responds better to PI3Kbi.
Overall, these results suggest MIA-602/690 alone and in combination with PI3Ka or b isoform inhibitors altered multiple signaling pathways including apoptosis, proliferation, PI3Ka/b, AKT, ERK, and AR.
3.5. Testing MIA-602 and -690 Acetate Salt (Ac) Form for Future Clinical Applications
To prepare for clinical application, MIA-602 and -690 were converted from TFA to an Ac salt form to reduce potential toxicity from subcutaneous injection (see methods for description). A comparison revealed that MIA-602Ac and -690Ac were better at increasing cell death in 22Rv1 compared to MIA-602/690TFA (Supplementarty Figure S6). In LNCaP and 22Rv1, MIA-602Ac and -690Ac increased cell death when combined with PI3Kbi or PI3Kai, similar to results with MIA-602/690 in the TFA form (Figure 6A). Cell viability assay revealed that MIA-602/690 alone (Ac or TFA form) had little or modest effects in LNCaP and PC3 (Supplementary Figure S7A). Calcusyn analysis of cell viability assays revealed that MIA-602Ac and -690Ac + PI3Kai or PI3Kbi synergistically inhibited LNCaP and PC3 proliferation (CI<0.4 for PC3) (Supplementary Figure S7B). Similar results were obtained with MIA-602/690TFA + PI3Kai or PI3Kbi (not shown).
Western blot analysis in LNCaP indicated that MIA-602Ac/690Ac + PI3Kbi increased cl-PARP better than either alone (24, 48h), which differed from MIA-602/690 in TFA form (Figure 6B). MIA-602Ac/690Ac effects on Mcl-1L and Mcl-1S were similar but not as strong as with TFA forms. There were some similarities with MIA-602Ac/690Ac effects on E2F1, cyclin A (proliferation), and AR. Stronger effects of MIA-690Ac on reducing GHRHR (24h) were noted and ERK was increased by PI3Kbi. Similar results were obtained in 22Rv1 with the MIA-602Ac/690Ac + PI3Kai combination but with MIA-690Ac demonstrating stronger effects (Figure 6C).
Overall, these results indicated that the process of converting MIA-602 and -690 from the TFA to the Ac salt form did not affect its activity. In addition, MIA-602Ac also had a similar anti-tumor activity in H460 non-small cell lung cancer xenograft (not shown). Thus, application of MIA602Ac and -690Ac for future clinical studies can proceed.
3.6. AR Antagonist Enzalutamide + MIA-602 or -690 has No Effect
Because of the unexpected result that MIA-602 and -690 greatly reduced AR in LNCaP and 22Rv1 (Figure 5B, C and Figure 6B, C), we investigated whether adding the AR antagonist enzalutamide can improve efficacy. Results indicated that enzalutamide did not enhance cell death mediated by MIA-602/690 in LNCaP (Supplementary Figure S8). The likely reason is that enzalutamide increased the AKT signaling pathway, which is known to negatively regulate AR signaling pathway [38,39]. Therefore, we predict MIA-602 or -690 + enzalutamide will not prove to be an effective combination.
4. Discussion
There is clear evidence in cell line and mouse models of PCa that targeting GHRH with peptide antagonist provides some anti-cancer efficacy [14,15]. However, it is unlikely GHRH antagonists such as MIA-602 or -690 will provide optimal therapeutic benefit as single agents, especially for advanced CRPC/NEPC. Our data identified clinically relevant PI3K isoform inhibitors (alpelisib [PI3Kai]; AZD8186 [PI3Kbi]) + MIA-602 or -690 as a novel strategy for treatment of PCa/CRPC/NEPC. We suggest that these combinations alter multiple signaling pathways including apoptosis, proliferation, PI3Ka/b, AKT, ERK, and AR to amplify effects on cell death.
MIA-602 and -690 are potent inhibitors of GHRHR signaling in multiple cancers but with weaker effects on GH/IGF-1 release, suggesting an important autocrine mechanism [8,13]. Using MIA-602 and -690 as single agents, our results revealed some pro-cell death effects in androgen sensitive PCa (LNCaP) and CRPC (22Rv1) but not in PC3/DU145 CRPC (no AR); there were some effects on NEPC H660 and LASCPC (Figure 2). There is a suggestion that since MIA-690 blocks GHRH-mediated increase in NE differentiation of LNCaP, use in NEPC therapy should be considered [40]. Overall, the effects of MIA-602/690 as single agents were minor, prompting us to search for a drug combination that can increase cell death.
Previous data showed effects of GHRH antagonists on Twist/N-cadherin, NFkB, JAK2/STAT3, AKT, and ERK, suggesting multiple signaling pathways are altered [10,14,36,37,41,42,43]. Our data in PCa/CRPC is supportive of MIA-602/690 altering multiple signaling pathways. New data not previously reported were the effects on switching anti-apoptotic Mcl-1L to pro-apoptotic Mcl-1S [44] and decreased AR, E2F1, cyclin A, PI3Ka/b. The mechanisms of how MIA-602/690 as single agents can alter individual proteins in multiple signaling pathways requires further investigation.
Our data revealed that adding PI3K isoform inhibitors to MIA-602/690 increased cell death in all types of PCa, including CRPC and NEPC (Figure 4). No other drug combination provided as consistent an increase on cell death as with PI3K inhibitors. PIK3CA is one of the most frequently mutated oncogenes in cancer and therefore provides a strong candidate for drug development and targeting [45]. In fact, PIK3CA mutation/ amplification correlates with poor survival and occurs in ~60% of PCa patients [46]. There is a suggestion in PTEN deficient PCa that PI3Ka activity is suppressed and PI3Kb drives PI3K signaling [47]. However, our data suggested that sensitivity to PI3K isoform inhibitors + MIA-602/690 may depend on PI3Ka or PI3Kb protein levels rather than PTEN status (Table 1 and Supplementary Figure S5 [48]).
Identification and development of PI3K isoform inhibitors has been prompted by the clinical observation that pan-PI3K inhibitors results in intolerable toxicity [25]. The PI3Ka inhibitor alpelisib has been approved by the FDA for treatment of PIK3CA-mutated, advanced or metastatic breast cancer, with manageable toxicity [49]. The PI3Kb inhibitor AZD8186 has completed Phase I clinical trial in solid tumors with PTEN deficient or PI3Kb mutation but with limited efficacy [50]. In PCa, Phase I results for alpelisib and AZD8186 are limited or have been disappointing. The effectiveness of PI3K isoform inhibitors as single agents in cancer therapy is challenging due to the activation of adaptive mechanisms and crosstalk with other signaling pathways [51]. Therefore, combination with other drugs to improve efficacy is required. Given that MIA-602 and -690 can alter multiple signaling pathways, its combination with PI3K isoform inhibitors may weaken activation of adaptive mechanisms and improve efficacy. Further investigations are required to determine if this is correct.
To prepare for pre-Investigational New Drug (IND) studies, MIA-602 and -690 were converted into a more clinically acceptable Ac salt form (see Methods). Our results revealed that MIA-602Ac and -690Ac remain potent with regard to effects on multiple signaling pathways (apoptosis, proliferation) and in combination with PI3K isoform inhibitors (synergistic, CI<0.4). Overall, our results suggest MIA-602/690 alone and in combination with PI3Ka or b isoform inhibitors alters multiple signaling pathways including apoptosis, proliferation, PI3Ka/b, AKT, ERK, and AR.
Future studies will 1) use prostate cancer xenograft models (e.g., LNCaP, 22Rv1, PC3, or patient-derived xenografts) to confirm the efficacy of the combination in a preclinical setting and 2) develop shRNA knockdown or CRISPR-deletion of PI3K isoforms to validate whether PI3Kα or PI3Kβ are the key players in synergy with MIA-602/690.
5. Conclusions
Discovering new strategies for the treatment of advanced CRPC/NEPC is an urgent topic. Our MIA-602/690 + PI3K isoform inhibitor combination strategy may improve upon efficacies over each drug alone, especially in advanced CRPC/NEPC. We consider that due to the reciprocal negative feedback regulation between PI3K/AKT activity and AR signaling [38,39], the MIA-602/690 mediated decrease in AR in LNCaP and 22Rv1 may increase PI3K activity. Therefore, the addition of PI3K inhibitors may counter the negative feedback effect of AR reduction. In addition, PI3K inhibitors should further block the RTK/ERK signaling pathway (shared PI3K family members) in AR negative CRPC/NEPC above the RTK/ERK inhibition resulting from GHRH antagonists [37] (Figure 7). Our future goal is to translate MIA-602Ac or -690Ac to the clinic and eventually investigate whether the combination with PI3K isoform inhibitors will provide improved therapeutic benefit, especially for advanced CRPC/NEPC.
Supplementary Materials
The following supporting information can be downloaded at the website of this paper posted on Preprints.org, Figures S1-S8.
Author Contributions
C.P-S. carried out cell culture, drug treatments, trypan blue cell death, and cell viability; A.P. carried out western blots; R.C synthesized MIA-602/690; W.S. and R.C. prepared Ac form of MIA-602/690; and H.W. carried out GH release assay in rats. C.P-S. conceived the study, coordinated and supervised the project, and wrote and edited the manuscript. All the authors critically read and approved the final manuscript.
Funding
This work was supported by a Veterans Affairs BLR&D Distinguished Medical Research Scientist Award (I01-BX00501; Andrew V. Schally). Further support was provided by Miami VA Geriatric Research and Clinical Center (GRECC).
Data Availability Statement
All data generated or analyzed during this study are included in this published article and supplementary information files. Upon written or e-mail request, any resources or data will be made freely available.
Acknowledgments
We thank Dr. Robert Jackson and Mr. Luis Gonzalez at the Miami VA for their support.
Conflicts of Interest
A.V.S, R.C., and W.S. are inventors on the patents for GHRH analogs, assigned to the University of Miami and Veterans Affairs Medical Center. The remaining authors declare no conflicts of interest. The funders had no role in the design of the study; in the collection, analyses, or interpretation of data; in the writing of the manuscript; or in the decision to publish the results.
Abbreviations
The following abbreviations are used in this manuscript:
| Ac | Acetate |
| AKT | Protein Kinase B |
| AR | Androgen Receptor |
| ATCC | American Type Culture Collection |
| ca | Constitutively Active |
| CDK | Cyclin-Dependent Kinase |
| CI | Combination Index |
| CRPC | Castration Resistant Prostate Cancer |
| EGFR | Epidermal Growth Factor Receptor |
| ERK | Extracellular-signal Regulated Kinase |
| FDA | Food and Drug Administration |
| GH | Growth Hormone |
| GHRH | Growth Hormone-Releasing Hormone |
| GHRHR | Growth Hormone-Releasing Hormone Receptor |
| GnRH | Gonadotropin-Releasing Hormone |
| GPCR | G Protein-Coupled Receptor |
| IGF1 | Insulin Growth Factor 1 |
| mTOR | Mammilian Target of Rapamycin |
| NFkB | Nuclear Factor Kappa-Light-Chain-Enhancer of Activated B Cells |
| NEPC | Neuroendocrine Prostate Cancer |
| P | Phospho |
| PCa | Prostate Cancer |
| PI3K | Phosphoinositide 3-Kinase |
| PTEN | Phosphatase and Tensin Homolog |
| RTK | Receptor Tyrosine Kinase |
| TFA | Trifluoroacetic Acid |
| T | Total |
References
- Sartor, O.; de Bono, J.S. Metastatic prostate cancer. N Engl J Med. 2018, 378, 645–657. [Google Scholar] [CrossRef] [PubMed]
- Prekovic, S.; van den Broeck, T.; Linder, S.; van Royen, M.E.; Houtsmuller, A.B.; Handle, F.; Joniau, S.; Zwart, W.; Claessens, F. Molecular underpinnings of enzalutamide resistance. Endocr Relat Cancer. 2018, 25, R545–R557. [Google Scholar] [CrossRef] [PubMed]
- Beltran, H.; Demichelis, F. Therapy considerations in neuroendocrine prostate cancer: what next? Endocr Relat Cancer. 2021, 28, T67–T78. [Google Scholar] [CrossRef] [PubMed]
- Wang, Y.; Wang, Y.; Ci, X.; Choi, S.Y.C.; Crea, F.; Lin, D.; Wang, Y. Molecular events in neuroendocrine prostate cancer development. Nat Rev Urol. 2021, 18, 581–596. [Google Scholar] [CrossRef]
- Liu, S.; Alabi, B.R.; Yin, Q.; Stoyanova, T. Molecular mechanisms underlying the development of neuroendocrine prostate cancer. Semin Cancer Biol. 2022, 86, 57–68. [Google Scholar] [CrossRef]
- Conn, P.M.; Crowley, W.F., Jr. Gonadotropin-releasing hormone and its analogues. N Engl J Med. 1991, 324, 93–103. [Google Scholar] [CrossRef]
- Schally, A.V., Arimura, A.; Kastin, A.J.; Matsuo, H.; Baba, Y.; Redding, T.W.; Nair, R.M.; Debeljuk, L.; White, W.F. Gonadotropin-releasing hormone: one polypeptide regulates secretion of luteinizing and follicle-stimulating hormones. Science. 1971, 173, 1036–1038. [CrossRef]
- Schally, A.V.; Cai, R.; Zhang, X.; Sha, W.; Wangpaichitr, M. The development of growth hormone-releasing hormone analogs: therapeutic advances in cancer, regenerative medicine, and metabolic disorders. Rev Endocr Metab Disord. 2024. [Google Scholar] [CrossRef]
- Schally, A.V.; Varga, J.L.; Engel, J.B. Antagonists of growth hormone-releasing hormone: An emerging new therapy for cancer. Nat Clin Pract Endocrinol Metab. 2008, 4, 33–43. [Google Scholar] [CrossRef]
- Gesmundo, I.; Pedrolli, F.; Cai, R.; Sha, W.; Schally, A.V.; Granata, R. Growth hormone-releasing hormone and cancer. Rev Endocr Metab Disord. 2024. [Google Scholar] [CrossRef]
- Pollak, M.N.; Schernhammer, E.S.; Hankinson, S.E. Insulin-like growth factors and neoplasia. Nat Rev Cancer. 2004, 4, 505–518. [Google Scholar] [CrossRef] [PubMed]
- Varga J.L., Schally, A.V.; Csernus, V.J.; Zarándi, M.; Halmos, G.; Groot, K.; Rékási, Z. Synthesis and biological evaluation of antagonists of growth hormone-releasing hormone with high and protracted in vivo activities. Proc Natl Acad Sci USA. 1999, 96, 692–697. [CrossRef] [PubMed]
- Zarandi, M., Cai R, Kovacs M, Popovics P, Szalontay L, Cui T, Sha W, Jaszberenyi M, Varga, J.; Zhang, X.; Block, N.L.; Rick, F.G.; Halmos, G.; Schally, A.V. Synthesis and structure-activity studies on novel analogs of human growth hormone releasing hormone (GHRH) with enhanced inhibitory activities on tumor growth. Peptides. 2017, 89, 60–70. [CrossRef]
- Rick, F.G.; Schally, A.V.; Szalontay, L.; Block, N.L.; Szepeshazi, K.; Nadji, M.; Zarandi, M.; Hohla, F.; Buchholz, S.; Seitz, S. Antagonists of growth hormone-releasing hormone inhibit growth of androgen-independent prostate cancer through inactivation of ERK and Akt kinases. Proc Natl Acad Sci USA. 2012, 109, 1655–1660. [Google Scholar] [CrossRef]
- Fahrenholtz, C.D.; Rick, F.G.; Garcia, M.I.; Zarandi, M.; Cai, R.Z.; Block, N.L.; Schally, A.V.; Burnstein, K.L. Preclinical efficacy of growth hormone-releasing hormone antagonists for androgen-dependent and castration-resistant human prostate cancer. Proc Natl Acad Sci USA. 2014, 111, 1084–1089. [Google Scholar] [CrossRef]
- Schally, A.V.; Perez, R.; Block, N.L.; Rick, F.G. Potentiating effects of GHRH analogs on the response to chemotherapy. Cell Cycle. 2015, 14, 699–704. [Google Scholar] [CrossRef]
- Hohla, F.; Schally, A.V.; Szepeshazi, K.; Varga, J.L.; Buchholz, S.; Köster, F.; Heinrich, E.; Halmos, G.; Rick, F.G.; Kannadka, C.; Datz, C.; Kanashiro, C.A. Synergistic inhibition of growth of lung carcinomas by antagonists of growth hormone-releasing hormone in combination with docetaxel. Proc Natl Acad Sci USA. 2006, 103, 14513–14518. [Google Scholar] [CrossRef]
- Hohla, F.; Buchholz, S.; Schally, A.V.; Seitz, S.; Rick, F.G.; Szalontay, L.; Varga, J.L.; Zarandi, M.; Halmos, G.; Vidaurre, I.; Krishan, A.; Kurtoglu, M.; Chandna, S.; Aigner, E.; Datz, C. GHRH antagonist causes DNA damage leading to p21 mediated cell cycle arrest and apoptosis in human colon cancer cells. Cell Cycle. 2009, 8, 3149–3156. [Google Scholar] [CrossRef]
- Perez, R., Schally, A.V.; Popovics, P.; Cai, R.; Sha, W.; Rincon, R.; Rick, F.G. Antagonistic analogs of growth hormone releasing hormone increase the efficacy of treatment of triple negative breast cancer in nude mice with doxorubicin: a preclinical study. Oncoscience. 2014, 1, 665–673. [CrossRef]
- Gesmundo, I.; Pedrolli, F.; Vitale, N.; Bertoldo, A.; Orlando, G.; Banfi, D.; Granato, G.; Kasarla, R.; Balzola, F.; Deaglio, S.; Cai, R.; Sha, W.; Papotti, M.; Ghigo, E.; Schally, A.V.; Granata, R. Antagonist of growth hormone-releasing hormone potentiates the antitumor effect of pemetrexed and cisplatin in pleural mesothelioma. Int J Mol Sci. 2022, 23, 11248. [Google Scholar] [CrossRef]
- Muñoz-Moreno, L.; Gómez-Calcerrada, M.I.; Arenas, M.I.; Carmena, M.J.; Prieto, J.C.; Schally, A.V.; Bajo, A.M. Antagonist of growth hormone-releasing hormone receptor MIA-690 suppresses the growth of androgen-independent prostate cancers. Int J Mol Sci. 2024, 25, 11200. [Google Scholar] [CrossRef]
- Glaviano, A.; Foo, A.S.C.; Lam, H.Y.; Yap, K.C.H.; Jacot, W.; Jones, R.H.; Eng, H.; Nair, M.G.; Makvandi, P.; Geoerger, B.; Kulke, M.H.; Baird, R.D.; Prabhu, J.S.; Carbone, D.; Pecoraro, C.; The, D.B.L.; Sethi, G.; Cavalieri, V.; Lin, K.H.; Javidi-Sharifi, N.R.; Toska, E.; Davids, M.S.; Brown, J.R.; Diana, P.; Stebbing, J.; Fruman, D.A.; Kumar, A.P. PI3K/AKT/mTOR signaling transduction pathway and targeted therapies in cancer. Mol Cancer. 2023, 22, 138. [Google Scholar] [CrossRef] [PubMed]
- Taylor, B.S.; Schultz, N.; Hieronymus. H.; Gopalan, A.; Xiao, Y.; Carver, B.S.; Arora, V.K.; Kaushik, P.; Cerami, E.; Reva, B.; Antipin, Y.; Mitsiades, N.; Landers, T.; Dolgalev, I.; Major, J.E.; Wilson, M.; Socci, N.D.; Lash, A.E.; Heguy, A.; Eastham, J.A.; Scher, H.I.; Reuter, V.E.; Scardino, P.T.; Sander, C.; Sawyers, C.L.; Gerald, W.L. Integrative genomic profiling of human prostate cancer. Cancer Cell. 2010, 18, 11–22. [CrossRef]
- Grasso, C.S.; Wu, Y.M.; Robinson, D.R.; Cao, X.; Dhanasekaran, S.M.; Khan, A.P.; Quist, M.J.; Jing, X.; Lonigro, R.J.; Brenner, J.C.; Asangani, I.A.; Ateeq, B.; Chun, S.Y.; Siddiqui, J.; Sam, L.; Anstett, M.; Mehra, R.; Prensner, J.R.; Palanisamy, N.; Ryslik, G.A.; Vandin, F.; Raphael, B.J.; Kunju, L.P.; Rhodes, D.R.; Pienta, K.J.; Chinnaiyan, A.M.; Tomlins, S.A. The mutational landscape of lethal castration-resistant prostate cancer. Nature. 2012, 487, 239–243. [Google Scholar] [CrossRef] [PubMed]
- Yu, M.; Chen, J.; Xu, Z.; Yang, B.; He, Q.; Luo, P.; Yan, H.; Yang, X. Development and safety of PI3K inhibitors in cancer. Arch Toxicol. 2023, 97, 635–650. [Google Scholar] [CrossRef]
- Shan, K.S.; Bonano-Rios, A.; Theik, N.W.Y.; Hussein, A.; Blaya, M. Molecular targeting of the phosphoinositide-3-protein kinase (PI3K) pathway across various cancers. Int J Mol Sci. 2024, 25, 1973. [Google Scholar] [CrossRef]
- Li, H.; Wen, X.; Ren, Y.; Fan, Z.; Zhang, J.; He, G.; Fu, L. Targeting PI3K family with small-molecule inhibitors in cancer therapy: current clinical status and future directions. Mol Cancer. 2024, 23, 164. [Google Scholar] [CrossRef]
- Dekant, W.; Dekant, R. Mammalian toxicity of trifluoroacetate and assessment of human health risks due to environmental exposures. Arch Toxicol. 2023, 97, 1069–1077. [Google Scholar] [CrossRef]
- Lee, J.K.; Phillips, J.W.; Smith, B.A.; Park, J.W.; Stoyanova, T.; McCaffrey, E.F.; Baertsch, R.; Sokolov, A.; Meyerowitz, J.G.; Mathis, C.; Cheng, D.; Stuart, J.M.; Shokat, K.M.; Gustafson, W.C.; Huang. J.; Witte, O.N. N-myc drives neuroendocrine prostate cancer initiated from human prostate epithelial cells. Cancer Cell. 2016, 29, 536–547. [CrossRef]
- VanDeusen, H.R.; Ramroop, J.R.; Morel, K.L.; Bae, S.Y.; Sheahan, A.V.; Sychev, Z.; Lau, N.A.; Cheng, L.C.; Tan, V.M.; Li, Z.; Petersen, A.; Lee, J.K.; Park, J.W.; Yang, R.; Hwang, J.H.; Coleman, I.; Witte, O.N.; Morrissey, C.; Corey, E.; Nelson, P.S.; Ellis, L.; Drake, J.M. Targeting RET kinase in neuroendocrine prostate cancer. Mol Cancer Res. 2020, 18, 1176–1188. [Google Scholar] [CrossRef]
- Gomez, L.A.; de las Pozas, A.; Perez-Stable, C. Sequential combination of flavopiridol and docetaxel reduces the levels of XIAP and AKT proteins and stimulates apoptosis in human LNCaP prostate cancer cells. Mol Cancer Ther. 2006, 5, 1216–1226. [Google Scholar] [CrossRef] [PubMed]
- Halmos, G.; Schally, A.V.; Czompoly, T.; Krupa, M.; Varga, J.L.; Rekasi, Z. Expression of growth hormone-releasing hormone and its receptor splice variants in human prostate cancer. J Clin Endocrinol Metab. 2002, 87, 4707–4714. [Google Scholar] [CrossRef] [PubMed]
- McMenamin, M.E.; Soung, P.; Perera, S.; Kaplan, I.; Loda, M.; Sellers, W.R. Loss of PTEN expression in paraffin-embedded primary prostate cancer correlates with high Gleason score and advanced stage. Cancer Res. 1999, 59, 4291–4296. [Google Scholar] [PubMed]
- Li, J.; Yen, C.; Liaw, D.; Podsypanina, K.; Bose, S.; Wang, SI.; Puc, J.; Miliaresis, C.; Rodgers, L.; McCombie, R.; Bigner, S.H.; Giovanella, B.C.; Ittmann, M.; Tycko, B.; Hibshoosh, H.; Wigler, M.H.; Parsons, R. PTEN, a putative protein tyrosine phosphatase gene mutated in human brain, breast, and prostate cancer. Science. 1997, 275, 1943–1947. [Google Scholar] [CrossRef]
- Sramkoski, R.M.; Pretlow, T.G.; Giaconia, J.M.; Pretlow, T.P.; Schwartz, S.; Sy, M.S.; Marengo, S.R.; Rhim, J.S.; Zhang, D.; Jacobberger, J.W. A new human prostate carcinoma cell line, 22Rv1. In Vitro Cell Dev Biol Anim. 1999, 35, 403–409. [Google Scholar] [CrossRef]
- Muñoz-Moreno, L.; Román, I.D.; Bajo, A.M. GHRH and the prostate. Rev Endocr Metab Disord. 2024. [Google Scholar] [CrossRef]
- Muñoz-Moreno, L.; Arenas, M.I.; Carmena, M.J.; Schally, A.V.; Prieto, J.C.; Bajo, A.M. Growth hormone-releasing hormone antagonists abolish the transactivation of human epidermal growth factor receptors in advanced prostate cancer models. Invest New Drugs. 2014, 32, 871–882. [Google Scholar] [CrossRef]
- Tortorella, E.; Giantulli, S.; Sciarra, A.; Silvestri, I. AR and PI3K/AKT in prostate cancer: a tale of two interconnected pathways. Int J Mol Sci. 2023, 24, 2046. [Google Scholar] [CrossRef]
- Raith, F.; O’Donovan, D.H.; Lemos, C.; Politz, O.; Haendler, B. Addressing the reciprocal crosstalk between the AR and the PI3K/AKT/mTOR signaling pathways for prostate cancer treatment. Int J Mol Sci. 2023, 24, 2289. [Google Scholar] [CrossRef]
- Muñoz-Moreno, L.; Carmena, M.J.; Schally, A.V.; Prieto, J.C.; Bajo, A.M. Stimulation of neuroendocrine differentiation in prostate cancer cells by GHRH and its blockade by GHRH antagonists. Invest New Drugs. 2020, 38, 746–754. [Google Scholar] [CrossRef]
- Gan, J.; Ke, X.; Jiang, J.; Dong, H.; Yao, Z.; Lin, Y.; Lin, W.; Wu, X.; Yan, S.; Zhuang, Y.; Chu, W.K.; Cai, R.; Zhang, X.; Cheung, H.S.; Block, N.L.; Pang, C.P.; Schally, A.V.; Zhang, H. Growth hormone-releasing hormone receptor antagonists inhibit human gastric cancer through downregulation of PAK1-STAT3/NF-κB signaling. Proc Natl Acad Sci USA. 2016, 113, 14745–14750. [Google Scholar] [CrossRef] [PubMed]
- Wu, H.; Huang, H.; Schally, A.V.; Chao, A.; Chou, H.; Leung, P.C.K.; Wang, H. Growth hormone-releasing hormone antagonist inhibits the invasiveness of human endometrial cancer cells by down-regulating twist and N-cadherin expression. Oncotarget. 2017, 8, 4410–4421. [Google Scholar] [CrossRef] [PubMed]
- Liang, W.C.; Ren, J.L.; Yu, Q.X.; Li, J.; Ng, T.K.; Chu, W.K.; Qin, Y.J.; Chu, K.O.; Schally, A.V.; Pang, C.P.; Chan, S.O. Signaling mechanisms of growth hormone-releasing hormone receptor in LPS-induced acute ocular inflammation. Proc Natl Acad Sci USA. 2020, 117, 6067–6074. [Google Scholar] [CrossRef] [PubMed]
- Hartman, M.L. Tipping the balance of cell death: alternative splicing as a source of MCL-1S in cancer. Cell Death Dis. 2024, 15, 917. [Google Scholar] [CrossRef]
- Bailey, M.H.; Tokheim, C.; Porta-Pardo, E.; Sengupta, S.; Bertrand, D.; Weerasinghe, A.; Colaprico, A.; Wendl, M.C.; Kim, J.; Reardon, B.; Ng, P.K.; Jeong, K.J.; Cao, S.; Wang, Z.; Gao, J.; Gao, Q.; Wang, F.; Liu, E.M.; Mularoni, L.; Rubio-Perez, C.; Nagarajan, N.; Cortés-Ciriano, I.; Zhou, D.C.; Liang, W.W.; Hess, J.M.; Yellapantula, V.D.; Tamborero, D.; Gonzalez-Perez, A.; Suphavilai, C.; Ko, J.Y.; Khurana, E.; Park, P.J.; Van Allen, E.M.; Liang, H.; MC3 Working Group; Cancer Genome Atlas Research Network; Lawrence, M.S.; Godzik, A.; Lopez-Bigas, N. Stuart, J.; Wheeler, D.; Getz, G.; Chen, K.; Lazar, A.J.; Mills, G.B.; Karchin, R.; Ding, L. Comprehensive characterization of cancer driver genes and mutations. Cell. 2018, 173, 371–385. [CrossRef]
- Pearson, H.B.; Li, J.; Meniel, V.S.; Fennell, C.M.; Waring, P.; Montgomery, K.G.; Rebello, R.J.; Macpherson, A.A.; Koushyar, S.; Furic, L.; Cullinane, C.; Clarkson, R.W.; Smalley, M.J.; Simpson, K.J.; Phesse, T.J.; Shepherd, P.R.; Humbert, P.O.; Sansom, O.J.; Phillips, W.A. Identification of Pik3ca mutation as a genetic driver of prostate cancer that cooperates with Pten loss to accelerate progression and castration-resistant growth. Cancer Discov. 2018, 8, 764–779. [Google Scholar] [CrossRef]
- Schwartz, S.; Wongvipat, J.; Trigwell, C.B.; Hancox, U.; Carver, B.S.; Rodrik-Outmezguine, V.; Will, M.; Yellen, P.; de Stanchina, E.; Baselga, J.; Scher, H.I.; Barry, S.T.; Sawyers, C.L.; Chandarlapaty, S.; Rosen, N. Feedback suppression of PI3Kα signaling in PTEN-mutated tumors is relieved by selective inhibition of PI3Kβ. Cancer Cell. 2015, 27, 109–122. [Google Scholar] [CrossRef]
- Mao, N.; Zhang, Z.; Lee, Y.S.; Choi, D.; Rivera, A.A.; Li, D.; Lee, C.; Haywood, S.; Chen, X.; Chang, Q.; Xu, G.; Chen, H.A.; de Stanchina, E.; Sawyers, C.; Rosen, N.; Hsieh, A.C.; Chen, Y.; Carver, B.S. Defining the therapeutic selective dependencies for distinct subtypes of PI3K pathway-altered prostate cancers. Nat Commun. 2021, 12, 5053. [Google Scholar] [CrossRef]
- Markham, A. Alpelisib: first global approval. Drugs. 2019, 79, 1249–1253. [Google Scholar] [CrossRef]
- Choudhury, A.D.; Higano, C.S.; de Bono, J.S.; Cook, N.; Rathkopf, D.E.; Wisinski, K.B.; Martin-Liberal, J.; Linch, M.; Heath, E.I.; Baird, R.D.; García-Carbacho, J.; Quintela-Fandino, M.; Barry, S.T.; de Bruin, E.C.; Colebrook, S.; Hawkins, G.; Klinowska, T.; Maroj, B.; Moorthy, G.; Mortimer, P.G.; Moschetta, M.; Nikolaou, M.; Sainsbury, L.; Shapiro, G.I.; Siu, L.L.; Hansen, A.R. A phase I study investigating AZD8186, a potent and selective inhibitor of PI3Kβ/δ, in patients with advanced solid tumors. Clin. Cancer Res. 2022, 28, 2257–2269. [Google Scholar] [CrossRef]
- Wright, S.C.E.; Vasilevski, N.; Serra, V.; Rodon, J.; Eichhorn, P.J.A. Mechanisms of resistance to PI3K inhibitors in cancer: adaptive responses, drug tolerance and cellular plasticity. Cancers. 2021, 13, 1538. [Google Scholar] [CrossRef]
Figure 1.
Higher expression of GHRHR and GHRH mRNA in PCa compared to normal tissue: a database analysis. (A) Oncomine database search indicated a 1.65-fold higher expression for GHRHR mRNA in PCa vs. normal tissue (LaTulippe Prostate Statistics; P=0.008). GHRHR mRNA was higher in metastatic (mets; n=9) vs primary (n=23) PCa. Higher GHRHR mRNA metastasis localized more in soft tissue (LN, lymph node; n=5) vs bone (n=2). (B) GEPIA database search indicated higher expression for GHRHR mRNA in PCa (n=492) vs. normal tissue (n=152). High vs low GHRHR expression did not correlate with disease free survival (n=246 for each). (C) OncoDB database search indicated GHRH mRNA expression was higher in PCa (n=505) vs normal tissue (n=52) (P=0.037).
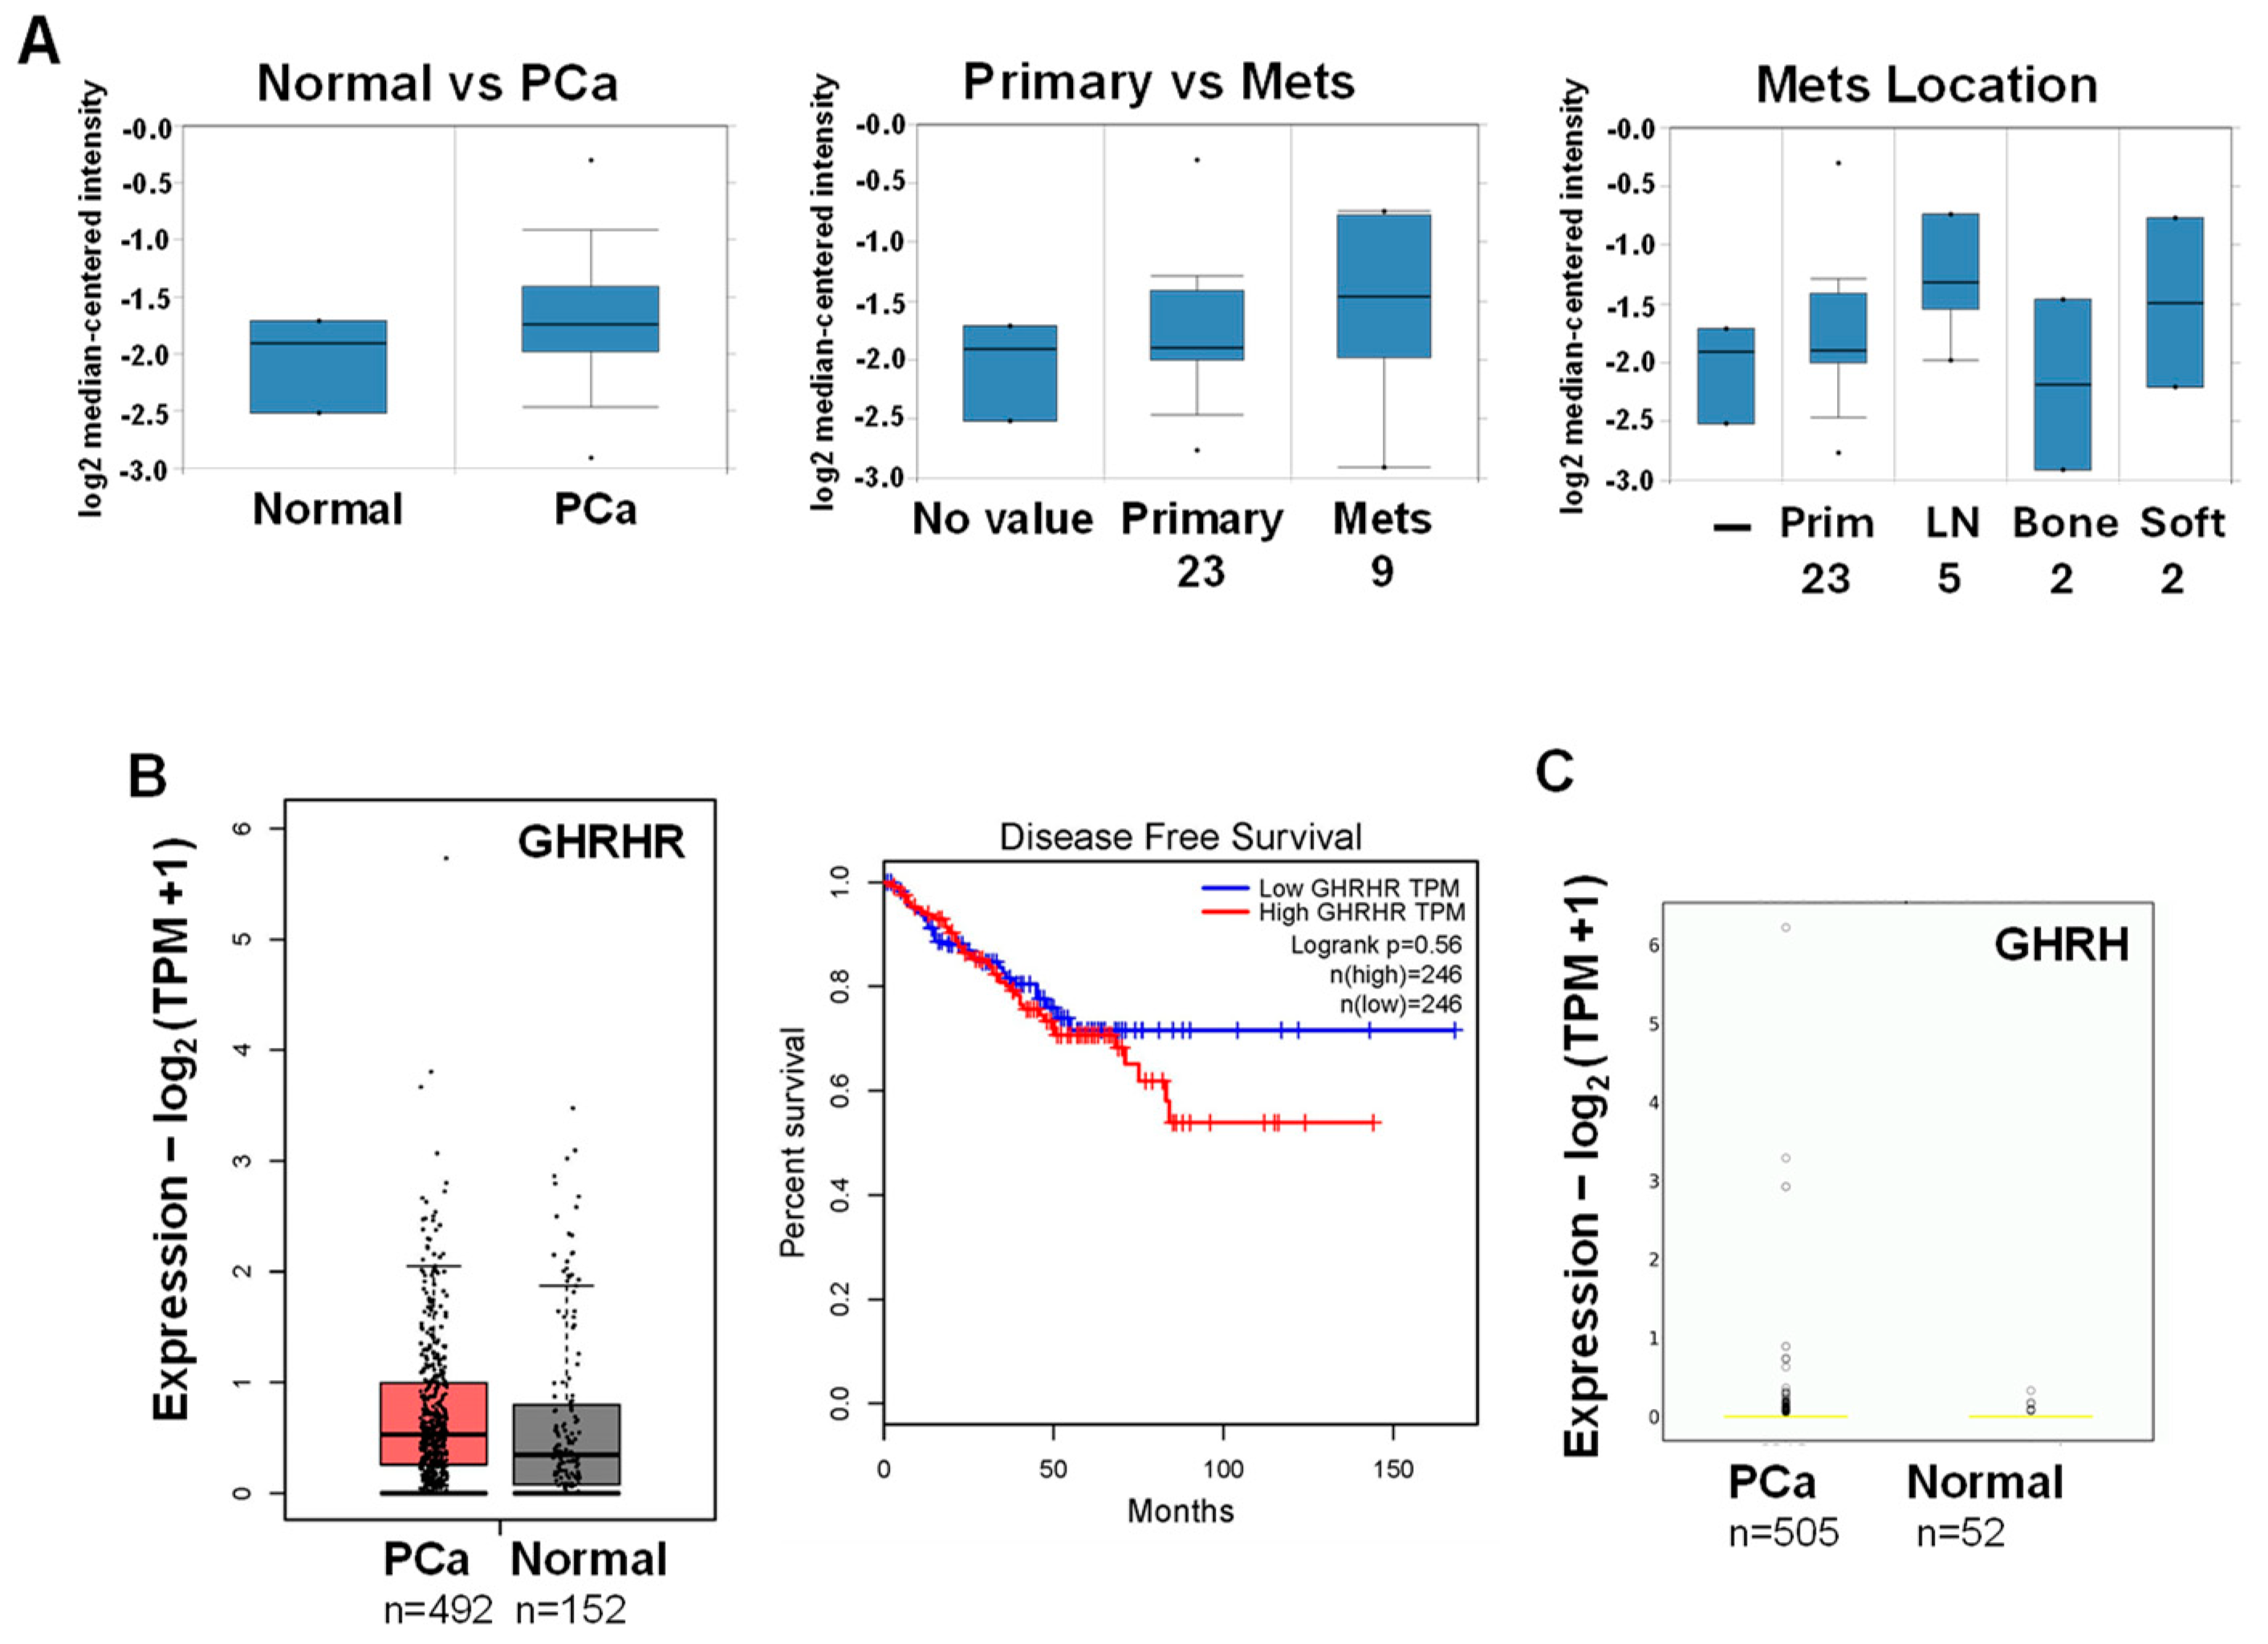
Figure 2.
MIA-602 and -690 GHRH antagonists increase cell death in PCa/CRPC/NEPC cells. Trypan blue exclusion assay showed significantly higher cell death (72h) in MIA-602 (02) and -690 (90) (5 mM) treated LNCaP (PCa), 22Rv1 (CRPC), and H660, LASCPC (NEPC) cells compared to control (─) treated cells. There was no increased cell death PC3 or DU145 (CRPC). P values are shown above the bars.
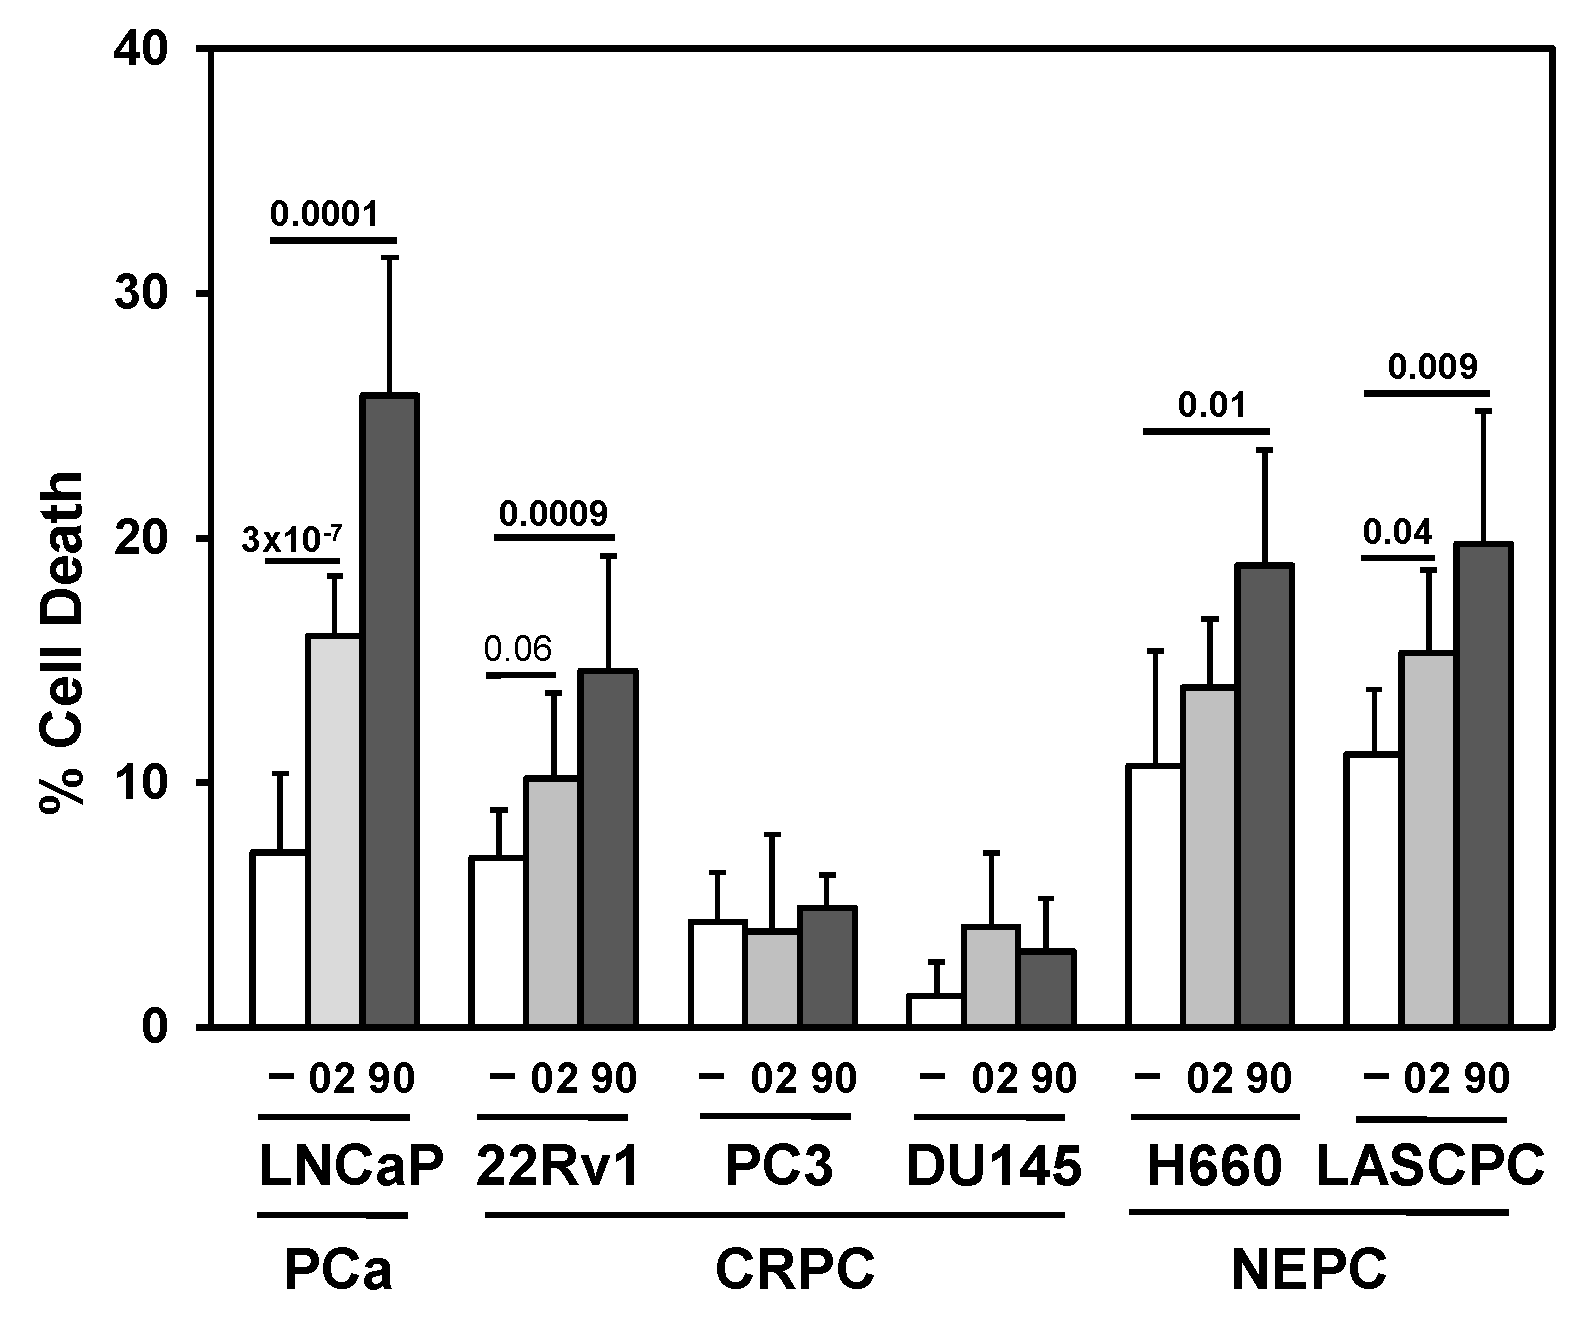
Figure 3.
Searching for a drug combination with MIA-602 and -690 GHRH antagonist peptides that will increase cell death in PCa/CRPC/NEPC. (A) Trypan blue exclusion assay showed the anti-mitotic docetaxel (D; 0.25 nM LNCaP, 22Rv1; 1 nM PC3) + MIA-602 (02) or -690 (90) (5 mM) increased cell death in LNCaP, 22Rv1, and PC3 cells compared to D, 02/90, and control cells. Positive control is D + Bcl-2 (B) inhibitor ABT-737 (1 mM). (B) Bcl-2 (B) inhibitor ABT-737 (1 mM) + MIA-602 or -690 partially increased cell death LNCaP, PC3 but not in 22Rv1 cells. (C) Pan-PI3K inhibitor LY294002 (LY, 10 mM) + MIA-602 or -690 significantly increased cell death in LNCaP, 22Rv1, and PC3 compared to LY, 02/90, and control cells. P values are shown near the bars.
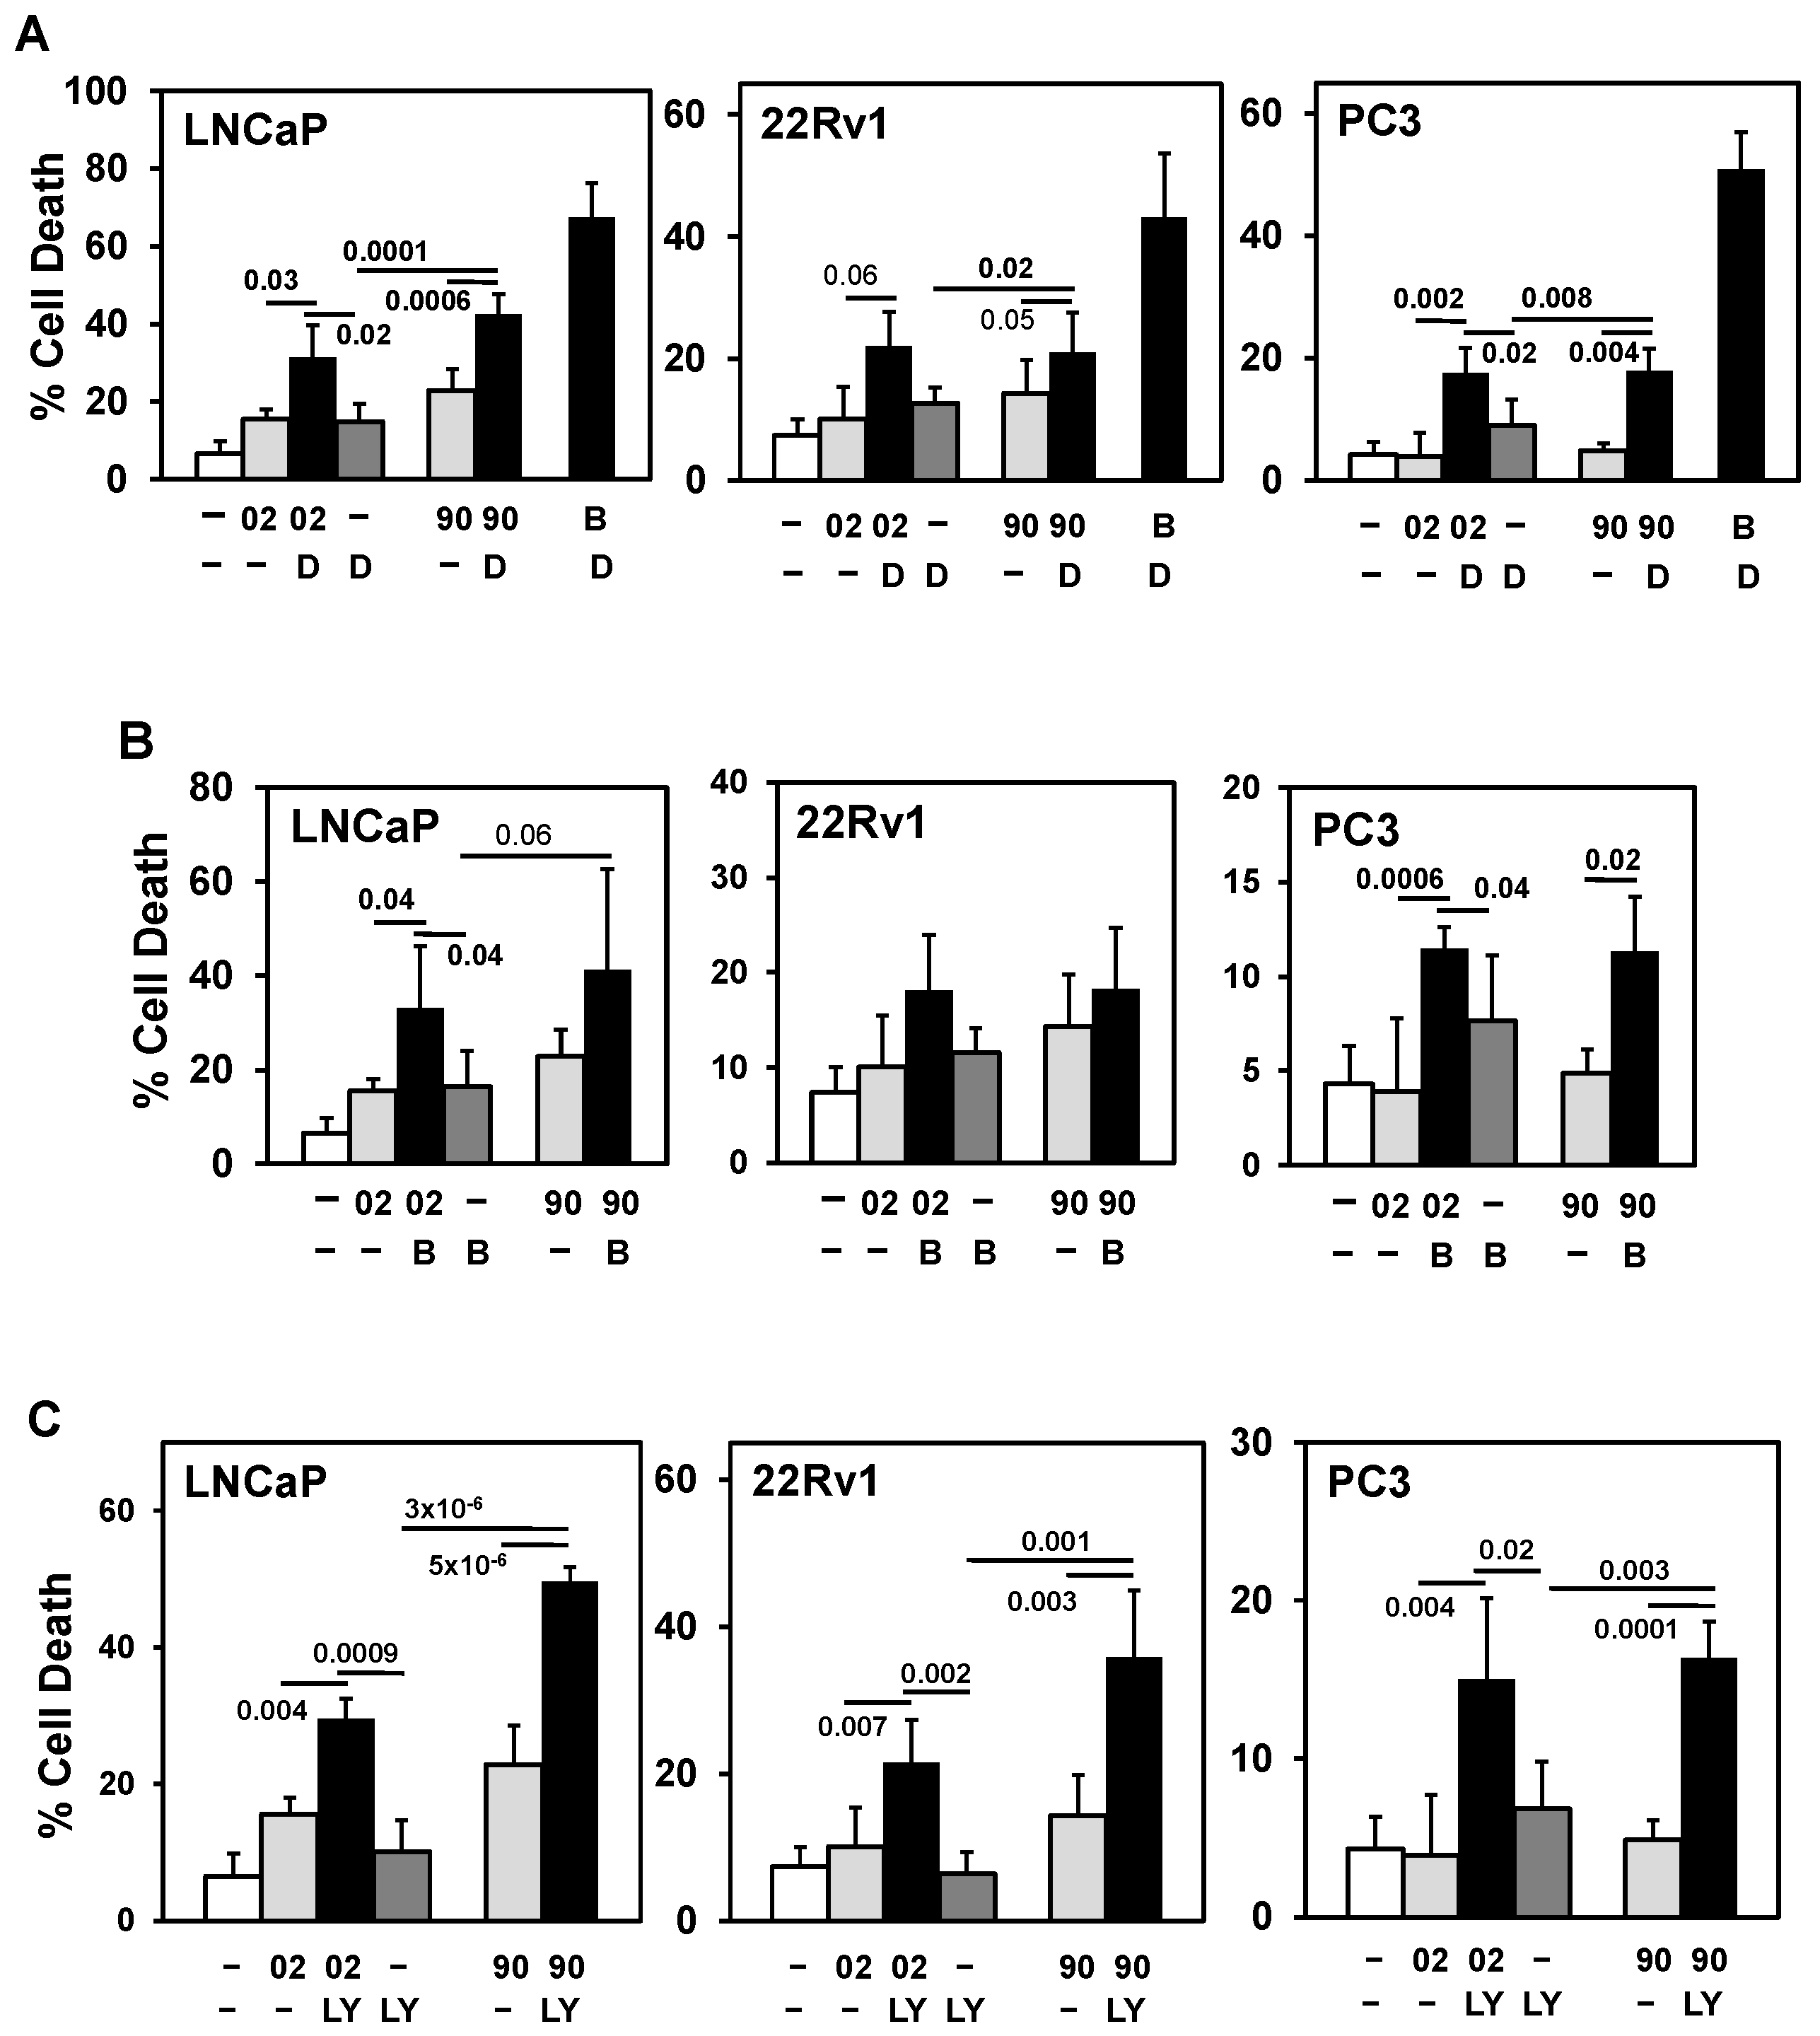
Figure 4.
PI3Ka or b isoform inhibitors + MIA-602 or -690 increases cell death in PCa/CRPC/NEPC cells. (A) Trypan blue exclusion assay showed PI3Kai (ai, 10 mM) + MIA-602 (02) or -690 (90) (5 mM) significantly increased cell death in 22Rv1 compared to ai, 02/90, and control cells. In LNCaP, PI3Kai did not increase MIA-602 or -690 cell death. PI3Kbi (bi, 2.5 mM) + MIA-602 or -690 significantly increased cell death in LNCaP compared to bi, 02/90, and control cells, but only slightly increased cell death in 22Rv1 (bi, 10 mM). (B) PI3Kai + MIA-602 or -690 significantly increased cell death in PC3 but partially in DU145 (90 + ai). PI3Kbi (10 mM) significantly increased MIA-602 or -690 cell death in DU145 but not in PC3. (C) PI3Kai + MIA-602 or -690 significantly increased cell death in H660 and LASCPC whereas PI3Kbi (10 mM) + MIA-602 or -690 slightly increased cell death in LASCPC but not in H660. P values are shown near the bars.
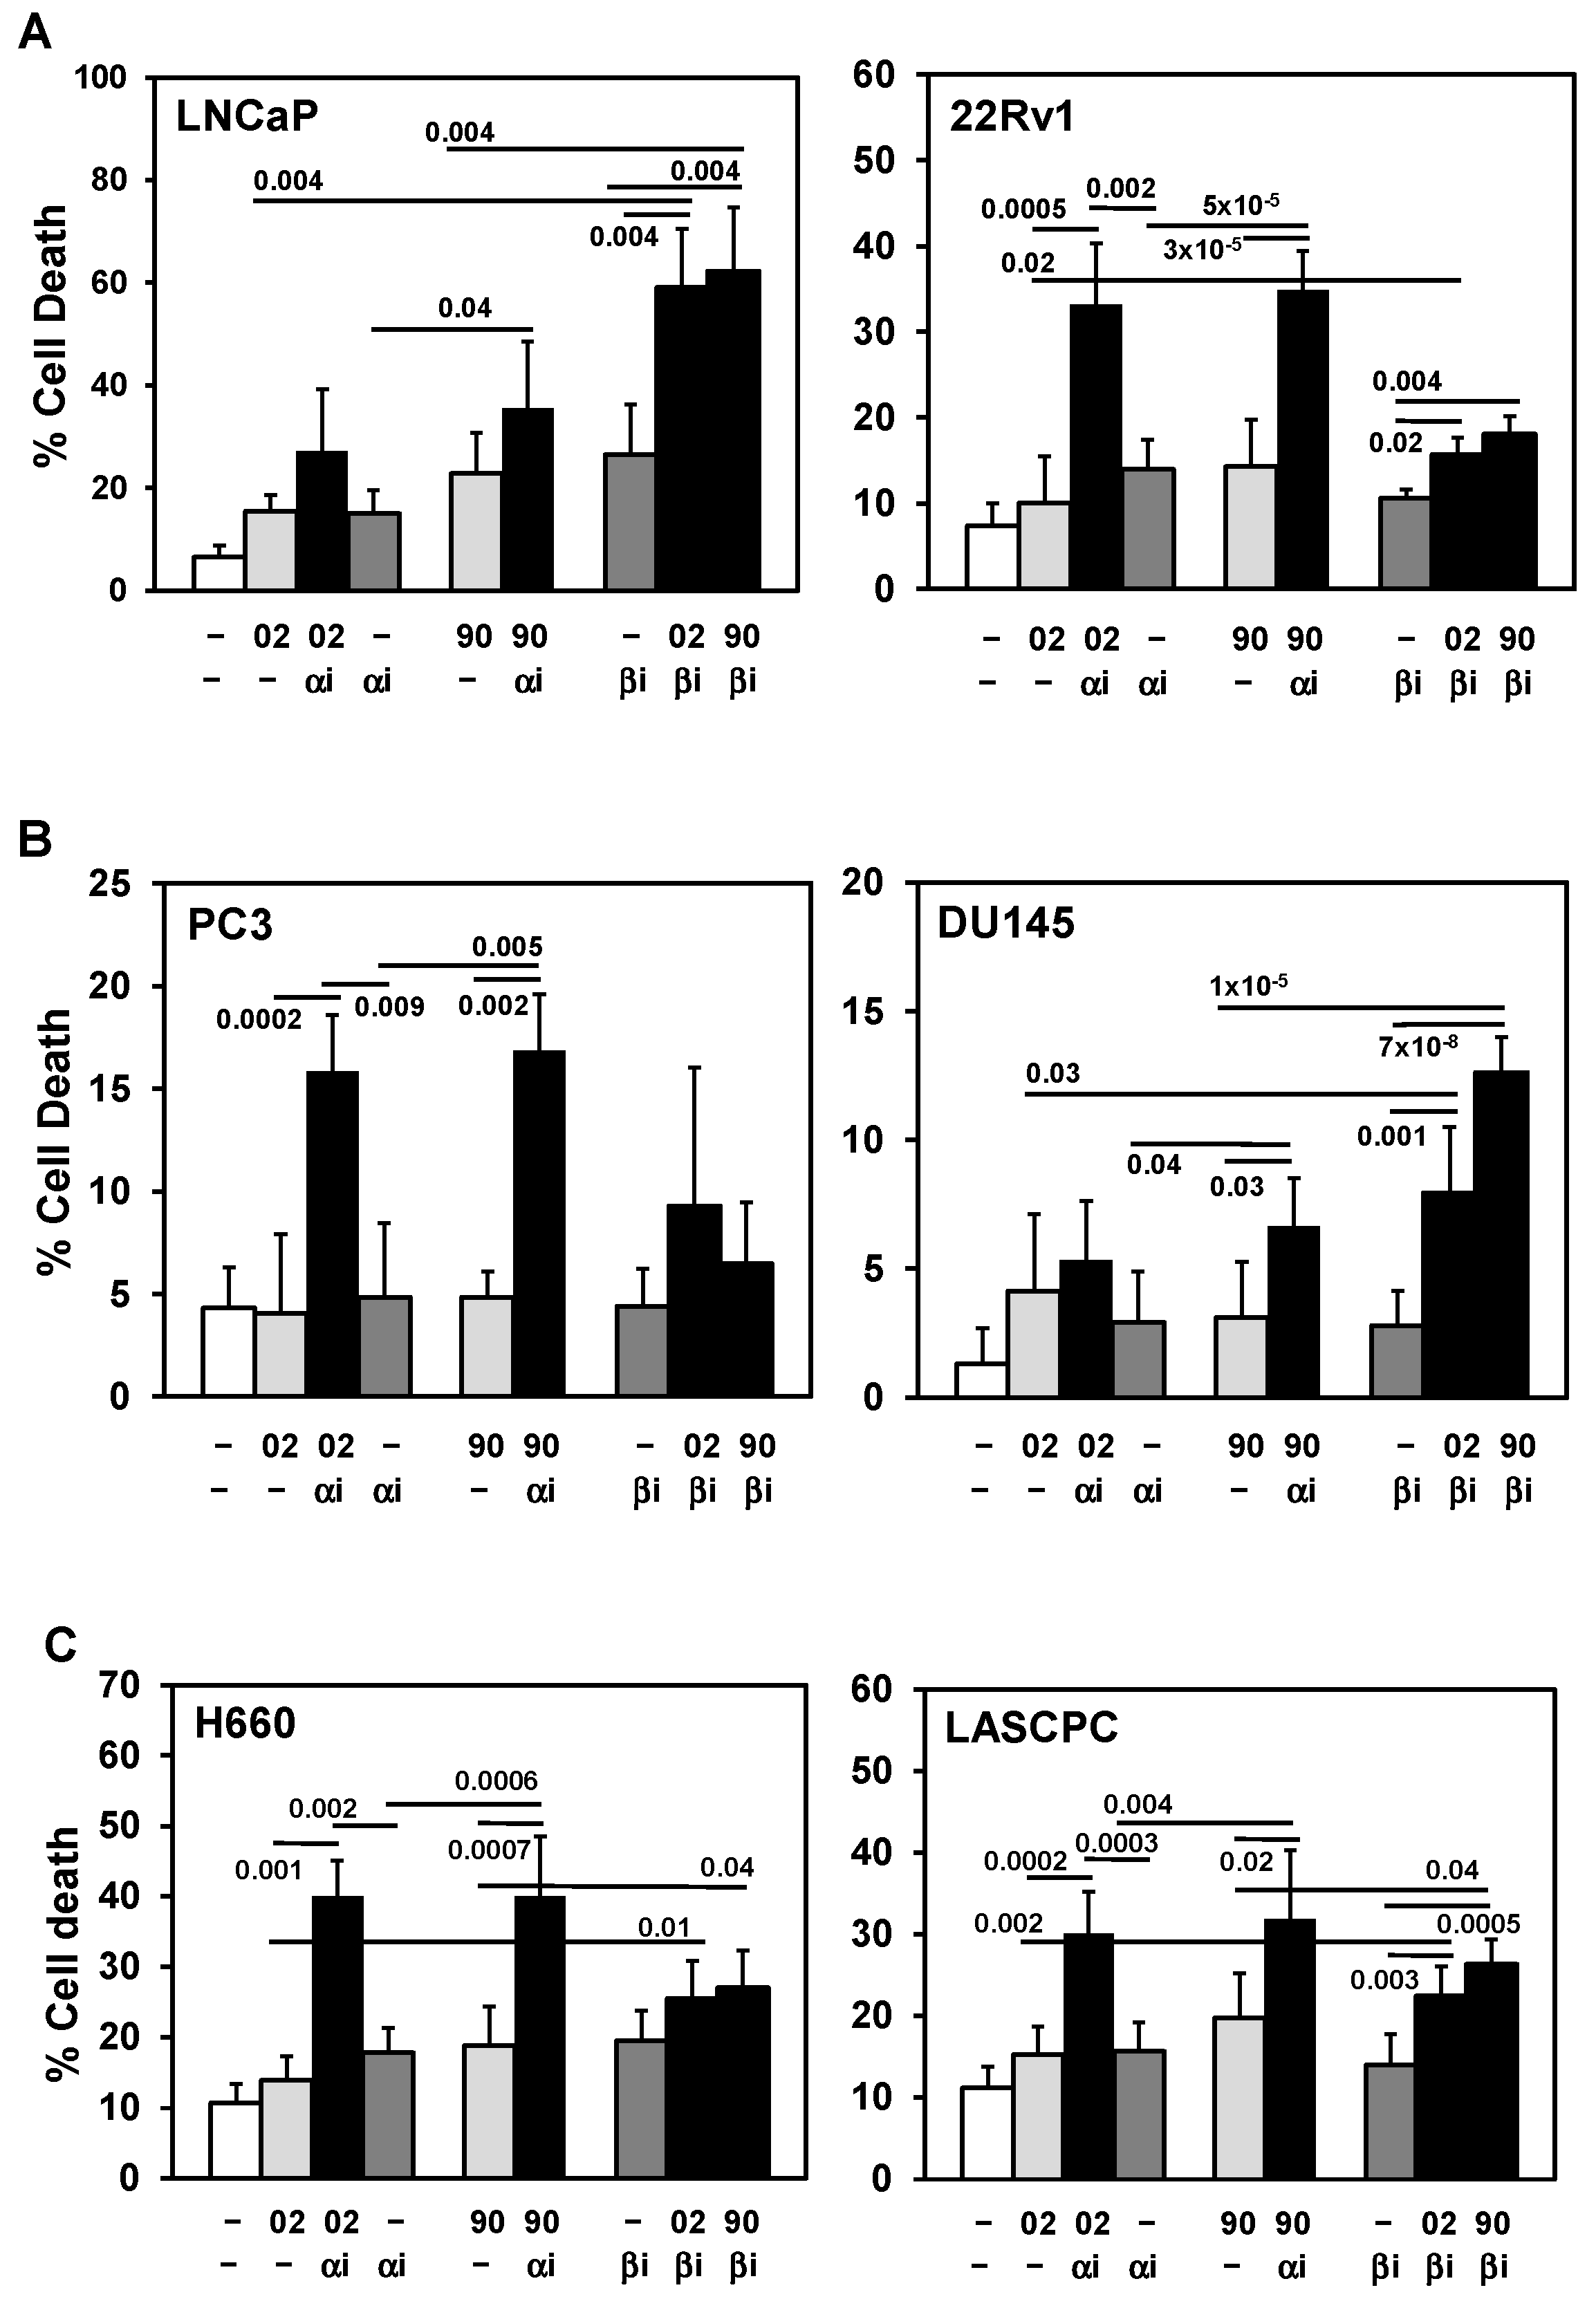
Figure 5.
MIA-602/690 alone and + PI3K inhibitors alters multiple signaling pathways and AR expression. (A) Western blot analysis showed MIA-602 (02, 5 mM) + PI3Kai (ai, 10 mM) decreased PI3Ka, PI3Kb, and AKT in 22Rv1 and PC3 (P-AKT increased in PC3 24h); MIA-602 alone decreased PI3Ka in 22Rv1. MIA-602 decreased P-ERK in 22Rv1 (72h) (PI3Kai increased P-ERK). MIA-602 alone and MIA-602 + PI3Kai decreased total ERK in 22Rv1 (72h). In PC3, there was a switch from P-ERK1 to P-ERK2 with MIA-602 and MIA-602 + PI3Kai (24, 72h). No clear differences were noted in GHRHR and cl-PARP. (B) In LNCaP, MIA-602/690 alone and MIA-602/690 + PI3Kbi (bi, 2.5 mM) (24h) decreased Mcl-1L (anti-apoptosis) and increased Mcl-1S (pro-apoptosis). No clear difference in apoptosis marker cl-PARP was noted. PI3Kbi alone and MIA-602/690 + PI3Kbi decreased proliferation markers E2F1 and cyclin A. MIA-690 + PI3Kbi decreased PI3Ka, PI3Kb, and P/T-AKT. AR was strongly decreased with MIA-602/690 alone. (C) In LNCaP, treatment with MIA-602/690 over time (4-72h) decreased Mcl-1L, PI3Ka, PI3Kb, P-AKT, and AR. No clear differences were noted in GHRHR. Quantification values (divided by protein [p]) for PI3Ka, PI3Kb, AKT, ERK, Mcl-1L, Mcl-1S, E2F1, cyclin A, and AR were shown below specific bands with control =1. Ratio of P/T (total) AKT and ERK values were also shown.
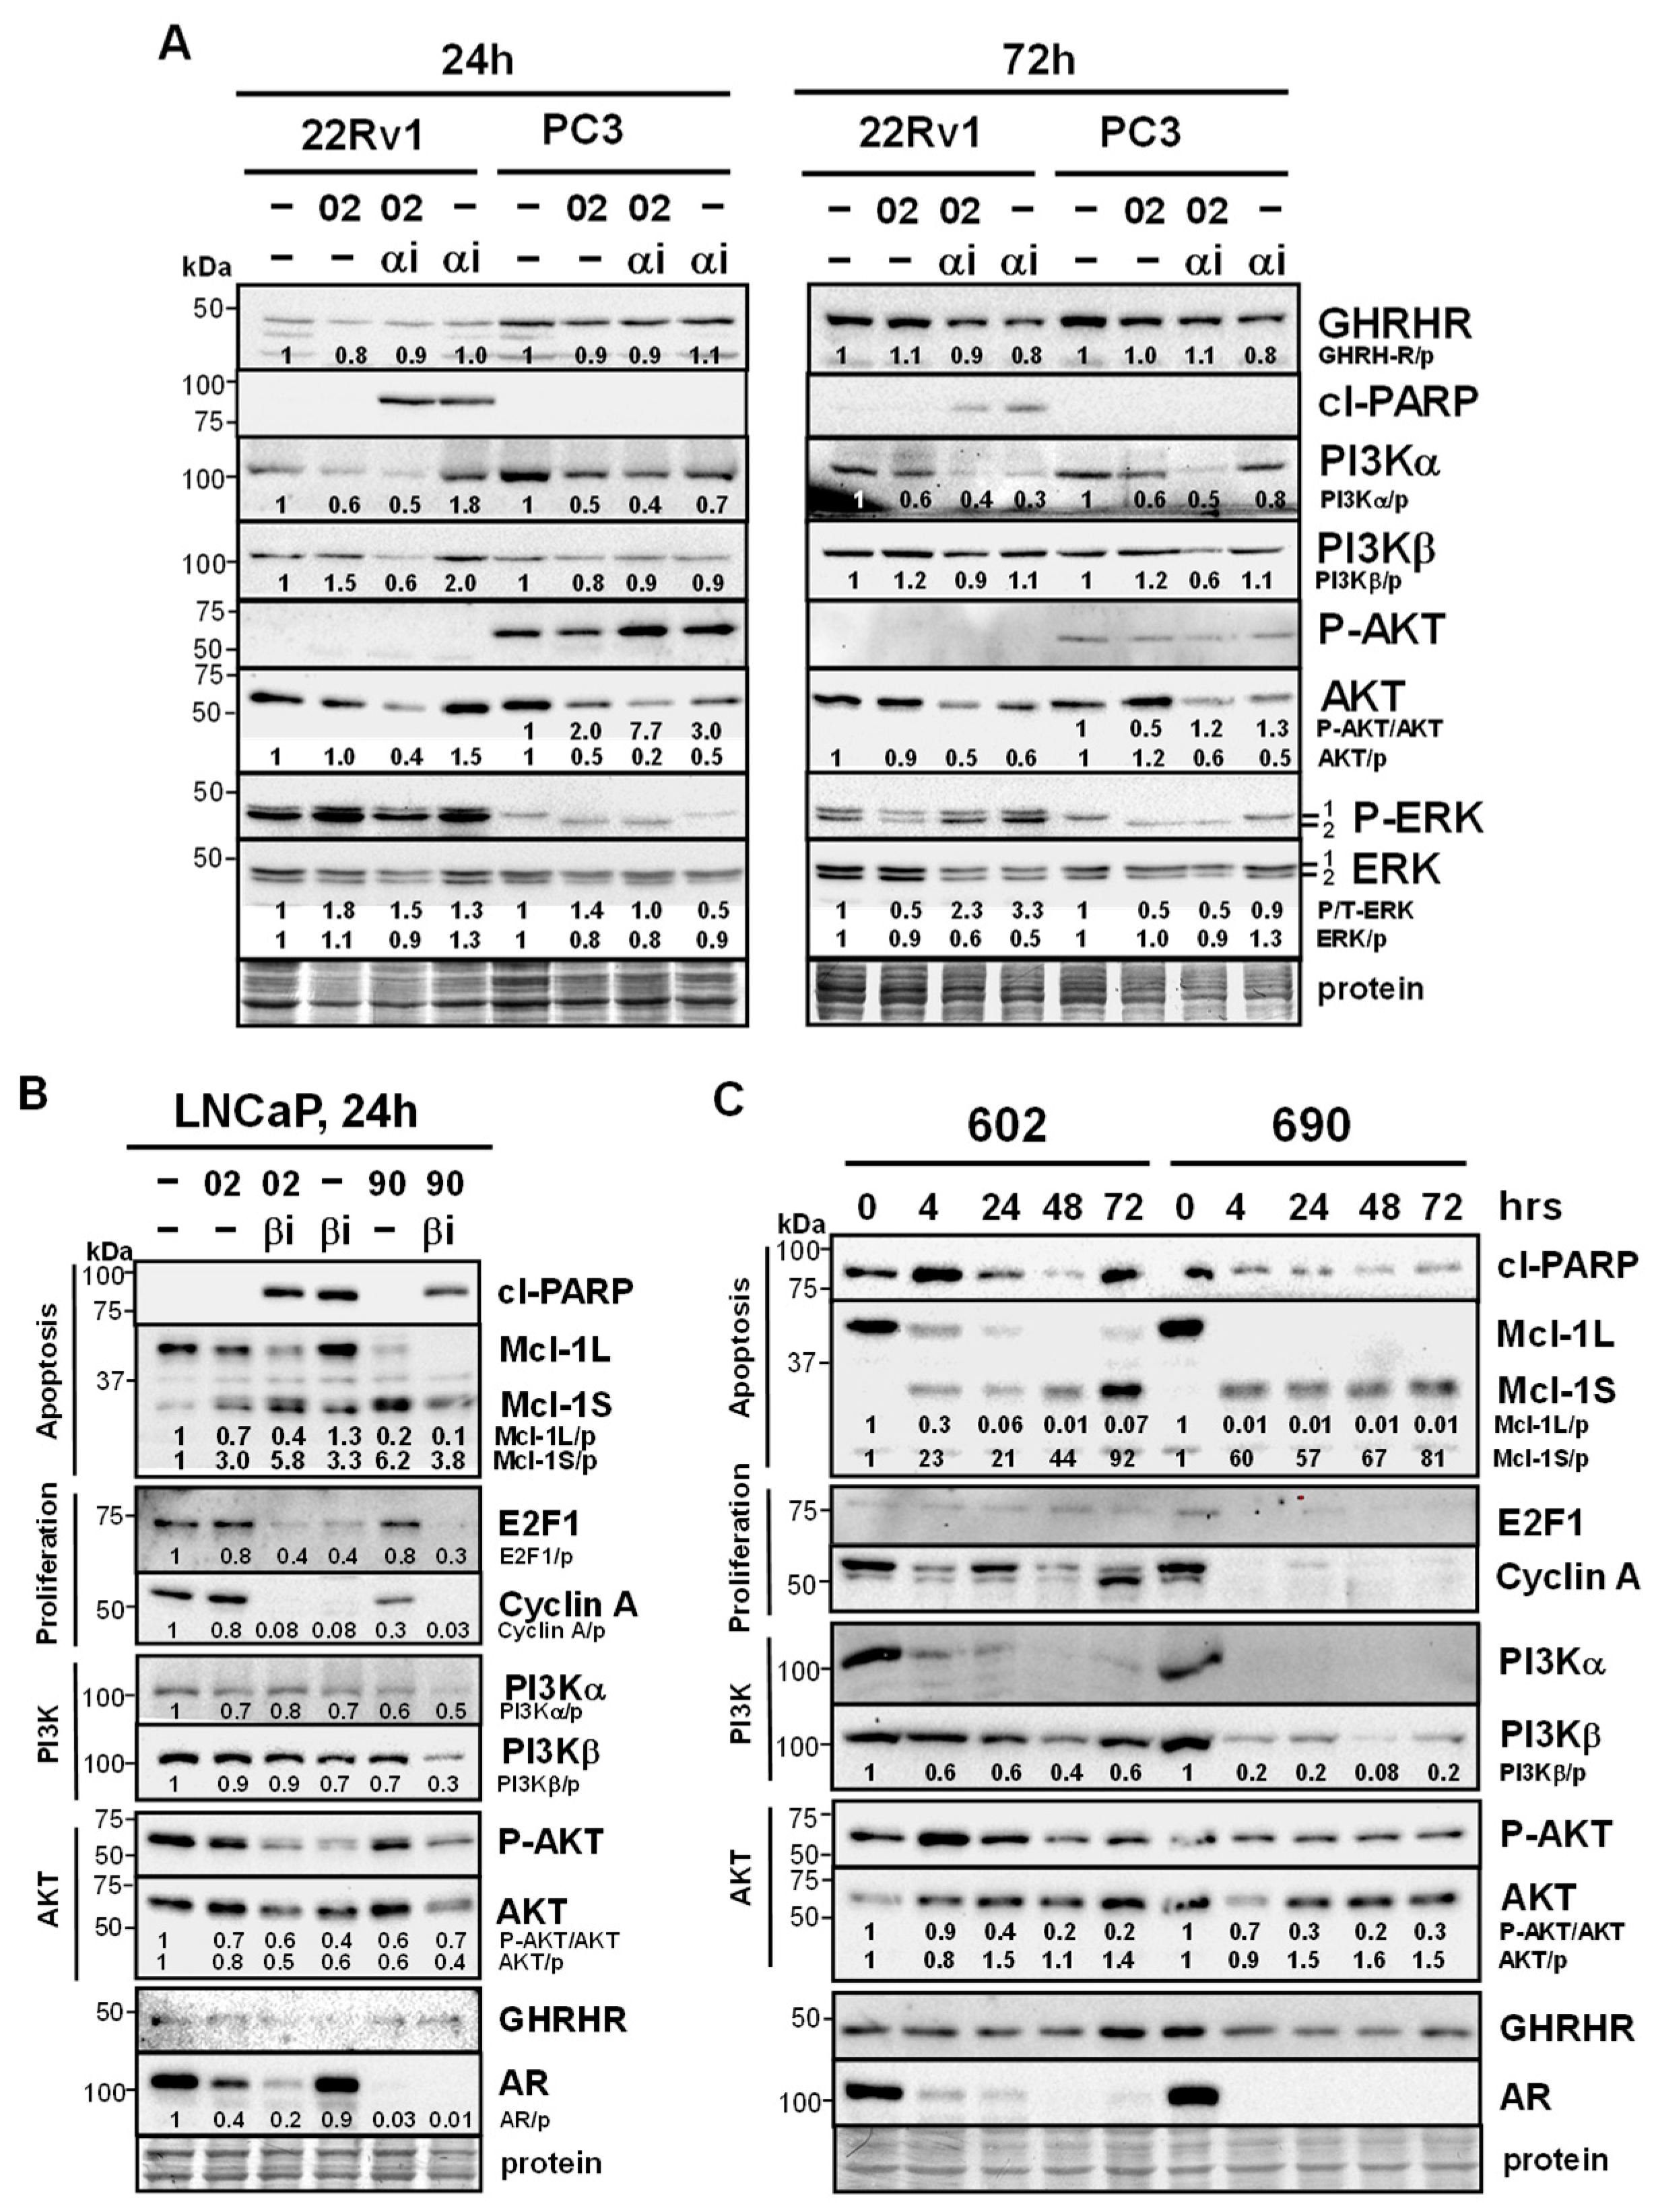
Figure 6.
MIA-602Ac and -690Ac are clinically relevant forms with similar effects on signaling pathways. (A) Trypan blue exclusion assay showed MIA-602Ac (02) or -690Ac (90) (5 mM) + PI3Kbi (bi, 25 nM) (LNCaP) or PI3Kai (ai, 10 mM) (22Rv1) significantly increased cell death compared to bi/ai, 02/90, and control cells. P values are shown near the bars. (B) Western blot analysis in LNCaP showed MIA-602Ac or -690Ac (5 mM) + PI3Kbi (25 nM) increased cl-PARP better than either alone (24, 48h). MIA-602Ac/690Ac decreased Mcl-1L (apoptosis), E2F1, cyclin A (proliferation), GHRHR (stronger with 90 at 24h), AR, and increased Mcl-1S. ERK was increased by PI3Kbi. (C) In 22Rv1, Western blot results showed MIA-602Ac/690Ac + PI3Kai (10 mM) had similar changes compared to LNCaP, with MIA-690Ac demonstrating stronger effects.

Figure 7.
Schematic summary of how MIA-602/690 alone and + PI3K isoform inhibitors is hypothesized to affect multiple signaling pathways in PCa/CRPC/NEPC. MIA-602/690 antagonizes extracellular GHRH to block GHRHR intracellular signaling. A likely consequence of the MIA-602/690 decrease in intracellular AR is an increase in PI3K activity, which is countered by adding PI3Ka or PI3Kb isoform inhibitors. In CRPC/NEPC cells that are AR negative, MIA-602/690 + PI3Ki should further reduce signaling from RTK (decreased PI3K and altered ERK). The downstream effects are a reduction in survival (anti-apoptotic Mcl-1L switch to pro-apoptotic Mcl-1S; decreased P/T-AKT/ERK), proliferation (decreased E2F1, cyclin A), and increased cell death in all types of PCa, including CRPC/NEPC.
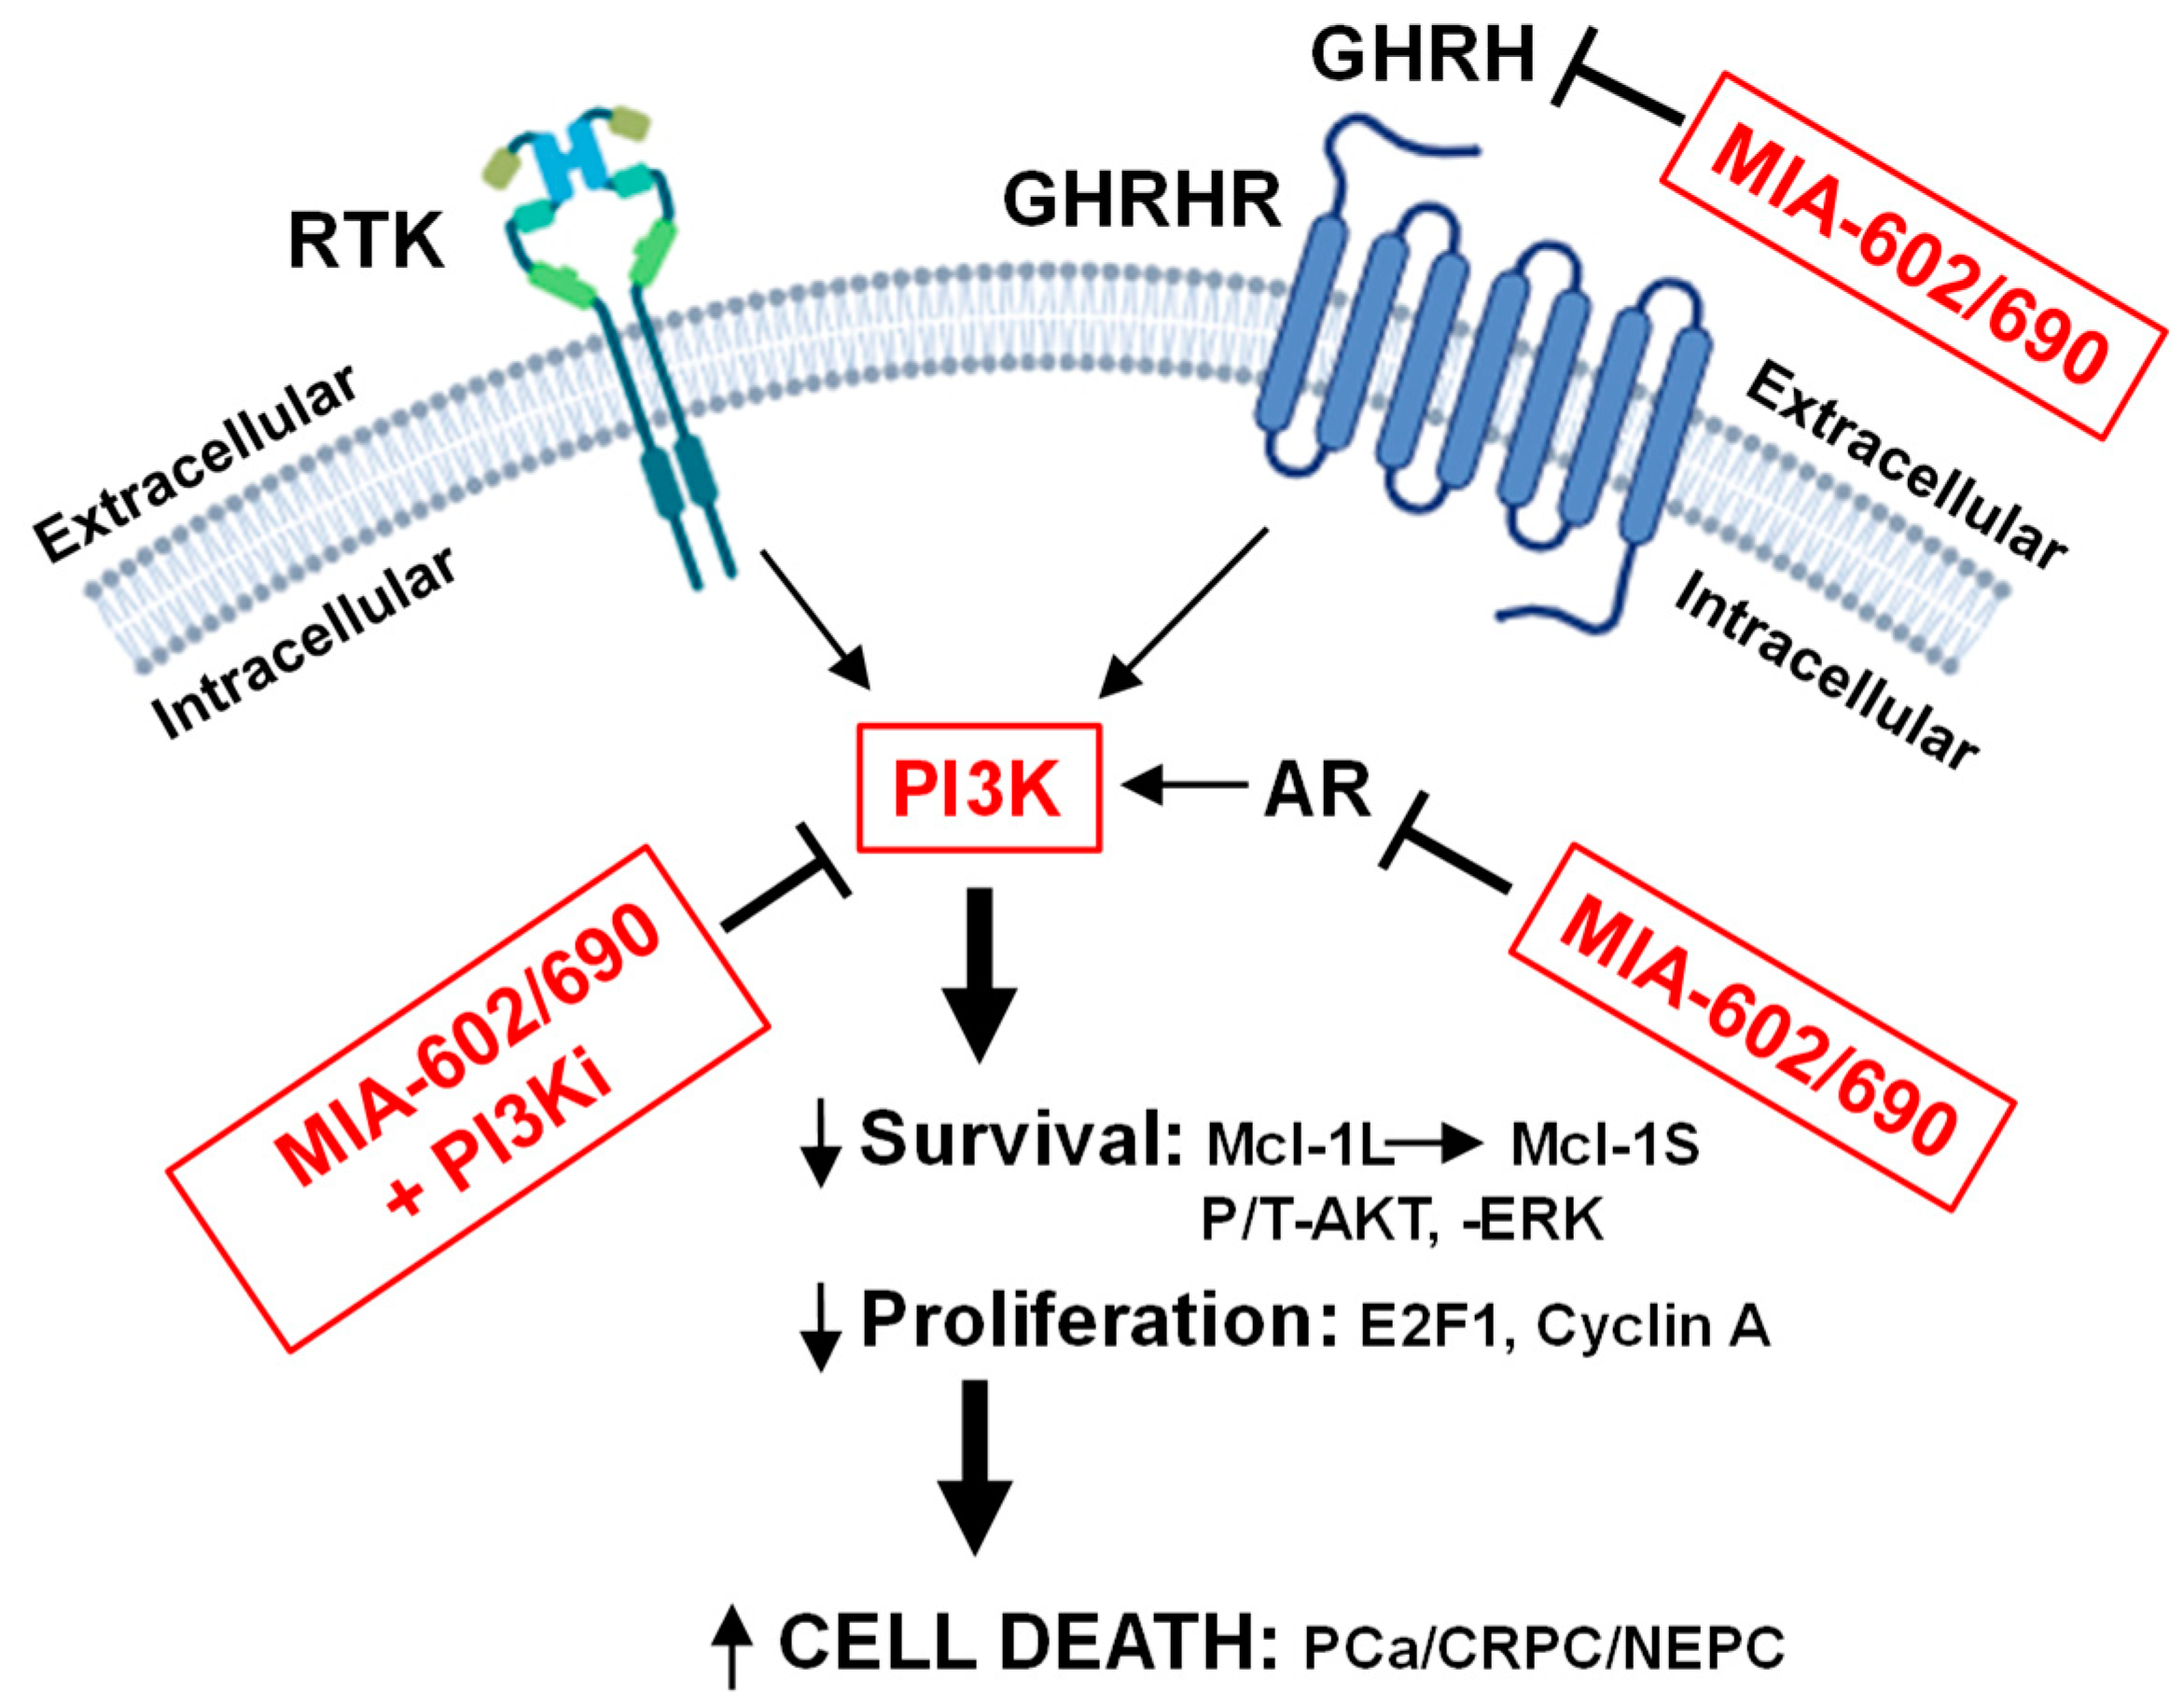

Table 1.
Characteristics of prostate cancer cell lines used in the current study.
| Cell Line | Type | AR | PTEN | AKT | p53 | Additional |
|---|---|---|---|---|---|---|
| LNCaP | AS PCa | + | mut/─ | ca | +/+ | ARmut T877A |
| 22Rv1 | CRPC | + | +/+ | wt | +/+ |
1) AR-V7 (splice variant ─LBD 2) PIK3CA mut |
| PC3 | CRPC | ─ | ─/─ | ca | ─/─ | |
| DU145 | CRPC | ─ | +/─ | wt | dn/oe | Bax null |
| H660 | NEPC | ─ | ─/─ | ca | mut | |
| LASCPC | NEPC | ─ | ca | N-myc/AKTmyr oe |
AS, androgen sensitive; mut, mutant; ca, constitutively active; wt, wild type; LBD, ligand binding domain; dn, dominant negative; oe, overexpressed; myr, mrystolated.
Disclaimer/Publisher’s Note: The statements, opinions and data contained in all publications are solely those of the individual author(s) and contributor(s) and not of MDPI and/or the editor(s). MDPI and/or the editor(s) disclaim responsibility for any injury to people or property resulting from any ideas, methods, instructions or products referred to in the content. |
© 2025 by the authors. Licensee MDPI, Basel, Switzerland. This article is an open access article distributed under the terms and conditions of the Creative Commons Attribution (CC BY) license (http://creativecommons.org/licenses/by/4.0/).
Copyright: This open access article is published under a Creative Commons CC BY 4.0 license, which permit the free download, distribution, and reuse, provided that the author and preprint are cited in any reuse.


