Submitted:
17 March 2025
Posted:
18 March 2025
You are already at the latest version
Abstract
The valorization of food waste, particularly in a manner that is decentralized has significant potential to enhance to reuse of organic wastes. A novel technology which converts raw organic waste, particularly vegetable and food waste a de-graded material in approximately 24 hours as a bio fertiliser. The material which is pathogen free and stable and has a texture similar to humic soil conditioner and an aromatic characteristic similar to that of coffee grind . This material is created through the use of a bio-digester. During the process, the food digester or bio-digester does not require any additional fresh water and has little to no grey water discharge to the sewers, environmental conditions dependent. A cultivated and unique consortium of hydrolytic and mesophilic enzymes are added to the pre-conditioned chamber that aggressively breaks down the raw material. This chamber is controlled and monitored to maintain optimum mesophilic conditions throughout the 24-hour period. During the processing of food waste, emissions were recorded as being minimal. The addition of the enzyme had a significant effect on the organic matter characteristics and on the nutrient profile on the material. The nutrient profile, pH, electrical conductivity, heavy metal content, and other parameters of the material produced from the process over a number of years was determined. These data indicate very low levels of heavy metals and reasonable levels of nitrogen (N), phosphorus (P) and potassium (K). Controlled growth studies were conducted to ascertain the comparative growth performance of a model crop, perennial rye grass when grown in soil treated with the material, biowaste compost (BWC) and composted green waste (CGW), all applied at three rates. Overall, the biomass from pots treated with degraded food waste material were higher than pots treated with a biowaste and green waste compost at com-parative application rates on a volume basis. Analysis of the grass for agronom-ically important macronutrients, such as N, P and K, indicated higher uptake rates of these nutrients in the experimental material treated pots over four harvests. Despite higher uptake the residual total nitrogen (N) and available phosphorus (P) and potassium (K) were higher in the soil after the 4th harvest. The product produced from the food waste processing has a high potential as a viable organ-ic/biofertilizer fertilizer and fits in with the EU strong policy of the Circular Economy and new EU Fertiliser Regulations which promotes organic fertilizer as against mineral fertilizer. The most substantial benefits of such a technology are both the very short turn around and the reduced emissions of GHG gasses re-leased during the processing.
Keywords:
nutrient release
; green waste compost
; biowaste compost
; residual nutrients
; emissions
; FTIR
; heavy metals
1. Introduction
There is a great deal of interest in treating foodwaste at source be it by kitchen digestors/dehydrators home and industrial composting (Dong-Qing Zhang et al., 2008, Jiao Ma et al., 2018,Cerda et al. 2018, Lucas Lourenço et al., 2018 Castiglioni Guidoni et al 2018).
A novel technology has been developed which processes raw organic wastes, typically canteen waste from commercial sites, food factories and onsite canteens, into an agronomic product/biofertilizer that can then be used on green or landscaped areas around the premises. According to a report by the US Compost Council and ILSR (US institute for Local Self-Reliance), on-site composting should be prioritized over large scale, decentralized composting sites. A life-cycle analysis performed by the European Environment Agency on the greenhouse gas emissions (GHG) from municipal solid waste management, also concluded that home composting has the best environmental performance as “direct emissions from home composting are negligible (very little methane is emitted) if composting is done well, largely due to there being no transportation involved [ EEA Report No 3/2011).]. The Harp process involves minimum transportation. The final product however, should not be considered as a compost, but as an organic/biofertilizer fertilizer and soil improver.
By utilizing technology which rapidly degrades organic material at source, this removes the need for collection and transportation of organic waste, eliminating the demand for diesel powered heavy good vehicles, traceability can be improved, potential cross contamination of other recycling streams can be minimized and inefficiencies/emission losses in large scale composting sites can be mitigated. The examined process/technology in this study is fully automated to mechanically rotate the material while at the same time removing excess steam or vapour while drawing in fresh air for improved aeration. The raw material slowly passes through a reactor at around 55 to 75 degrees centigrade. A cultivated consortium of hydrolytic and mesophilic enzymes are added that aggressively breaks down the raw material. that the unit controls internal environmental factors, such as moisture and temperature, which favor mesophilic breakdown of the substrate, ensuring the material output achieves a pasteurization process temperature of 70 degrees centigrade for a minimum of 1 hour before it is deposited from the unit. The biodigester reduces the organic mass by about volume of 70% on average, however this is feedstock dependent. The process produces a material which is visually similar to the widely available kitchen digestors [ Alexander 2023)] but is not the same as a unique blend of enzyme is added and the scale of operation is large scale, up to 5 ton per day. Little information is available on the agronomic performance of the kitchen digestor’s final product except for germination tests to test for phytotoxicity [Azis et al 20193]. This material is also sometimes wrongly classified as “compost”. There is almost no information to our knowledge, limited information on the materials suitability for supporting plant growth. [Aziz et al., 2023] did study the effect of the thermal dried material on plant performance but it was restricted to only germination. To that end, as mentioned earlier there are no studies we can identify on the agronomic performance of rapidly degraded materials such as that produced by the process assessed in this study, nor is there published detail on the impact of enzyme addition on the change in the nature of the organic matter during thermal drying. It should be emphasized that the product and process which are the focus of this study, although also derived from food waste and which may have some similarities to the kitchen digestors, there are important differences in the processes (addition of enzyme, scale). The primary objective of this study was to determine the quality of the end product, as evidenced primarily by nutrient release characteristics of N, P and K for use as an organic/biofertilizer using plant growth test and determining nutrient uptake and comparing it to commercial biowaste compost, BWC (from brown bin) and a commercial green waste compost (CGW). Residual nutrients in the soil after four harvests (160 days) were analyzed based on the total nitrogen and soil test for phosphorous and potassium to study the residual effect of these amendments. Other objectives of the study were to quantify the emissions from the production process and changes in the composition of organic matter due to enzyme addition as evidenced primarily in the change of the FTIR spectra. Heavy metal and N, P and K content of the Harp Product over a period of time was also examined.
2. Materials and Methods
Organic Degradation Process (Harp process)
The technology is fully automated to mechanically rotate the material while at the same time removing excess steam or vapor while drawing in fresh air for improved aeration. The composter is also equipped with an activated carbon filter to remove unwanted odours.
During the process, the food digester or biodigester does not require any freshwater or water connection and has little to no grey water discharge to the sewers, environmental conditions dependent. A cultivated and unique consortium of hydrolytic and mesophilic enzymes are added to the preconditioned chamber that aggressively breaks down the raw material. This chamber is controlled and monitored to maintain optimum mesophilic conditions throughout the 24-hour period. The raw material slowly passes through a rector at around 55 to 75 degrees centigrade. A cultivated and unique consortium of hydrolytic and mesophilic enzymes are added that aggressively breaks down the raw material. A computerized PLC unit that controls internal environment factors, such as moisture and temperature, which favour mesophilic breakdown of the substrate, ensures the material output achieves a pasteurization process of 70 degrees centigrade for a minimum of 1 hour before it is deposited from the unit. The biodigester reduces the organic mass by about volume of 70% on average.
Emissions
Emissions on a limited number of parameters, using a colourmetric tube was outsourced to Axis Environmental Services, Limerick, Ireland. Sampling and analysis of dust was carried out in accordance with the methodology MDHS-14. Volatile Organic compounds monitoring was carried out by the standard method MDHS-96 using gas chromatography. Monitoring was also carried out on the outlet gases (NH3, Mercaptans, Hydrogen Sulphide and Amines using colourmetric tubes [Axis Environmental Services 2016]
Heavy Metals
Heavy metal content on the final product was measured on numerous occasions using acid digestion and ICP [IS EN 13650:2001]
Enzyme Addition
The study on the effect of enzyme addition on the organic composition, pH and nutrient availability was studied by heating the material to 70°C with and without the addition of enzyme on three occasions. FTIR-ATR was used on the samples. The spectrum range of the FTIR was 800cm-1 to 4000cm-1 with a resolution factor with 3 sample views for each sample on the absorption mode. A base line was drawn between 3600 cm-1 and 1500 cm-1 and between 1500cm-1 and 650cm-1 and the height was measured using a ruler as shown in the diagram. pH and EC were measured using EN methods and nutrients were measured using CAT extractant [] IS EN 13037-2002, IS EN 13038-2002 and IS EN 13651-2002)
Nutrient Profile and Growing Trial
The total organic carbon (TOC), N, P and K and other macro and micronutrients on treated food waste by the degradation process were analysed [EN 13039:2011, IS EN 13654-2:2002, IS EN 13650:2001]
The parameters for the biowaste compost and green waste compost were evaluated [Prasad, M. and Foster, P., 2008 and Prasad, M.et al.,2012]. We then evaluated the Harp product, Biowaste compost (BWC) and green waste compost (CGW) as an effective organic fertilizer by studying nitrogen, phosphorus, and potassium release characteristic by measuring their plant/crop uptake of perennial ryegrass, which was used as a model crop. The methodology for this study was based on [Prasad, et al., 2012]. Composted green waste and composted biowaste (mostly food waste) were included for comparative purposes. Although the three materials were added at a similar volume basis (4,8 and 12%), the resultant addition rates of various nutrients were not equal, see Table 7. There were four harvests of grass over a period of 160 days. Due to a lack of growth after two harvests from CGW, this treatment was discontinued. Fresh weights, dry weights and the macronutrient & micronutrient analysis were done on all four cuts to determine nutrient uptake. Mineral content in the upper plant biomass (including leaves and shoots) was determined on four replicates/treatment (two pooled plants/replicate). Plant tissue was dried to constant weight (at 65 °C for 3 d) and sub samples (~ 0.5 g) were ashed (at 500 °C for 5 h) and acid (2 N HCl) digested ( Chrysargyis et al., 2016). Nitrogen (N) content was determined with Kjeldahl (BUCHI, Digest automat K-439 and Distillation Kjeldahl K-360) digestion method. Phosphorus content was determined with spectrophotometer (Multiskan GO, Thermo Fischer Scientific, USA), and K, Mg, Ca, and Na by an atomic absorption spectrophotometer (PG Instruments AA500FG, Leicestershire, UK) for plant tissue analysis. Plant mineral content multiplied by dry weight gave the nutrient uptake and was expressed in mg. Nutrient content in the roots of the plant was not counted.
Data on the major macronutrients is included in the results section, with additional data on other macro and micronutrients included in the supplementary data. In addition, at the completion of the final harvest, composite soil samples were taken and the residual C (loss of ignition) and total N and available nutrients (Mehlich P and K) left in the soil were determined.
3. Results and Discussion
3.1. Effect of Addition of Enzymes Versus Thermal Drying
The FTIR spectra (Figure 1) shows clearly that the nature of the organic matter in the food waste has changed as result of the addition of the enzyme. Significant differences in the height of the various band numbers and the ratios of the heights and the assignment of the FTIR bands are given in Table 2.
The results indicate that changes occurred mostly in the soluble and easily decomposable organic matter e.g., carbonyl 1740 cm-1, alkyl 2922 cm-1, with little or no change in the aromatic structure 1630 cm-1. Furthermore, the ratio of the peaks 1740cm-1/1071cm-1 decreased. This indicates an overall decrease in the carbonyl content upon treatment. Similarly, there was a decrease in the ration 2920cm-1/1620cm-1 showed the relative enrichment of aromatic structure vis a vis alkyl structure.

Table 1.
Reduction (or increase) of the height of selected wave numbers and ratios, as a result of the addition of enzyme.
Table 1.
Reduction (or increase) of the height of selected wave numbers and ratios, as a result of the addition of enzyme.
| Wave Number cm-1 | Significance Level |
|---|---|
| 3200 | p=0.086 NS OH (phenols, carboxylic groups) |
| 2930 | p=<0.001 C-H stretching of alkyl structures |
| 2830 | p=<0.001 C-H stretching of alkyl structures |
| C=O stretching of carboxyl, acids and ketones | |
| 1720 | p=<0.001 ketones |
| 1620 | NS Aromatic C=C. COO-, C=O |
| 1460 | p=<0.0001 C-H stretching of aiphatic structures |
| 1148 | p=<0.001 C-O stretching of polysaccharides |
| 1017 | p=<0.002 Increase silica, carbohydrates |
| 2920/1620 | p=<0.001 |
| 1720/1017 | p=0.001 |
These results are in agreement with the findings of Zhang et al. 2008, which showed inoculation albeit with microorganism accelerated the organic matter degradation. However, their results were over a longer period of time.
The effect of enzyme addition on extractible nutrients and electrical conductivity (see Table 3) showed no statistically significant effect although there were trends towards slight increase, however pH was trending upwards.
Table 2.
Effect of enzyme addition on pH, EC and extractable N, P and K.
| pH | EC | Ext.N | Ext.P | Ext.K | |
|---|---|---|---|---|---|
| μS/cm | mg/L | mg/L | mg/L | ||
| Untreated | 5.0 | 7793 | 35.8 | 973 | 5566 |
| treated | 5.3 | 8250 | 44.2 | 1360 | 7541 |
| Sig. | x | NS | NS | NS | NS |
The heavy metal content levels of the Harp product are extremely low, see Table 3. In the context of the new EU fertilizer regulations [REGULATION EU 2019/1009),], we can see they are very well within any tolerance or required levels.
The analysis of plant nutrient content over a longer period of time (over 4 years) indicated reasonable levels of N, P and K and the contents fall within the criteria of the new fertilizer regulations NPK index of 4.1 [NPK Index EU Fertilizer Regulations 2019e], Table 4.The carbon content of the sample is very high indicating little or no loss of carbon during the process.
Emissions
During the processing of food waste, emissions were minimal, with ammonia <1 ppm, H2S < 0.1 ppm, amines <0.5 ppm and mercaptans <0.5ppm. Much of the carbon is retained within the substrate in the form of organic carbon and therefore mitigating much of the carbon volatilization in the form of CO2 emissions. Total Dust and Respirable Dust was a % of TWA limit < 2.1 and 7.91 respectively. There was no change in Volatile organic Carbon after 8 hours reference was 0.278 mg/m3 (Report available as supplementary information) [Axis Environmental Services. Limerick 2016).]. As mentioned above, processing of the food waste, emissions were minimal with theoretical reductions in Methane and Nitrous Oxide of 46-69% and 73% compared to traditional composting methods respectively [Cerda et al., 2018.Cao, Y. et al., 2019 ,EEA Report No 3/2011,Hwang et al.,2020] Cerda et., al has shown that composting can lead to significant amounts of GHG emissions
Plant Growth Trial
The pH analysis for the Harp material, at 5.5 is low for what would typically be expected for a compost (Table 5). The EC for the Harp material is very high potentially indicating high salt levels due to higher nutrient content. The organic matter content is very high compared to BWC and CGW 2 to 4 times higher than the BWC and CGW respectively.
Extractable Nitrogen content are much higher in the Harp product and lowest in CGW (Table 6)
Table 6.
Available nitrogen content of materials tested.
| Ammonium (NH4+) | Nitrate (NO3-) | ||||
|---|---|---|---|---|---|
| Material | Dry Sample (mg/Kg) | Fresh Sample (mg/L) | Dry Sample (mg/Kg) | Fresh Sample (mg/L) | |
| Harp product | 427.4 | 210 | 103.8 | 51 | |
| Greenwaste | 79 | 20 | 122.5 | 31 | |
| BioWaste | 227.5 | 128.5 | 211.5 | 119.5 | |
Table 7.
Influence of application rates on volume basis on the addition of total N and available macronutrients and organic matter regarding the pot trial.
Table 7.
Influence of application rates on volume basis on the addition of total N and available macronutrients and organic matter regarding the pot trial.
| Application Rate (Volume/ml) | Weight of Addition (g) | Dry Weight of Addition (g) | TKN (Addition) (g) | NH4 (Addition) (g) | NO3 (Addition) (g) | P (Addition) (g) | K (Addition) (g) | Organic Matter (g) | Organic Carbon (g) | |
|---|---|---|---|---|---|---|---|---|---|---|
| Harp product (4%) | 80 | 45.6 | 39.31 | 1.217 | 0.0168 | 0.0041 | 0.0481 | 0.4720 | 35.179944 | 20.439744 |
| Harp product (8%) | 160 | 91.2 | 78.61 | 2.435 | 0.0336 | 0.0082 | 0.0962 | 0.9440 | 70.359888 | 40.879488 |
| Harp product (12%) | 320 | 136.8 | 117.92 | 3.652 | 0.0504 | 0.0122 | 0.1443 | 1.4160 | 105.539832 | 61.319232 |
| Greenwaste (4%) | 80 | 46.16 | 20.22 | 0.472 | 0.0016 | 0.0025 | 0.0060 | 0.1707 | 9.1992264 | 5.3577912 |
| Greenwaste (8%) | 160 | 92.32 | 40.44 | 0.944 | 0.0032 | 0.0050 | 0.0120 | 0.3414 | 18.3984528 | 10.7155824 |
| Greenwaste (12%) | 320 | 138.48 | 60.65 | 1.416 | 0.0048 | 0.0074 | 0.0180 | 0.5120 | 27.5976792 | 16.0733736 |
| Biowaste (4%) | 80 | 49.6 | 45.19 | 0.616 | 0.0103 | 0.0096 | 0.0034 | 0.1117 | 10.392688 | 6.0548704 |
| BioWaste (8%) | 160 | 99.2 | 90.37 | 1.232 | 0.0206 | 0.0191 | 0.0067 | 0.2233 | 20.785376 | 12.1097408 |
| Biowaste (12%) | 320 | 148.8 | 135.56 | 1.848 | 0.0308 | 0.0287 | 0.0101 | 0.3550 | 31.178064 | 18.1646112 |
The data over the 4 harvests (2 harvests for CGW) over 160 days showed that the Harp material has a consistently higher fresh weight than the comparative compost treatments indicating sustained availability of nutrients from the material, Figure 2.
As expected, nitrogen uptake (Figure 3) effectively mirrored fresh weight returns. As the experiment progressed through the harvests, the impact of application rate and initial nitrogen application seem to have had an impact. In terms of recovered nitrogen from the grass samples harvested from each pot, the comparative nitrogen uptake in the pots with Harp material applied to the biowaste pots was 12.5 times higher at 4% application rate, 7.44 times higher at 8% application rate, and 4.6 times higher at 12% application rate.
Therefore, the comparative efficacy in terms of nitrogen uptake is more pronounced at lower application rates. Given that there will possibly be agronomic and environmental constraints on applications at the tested higher rates. The performance at the lower rate of treated are significant. Uptake of P and K followed a similar pattern to N uptake.
With regards to phosphorus and potassium uptake, due to the application rates of P and K being variable between the three materials due to different P and K content despite the rates on volume basis being similar it followed a similar scenario to N uptake (Figure 4). Significantly more available phosphorus was present in the Harp material than in the CBW or the CGW material. The recovery (uptake) of phosphorus and to a lesser extent potassium from materials subjected to the Harp treatment process may be beneficial from a purely agronomic and resource utilization perspective. Given the lack of naturally occurring phosphorus resources within the EU, greater emphasis is being placed on technologies and processes for the recovery and utilization of phosphorus from organic waste streams.
With regards to magnesium, calcium, and Sulphur uptake, similar to the scenario with nitrogen, it is an indication that the elements were available to be taken up by the plant. Data available as supplementary information.
Figure 5.
Post cropping soil content and characterisation analysis of Harp material and composts.
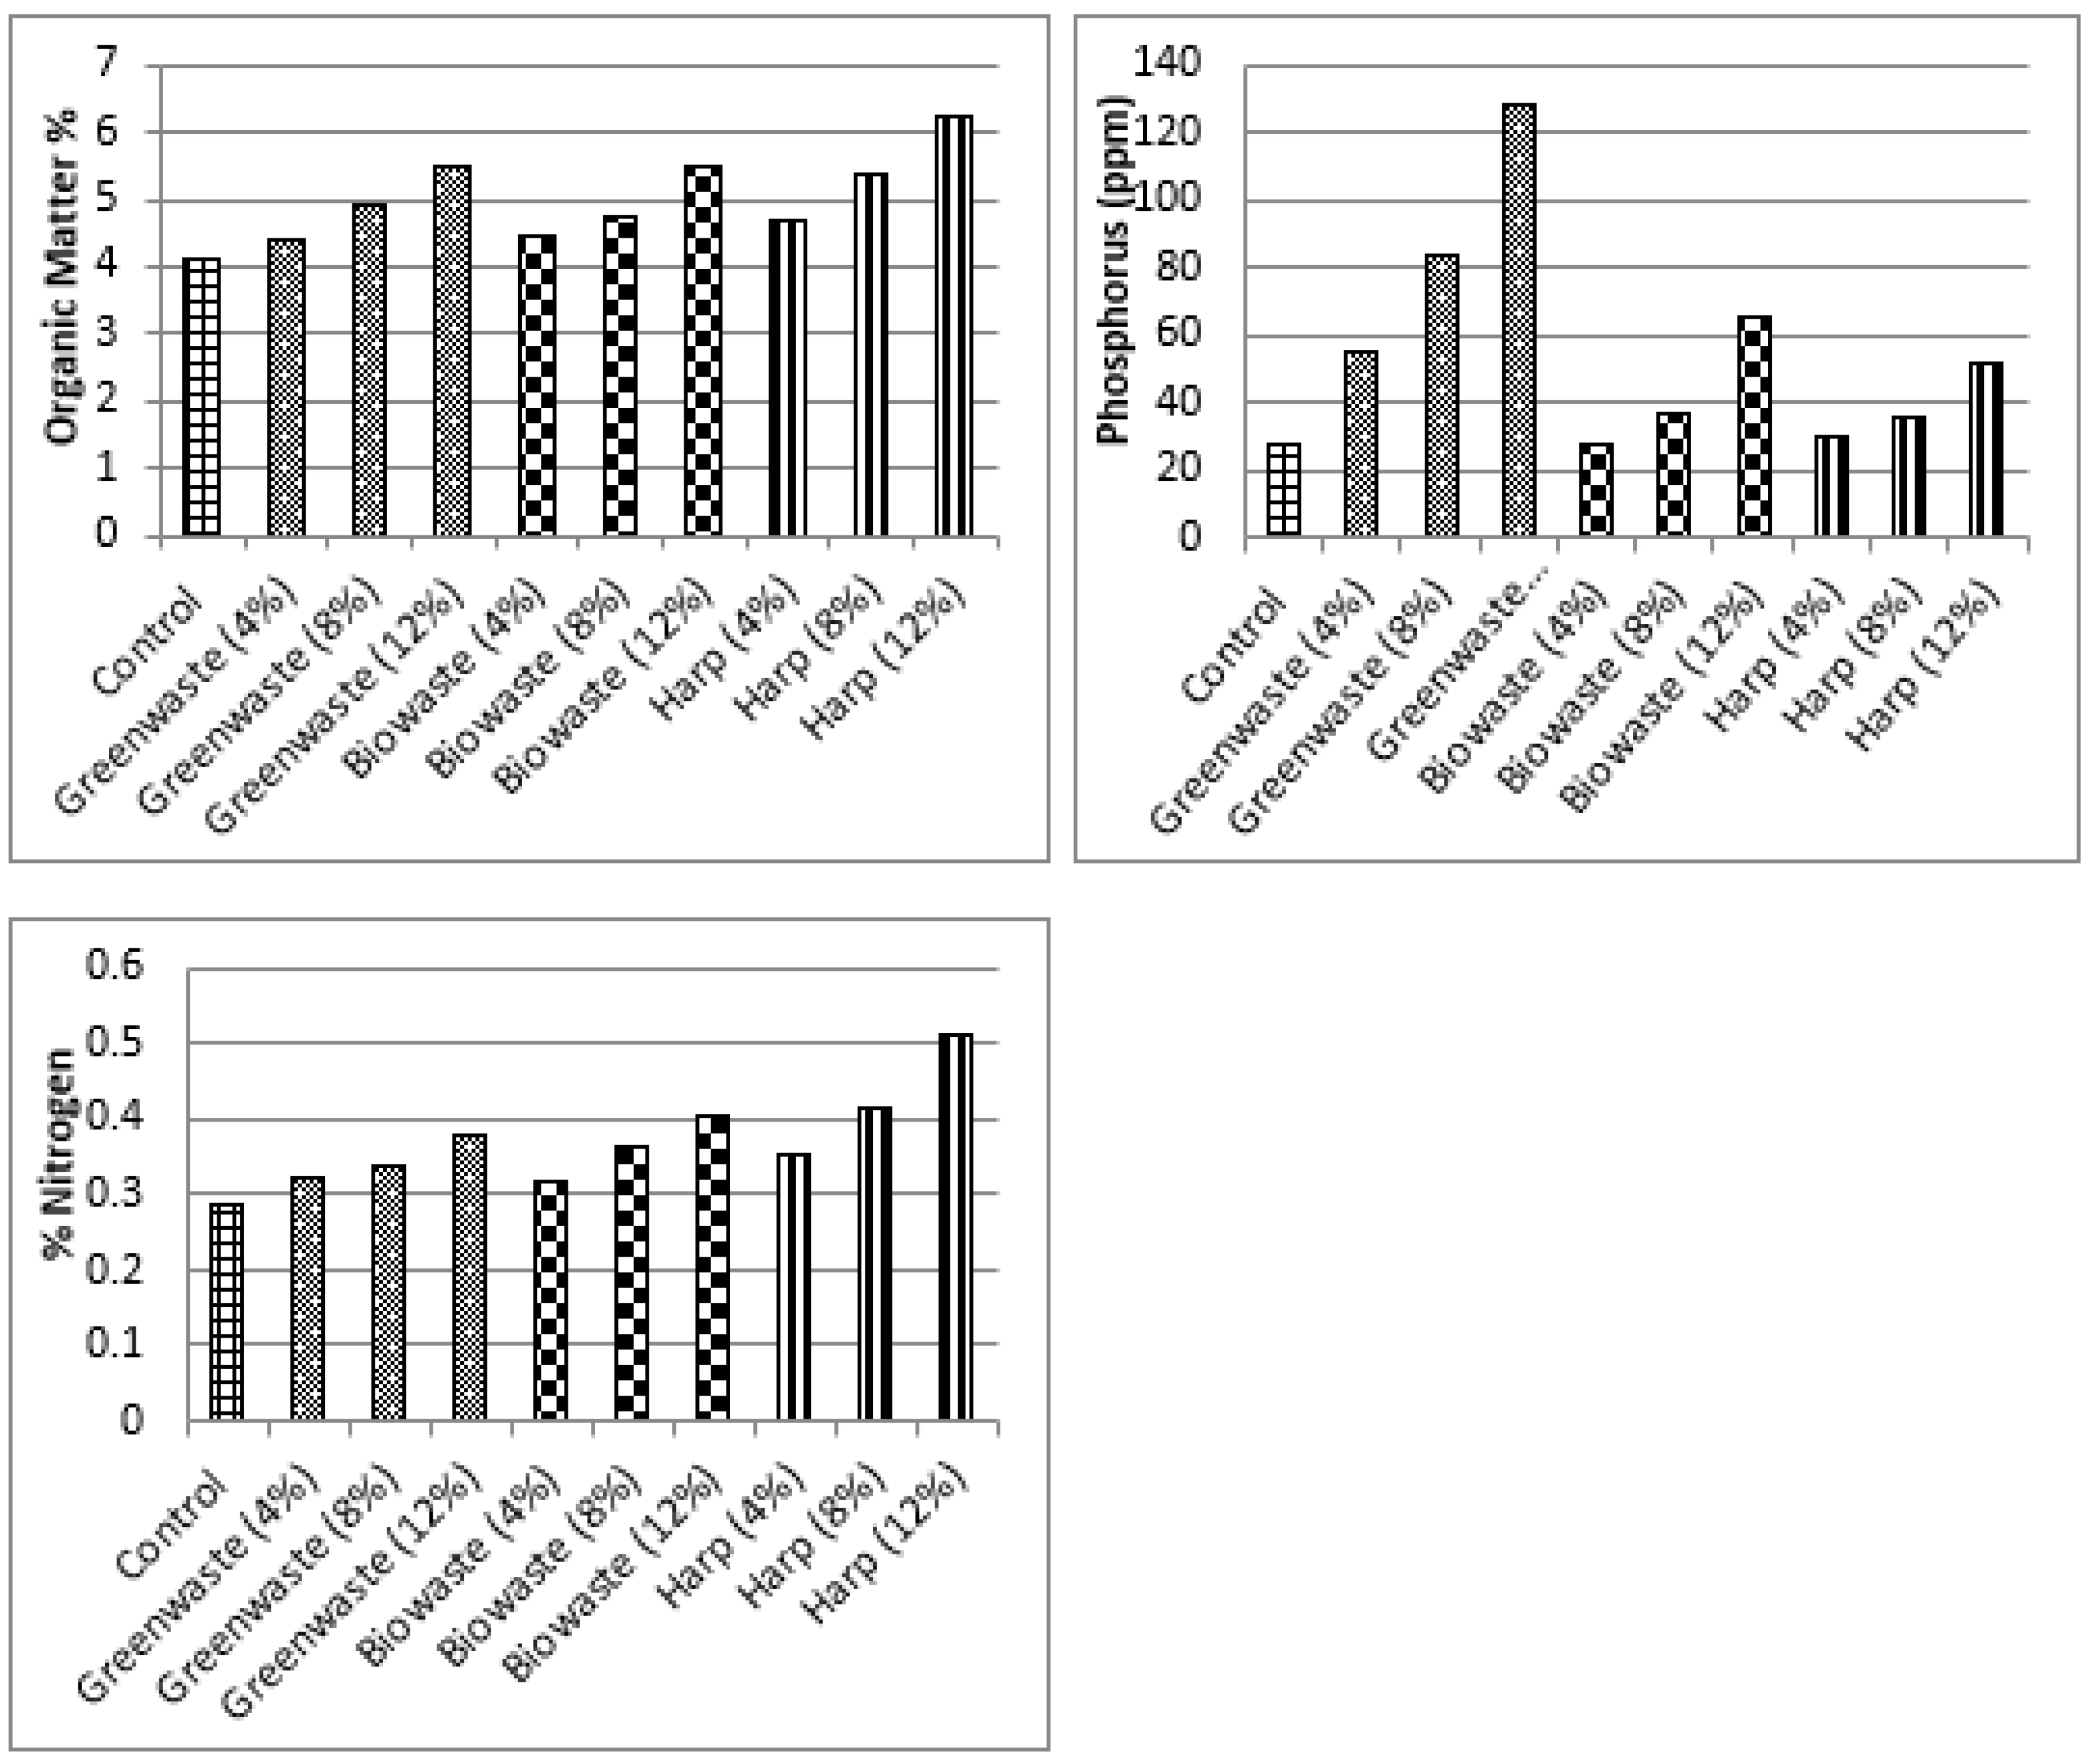
In relation to the residual organic matter in the soil, the application of Harp materials had a positive impact on organic matter levels, which was expected given the high organic matter content on the material. Despite the higher macronutrients uptake by plants during the cropping period, the fact that there is still residual nitrogen (total N), and extractable phosphorus left after cropping comparable to BioWaste compost is of interest and reflective of the comparatively high nutrient value of the Harp material. (GW compost not comparable as only two harvests taken due to lack of growth and minimal nutrient uptake by grass occurred)
On average, food waste processed using this Harp technology achieve, a Total Organic Carbon (TOC) of over 45% (n=70). Comparing this to the Carbon content of a number of bio-waste and greenwaste compost from Ireland, UK and Switzerland of 23% to 34% (Prasad et al., 2012)e the levls of organic matter is very high.)With over 70 analyses performed on Harp treated food waste, the median percentage N-P2O5-K2O values are estimated at 2.8-0.8-1.5 or an NPK index of 5.1% as shown inTable 4 which meet the minimum nutrient limit of 4% in the EU Fertiliser Regulations 2019/1009 [] and the minimum nutrient value for all fertiliser regulations across the United States [SUMMARY STATE FERTILIZER LAWS 2003)].
4. Conclusions
In conclusion, the product from the Harp food waste processing procedure has high potential as a viable organic/ biofertilizer and fits within the EU policy on the Circular Economy and new EU Fertiliser Regulations which promotes organic fertiliser as against mineral fertiliser , and the need to reduce dependence on imported phosphate raw material with almost all comes from outside the Europe. Although visually the material appears similar to compost, oxygen uptake rate analysis would indicate the material is not stable. It should be classified as an organic/biofertilizer fertilizer and to a lesser extent a soil improver. A significant advantage of the system is that it is deployable in a podded system, at a local level, is rapid and has a low emissions profile, creating a lower C footprint and a lower GHG emission in relation to traditional aerobic composting processes. This has the potential to improve environmental metrics of many businesses which jproduce large amounts of organic wastes.
Supplementary Materials
The following supporting information can be downloaded at the website of this paper posted on Preprints.org.
Acknowledgments
Grateful thanks are due to Joe Cowley and Gerry McDonell of Harp Environmental for their helpful suggestions and to Emma Finnegan for the help with the document?
References
- Alejandra Cerda, Adriana Artola, Xavier Font, Raquel Barrena, Teresa Gea, Antoni Sánchez.
- A Composting of food wastes: Status and challenges.
- Bioresource Technology 248 (2018) 57–67. [CrossRef]
- Alexander, R- Composting, Food Waste, Markets.
- Electric Kitchen “Composter” Confusion, Biocycle September 25, 2023.
- Axis Environmental Services. Limerick 2016, Report No.4580-16-01 www.axisenv.ie.
- Azis, F.A.; Choo, M.; Suhaimi, H.; Abas, P.E. The Effect of Initial Carbon to Nitrogen Ratio on Kitchen Waste Composting Maturity. Sustainability 2023, 15, 6191. https:/doi.org/10.3390/su15076191.
- Cao, Y. et al., Mitigation of ammonia, nitrous oxide, and methane emissions during solid waste.
- composting with different additives: A meta-analysis, J. Clean. Prod., vol. 235, pp. 626–635, Oct.
- 2019. [CrossRef]
- Chrysargyris, A., Panayiotou, C., Tzortzakis, N., 2016. Nitrogen and phosphorus levels affected plant growth, essential oil composition and antioxidant status of lavender plant (Lavandula angustifolia Mill.). Ind. Crops Prod. 83, 577–586. [CrossRef]
- Dong-Qing Zhang, Pin-Jing He *, Tai-Feng Jin, Li-Ming Shao.
- Bio-drying of municipal solid waste with high water content by aeration.
- procedures regulation and inoculation.
- Bioresource Technology 99 (2008) 8796–8802. [CrossRef]
- EEA Report No 3/2011, Using a life-cycle perspective, this report analyses the greenhouse gas emissions (GHG) from municipal solid waste management in the EU.
- Hwang HY, Kim SH, Shim J, Park SJ. Composting Process and Gas Emissions during Food Waste Composting under the Effect of Different Additives. Sustainability. 2020; 12(18):7811. [CrossRef]
- IS EN 13037-2002 Determination of PH.
- IS EN 13038-2002 Determination of Electrical Conductivity.
- IS EN 13650:2001 Extraction of aqua regia soluble elements.
- IS EN 13654-2:2002 – Soil improvers and growing media – determination of N – part 2 Dumas method.
- IS EN 13651-2002 Soil Improvers and Growing Media -Extraction of Calcium Chloride/DTPA (CAT), Soluble nutrients. 2002.
- IS EN 13038:2011 Soil improvers and growing media –Determination of Electrical Conductivity.
- IS EN 13039:2011Soil improvers and growing media - Determination of organic matter content and ash.
- Jiao Ma, Lei Zhang, Lan Mu, Kongyun Zhu, Aimin Li.
- Thermally assisted bio-drying of food waste: Synergistic enhancement and energetic evaluation. Waste Management 80 (2018) 327–338. [CrossRef]
- JRC-IPTS (Joint Research Centre Institute for Prospective Technological Studies), 2008. End-of waste Criteria. Draft report. European Commission Joint Research Centre, Seville, Spain.
- Naturemill composters http://www.peoplepoweredmachines.com/naturemill/naturemill_plus.htm.
- Lucas Lourenço Castiglioni Guidoni , Roger Vasques Marques ,Rodrigo Bilhalva Moncks, Fabiana Torma Botelho, Matheus Francisco da Paz,Luciara Bilhalva Corr^ea , _Erico Kunde Corr^ea.,.
- Home composting using different ratios of bulking agent to food waste.
- Journal of Environmental Management 207 (2018) 141-150. [CrossRef]
- Prasad, M. and Foster, P., 2008. Development of an Industry-led Standard Quality Standard for Source separated Biodegradable Materials Derived Compost. Environmental Protection Agency, Johnstown Castle, Ireland.
- Prasad, M., Lee, A. and Gaffney, M.T., 2012. A Detailed Chemical and Nutrient Characterization of Compost and Digestate Fiber. rx3, Department of Environment, Dún Laoghaire, Ireland.
- REGULATION (EU) 2019/1009, Laying down rules on the making available on the market of EU fertilising product, Publishing European Commission Web portal. https://eur-lex.europa.eu/legal-content/EN/TXT/PDF/?uri=CELEX:32019R1009&from=EN.
- SUMMARY STATE FERTILIZER LAWS 2003, Fertilizer Institute Product Quality &Technology Committee Publishing document. site. https://documen.site/download/2003-summary-state-fertilizer-laws_pdf.
Figure 1.
Effect of Addition of Enzymes against thermal drying. FTIR analysis: untreated vs Treated( untreated broken lines).
Figure 1.
Effect of Addition of Enzymes against thermal drying. FTIR analysis: untreated vs Treated( untreated broken lines).
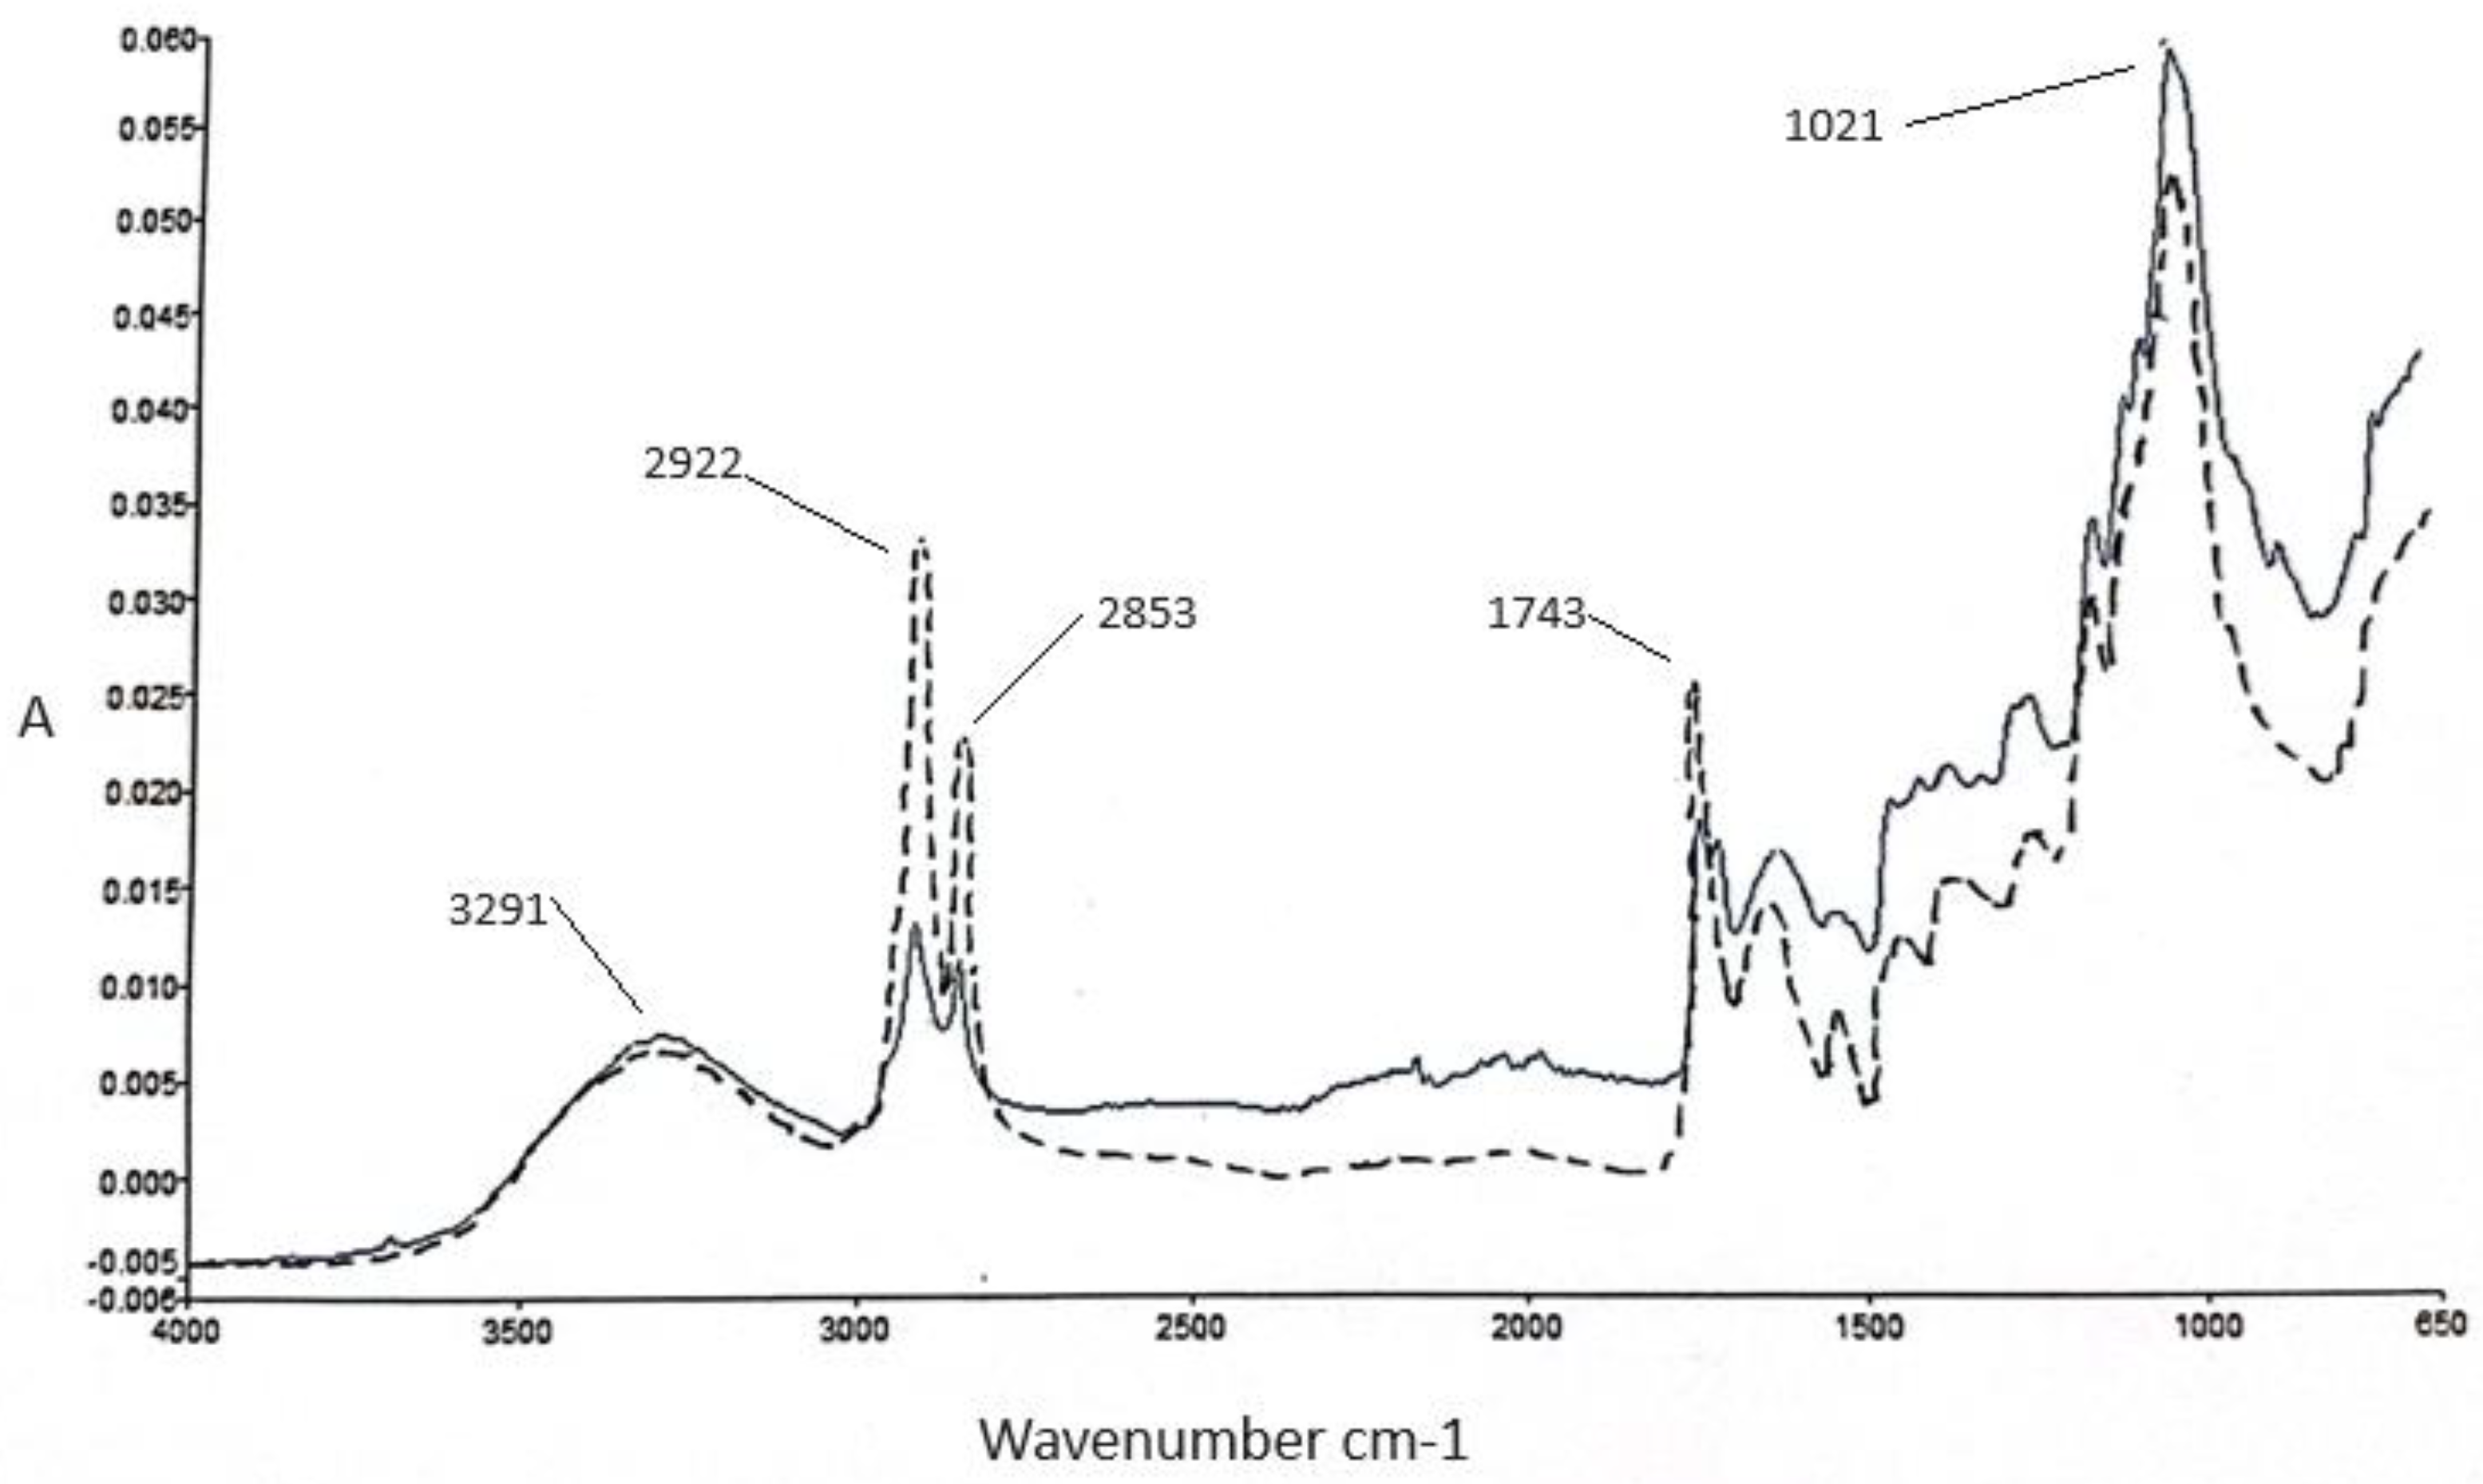
Figure 2.
Comparative fresh weight recovery for compost and Harp material over 4 harvest periods.
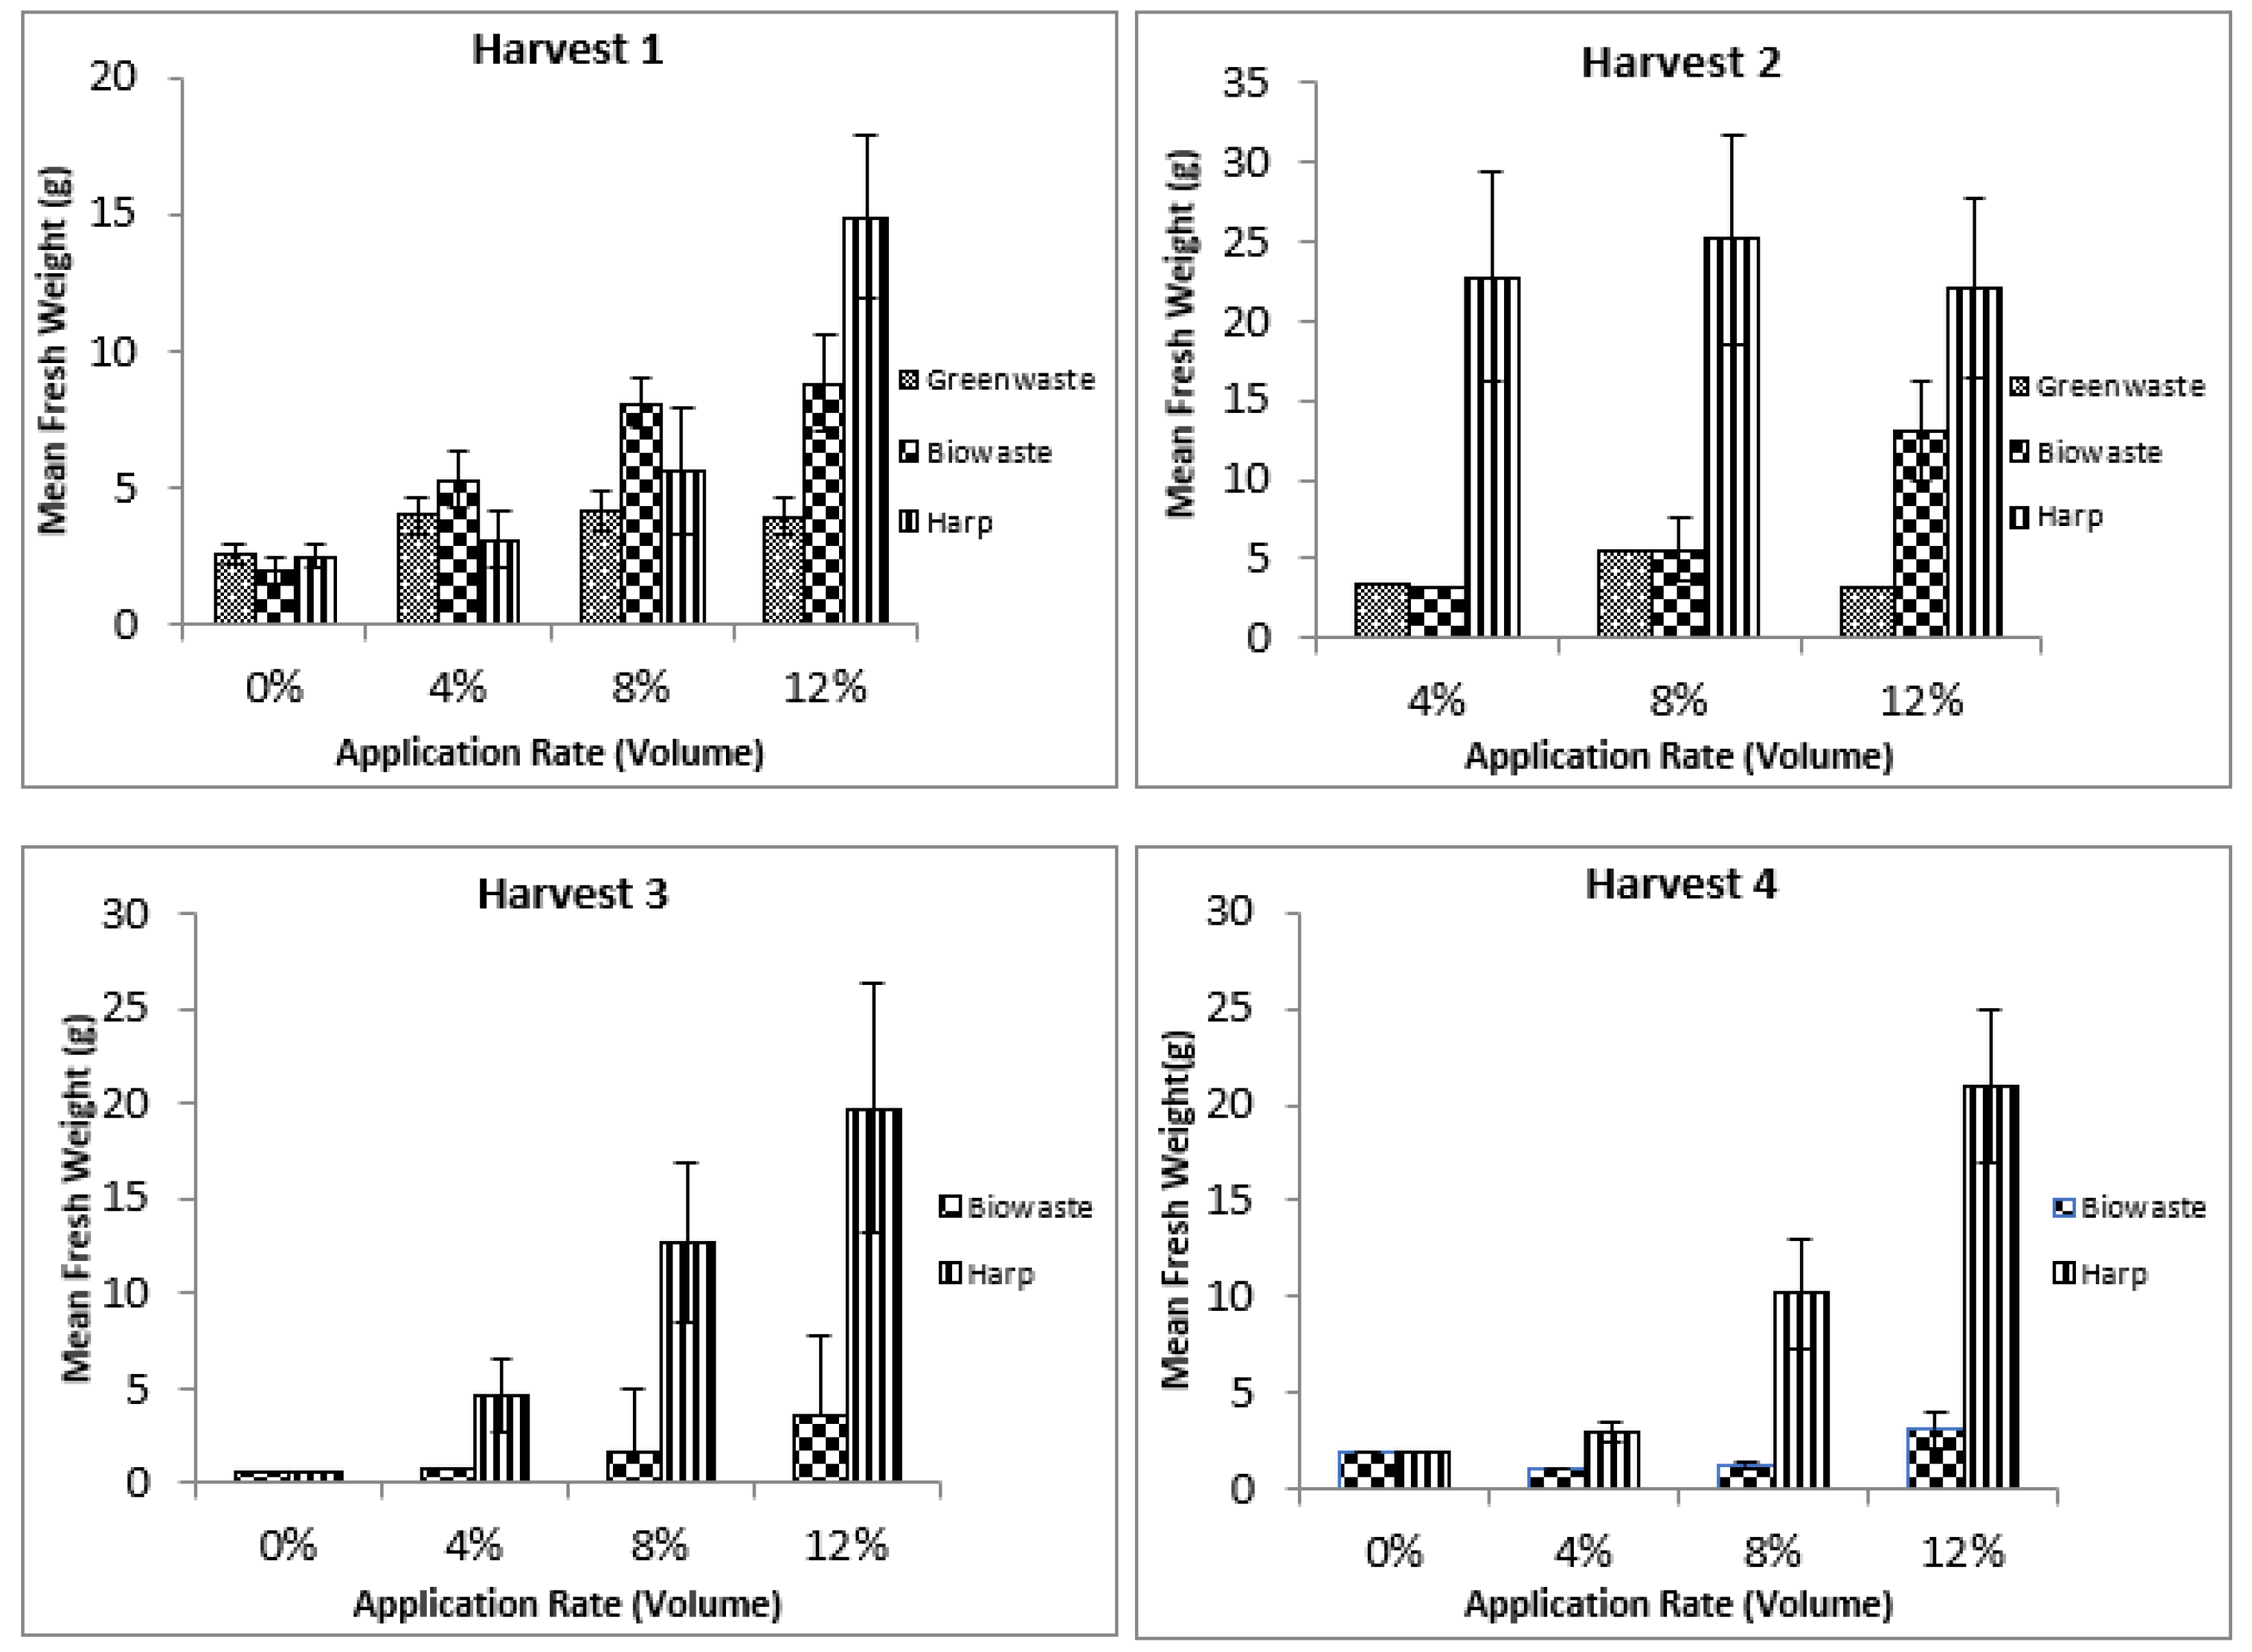
Figure 3.
Comparative nitrogen uptake for compost and Harp material over 4 harvest periods.
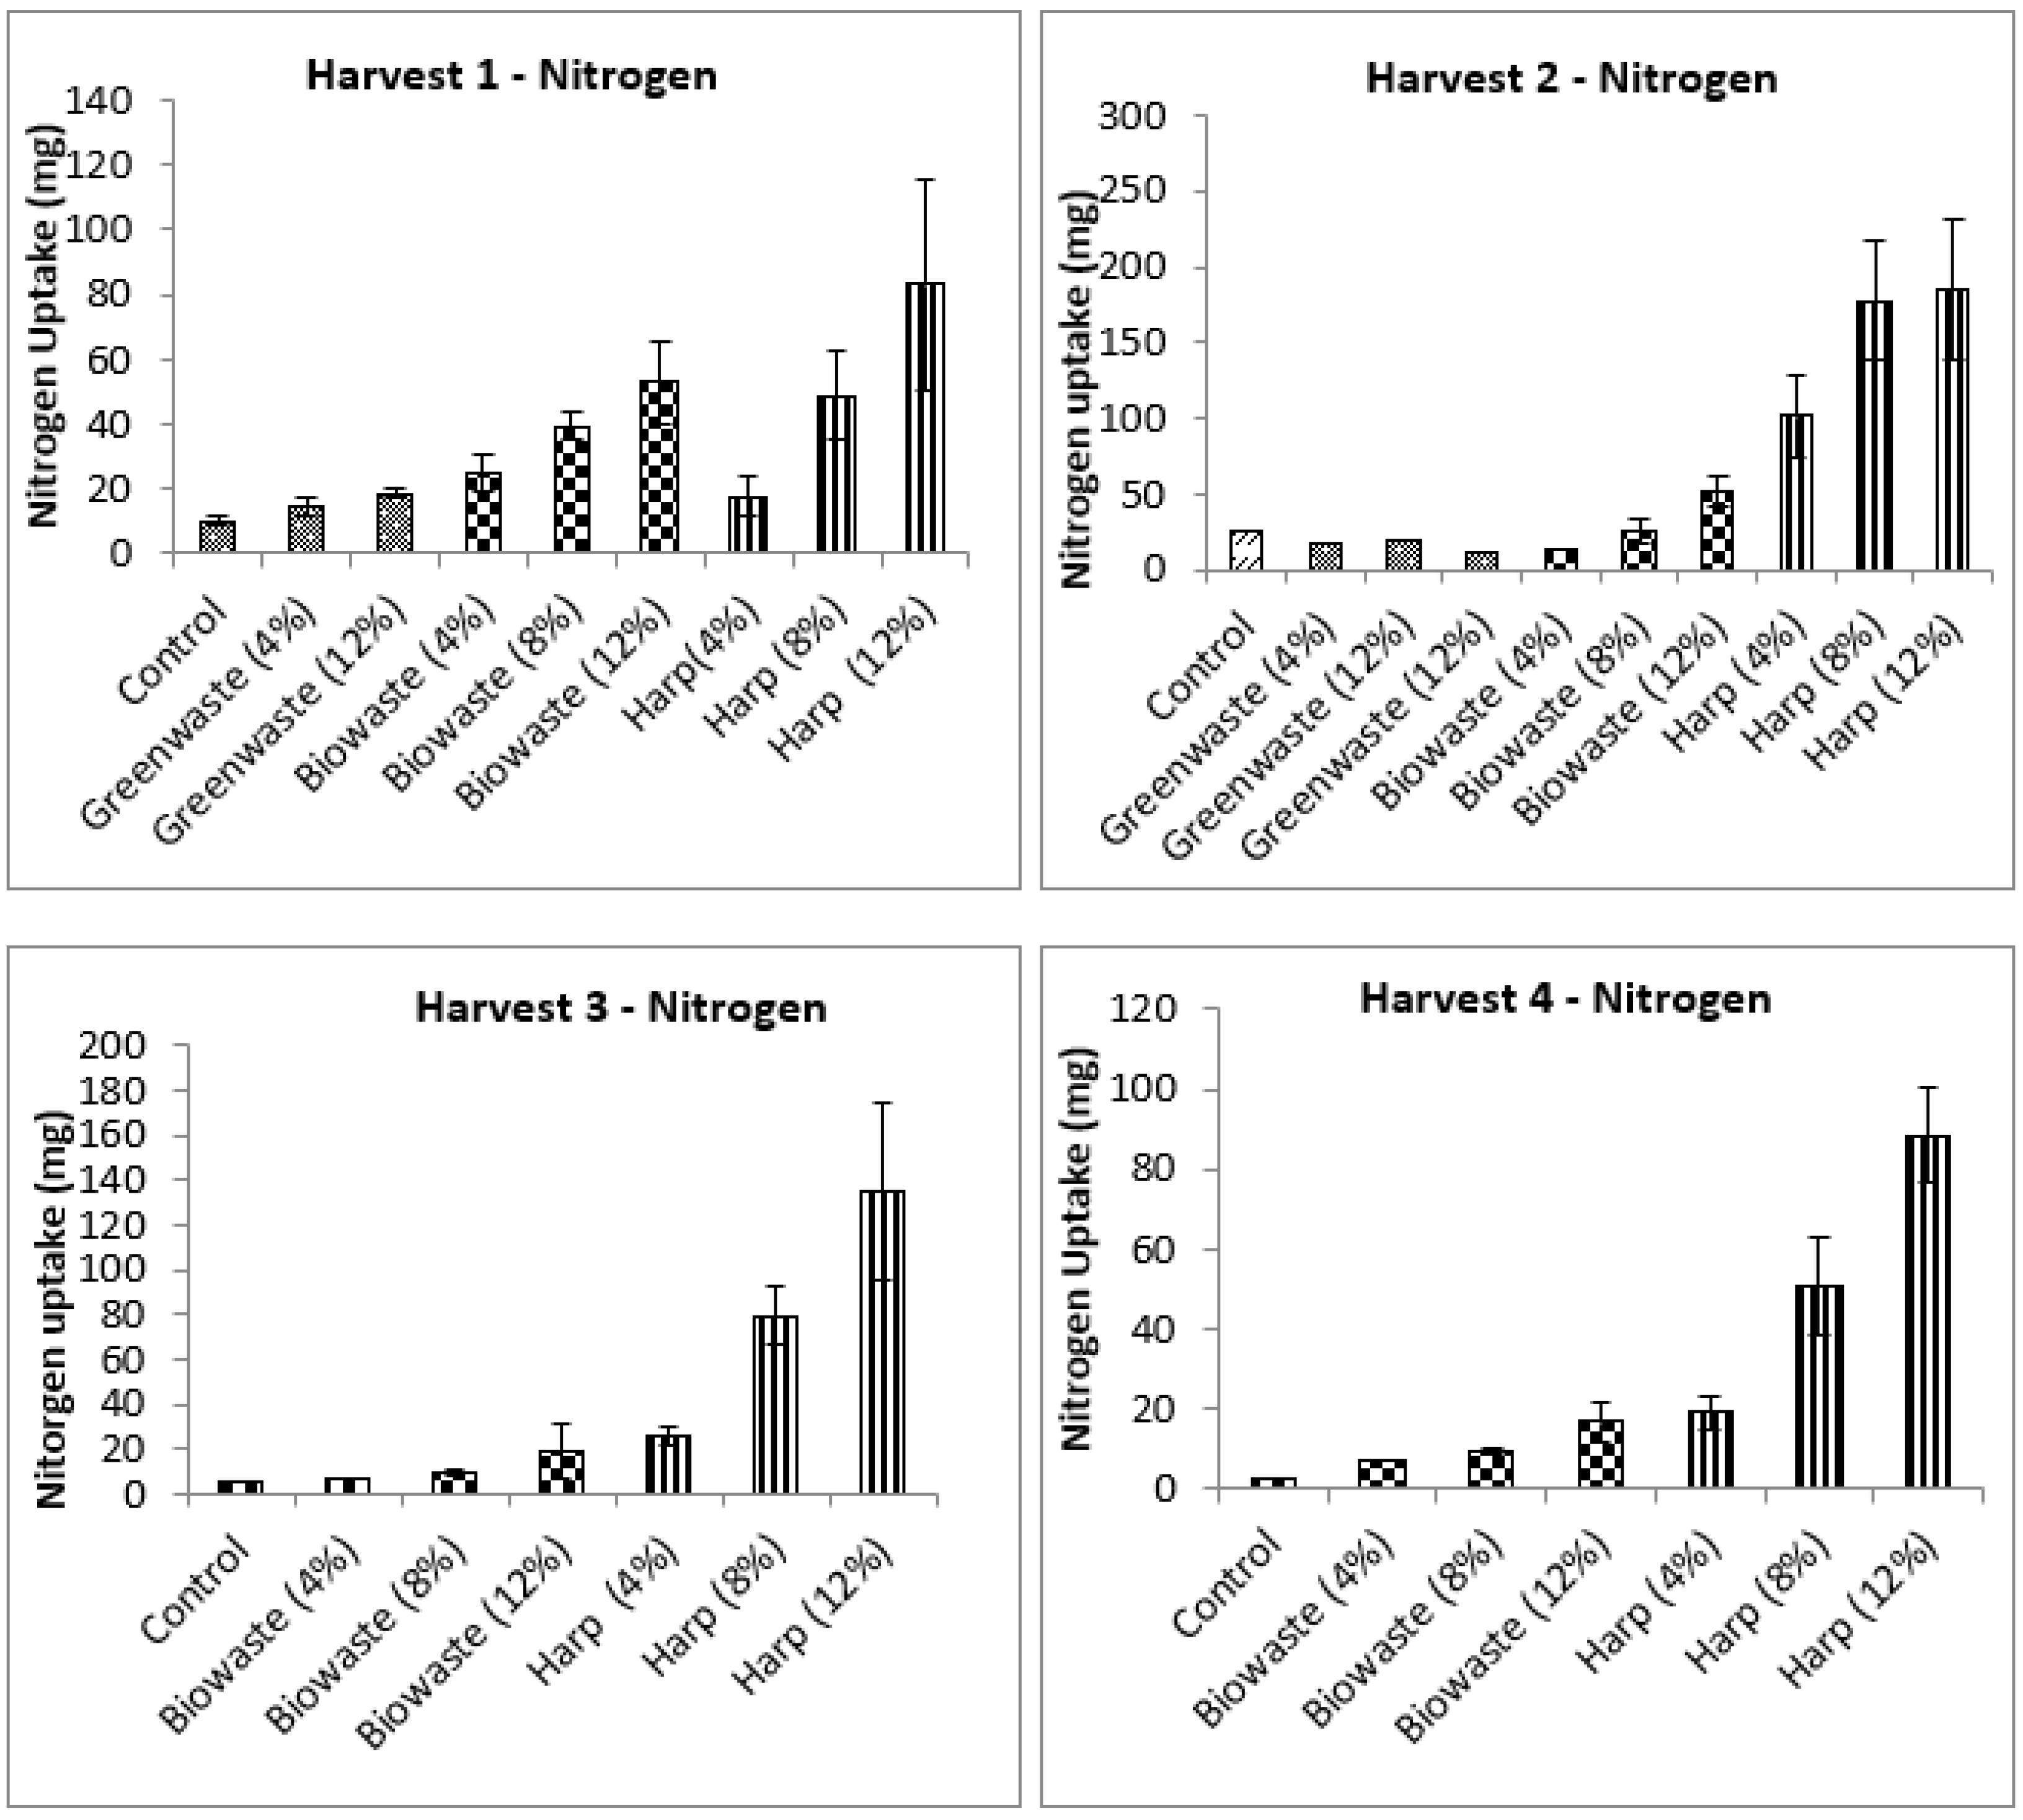
Figure 4.
Comparative Phosphorus and Potassium uptake for compost and Harp material over four harvest periods.
Figure 4.
Comparative Phosphorus and Potassium uptake for compost and Harp material over four harvest periods.
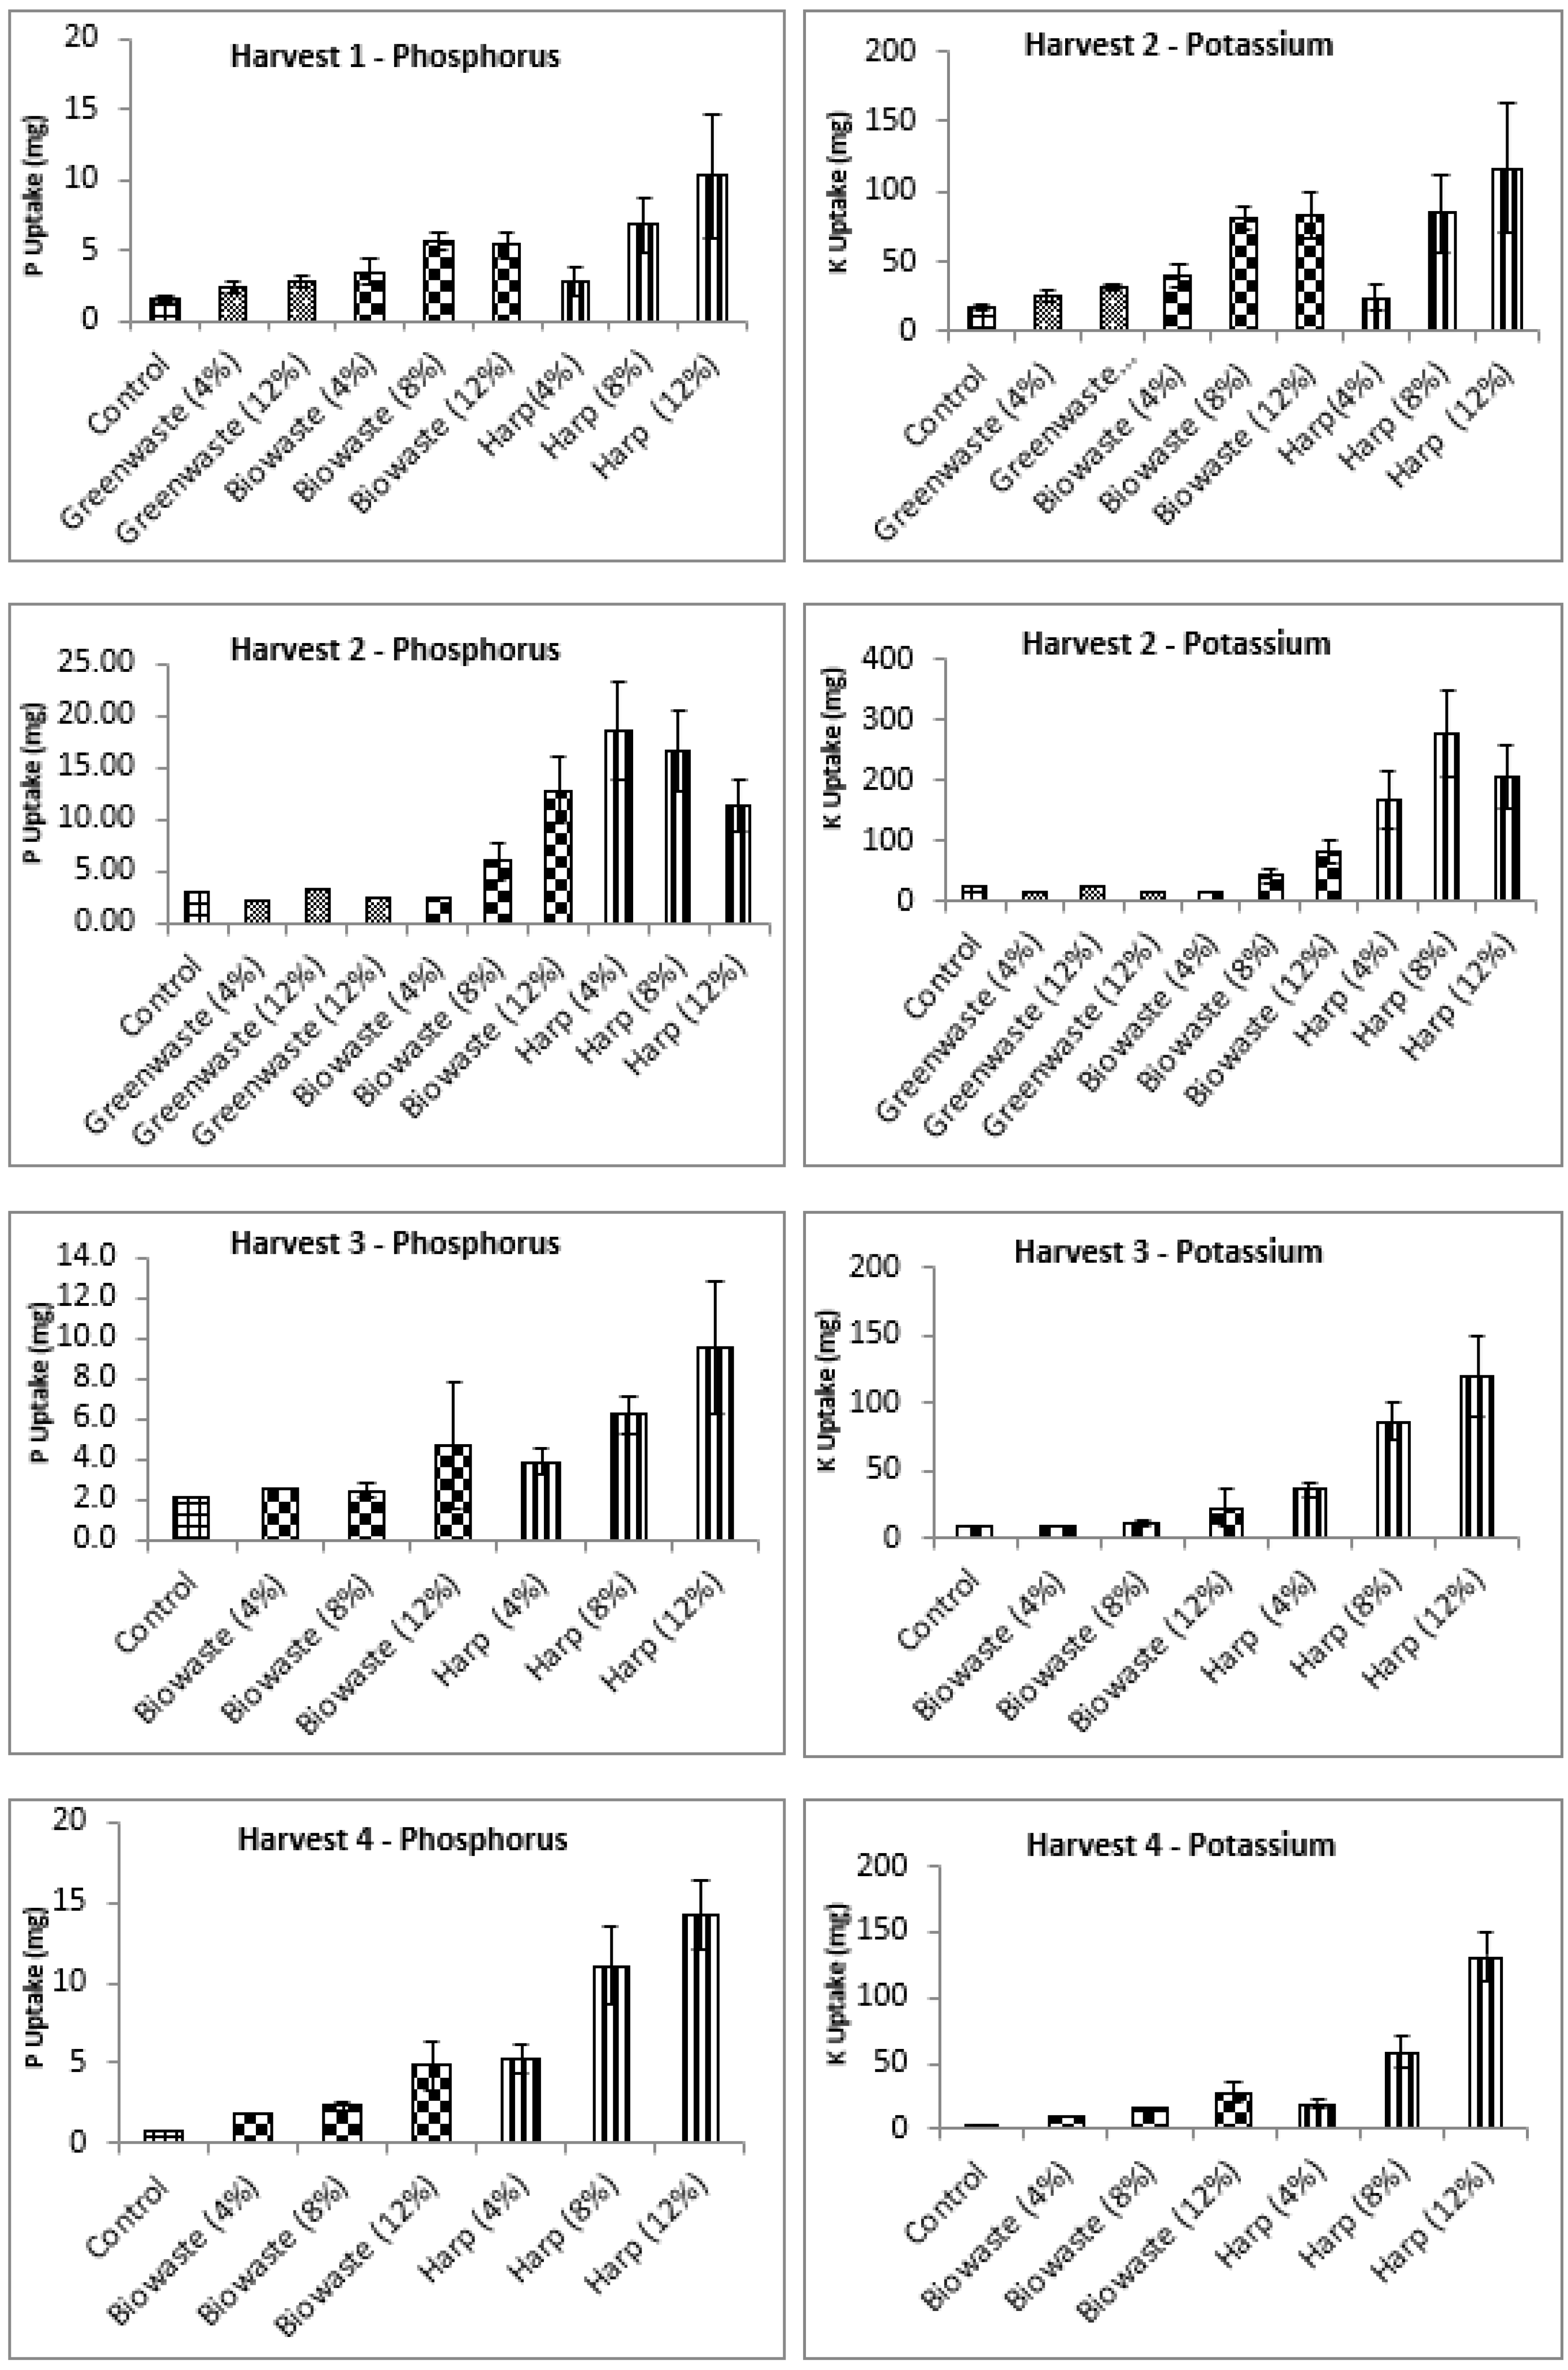
Table 3.
Heavy metal content.
| Arsenic (As) | Copper (Cu) | Chromium (Cr) | Lead (Pb) | Mercury (Hg) | Nickel (Ni) | Zinc (Zn) | |
|---|---|---|---|---|---|---|---|
| NN | mg/kg | mg/kg | mg/kg | mg/kg | mg/kg | mg/kg | mg/kg |
| Mean | 1 | 9.06 | 2.14 | 2.48 | 0.11 | 2.22 | 74.38 |
| SD | 0.5 | 6.53 | 0.91 | 2.66 | 0.03 | 1.09 | 76.94 |
| n=12 | n=14 | n=10 | n=13 | n=9 | n=13 | n=14 | |
| EU Fertilizer/Soil Improver https://eur-lex.europa.eu/eli/reg/2019/1009/oj ( |
na | 300 | na | 120 | 1 | 50 | 800 |
na= not available.
Table 4.
Plant Nutrient and carbon content of bio-digested material (HARP).
| N | P2O5 | K2O | Ca | Mg | S | NPK Index (5.1% EU Fert. Regs [15]) | Total Organic Carbon | |
| % | % | % | % | % | % | % | ||
| Mean | 2.81 | 0.85 | 1.57 | 1.18 | 0.15 | 1.09 | 5.23% | 45.7 |
| SD | 0.25 | 0.04 | 0.17 | 0.26 | 0.06 | 0.23 | 2.8 | |
| n=70 | n=70 | n=70 | n=70 | n=70 | n=70 | n=70 |
Table 5.
Comparative characterizations of the materials used.
| Material | Bulk Density (g/L) | Moisture % | Organic Matter % | Organic Carbon % | pH | EC (μS/cm) | C:N ratio |
|---|---|---|---|---|---|---|---|
| Harp product | 570 | 13.8 | 89.5 | 52 | 5.5 | 5410 | 16 |
| Greenwaste | 577 | 56.2 | 45.5 | 26.5 | 8.7 | 970 | 11 |
| Biowaste Compost | 600 | 8.9 | 23 | 13.4 | 7.8 | 2120 | 10 |
Disclaimer/Publisher’s Note: The statements, opinions and data contained in all publications are solely those of the individual author(s) and contributor(s) and not of MDPI and/or the editor(s). MDPI and/or the editor(s) disclaim responsibility for any injury to people or property resulting from any ideas, methods, instructions or products referred to in the content. |
© 2025 by the authors. Licensee MDPI, Basel, Switzerland. This article is an open access article distributed under the terms and conditions of the Creative Commons Attribution (CC BY) license (http://creativecommons.org/licenses/by/4.0/).
Copyright: This open access article is published under a Creative Commons CC BY 4.0 license, which permit the free download, distribution, and reuse, provided that the author and preprint are cited in any reuse.


