
Submitted:
16 March 2025
Posted:
18 March 2025
You are already at the latest version
Abstract
Background: Ventilator-associated pneumonia (VAP) is one of the most common infections in intensive care units (ICUs), with an estimated attributable mortality of approximately 10%. It is associated with prolonged duration of mechanical ventilation (MV) and ICU stay, and with increased difficulty in early and adequate antibiotic (AB) treatment. The use of machine learning techniques could enable the early prediction of patients at high risk of VAP and the activation of protocols aimed at confirming the microbiological diagnosis and initiating early appropriate treatment. Our objective is to develop a real-time VAP predic-tion model as a decision support tool for clinicians using data from the clinical information system (CIS). Methods: All pa-tients from 1/1/2014 to 31/12/2024 who required MV for more than two days were included in the study. Day 0 (zero) was de-fined as the clinical diagnosis of VAP, and the clinical and labor-atory variables included in the models were considered with windows of 24, 48 and 72 hours prior to day zero, respectively. These were obtained automatically from the CIS through an ETL (Extract, Transform and Load) in a Python/Jupyter environment. The data was divided into a training set (Train= 80%) and a test set (Test=20%). The imbalance of the positive class (VAP) was corrected in Train by applying a down-sampling adjustment. The models developed using XGBoost were evaluated to inves-tigate their effectiveness in predicting VAP 24, 48 and 72 hours before the date of the event using accuracy, recall, confusion matrix and area under the ROC curve (AUC). Results: 2,714 pa-tients were included in the cohort, of which 314 (11.6%) had VAP. An XGBoost model was developed, achieving accuracies of 0.84, 0.71 and 0.70 for predictions made within the time win-dows of 24, 48 and 72 hours before the onset of VAP, respective-ly. The model also demonstrated high recovery rates of 0.83, 0.76 and 0.73 for these intervals, and showed excellent discriminatory power between the two classes, with AUC values of 0.90, 0.77 and 0.75, highlighting its great predictive capacity in the early detection of VAP. Conclusions: The development of 3 real-time VAP prediction models using machine learning showed ade-quate prediction especially in the 24 hours prior to clinical diag-nosis. This decision support tool can have a favorable impact on the prognosis of patients with VAP. However, these models must be prospectively validated before being implemented in clinical practice.
Keywords:
Ventilator-associated pneumonia
; Machine Learning
; Prediction Models
; XGBoost
1. Introduction
Ventilator-associated pneumonia (VAP) affects up to 20% of critically ill patients and significantly increases pressure for antibiotic prescription, accounting for half of all antibiotic use in the ICU. [1,2] VAP increases the length of hospital stay and healthcare costs, and is also associated with long-term morbidity and mortality [3,4,5]. The diagnosis of VAP continues to present challenges and difficulties for the arsenal of clinical, radiological and microbiological diagnostics currently available.[1,6,7,8]
Clinic Clinical information systems (CIS) emerged with the aim of improving safety and communication in healthcare through the primary use of data generated in patient care. In recent years, their secondary use has opened up new opportunities to optimize healthcare by enabling quality assessment and the development of tools to support clinical decision making. These systems take advantage of large amounts of data collected from patient records and serve as the backbone of clinical decision support (CDS) systems. CDS uses algorithms and data analysis to offer personalized recommendations to doctors about the potential risk of an entity, helping to implement early actions regarding diagnosis and possible treatment.[9,10,11] These tools are designed to integrate seamlessly into clinical workflows, presenting alerts and reminders to clinicians at critical decision points.
Predictive modelling in healthcare uses CIS data to forecast individual patient outcomes or the likelihood of certain conditions. [12,13,14]These models can predict the onset of disease by analyzing patterns within large data sets. This predictive capability is fundamental to preventative medicine, allowing doctors to intervene early and adjust diagnostic protocols and treatments at an early stage.
The integration of Artificial Intelligence (AI) and Machine Learning (ML) technologies has significantly advanced the development of predictive models and decision support tools. By analyzing historical and real-time data, ML techniques improve the accuracy of predictions over time and adapt to new information as it becomes available [15,16].
In this context, we hypothesized that the new ML techniques can adequately predict the risk of VAP in critical patients on mechanical ventilation at an early stage. To test our hypothesis, we developed a VAP prediction model using ML with data obtained automatically and in real time from the CIS.
2. Materials and Methods
2.1. Study Design
Retrospective observational study carried out in a 28-bed general (non-coronary) ICU at a tertiary university hospital between 1 January 2014 and 31 December 2024. The sample size was not calculated due to the large amount of data collected and the retrospective nature of the study.
2.2. Population
All critically ill adults (> 18 years) who required MV for more than 48 hours were included. Patients whose length of stay in the ICU was less than 72 hours, the minimum time necessary to include the variables in the models, were excluded.
2.3. Variables
The variables studied are listed in Table 1. These variables were automatically obtained from the clinical information system (CIS, Centricity Critical Care®, GE, Berlin, Germany) through the development of a custom-built ETL (extract, transform and load) system using SQL (version 16.0) and Python (version 3.11.6) / Jupyter environment (version 4.0.7). The CIS automatically collects data from patient-connected devices every two minutes, including hemodynamic variables, monitor-derived parameters, and variables from life-support devices (e.g., mechanical ventilators). In contrast, hourly urine output is recorded by healthcare professionals and is not automatically measured by the CIS. Additional clinical parameters, laboratory values, and medication information are also integrated into the CIS. Furthermore, healthcare professionals record all information related to the patient during their stay in the ICU as VAP.
Day 0 (zero) was defined for patients with VAP as the time when the clinical diagnosis was made by the treating physician. For patients who did not develop VAP, day zero was considered to be the last day of MV. Data extraction was performed by creating 24-hour time windows starting from the date of the event (day zero) and going back to the cut-off time 24, 48 and 72 hours before day zero.
2.3.1. Missing Data Imputation
The availability of continuous data in the CIS with 24-hour time windows for the entire patient stay made it much easier to deal with the few missing data. Tracheostomy, days on IMV, antibiotics (1/0), number of aspirations, total diuresis, total norepinephrine dose and total dobutamine dose were imputed as 0. The remaining variables were imputed using a progressive imputation method (fillforward).
2.3.2. Feature Selection
Categorical variables that were not statistically significant in bivariate comparison, as well as those with more than 30% missing values (SOFA score and procalcitonin), were excluded from the analysis. The remaining variables were then subjected to several semi-automatic feature selection methods, including Minimum Redundancy-Maximum Relevance (mRMR), Gain Ratio (GR), Random Forest (RF), XGBoost, Forward Feature Selection (FFS), and Backward Feature Selection (BFS). Each method ranked the features from most to least important in a different manner, based on their own approach. An XGBoost model was then iteratively trained using first the best ranked feature, then the next two best, then the next three best and so on until all features were included. This approach provides a systematic way to automate feature selection when dealing with a large number of variables and multiple options to choose from.
2.4. Models
We decided to build the models using XGBoost (extreme gradient boosting, version 2.1.2). XGBoost is a powerful ML algorithm that has gained immense popularity due to its power and speed. It is particularly effective on structured data and has become the preferred option for many data scientists and ML professionals due to its high performance, its built-in regularization techniques that help prevent overfitting, and its flexibility as it supports multiple objective functions, including regression, classification and ranking. This flexibility allows it to be applied to a wide range of problems, making it a versatile tool in the data scientist's toolkit. [17,18]. The models developed using XGBoost were evaluated to investigate their effectiveness in predicting VAP 24, 48 and 72 hours before the date of the event using accuracy, re-call, confusion matrix and area under the ROC curve (AUC).
2.4.1. Data Splitting
The data were systematically divided into two distinct sets: a training set (80%) and a test set (20%) using scikit-learn (version 1.6.1). This split was stratified to ensure that the distribution of the positive VAP class remained consistent between the two sets. In addition, cross-validation was applied during the training phase to ensure the robustness of the model due to the limited data.
2.4.2. Class Imbalance
The positive VAP class was significantly smaller than the negative class, resulting in an unbalanced cohort. When training a model, this imbalance must be taken into account to avoid classification bias towards the main class. To minimize this effect, we applied reduced sampling using a custom function, which contained the resample function from scikit-learn (version 1.6.1). This function selectively reduces the number of majority class samples while preserving all minority class instances. The function allows adjusting the balance ratio between classes through a configurable parameter declared as majority proportion, ensuring flexibility in determining the level of downsampling applied. A value of 1 resulted in equal numbers of positive and negative samples, while a value of 2 meant the majority class had twice as many samples as the minority class, and so forth. The selected majority class samples were randomly chosen to maintain variability in the dataset. This method was applied to the training set before model training, ensuring that different levels of class balance could be tested systematically. The downsampling process was performed with a fixed random seed to allow for reproducibility. The code used is accessible at https://github.com/julenberrueta/vap-model-utils.
2.4.3. Hyperparameter Tuning
The Optuna library (version 4.1.0) was used for hyperparameter tuning. Optuna is an open source optimization library specifically designed to automate the optimization of hyperparameters in machine learning models. It works by efficiently searching the parameter space to find the most effective values, using techniques such as Bayesian optimization, tree-structured Parzen estimators or evolutionary algorithms. Optuna streamlines the process by providing a framework for defining a search space and managing the trial process to evaluate different configurations. This approach helps identify the optimal set of parameters that lead to the best model performance, improving both the efficiency and accuracy of machine learning models [19]. The score used to optimize the models during the tuning phase was the AUC score. This approach was chosen to emphasize the importance of creating a strong discriminative model, ensuring that the model is confident in its predictions while maintaining a good balance between predictions in the negative and positive classes.
2.4.4. Model Explainability
To assess the relative importance and contribution of each variable to the model's predictions, the SHapley Additive exPlanations (SHAP) method was used. SHAP values provide a clear, interpretable understanding of how each feature influences the model's output and how the range of values in the distribution of a given variable contributes differently to the model's predictions.
2.5. Definitions
Ventilator-associated pneumonia (VAP) was defined as a respiratory infection occurring in mechanically ventilated patients according to the guidelines of the European Respiratory Society (ERS), the European Society of Intensive Care Medicine (ESICM), the European Society of Clinical Microbiology and Infectious Diseases (ESCMID), and the Asociación Latinoamericana del Tórax (ALAT) [20]. VAP was defined as pneumonia occurring more than 48 h after endotracheal intubation with fever, without other apparent causes, with new or increased sputum production, positive endotracheal aspirate (ETA) culture (>106 CFU/mL), or bronchoalveolar lavage (BAL) culture (>104 CFU/mL), with at least one respiratory pathogen known to cause pneumonia, and with radiographic evidence of nosocomial pneumonia.
2.6. Objectives
Our primary objective was to evaluate the predictive performance of the VAP prediction models developed using XGBoost.
Our secondary objective was to evaluate the applicability of the prediction models in a clinician-friendly front-end interface as part of the model maturity definition.
2.7. Statistical Analysis
A univariate statistical analysis was conducted using R (version 4.4.2) and the compareGroups library (version 4.9.1) to summarize and compare baseline characteristics between groups based on VAP status. The analysis included both categorical and continuous variables. For categorical variables, the Chi-squared test was employed to assess differences in distribution between groups, with the exact Fisher test applied when the expected frequencies were less than 5. Continuous variables were evaluated using the Kruskal-Wallis test, as normality assumptions were not met.
Model performance was assessed by determining accuracy (for overall model performance), recall (to assess the model's ability to predict the positive class), confusion matrix (to provide a detailed view of true positives, false positives, true negatives and false negatives) and AUC (area under the curve, which measures the model's ability to discriminate between classes).
3. Results
3.1. Population
A total of 4,394 patients who received mechanical ventilation were included in the study. Of these, 1,560 patients who received invasive mechanical ventilation for less than 48 hours were excluded, leaving 2,834 patients. From this group, 95 patients were excluded because they spent less than 72 hours in the ICU. Of the remaining 2,739 patients, 339 were diagnosed with VAP. However, 25 patients were later excluded because the date of VAP diagnosis was incorrectly recorded, as they had been on MV for less than 48 hours at the time of annotation, resulting in a final count of 314 VAP cases (Figure 1).
The variables considered and the characteristics of the patients distinguishing those with and without VAP development are shown in Table 1. Patients with VAP were more likely to be male, have medical conditions, and have a lower mean age and number of days on MV than patients without VAP. The intensity of ventilatory support (FiO2, PEEP, etc.) and inflammatory variables (CRP, leukocytes, etc.) were higher in the VAP group. Strikingly, although the intensity of organ dysfunction (SOFA score) was higher in patients with VAP, the overall severity (APACHE II score) was higher in patients without VAP (Table 1). Finally, the overall crude mortality was 28.4% and higher in patients with VAP (35.4%, p=0.004).
3.2. Models Performance
The XGBoost model performed best in the 24-hour prediction window, achieving an accuracy of 0.85, a recall of 0.83 and an AUC of 0.90. These results indicate that the model effectively discriminates between VAP and non-VAP cases, with a reasonable balance between the two classes. The high AUC value of 0.90 highlights the excellent discriminatory ability of the model.
For the 48-hour prediction window, the performance of the model decreased, with an accuracy of 0.71, a recall of 0.76 and an AUC of 0.77. Although the model maintained a reasonable ability to identify cases of VAP, it had a higher number of false positives. The AUC of 0.77 indicates moderate discriminatory power.
In the 72-hour prediction window, the model's performance showed a greater decline, reaching an accuracy of 0.70, a recall of 0.73 and an AUC of 0.75. These results suggest that the model struggled to accurately identify cases of VAP over a longer period of time, resulting in an increase in the number of false negatives and false positives. The AUC of 0.75 indicates moderate performance. (Table 2)
Figure 2 shows the comparison of the performance (AUC ROC) of the variable selection algorithms used for different numbers of features for predicting the 24 hours before the event. As can be seen, the XGBoost algorithm shows constant superiority, especially with fewer features, highlighting its effectiveness in selecting the most relevant variables. On the basis of this classification, the most important variables included in the different models were selected (Table 2).
3.3. User-Friendly Model Visualization
The models have been implemented within a clinician-friendly front-end that allows the different probabilities of risk of developing VAP for each patient to be viewed in near-real time throughout the patient's stay.
Figure 3 shows an example of a patient who developed VAP. The red dot indicates the time when the patient had VAP and the corresponding probability, while the green dot represents the probability exactly 24 hours before the event. For this particular patient, we can see that all the models are predicting correctly. However, as we approach the end of the stay, we see that the 24-hour model tends to give clearer predictions when the probability is less than 0.5, while the other two models show greater variability.
Figure 4 shows the case of a patient who did not develop VAP. The blue dot indicates the last day the patient was mechanically ventilated and serves as a reference date for patients who did not develop VAP. We can see that the 24-hour model consistently and accurately predicted that this patient would not develop VAP throughout the entire stay, whereas the other two models incorrectly predicted that the patient would develop VAP at some point during the stay.
3.4. Model Explainability
The application of SHAP analysis to the prediction models provided valuable insights into the key factors influencing VAP prediction. Of the eleven features evaluated, PEEP (maximum), temperature (maximum), purulent secretions, respiratory rate (minimum) and C-reactive protein (minimum) consistently emerged as the five most influential predictors. The color scale in the figure represents the relative magnitude of each variable, with red indicating higher values and blue indicating lower values within each characteristic. In addition, the SHAP values on the x-axis indicate the direction of the contribution: values to the right of zero are associated with an increased likelihood of VAP, whereas values to the left of zero contribute negatively to the prediction.
4. Discussion
The main finding of our study is that the development and implementation of a model for predicting VAP in almost real time on a user-friendly interface was associated with an adequate prediction (AUC 90%), especially in the 24 hours prior to the development of VAP. To the best of our knowledge, this is the first study to implement a real-time VAP prediction algorithm in an easy-to-use user interface for healthcare professionals within the dashboard commonly used in our ICU. [11,21,22]
Current diagnostic approaches to VAP (e.g. signs and symptoms, microbiological cultures and chest X-rays) and conventional surveillance methods (e.g. manual chart reviews, prevalence studies, discharge codes, electronic surveillance algorithms) are insensitive, time-consuming and often costly [23,24,25]. In addition, they cannot identify a person who would benefit from a particular type of diagnosis or treatment based on the expected course of the disease.
AI is transforming medical practice and precision medicine in ICUs [26,27]. Emerging technologies using ML techniques will overcome the limitations of current diagnostic approaches [23,24,25,26,27]. These data-intensive systems will integrate and analyze diverse structured and unstructured data from different sources to monitor temporal trends, identify risk factors and predict the onset of a possible complication (VAP), thus facilitating or supporting rapid clinical decision-making regarding the diagnosis and possible treatment of infectious diseases.
For more than 10 years, various researchers have developed automated methods for the objective detection of VAP [23,24,25,28,29]. However, these automated systems have not improved the diagnostic accuracy of VAP [28], mainly because they have considered definitions related to epidemiological surveillance rather than clinical definitions. Furthermore, automation without AI techniques cannot provide information on the likelihood or risk of future complications (VAP) in patients receiving invasive mechanical ventilation.
Several authors have investigated the accuracy of electronic nose (e-nose) sniffers in detecting possible cases of VAP [30,31]. These devices use ML methods to analyze exhaled breath for metabolites that may be indicative of VAP, and some have demonstrated strong discrimination in identifying the presence of VAP. However, prospective validation of an e-nose device found that sensitivity and specificity were insufficient for general clinical use.
Giang, C et al. developed a model to predict VAP using the publicly available MIMIC III database [32]. The authors used a similar methodology to our study and tested the usefulness of different ML techniques. For predicting VAP after 48 hours of intubation, the XGBoost models performed better than other types of models, especially in the 6-hour time window (AUC 79.9%). Although with a lower performance than that observed in our study (AUC 90%), the results are consistent with our findings. However, there are some important differences. One would expect a model closer to the event (6 h) to perform better, but its predictive value has a limited clinical impact. A major limitation is that the exact time of onset of VAP could not be determined retrospectively from this dataset, so it was not possible to determine the degree of early warning provided by the models. In addition, these results may also be limited by the use of ICD codes as the gold standard for VAP diagnosis, which may not accurately capture all patients who experienced VAP during their hospital stay. Our study recorded the exact time of clinical diagnosis of VAP (not ICD), which provides a better and more robust prediction. In addition, Liang, Y et al. [33] also developed a VAP prediction model with the MIMIC III database. The authors point out that the AUC of optimal performance (84%) corresponds to the random forest model. Although the performance of the model is very good, it is striking that the authors do not clearly explain the development of the model or the selection of variables. On the other hand, it should be noted that using the same database (MIMIC III) as Giang, C. et al. [32] they find a significantly lower number of patients (n=221) with VAP compared to Giang, C. et al.(n= 524). This casts doubt, in our opinion, on the veracity of the VAP diagnosis and its temporal association necessary to determine the time windows in the construction of the model.
Furthermore, the elegant study by Samadani A et al [34], which used a large multi-institutional electronic health record (EHR) database, including 57,944 patients, of whom 9,204 had suspected VAP events, obtained results similar to ours. The development of XGBoost models to predict VAP events with a lead time of 24 hours showed reasonable performance with an AUC ROC of 76%. Although this study included a large number of patients from different centres, it only evaluated the prediction of VAP using international guidelines for the diagnosis of VAP. Specifically, the authors consider the presence of VAP when antibiotics are administered close to the time of culture orders in the EMR. As the authors acknowledge, the time of onset of VAP marked by the criteria used may not coincide with the actual physiological onset of infection, and this may strongly influence the prediction. The lack of real-world data to define VAP events and, more importantly, their timing in relation to recording, poses a significant challenge to the development of predictive models. The accuracy of the time of diagnosis of VAP by the treating physician is one of the major strengths of our study. Furthermore, the reliability of these data is a critical issue in modelling. In our ICU, the quality and reliability of the data is optimized by random audits, as previously published [35,36,37,38]. This makes the model more robust and reliable in its predictions.
The limited clinical relevance of the models, the lack of reliable data and adequate infrastructures, the costs associated with the digitalization of the ICU, as well as legal and ethical considerations have hindered the clinical integration and implementation of AI models [33,34] in clinical practice. Although AI can enable the development of accurate decision support tools, their adoption and implementation must be preceded by careful consideration of their clinical utility in real practice, aimed at meeting a real need, in a user-friendly environment for the clinician, and allowing their proper integration into the existing workflow. We have proven that the prediction model can be included in a front-end that is user-friendly for clinical use and thus integrated into the daily workflow of the ICU. [21,22]
As recently highlighted by Lee et al [39], in the era of digital healthcare it should be possible to dynamically adapt decision support by identifying and analyzing similar patients in the past. However, most existing clinical applications of AI have been achieved using static prediction models for the whole population. Recent advances in AI methods allow for processing and learning through a real-time data analysis platform to obtain predictions that are modified over time based on the changes experienced by the different variables included in the model. In this way, and as proposed by our model, continuous learning from time series in the same patient over time provides a much more personalized prediction than traditional models. Obtaining a quality prediction as a decision support tool can enable the active implementation of diagnostic methods aimed at confirming the presence of VAP and possibly initiating early antimicrobial treatment. Finally, as argued by Frondelius T et al [40], an ideal diagnostic test should have high accuracy and be low cost, non-invasive, easily repeatable at specific intervals, non-technical and clinically available at the patient's bedside. Our model fulfils all these requirements and is a highly reliable decision support tool. Moreover, it is also highly generalizable. The 24-hour model requires only 8 variables to operate, and the complete set of models (24h, 48h, and 72h) runs with just 21 unique variables. This streamlined variable set not only facilitates easy integration into clinical workflows but also underscores the model’s adaptability across diverse healthcare settings. However, its implementation in the real world cannot be assessed until external prospective validation confirms its usefulness.[41]
Our model has important limitations that must be acknowledged. The first and most important of these is that our results must be treated with caution because, although the model has been validated internally, without prospective and external validation it is not possible to conclude on its usability and clinical impact in real life [41]. Secondly, the model was developed in a single ICU with specific characteristics and a long history of data use, so the results cannot be extrapolated to other ICUs without prior validation. Finally, our model includes clinical variables that need to be recorded by physicians and nurses (e.g. VAP, type of secretions, number of secretions aspirated per shift, etc.). We acknowledge that these variables are not commonly recorded, which may limit the implementation of the model in other ICUs where these variables are not considered.
5. Conclusions
The VAP prediction model developed provides an instantaneous risk score that changes with the patient's clinical condition, providing a temporal context for the infection event, allowing for the study of disease progression, as well as early intervention and confirmatory diagnostic measures. However, the usability of the model and its real clinical impact need to be confirmed through prospective validation.
Author Contributions
For research articles with several authors, a short paragraph specifying their individual contributions must be provided. The following statements should be used “Conceptualization, J.B; A.R; J.G; A.G.M, S.A.T. and M.B.; methodology, J.B; A.R; J.G.; A.G.M. and M.B.; software, J.B.; J.G. and A.G.M.; validation, J.B.; A.R.; S.M.; L.C.; J.J.G. and M.B.; formal analysis, J.B.; A.R.; J.G. and A.G.M.; investigation, J.B.; A.R.; S.M.; L.C.; J.J.G.;S.A.T. and M.B.; data curation, J.B.; J.G. and A.G.M.; writing—original draft preparation, J.B.; A.R.; S.M.; L.C.; J.J.G; S.A.T. and M.B.; writing—review and editing, J.B.; A.R. and J.G.; visualization, J.B.; A.R. and M.B. ; supervision, J.J.G, S.A.T. and M.B.; funding acquisition, A.R.; J.J.G and M.B. All authors have read and agreed to the published version of the manuscript.”
Funding
This study was supported with protected research time (AR and MB) by a grant from the Ricardo Barri Casanovas Foundation (FRBC01/2024). The sponsors were not involved in the study design, data collection, data analysis, data interpretation, or report writing.
Institutional Review Board Statement
The study was conducted in accordance with the Declaration of Helsinki and the European Community Directive on Clinical Trials (2001/20/EC) of the European Parliament on Good Clinical Practice guidelines.
Informed Consent Statement
Ethical review and approval have been waived because this is an observational and retrospective study (10 years) with automated collection of anonymous data in the context of improving the quality of care.
Data Availability Statement
The data supporting the conclusions of this study are available from the Joan XXIII de Tarragona Hospital (Spain), but restrictions are placed on the free availability of these data by the health authorities of Catalonia, so they are not publicly available. However, the data can be obtained from the corresponding author (A.R.) upon reasonable request and with the permission of the Technical Secretary and the person responsible for data management at Joan XXIII de Tarragona Hospital (Spain).
Acknowledgments
We express our gratitude to the dedicated staff members (nurses and physicians) of Intensive Care and Nursing Departments at Hospital Universitari Joan XXIII. This project would not have been possible without their collaborative efforts.
Conflicts of Interest
The authors declare no conflicts of interest.
Abbreviations
The following abbreviations are used in this manuscript:
| XGBoost | Extreme gradient boosting |
| mRMR | Minimum Redundancy-Maximum Relevance |
| GR | Gain Ratio |
| FFS | Forward Feature Selection |
| BFS | Backward Feature Selection |
| AUC | Area under curve |
References
- Howroyd, F.; Chacko, C.; MacDuff, A.; Gautam, N.; Pouchet, B.; Tunnicliffe, B.; Weblin, J.; Gao-Smith, F.; Ahmed, Z.; Duggal, N.A.; Veenith, T. Ventilator-associated pneumonia: pathobiological heterogeneity and diagnostic challenges. Nat Commun 2024, 15, 6447. [Google Scholar] [CrossRef] [PubMed]
- Papazian, L.; Klompas, M. ; Luyt, C-E. Ventilator-associated pneumonia in adults: a narrative review. Intensive Care Med 2020, 46, 888–906. [Google Scholar] [CrossRef]
- Erb, C.T.; Patel, B.; Orr, J. E.; Bice, T.; Richards, J.B.; Metersky, M.L.; Wilson, K.C.; Thomson, C.C. Management of Adults with Hospital-acquired and Ventilator-associated Pneumonia. Ann Am Thorac Soc 2016, 13, 2258–2260. [Google Scholar] [CrossRef]
- Kalil, A.C.; Metersky, M.L.; Klompas, M.; Muscedere, J.; Sweeney, D.A.; Palmer, L.B.; Napolitano, L.M.; O’Grady, N.P.; Bartlett, J.G.; Carratalá, J.; et al. Executive summary: management of adults with hospital-acquired and ventilator-associated pneumonia: 2016 clinical practice guidelines by the Infectious Diseases Society of America and the American Thoracic Society. Clin Infect Dis 2016, 63, 575–582. [Google Scholar] [CrossRef]
- Kalanuria, A.A.; Zai, W.; Mirski, M. Ventilator-associated pneumonia in the ICU. Crit Care. 2014, 18, 208. [Google Scholar] [CrossRef] [PubMed]
- Michael Klompas, M. Does This Patient Have Ventilator-Associated Pneumonia? JAMA 2007, 297, 1583–93. [Google Scholar] [CrossRef] [PubMed]
- Kirtland, S.H.; Corley, D.E.; Winterbauer, R.H.; Springmeyer, S.C.; Casey, K.R.; Hampson, N.B.; Dreis, D.F. The diagnosis of ventilator-associated pneumonia: a comparison of histologic, microbiologic, and clinical criteria. Chest. 1997, 112, 445–57. [Google Scholar] [CrossRef]
- Kawamoto,K. ; Houlihan, C.; Balas, A.; Lobach, D. Improving clinical practice using clinical decision support systems: A systematic review of trials to identify features critical to success. BMJ 2005, 330, 765. [CrossRef]
- Weiner, S.J.; Schwartz, A.; Weaver, F.; Galanter, W.; Olender, S.; Kochendorfer, K.; Binns-Calvey, A.; Saini, R.; et al. Effect of Electronic Health Record Clinical Decision Support on Contextualization of Care A Randomized Clinical Trial. JAMA Netw Open. 2022, 5, e2238231. [Google Scholar] [CrossRef]
- Weiner, S.J.; Kelly, B.; Ashley, N.; Binns-Calvey, A.; Sharma, G.; Schwartz, A.; Weaver, F.M. Content coding for contextualization of care: evaluating physician performance at patient-centered decision making Med Decis Making 2014, 34, 97-106. [CrossRef]
- Manrique, S.; Ruiz-Botella, M.; Rodríguez, A.; Gordo, F.; Guardiola, J.J.; Bodí, M.; Gómez, J. ; on behalf the Advanced Analysis of Critical Data (AACD)Research Group. Secondary use of data extracted from a clinical information system to assess the adherence of tidal volume and its impact on outcomes. Med Intensiva (Engl Ed). 2022, 46, 619–629. [Google Scholar] [CrossRef]
- Cuadrado, D.; Riaño, D.; Gómez, J.; Rodríguez, A.; Bodí, M. Methods and measures to quantify ICU patient heterogeneity. J Biomed Inform. 2021, 117, 103768. [Google Scholar] [CrossRef] [PubMed]
- Fabregat, A.; Magret, M.; Ferré, J.A.; Vernet, A.; Guasch, N.; Rodríguez, A.; Gómez, J.; Bodí, M. A Machine Learning decision-making tool for extubation in Intensive Care Unit patients. Comput Methods Programs Biomed. 2021, 200, 105869. [Google Scholar] [CrossRef] [PubMed]
- Obermeyer, Z.; Emanuel, E.J. Predicting the Future — Big Data, Machine Learning, and Clinical Medicine. N Engl J Med 2016, 375, 1216–1219. [Google Scholar] [CrossRef]
- Rajkomar, A.; Dean, J.; Kohane, I. Machine Learning in Medicine. N Engl J Med 2019, 380, 1347–1358. [Google Scholar] [CrossRef] [PubMed]
- Ravid Shwartz-Ziv, R.; Armon, A. Tabular data: Deep learning is not all you need. Information Fusion 2022, 81, 84–90. [Google Scholar] [CrossRef]
- Friedman, J. ; Hastie,T. ; Robert Tibshirani, R. Additive logistic regression: a statistical view of boosting. Ann. Statist 2000, 28, 337–407. [Google Scholar] [CrossRef]
- Akiba, T.; Sano, S.; Yanase, T.; Ohta, T.; Koyama, M. “Optuna: A next-generation hyperparameter optimization framework,” in Proceedings of the 25th ACM SIGKDD International Conference on Knowledge Discovery & Data Mining, ser. KDD ’19, Anchorage, AK, 2019, USA: Association for Computing Machinery; pp. 2623–2631. [CrossRef]
- Metersky, M.L.; Wang, Y.; Klompas, M.; Eckenrode, S.; Bakullari, A.; Eldridge, N. Trend in ventilator-associated pneumonia rates between 2005 and 2013. JAMA 2016, 316, 2427–2429. [Google Scholar] [CrossRef]
- Jansson, M.; Ala-Kokko, T.; Ahvenjärvi, L.; Karhu, J.; Ohtonen, P.; Syrjälä, H. What is the applicability of a novel surveillance concept of ventilator-associated events? Infect Control Hosp Epidemiol. 2017, 38, 983–8. [Google Scholar] [CrossRef]
- Claverías, L.; Gómez, J.; Rodríguez, A.; Albiol, J.; Esteban, F.; Bodí, M. Support to the organization of the Intensive Care Units during the pandemic through maps created from the Clinical Information Systems. Med Intensiva (Engl Ed). 2021, 45, 59–61. [Google Scholar] [CrossRef]
- Bodí, M.; Claverias, L.; Esteban, F.; Sirgo, G.; De Haro, L.; Guardiola, J.J.; Gracia, R.; Rodríguez, A.; Gómez, J. Automatic generation of minimum dataset and quality indicators from data collected routinely by the clinical information system in an intensive care unit. Int J Med Inform. 2021, 145, 104327. [Google Scholar] [CrossRef]
- Ramírez-Estrada, S.; Lagunes, L.; Peña-López, Y.; Vahedian-Azimi, A.; Nseir, S.; Arvaniti, K.; et al. Assessing predictive accuracy for outcomes of ventilator-associated events in an international cohort: the EUVAE study. Intensive Care Med. 2018, 44, 1212–20. [Google Scholar] [CrossRef]
- Fernando, S.M.; Tran, A.; Cheng, W.; Klompas, M.; Kyeremanteng, K.; Mehta, S.; et al. Diagnosis of ventilator-associated pneumonia in critically ill adult patients-a systematic review and meta-analysis. Intensive Care Med. 2020, 46, 1170–9. [Google Scholar] [CrossRef] [PubMed]
- Pirracchio, R.; Cohen, M.J.; Malenica, I.; Cohen, J.; Chambaz, A.; Cannesson, M.; et al. Big data and targeted machine learning in action to assist medical decision in the ICU. Anaesth Crit Care Pain Med. 2019, 38, 377–84. [Google Scholar] [CrossRef] [PubMed]
- Jansson, M.; Rubio, J.; Gavaldà, R.; Rello, J. Artificial intelligence for clinical decision support in critical care, required and accelerated by COVID-19. Anaesth Crit Care Pain Med. 2020, 39, 691–3. [Google Scholar] [CrossRef] [PubMed]
- Nuckchady, D.; Heckman, M.G.; Diehl, N.N.; Creech, T.; Carey, D.; Domnick, R.; Hellinger, W.C. Assessment of an automated surveillance system fordetection of initial ventilator-associated events. American Journal of Infection Control 2015, 43, 1119–1121. [Google Scholar] [CrossRef]
- Stevens, J.P.; Silva, G.; Gillis, J.; Novack, V.; Talmor, D.; Klompas, M.; Howell, M.M. Automated Surveillance for Ventilator-Associated Events. CHEST 2014, 146, 1612–1618. [Google Scholar] [CrossRef]
- Fan, Y.; Gao, F.; Wu, Y.; Zhang, J.; Zhu, M.; Xiong, L. Does ventilator associated event surveillance detect ventilator associated pneumonia in intensive care units? A systematic review and meta-analysis. Crit Care. 2016, 20, 338. [Google Scholar] [CrossRef]
- Liao, Y-H. ; Shih, C-H.; Abbod, M.F.; Sheih, J.S.; Hsiao, Y.J. Development of an E-nose system using machine learning methods to predict ventilatorassociated pneumonia. Microsystem Technologies 2022, 28, 341–351. [CrossRef]
- Liao YH, Wang ZC, Zhang FG, Abbod MF, Shih CH, Shieh JS. Machine learning methods applied to predict ventilator-associated pneumònia with Pseudomonas aeruginosa infection via sensor array of electronic nose in intensive care unit. Sensors 2019, 19, 1866. [CrossRef]
- Giang, C. ; Calvert,J. ; Rahmani, K.; Barnes, G.; Siefkas, A.; Green-Saxena, A.; et al. Predicting ventilator-associated pneumonia with machine learning. Medicine 2021, 100, e26246. [Google Scholar] [CrossRef]
- Liang,Y. ; Zhu, C.; Tian, C.; Lin,Q.; Li, Z.; Li, Z.; Dongshu Ni, D.; Ma, X. Early prediction of ventilator-associated pneumonia in critical care patients: a Machine learning model. BMC Pulmonary Medicine 2022, 22, 250. [CrossRef]
- Samadani, A.; Wang, T.; van Zon, K.; Leo Anthony Celi, L. VAP risk index: Early prediction and hospital phenotyping of ventilator-associated pneumonia using machine learning. Artificial Intelligence in Medicine 2023, 146, 102715. [Google Scholar] [CrossRef]
- Bodí, M.; Samper, M.A.; Sirgo, G.; Esteban, F.; Canadell, L.; Berrueta, J.; Gómez, J.; Rodríguez, A. Assessing the impact of real-time random safety audits through full propensity score matching on reliable data from the clinical information system. Int J Med Inform. 2024, 184, 105352. [Google Scholar] [CrossRef] [PubMed]
- Sirgo, G.; Samper, M.A.; Berrueta, J.; Cañellas, J.; Rodríguez, A.; Bodí, M. Reformulating real-time random safety analysis during the SARS-CoV-2 pandemic. Med Intensiva (Engl Ed). 2024, 28, 502117. [Google Scholar] [CrossRef] [PubMed]
- Bodí, M.; Oliva, I.; Martín, M.C.; Sirgo, G. Real-time random safety audits: A transforming tool adapted to new times. Med Intensiva. 2017, 41, 368–376. [Google Scholar] [CrossRef]
- Bodí, M.; Oliva, I.; Martín, M.C.; Gilavert, M.C.; Muñoz, C.; Olona, M.; Sirgo, G. Impact of random safety analyses on structure, process and outcome indicators: multicentre study. Ann Intensive Care. 2017, 7, 23. [Google Scholar] [CrossRef]
- Lee,J. ; Maslove, D.M.; Dubin, J.A. Personalized mortality prediction driven by electronic medical data and a patient similarity metric. PloS One 2015, 10, e0127428. [CrossRef]
- Frondelius,T.; Atkova, I.; Jouko Miettunen, J.; Rello, J.; Jansson, M.M. Diagnostic and prognostic prediction models in ventilator-associated pneumonia: Systematic review and meta-analysis of prediction modelling studies. Journal of Critical Care 2022, 67. [CrossRef]
- Lekadir, K.; Frangi, A.F; Porras, A.R.; Glocker, B. ; Cintas,C. ; Langlotz, C.P. et al. FUTURE-AI: international consensus guideline for trustworthy and deployable artificial intelligence in healthcare. BMJ 2025, 388, e081554. [Google Scholar] [CrossRef]
Figure 1.
Workflow of patients included in the study (VAP: ventilator-associated pneumonia, ICU: intensive Care Unit) .
Figure 1.
Workflow of patients included in the study (VAP: ventilator-associated pneumonia, ICU: intensive Care Unit) .
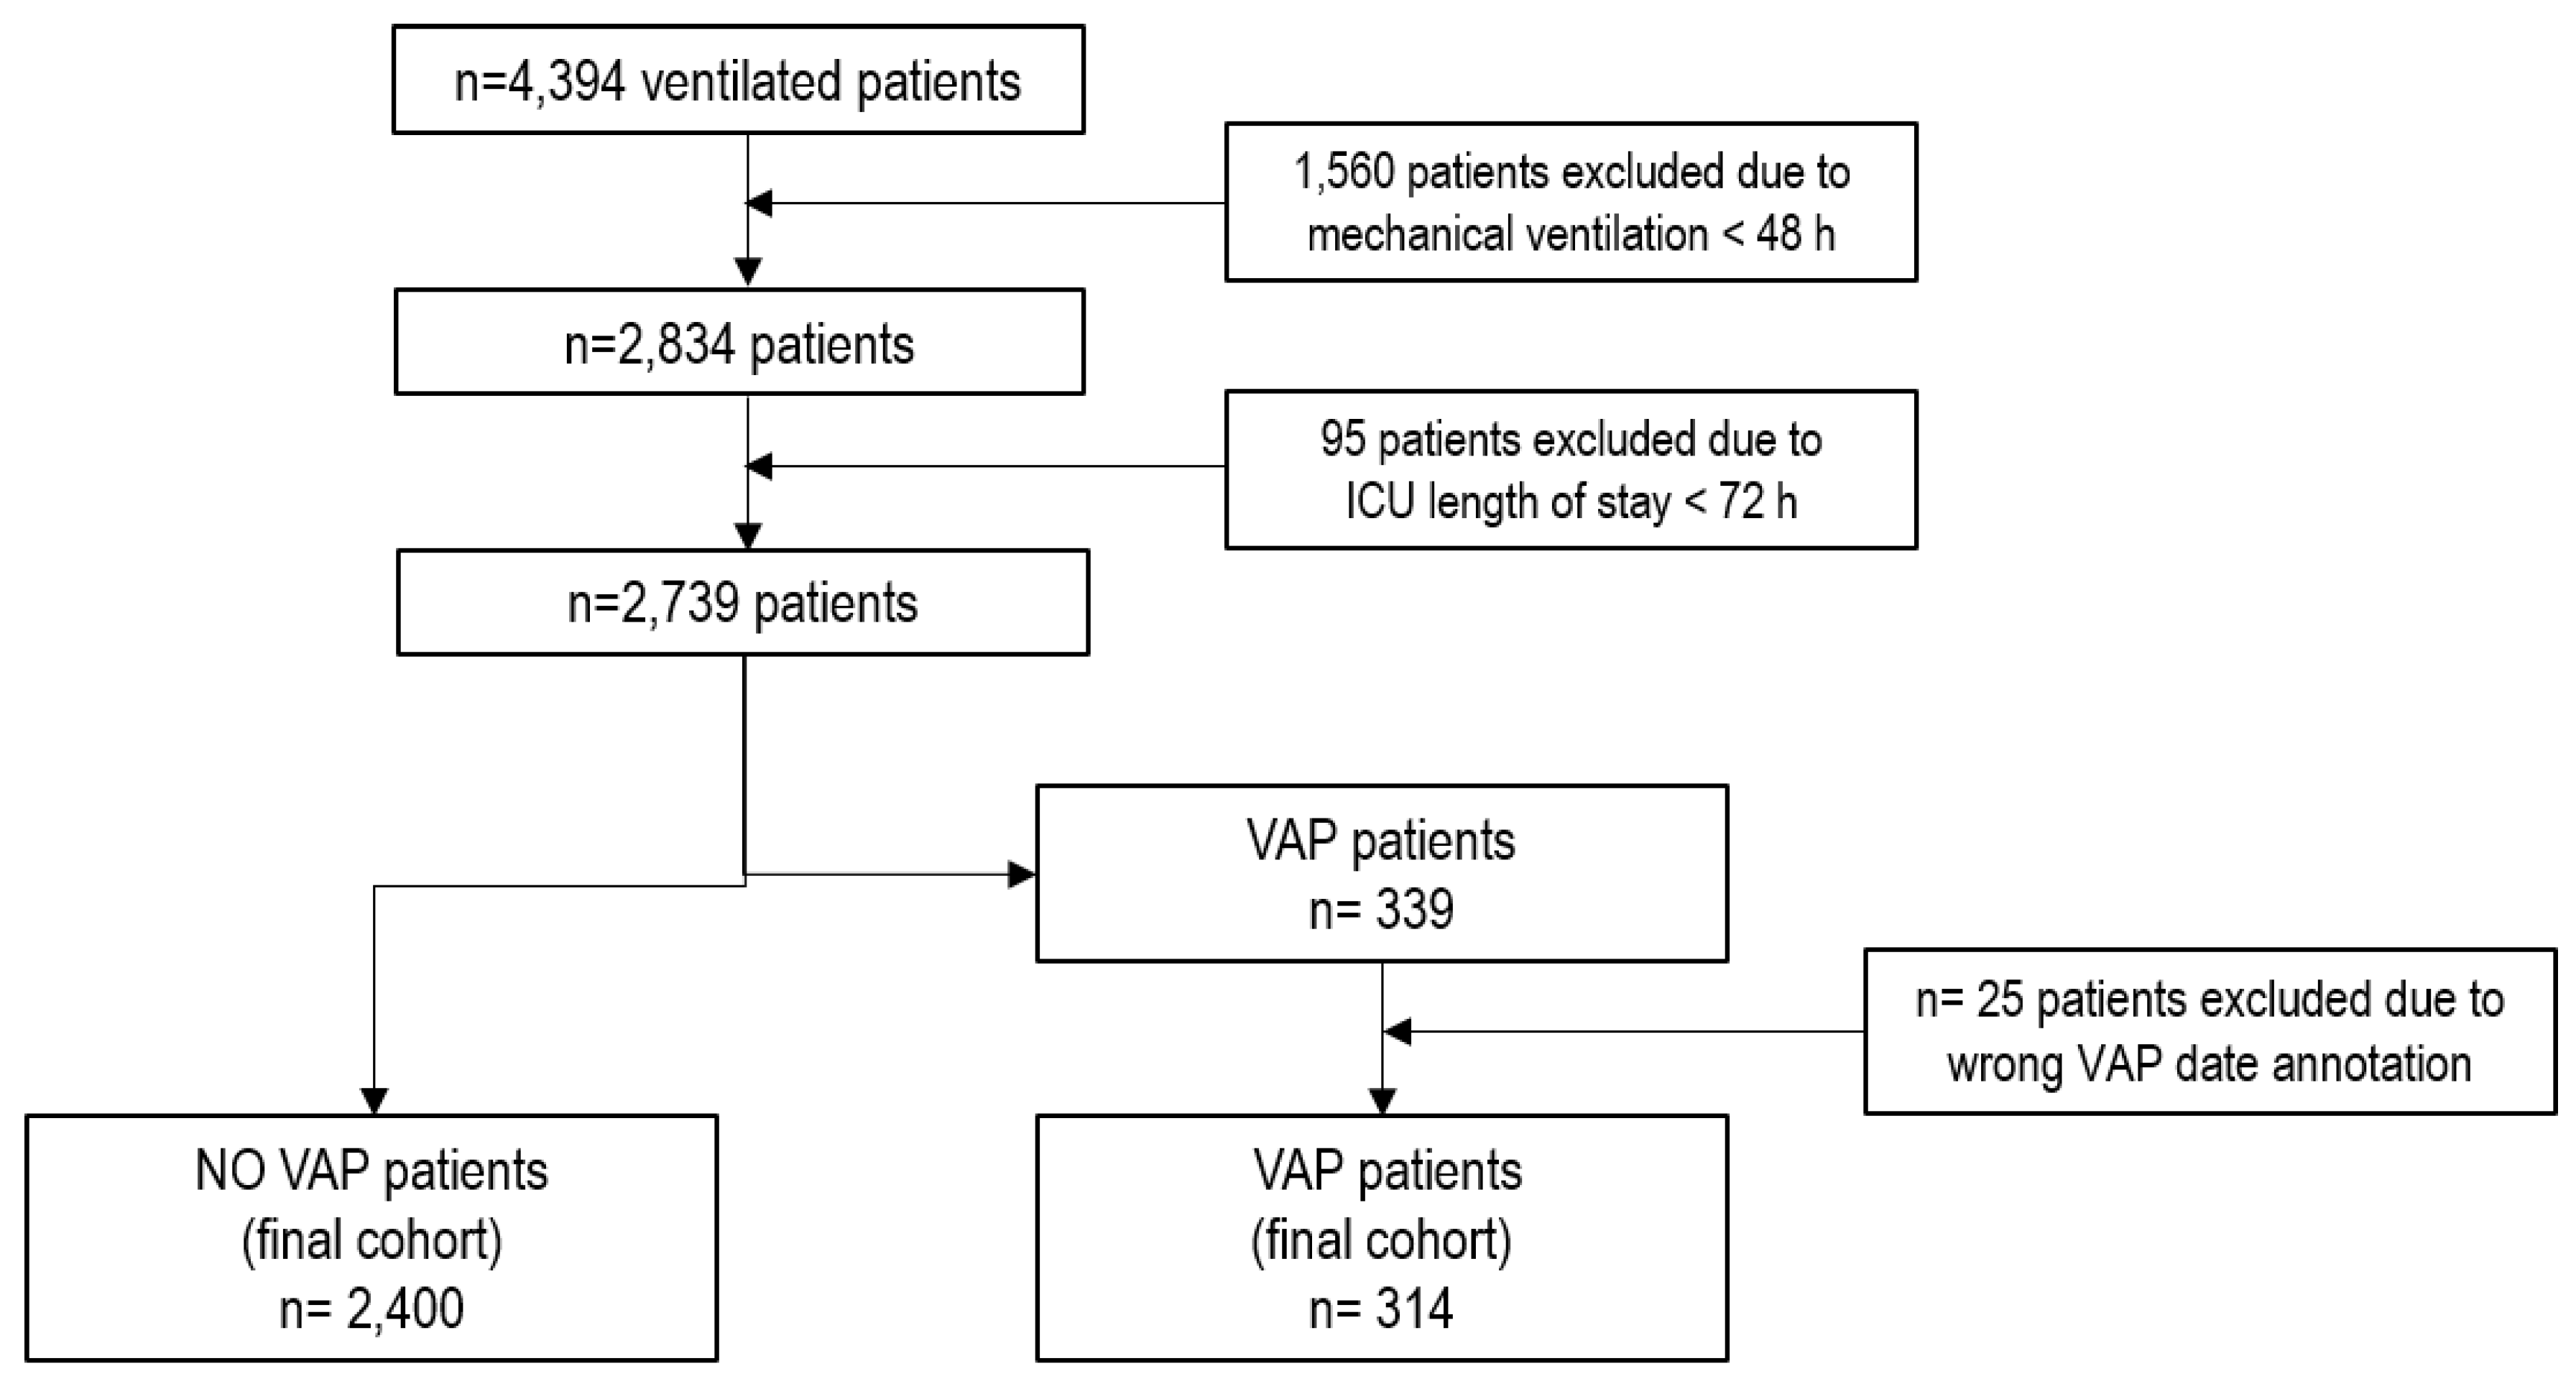
Figure 2.
Comparison of the performance of different feature selection algorithms used in relation to the number of features included. Minimum Redundancy-Maximum Relevance (mRMR), Gain Ratio (GR), Random Forest (RF), XGBoost (XGB), Forward Feature Selection (FFS), Backward Feature Selection (BFS), ROC-AUC: area under ROC.
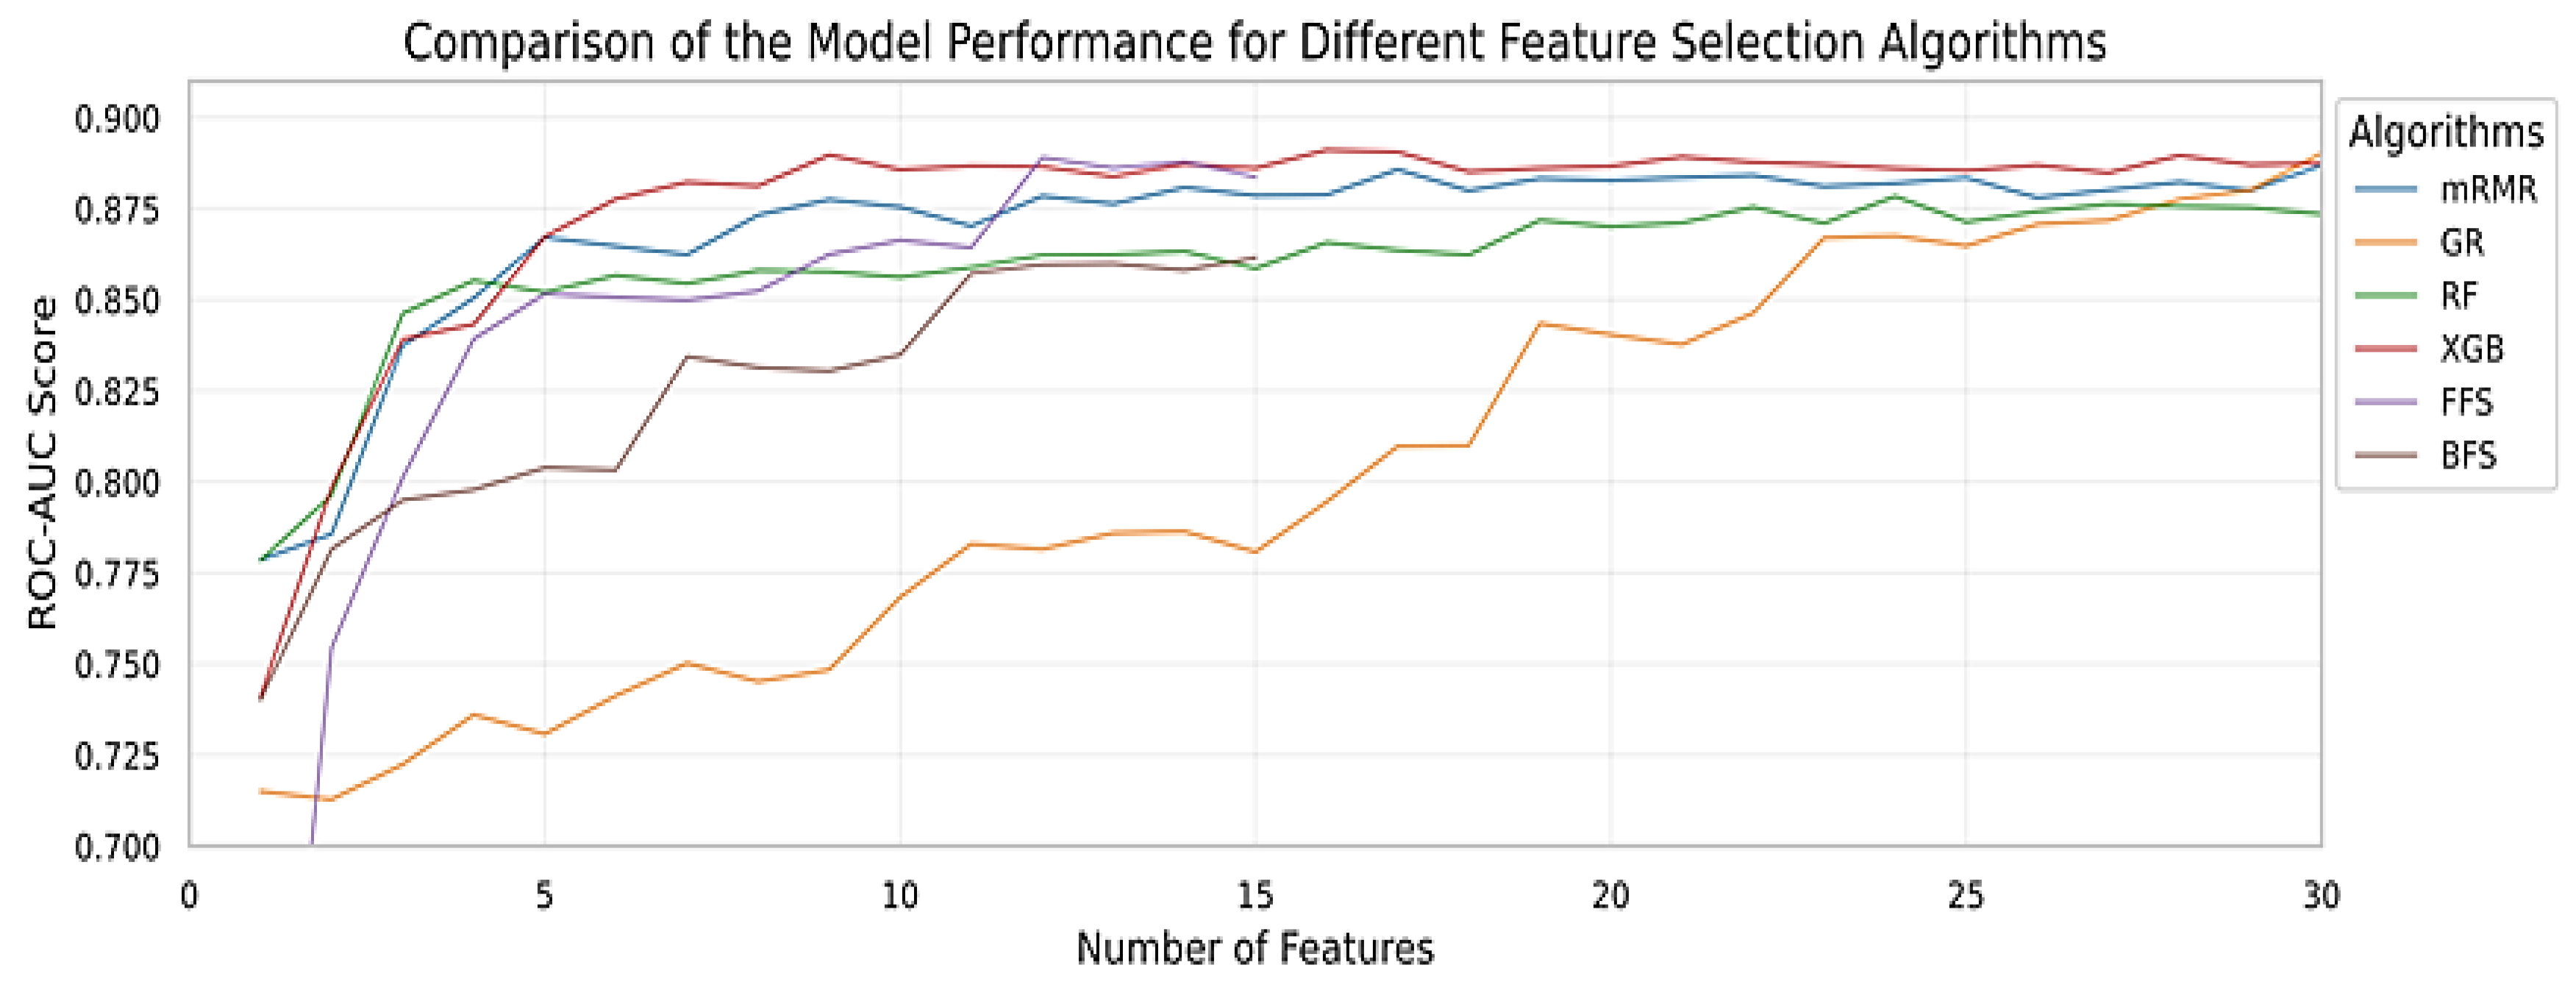
Figure 3.
Comparison of model performance throughout a patient's entire stay, including a case of VAP.
Figure 3.
Comparison of model performance throughout a patient's entire stay, including a case of VAP.
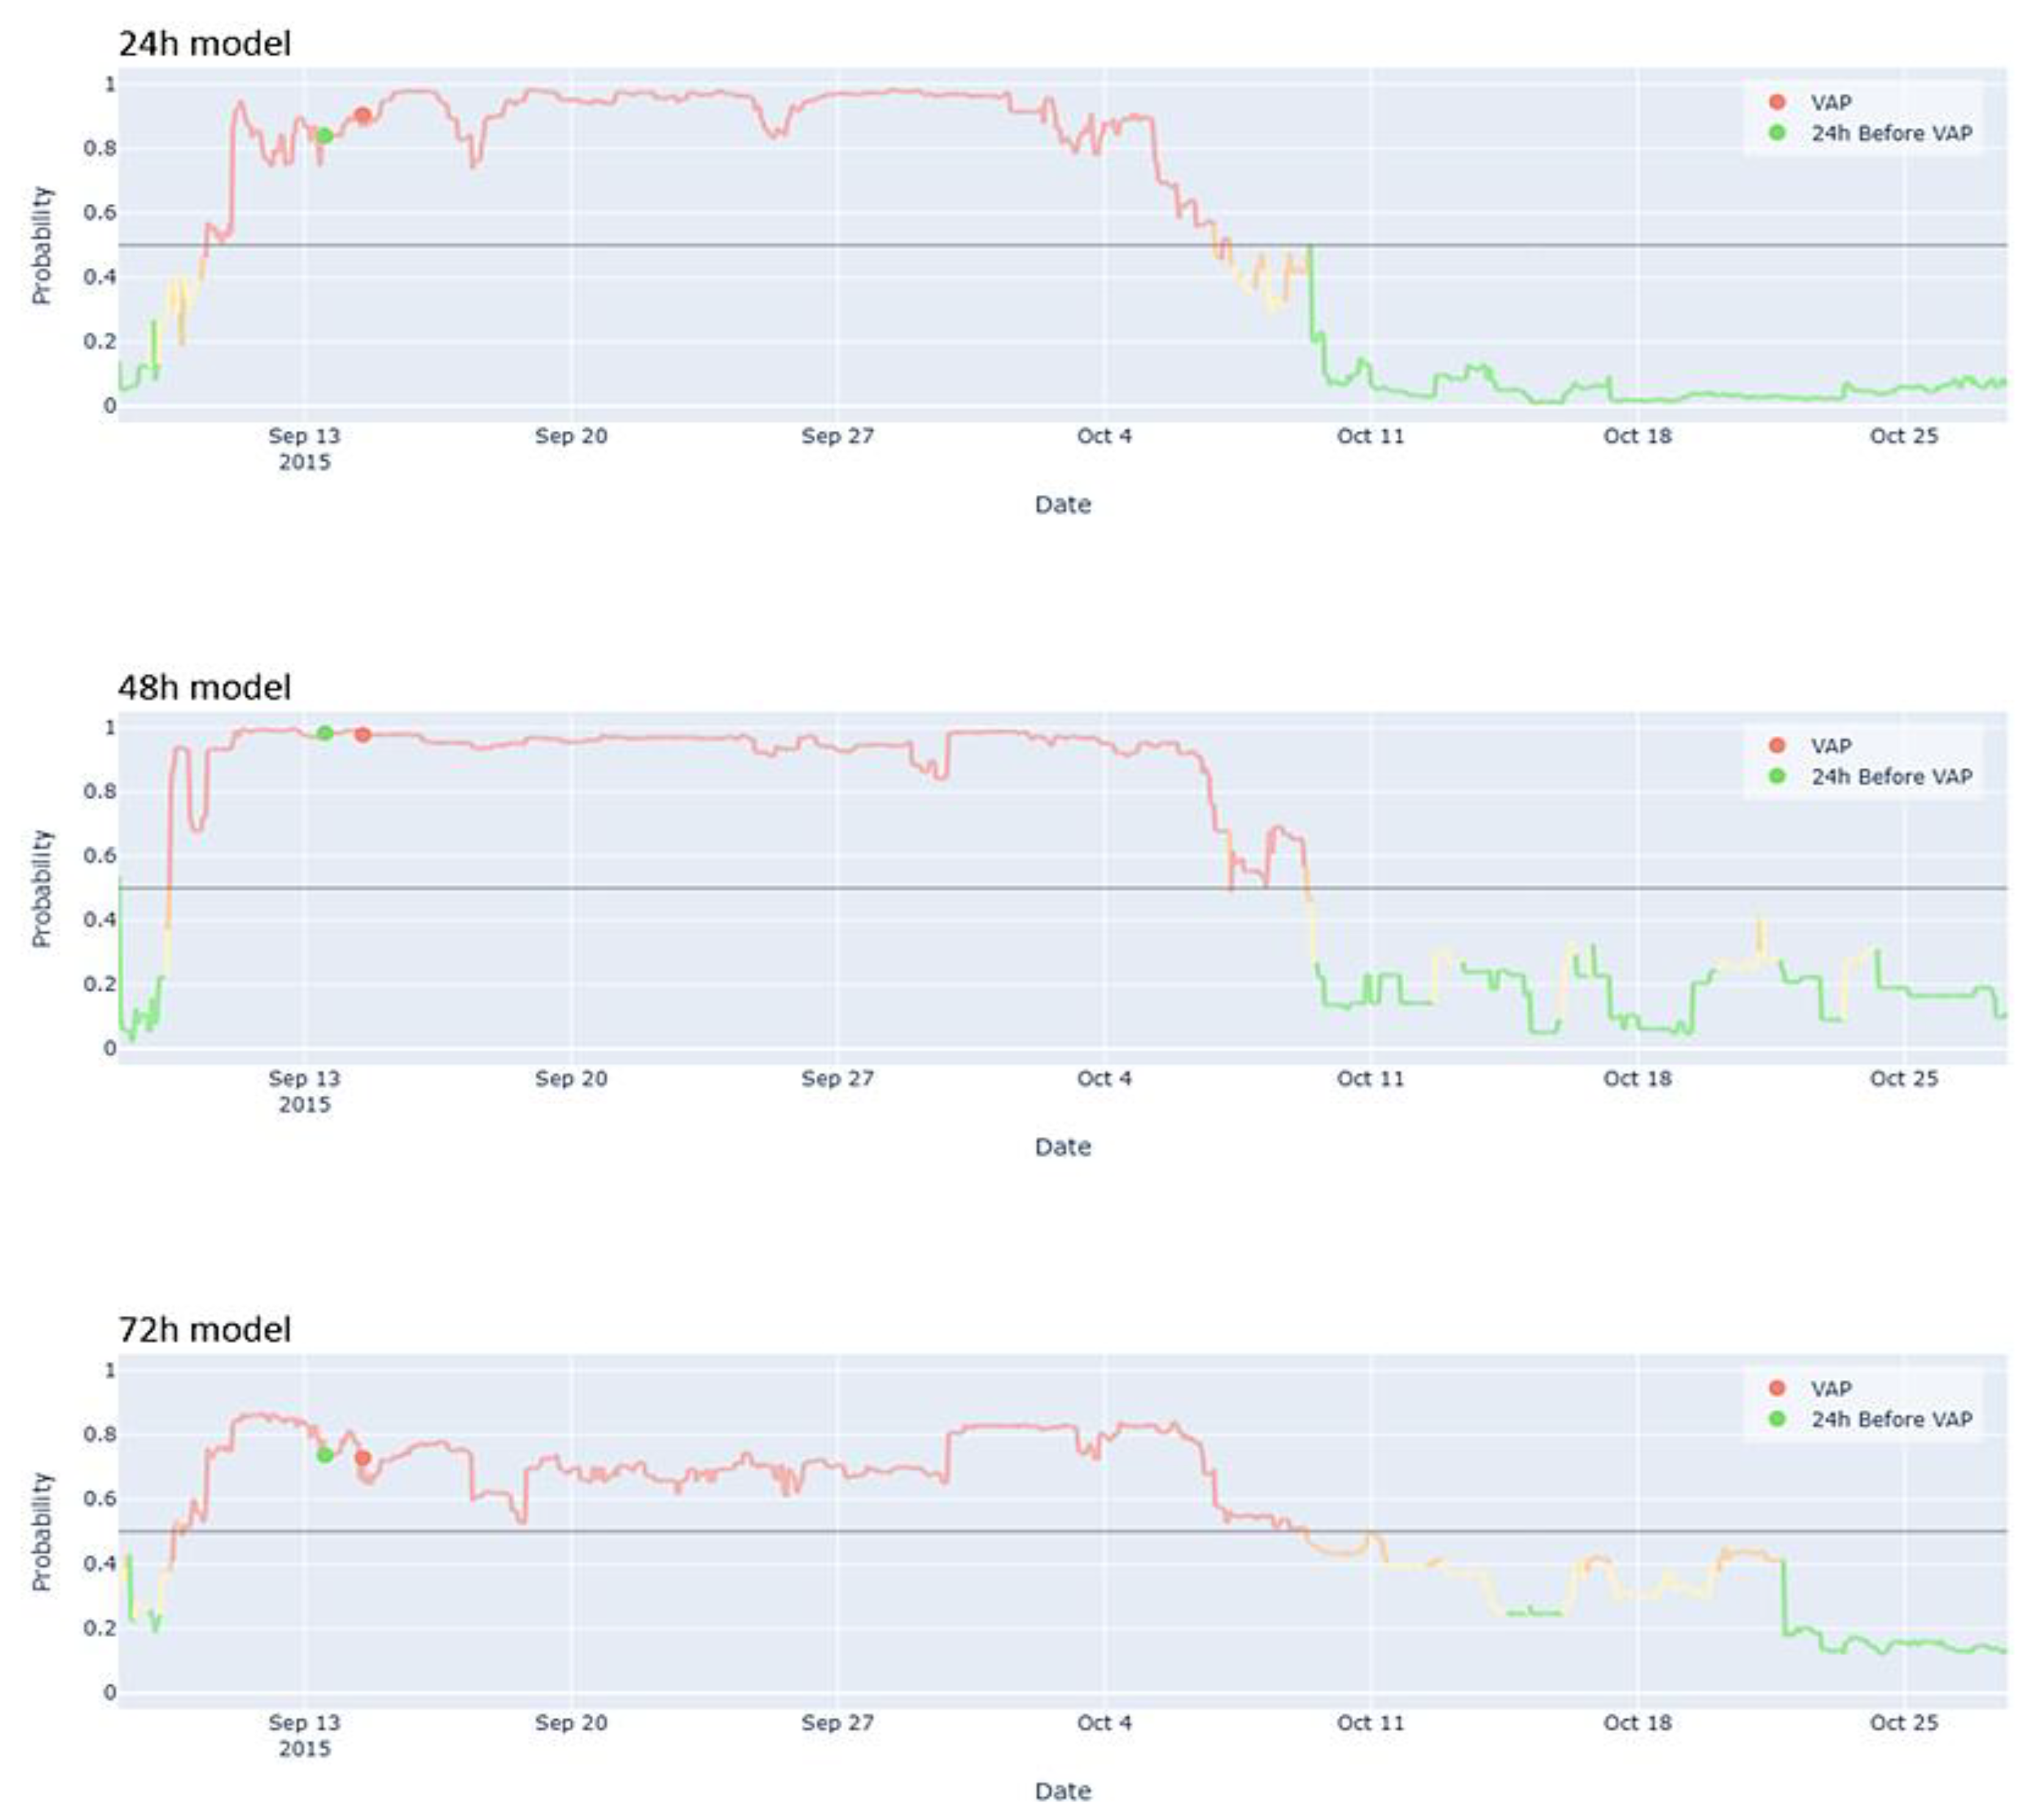
Figure 4.
Comparison of model performance throughout a patient's entire stay, including a non-VAP case.
Figure 4.
Comparison of model performance throughout a patient's entire stay, including a non-VAP case.
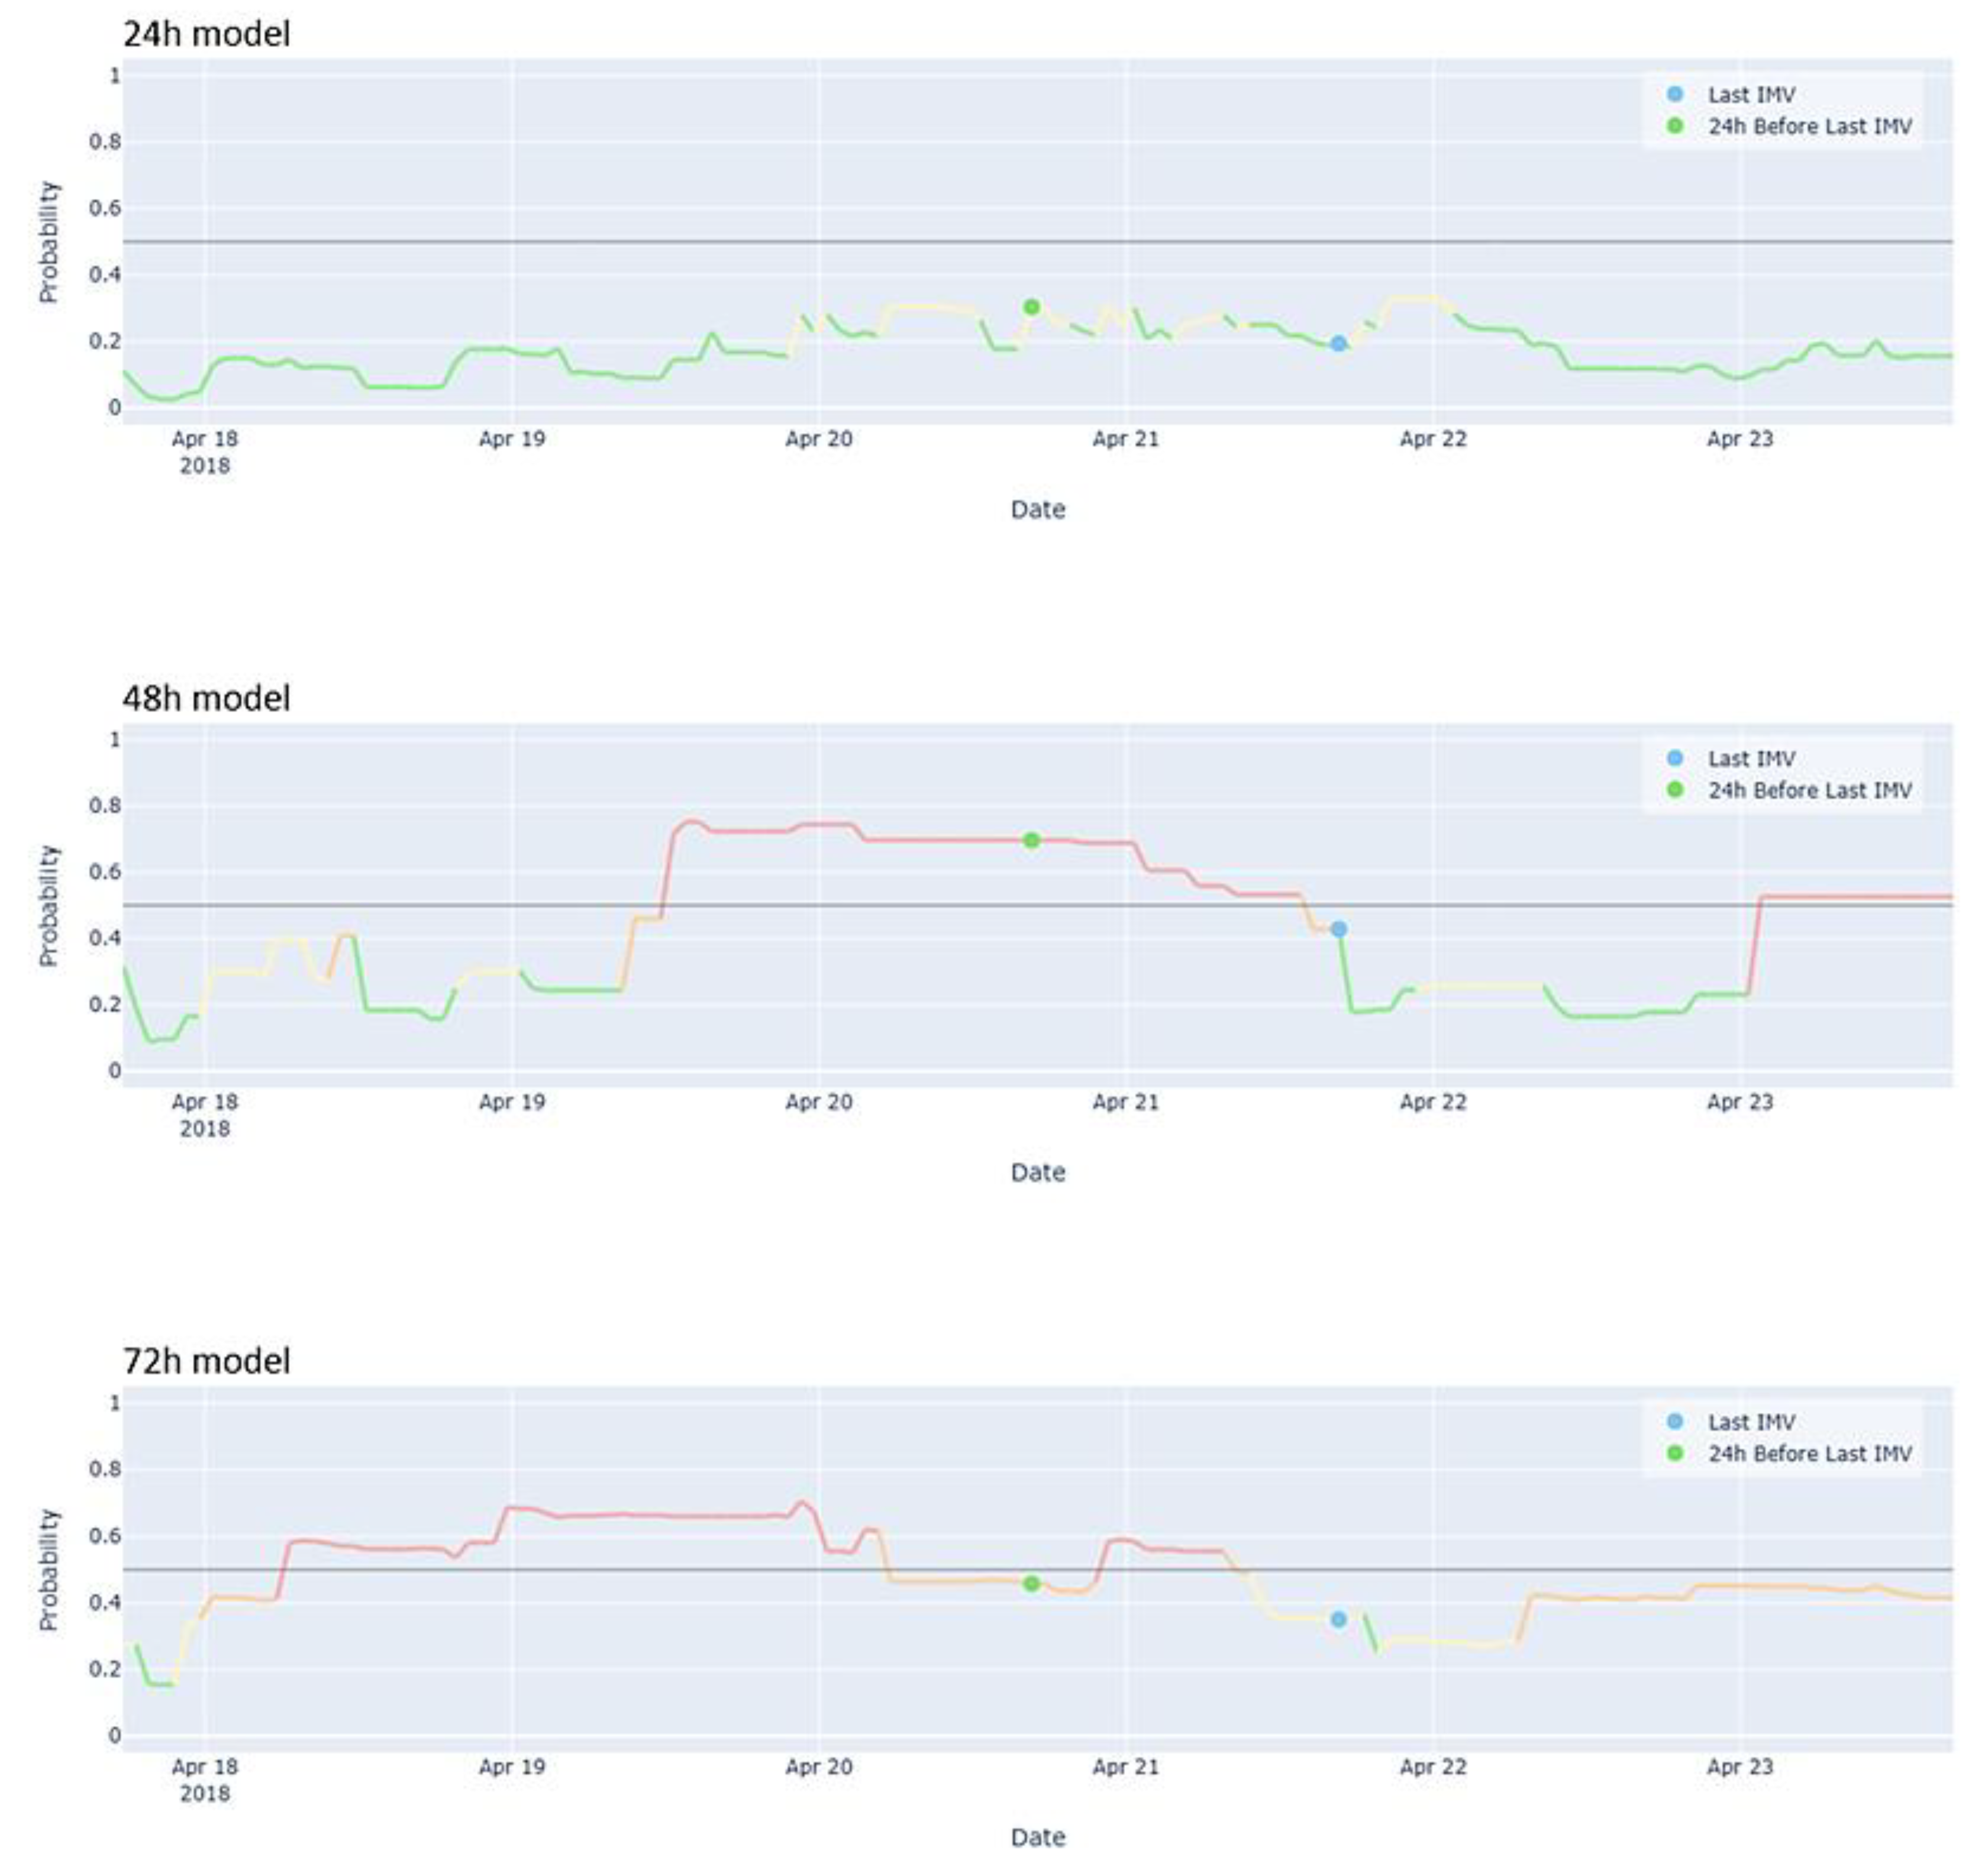
Figure 4.
Contribution of variables to XGBoost model predictions across the test dataset, sorted from most important at the top to least important at the bottom.
Figure 4.
Contribution of variables to XGBoost model predictions across the test dataset, sorted from most important at the top to least important at the bottom.
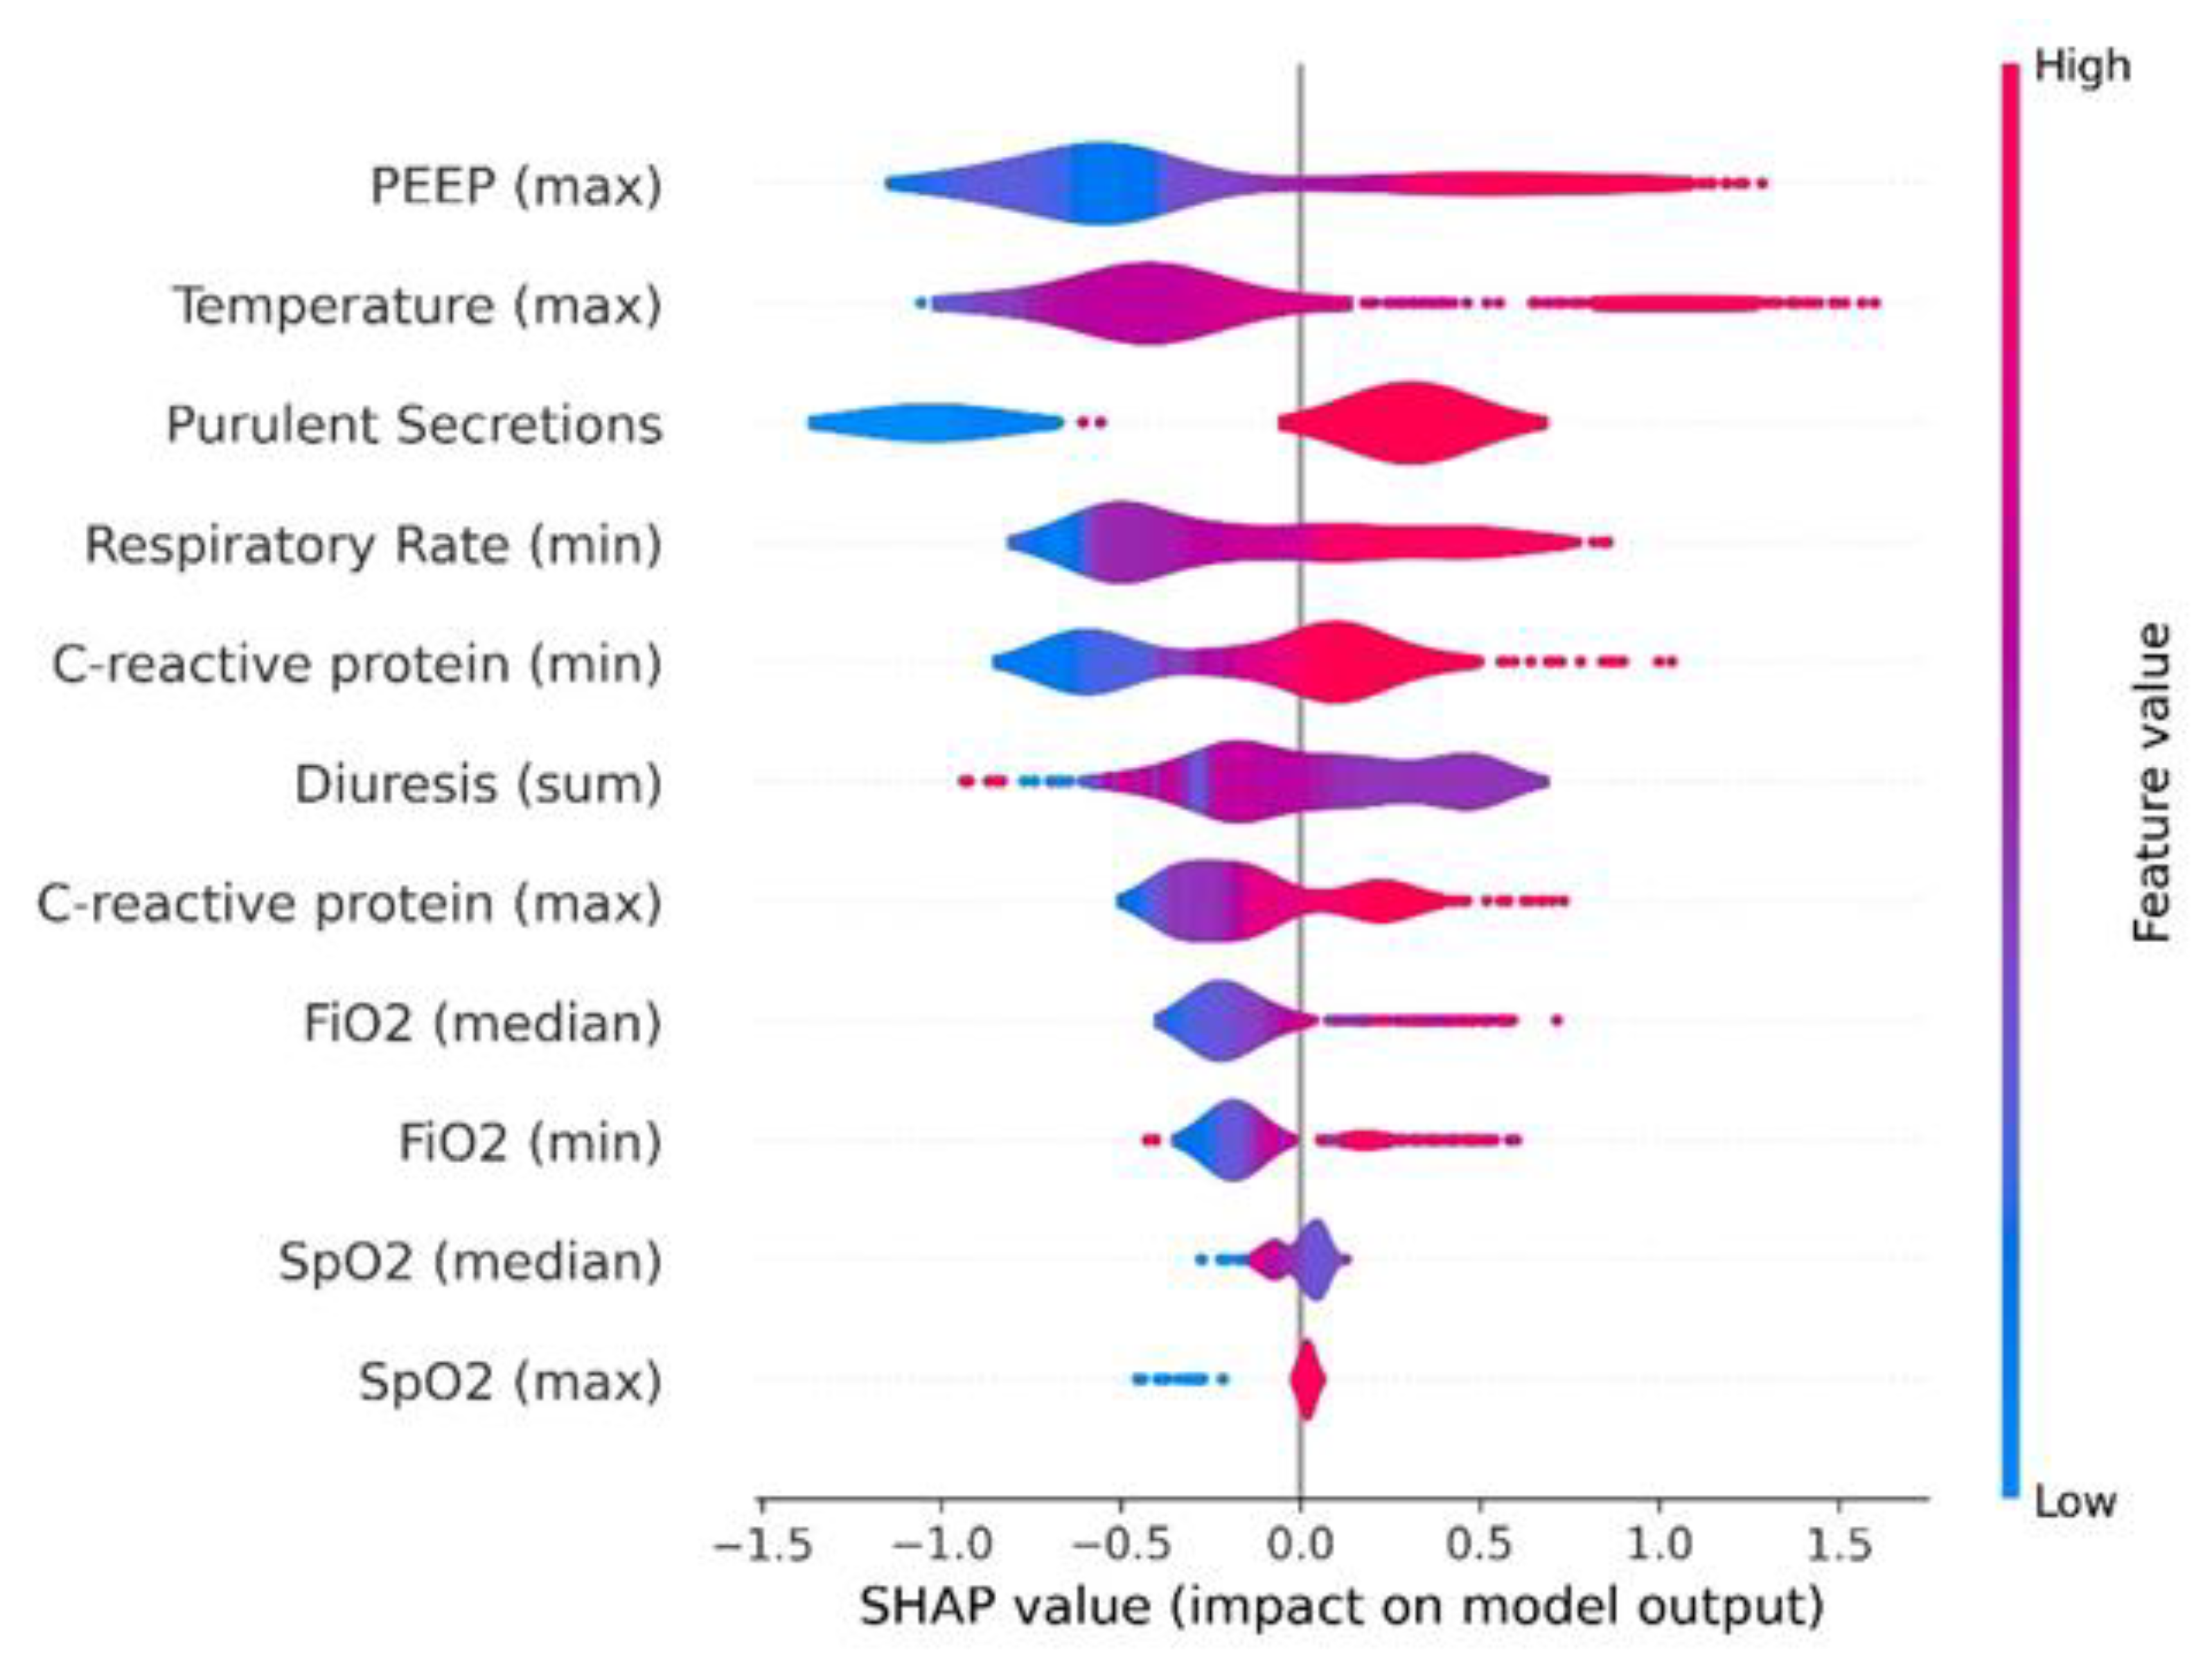

Table 1.
Variables considered and the characteristics of the patients distinguishing those with and without VAP development during the 24 hours prior the event.
Table 1.
Variables considered and the characteristics of the patients distinguishing those with and without VAP development during the 24 hours prior the event.
| Variable | Whole Population (n = 2714) |
Non-VAP (n = 2400) |
VAP (n = 314) |
p-Value | |
|---|---|---|---|---|---|
| General | |||||
| Sex, n (%) | Male | 1843 (67.9) | 1609 (67.0) | 234 (74.5) | 0.009 |
| Age, median (Q1-Q3) years | 64 (52-72) | 64 (52-72) | 62 (50-71) | 0.027 | |
| Admission type, n (%) | Urgent | 2586 (95.3) | 2286 (95.2) | 300 (95.5) | 0.930 |
| Patient type, n (%) | Medical | 1737 (64.0) | 1507 (62.8) | 230 (73.2) | <0.001 |
| Surgical | 938 (34.6) | 860 (35.8) | 78 (24.8) | ||
| Traumatic | 39 (1.4) | 33 (1.4) | 6 (1.9) | ||
| ICU LOS, median (Q1-Q3) days | 8.1 (3.9-16.4) | 8.2 (3.8-16.7) | 7.9 (4.9-13.9) | 0.709 | |
| IMV days, median (Q1-Q3) days | 7.9 (4.4-15.3) | 7.9 (4.3-15.5) | 8.1 (5.3-13.3) | 0.278 | |
| SOFA score median, median (Q1-Q3) | 4 (2-7) | 4 (2-6) | 5 (3-7) | 0.001 | |
| First APACHE II, median (Q1-Q3) | 23 (17-29) | 23 (17-29) | 20 (15-25) | <0.001 | |
| Tracheostomy, n (%) | Yes | 382 (14.1) | 353 (14.7) | 29 (9.2) | 0.011 |
| Ventilator Settings | |||||
| FiO2 median, median (Q1-Q3) % | 35 (30-40) | 31 (30-40) | 45 (35-60) | <0.001 | |
| FiO2 max, median (Q1-Q3) % | 40 (30-99) | 40 (30-98.8) | 90.5 (50-100) | <0.001 | |
| FiO2 min, median (Q1-Q3) % | 30 (28-35) | 30 (28-35) | 40 (31-50.5) | <0.001 | |
| PEEP median, median (Q1-Q3) cmH2O | 6 (5-8) | 6 (5-7.9) | 8 (6-11) | <0.001 | |
| PEEP max, median (Q1-Q3) cmH2O | 7 (5-8.9) | 6.7 (5-8) | 10 (8-14) | <0.001 | |
| PEEP min, median (Q1-Q3) cmH2O | 5 (1.8-6) | 5 (1.6-6) | 6 (4.1-9.1) | <0.001 | |
| Vital Signs | |||||
| Tª median, median (Q1-Q3) ºC | 36.5 (36-37) | 36.5 (36-36.9) | 37 (36.5-37.4) | <0.001 | |
| Tª max, median (Q1-Q3) ºC | 37.1 (36.6-37.6) | 37 (36.6-37.5) | 37.8 (37.2-38.3) | <0.001 | |
| Tª min, median (Q1-Q3) ºC | 35.8 (35.3-36.3) | 35.8 (35.3-36.2) | 36.1 (35.5-36.6) | <0.001 | |
| SpO2 median, median (Q1-Q3) % | 98 (96-99) | 98 (96-99) | 97 (95-98) | <0.001 | |
| SpO2 max, median (Q1-Q3) % | 100 (100-100) | 100 (100-100) | 100 (100-100) | 0.135 | |
| SpO2 min, median (Q1-Q3) % | 89 (82-92) | 89 (82-93) | 87 (83-91) | 0.008 | |
| RR median, median (Q1-Q3) bpm | 18 (16-22) | 18 (16-21) | 21 (18-24) | <0.001 | |
| RR max, median (Q1-Q3) bpm | 34 (28-43) | 34 (28-43) | 32.5 (26-41) | 0.075 | |
| RR min, median (Q1-Q3) bpm | 13 (10-16) | 13 (9.8-16) | 17 (15-20) | <0.001 | |
| Laboratory | |||||
| WBC median, median (Q1-Q3) x103 | 10.8 (8.1-14.9) | 10.5 (8-14.5) | 13.3 (9.2-17.8) | <0.001 | |
| WBC max, median (Q1-Q3) x103 | 10.8 (8.1-15) | 10.6 (8-14.6) | 13.3 (9.2-18) | <0.001 | |
| WBC min, median (Q1-Q3) x103 | 10.7 (8-14.7) | 10.5 (7.9-14.3) | 13.1 (8.9-17.8) | <0.001 | |
| Lymphocytes median, (Q1-Q3) x103 | 1.1 (0.7-1.6) | 1.1 (0.7-1.6) | 1.0 (0.6-1.4) | <0.001 | |
| Lymphocytes max, median (Q1-Q3) x103 | 1.1 (0.7-1.6) | 1.1 (0.8-1.6) | 1.0 (0.6-1.4) | <0.001 | |
| Lymphocytes min, median (Q1-Q3) x103 | 1.1 (0.7-1.6) | 1.1 (0.7-1.6) | 1.0 (0.5-1.3) | <0.001 | |
| CRP median, median (Q1-Q3) mg/dL | 10 (4.5-19.4) | 9 (4.1-17.7) | 21.7 (12.1-29.6) | <0.001 | |
| CRP max, median (Q1-Q3) mg/dL | 10.1 (4.5-19.8) | 9.1 (4.1-17.8) | 22.3 (12.1-30.0) | <0.001 | |
| CRP min, median (Q1-Q3) mg/dL | 9.9 (4.4-19.1) | 8.9 (4.0-17.6) | 21.1 (11.8-29.6) | <0.001 | |
| PCT median, median (Q1-Q3) ng/mL | 0.4 (0.2-1.2) | 0.4 (0.2-1.2) | 0.5 (0.2-1.2) | 0.119 | |
| PCT max, median (Q1-Q3) ng/mL | 0.4 (0.2-1.2) | 0.4 (0.2-1.2) | 0.5 (0.2-1.2) | 0.122 | |
| PCT min, median (Q1-Q3) ng/mL | 0.4 (0.2-1.1) | 0.4 (0.2-1.1) | 0.5 (0.2-1.2) | 0.115 | |
| Creatinine median, median (Q1-Q3) mg/dL | 0.7 (0.4-1.0) | 0.6 (0.4-1.0) | 0.7 (0.5-1.1) | 0.018 | |
| Creatinine max, median (Q1-Q3) mg/dL | 0.7 (0.5-1.0) | 0.6 (0.4-1.0) | 0.7 (0.5-1.1) | 0.018 | |
| Creatinine min, median (Q1-Q3) mg/dL | 0.6 (0.4-1.0) | 0.6 (0.4-1.0) | 0.7 (0.5-1.1) | 0.02 | |
| Glucose median, median (Q1-Q3) mg/dL | 125.5 (111-144) | 125 (110.5-143.0) | 131.5 (117-150) | <0.001 | |
| Glucose max, median (Q1-Q3) mg/dL | 147 (127-178) | 146 (126-176) | 160 (134-184) | <0.001 | |
| Glucose min, median (Q1-Q3) mg/dL | 106 (92-123) | 106 (92-122) | 110 (93-128) | 0.059 | |
| Drugs | |||||
| Antibiotic, n (%) | Yes | 1533 (56.5) | 1321 (55) | 212 (67.5) | <0.001 |
| Noradrenaline dose acc, median (Q1-Q3) mg/kg/min | 0 (0.0-1.6) | 0 (0.0-0.7) | 1.4 (0-11.3) | <0.001 | |
| Dobutamine dose acc, median (Q1-Q3) mg/kg/min | 0 (0-0) | 0 (0-0) | 0 (0-0) | 0.176 | |
| Manually recorded clinical parameters | |||||
| Secretion Consistency, n (%) | Thick | 1119 (41.5) | 962 (40.4) | 157 (50) | 0.011 |
| Fluid | 1542 (57.2) | 1387 (58.2) | 155 (49.4) | ||
| Mucus Plug | 27 (1) | 25 (1) | 2 (0.6) | ||
| Others | 9 (0.3) | 9 (0.4) | 0 (0) | ||
| Purulent Secretions, n (%) | Yes | 1799 (66.8) | 1518 (63.8) | 281 (89.5) | <0.001 |
| Urinary Output acc, median (Q1-Q3) mL | 1710 (1140-2410) | 1710 (1120-2415) | 1695 (1250-2320) | 0.583 | |
| Nº aspirations, median (Q1-Q3) | 4 (2-6) | 4 (2-6) | 5 (3-7) | <0.001 | |
| Outcomes | |||||
| ICU crude mortality, n (%) | Yes | 770 (28.4) | 659 (27.5) | 111 (35.4) | 0.004 |
Table 2.
Performance and variables included in each model.
| 24h model | 48h model | 72h model | |
|---|---|---|---|
| Model | XGBoost | XGBoost | XGBoost |
| Accuracy | 0.85 | 0.71 | 0.70 |
| Recall | 0.83 | 0.76 | 0.73 |
| AUC | 0.90 | 0.77 | 0.75 |
| Confusion matrix | | 52 11 | | 73 407 | |
| 48 15 | | 142 338 | |
| 46 17 | | 146 334 | |
| Majority proportion | 1.3 | 0.8 | 0.9 |
| N variables | 8 | 8 | 12 |
| N features | 11 | 10 | 13 |
| Features | - C-reactive protein (maximum) - C-reactive protein (minimum) - FiO₂ (median) - FiO₂ (minimum) - PEEP (maximum) - Purulent secretion appearance (yes/no) - Respiratory rate (minimum) - SpO₂ (maximum) - SpO₂ (median) - Temperature (maximum) - Urinary output (sum) |
- Antibiotic use (yes/no) - APACHE II (first measurement) - C-Reactive Protein (minimum) - FiO₂ (median) - FiO₂ (minimum) - PEEP (maximum) - PEEP (median) - Purulent secretion appearance (yes/no) - Respiratory Rate (minimum) - Temperature (median) |
- Age - Antibiotic use (yes/no) - Purulent secretion appearance (yes/no) - Days on invasive mechanical ventilation - Urinary output (sum) - FiO₂ (median) - Respiratory rate (median) - Respiratory rate (minimum) - Norepinephrine dose (sum) - C-reactive protein (median) - PEEP (median) - Patient type surgical (yes/no) - SpO₂ (maximum) |
Disclaimer/Publisher’s Note: The statements, opinions and data contained in all publications are solely those of the individual author(s) and contributor(s) and not of MDPI and/or the editor(s). MDPI and/or the editor(s) disclaim responsibility for any injury to people or property resulting from any ideas, methods, instructions or products referred to in the content. |
© 2025 by the authors. Licensee MDPI, Basel, Switzerland. This article is an open access article distributed under the terms and conditions of the Creative Commons Attribution (CC BY) license (http://creativecommons.org/licenses/by/4.0/).
Copyright: This open access article is published under a Creative Commons CC BY 4.0 license, which permit the free download, distribution, and reuse, provided that the author and preprint are cited in any reuse.


