
Submitted:
15 March 2025
Posted:
17 March 2025
You are already at the latest version
Abstract
This paper explores the effectiveness of an innovative risk scoring FinTech model to predict the risk appropriate return of short-term credit sales. The risk score serves to mitigate the information asymmetry between the seller of receivables (“Seller”) and the purchaser (“Funder”), at the same time provides opportunity to the Funder to earn returns as well as diversify their portfolio on a risk appropriate basis. Selling receivables/credit to potential Funders at a discount helps Sellers maintain their short-term financial stability and provide the necessary cashflow for operations and other immediate financial needs. We use 18,304 short-term credit sales transactions between April 23, 2020, and September 30, 2022, from a private FinTech startup, and its Sustainability, Underwriting, Risk, & Financial (SURF) risk-scoring system to analyze the risk return relationship. The data includes risk scores for both Sellers of receivables (e.g., invoices) along with the Obligors (firms purchasing goods and services from the Seller) on these receivables, and provides, as outputs, the mutual gains by the Sellers and the financial institutions or other investors funding the receivables. Our analysis shows that the SURF score is instrumental in mitigating the information asymmetry between the Sellers and the Funders and provides risk appropriate periodic returns to the Funders across industries. A comparative analysis shows that the use of SURF technology generates higher risk appropriate annual internal rate of returns (IRR) as compared to nonuse of the SURF scoring system in these transactions. While Sellers and Funders enter in a win-win relationship (in the absence of a default), generally Sellers of credit are not often scored based on the potential diversification by industry classification. Crowdz’s SURF technology does so and provides the Funders with diversification opportunities with numerous invoices of differing amounts and SURF scores in a wide range of industries. The analysis also shows that Sellers generally have lower financing stability compared to the Obligors (payers on receivables), a fact captured in the SURF scores.
Keywords:
credit sales
; FinTech
; invoice financing
; risk scoring
; return
; internal rate of return
; diversification
1. Introduction and Motivation
Risk-Return management of invoices is a topical issue in business and research. The pandemic crisis of 2019-20 led to severe supply chain disruption worldwide [1,2] and consequently, the short-term funding crisis especially faced by small business. The transaction that results in short term funding need for the businesses is characterized here: Business A is a “Seller” of goods or services to business B (“Obligor”) and send an invoice to business B with a due date by which the receivables should be paid. Since there is a lag, in terms of time, in the collection of funds and supply of goods and services by business A, it could result in liquidity issues for the Seller. FinTech startup Crowdz provides a platform where the Seller can list its invoice to be purchased by a “Funder” (finance company or banks) at a discount and receive the funds prior to the invoice due date. The Funder is expecting to receive the funds by the invoice due date and earn a rate of return. There is an information asymmetry that exists in this transaction. The Funder is not fully aware of the risk of the invoice it is purchasing given these are typically small firms. Since the Obligor is shifting the risk of these transactions to the Funder, the Funder would like to earn an appropriate return. This is where Crowdz’s innovative, proprietary credit risk scoring model, FinTech “SURF” (Sustainability, Underwriting, Risk, & Financial)1 comes into picture. A typical risk scoring model has potential to mitigate the information asymmetry [3] by measuring an appropriate level of collection risk through the scoring system at the same time allowing the Funder to diversify their funding across industries on a risk appropriate basis (higher risk for higher return and vice versa).
This paper provides a case study of the use of an innovative risk scoring model to mitigate information asymmetry between the Funder and the Seller and at the same time allowing the Funder to diversify their funding on the flight-to-safety theory that suggests the mitigation of risks [4,5] through risk-sharing. Receivables assets are not sales until payments are received and they reflect the quality of operations in the revenue cycle [6]. An empirical analysis on the proprietary data collected from the Crowdz on 18,304 short-term credit sales transactions between April 23, 2020, and September 30, 2022 (a period of post pandemic supply chain disruptions and liquidity crisis in the secondary short-term credits market), we find that SURF technology is effective in the assessment of the risk of the invoice being sold. Consequently, it provides higher periodic risk appropriate returns to the Funder on an absolute basis and higher risk appropriate annual internal rate of returns on a comparative basis (as compared to the nonuse of the SURF scoring system2). Crowdz’s innovative SURF technology provides mutual gains for the Sellers (in terms of liquidity) and the Funders (in terms of higher risk appropriate returns).
The remainder of this document is organized into four sections. Section I provides a comprehensive literature review and outlines the hypotheses that guide the research. In Section II, we detail the research methodology and the data collection process used in the study. Section III discusses the findings and their implications, while Section IV offers a concluding overview of the research.
2. Literature Review and Hypotheses
2.1. Supply Chain Disruption Mitigation Mechanism Studies
There is significant research undertaken in studying the actions taken by the businesses to overcome the disruption in payment and collection process and systems due to the pandemic.
2.1.1. Technology
The COVID-19 pandemic led to an increased reliance on technology to address disruption in the supply chain. [1] find that as the transports closed, the international companies increased their reliance on the artificial intelligence to for supply chain management. The usage of artificial intelligence continues to increase day by day in several companies.
On the other hand, [2] investigate the impact of the announcement of the COVID-19 pandemic on the market value and trading volume of supply chain finance (SCF) firms. Using an event study, they observe a significant valuation loss and higher trading volume of SCF firms. However, blockchain-enabled SCF firms are protected from such valuation loss and volatility in trading. They find that higher research and development (R&D) and capital expenditures by firms prevent the loss. Moreover, the firm value of blockchain-enabled SCF firms is impacted by their membership in a blockchain consortium and progress in blockchain implementation. Investors’ confidence in blockchain reduces the market uncertainty.
2.1.2. FinTech Solutions
The reliance on technology to find short-term financing solutions increased considerably as well. In their study, [7] find that the firms are turning to supply chain financing solutions to stabilize liquidity and their net working capital to maintain solvency and ensure continuity of supply through their supply chains. Their paper discloses several different types of supply chain financing solutions and how these can impact firms and their value creating partners struggling through the uncertain business environment caused by a global pandemic.
[8], through the support of empirical data collected through a focus group with industry experts, present new research directions in the Supply Chain domain (SCF), based on Contingency Theory and Resource Orchestration Theory, including new solutions, actors, collaborations, technologies, regulations, and performance.
2.1.3. Firm Characteristics
It is of high interest to the researchers to study firm characteristics that are more susceptible or resilient to supply chain disruption. [9] discover that firm size, supply chain network centrality, cash holdings, inventory, strong credit ratings, capital redeploy ability, and the number of segments increase resilience to global supply chain shocks, while financial leverage, operational leverage, and market competition weaken supply chain resilience.
2.1.4. Case Studies
There are multiple case studies, like ours, that have studied the financial impact of pandemic on the supply chain and the payment systems on specific firms or industries. [10] show that stock markets have reacted with increased price volatility. Manufacturers of fertilizers and agrochemicals as well as food distributors show particularly high volatility in their stock prices. Low price volatility was observed in the stocks of food retailers.
[11] summarize multiple such studies. The synthesis of the findings reveals that four broad themes recur in the published work: namely, impacts of the COVID-19 pandemic, resilience strategies for managing impacts and recovery, the role of technology in implementing resilience strategies, and supply chain sustainability in the light of the pandemic.
2.2. Information Asymmetry
Information asymmetry between the borrower and the lender has been extensively researched in the field of finance. [3] finds that the large banks, geographically closer in location as well in the previous lending relationship to the borrowing firms, are more inclined to lend to the firms with a high level of information asymmetry.
The borrower uses specific debt contract provisions to mitigate that information asymmetry to achieve financing a reasonable cost. [12] find that the higher level of information asymmetry exits in the smaller firms, and they typically use short-term debt for financing. They also tend to rely on trade credit as the alternative means of short-term financing. Their findings supplement the findings by [13] and [14]. [15] using the data of 6000 commercial loans from large U.S banks find that the firms with a high level of information asymmetry and positive private information issue short maturity to obtain favorable finance terms. On the other hand, the lenders, lending to firms with high level of information asymmetry are likely to provide short term credit to facilitate constant monitoring of the terms of the debt [16].
2.3. Risk Scoring Models
Increase in innovations to address short-term financing issues has led to development of risk scoring models to efficiently measure the risk of the borrower to the lenders and consequently reduce the information asymmetry. Here we provide historical perspectives on risk scoring models. All these risk scoring models are pertinent to unique lending environments, time periods, nature of borrowers and lenders, and the debt contracts.
[17] finds that the small business scoring risk score system by the banks relies on the expanded quantities, increased average prices and the higher average risk for the businesses seeking credit in the amount less than a $100,000. The study also finds that the learning curve is important in the scoring system and the scoring is different for the banks willing to adapt the technology and use discretion.
[18] presents the statistical method that most efficiently measures and captures the operational risk indicators. Although focused on the risk indicators that help the banking sector, with the Basel II Accord in mind, it can be extended to enterprise risk assessment as well. It presents different risk scoring methods for operational risk management. It highlights the negative aspects of considering only past events, or only future events. It suggests that a combined method, which considers both the history of risk events, a self-assessment and future-looking scorecard, is a better scoring method to measure the operational risk.
[19] contends that the credit score enables the users to make quick decisions, and in some cases automate decisions, in the lending process. The study states that the New Basel Capital Accord has given increased importance to risk scoring models. Banks and most financial institutions have developed or remodeled existing credit risk scoring models to conform with the new rules.
[20] perform survey on the use of credit scoring by the banks to evaluate the credit risk of small business borrowers. They find that the credit scores tend to focus on the score of the owners themselves rather than the score of the business they own. They also find that the credit scoring system leads to an increase in lending activity thereby, helping the small business with liquidity issues.
[21] discuss the Altman z-score which is still a standard model used in the field of finance to assess the risk of a default by the borrower. It is also used as a benchmark model to compare the output of the other credit risk models.
[22] discuss algorithmic credit risk scoring model and suggest that the scoring model may not guarantee unbiased scoring due to potential inability to capture the subpopulation characteristics such as race, gender, and sexual orientation. With the help of simulation analysis they show that it is possible to remove biases in the scoring system without a significant decrease in the performance if the correlations between the discriminatory attributes and the predictive variables in the model have lower correlations.
2.4. Hypotheses
Based on the review of the literature and the discussions above, we develop two testable hypotheses for the Crowdz SURF technology:
Hypothesis I.
Use of SURF technology, due to its ability to effectively assess transaction risk and mitigate information asymmetry, provides higher risk appropriate periodic returns (higher return for the lower SURF score and vice versa) for the investors.
Hypothesis II.
Use of SURF technology provides comparatively higher risk appropriate annual rates of returns as compared to nonuse of the SURF scoring system in these transactions.
3. Research Methodology and Data Collection
This section presents the econometric models and data employed in this study to estimate the relationship between risk scoring and profitability measures3. We present a comprehensive analysis of 18,304 transactions conducted on the FinTech platform Crowdz between April 23, 2020, and September 30, 2022.
3.1. Research Modelling
We develop and describe the econometric models used in this study: a linear model and a Bayesian model. For accuracy, in addition to simple linear modeling, we also employ a Bayesian model for multivariate normal distributions.
3.1.1. Linear Modeling
The linear model could be written as follows,
In which, is the response variable as measured by RETURN, IRR with SURF, and IRR without SURF for each transaction i at date t. is the constant of the model. SURF (Sustainability, Underwriting, Risk, and Financial) is the risk score measurement developed by the FinTech firm Crowdz4. SURF is calculated as the Obligor score times the Seller score divided by 100.
Explanatory variables or regressors are that include the dilution rate (DILUTION RATE) computed as the difference between invoice amount and financed amount divided by invoice amount, actual amount of time over which the financed invoice is paid to the Funder (ACTUAL TERM), and the invoice amount (SIZE) expressed in natural logarithm of dollars amount. The coefficients to be estimated are and , while reflects the error term.
Ordinary Least Squares (OLS) models are particularly popular due to their effectiveness in establishing a linear relationship between a response variable and one or more predictor variables.
The fundamental principle behind OLS regression involves minimizing the sum of squared errors (SSE), where an error is defined as the deviation between the actual values and the predicted values of the response variable. As discussed by [23], this approach is foundational in regression analysis. Furthermore, [24] highlight that OLS techniques are versatile and find applications across a wide range of disciplines.
In our analysis, we assume that the dependent and independent variables demonstrate a linear relationship. We model this connection through Ordinary Least Squares (OLS) regression, a robust method that empowers the intricate relationship between risk and return5.
3.1.2. Bayesian Estimation
Bayesian regression provides a robust framework for estimating the posterior distribution, which incorporates both the likelihood of the data and the prior distribution6. This probabilistic modeling technique allows researchers to draw inferences about hypotheses based on the available data [25]. One of the key benefits of Bayesian methods is their effectiveness in addressing statistical challenges, particularly those arising from small sample sizes. Previous research has demonstrated that Bayesian approaches can adeptly handle a range of dataset sizes and manage the distributions of various variables [26,27,28].
Given the intricate relationships between the variables associated with risk and return in this study, Bayesian linear regression is a suitable choice for our model.
Assume D is Data, is the dependent variable and is the independent variable for N sample size.
Bayesian linear is written as follows,
The general Bayesian model is,
The error term, follows a normal distribution and expressed as
Parameters to be estimated are,
The Bayesian process is a statistical method that estimates parameters based on the available data and predicts a range of possible outcomes by incorporating probabilities . Essentially, Bayesian regression explores all potential relationships between and variables and provides a tolerance interval that can indicate either positive or negative outcomes. If there are changes in signs, this may suggest a misspecification in the relationship among the variables involved.
In the context of Bayesian Machine Learning, this approach utilizes a Gaussian distribution of functions and follows specific rules for effective predictions and modeling,
where,
is the likelihood of
represents the prior on
is the posterior of given data D
Expressed in terms of OLS estimators, the Bayesian approach is as follows,
Then the variance (Sigma2) is,
Bayesian models are utilized in numerous fields, demonstrating their versatility and effectiveness. Recent advancements in statistical software have improved the application of Bayes' rules, enhancing modeling techniques in research [25].
3.2. Data Description
The selection of Crowdz case as a FinTech platform is based on the availability of private data provided by the firm. Additionally, FinTech has evolved exponentially in recent times. For instance, in a recent research [25] investigate the link between mobile application technology and the growth of deposits of the largest European and American banks from 2005 to 2022. They conclude the importance of technology in supporting the financial performance of traditional banks.
Three dependent variables - RETURN, IRR with SURF and IRR without SURF - are employed in this study as measures of profitability. Return from the repayment process on the FinTech platform is calculated as the difference between repaid amount and funded amount divided by the funded amount. Additionally, internal rates of return (IRR) with and without the risk scoring (SURF) are used to assess the profitability.
As shown in Table 1, from April 23, 2020, to September 30, 2022, the RETURN, IRR with SURF, and IRR without SURF 7 have means of 2%, 17%, and 15% and standard deviations of 2%, 6%, and 13%, respectively. Additionally, RETURN has a maximum of 31% and a minimum of 0.5%.
As for independent variables, the SURF is the major explanatory variable. SURF assesses the invoice risk score based on a scale from 0 to 100. The higher the SURF score, the lower the invoice risk. Based on 18,304 observations, SURF varies between 1.57 and 99.97, with a mean of 92 and a standard deviation of 14 (see Table 1). Control variables include the DILUTION RATE, ACTUAL TERM, and the invoice amount (SIZE). DILUTION RATE presents the percentage given up by the invoice Seller against the amount financed. That rate varies between 35% and 0% with an average of 13.5% and a standard deviation of 4.6%. ACTUAL TERM measures the amount of time it takes for the Funder to receive the funds. That time varies between 6.5 days and 0 days with an average of 3.6 and a standard deviation of 0.7. To address data heterogeneity, SIZE is expressed in natural logarithm of the invoice amount. The SIZE variable has a mean of 5.4, a standard deviation of 1.4, a minimum of negative 0.3, and a maximum of 13, as shown in Table 1.
Additionally, we carefully examine the relationships among the variables, as outlined in Table A2 in the Appendix A. To ensure the integrity of our model, we retain only those correlations that are below 80%. This rigorous approach helps us identify and address any potential issues related to multicollinearity, which could undermine the reliability of our findings. As a result, the correlation matrix shows that the remaining variables operate within acceptable levels of independence, thereby enhancing the credibility of our subsequent regressions.
4. Findings and Discussion
We investigate the potential for SURF technology to accurately establish the risk and return profile of the accounts receivable to provide the risk appropriate financial returns and enhance the internal rate of return for investors. Our findings suggest that by employing advanced technology solutions, these firms can more effectively evaluate and manage risk, which not only creates additional value for their operations but also provides crucial support to small businesses. This study emphasizes the transformative role of FinTech innovations in fostering sustainability and growth within the small business sector.
The core hypothesis is that FinTech, such as SURF technology, has potential to boost the returns for the Funders (investors) along with the option to evaluate potential investments based on level of risk to generate risk appropriate returns.
4.1. Linear Risk-Return Relationship: OLS and Bayesian
In this section, we discuss the estimates of linear and Bayesian for linear regressions
Higher risk-taking behavior is frequently linked to the potential for higher expected returns. In this study, we employ a risk assessment tool known as SURF, which specifically analyzes the invoices within the accounts receivable of various firms. By examining these invoices, we aim to provide deeper insights into the relationship between risk and return in financial practices.
The SURF score serves as a key indicator of the risk associated with invoices, with a higher score reflecting a lower level of risk. This score is crucial for businesses when evaluating the reliability of financial transactions. As shown in Figure 1, it is generally observed that the Obligor’s (buyer’s) score tends to be higher than that of the Seller. This difference highlights the varying degrees of risk that each party incurs in the short-term transactions. The invoice score, which combines Obligor and Seller scores, points to the level of risk that Funders face when engaging with the Sellers. Essentially, the invoice score encapsulates the overall risk management dynamics between Funders and Sellers, providing valuable insights for both parties when making financial decisions.
4.1.1. Risk and Return on Ordinary Least Squared Models
We propose that evaluating investments with varying degrees of risk can enhance the profitability of Funders. As illustrated in Table 2, linear regressions indicate that the risk measure (SURF) has a negative impact on both profitability metrics (RETURN (1) and IRR with SURF (2)) at a significance level of 1%. This suggests that a higher SURF score, which indicates lower risk, leads to decreased RETURN and IRR for investors. Specifically, a 1% increase in the SURF score results in a 0.1% decrease in RETURN and a 0.4% decrease in IRR. This finding aligns with the established relationship between risk and return: higher risk is associated with higher returns, while lower risk correlates with lower returns. A higher SURF score indicates lower invoice risks and suggests a more stable profit outlook. This distinction is crucial for understanding the relationship between risk tolerance and financial performance.
Interestingly, in comparing the Internal Rate of Return (IRR) with the utilization of the SURF scoring model (column (2) of Table 2) to the IRR calculated without it (column (3) of Table 2), we uncover some significant insights. Notably, both the actual time it takes to finance an invoice (ACTUAL TERM) and the size of the invoice itself (SIZE), demonstrate a positive relationship with the IRR when the SURF score is integrated into the assessment. This means that as the waiting period for repayment extends and the invoice amount increases, investors experience a higher IRR when employing the SURF score.
Conversely, when we evaluate the IRR without considering the SURF score, a contrasting trend emerges. Here, the relationship is negative; longer repayment terms and larger invoices tend to result in a diminished IRR for investors. Furthermore, this detrimental impact is less pronounced compared to the IRR with SURF, indicating that the absence of a robust risk assessment tool may lead to increased volatility in profitability. These findings collectively underscore the importance of effectively assessing risk. By leveraging the SURF scoring model, investors can better navigate the challenges posed by extended payment periods and large invoice amounts, ultimately achieving more stable and favorable returns. This supports our hypothesis that a comprehensive risk evaluation, as exemplified by the SURF score, plays a crucial role in enhancing overall investment outcomes.
The DILUTION RATE (discount on the invoice purchased) has a negative impact on RETURN and a positive effect on both IRR with and without the SURF score, as demonstrated in Table 2. Statistically, a 1% increase in the dilution rate results in a 4% decrease in RETURN, while the IRR with SURF increases by 7% and the IRR without SURF increases by 8%.
It is essential to recognize that the relationship between dilution rate (DILUTION RATE) and returns (RETURN) can be challenging to predict, as returns are assessed periodically and do not factor in time. A more insightful measure is the time-adjusted metric such as the Internal Rate of Return (IRR), which better illustrates the anticipated positive relationship between dilution rate and returns.
The intercepts of all three regressions are positive and statistically significant at the 1% level.
In Table 2, the overall significance of the regression, F-statistics is notably robust. The R-squared values, which indicate the proportion of variance explained by the model, demonstrate a remarkable degree of fit for both RETURN and IRR when incorporating SURF, achieving values of 86% and 83%, respectively. In contrast, the R-squared for IRR without SURF languishes at a mere 34%. This significant difference suggests that the SURF effectively measures the risk of the transaction. We can confidently assert that SURF serves as a valuable tool for providing risk appropriate return to Funder and investment opportunities of varying degree of risk8.
4.1.2. Risk and Return on Bayesian Models
To evaluate the accuracy of linear results, we implement a Bayesian procedure that leverages multivariate features. This Bayesian approach fundamentally differs from traditional methods by treating all parameters as random variables, allowing each parameter to be characterized by a full probability distribution rather than being defined by a single estimate, such as the mean. This stands in contrast to the Ordinary Least Squares (OLS) method, which relies on the assumption of fixed values for parameters. By adopting the Bayesian framework, we gain a more comprehensive understanding of the uncertainty surrounding each parameter, leading to richer insights into the relationships within the data.
Table 3 presents the outcome of Bayesian regressions for the three response variables (RETURN, IRR with SURF and IRR without SURF) and findings support the robustness of linear regressions.
For instance, the relationships between return on financing (RETURN) and the SURF score, dilution rate (DILUTION RATE), and invoice size (SIZE) exhibit negative sign at a 95 percent credibility interval. The Monte Carlo Standard Error (MCSE) for these relationships are 0.007, 0.051, and 0.003, respectively. This suggests a systematic decrease in RETURN as the SURF score, the dilution rate or the invoice size increase. Meanwhile, the actual time it takes to repay the Funder (ACTUAL TERM) and the constant maintain a positive relationship to RETURN with MCSE of 0.006 and 0.009, respectively for an acceptance rate of the regression at 36 percent.
Similarly, when examining the internal rate of return (IRR) with the SURF score and without it, the findings are consistent and robust. Here, the dilution rate (DILUTION RATE) and the constant again show a positive links with both iterations of IRR, reinforcing the idea that increased dilution potentially raises the IRR when risk factors are included.
Additionally, there are nuanced findings regarding ACTUAL TERM and SIZE. While these variables maintain positive relationships with IRR when SURF is accounted for, they switch to negative relationships with IRR when SURF is excluded. This variation arises at the same 95 percent credibility interval, with acceptance rates for these insights recorded at 32 percent for IRR with SURF and 34 percent for IRR without SURF. Such dynamics accentuate the significance of the SURF score in return expectations and highlight the complex interplay between these financial metrics.
Bayesian analysis is fundamentally anchored in the interplay between conventional probability and posterior distributions. A posterior distribution emerges from the integration of a prior distribution and a likelihood model, which infuses our understanding with insights drawn from empirical observations. Depending on the selection of prior distributions and likelihood models, the resultant posterior distribution may be derived analytically or approximated, using advanced techniques, such as Markov chain Monte Carlo (MCMC) methods.
The Monte Carlo Standard Error (MCSE) serves as a critical benchmark for assessing the accuracy of Monte Carlo samples. A smaller MCSE value indicates superior sampling performance, highlighting the effectiveness of the sampling process in capturing the true underlying distributions [25].
Under financial frictions, a risk pricing system could effectively mitigate behavioral anomalies. For instance, the impact of over-optimism on risk-taking behaviors and expected returns in banks has been widely demonstrated. The phenomenon of credit expansion can be understood through this perspective, as discussed by [29]. Additionally, [30] explore an economy characterized by financial frictions, where a regulator conducts a test that reveals external information about a firm's quality to investors, while the firm simultaneously discloses verifiable internal information regarding its quality. This interplay can significantly affect credit ratings and valuations.
[31] identify that investors often exhibit insensitivity, as the relationship between subjective expectations and actions becomes more pronounced when those expectations align closely with rational expectations. Their research highlights the necessity of integrating weak transmission effects into belief-based asset pricing models.
4.2. Risk Assessment and Profitability by Industry
In this section, we present a detailed analysis of our findings by classifying our sample according to industry. To ensure accuracy, we include only samples with more than 500 observations. Next, we conduct Ordinary Least Squared (OLS) regressions categorized into five industries: Accommodation and Food Services, Construction, Manufacturing, Professional, Scientific and Technical Services, and Real Estate, Rentals, and Leasing.
For both RETURN (Panel A) and IRR with SURF score (Panel B) as response variables, as presented in Table 4, the SURF variable consistently demonstrates a significant negative relationships across all industries at the 1% confidence level. This finding supports the theory that higher risks are associated with higher returns, while the opposite holds true when relevant risk assessments are considered. These results further strengthen our hypothesis that a thorough evaluation of risk can lead to better investment opportunities by effectively aligning investors' risk and return preferences.
Upon examining Panel A (RETURN) by industry, we observe that the dilution rate (DILUTION RATE) exhibits a significantly positive relationship for industries such as accommodation and food services, as well as professional, scientific, and technical services. Conversely, it shows a negative relationship for the construction, manufacturing, and real estate, rentals, and leasing sectors. As previously mentioned, predicting the relationship between dilution rate and returns presents certain challenges, primarily due to the fact that returns are evaluated on a periodic basis without taking time into account. To more accurately reflect the anticipated positive relationship between dilution rate and returns, it is recommended to employ time-adjusted metrics, such as the Internal Rate of Return (IRR). This approach provides a more nuanced understanding of the dynamics involved.
Additionally, for all industries considered, both the actual term (ACTUAL TERM) and the intercept (CONS) are positively and significantly linked to RETURN. Notably, the invoices amount (SIZE) variable is negatively associated with RETURN at a 1% level of significance across all industries.
Furthermore, in analyzing the five industries, we observe a notable distinction between Panel B (IRR with SURF) and Panel C (IRR without SURF). Specifically, the actual repayment term (ACTUAL TERM) and invoice size (SIZE) display alternating signs: both metrics are significantly positive for the IRR with SURF score, while they turn negative for the IRR without SURF score. This finding reinforces the impact of the risk-taking measure (SURF) in rewarding investors for both the duration of their capital commitment and the substantial size of financing invoices.
Interestingly, while the dilution rate is positively associated with the internal rate of return (IRR) with SURF across all industries (as shown in Panel B of Table 4), this variable exhibits a particularly strong positive relationship with both the RETURN and the IRR with SURF specifically in the professional, scientific, and technical services industry.
These insights further reinforce our hypothesis that a comprehensive evaluation of risk not only yields a clearer understanding of potential investments but also improves the alignment between investors' risk tolerance and their return expectations. By closely analyzing risk factors through the lens of the risk metric (e.g. SURF), investors can uncover better investment opportunities that may have otherwise been overlooked, ultimately leading to more informed decision-making and enhanced portfolio performance.
This study underscores the importance of integrating robust “risk-pricing”9 approaches in investment strategies, thereby contributing to more effective risk management practices within diverse industries.
Our findings contribute to the existing body of research addressing the significant issue of high information asymmetry prevalent in small firms. This asymmetry frequently results in challenges related to decision-making and resource allocation, creating a disconnect between the firms' risk profiles and the information accessible to external stakeholders. We underscore the essential role that a robust risk scoring system can play in alleviating these challenges. By offering a standardized framework for evaluating and communicating risk, such systems can effectively diminish information asymmetry, thereby fostering enhanced trust and investment opportunities. This is in line with the conclusions drawn by previous studies, including those by [12] and [17], which emphasized the necessity for improved information-sharing mechanisms to bolster the transparency and stability of small enterprises.
We conclude that risk pricing is a vital component in guiding investors regarding their risk-return preferences and empowering them to make informed decisions that align with their investment strategies. The accurate reflection of asset-risk level, risk pricing mechanisms support flight-to-safety strategies. Consequently, a robust risk-pricing framework is essential for fostering efficient markets and assisting investors in navigating economic, political, financial, and legal market conditions.
5. Conclusions and Extensions
Covid-19 pandemic and resulting disruption in the supply chain management across the globe led to a cascading disruptive effect on the payment systems in the working capital management of the firms. As is the case during the times of crisis, the Seller of the receivables faced liquidity crunch due to lack of trust or information symmetry between the Seller and the Funder (investor). The pressing need to address this disruption led to innovation by a FinTech startup Crowdz in developing SURF (Sustainability, Underwriting, Risk, & Financial) scoring technology to provide a robust score to the receivables/credit (invoices) and facilitate liquidity in the secondary receivables markets.
Our analysis shows that the SURF score is highly effective in capturing the risks of counter parties (Obligor and Seller) in these transactions and consequently, provides the risk appropriate (higher return for higher risk and vice versa) periodic absolute returns to the Funders across industries. A comparative analysis shows that the use of SURF technology generates higher risk appropriate annual rates of returns (IRR) as compared to nonuse of the SURF scoring system in these transactions. Our results are robust overall and across industries.
Besides providing liquidity to the secondary short-term credits markets, Crowdz technology also provides the Funders with the diversification opportunity with numerous invoices of differing amounts and SURF scores in a wide range of industries.
The future course of this research should include how the presence of AI (artificial intelligence) in the scoring systems benefits the secondary short-term credits markets.
Funding
This research received no external funding.
Data Availability Statement
Please be advised that there are limitations on data availability stemming from exclusive data collection conducted by a private startup. Further inquiries can be directed to the corresponding author.
Conflicts of Interest
The authors declare no conflicts of interest.
Appendix A
Appendix A1. Risk Scoring (SURF) Methodology
The SURF Score methodology was developed to analyze risk in real-time, looking at several factors, including external, accounting, bank, and transactional data. The need for this type of scoring originated since most risk methodologies (and externally available sources and data) account only for historical data, whose information is often outdated by weeks, months. or even years. Utilizing real-time risk scoring allows for real-time pricing of risk into receivables and other assets, including asset-backed loans.
The SURF Score is calculated in four continuously updated steps:
- Scores are initially computed based on external business-credit data, including conventional business credit scores and publicly available financial data. This initial scoring is used at the point at which the Crowdz Platform (and hence the Funder) has no specific information about either the Seller of the invoices or of the Obligors on said invoices.
- (a) Accounting and banking data is analyzed to determine the Sellers’ and Obligors’ (i.e., Buyers’) reliability and timing of the payment of their debt obligations, both historically and in real-time.(b) Simultaneously, Seller financial data is fed into a real-time regression model to further pin down payment reliability and timing.
- In like manner as described with regard to Step 2(a) above, Crowdz Platform data is analyzed to determine the Sellers’ reliability and timing of the repayment of funding on their purchased invoices, both globally and on an Obligor-by-Obligor (i.e., Buyer-by-Buyer) basis, both historically and in real-time.
- The use of artificial intelligence (AI), such as through matching of like companies, has been explored but not yet implemented.

Table A1.
Variables and description.
| Variable | Description |
|---|---|
| SURF | Invoice SURF Score (Obligor SURF score * Seller SURF score/100) |
| RETURN IRR with SURF IRR without SURF |
Periodic return over the time-period funding to collection = profit/funded amount, in which profit is the difference between repaid amount and funded amount Annual Internal Rate of Return (annualized periodic return) with using CROWDZ SURF score Annual Internal Rate of Return (annualized periodic return) without using CROWDZ SURF score |
| DILUTION RATE | Ratio that captures proportion of the original amount financed = (Invoice Amount-Financed Amount)/Invoice Amount |
| ACTUAL TERM | Actual amount of time over which the financed invoice is paid to the Funder |
| SIZE | Natural log of the invoice amount |
Table A2.
Correlation Matrix.
| Variable | SURF | RETURN | IRR with SURF | IRR without SURF | DILUTION RATE | ACTUAL TERM | SIZE |
|---|---|---|---|---|---|---|---|
| SURF | 1 | ||||||
| RETURN | -0.666 | 1 | |||||
| IRR with SURF | -0.796 | 0.666 | 1 | ||||
| IRR without SURF | 0.141 | -0.039 | -0.130 | 1 | |||
| DILUTION RATE | 0.174 | -0.592 | -0.094 | 0.115 | 1 | ||
| ACTUAL TERM | -0.234 | 0.555 | 0.221 | -0.476 | -0.447 | 1 | |
| SIZE | -0.136 | 0.252 | 0.083 | -0.075 | -0.460 | 0.144 | 1 |
Source: Authors own creation.
Table A3.
Internal Rate of Return comparison between using and not using SURF score for the invoice risk assessment.
Table A3.
Internal Rate of Return comparison between using and not using SURF score for the invoice risk assessment.
| Statistic | IRR without SURF | IRR with SURF | Difference |
|---|---|---|---|
| Mean | 15.39% | 16.91% | 1.53% |
| Standard Error | 0.09% | 0.04% | 0.11% |
| Median | 13.77% | 15.34% | 2.54% |
| Mode | 11.80% | 15.29% | 4.96% |
| Standard Deviation | 12.80% | 5.75% | 14.69% |
| Sample Variance | 0.02 | 0.00 | 0.02 |
| Kurtosis | 27.06 | 71.13 | 18.88 |
| Skewness | -0.65 | 7.59 | 1.32 |
| Range | 199.89% | 84.90% | 204.91% |
| Minimum | -100.00% | 15.00% | -84.69% |
| Maximum | 99.89% | 99.90% | 120.23% |
| Count | 18304 | 18304 | 18304 |
| Confidence Level (95.0%) | 0.00185 | 0.00083 | 0.00213 |
Table A4.
Repayment outcomes when using risk scoring.
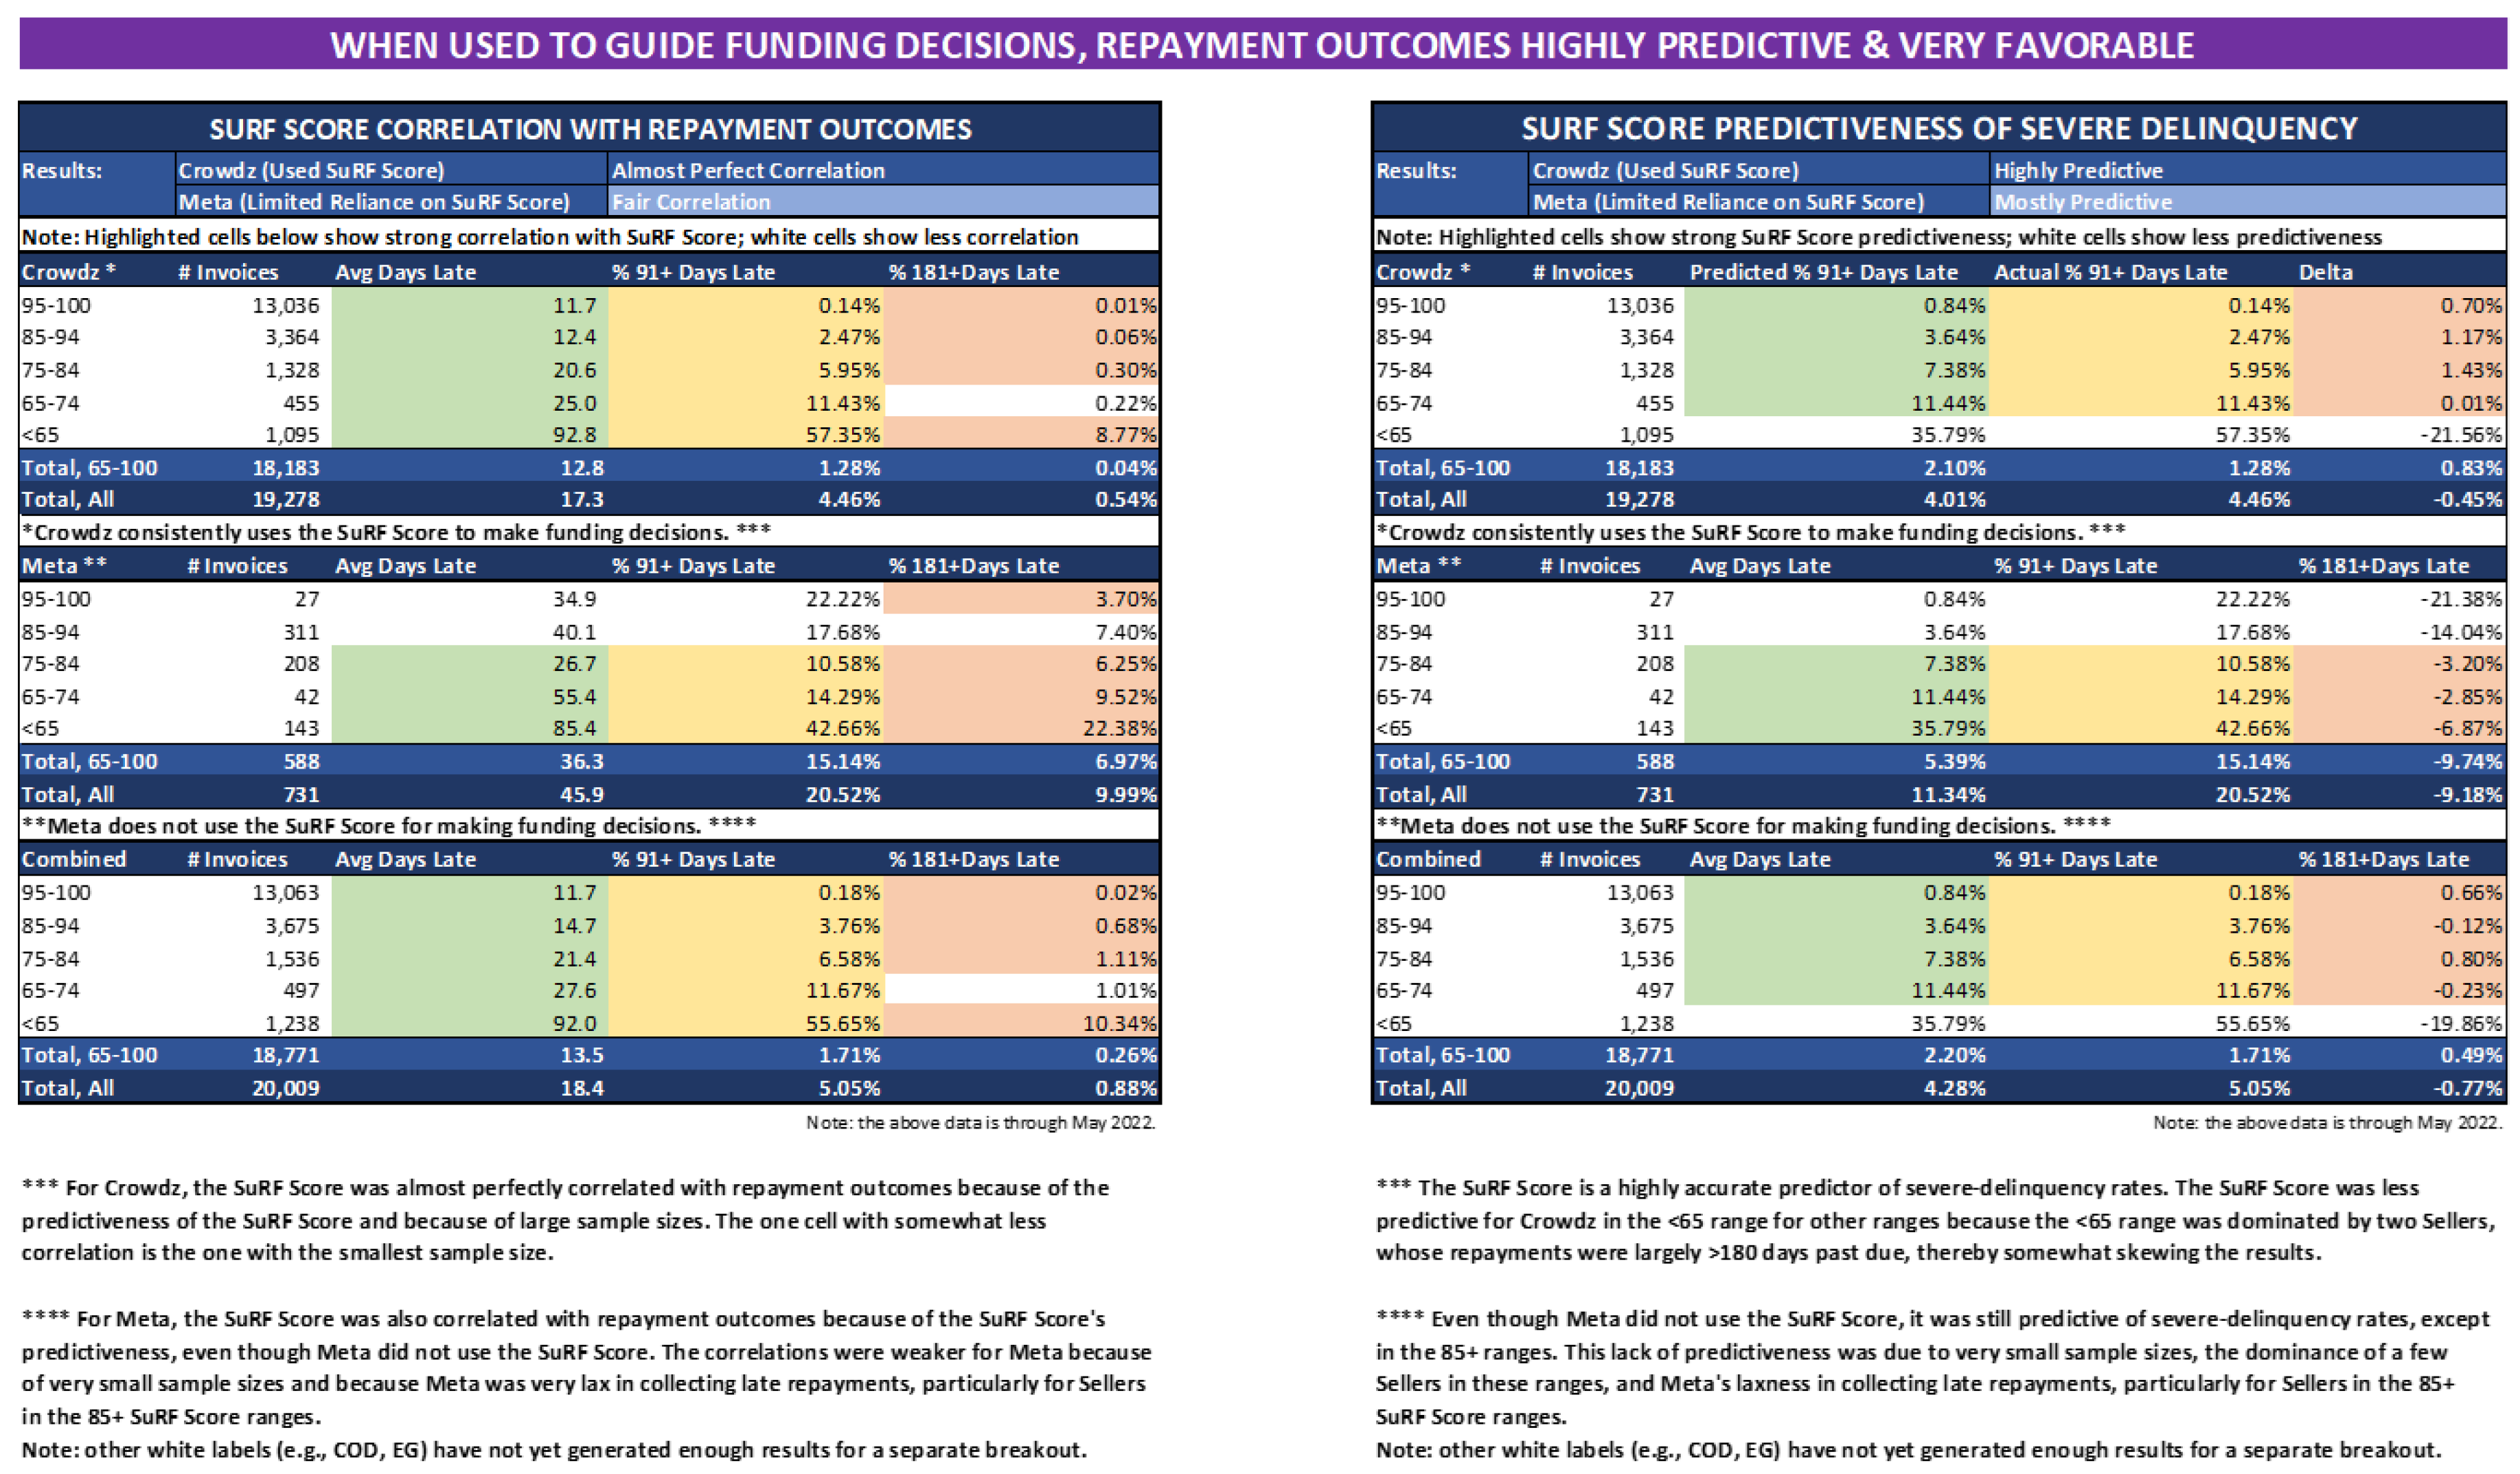 |
Table A5.
Repayment outcomes when not using the risk scoring.
 |
These tables present the repayment performance for invoice-funding transactions during the time period in which the SURF Score was consistently employed to determine funding decisions (note: during this time period, Meta did not generally employ the SURF Score specifically for making invoice-funding decisions but at least attempted to use underlying data to assess the creditworthiness of Sellers being funded).
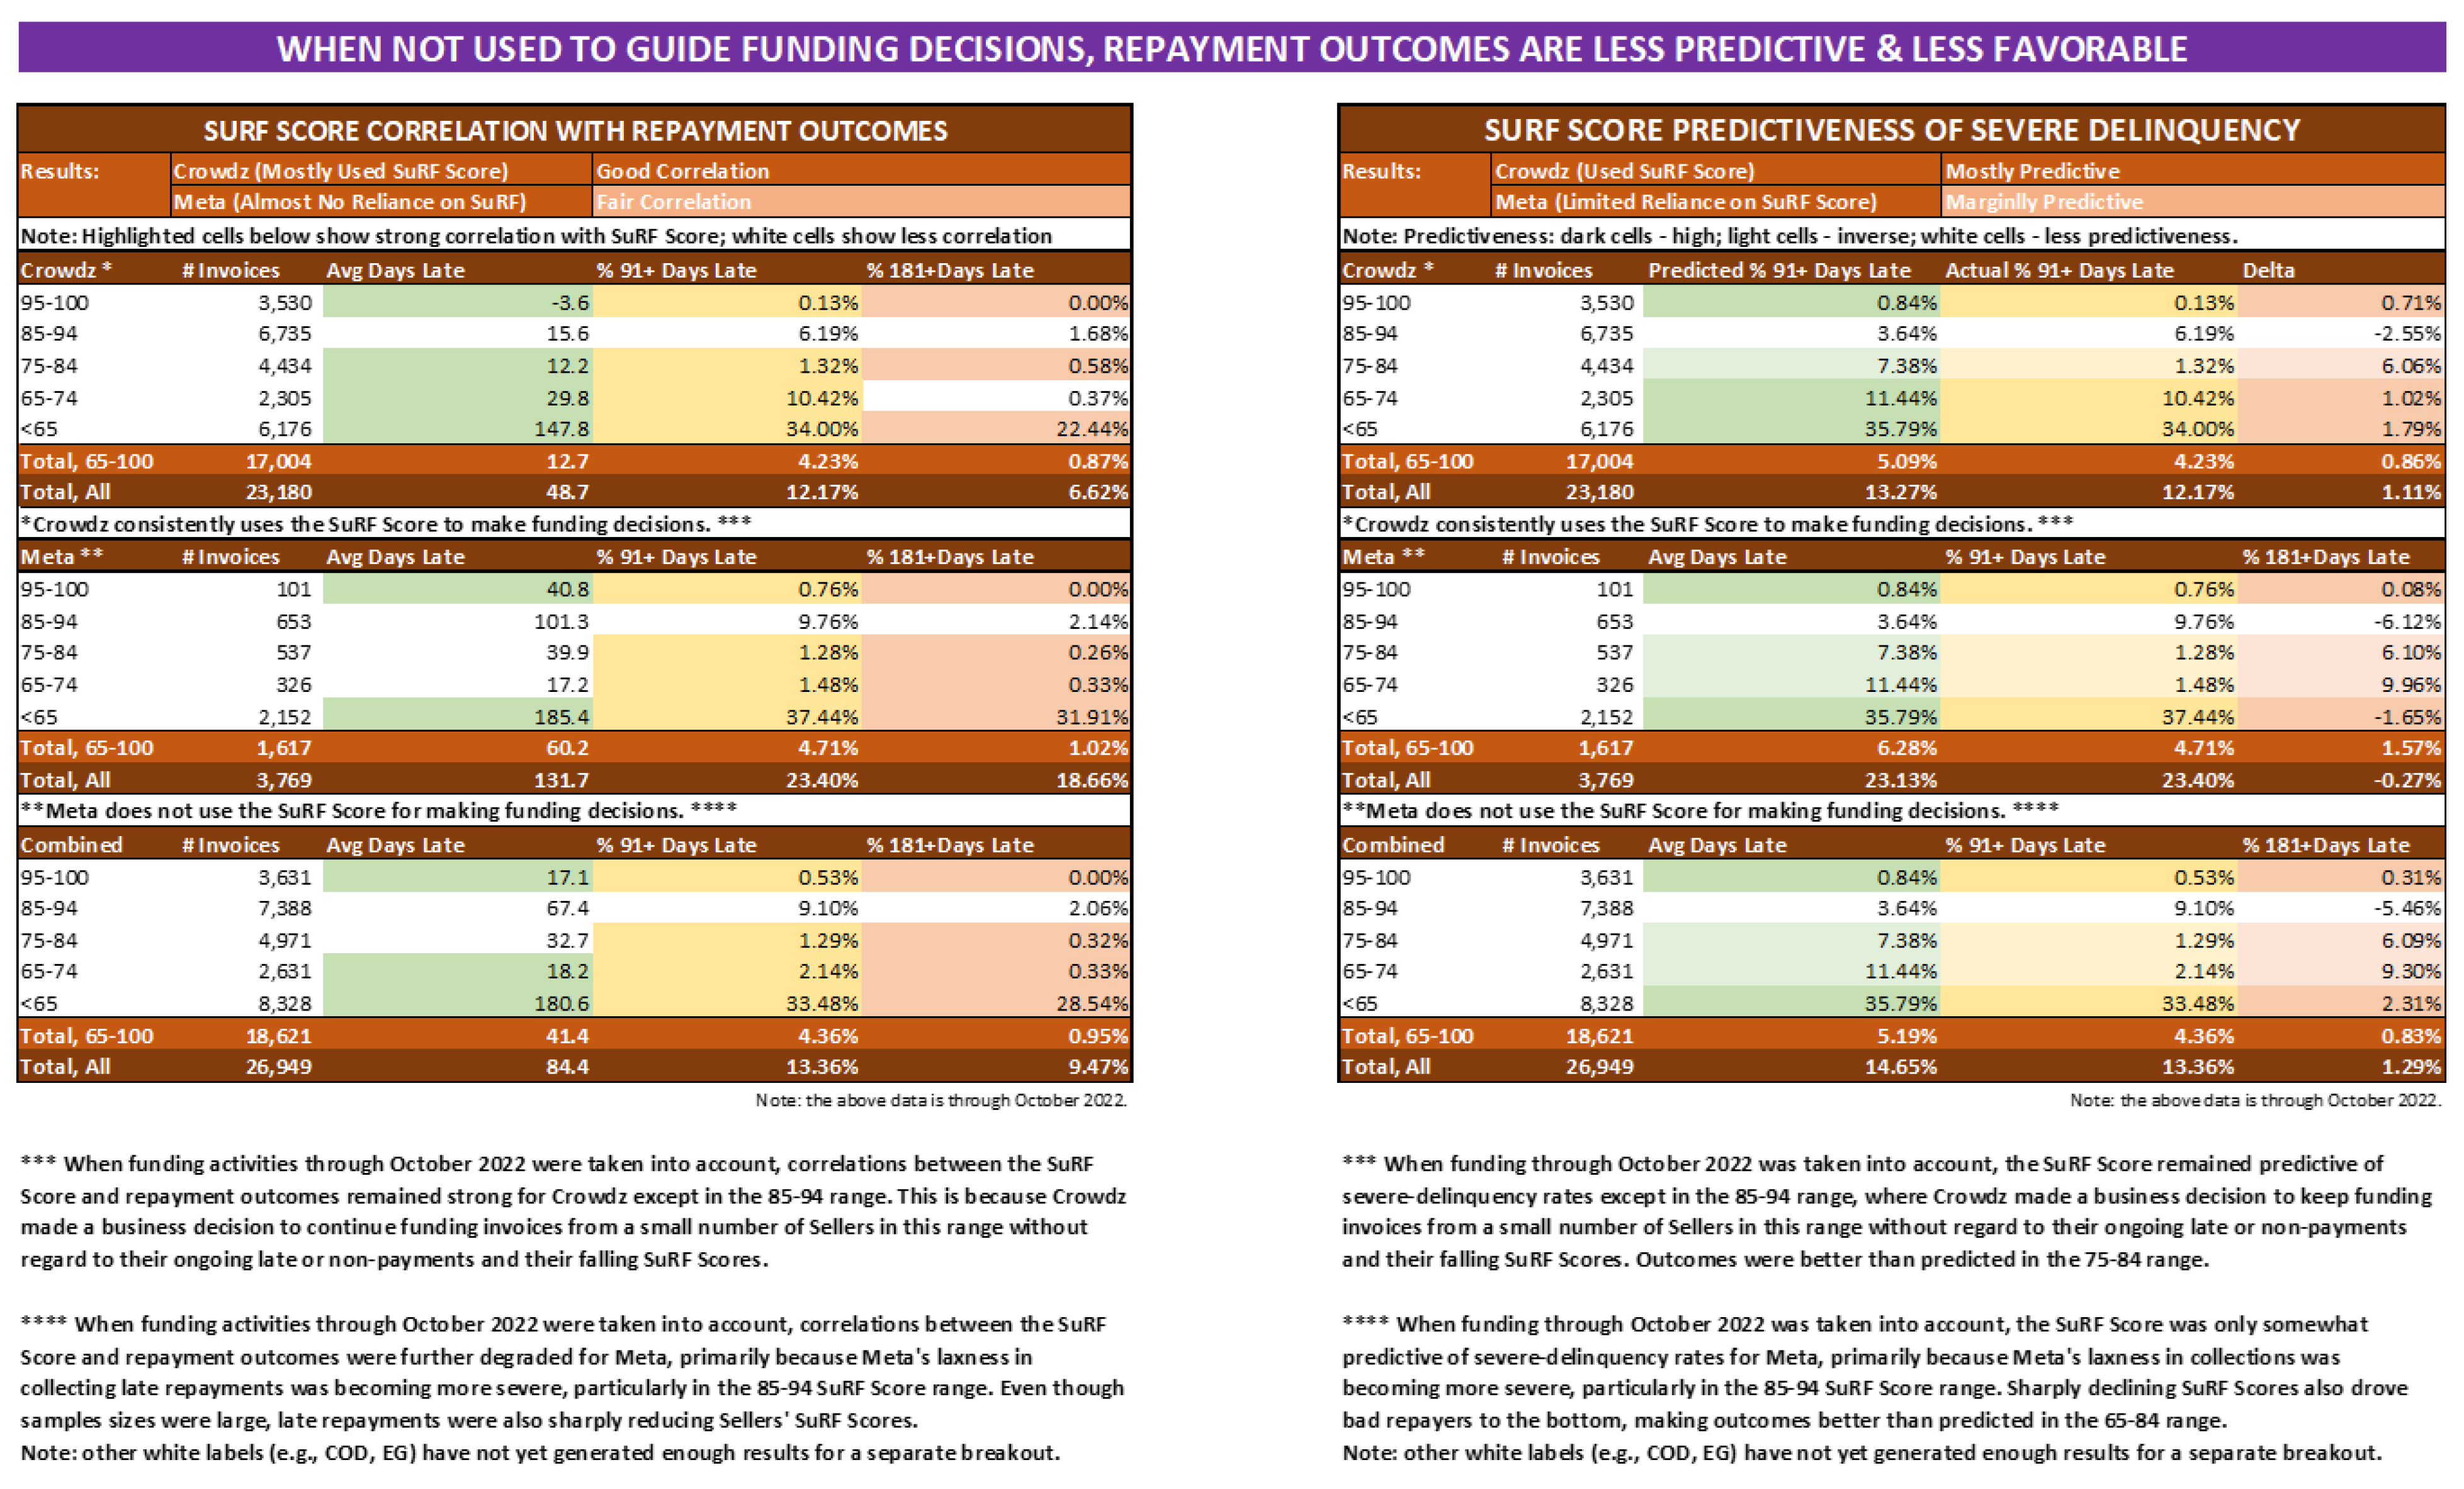
These tables present the repayment performance for invoice-funding transactions during the time period in which the SURF Score was not consistently employed to determine funding decisions (note: during this time period, Meta continued to not generally employ the SURF Score for making invoice-funding decisions but also paid less attention to the potential creditworthiness of Sellers being funded).
References
- Sangeetha, M., Hoti, A., Bansal, R., Hasan, M. F., Gajjar, K., & Srivastava, K. (2022). Facilitating artificial intelligence supply chain analytics through finance management during the pandemic crises. Materials Today: Proceedings, 56, 2092-2095. [CrossRef]
- Paul, S., Adhikari, A., & Bose, I. (2022). White knight in dark days? Supply chain finance firms, blockchain, and the COVID-19 pandemic. Information & Management, 59(6), 103661. [CrossRef]
- Sufi, A. (2007). Information asymmetry and financing arrangements: Evidence from syndicated loans. The Journal of Finance, 62(2), 629-668.
- Adrian T, Crump RK, Vogt E., 2019. Nonlinearity and Flight-to-Safety in the Risk-Return Trade-Off for Stocks and Bonds. The Journal of Finance 74 (4):1931–1973.
- Ben Bouheni F., Tewari M., 2023. Common Risk Factors and Risk-Return Trade-off for REITs and Treasuries. Journal of Asset Management, 2023, . [CrossRef]
- Singh, R. P., Singh, R., & Mishra, P. (2021). Does managing customer accounts receivable impact customer relationships, and sales performance? An empirical investigation. Journal of Retailing and Consumer Services, 60, 102460. [CrossRef]
- Hofmann, E., Templar, S., Rogers, D., Choi, T. Y., Leuschner, R., & Korde, R. Y. (2021). Supply chain financing and pandemic: Managing cash flows to keep firms and their value networks healthy. Rutgers Business Review, 6(1), 1-23. Available at SSRN: https://ssrn.com/abstract=3832036.
- Moretto, A., & Caniato, F. (2021). Can Supply Chain Finance help mitigate the financial disruption brought by Covid-19?. Journal of Purchasing and Supply Management, 27(4), 100713. [CrossRef]
- Ağca, Ş., Birge, J. R., Wang, Z. A., & Wu, J. (2023). The impact of COVID-19 on supply chain credit risk. Production and Operations Management, 32(12), 4088-4113. [CrossRef]
- Höhler, J., & Lansink, A. O. (2021). Measuring the impact of COVID-19 on stock prices and profits in the food supply chain. Agribusiness, 37(1), 171-186. [CrossRef]
- Chowdhury, P., Paul, S. K., Kaisar, S., & Moktadir, M. A. (2021). COVID-19 pandemic related supply chain studies: A systematic review. Transportation Research Part E: Logistics and Transportation Review, 148, 102271. [CrossRef]
- Abad, D., Sánchez-Ballesta, J. P., & Yagüe, J. (2017). The short-term debt choice under asymmetric information. SERIEs, 8, 261-285. [CrossRef]
- Barclay, M. J., & Smith Jr, C. W. (1995). The maturity structure of corporate debt. the Journal of Finance, 50(2), 609-631. [CrossRef]
- Stohs, M. H., & Mauer, D. C. (1996). The determinants of corporate debt maturity structure. Journal of business, 279-312. https://www.jstor.org/stable/2353370.
- Berger, A. N., Espinosa-Vega, M. A., Frame, W. S., & Miller, N. H. (2005 a). Debt maturity, risk, and asymmetric information. The Journal of Finance, 60(6), 2895-2923. [CrossRef]
- Diamond, D. W. (1991). Monitoring and reputation: The choice between bank loans and directly placed debt. Journal of political Economy, 99(4), 689-721. [CrossRef]
- Berger, A. N., Frame, W. S., & Miller, N. H. (2005 b). Credit scoring and the availability, price, and risk of small business credit. Journal of money, credit and banking, 191-222.
- Giudici, P. (2010). Scoring models for operational risks. Operational Risk Management: A Practical Approach to Intelligent Data Analysis, 125-135.
- Sabato, G. (2010). Assessing the Quality of Retail Customers: Credit Risk Scoring Models. IUP Journal of Financial Risk Management, 7.
- Berger, A. N., Cowan, A. M., & Frame, W. S. (2011). The surprising use of credit scoring in small business lending by community banks and the attendant effects on credit availability, risk, and profitability. Journal of Financial Services Research, 39, 1-17.
- Altman, E. I. (2018). A fifty-year retrospective on credit risk models, the Altman Z-score family of models and their applications to financial markets and managerial strategies. Journal of Credit Risk, 14(4).
- Szepannek, G., & Lübke, K. (2021). Facing the challenges of developing fair risk scoring models. Frontiers in artificial intelligence, 4, 681915.
- Zdaniuk, B. (2014). Ordinary Least-Squares (OLS) Model. In: Michalos, A.C. (eds) Encyclopedia of Quality of Life and Well-Being Research. Springer, Dordrecht. [CrossRef]
- Montgomery, D. C., Peck, E. A., and Vining, G. G. (2021). Introduction to linear regression analysis (6th ed.). New York: Wiley.
- Ben Bouheni, F., Sidaoui, M., Leshchinskii, D., Zaremba, B. and Albashrawi, M. (2024), "Banking-as-a-service? American and European G-SIBs performance", Journal of Risk Finance, Vol. 25 No. 5, pp. 840-869. [CrossRef]
- McNeish, D. (2016). On using Bayesian methods to address small sample problems. Structural Equation Modeling: A Multidisciplinary Journal 23, 2016 - Issue 5. [CrossRef]
- Hobbs, T., Hooten, MB. 2015. Bayesian Models: A statistical Primer for Ecologists. Princeton University Press. https://www.jstor.org/stable/j.ctt1dr36kz.
- Johnson, A., Ott, M., Dogucu, M. 2022. Bayes rules! An introduction to applied Bayesian modeling. Routledge. https://www.routledge.com/Bayes-Rules-An-Introduction-to-Applied-Bayesian-Modeling/Johnson-Ott-Dogucu/p/book/9780367255398.
- Ben Bouheni, F., Tewari, M. (2022). Over-Optimism, Credit Expansion and Banks’ Risk and Return. Banking and Finance Review 13(1).
- Quigley, D. and Walther, A. (2024), Inside and Outside Information. The Journal of Finance, 79: 2667-2714. [CrossRef]
- Charles, C., Frydman, C. and Kilic, M. (2024), Insensitive Investors. The Journal of Finance, 79: 2473-2503. [CrossRef]
- Ben Bouheni, F., Tewari, M., Sidaoui, M., and Hasnaoui, A. (2023). An Econometric Understanding of Fintech and Operating Performance, Review of Accounting and Finance 22(3), 329-352.
| 1 | See Appendix A1 for SURF methodology. |
| 2 | Proprietary data provided by Crowdz. |
| 3 | Table A1 in Appendix presents the description of variables. |
| 4 | SURF methodology is detailed in Appendix A1. |
| 5 | To replicate the linear estimates, use the following command: regress Y X. Where Y is the dependent variable and X includes one or more independent variables. |
| 6 | To replicate the Bayesian linear regressions, use the following command: bayes: regress Y X. Where Y is the dependent variable and X includes one or more independent variables. |
| 7 | A difference of mean t-test between the IRR with SURF and the IRR without SURF shows a positive difference of 1.53%, significant at 99% level (p-value of 0.002). |
| 8 | Crowdz provided predictability and favorability of payment outcomes analysis and the comparison of receivables transactions on META platform in Appendix Table A4 and Table A5 supplement our findings. When SURF score is used in the transactions, the payment outcomes are highly predictive and very favorable and when SURF score is not used in the transactions, the payment outcomes are less predictive and less favorable. |
| 9 | For risk-pricing and flight to safety theory, see for instance, [4,32]. |
Figure 1.
Invoice funding by date of invoice ingestion from April 2020 to September 2022. This figure plots the risk scores (i.e., SURF Scores) of Sellers of invoices (Seller Score), the risk scores of Obligors on the purchased invoices (Buyer Score), and the risk scores of the invoices themselves (Invoice Score). The risk scoring is based on the Crowdz SURF methodology of risk assessment, and it is scaled from 0 to 100. The higher the SURF Score, the lower the risk. Specifically, the SURF Score represents the probability of timely repayment of the funding to the Funder, and, hence, a 100 SURF Score indicates that there is a 100% probability that the funding will be repaid to the Funder within the Funder-specified timing. The x axis presents all monthly transactions on the Crowdz Platform and the y axis presents the corresponding risk -cores. Raw Data is based on 19,278 funding transactions on the Crowdz Platform from April 23, 2020, to September 30, 2022. Source: Authors own creation.
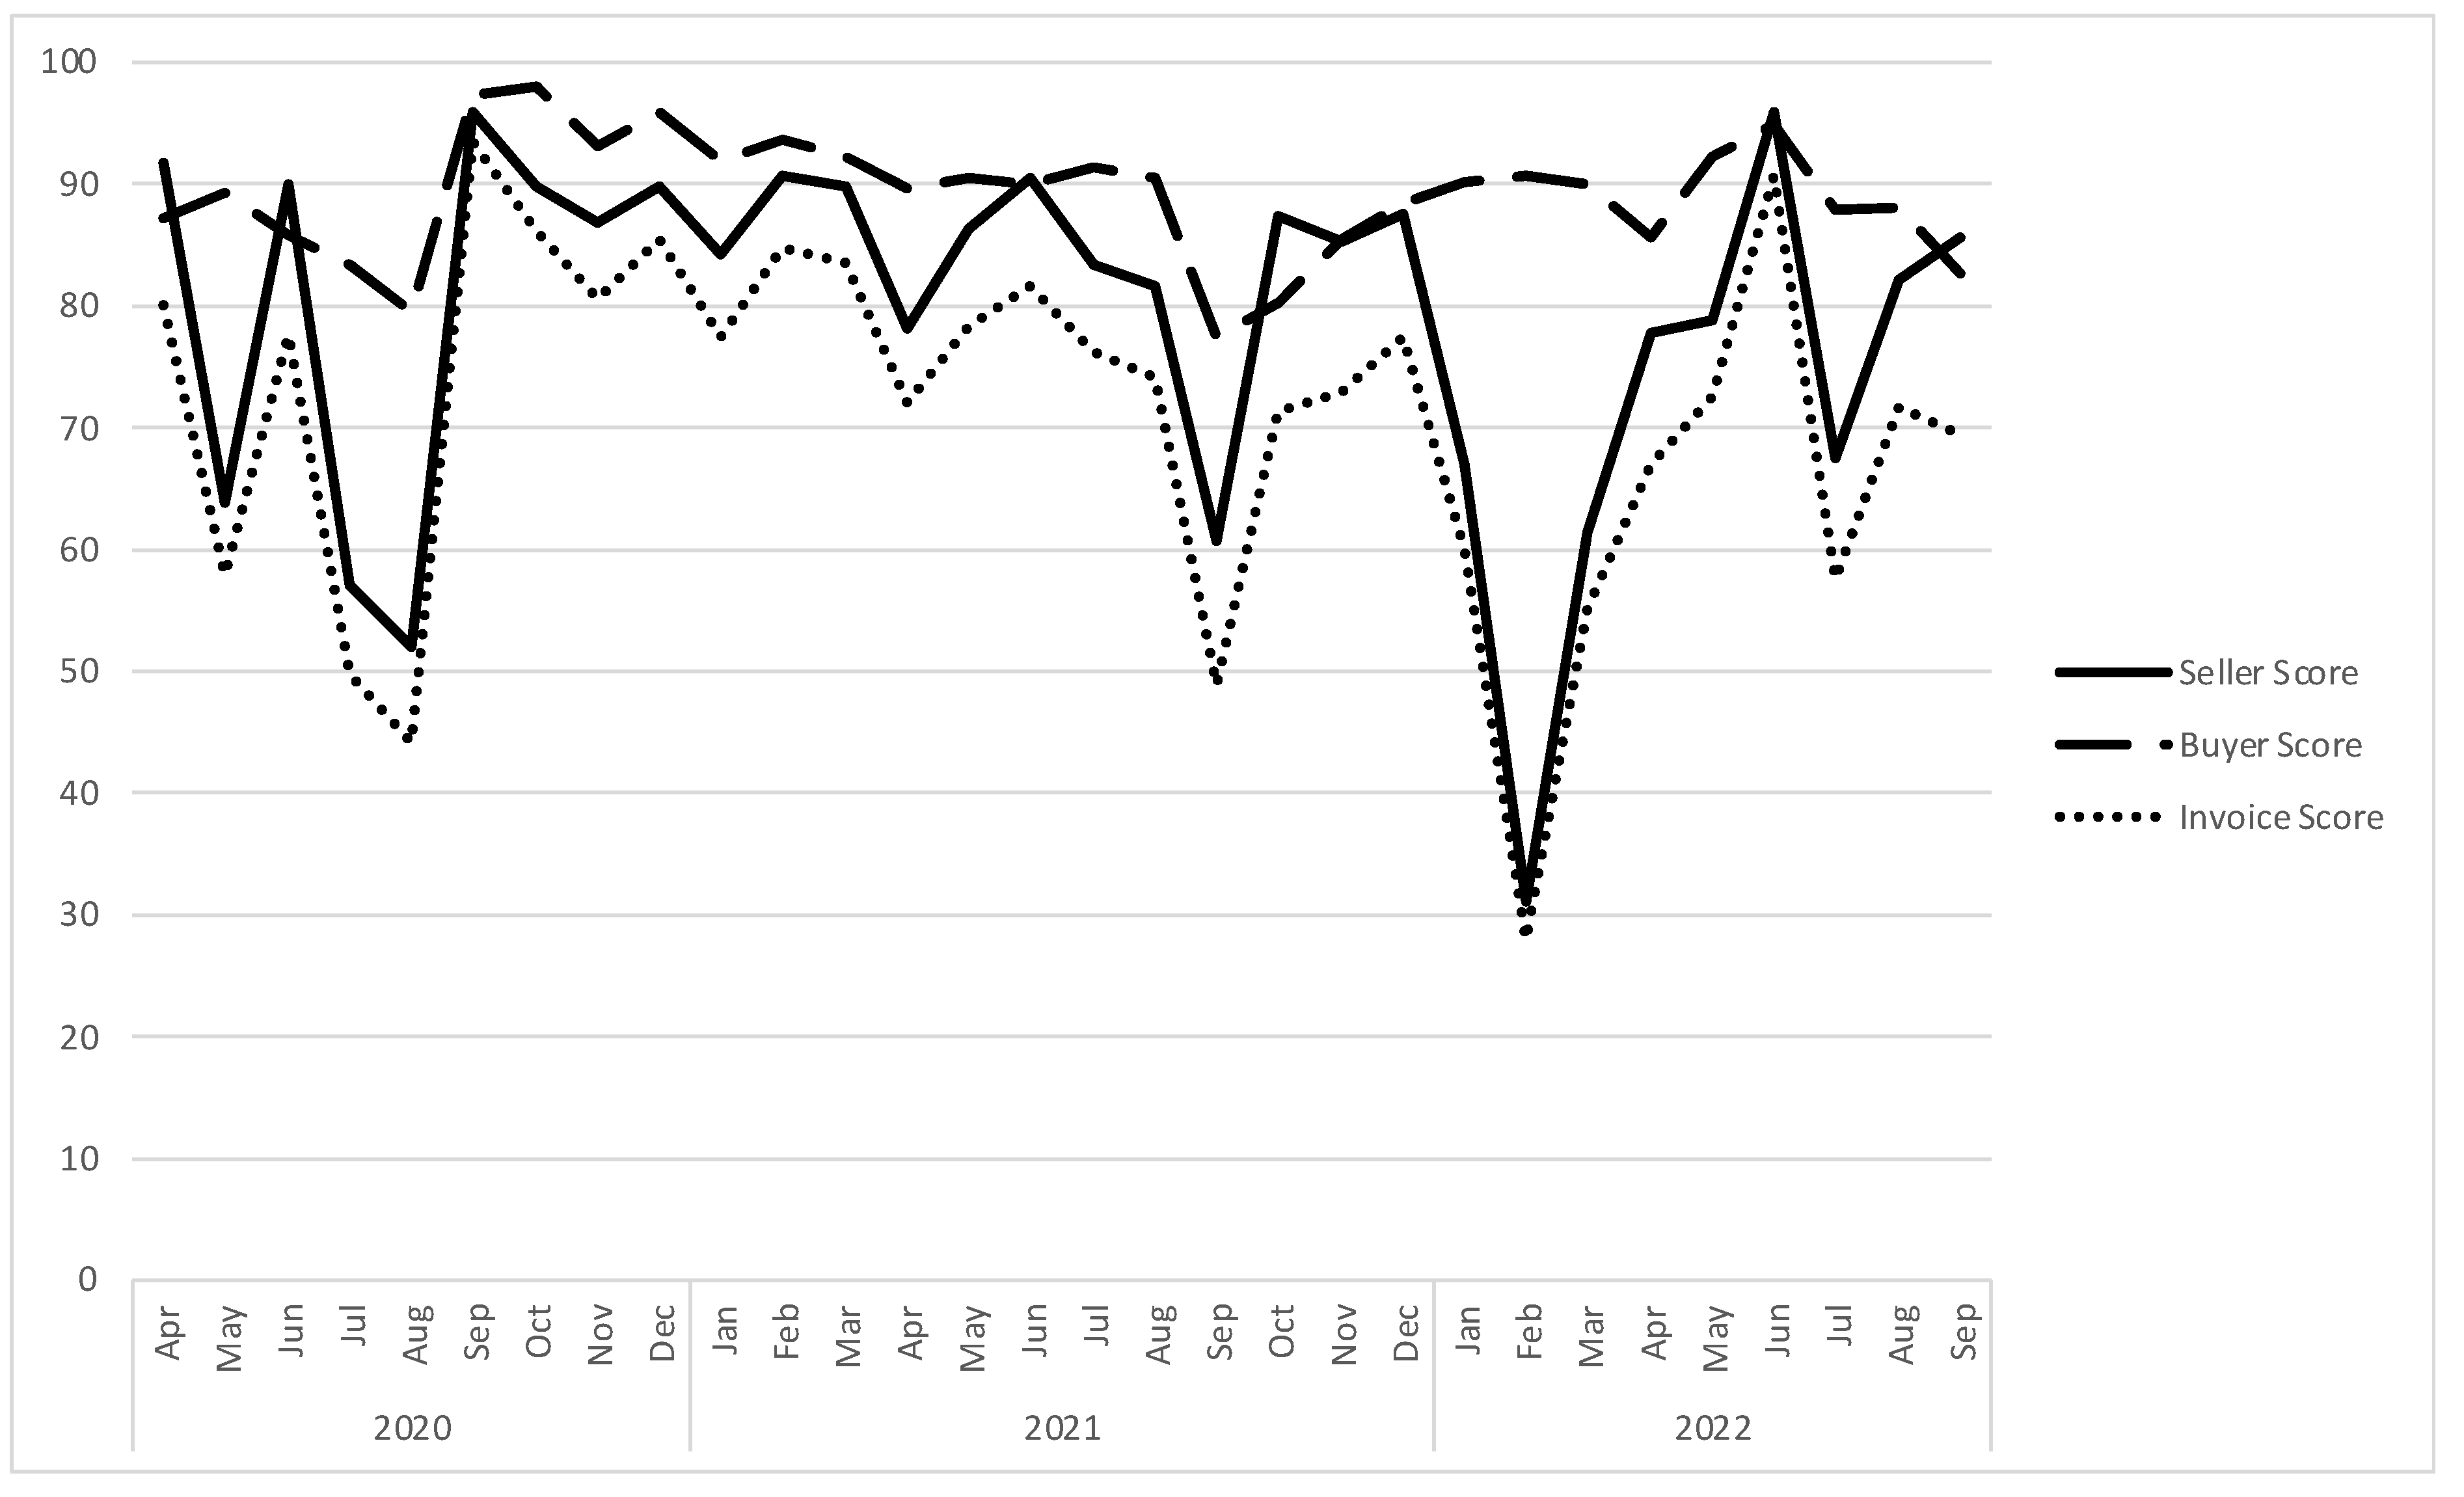
Table 1.
Descriptive Statistics. This table presents data statistics for 18,304 transactions conducted on Crowdz platform between April 23, 2020, and September 30, 2022. The dependent variables include RETURN, computed as the ratio of profit over funded amount, in which profit is the difference between repaid amount and funded amount; Internal Rate of Return (IRR) with SURF scoring; and Internal Rate of Return (IRR) without SURF scoring. Independent variables comprise invoice scoring (SURF) calculated as Obligor SURF score times Seller SURF score divided by 100; dilution rate (DILUTION RATE) computed as the difference between invoice amount and financed amount divided by invoice amount; actual amount of time over which the financed invoice is paid to the Funder (ACTUAL TERM); and invoice amount (SIZE) expressed in natural logarithm of dollars amount.
| Variable | Obs | Mean | Std. Dev. | Min | Max |
|---|---|---|---|---|---|
| SURF | 18,304 | 92.077 | 14.247 | 1.575 | 99.977 |
| RETURN | 18,304 | 0.019 | 0.021 | 0.005 | 0.312 |
| IRR with SURF | 18,304 | 0.169 | 0.058 | 0.150 | 0.999 |
| IRR without SURF | 18,304 | 0.154 | 0.128 | -1 | 0.999 |
| DILUTION RATE | 18,304 | 0.135 | 0.046 | 0 | 0.350 |
| ACTUAL TERM | 18,304 | 3.673 | 0.681 | 0 | 6.512 |
| SIZE | 18,304 | 5.396 | 1.435 | -0.282 | 13.144 |
Source: Authors own creation.
Table 2.
Linear OLS Estimation of the relationship between risk and return for the full sample. This table reports the coefficients, their t-statistics in parentheses, and the level of significance of the OLS regressions in Equation (1), in which the dependent variables are RETURN, computed as the ratio of profit over funded amount, in which profit is the difference between repaid amount and funded amount; Internal Rate of Return (IRR) with SURF scoring; and Internal Rate of Return (IRR) without SURF scoring. The independent variables include the invoice scoring (SURF) calculated as Obligor SURF score times Seller SURF score divided by 100; dilution rate (DILUTION RATE) computed as the difference between invoice amount and financed amount divided by invoice amount; actual amount of time over which the financed invoice is paid to the Funder (ACTUAL TERM); and invoice amount (SIZE) expressed in natural logarithm of dollars amount. The sample includes 18,304 transactions conducted on Crowdz platform, and the study period spans from April 23, 2020 to September 30, 2022.The “RETURN” column (1) reflects total return to investors when SURF scoring is used, the column (2) “IRR with SURF” is the internal rate of return to investors when SURF scoring is used, and the column (3) “IRR without SURF” is the internal rate of return to investors when SURF scoring is not used to assess the invoice risk. The regression constant (CONS), number of observations (N), F-statistics, and R-squared are also included. F-statistics reflect the overall significance of the joint test under the null hypothesis that all regression coefficients are equal to 0. R-squared reports the proportion of the variation in profitability explained by the loading factors (SURF, DILUTION RATE, ACTUAL TERM, and SIZE). *, **, and *** indicate significance at the 10%, 5%, and 1% levels, respectively.
| Full Sample | |||
|---|---|---|---|
|
Variable |
(1) RETURN |
(2) IRR with SURF |
(3) IRR without SURF |
| SURF | -0.001*** (-44.81) |
-0.004*** (-38.59) |
|
| DILUTION RATE | -0.039*** (-16.34) |
0.068*** (10.26) |
0.079** (3.15) |
| ACTUAL TERM | 0.004*** (31.63) |
0.005*** (14.90) |
-0.121*** (-86.93) |
| SIZE | -0.021*** (-49.27) |
0.004*** (6.89) |
-0.075*** (-41.41) |
| CONS | 0.132*** (39.13) |
0.469*** (77.58) |
0.923*** (82.89) |
| N | 18,288 | 18,288 | 18,288 |
| F-Statistics | 77.37 (0.000) |
54.08 (0.000) |
86.50 (0.000) |
| R-Squared | 0.864 | 0.830 | 0.345 |
Source: Authors own creation.
Table 3.
Bayesian Multivariate Estimation of the relationship between risk and return for the full sample. This table presents the Bayesian Multivariate Normal regressions of Equations (2), (3) and (4) at a confidence interval of 95%, in which dependent variables are RETURN, IRR with SURF, IRR without SURF, and independent variables include SURF, DILUTION RATE, ACTUAL TERM, and SIZE. Mean, Std. Dev., and Median represent mean, standard deviation and median of parameters, respectively. Monte Carlo Standard Error (MCSE) measures the accuracy of the estimation and verifies the estimation noise. Sigma2 and Acceptance Rate are the specificities of the Bayesian procedure. The sample includes 18,304 transactions, and the period of this study spans from April 23, 2020, to September 30, 2022.
| Full Sample | ||||||
|---|---|---|---|---|---|---|
| Mean | Std. Dev. | MCSE | Median | [95% Cred. Interval] | ||
|
(1) RETURN | ||||||
| SURF | -0.001 | 0.091 | 0.007 | -0.002 | -0.003 | -0.002 |
| DILUTION RATE | -0.040 | 0.028 | 0.051 | -0.041 | -0.043 | -0.036 |
| ACTUAL TERM | 0.004 | 0.001 | 0.006 | 0.004 | 0.003 | 0.004 |
| SIZE | -0.021 | 0.002 | 0.003 | -0.021 | -0.022 | -0.020 |
| Constant | 0.131 | 0.001 | 0.009 | 0.131 | 0.129 | 0.133 |
| Sigma2 | 0.133 | 0.060 | 0.007 | 0.008 | 0.080 | 0.083 |
| Acceptance Rate | 0.359 | |||||
|
(2) IRR with SURF | ||||||
| SURF | -0.004 | 0.018 | 0.017 | -0.037 | -0.003 | -0.004 |
| DILUTION RATE | 0.065 | 0.025 | 0.076 | 0.065 | 0.060 | 0.070 |
| ACTUAL TERM | 0.005 | 0.034 | 0.015 | 0.049 | 0.004 | 0.006 |
| SIZE | 0.004 | 0.056 | 0.054 | 0.042 | 0.003 | 0.005 |
| Constant | 0.469 | 0.027 | 0.014 | 0.469 | 0.464 | 0.475 |
| Sigma2 | 0.063 | 0.059 | 0.047 | 0.063 | 0.062 | 0.064 |
| Acceptance Rate | 0.324 | |||||
|
(3) IRR without SURF | ||||||
| DILUTION RATE | 0.077 | 0.025 | 0.014 | 0.076 | 0.031 | 0.127 |
| ACTUAL TERM | -0.121 | 0.001 | 0.057 | -0.121 | -0.123 | -0.118 |
| SIZE | -0.075 | 0.018 | 0.071 | -0.075 | -0.078 | -0.072 |
| Constant | 0.923 | 0.011 | 0.046 | 0.922 | 0.902 | 0.943 |
| Sigma2 | 0.011 | 0.012 | 0.056 | 0.013 | 0.011 | 0.012 |
| Acceptance Rate | 0.340 | |||||
| N | 18,288 | 18,288 | 18,288 | 18,288 | 18,288 | 18,288 |
Source: Authors own creation.
Table 4.
Linear OLS Estimation of the relationship between risk and return by industry. This table reports the coefficients, their t-statistics in parentheses, and the level of significance of the OLS regressions sorted by five industries (Accommodation and food services, Construction, Manufacturing, Professional scientific and technical services, and Real Estate, rentals and leasing). Dependent variables are RETURN in Panel A; Internal Rate of Return (IRR) with SURF score in Panel B; and Internal Rate of Return (IRR) without SURF score in Panel C. The independent variables include the invoice scoring (SURF) calculated as Obligor SURF score times Seller SURF score divided by 100; dilution rate (DILUTION RATE) computed as the difference between invoice amount and financed amount divided by invoice amount; actual amount of time over which the financed invoice is paid to the Funder (ACTUAL TERM); and invoice amount (SIZE) expressed in natural logarithm of dollars amount. For the relevance of estimates, we drop industries with less than 500 observations, thus industries are accommodation and food services with 1,089, construction with 1,231, manufacturing with 7,081, professional scientific and technical services with 575, and real estate, rentals and leasing with 8,027 observations. The study period spans from April 23, 2020, to September 30, 2022. Regressions’ constants (CONS), number of observations (N), F-statistics, and R-squared are also reported in this table. F-statistics reflect the overall significance of the joint test under the null hypothesis that all regression coefficients are equal to 0. R-squared reports the proportion of the variation in profitability measures explained by the explanatory variables. *, **, and *** indicate significance at the 10%, 5%, and 1% levels, respectively.
| Panel A. RETURN | |||||
|---|---|---|---|---|---|
| Accommodation & Food Services | Construction | Manufacturing | Professional Scientific & Technical Services | Real Estate, Rentals & Leasing | |
| SURF | -0.016*** (-5.41) |
-0.024*** (-8.45) |
-0.033*** (-27.55) |
-0.036*** (-13.11) |
-0.058*** (-87.69) |
| DILUTION RATE | 0.052*** (7.15) |
-0.007 (- 0.76) |
-0.091*** (-20.52) |
0.058*** (8.06) |
-0.005* (-1.85) |
| ACTUAL TERM | 0.005*** (9.91) |
0.005*** (8.89) |
0.004*** (18.86) |
0.002*** (4.50) |
0.001*** (12.09) |
| SIZE | -0.026*** (-30.67) |
-0.025*** (-26.61) |
-0.019*** (-48.48) |
-0.018*** (-20.81) |
-0.010*** (-52.39) |
| CONS | 0.124*** (29.68) |
0.136*** (27.61) |
0.131*** (73.92) |
0.117*** (30.50) |
0.112*** (41.15) |
| N | 1,089 | 1,231 | 7,081 | 575 | 8,027 |
| F-Statistics | 62.98 (0.000) |
93.49 (0.000) |
87.39 (0.000) |
77.35 (0.000) |
78.92 (0.000) |
| R-Squared | 0.885 | 0.834 | 0.848 | 0.876 | 0.874 |
| Panel B. IRR with SURF | |||||
| Accommodation & Food Services | Construction | Manufacturing | Professional Scientific & Technical Services | Real Estate, Rentals & Leasing | |
| SURF | -0.049*** (-44.74) |
-0.087*** (-48.81) |
-0.059*** (-24.13) |
-0.036*** (-25.71) |
-0.039*** (-12.83) |
| DILUTION RATE | 0.024 (1.00) |
0.111*** (4.49) |
0.061*** (5.74) |
0.196*** (5.23) |
0.049** (3.14) |
| ACTUAL TERM | 0.070*** (4.11) |
0.043** (2.68) |
0.042*** (8.20) |
0.041 (1.59) |
0.044*** (9.40) |
| SIZE | 0.089** (3.00) |
0.042 (0.02) |
0.015* (1.62) |
-0.027 (-0.59) |
0.010*** (10.27) |
| CONS | 0.518*** (36.15) |
0.500*** (35.75) |
0.470*** (110.74) |
0.475*** (24.08) |
0.462*** (111.40) |
| N | 1089 | 1231 | 7081 | 575 | 8027 |
| F-Statistics | 76.36 (0.000) |
84.76 (0.000) |
67.75 (0.000) |
31.65 (0.000) |
43.34 (0.000) |
| R-Squared | 0.793 | 0.822 | 0.829 | 0.754 | 0.820 |
| Panel C. IRR without SURF | |||||
| Accommodation & Food Services | Construction | Manufacturing | Professional Scientific & Technical Services | Real Estate, Rentals & Leasing | |
| DILUTION RATE | -0.177** (-3.03) |
0.166* (1.95) |
0.278*** (5.52) |
0.600*** (6.81) |
0.154** (3.05) |
| ACTUAL TERM | -0.120*** (-26.10) |
-0.110*** (-17.83) |
-0.105*** (-37.21) |
-0.117*** (-18.64) |
-0.142*** (-93.52) |
| SIZE | -0.059*** (-9.45) |
-0.086*** (-10.89) |
-0.080*** (-20.56) |
-0.044*** (-5.58) |
-0.053*** (-25.51) |
| CONS | 0.881*** (22.64) |
0.932*** (17.40) |
0.851*** (36.25) |
0.684*** (14.18) |
0.888*** (66.06) |
| N | 1089 | 1231 | 7081 | 575 | 8027 |
| F-Statistics | 76.59 (0.000) |
87.78 (0.000) |
93.45 (0.000) |
66.97 (0.000) |
98.76 (0.000) |
| R-Squared | 0.420 | 0.345 | 0.358 | 0.550 | 0.634 |
Source: Authors own creation.
Disclaimer/Publisher’s Note: The statements, opinions and data contained in all publications are solely those of the individual author(s) and contributor(s) and not of MDPI and/or the editor(s). MDPI and/or the editor(s) disclaim responsibility for any injury to people or property resulting from any ideas, methods, instructions or products referred to in the content. |
© 2025 by the authors. Licensee MDPI, Basel, Switzerland. This article is an open access article distributed under the terms and conditions of the Creative Commons Attribution (CC BY) license (http://creativecommons.org/licenses/by/4.0/).
Copyright: This open access article is published under a Creative Commons CC BY 4.0 license, which permit the free download, distribution, and reuse, provided that the author and preprint are cited in any reuse.


