
Submitted:
13 March 2025
Posted:
17 March 2025
You are already at the latest version
Abstract
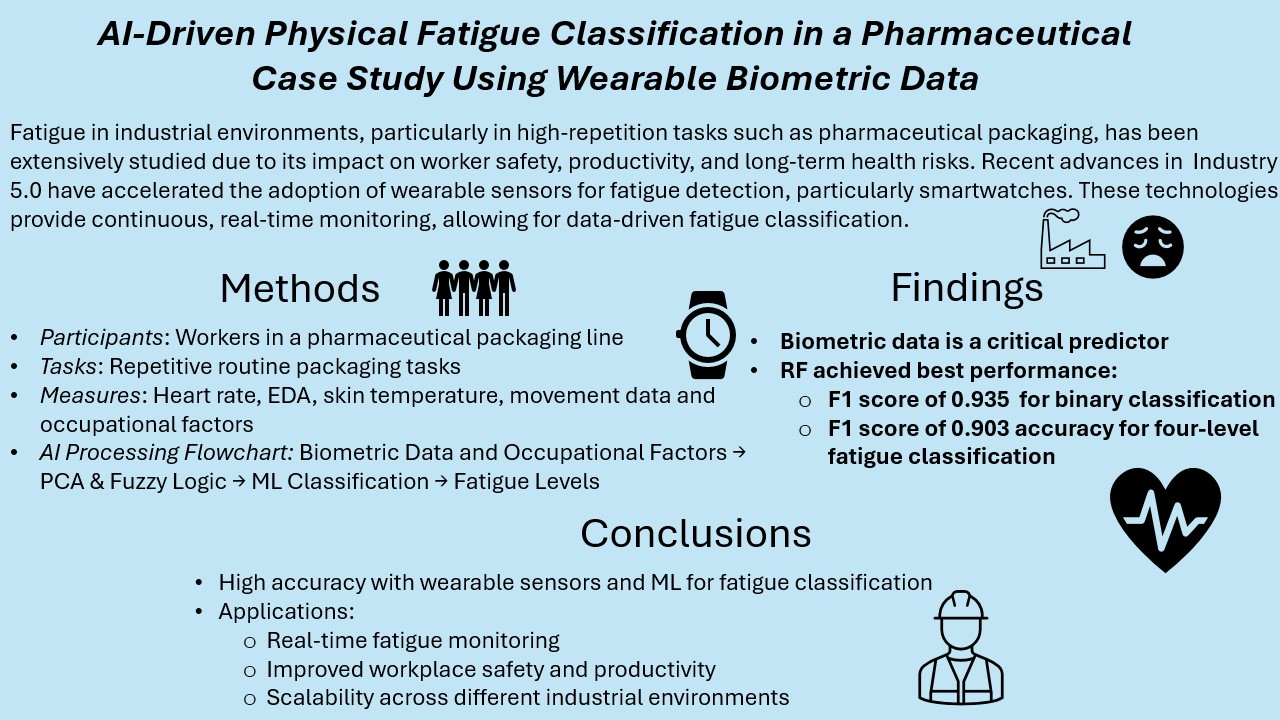
Physical fatigue is a significant concern in repetitive production line operations, often contributing to musculoskeletal disorders (MSDs) and high absenteeism rates. This study focuses on a pharmaceutical packaging line where workers frequently develop MSDs due to the repetitive nature of their tasks. To address this issue, biometric data from smartwatches, including pulse rate, internal temperature, electrodermal activity, and movement patterns, were collected alongside demographic factors such as age and experience and occupational factors related to task demands, including physical load, and operational conditions such as production line location, day of the week, work shift, and timing within the shift. Principal Component Analysis was first applied to reduce the dataset's dimensionality, extracting the most relevant features. Subsequently, fuzzy logic was employed to label the data into two and four levels of fatigue based on prior research. The resulting features and labels were then used as inputs for machine learning classification models to predict fatigue states. Our findings demonstrate that integrating wearable sensor data significantly enhances classification performance. In binary classification, the Random Forest model achieved an F1 score of 0.935 with biometric data and 0.681 without it. For the four-level classification, incorporating biometric data improved the F1 score from 0.573 to 0.903, highlighting its importance in fatigue prediction. This study contributes by developing a generalized predictive fatigue model and establishing a foundation for a real-time fatigue alert system to enhance worker safety and productivity.
Keywords:
Workplace fatigue
; musculoskeletal disorders (MSDs)
; physiological monitoring
; Machine learning classification
; fuzzy logic
; real-time alert system
; human performance
; Industry 5.0
1. Introduction
Industry 4.0 integrates advanced technologies such as the Internet of Things (IoT), artificial intelligence (AI), and robotics to enhance industrial automation and efficiency [1]. While these advancements have significantly improved production processes, human workers remain a crucial part of industrial systems [2]. However, traditional quality-focused approaches often overlook human factors such as worker fatigue and ergonomics [3]. Neglecting human factors has been linked to increased accidents, a higher risk of injuries, and potential quality issues in production [4]. To address these challenges, Industry 5.0 introduces a human-centered approach that blends human creativity with smart automation, emphasizing sustainability, worker well-being, and operational performance [5,6].
Physical fatigue is a widespread concern in industries involving repetitive tasks such as packaging, lifting, pushing, and assembly-line work [7]. Over time, fatigue contributes to exhaustion, increased human errors, and workplace accidents [8]. It also impairs cognitive and motor functions, elevating the risk of incidents such as slips, falls, and injuries [9]. Prolonged exposure to fatigue not only affects worker performance but also leads to long-term health issues, including chronic fatigue syndrome (CFS), musculoskeletal disorders (MSDs), and weakened immune function [10,11].
The global prevalence of MSDs underscores the critical need for effective workplace prevention strategies. According to the World Health Organization, approximately 1.71 billion people worldwide are affected by MSDs, making them the leading contributor to disability globally [12]. Among these disorders, carpal tunnel syndrome (CTS), linked to repetitive hand movements, has been identified as a major occupational health concern [13]. In Colombia, MSDs have been a significant concern in occupational health. According to a study analyzing data from 2009 to 2013, 88% of reported occupational diseases were MSDs [14]. Notably, women are disproportionately affected, with a prevalence ratio of eight-to-one compared to men [15]. The most impacted age group is 41 to 60 years, but an increasing number of cases have been reported among younger workers aged 16 to 25 in recent years [15]. Studies have also identified that workers in the packaging area of pharmaceutical production lines are the most affected by ergonomic risk factors, with 69.8% of operators in the hand/wrist conditioning area reporting pain-related symptoms [16]. These findings underscore the urgent need for improved fatigue monitoring and prevention strategies.
Despite its impact, fatigue assessment remains challenging due to its subjective nature, as it is influenced by individual health conditions, job demands, and personal circumstances [17]. Traditional subjective fatigue evaluation methods, such as self-reported questionnaires, are widely used but often suffer from bias and variability [18]. A more objective approach involves physiological measurements linked to the sympathetic nervous system (SNS), such as heart activity, blood parameters, and electrodermal responses, which provide quantifiable fatigue indicators [19]. Recent advances in wireless sensor technology have further enabled real-time, non-intrusive fatigue monitoring, offering a promising solution for industrial environments [20].
This study focuses on a pharmaceutical packaging area in a company in Colombia, where workers perform repetitive upper limb movements as part of their daily tasks. These movements involve short work cycles that require repeated muscle exertion, engaging muscle groups, bones, joints, tendons, ligaments, and nerves. Over time, this repetitive strain can lead to MSD-related complications. Expanding upon previous research [21,22], a simulation of industrial tasks in a fitness setup that primarily focused on subjective assessments, such as the Borg test [23], and objective measures, including biometric data, this study further incorporates demographic factors and occupational variables that contribute to physical fatigue [24] in a real-world domain. We analyzed demographic factors such as age and experience, task-related factors such as physical load measured by the number of drugs packed per box, and operational factors such as production line location, day of the week, work shift, and timing within the shift. Notably, temperature and other environmental conditions were not included in this study, as they remain relatively constant in this pharmaceutical production setting. By integrating biometric data with worker-related factors, this research aims to develop a comprehensive fatigue monitoring approach, ultimately enhancing worker safety, reducing MSD risks, and improving operational efficiency.
The remainder of this paper is structured as follows. Section 2 describes the data collection campaign and the data analysis process, including principal component analysis (PCA) and fuzzy logic techniques before the machine learning (ML) classification algorithms. Section 3 presents the results for binary and four-level physical fatigue classification, followed by Section 4, which discusses these findings. Finally, Section 5 provides the conclusion of this study and outlines potential directions for future work.
2. Materials and Methods
This section is divided into two main parts. The first part describes the data collection campaign, including the types of data collected and the conditions under which they were obtained. The second part outlines the methodology used to analyze the collected data, detailing the steps followed to develop a predictive model for physical fatigue.
2.1. Data Collection Campaign
The data collection campaign was conducted in a pharmaceutical company, where physiological, demographic and occupational data were gathered from operators working on the packaging line. Data collection took place during normal working conditions while operators performed their routine tasks of inspecting and packing pharmaceutical products into boxes.
Prior to participation, all 43 operators (42 females, aged 19 to 53 years, mean age 32.2 years) provided informed consent, confirming that they did not have any injuries or medical conditions that would prevent them from carrying out their usual work. Participants were informed that they could withdraw from the study at any time without any consequences for their employment. No financial compensation was provided. The study was approved by the Ethics Committee of the Universidad de América (Colombia) and adhered to the ethical principles of the Declaration of Helsinki (Protocol No. 002-2024).
Each participant wore an Empatica EmbracePlus smartwatch for 20 minutes at the beginning and end of their shift to capture biometric data relevant to physical fatigue analysis [21,22]. The smartwatch recorded pulse rate (bpm) to measure heart rate in beats per minute, skin temperature (°C) to monitor peripheral temperature changes, and electrodermal activity (EDA, μS) to assess autonomic nervous system activity and physiological arousal [21,22]. Additionally, movement-related data included accelerometer readings (standard deviation of G-forces), representing movement intensity and variability, step count, and activity count, which quantified overall motion throughout the recording period. At the beginning of each trial, participants rated their perceived physical fatigue using the Borg Rating of Perceived Exertion (RPE) scale (6–20) [23].
In addition to biometric data, demographic and occupational factors were incorporated into the dataset to enhance the predictive model for physical fatigue [25]. The demographic factors included age and work experience in the packaging area. The occupational factors encompassed physical load, referring to the number of pharmaceutical products packed per box (1, 10, 100, or long trays), and operational conditions, which considered the moment or timing of data collection (specifically distinguishing between measurements taken at the beginning or at end of the work shift), the day of the week (Monday to Friday), the work shift (three 8-hour shifts: 06:30–14:30, 14:30–22:30, and 22:30–06:30), and the production line location, where data were collected from four different scenarios: Plant 4, Line 2; Plant 4, Line 3; Plant 4, Line 4; and Plant 8, all of which involved the same packaging activity.
Once the dataset was collected, an initial baseline period at the start of each recording session was removed to eliminate artifacts related to device setup. The cleaned dataset was then prepared for further analysis, following the methodology outlined in the next section.
2.2. Data Analysis Techniques
This subsection describes the data analysis methods used to preprocess and analyze the collected dataset. The analysis framework consisted of three key steps: reducing dimensionality with PCA, labeling the data using fuzzy logic based on a previous study [26], and applying ML classification algorithms to develop a predictive model for physical fatigue.
2.2.1. Principal Component Analysis for Feature Extraction
PCA was first applied to reduce the dataset’s dimensionality while retaining the most significant features. PCA was conducted separately for biometric data and demographic and occupational factors, allowing for a structured and interpretable feature selection process.
After extracting the Principal Components (PCs) from both internal (biometric data) and external (demographic and occupational factors) datasets, a Promax rotation with Kaiser Normalization was applied [26,27]. This approach was adopted to improve physical interpretability by ensuring that the extracted components correspond to meaningful physiological and work-related variables while simplifying the data structure, reducing redundancy, and enhancing the clarity of factor loadings [26,27].
The transformed components were then used in the subsequent fuzzy logic classification step to assign fatigue levels before training the ML classification models.
2.2.2. Fuzzy Logic-Based Data Labeling for Physical Fatigue Classification
Fuzzy logic [28] was used to assign a degree of membership to each sample in the dataset for either the fatigue or non-fatigue groups, rather than making a strict binary classification. This approach provides a more flexible and realistic representation of physical fatigue levels. Based on previous work [26], the probability density functions (PDFs) and cumulative distribution functions (CDFs) for fatigue and non-fatigue states were derived from an earlier dataset [29], in which participants engaged in repetitive and monotonous tasks within a controlled fitness environment designed to simulate industrial work conditions [21,22]. These probability functions were used to compute fuzzy probability coefficients in the current dataset.
To ensure consistency, the same normalization method used in the previous study was applied before implementing the fuzzy logic classifier. Specifically, Z-score normalization was used:
where x represents the raw data value, µ is the mean, and σ the standard deviation of the original dataset. The same µ and σ values from the previous dataset were applied to the new dataset to ensure scale consistency and allow the fuzzy classifier to correctly map the new data onto the pre-established fatigue and non-fatigue distributions.
Once the data was normalized, we compute the fuzzy membership values for each sample xi using the pre-fitted PDF and CDF functions for the fatigue and non-fatigue states:
These membership values indicate how strongly each data point is associated with either the fatigue or non-fatigue group. For the final labeling, two classification approaches were implemented: binary classification and multiclass classification with four levels. In the binary approach, samples were assigned to fatigue or non-fatigue groups based on the crossover point of the membership functions. In contrast, the four-level classification introduced intermediate fatigue states, categorizing samples into pure non-fatigue, higher non-fatigue, higher fatigue, and pure fatigue states, based on their degree of belonging to each group.
2.2.3. Machine Learning Classification Algorithms for Physical Fatigue Prediction
After applying the preliminary analysis, we obtained a reduced dataset consisting of principal components derived from biometric data (internal factors) and demographic and occupational factors (external factors), along with the fatigue labels generated through fuzzy logic analysis. We then applied different ML classification algorithms for both binary and four-level fatigue classification to compare their performance.
The analysis evaluated the F1 scores for each classifier and feature set (binary and four-class classification) following a 5-fold cross-validation process. The F1 score is a metric that balances precision and recall, making it particularly useful for handling imbalanced datasets. A higher F1 score indicates a better trade-off between correctly identifying fatigue cases while minimizing false positives and false negatives. Two feature configurations were tested: one using only external factors and another combining both external and internal factors. Based on insights from the literature review on physical fatigue prediction using wearable devices in industrial settings, the selected classification algorithms included Random Forest (RF), Logistic Regression, Support Vector Machine (SVM), and K-Nearest Neighbors (KNN), all of which demonstrated competitive performance in fatigue detection [30,31,32,33,34,35].
3. Results
This section presents the main findings, following the same sequence of the data analysis techniques described earlier. First, we outline the results of PCA, highlighting the extracted components from biometric, demographic, and occupational factors. Next, we present the fuzzy logic classification results, detailing the assigned fatigue levels based on the membership functions. Finally, we evaluate the performance of ML classification algorithms, comparing their effectiveness in predicting binary (two-level) and multiclass (four-level) physical fatigue states. The evaluation is conducted in two stages: first, using only external data (demographic and occupational factors), and then with a combined approach that integrates both external data and internal biometric signals to assess their impact on classification accuracy.
3.1. PCA Results
After extracting the PCs from both internal (biometric data) and external (demographic and occupational factors) datasets, the Promax rotation with Kaiser Normalization was applied to enhance interpretability.
-
For biometric data (internal factors) Table 1:
- ○
- IPC1 (internal principal component 1) is associated with physiological responses, including EDA (0.703), pulse rate (0.711), and skin temperature (0.505).
- ○
- IPC2 (internal principal component 2) captures motion-related factors, such as accelerometer (0.867), step count (0.918), and activity count (0.863).
This analysis resulted in distinct components that grouped variables based on their underlying relationships, aligning with previously published findings [26,27].
-
For external factors (demographic and occupational data) Table 2:
- ○
- EPC1 (external principal component 1) consists of work-related process factors, including shift (0.734), production line (0.929), and number of products (0.811), which influence workplace fatigue levels.
- ○
- EPC2 (external principal component 2) represents personal attributes, specifically age (0.955) and experience (0.845).
- ○
- EPC3 (external principal component 3) and EPC4 (external principal component 4) consist of single variables (day and moment of measurement, respectively) and were retained without considering their factor loadings.
The original 13-dimensional feature set was effectively reduced to a 6-dimensional feature set, providing a more interpretable and manageable input for the ML algorithms. This dimensionality reduction facilitates a more efficient classification process while preserving the most relevant information for fatigue prediction [36]. Before proceeding with the ML algorithms, the next section applies fuzzy logic to assign fatigue labels, following the methodology established in previous work [26]. In that study, the physiological principal component (corresponding to IPC1 in our current analysis) was selected as the input for the fuzzy logic classifier, as it exhibited a clear classifying performance in distinguishing fatigue levels, as observed in the density plot analysis [26].
3.2. Fuzzy Logic-Based Label Classifier Results
Following the methodology established in previous research [26], the physiological principal component (IPC1) was used as the input for the fuzzy logic classifier. The same normalization method from the previous study was applied to ensure consistency in data scaling (equation (1)). The fuzzy logic approach computed membership degrees for each sample (equation (2)), determining its probability of belonging to either the fatigue or non-fatigue category. Based on these probabilities, labels were assigned using binary classification (fatigue vs. non-fatigue) and four-level classification, where fatigue was categorized into progressive intensity levels.
The first membership function plot (Figure 1(a)) illustrates the probability distribution for fatigue classification based on IPC1. A threshold was set at the intersection of the non-fatigue and fatigue states, enabling binary classification. The corresponding histogram (Figure 1(b)) shows the distribution of samples, indicating a higher frequency of non-fatigue cases compared to fatigue cases.
To enhance classification granularity, the second membership function plot (Figure 2(a)) introduces a four-level fatigue classification based on progressive membership values: Pure Non-Fatigue, Higher Non-Fatigue, Higher Fatigue, and Pure Fatigue. The histogram of the four-class labels (Figure 2(b)) shows an imbalanced distribution of fatigue states, with a higher frequency of Higher Non-Fatigue cases compared to the other categories. This indicates that while the classification differentiates between subtle fatigue levels, the distribution of samples across the four categories is not uniform.
These labeled fatigue states serve as training targets for the next stage, where ML classification models will be implemented to predict physical fatigue.
3.3. Machine Learning Classification Algorithms Results
In this section, we present the results of ML classification algorithms applied to predict binary (fatigue vs. non-fatigue) and four-level physical fatigue states. The analysis was conducted using two feature configurations: one considering only external data, which consists of the principal components EPC1, EPC2, EPC3, and EPC4, and another integrating both external and internal data, incorporating IPC1 and IPC2 along with the external components. The results are structured into two subsections, each evaluating the impact of these feature sets on classification performance. To assess model effectiveness, the F1 score is reported, as it is particularly well-suited for this study given the imbalanced nature of the dataset.
3.3.1. External Features
The results for binary classification using only external features are presented in Table 3. The highest F1 score was achieved by RF with 0.681, followed KNN with 0.668, while SVM obtained 0.435, and Logistic Regression failed to provide a meaningful prediction with an F1 score of 0.0.
For four-level classification, the results in Table 4 show that RF again outperformed the other models with an F1 score of 0.573, followed by KNN with 0.538, SVM with 0.442, and Logistic Regression with the lowest score of 0.261.
In both binary and multi-class classification, RF consistently outperformed the other models, but its performance was still insufficient for reliable fatigue prediction. These results highlight the limitations of using only external features, reinforcing the necessity of incorporating internal principal components (IPC1 and IPC2) derived from biometric data to improve classification accuracy.
3.3.2. External + Internal Features
The inclusion of internal features derived from biometric data (IPC1 and IPC2) significantly improved classification performance across all models.
For binary classification, the results presented in Table 5 show that RF achieved the highest F1 score of 0.935, followed by SVM with 0.910, KNN with 0.900, and Logistic Regression with 0.883.
For four-level classification, Table 6 presents the results, where RF again outperformed the other models with an F1 score of 0.903, followed by SVM (0.853), Logistic Regression (0.849), and KNN (0.842).
Additionally, analyzing the confusion matrix in multi-level classification allows for a deeper understanding of classification accuracy and potential misclassifications. In this case, RF, the best-performing algorithm, achieved the following results (Figure 3): pure non-fatigue was correctly classified 94% of the time, with 5.7% misclassified as higher non-fatigue. Higher non-fatigue showed 88% correct classification, with 7.1% misclassified as higher fatigue and 5.2 % as pure non-fatigue. Higher fatigue was correctly identified in 89% of cases, with 9.4% misclassified as higher non-fatigue and 1.6% pure fatigue. Pure fatigue achieved 92% accuracy, with only 7.8% misclassified as higher fatigue. The overall classification accuracy for the four-level classification was 90.8%. In the binary classification, the confusion matrix results yielded 95.2% accuracy.
4. Discussion
The results of this study demonstrate the effectiveness of integrating wearable biometric data for physical fatigue classification. The Random Forest model, which exhibited the best performance, achieved an F1 score of 0.935 for binary classification when biometric data was included, compared to 0.681 without it. Similarly, in four-level classification, incorporating biometric data improved the F1 score from 0.573 to 0.903, underscoring the substantial impact of physiological signals on distinguishing fatigue levels. The confusion matrix analysis revealed that the four-level classification framework effectively differentiated between various fatigue intensities while minimizing misclassification errors. Notably, misclassified instances within the pure fatigue category remained within the adjacent fatigue state, meaning that even when errors occurred, the model still correctly identified the presence of fatigue rather than misclassifying it as a non-fatigue state. This distinction is particularly useful for fatigue alert systems in industrial environments, where the primary goal is to early detect fatigue and prevent hazardous situations. In industrial settings, unaddressed fatigue can lead to human errors, workplace accidents, and the development of work-related musculoskeletal disorders, making precise classification essential for worker safety and productivity.
Compared to prior research [30,31,32,33,34,35] on physical fatigue classification, which we reviewed to select the machine learning algorithms, our model achieved a 0.935 F1-score and 95.2% accuracy in binary classification. This performance surpasses most of the reviewed studies. Only [31,32] reported higher classification accuracy, with 95.7% using Random Forest (RF) and 96.5% using Support Vector Machine (SVM), respectively. However, our study offers a key advantage, it also applied a four-level fatigue classification and achieved high performance, with an F1-score of 0.903, making it more applicable for early detection and intervention of fatigue in industrial environments. Unlike binary classification, the four-level approach provides a more detailed assessment of fatigue progression, allowing for proactive measures to be taken before fatigue reaches a critical state.
The transferability of data from prior research in physical fatigue detection was successfully demonstrated. The fuzzy logic-based labeling method, originally developed in a controlled fitness setup [21,22], was effectively applied to new data from a real-world pharmaceutical production environment. This demonstrates that physiological data collected in a controlled setting can still yield meaningful classifications in industrial domains, reinforcing the adaptability of our approach. This finding paves the way for broader applications across various industrial sectors, where integrating new datasets and expanding fatigue classification models could enhance the development of generalized, adaptive, and transferable fatigue prediction systems.
Furthermore, our results highlight the significance of physiological data as a key differentiator in accurately identifying fatigue states. Future research should extend these efforts to mental fatigue models, incorporating physiological, occupational, and cognitive workload factors to create safer, more efficient workplaces and improve worker well-being and productivity.
5. Conclusions
We have successfully developed a physical fatigue classification model using data collected directly from an industrial environment, while also demonstrating the transferability of a previously developed fuzzy logic-based labeling method from a simulated controlled study. The methodology integrated Principal Component Analysis to reduce dimensionality and enhance dataset manageability, followed by the fuzzy logic classification model to generate fatigue labels before input into machine learning classification algorithms. Our findings show that Random Forest achieved the highest classification performance, particularly in four-level classification, which provides greater applicability for early fatigue detection compared to traditional binary models. Initially, the model was developed using only demographic and occupational factors, offering a generalized approach where only data related to the worker and work conditions were needed. However, performance remained suboptimal. Incorporating biometric data from wearable sensors significantly improved classification accuracy, enabling the development of a customized fatigue alert system. This system is particularly valuable in critical operational scenarios, including maintenance tasks, quality control inspections, process monitoring, and other repetitive, monotonous tasks, where workers operate independently on the shop floor. A key advantage of our AI-driven fatigue monitoring system is that it requires only a smartwatch, ensuring a non-intrusive and real-time fatigue assessment that does not disrupt workers’ tasks. Future work will focus on applying this model to additional industrial domains to enhance its generalizability, as well as adapting it for mental fatigue assessment, integrating cognitive workload factors alongside physiological and occupational data. These advancements will contribute to the development of intelligent fatigue management systems, ensuring safer and more efficient industrial workplaces.
Author Contributions
Conceptualization, C.A.M and M.D.; methodology, C.A.M., H.S; software, C.A.M., H.S. and J.S.P.; validation, C.A.M., H.S. and J.S.P.; formal analysis, C.A.M., H.S. and J.S.P.; investigation, C.A.M; resources, M.D.; data curation, C.A.M., H.S. and J.S.P.; writing—original draft preparation, C.A.M; writing—review and editing, C.A.M., H.S., J.S.P.. and M.D.; visualization, J.S.P.; supervision, M.D. and J.S.P.; project administration, M.D; funding acquisition, M.D. All authors have read and agreed to the published version of the manuscript.
Funding
This work is funded by the CISC project, which is part of the grant H2020-MSCA-ITN-2020 grant agreement no. 955901.
Institutional Review Board Statement
The study was conducted in accordance with the Declaration of Helsinki and approved by the Ethics Committee of Universidad de América (Colombia) (protocol code 002-2024 June 2024).
Informed Consent Statement
Informed consent was obtained from all subjects involved in the study.
Data Availability Statement
The anonymized data files from the previous study used for fuzzy logic labeling are available in the Zenodo repository: https://doi.org/10.5281/zenodo.13906740. Additionally, the anonymized dataset collected from the pharmaceutical case study, which was used for these classification models, is accessible at: https://doi.org/10.5281/zenodo.14891916.
Acknowledgments
The authors express their gratitude to Anyela Jineth Mateus and Catalina Nicholls from the pharmaceutical company and Monica Camargo Salinas and Nasli Yuceti Miranda Arandia from the Universidad de América for their invaluable support and collaboration throughout this research.
Conflicts of Interest
The authors declare no conflicts of interest.
Abbreviations
The following abbreviations are used in this manuscript:
| AI | Artificial Intelligence |
| CDFs | Cumulative Distribution Functions |
| CFS | Chronic Fatigue Syndrome |
| CTS | Carpal Tunnel Syndrome |
| EDA | Electrodermal Activity |
| EPC1 | External Principal Component 1 |
| EPC2 | External Principal Component 2 |
| EPC3 | External Principal Component 3 |
| EPC4 | External Principal Component 4 |
| IoT | Internet of Things |
| IPC1 | Internal Principal Component 1 |
| IPC2 | Internal Principal Component 2 |
| KNN | K-Nearest Neighbors |
| LR | Logistic Regression |
| ML | Machine Learning |
| MSDs | Musculoskeletal Disorders |
| PCA | Principal Component Analysis |
| PDFs | Probability Density Functions |
| PCs | Principal Components |
| RF | Random Forest |
| RPE | Rating of Perceived Exertion |
| SVM | Support Vector Machine |
| SNS | Sympathetic Nervous System |
References
- Ahmmed, S.; Isanaka, S.P.; Liou, F. Promoting Synergies to Improve Manufacturing Efficiency in Industrial Material Processing: A Systematic Review of Industry 4.0 and AI. Machines 2024, 12, 681. [Google Scholar] [CrossRef]
- Mital, A.; Pennathur, A. Advanced technologies and humans in manufacturing workplaces: an interdependent relationship. Int. J. Ind. Ergon. 2004, 33, 295–313. [Google Scholar] [CrossRef]
- Trstenjak, M.; Benešova, A.; Opetuk, T.; Cajner, H. Human Factors and Ergonomics in Industry 5.0—A Systematic Literature Review. Appl. Sci. 2025, 15, 2123. [Google Scholar] [CrossRef]
- Breese, M. “The Effect of Human Factors and Leadership on Safety. ” Chem. Eng. Prog. 2024, 120, 44–49. [Google Scholar]
- Verma, D. Industry 5.0: A Human-Centric and Sustainable Approach to Industrial Development. Int. J. Soc. Relev. Concern 2024, 12, 17–21. [Google Scholar] [CrossRef]
- Ruiz-de-la-Torre-Acha, A.; Guevara-Ramirez, W.; Río-Belver, R.M.; Borregan-Alvarado, J. “Industry 5.0: The Road to Sustainability.” In Towards a Smart, Resilient and Sustainable Industry; Springer: Cham, Switzerland, 2023; pp. 247–257. [Google Scholar]
- Panneerselvam, S.; Kumar, A.S.; Subramanian, C. “Physical Challenges in Assembly Line Production Systems from Ergonomics Point of View – Review. ” J. Ind. Mech. 2023, 8, 24–43. [Google Scholar]
- Sieber, W.K.; Chen, G.X.; Krueger, G.P.; Lincoln, J.E.; Menéndez, C.C.; O'Connor, M.B. Research gaps and needs for preventing worker fatigue in the transportation and utilities industries. Am. J. Ind. Med. 2022, 65, 857–866. [Google Scholar] [CrossRef]
- Parijat, P.; Lockhart, T.E. Effects of lower extremity muscle fatigue on the outcomes of slip-induced falls. Ergonomics 2008, 51, 1873–1884. [Google Scholar] [CrossRef]
- Fukuda, K.; Straus, S.E.; Hickie, I.; Sharpe, M.C.; Dobbins, J.G.; Komaroff, A.; International Chronic Fatigue Syndrome Study Group. The Chronic Fatigue Syndrome: A Comprehensive Approach to Its Definition and Study. Ann. Intern. Med. 1994, 121, 953–959. [Google Scholar] [CrossRef]
- Andersen, J.H.; Haahr, J.P.; Frost, P. Risk factors for more severe regional musculoskeletal symptoms: A two-year prospective study of a general working population. Arthritis Rheum. 2007, 56, 1355–1364. [Google Scholar] [CrossRef]
- World Health Organization (WHO). Musculoskeletal Conditions. WHO Fact Sheets, 2023. Available online: https://www.who.
- Szabo, R.M. Carpal Tunnel Syndrome as a Repetitive Motion Disorder. 1998, 351, 78??? 89. [CrossRef]
- Guzmán-Velasco, A.; Diago-Franco, J.L. Coexistence of musculoskeletal disorders in the upper body of labor origin. Duazary 2019, 16, 193–203. [Google Scholar] [CrossRef]
- Quiroga, S.; Largo, J.F.; Rodriguez, F.; Sánchez, V. Carpal Tunnel Syndrome Diagnosis and Prevention System. Universidad de los Andes, Bogotá, Colombia, 2022. Available online: https://repositorio.uniandes.edu. 4954. [Google Scholar]
- Ferrerosa, B.; López, J.; Reyes, E.G.; Bravo, M. Painful Musculoskeletal Symptoms and Ergonomic Risk in Upper Limbs in Workers of a Cosmetics Company. Rev. Colomb. Salud Ocup. 2015, 5(3), 26–30. https://dialnet.unirioja.es/descarga/articulo/7890185.pdf.
- Bazazan, A.; Noman, Y.; Norouzi, H.; Maleki-Ghahfarokhi, A.; Sarbakhsh, P.; Dianat, I. Physical and psychological job demands and fatigue experience among offshore workers. Heliyon 2023, 9, e16441. [Google Scholar] [CrossRef]
- Gawron, V.J. Overview of Self-Reported Measures of Fatigue. Int. J. Aviat. Psychol. 2016, 26, 120–131. [Google Scholar] [CrossRef]
- Valenza, G.; Citi, L.; Saul, J.P.; Barbieri, R. Measures of sympathetic and parasympathetic autonomic outflow from heartbeat dynamics. J. Appl. Physiol. 2018, 125, 19–39. [Google Scholar] [CrossRef]
- Moon, J.; Ju, B.-K. Wearable Sensors for Healthcare of Industrial Workers: A Scoping Review. Electronics 2024, 13, 3849. [Google Scholar] [CrossRef]
- Morillo, C.A.; Demichela, M. A Data-Driven Framework to Model Physical Fatigue in Industrial Environments Using Wearable Technologies. 14th International Conference on Applied Human Factors and Ergonomics (AHFE 2023). LOCATION OF CONFERENCE, COUNTRYDATE OF CONFERENCE;
- Albarrán Morillo, C.; Demichela, M. Exploring the Impact of Repetitive Exercise on Physical Fatigue: A Study of Industrial Task Simulation in a Controlled Fitness Setting. Chem. Eng. Trans. 2023, 99, 167–172. [Google Scholar] [CrossRef]
- Borg, G.A. Psychophysical bases of perceived exertion. Med. Sci. Sports Exerc. 1982, 14, 377–381. [Google Scholar] [CrossRef]
- Jones, G.; Hocine, M.; Salomon, J.; Dab, W.; Temime, L. Demographic and occupational predictors of stress and fatigue in French intensive-care registered nurses and nurses' aides: A cross-sectional study. Int. J. Nurs. Stud. 2015, 52, 250–259. [Google Scholar] [CrossRef]
- Ahmadi, M.; Choobineh, A.; Mousavizadeh, A.; Daneshmandi, H. Physical and psychological workloads and their association with occupational fatigue among hospital service personnel. BMC Heal. Serv. Res. 2022, 22, 1–8. [Google Scholar] [CrossRef]
- Shi, H.; Albarrán Morillo, C.; Baldissone, G.; Demichela, M. The Design of the Principal Component Analysis (PCA)-Based Fuzzy Logic Classifier on Physical Fatigue in Process Industries. Chem. Eng. Trans. 2024, 111, 189–194. [Google Scholar] [CrossRef]
- Albarrán Morillo, C.; Shi, H.; Baldissone, G.; Demichela, M. Customizing a Weighted Scale for Precision in Fatigue Assessment within the Process Industry. Chem. Eng. Trans. 2024, 111, 193–198. [Google Scholar] [CrossRef]
- Mendel, J.M. Fuzzy logic systems for engineering: a tutorial. Proc. IEEE 1995, 83, 345–377. [Google Scholar] [CrossRef]
- Morillo, C.A.; Demichela, M.; Jawla, D.; Kelleher, J. Wearable Technology and Machine Learning for Assessing Physical Fatigue in Industry 4.0. 15th International Conference on Applied Human Factors and Ergonomics (AHFE 2024). LOCATION OF CONFERENCE, COUNTRYDATE OF CONFERENCE;
- Hernandez, G.; Valles, D.; Wierschem, D.C.; Koldenhoven, R.M.; Koutitas, G.; Mendez, F.A.; Aslan, S.; Jimenez, J. Machine Learning Techniques for Motion Analysis of Fatigue from Manual Material Handling Operations Using 3D Motion Capture Data. 2020 10th Annual Computing and Communication Workshop and Conference (CCWC). LOCATION OF CONFERENCE, United StatesDATE OF CONFERENCE; pp. 0300–0305.
- Lambay, A.; Liu, Y.; Ji, Z.; Morgan, P. Effects of Demographic Factors for Fatigue Detection in Manufacturing. IFAC-PapersOnLine 2022, 55, 528–533. [Google Scholar] [CrossRef]
- Nagahanumaiah, L.; Singh, S.; Heard, J. Diagnostic Human Fatigue Classification using Wearable Sensors for Intelligent Systems. 2022 17th Annual System of Systems Engineering Conference (SOSE). LOCATION OF CONFERENCE, United StatesDATE OF CONFERENCE; pp. 424–429.
- Narteni, S.; Orani, V.; Cambiaso, E.; Rucco, M.; Mongelli, M. On the Intersection of Explainable and Reliable AI for Physical Fatigue Prediction. IEEE Access 2022, 10, 76243–76260. [Google Scholar] [CrossRef]
- Nasirzadeh, F.; Mir, M.; Hussain, S.; Darbandy, M.T.; Khosravi, A.; Nahavandi, S.; Aisbett, B. Physical Fatigue Detection Using Entropy Analysis of Heart Rate Signals. Sustainability 2020, 12, 2714. [Google Scholar] [CrossRef]
- Maman, Z.S.; Chen, Y.-J.; Baghdadi, A.; Lombardo, S.; Cavuoto, L.A.; Megahed, F.M. A data analytic framework for physical fatigue management using wearable sensors. Expert Syst. Appl. 2020, 155. [Google Scholar] [CrossRef]
- Vaillant, A.G.; Sagrilo, L.V.S.; Custódio, A.B. On the Use of Dimension-Reduction Methods in Fatigue Analysis of Flexible Risers Subjected to Bimodal Seas. J. Offshore Mech. Arct. Eng. 2024, 147. [Google Scholar] [CrossRef]
Figure 1.
Fuzzy logic-based labeling for binary classification. (a) Membership function for binary fatigue classification based on IPC1. (b) Histogram of physical fatigue label distribution for binary classification.
Figure 1.
Fuzzy logic-based labeling for binary classification. (a) Membership function for binary fatigue classification based on IPC1. (b) Histogram of physical fatigue label distribution for binary classification.
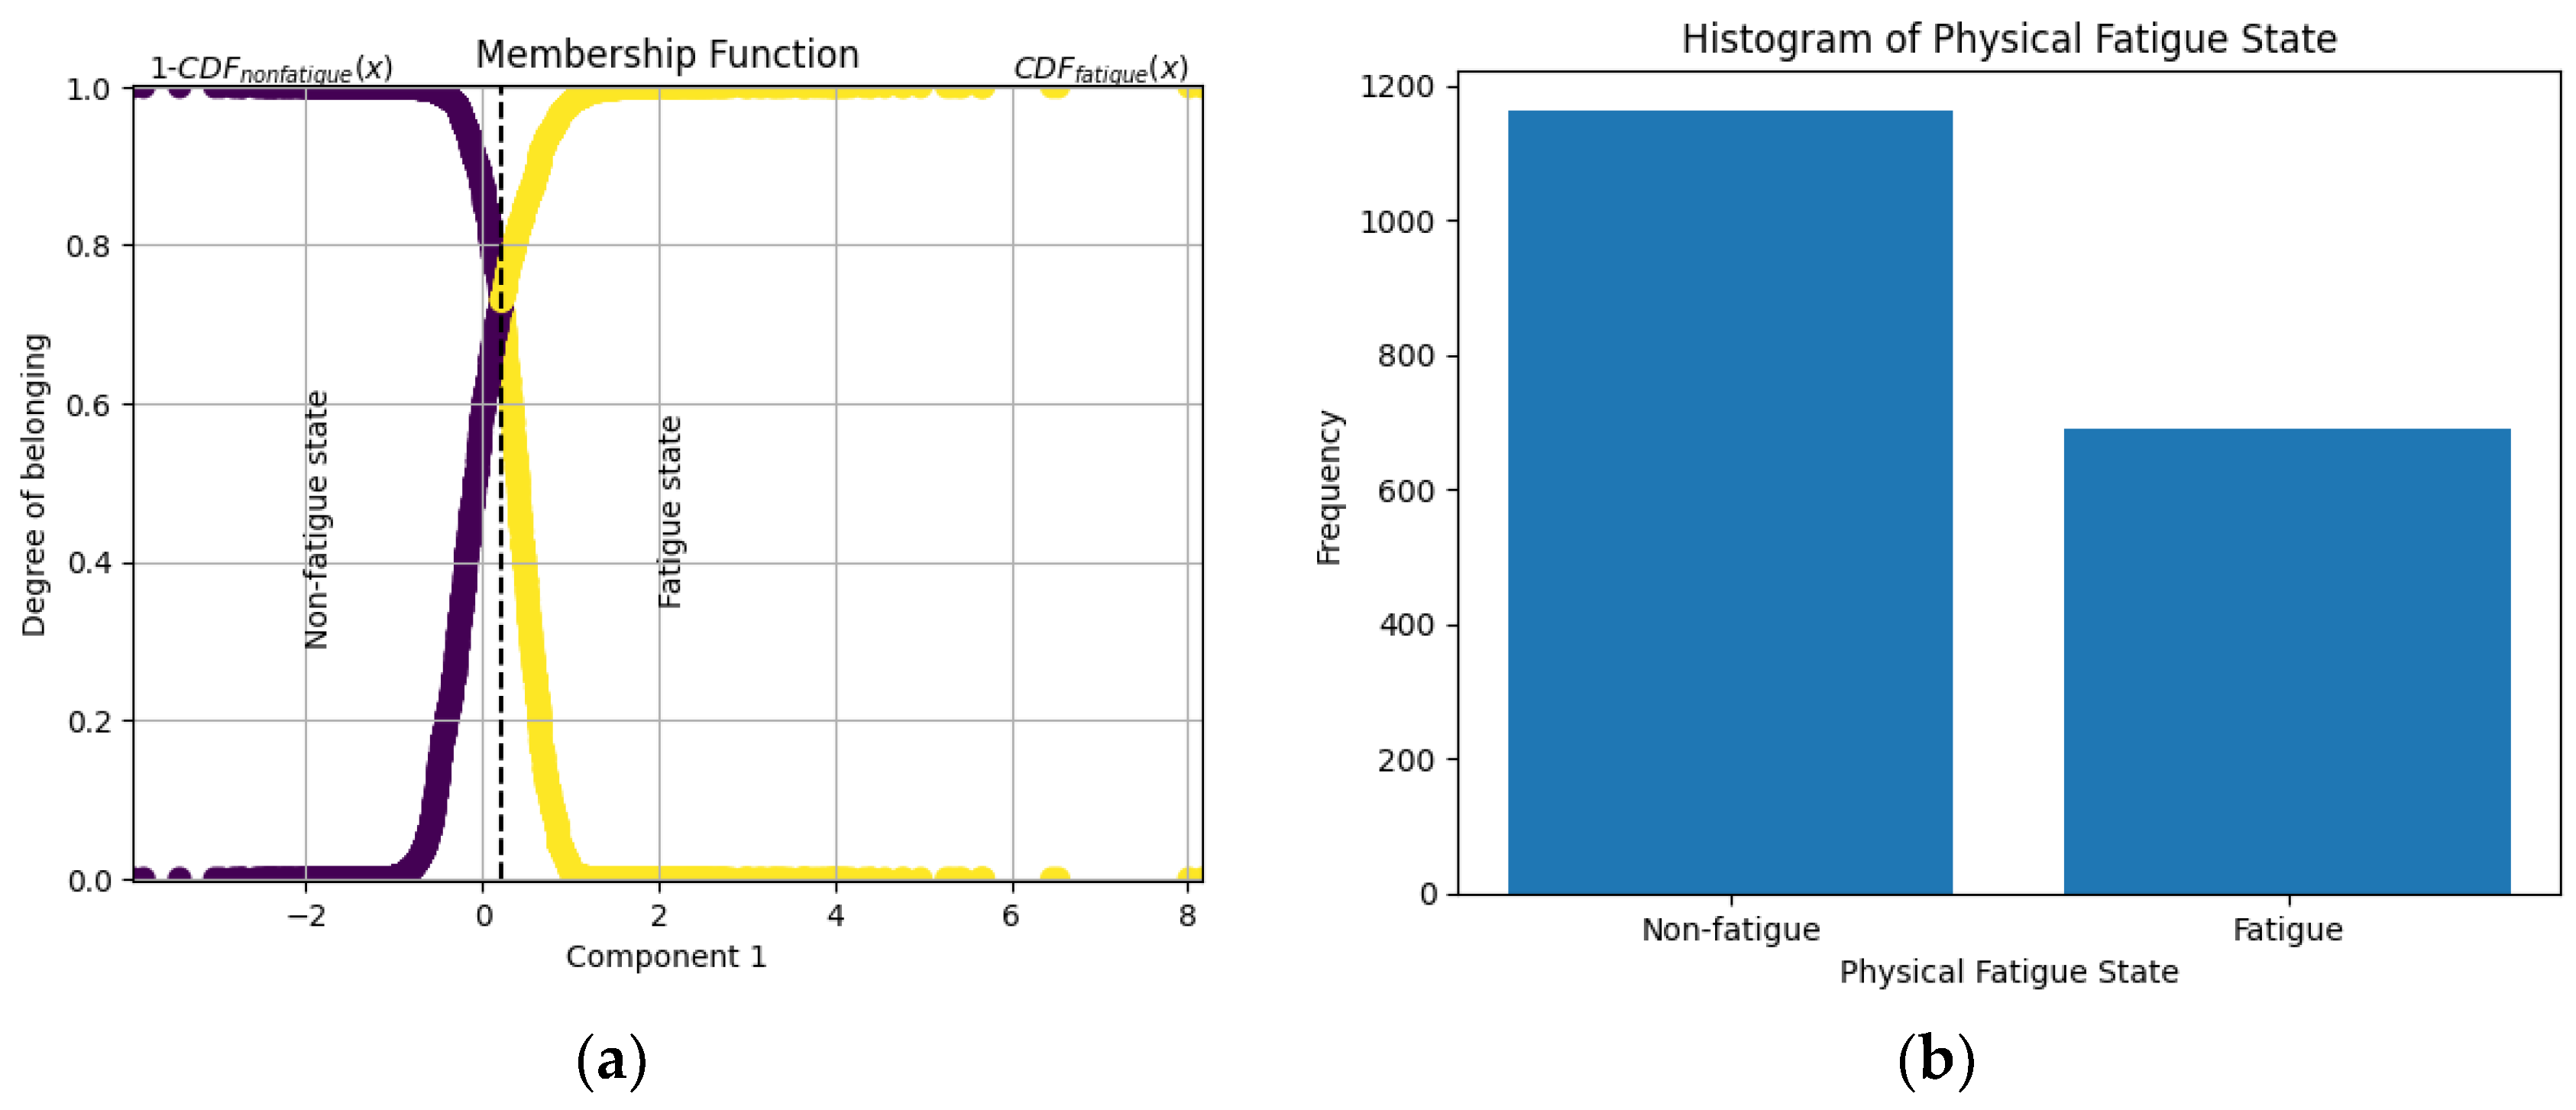
Figure 2.
Fuzzy logic-based labeling for four-level classification. (a) Membership function for four-level fatigue classification based on IPC1. (b) Histogram of physical fatigue label distribution for four-level classification.
Figure 2.
Fuzzy logic-based labeling for four-level classification. (a) Membership function for four-level fatigue classification based on IPC1. (b) Histogram of physical fatigue label distribution for four-level classification.
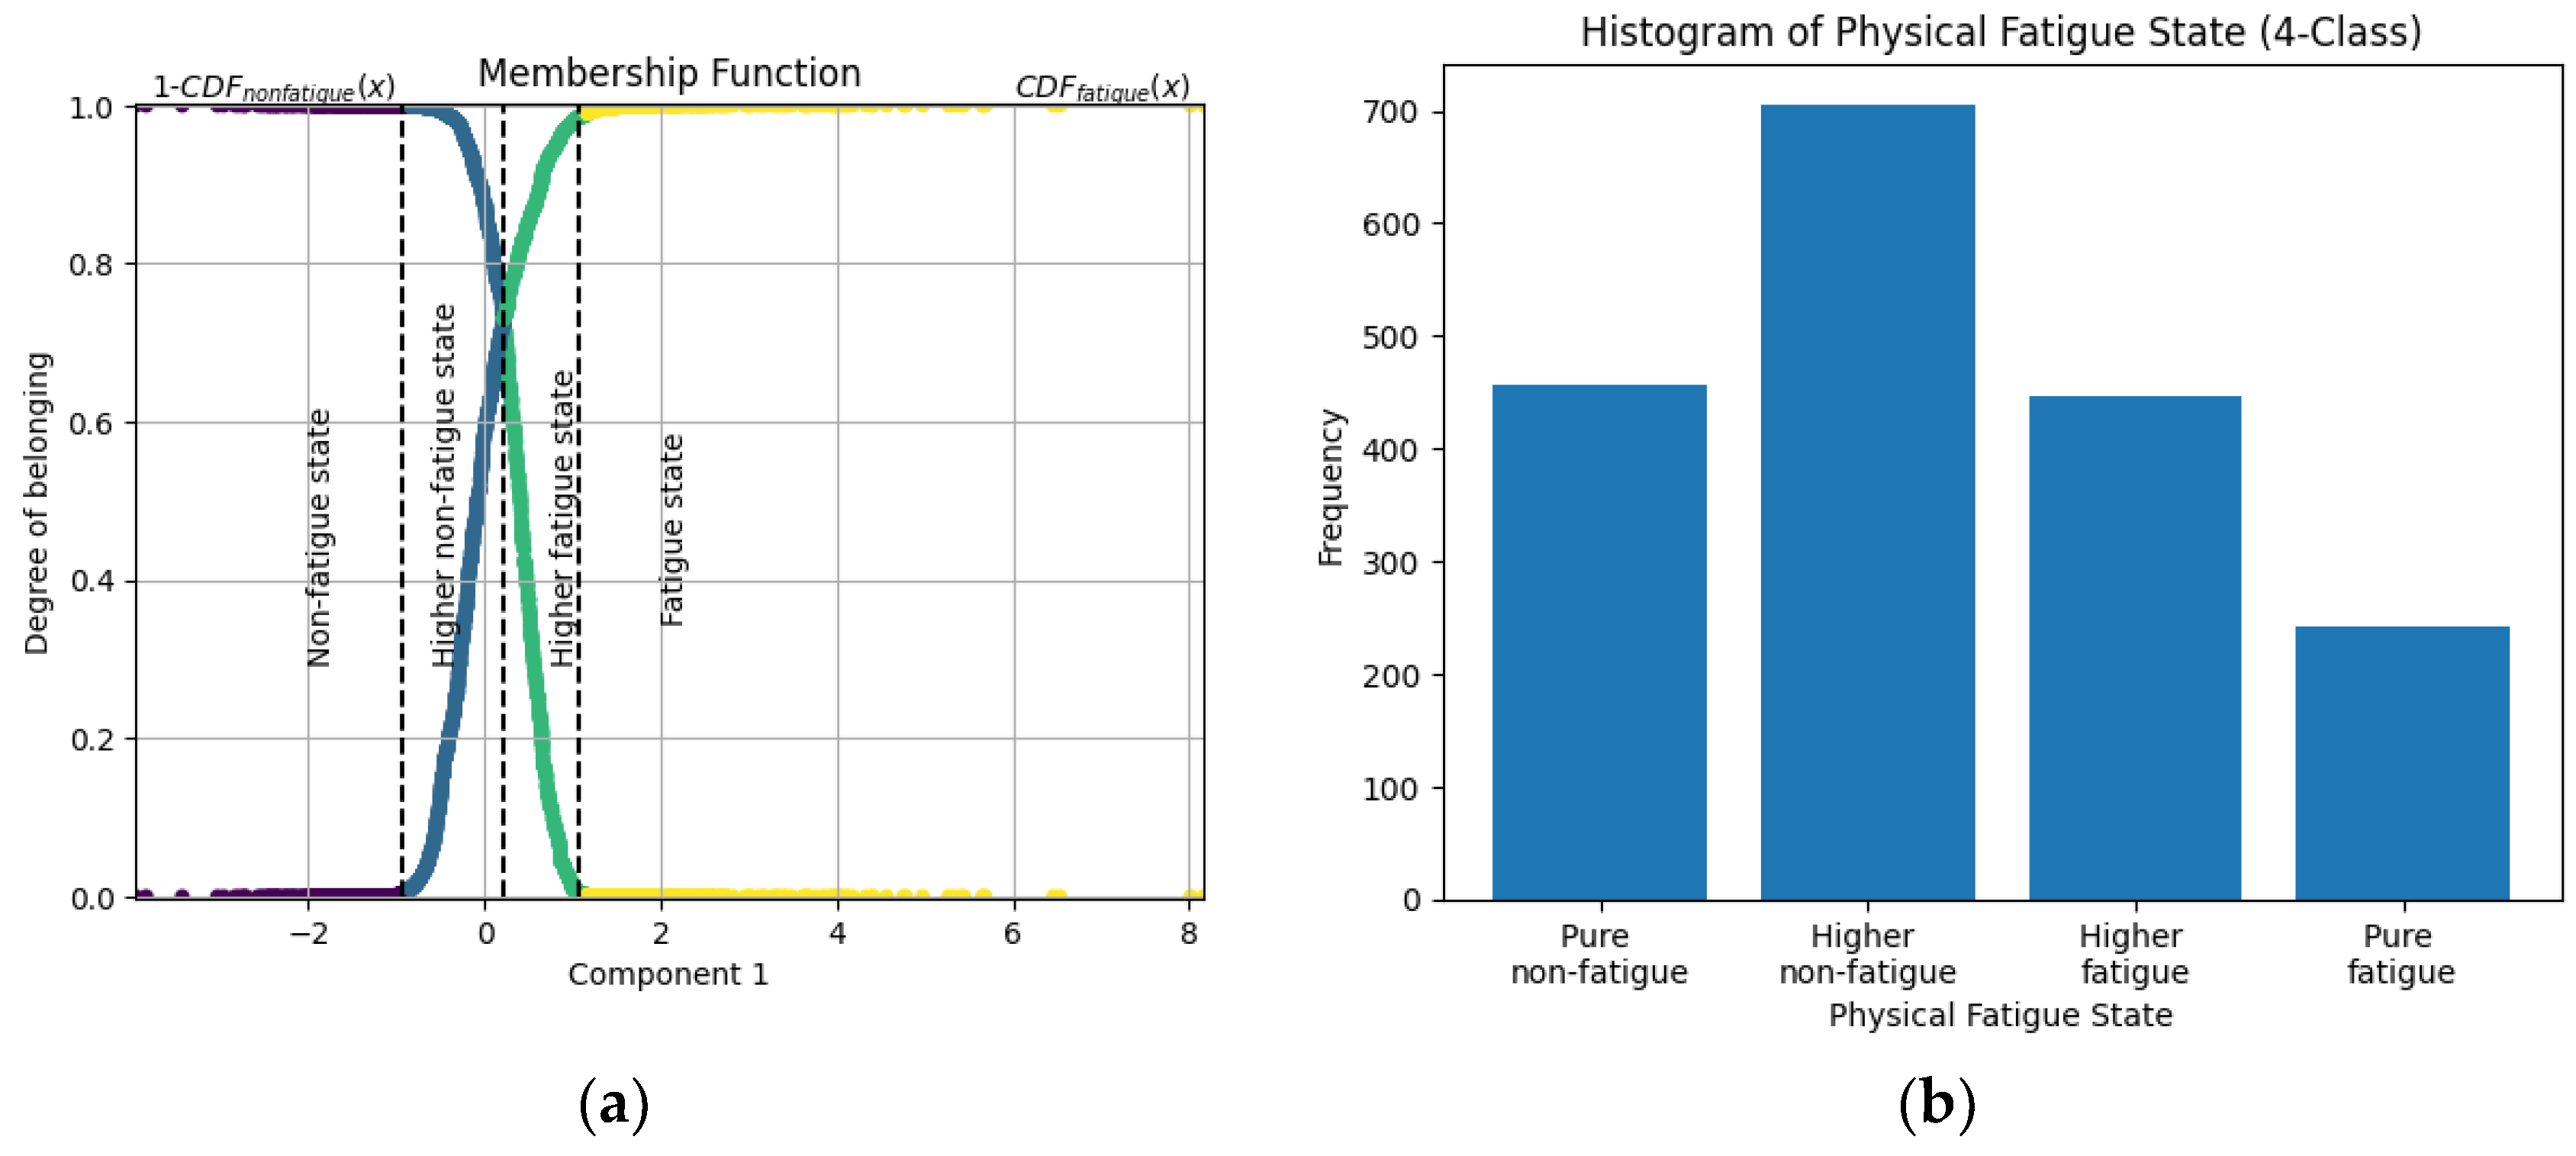
Figure 3.
Normalized confusion matrix for four-level fatigue classification using RF with external and internal features.
Figure 3.
Normalized confusion matrix for four-level fatigue classification using RF with external and internal features.
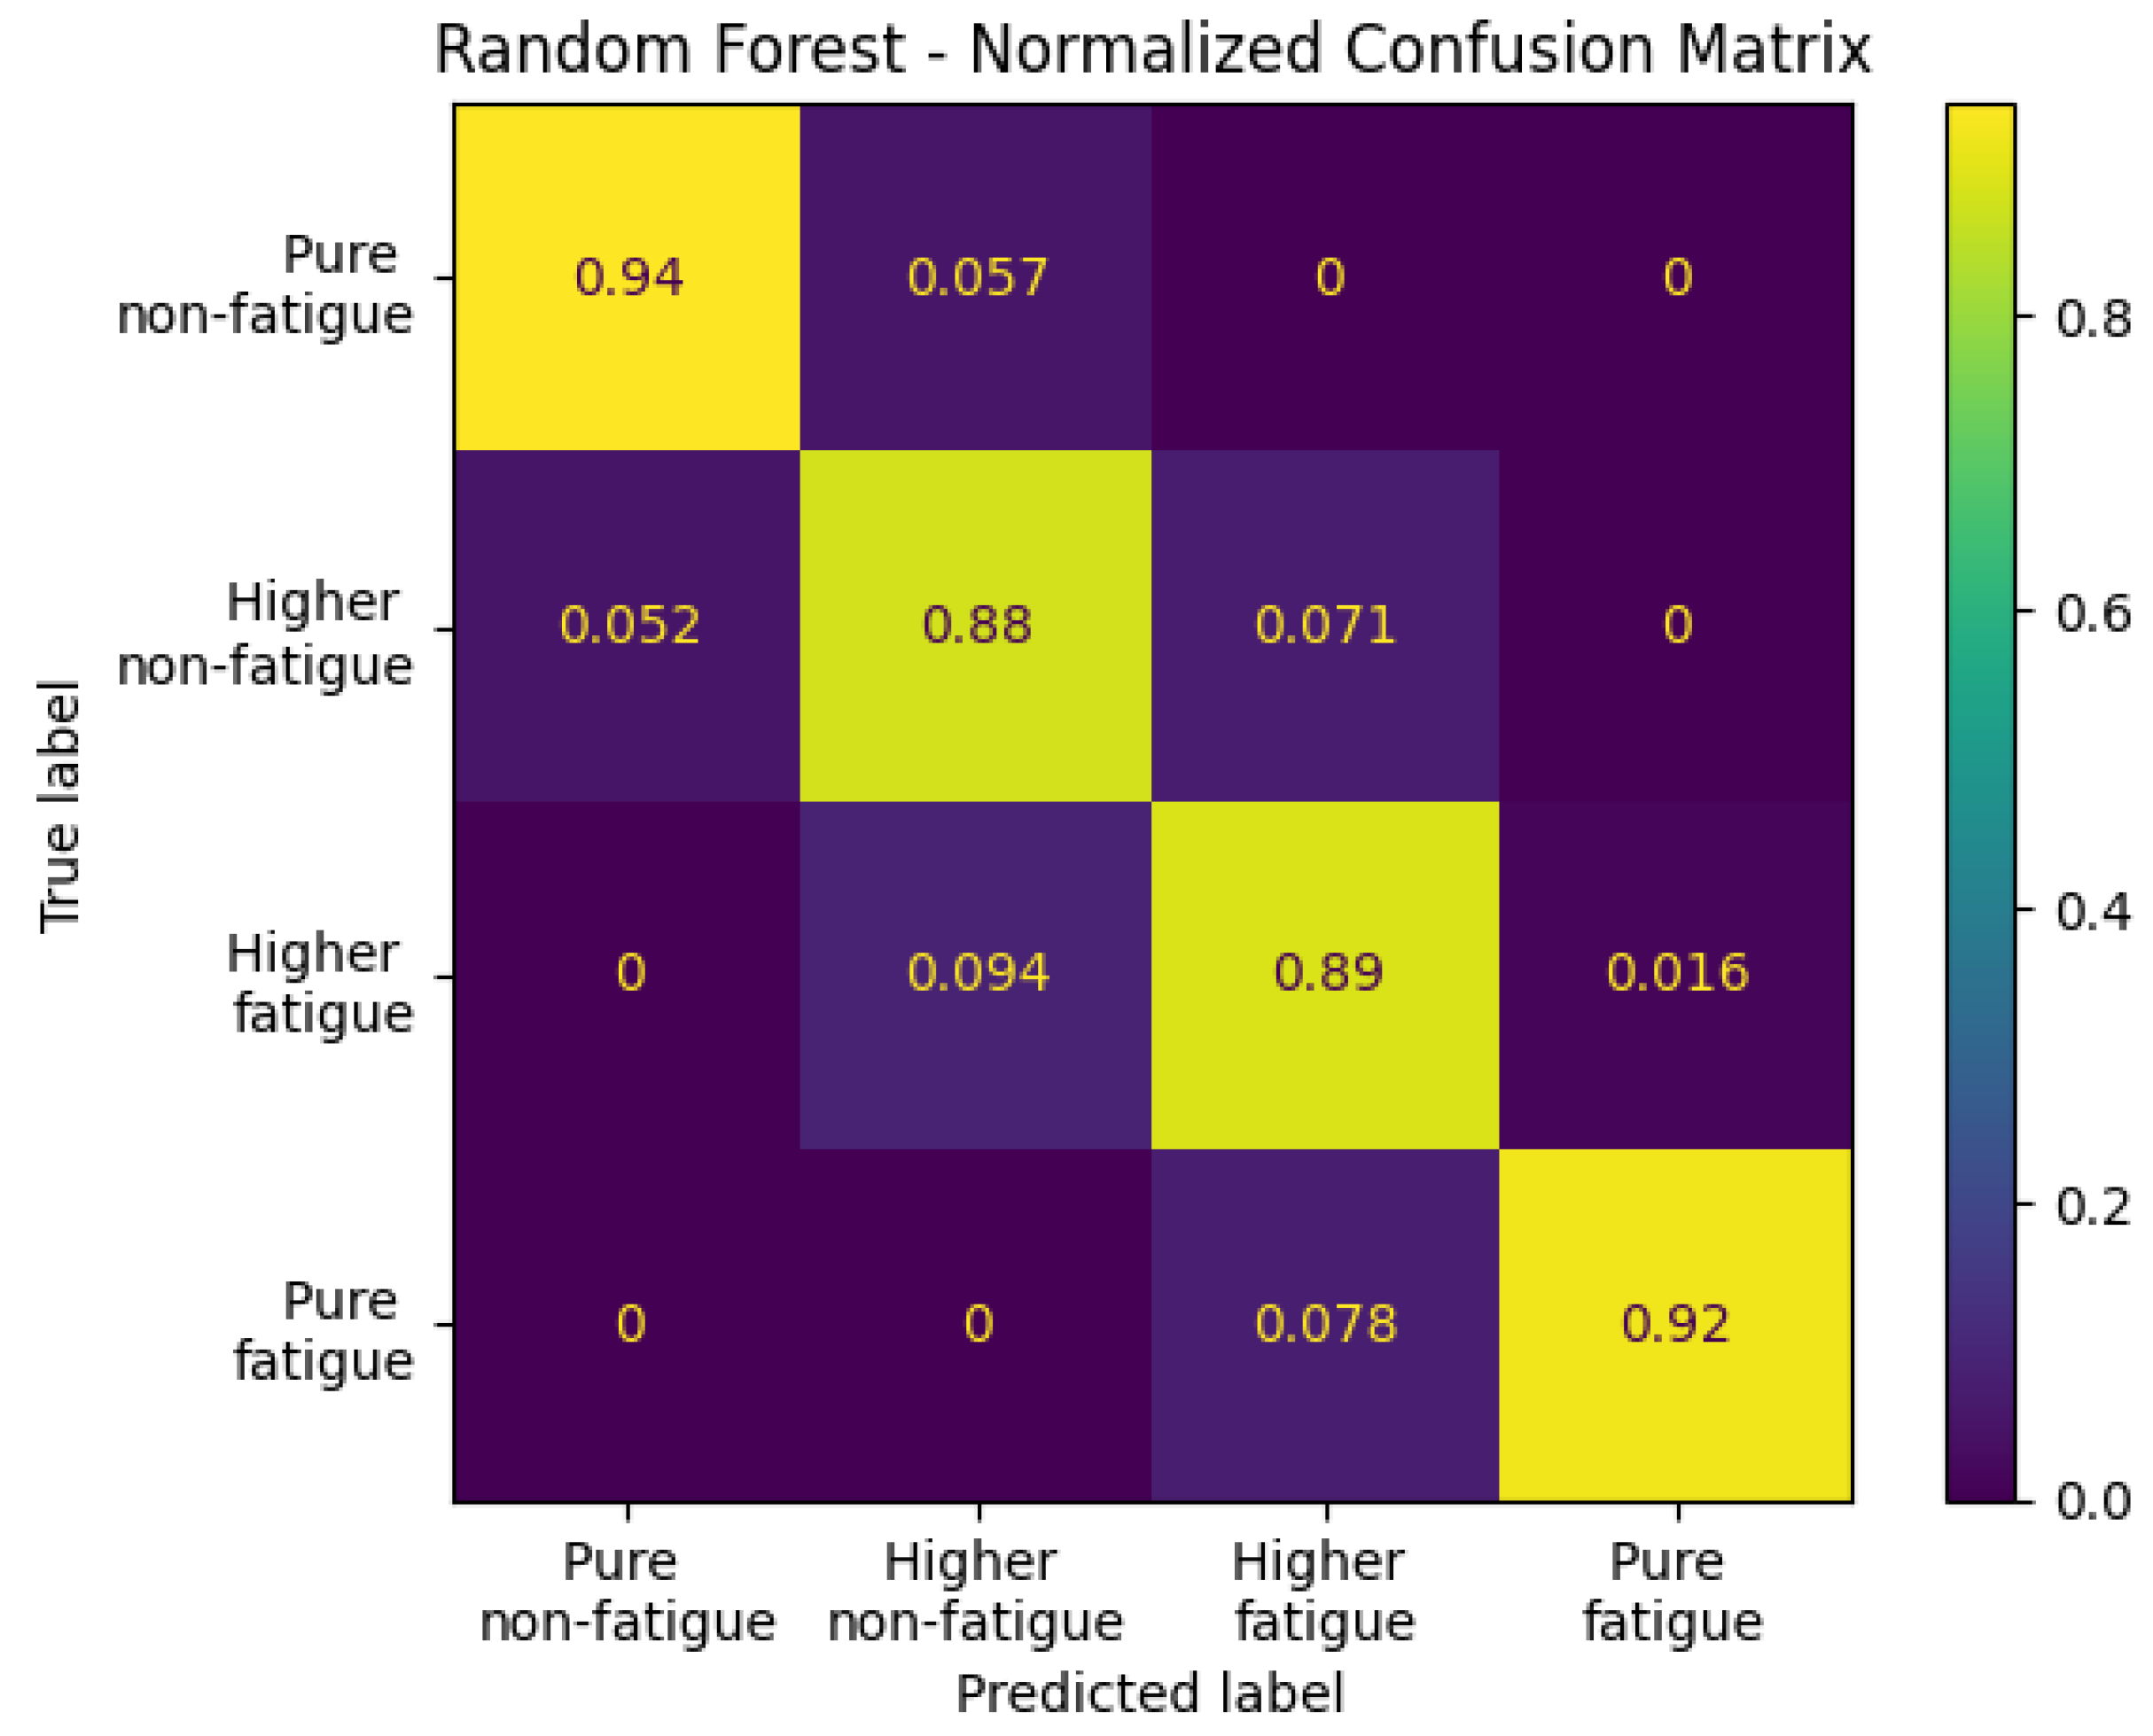

Table 1.
Principal component matrix with factor loadings for biometric data (internal factors).
| Variable | Principal | Component |
|---|---|---|
| 1 | 2 | |
| EDA | 0.703 | |
| Pulse rate | 0.711 | |
| Temperature | 0.505 | |
| Accelerometer | 0.867 | |
| Step count | 0.918 | |
| Activity count | 0.863 |
Factor loadings with an absolute value <0.5 are not indicated in the table.
Table 2.
Principal component matrix with factor loadings for demographic and occupational data (external factors).
Table 2.
Principal component matrix with factor loadings for demographic and occupational data (external factors).
| Variable | Principal | Component | ||
|---|---|---|---|---|
| 1 | 2 | 3 | 4 | |
| Moment | 0.997 | |||
| Shift | 0.734 | |||
| Production line | 0.929 | |||
| Day | 0.968 | |||
| Number of products | 0.811 | |||
| Age | 0.955 | |||
| Experience | 0.845 |
Factor loadings with an absolute value <0.5 are not indicated in the table.
Table 3.
F1 scores for binary fatigue classification using external features.
| Algorithm | F1 score |
|---|---|
| RF | 0.681 |
| KNN | 0.668 |
| SVM | 0.435 |
| Logistic Regression | 0.0 |
Table 4.
F1 scores for four-level fatigue classification using external features.
| Algorithm | F1 score |
|---|---|
| RF | 0.573 |
| KNN | 0.538 |
| SVM | 0.442 |
| Logistic Regression | 0.261 |
Table 5.
F1 scores for binary fatigue classification using external and internal features.
| Algorithm | F1 score |
|---|---|
| RF | 0.935 |
| KNN | 0.900 |
| SVM | 0.910 |
| Logistic Regression | 0.883 |
Table 6.
F1 scores for four-level fatigue classification using external and internal features.
| Algorithm | F1 score |
|---|---|
| RF | 0.903 |
| KNN | 0.842 |
| SVM | 0.853 |
| Logistic Regression | 0.849 |
Disclaimer/Publisher’s Note: The statements, opinions and data contained in all publications are solely those of the individual author(s) and contributor(s) and not of MDPI and/or the editor(s). MDPI and/or the editor(s) disclaim responsibility for any injury to people or property resulting from any ideas, methods, instructions or products referred to in the content. |
© 2025 by the authors. Licensee MDPI, Basel, Switzerland. This article is an open access article distributed under the terms and conditions of the Creative Commons Attribution (CC BY) license (http://creativecommons.org/licenses/by/4.0/).
Copyright: This open access article is published under a Creative Commons CC BY 4.0 license, which permit the free download, distribution, and reuse, provided that the author and preprint are cited in any reuse.


