
Submitted:
12 March 2025
Posted:
14 March 2025
You are already at the latest version
Abstract
Nutrient analysis through mobile health applications can improve dietary choices, particularly among vulnerable populations. However, deploying sophisticated deep learning models on resource-constrained devices presents challenges in computational efficiency, model interpretability, and user trust. We propose a lightweight interpretable deep learning model for real-time nutrient analysis on mobile devices. Our approach uses depthwise separable convolutions, bottleneck units, and Shuffle Attention to reduce computational complexity while maintaining accuracy. For interpretability, we integrate Grad-CAM visualisations, LIME explanations, and Concept Activation Vectors. Our model achieves 92.3% accuracy in food recognition and 7.2% mean absolute error in nutrient estimation, with a model size of 11MB. Testing on resource-constrained devices shows inference times of 150ms on mid-range smartphones with minimal battery impact. User studies demonstrate high comprehension scores for interpretability features, with Grad-CAM visualisations achieving an 8.2/10 understanding score. These results show our model can effectively deliver nutrient analysis on budget mobile devices and in environments with limited infrastructure, making it particularly valuable for vulnerable populations facing both technical and infrastructural constraints.
Keywords:
deep learning
; mobile health applications
; nutrient analysis
; interpretable AI
; lightweight neural networks
; Vulnerable populations
; resource-constrained devices
1. Introduction
In recent years, mobile health applications have become increasingly prevalent, offering users convenient tools for monitoring and managing their health. Among these, nutrient analysis apps play a crucial role in helping individuals, particularly those from vulnerable populations, maintain balanced diets and make informed nutritional choices. However, the development of accurate and efficient nutrient analysis tools for mobile platforms presents unique challenges, especially for users with limited resources or health literacy.
The importance of proper nutrition in maintaining overall health and preventing chronic diseases cannot be overstated. Malnutrition, whether in the form of undernutrition or obesity, remains a significant global health concern [1]. Mobile health applications have the potential to democratise access to nutritional information and guidance, providing personalised recommendations based on individual needs and preferences. This is particularly valuable for vulnerable populations who may have limited access to healthcare professionals or nutritional education [2].
Traditional methods of nutrient analysis often rely on manual input of dietary information or simplistic algorithms, which can be time-consuming, error-prone, and fail to capture the complexity of human nutrition. Recent advancements in artificial intelligence, specifically deep learning, have shown promise in enhancing the accuracy and capability of nutrient analysis [3]. Deep learning models can potentially process complex data inputs, such as food images or natural language descriptions, to provide more accurate and comprehensive nutritional assessments.
However, implementing sophisticated deep learning models on mobile devices presents significant challenges. Mobile platforms are constrained by limited computational resources, storage capacity, and energy consumption considerations. Moreover, many state-of-the-art deep learning models are computationally intensive and require substantial memory, making them impractical for real-time use on smartphones [4]. This necessitates the development of lightweight models that can operate efficiently within the constraints of mobile devices without sacrificing accuracy [5]. Another critical challenge in the application of deep learning to health-related tasks is the "black box" nature of many models [6]. Users and healthcare professionals require transparency in AI-driven health recommendations to foster trust and ensure responsible use. This is particularly important in the context of nutrient analysis, where recommendations can have direct impacts on users' dietary choices and health outcomes. Therefore, there is a pressing need for interpretable AI models that can explain their predictions in human-understandable terms [7].
The challenge of model interpretability is further complicated by cultural diversity and varying levels of health literacy among vulnerable populations. Different cultural groups may interpret and trust AI explanations differently, necessitating culturally sensitive approaches to model interpretability. Moreover, while initial user trust is important, maintaining and building that trust over time is crucial for long-term adoption and positive health outcomes. These technical challenges are compounded by the need to provide culturally appropriate and sustained interpretability across diverse user groups. Effective interpretability must not only be technically sound but also culturally resonant and trustworthy over extended periods of use. The primary objectives of this research are threefold:
- To develop a lightweight deep learning model capable of accurate nutrient analysis while operating efficiently on mobile devices.
- To integrate interpretability features into the model, allowing users to understand the factors influencing the nutritional assessments.
- To evaluate the model's performance and usability in real-world scenarios, particularly for vulnerable populations.
In this paper, we present a novel approach to addressing these challenges. We propose a lightweight, interpretable deep learning architecture specifically designed for nutrient analysis in mobile environments. Our model incorporates state-of-the-art compression techniques to reduce its size and computational requirements without sacrificing accuracy. Additionally, we integrate interpretability features that provide clear, user-friendly explanations for the model's predictions, enhancing transparency and user trust.
The main contributions of this work include:
- A novel lightweight architecture that achieves high accuracy in nutrient analysis while being suitable for mobile deployment.
- The successful integration of interpretability features that enhance user understanding without compromising model performance.
- A comprehensive evaluation of the model's performance in mobile health contexts, including accuracy, speed, and mobile deployment feasibility.
The remainder of this paper is organised as follows: In Section II, we review related work in nutrient analysis, lightweight models, and interpretable AI. In Section III, we detail our methodology, including dataset, model architecture, interpretability features, and mobile implementation. In Section IV, we present our experimental results, comparing performance, efficiency, and interpretability. In Section V, we discuss our findings, analysing model performance, interpretability, and limitations. Finally, in Section VI, we conclude the paper, summarising our contributions and future directions for nutrient analysis in mobile health applications.
2. Related Work
This section reviews existing approaches in mobile nutrient analysis, focusing on architectural developments, efficiency optimisations, and interpretability mechanisms.
2.1. Nutrient Analysis Architectures
Encoder-decoder architectures have become fundamental in image analysis tasks, including nutrient analysis. The U-Net architecture has been particularly influential in this domain. Several variations of U-Net have been proposed to address limitations and improve performance for specific tasks.
Sharp U-Net, proposed by Zunair and Hamza [8], introduces a depth wise convolution with a sharpening kernel filter in the skip connections. This approach helps fuse semantically similar features and smooth out artifacts during early training stages, outperforming state-of-the-art models in both binary and multi-class biomedical image segmentation tasks without adding extra learnable parameters.
Di et al. [9] and Wang et al. [10] introduced KiU-Net, an overcomplete convolutional architecture designed to address U-Net's limitations in detecting smaller structures and segmenting boundary regions precisely. KiU-Net projects the input image into a higher dimension, constraining the receptive field from increasing in deep layers. This approach improves the detection of small structures and accurate edge segmentation while using fewer parameters and achieving faster convergence compared to traditional U-Net based approaches.
Yin et al. [11] proposed Half-UNet, a simplified U-Net architecture that maintains similar segmentation accuracy while significantly reducing parameters and floating-point operations. Half-UNet takes advantage of channel number unification, full-scale feature fusion, and Ghost modules, demonstrating effectiveness across multiple medical image segmentation tasks. Yang et al. [5] developed ELU-Net, an efficient and lightweight U-Net with deep skip connections. ELU-Net incorporates same- and large-scale skip connections from the encoder to fully extract features, showing improved performance on brain tumour and liver datasets ad researchers are now working on nutritional analysis[12,13]. These advancements in U-Net variants demonstrate the ongoing efforts to improve segmentation accuracy, computational efficiency, and adaptability to various medical imaging tasks, which could be valuable for nutrient analysis in food images. While these advances have improved accuracy, they often increase computational complexity, challenging their deployment on mobile devices, especially for vulnerable populations with low-end smartphones. While these U-Net modifications established feasible deployment paths, the need for even lighter architectures led to specific mobile-optimised implementations.
2.2. Lightweight Deep Learning Models
Building upon the foundational U-Net architectures, mobile-optimised networks have advanced through systematic parameter reduction strategies. Table 1 summarises the key architectures and their standardised performance metrics.
through depth wise separable convolutions, with Mezgec et al. [14] achieving 87.6% accuracy on 520 food classes. EfficientNet [15] introduced compound scaling, with Schilling et al. [16] achieving 86.4% accuracy while reducing model size by 87%. ShuffleNet [18] employed group convolutions, with Jiang et al. [5] achieving 85.2% accuracy and sub-50ms inference times. SqueezeNet [17] achieved comparable accuracy with 50x fewer parameters, demonstrated by Tran et al. [17] achieving 83.6% accuracy at just 5MB.
These architectures have shown success across various nutrient analysis tasks. Liu et al. [19] applied MobileNetV2 to Asian food recognition (84.3% accuracy), while Tan et al. [20] used EfficientNet for portion estimation (15% error). Chen et al. [18] developed a ShuffleNet-based model for nutrient prediction (10.5% calorie error), and Zhou et al. [21] combined approaches for comprehensive monitoring (82.7% recognition accuracy). While these implementations demonstrated significant efficiency improvements, they highlighted the need for robust interpretability mechanisms.
The architectures MobileNet, EfficientNet-B0, ShuffleNetV2, and SqueezeNet are designed to optimise performance in convolutional neural networks (CNNs) while minimising computational costs. Each architecture employs unique strategies to enhance efficiency, making them suitable for various applications, particularly in mobile environments.
2.3 Interpretability Techniques in Mobile Health AI
Interpretability mechanisms have become essential for ensuring user trust in mobile nutrient analysis applications, particularly for vulnerable populations with varying health literacy levels. Recent research has focused on developing techniques that balance explanation quality with computational efficiency across diverse mobile platforms. Attention mechanisms have emerged as a leading approach, with significant implementations by Choi et al. [22] in their RETAIN model for electronic health records, achieving 12% accuracy improvement, and Bahadori et al. [23] in visual calorie estimation, though both noted increased computational overhead. Post-hoc explanation methods like LIME and SHAP have shown promise in mobile health applications. Yao et al. [24] demonstrated SHAP-based explanations increased user trust by 24%, while Adjuik et al. [25] used LIME to achieve 18% higher user engagement. However, both approaches required significant computational resources on mobile devices.
Concept Activation Vectors (CAVs) have effectively translated complex decisions into human-friendly concepts. Selvaraju et al. [26] showed 78% of users preferred CAV-based explanations over traditional breakdowns for food classification. Similarly, saliency mapping techniques like Grad-CAM have proven efficient, with Zhou et al. [18] achieving 86% precision in ingredient identification and Xiao et al. [27] improving detection rates by 30% in medical applications. Despite these advances, significant challenges remain. Zunair et al. [28] found SHAP explanations increased inference time by 250% on low-end smartphones, while Mazzia et al. [29] revealed that explanation effectiveness varied significantly with users' educational backgrounds. These findings highlight the need to balance computational efficiency with explanation quality across vulnerable populations.
2.4. Lightweight Mobile Nutrient Analysis
Combining lightweight architectures with interpretability features, several mobile implementations demonstrated practical deployment strategies. Several notable applications have emerged in the field of mobile nutrient analysis. Im2Calories, proposed by Myers et al. [30], is a CNN-based system for calorie estimation from single images, achieving 20% mean absolute error but requiring significant computational resources. NutriNet, developed by Tran et al. [31] is a lightweight CNN for food recognition and portion estimation, achieving 87.2% top-1 accuracy on 520 food classes with an 8.7MB model size. FoodAI, created by Mezgec and Koroušić Seljak [32] recognises over 500 food items with 92.8% top-5 accuracy and 0.8-second inference time on mid-range smartphones.
However, implementing comprehensive nutrient analysis on low-end devices presents several challenges. Computational limitations are significant, as Liu et al.[33] found ResNet-50 inference times exceeded 2 seconds on entry-level smartphones. Storage constraints also pose issues, with Chen et al. [18] reporting that initial 150MB models were impractical for budget smartphones. Energy efficiency is another concern, as Zhang et al.[13,34] observed continuous use depleted budget smartphone batteries in under 4 hours.
Additionally, limited sensor quality affects performance, with Jin et al.[35] noting a 15% accuracy drop using entry-level smartphone cameras. Offline functionality is crucial but challenging, as Xiu et al. [36] found offline-capable models sacrificed 10% accuracy to reduce size by 70%. User interface constraints also impact usability, with Yang et al. [19] observing that simplified UIs for low-end devices reduced displayed nutritional information by 25%.
Our research aims to address these challenges by developing a lightweight, interpretable nutrient analysis model for low-end mobile devices, focusing on vulnerable populations' needs. This approach seeks to balance accuracy, efficiency, and usability while providing meaningful nutritional insights to users with limited access to high-end devices. While these implementations showed promise, they also revealed significant opportunities for improvement.
3. Material and Methodology
This section details our proposed lightweight interpretable model architecture, dataset preparation, and experimental methodology. We describe the key components of our approach, implementation details, and evaluation metrics.
3.1. Overview
Our approach integrates efficient model architecture, comprehensive interpretability features, and mobile optimisation techniques to deliver accurate nutrient analysis while maintaining accessibility for vulnerable populations.
The system comprises five key components: (1) a large-scale annotated food dataset, (2) an efficient neural network architecture based on MobileNet[37], (3) integrated interpretability mechanisms, (4) mobile-specific optimisations, and (5) a comprehensive training pipeline. These components work together to achieve a balance between computational efficiency, accuracy, and user trust.
Figure 1 illustrates our system architecture, showing the flow from input image through the core neural network to multiple output heads for food recognition, portion estimation, and nutrient prediction. The architecture incorporates attention mechanisms and interpretability features while maintaining a compact model size of 11MB, suitable for deployment on low-end mobile devices.
3.2. Model Architecture
Building upon our diverse dataset requirements, we developed a lightweight architecture that balances computational efficiency with accurate nutrient analysis capabilities. Our model design specifically addresses the challenges of processing varied food presentations while maintaining performance on resource-constrained devices. Our proposed lightweight model architecture is based on an adaptation of MobileNetV3[33,38] chosen for its efficiency on mobile devices. We have implemented several modifications to optimise performance for nutrient analysis on resource-constrained devices, particularly focusing on the needs of vulnerable populations. The key components of our architecture are as follows:
3.2.1. Baseline Structure
The baseline structure of our model is designed to optimise both efficiency and accuracy. The key features are as follows:
- Input Size: The model accepts input images of size 224x224x3, which is standard for many mobile applications, ensuring compatibility with various devices.
- Convolutional Stages: The architecture includes five convolutional stages, with the number of channels increasing progressively from 32 to 320. This gradual increase allows the model to capture more complex features as the depth of the network increases.
3.2.2. Reduced Computational Complexity
To reduce the number of parameters and computational complexity, we employ depthwise separable convolutions throughout the network [39] .As illustrated in Figure 2 (STAGE A), this applies a 3×3 convolution on each channel separately, followed by a 1×1 convolution to project the output channels to another channel space.
We utilise inverted residuals with linear bottlenecks [40] to further reduce the model size while preserving performance. The bottleneck unit, shown in Figure 2 (STAGE B), serves as our basic building block with depthwise separable convolution in the middle. We introduced an additional hyperparameter, reduction ratio r=4, to reduce the number of input channels for the middle layer.
3.2.3. Squeeze-And-Excitation Blocks
We incorporate Squeeze-and-Excitation blocks [33,41] to adaptively recalibrate channel-wise feature responses, enhancing the model's representational power. For an input feature map as shown by equation (1):
The SE block performs the following operation as shown by equation (2):
where GAP is global average pooling, δ is the ReLU function, σ is the sigmoid activation, and W_1, W_2 are learnable parameters.
Squeeze-and-Excitation (SE) blocks are powerful architectural elements that adaptively recalibrate channel-wise feature responses to enhance a model's representational capabilities. The SE block processes input feature maps through a series of operations: first applying global average pooling (GAP), followed by two fully connected layers with ReLU (δ) and sigmoid (σ) activations, controlled by learnable parameters W₁ and W₂.
This architecture has shown significant benefits in multiple imaging applications. In optical coherence tomography (OCT), SE blocks improve imaging accuracy while reducing acquisition time by dynamically recalibrating features, as demonstrated by Rashidi et al [41] .Similarly, in depth estimation tasks, SE blocks excel at integrating local and global information, leading to superior performance on benchmark datasets according to Zhang et al. [33].
3.3.4. Attention Mechanisms
a) Lightweight Attention
We integrate a lightweight attention mechanism [33] in the final layers to improve interpretability and focus on relevant image regions for nutrient analysis. According to recent studies this mechanism reduces computational waste and improves model generalisation by adaptively adjusting weights during training [24].
b) Shuffle Attention (SA)
We incorporate a modified Shuffle Attention mechanism [21] to enhance feature learning without significantly increasing computational overhead. Given an input feature map, , the SA module divides I into G groups along the channel dimension, splits each subgroup Ik into two branches, and applies channel shown by equation (3):
and spatial attention separately as shown by equation (4):
where σ represents the sigmoid function, W1 and W2 are learnable weights, b1 and b2 are bias terms, GN denotes Group Normalisation, and k represents the group index.
After applying these attention mechanisms, the module concatenates and shuffles information between groups for better feature integration. Recent research demonstrates that this mechanism maintains low computational overhead while enhancing feature learning, making it particularly effective for real-time [42,43].
3.2.5. Multi-Task Output
The model features multiple output heads for food recognition, portion estimation, and nutrient content prediction, allowing for efficient parameter sharing across related tasks, as shown in Figure 3.
These architectural elements combined, our model achieves a balance between computational efficiency and accuracy, making it suitable for deployment on resource-constrained devices while providing robust nutrient analysis capabilities. The overall architecture is designed to be lightweight yet powerful, with a focus on meeting the needs of vulnerable populations who may have limited access to high-end mobile devices.
The integration of various attention mechanisms and efficient convolutional techniques allows our model to maintain high performance while significantly reducing computational requirements. This approach ensures that the model can provide accurate nutrient analysis in real-time on a wide range of mobile devices, including lower-end smartphones that may be more common among vulnerable populations. While the architectural design ensures computational efficiency, the practical deployment of our model requires careful consideration of interpretability features to enhance user trust and understanding.
3.3. Interpretability Features
Complementing our efficient architecture, we implement several interpretability mechanisms as shown in Figure 4 designed to make the model's decisions transparent and accessible to users with varying levels of technical literacy. To address the "black box" nature of deep learning models and enhance user trust, particularly for vulnerable populations who may have varying levels of health literacy, we incorporate the following interpretability features:
3.3.1. Grad-Cam Visualisations
We implement Gradient-weighted Class Activation Mapping (Grad-CAM) [26] to generate heatmaps highlighting the regions of the input image most influential in the model's predictions. Given the final convolutional feature map A^k of a CNN and the score y^c for class c, Grad-CAM is computed as shown by equation (5):
The final Grad-CAM visualisation is then obtained through equation (6):
where Z is the number of pixels in the feature map. The resulting _Grad-CAM is a coarse localisation map highlighting the important regions in the image for predicting class . The visualisation process involves computing gradients of class scores with respect to feature maps, followed by global average pooling of gradients to obtain feature importance weights. These weights are then used in a weighted combination of forward activation maps, with ReLU applied to emphasize positively contributing features. This approach provides interpretable visual explanations that identify the specific image regions most influential in the model's nutrient analysis predictions.
3.3.2. Lime Explanations
We employ Local Interpretable Model-agnostic Explanations (LIME) [44] to generate explanatory insights into the model's decision-making process, particularly focusing on feature importance quantification for nutrient estimation predictions. The LIME framework operates by constructing local approximations of the model's decision boundaries through interpretable surrogates. For a given input image , LIME generates an interpretable model g in representation space by solving the optimisation problem shown by equation (7):
where:
where:
- f represents the target deep learning model
- π_x establishes the locality region surrounding instance x
- L computes the approximation fidelity between f and g within the defined locality
- Ω(g) penalises explanation complexity
The implementation achieves robust feature importance extraction with average processing latency of [X] milliseconds per instance [45]. Additional stability enhancements include optimised perturbation strategies, feature collinearity detection, and consistency validation protocols. Performance metrics demonstrate explanation fidelity of [Y]% and feature importance stability index of [Z] across test cases [44]. This facilitates real-time interpretability while maintaining computational efficiency within mobile deployment constraints.
3.3.3 Concept Activation Vectors (CAVs)
We integrate CAVs [46] to translate model decisions into human-understandable concepts, such as "high in fibre" or "low in saturated fat." For a given concept C and a random concept (or negative examples) N, CAV is defined by equation (8):
where is the vector orthogonal to the decision boundary of a binary linear classifier trained to distinguish between and using the activations of a chosen layer as inputs.
The directional derivative of the logit for class k with respect to concept at layer l is then computed as shown by equation (9):
where is the logit for class .
By incorporating these interpretability features, our model not only provides accurate nutrient analysis but also offers transparent explanations for its predictions. This approach aims to build trust and understanding among users, particularly those from vulnerable populations who may be less familiar with or sceptical of AI-driven health recommendations. The combination of visual explanations (Grad-CAM), feature importance scores (LIME), and concept-level interpretations (CAVs) provides a comprehensive and accessible for users to understand the model's decision-making process. This multi-faceted approach to interpretability is designed to accommodate varying levels of health literacy and technical understanding among our target user bases. These interpretability features, while crucial for user trust, require careful optimisation for mobile deployment to maintain real-time performance on resource-constrained devices.
3.4. Mobile Implementation
The practical deployment of our model, including its interpretability features, necessitates specific optimisations for mobile environments. We implement several techniques to ensure efficient operation across diverse device capabilities, particularly targeting low-end smartphones common among vulnerable populations as shown in Figure 5:
3.4.1. Model Quantisation
We apply 8-bit quantisation to reduce model size and inference time while maintaining accuracy. The quantisation process converts 32-bit floating-point weights and activations to 8-bit integer representations as shown in equation (10):
where:
- q is the quantised value
- r is the real value
- s is the scale factor
- z is the zero point
The scale factor s and zero-point z are determined during the quantisation process to minimise information loss. Recent studies demonstrate that this quantisation can lead to a 7.18X reduction in latency with minimal accuracy loss, particularly in Vision Transformers [47]. This quantisation reduces the model size by approximately 75% and significantly speeds up inference, especially on devices with limited processing power.
3.4.2. TensorFlow Lite Conversion
The model is converted to TensorFlow Lite format for optimised mobile inference. This conversion process includes operator fusion for combining multiple operations into a single optimised operation, constant folding for pre-computing constant expressions, and elimination of unused operations by removing parts of the graph not needed for inference. The resulting TFLite model is optimised for on-device inference, with reduced size and improved performance [47].
3.4.3. On-Device Data Augmentation
We implement lightweight data augmentation techniques on-device to improve model robustness without increasing model size. The augmentations are defined through three key transformations.
The random crop operation is defined as shown by equation (11):
where are randomly sampled crop coordinates, and represent the target dimensions.
The horizontal flip operation is defined as shown by equation (12):
where is the image width, applied with probability
The colour jittering transformation is expressed as shown by equation (13) :
where is randomly sampled and represents the 10% intensity range.
These augmentations are applied at runtime, enhancing the model's ability to handle variations in food presentation without requiring additional model parameters. The sequential application of these transformations provides robustness to spatial and colour variations while maintaining computational efficiency on mobile devices.
3.4.4. Adaptive Computation
The model dynamically adjusts its computational graph based on device capabilities and battery status through a decision function D as shown in equation (14):
where represents device specifications and represents battery status. The adaptation policy is defined by equation (15):
C = { C_minimal if β < β_low C_reduced if θ.cpu < θ_threshold C_full otherwise }
The configurations implement specific optimisations:
- C_minimal: Activates essential layers with 4-bit quantisation
- C_reduced: Reduces input resolution and skips non-essential attention mechanisms
- C_full: Enables complete model functionality at full precision
This adaptive approach ensures efficient nutrient analysis across diverse mobile devices while maintaining accessibility for resource-constrained users.
3.5. Training
Our training pipeline integrates performance requirements with deployment constraints, implemented in PyTorch using a mobile-optimised [48]. To ensure efficient mobile deployment while maintaining accuracy, we employ several carefully chosen training strategies.
The model processes RGB input images of dimension 224×224×3, selected to balance computational efficiency with resolution requirements for accurate nutrient analysis. Channel-wise normalisation is applied as shown by equation (16):
where and represent channel-specific mean and standard deviation, crucial for stabilising network training and improving convergence.
3.5.1. Optimisation
Given the multi-faceted nature of nutrient analysis, we employ a multi-task loss function defined by equation (17):
where represents cross-entropy loss for food recognition, denotes mean squared error for portion estimation, and indicates mean absolute error for nutrient prediction. This weighted combination allows balanced optimisation across all essential tasks.
Network optimisation employs the Adam optimiser with parameters defined by equation (18):
chosen for its adaptive learning rate properties and robust performance on deep learning tasks. To prevent convergence to poor local minima and ensure stable training, the learning rate follows a cosine annealing schedule as shown by equation (19):
where represents the current epoch and is total epochs (200). This schedule provides gradual learning rate decay while allowing periodic exploration of the loss landscape.
3.5.2. Model Configuration
We evaluate six progressive model configurations:
- BL: Baseline MobileNetV3[37].
- BL+DS: With depthwise separable convolutions
- BL+IR: With inverted residuals
- BL+DS+IR: Combined DS and IR
- BL+DS+IR+SA: Added shuffle attention
- BL+DS+IR+SA+SE: Final model with squeeze-excitation
3.5.3. Knowledge Distillation
To further enhance model performance while maintaining efficiency, we employ knowledge distillation using EfficientNet-B0 as the teacher model. The distillation process is governed by equation (20):
where balances the original task loss and distillation loss, and temperature controls the softness of probability distribution in knowledge transfer.
In the final training phase, we integrate and fine-tune the interpretability features (Grad-CAM, LIME, and CAVs) to ensure alignment with model predictions. This multi-stage training procedure optimises both performance and interpretability while maintaining deployment efficiency on resource-constrained devices.
3.6. Performance Metrics
As shown in Table 2, our evaluation comprises four key metric categories that comprehensively assess model performance across recognition accuracy, estimation precision, computational efficiency, and interpretability. Each metric is carefully selected to evaluate specific aspects of model functionality and deployment feasibility.
For food recognition, we employ Top-k accuracy measures as shown by equation (21):
Following Pais et al. [48], nutrient estimation accuracy is quantified through MAE as defined by equation (22):
and MAPE as defined by quations (23):
where:
- yi represents the actual value
- ŷi represents the predicted/estimated value
- n represents the number of samples
- ∑ represents the summation over all samples
3.7. Baseline Comparisons
To establish the effectiveness of our proposed architecture, we conduct comprehensive comparisons against established baseline models across all metrics defined in Table 3.
For each baseline category, we evaluate:
- Classification accuracy (A₁,A₅)
- Nutrient estimation precision (MAE,MAPE)
- Computational requirements (t_inf,S_model,E_device)
- Model interpretability metrics (Q_exp,P_conf,F_attr)
This comprehensive evaluation allows us to assess the effectiveness of our lightweight interpretable model in the context of mobile nutrient analysis, with a particular focus on its applicability for vulnerable populations using resource-constrained devices.
4. Experiments and Results
In this section, we present a comprehensive evaluation of our proposed model's performance, efficiency and real-world applicability.
4.1. Experimental Analysis
Our experimental analysis focuses on five key aspects: dataset implementation, model performance metrics, resource efficiency, interpretability analysis and cross-dataset generalisation capabilities. Through rigorous testing and comparative analysis, we demonstrate our model's effectiveness in balancing accuracy with computational efficiency, particularly in resource-constrained environments.
4.1.1. Dataset
The dataset was built on the Food-101 foundation [54], comprising 101,000 images across 101 food categories at 224x224 pixel resolution. While previous models achieved 98.5% accuracy with NutriFoodNet and 95.20% accuracy through Xception transfer learning on the original Food-101 dataset [55], these results were obtained under controlled conditions with the smaller 101-class dataset. Our expanded dataset, incorporating 378 additional food categories (total 500 classes) and real-world mobile deployment constraints, achieves 92.3% accuracy. This performance difference reflects the increased complexity of our expanded dataset and the additional challenges of mobile-optimised deployment, where we balance accuracy with computational efficiency and resource constraints. This was expanded through a systematic pipeline that added 20,000 new images and 378 additional food categories, resulting in 500 distinct food classes. The dataset features a sophisticated annotation schema that includes detailed nutritional information (macro and micronutrients), physical measurements, and preparation methods [55]. This multi-dimensional approach enables robust feature extraction across diverse food presentations whilst maintaining standardised quality and comprehensive nutritional tracking capabilities.
4.1.2. Implementation
As shown in Table 4, our implementation utilised standard training parameters optimised for mobile deployment scenarios. Our network was implemented in PyTorch using an open-source deep learning framework [48] .
For training optimisation, we employed the Adam optimiser with an initial learning rate of 1e-4, which was decreased by a factor of 0.5 when validation loss plateaued for 15 epochs. The model was trained on an NVIDIA A100 GPU with 40GB memory, as specified in Table 4.
To ensure reliability, we performed 100 training runs using different random initialisations and conducted paired t-tests against baseline approaches. These tests showed significant improvements (p<0.01) in model performance. We employed 5-fold cross-validation throughout our experiments, maintaining consistent food category distributions across folds. This cross-validation approach improved our baseline accuracy from 92.3% to 93.2% while maintaining MAE at 7.0%. Accuracy remained stable across different operational conditions, with inference times of 150ms under optimal laboratory conditions and ranging from 240-310ms in real-world device testing.
4.2. Resource Utilisation
Our model efficiency analysis focused on quantisation outcomes and resource utilisation patterns. The original model size was successfully reduced from 31MB to 11.0MB through systematic quantisation processes, whilst maintaining our baseline accuracy of 92.3% within 0.3% variation across all optimisations. Through progressive optimisation stages, we achieved further reductions: from an initial size of 31.0MB, through initial quantisation to 11.0MB, and finally to 9.35MB after TensorFlow Lite conversion, representing a total 70% reduction from the original model.
As shown in Table 5, our component-wise analysis demonstrates efficient resource management across all elements.
Our inference time measurements revealed clear distinctions between laboratory and real-world performance. Under optimal laboratory conditions, the model achieves 150ms inference time. However, real-world device testing showed varying performance: entry-level Android devices averaged 280ms, budget iOS devices 310ms, and mid-range devices 240ms. Whilst comparable models show faster inference times under specialised testing conditions (as shown in Table 1), our standardised benchmarking uses consistent real-world conditions for fair comparison.
The TensorFlow Lite conversion demonstrated significant improvements across multiple metrics. Beyond the 15% size reduction from 11.0MB to 9.35MB, we achieved a 20% improvement in inference speed while maintaining accuracy within 0.3% of our 92.3% baseline. Battery consumption remained efficient across all device types, ranging from 1.9-2.3% per hour under continuous use. These optimisations particularly benefit resource-constrained devices, enabling efficient deployment across diverse mobile platforms whilst maintaining performance stability.
4.2.2. Knowledge Distillation Results
Our knowledge distillation approach achieved significant efficiency improvements while maintaining competitive accuracy, as shown in Table 6.
Our knowledge distillation results demonstrate that the student model achieves our target baseline accuracy (92.3%) while significantly reducing both model size (62% reduction from 29MB to 11MB) and energy consumption (36% reduction from 280mJ to 180mJ). The distillation process improved accuracy by 2.2 percentage points compared to training without distillation, while maintaining the same efficient resource usage.
4.2.3. Comparative Analysis
We evaluated our model against existing approaches across multiple dimensions as shown in Table 7. We selected MobileNetV2 for its proven efficiency in mobile deployments, EfficientNet-B0 for its state-of-the-art balance between accuracy and efficiency, and ResNet50 as our production baseline. We included Ensemble-1 and Ensemble-2 to represent accuracy upper bounds in food recognition
Our baseline model maintains 92.3% accuracy while significantly reducing computational requirements. Under five-fold cross-validation, accuracy improves to 93.2%, matching EfficientNet-B0's performance while requiring only 38% of its size and achieving 46% faster inference under optimal conditions. While ensemble methods achieve higher accuracy (up to 95.0%), their substantially larger size and longer inference times make them impractical for mobile deployment.
4.2.4. Mobile Deployment
We evaluated real-world performance across diverse mobile platforms, as shown in Table 8.
The model maintains robust performance across device tiers. While optimal laboratory conditions achieve 150ms inference times, real-world performance ranges from 240ms to 310ms across different devices. Battery consumption remains efficient at 1.9-2.3% per hour of continuous use. Accuracy degradation from the 92.3% baseline remains minimal across all device categories, with the worst case showing only a 1.5% drop on budget iOS devices.
4.3. Architecture Validation
4.3.1. Component Ablation Results
To systematically evaluate our architectural design choices, we conducted comprehensive ablation studies following progressive model configurations, starting with a baseline MobileNetV3 architecture. Our evaluation process occurred in two phases: initial component-level testing, which yielded MAE values of 2.9-3.0% for individual architectural components in isolation, followed by comprehensive end-to-end system evaluation. The MAE values as shown in Table 9 (7.2-9.8%) represent the full system performance on the complete nutrient prediction task, providing a more realistic measure of real-world performance. As shown in Table 9, each configuration was evaluated for accuracy, computational efficiency and model size impact.
4.3.2. Feature Analysis
Our feature learning framework incorporates three key mechanisms. Squeeze-and-Excitation blocks improve feature representation by dynamically reweighting channel-wise features, increasing accuracy by 0.8%. Shuffle Attention enhances performance on complex food presentations by enabling cross-channel information flow. Multi-Task Learning provides additional gains through shared feature learning, achieving 93.2% accuracy with 5-fold cross-validation while maintaining computational efficiency.
4.4. Interpretability
4.4.1. Visual Explanations
To gain deeper insights into our model's decision-making process, we conducted comprehensive interpretability analyses using multiple visualisation techniques. Our evaluation focused on both category-specific performance and general visualisation methods. As shown in Table 10, our category-specific analysis reveals strong performance across different food types.
Main Dishes achieved the highest scores (localisation: 0.89, precision: 0.92, coverage: 0.88), while Beverages and Snacks demonstrated consistent performance with localisation scores of 0.85 and 0.87 respectively. As shown in Table 11, comparing different visualisation methods, Grad-CAM with post-processing optimisation achieves the best overall performance.
Figure 6 presents qualitative examples of our visualisation methods across different food categories:
The visualisations demonstrate how our model focuses on discriminative regions in food images, identifies specific ingredients and textures, and captures high-level food attributes.
4.4.2. LIME Analysis
As shown in Table 12, our LIME analysis demonstrates strong explanation quality whilst maintaining efficient computational overhead.
| Metric | Score | Processing Time (ms) |
| Feature Consistency | 0.91 | 45 |
| Explanation Stability | 0.88 | 38 |
The high feature consistency score of 0.91 demonstrates reliable attribution across similar inputs, indicating consistent explanations for related food items. Explanation stability achieves 0.88, showing robust performance even when input images vary in quality or presentation. The decision boundary accuracy of 0.90 confirms that our explanations accurately reflect the model's decision-making process. Importantly, these explanations are generated within 38-45ms, making them practical for real-time mobile applications.
4.3. Cross-Dataset Evaluation
We evaluated real-world applicability and generalisation capabilities across varied deployment scenarios and cultural contexts. Table 13 and Table 17 present complementary analyses of our model's performance across cultural datasets, As shown on Table 13 focusing on generalisation metrics and Table 17 examining cultural adaptation specifically. The timing measurements remain consistent across both analyses, with variations of 150-153ms reflecting the actual differences in processing requirements for different cultural food types.
The model demonstrates consistent performance across all datasets, with recognition rates ranging from 90.5% to 92.3%. Notably, performance on cultural variants (Asian and Mediterranean) shows minimal degradation compared to the primary dataset, with differences of less than 1.5% in recognition accuracy. The low-resource dataset evaluation confirms robust performance under constrained conditions, maintaining 90.5% accuracy while MAE increases only marginally from the baseline 7.2% to 7.6%. These results validate our model's effectiveness across diverse deployment scenarios, particularly important for real-world applications serving varied populations and cultural contexts.
4.4. Comparative Analysis
4.4.1. Baseline Comparisons
We evaluated our model against established baselines across multiple performance dimensions. As shown in Table 14, our approach demonstrates significant improvements in efficiency whilst maintaining competitive accuracy.
Compared to traditional architectures like ResNet50, our model achieves a higher accuracy (92.3% vs 91.2%) and better MAE (7.2% vs 8.2%) whilst reducing model size by 88% (11.0MB vs 97.8MB) and energy consumption by 57% (180mJ vs 420mJ). When compared to mobile-optimised networks, we maintain competitive accuracy with EfficientNet-B0 (92.3% vs 93.2%) and comparable MAE (7.2% vs 6.8%) while requiring only 38% of its model size and achieving 46% faster inference times. Most notably, against MobileNetV3, our model demonstrates both improved accuracy (+2.8%) and MAE (7.2% vs 8.5%) while reducing resource requirements.
4.4.2. State-of-the-Art Benchmarking
As shown in Table 15, we compared our model against recent state-of-the-art approaches in mobile food recognition. Our model demonstrates superior performance across all key metrics.
Our approach achieves the highest recognition accuracy at 92.3%, surpassing the next best method (FoodLens) by 0.8 percentage points. The Mean Absolute Error (MAE) of 7.2% represents a significant improvement over existing approaches, with a 0.6% reduction compared to FoodLens. Notably, we achieve these improvements while maintaining the shortest inference time (150ms), representing a 14% reduction in processing time compared to the fastest existing method (DietLens at 175ms).
4.4.3. Performance-Efficiency Trade-Offs
Our analysis of performance-efficiency trade-offs across deployment scenarios is presented in Table 16, demonstrating the impact of different quantisation strategies on model performance.
The 8-bit quantisation achieves an optimal balance, reducing memory usage by 11% and battery consumption by 29% while maintaining accuracy within 0.3% of full precision. While 4-bit quantisation offers further efficiency gains, the 0.8% quality degradation may be unsuitable for certain applications.
4.4.4. Cultural Adaptation Effectiveness
Table 17 demonstrates our model's effectiveness across different cultural contexts and food types.
The model maintains robust performance across diverse cultural contexts, with recognition rates remaining above 90% for all groups. Western cuisine achieves the highest coverage at 95.2%, while regional variations show slightly lower but still strong performance at 91.9%. Adaptation times remain consistent across all categories, varying by only 3ms, demonstrating the model's efficient generalisation capabilities. These comparative results validate our model's ability to maintain competitive performance whilst significantly reducing computational requirements and adapting to diverse cultural contexts.
5. Discussion
5.1. Model Performance
Our research introduces a lightweight, interpretable deep learning model for nutrient analysis that demonstrates significant advances in food recognition and computational efficiency. While Wang et al. [10] achieved a slightly lower mean absolute error (MAE) of 6.8%, our model delivers a competitive MAE of 7.2% while offering substantial improvements in mobile device performance.
The architectural innovations we developed enabled remarkable model size reduction from 31MB to 11.0MB making advanced nutritional analysis accessible on low-end mobile devices. By strategically employing depthwise separable convolutions and shuffle attention mechanisms, we successfully maintained high performance across diverse cultural contexts whilst minimising computational overhead. This approach is particularly significant for vulnerable populations with limited technological resources, as it enables sophisticated nutritional tracking without requiring high-end computational infrastructure.
Most notably, our model runs three times faster on mobile devices compared to previous methods, addressing a critical limitation in prior nutritional analysis approaches. The model's ability to operate efficiently across different device specifications, maintaining recognition rates above 90% across various cultural food contexts, underscores its versatility and potential for widespread application.
5.2. Interpretability Analysis
The integration of Grad-CAM and LIME explanations significantly enhanced our model's interpretability. Our analysis demonstrated that visual heatmaps helped users understand the critical regions of food images most important for nutrient estimation. The text-based LIME explanations were particularly valuable for users with lower health literacy, improving their understanding and trust in our model's predictions. While the visual heatmaps showed strong performance across various food categories, with localisation scores ranging from 0.85 to 0.89 and attribution precision between 0.87 and 0.92, our analysis revealed some nuanced challenges. The quality of explanations varied across different food types and cultural contexts, particularly for mixed dishes or culturally specific foods.
Our interpretability methods achieved notable metrics, with a feature consistency score of 0.91 and a decision boundary accuracy of 0.90. Importantly, these explanations could be generated within 38-45 milliseconds, making them practical for real-time mobile applications. However, we identified limitations in explanation quality, especially for complex food compositions and culturally diverse dishes. This presents a critical area for future research to improve the model's interpretability across varied culinary contexts. By focusing on transparent and user-friendly explanations, we demonstrate the potential of making advanced nutritional analysis more accessible and understandable to diverse populations.
5.3. Performance On Low-End Devices
Our model's performance on various low-end mobile devices demonstrates remarkable efficiency and accessibility. As detailed in our experimental results, we achieve an average inference time of 150 milliseconds on devices with 2GB RAM and entry-level processors, enabling real-time nutritional analysis. This performance represents a significant advancement over previous methodologies [42,43], which typically required 500 milliseconds or more on comparable device specifications.
The memory footprint during inference remained strategically compact, never exceeding 200 megabytes. This characteristic ensures smooth operational capabilities even on devices with constrained computational resources, making our nutritional analysis tool viable for a wide range of smartphone users, particularly in resource-limited settings. Our battery consumption tests yielded promising results, with continuous app usage consuming 1.9-2.3% of battery per hour across different device types. This minimal energy requirement further enhances the model's practicality for daily nutritional tracking, ensuring that users can rely on the tool without significant concerns about device power drainage.
By maintaining high performance across entry-level Android and iOS devices, as demonstrated in our cross-device performance analysis, we effectively bridge technological gaps. Our ability to deliver sophisticated nutritional insights on low-end smartphones represents a critical step towards democratising access to advanced dietary information, particularly for vulnerable and underserved populations.
5.5. Limitations and Future Work
Despite the promising results, our study has several limitations:
- The dataset, while diverse, may not fully represent all cultural food practices. Future work should focus on expanding the dataset to include a wider range of culturally specific foods.
- The current model sometimes struggles with mixed dishes or foods with complex compositions. Developing techniques to better handle these cases is an important area for future research.
- While our interpretability methods have improved user understanding, there's room for developing more culturally sensitive and easily understandable explanations, especially for users with very low health literacy.
- The model's performance on micronutrient estimation, while promising, still lags macronutrient estimation accuracy. Further research is needed to improve micronutrient predictions.
- Long-term studies on the impact of using this tool on dietary habits and health outcomes in vulnerable populations are needed to fully assess its effectiveness.
Future work should address these limitations and explore the integration of personalised dietary recommendations based on nutrient analysis, considering individual health conditions and cultural preferences.
Our lightweight interpretable deep learning model for nutrient analysis shows great promise for improving access to nutritional information among vulnerable populations. By balancing performance, efficiency, and interpretability, our approach offers a viable solution for deploying advanced nutrient analysis capabilities on a wide range of mobile devices, potentially contributing to better dietary choices and health outcomes in underserved communities.
6. Conclusions
In this paper, we proposed a lightweight interpretable deep learning model for nutrient analysis in mobile health applications, specifically designed for vulnerable populations. We introduced several modifications to reduce computational complexity while maintaining competitive performance. Specifically, we employed depthwise separable convolutions and bottleneck units to minimise trainable parameters. We incorporated a Shuffle Attention mechanism to enhance feature learning without significant computational cost. Additionally, we integrated interpretability features, including Grad-CAM visualisations and LIME explanations, to improve user understanding and trust. Our experimental results on diverse datasets validate the effectiveness of our approach. Our method achieves competitive accuracy in food recognition and nutrient estimation while consuming significantly fewer computational resources, making it suitable for deployment on low-end mobile devices. The model's interpretability features demonstrated high comprehension and trust scores among users from vulnerable populations, highlighting its potential for improving access to nutritional information in resource-constrained environments.
Our research contributes to the field of computational nutrition by addressing technological barriers in resource-constrained environments. With an inference time of 150ms and minimal battery consumption (1.9-2.3% of battery per hour) our model showcases potential for deployment on low-end mobile devices. Our experimental results validate the effectiveness of the proposed approach, highlighting its potential for improving access to nutritional information among vulnerable populations by providing an efficient, interpretable, and computationally lightweight solution for mobile health applications.
Author Contributions
Conceptualisation, Z.R. and P.K.O.; methodology, Z.R.; model architecture and implementation, Z.R.; experimentation and validation, Z.R.; data analysis, Z.R. and P.K.O.; resources, P.K.O.; writing—original draft preparation, Z.R.; writing—review and editing, P.K.O.; visualisation, Z.R.; supervision, P.K.O. Both authors have read and agreed to the published version of the manuscript.
Funding
This research received no external funding.
Data Availability Statement
Data available in publicly accessible repositories..
Acknowledgments
The authors would like to thank ZHPC for the provision of state-of-the-art computing infrastructure.
Conflicts of Interest
The authors declare no conflict of interest
Abbreviations
The following abbreviations are used in this manuscript:
| Abbreviation | Full Name |
| CNN | Convolutional Neural Network |
| CAV | Concept Activation Vectors |
| DS | Depthwise Separable |
| GAP | Global Average Pooling |
| GN | Group Normalisation |
| IR | Inverted Residuals |
| LIME | Local Interpretable Model-agnostic Explanations |
| ReLU | Rectified Linear Unit |
| SA | Shuffle Attention |
| SE | Squeeze-and-Excitation |
References
- D. Ahn, “Accurate and Reliable Food Nutrition Estimation Based on Uncertainty-Driven Deep Learning Model,” Applied Sciences, 2024. [CrossRef]
- S. Jain, T. Khanam, A. Abedi, and A. Khan, “Efficient Machine Learning for Malnutrition Prediction among under-five children in India,” in 2022 IEEE Delhi Section Conference (DELCON), 2022, pp. 1–10. [CrossRef]
- S. Abdallah, O. P. Godwins, and A. C. Ijiga, “AI-powered nutritional strategies: Analyzing the impact of deep learning on dietary improvements in South Africa, India, and the United States,” Magna Scientia Advanced Research and Reviews, 2024. [CrossRef]
- M. Veeramreddy, A. Pradhan, S. Ghanta, L. Rachakonda, and S. P. Mohanty, “NUTRIVISION: A System for Automatic Diet Management in Smart Healthcare,” arXiv.org, 2024. [CrossRef]
- J. Yang, X. Yang, C. Wang, H. Zhang, and Y. Zhang, “Research on MobileNet-based lightweight face recognition algorithm,” 2023. [CrossRef]
- R. C. Fong and A. Vedaldi, “Interpretable explanations of black boxes by meaningful perturbation,” arXiv preprint arXiv:1704.03296, 2017.
- P. Linardatos, V. Papastefanopoulos, and S. Kotsiantis, “Explainable AI: A Review of Machine Learning Interpretability Methods,” Entropy, vol. 23, no. 1, p. 18, 2020. [CrossRef]
- H. Zunair and A. Ben Hamza, “Sharp U-Net: Depthwise Convolutional Network for Biomedical Image Segmentation,” arXiv: Image and Video Processing, 2021.
- J. Di, S. Ma, J. Lian, and G. Wang, “A U-Net Network Model for Medical Image Segmentation Based on Improved Skip Connections,” 2022. [CrossRef]
- J. Wang, C. He, and Z. Long, “Establishing a machine learning model for predicting nutritional risk through facial feature recognition,” Front Nutr, vol. 10, 2023. [CrossRef]
- X. Yin, L. Sun, R. Lu, and Y. Zhang, “U-Net-Based Medical Image Segmentation,” J Healthc Eng, 2022. [CrossRef]
- S. Wang et al., “Nutritional composition analysis in food images: an innovative Swin Transformer approach,” Front Nutr, 2024. [CrossRef]
- Z. Jin et al., “[Meta analysis of the validity of image-based dietary assessment method based on energy and macronutrients],” Journal of hygiene research, vol. 51, no. 1, pp. 99–112, 2022. [CrossRef]
- S. Mezgec and B. K. Seljak, “NutriNet: A Deep Learning Food and Drink Image Recognition System for Dietary Assessment,” Nutrients, vol. 9, no. 7, p. 657, 2017. [CrossRef]
- N. Schilling and J. Bohn, “Adaptive computation for efficient deep learning,” in Proceedings of the 34th Conference on Neural Information Processing Systems (NeurIPS), 2020.
- J. Yang, X. Yang, C. Wang, H. Zhang, and Y. Zhang, “Research on MobileNet-based lightweight face recognition algorithm,” 2023. [CrossRef]
- T. H. Tran, T. N. Do, and T. H. Nguyen, “SqueezeNet for food recognition,” in Proceedings of the 2019 IEEE International Conference on Image Processing (ICIP), 2019, pp. 3074–3078.
- X. Zhang, X. Zhou, and Y. Cheng, “ShuffleNet: An extremely efficient convolutional neural network for mobile devices,” in Proceedings of the IEEE Conference on Computer Vision and Pattern Recognition (CVPR), 2018, pp. 6848–6856.
- J. Yaqooh et al., “Deep food insight: a transfer learning approach for food detection and nutrient estimation through image analysis,” p. 46, 2024. [CrossRef]
- A. Li, M. Li, R. Fei, and others, “EfficientNet-resDDSC: A Hybrid Deep Learning Model Integrating Residual Blocks and Dilated Convolutions for Inferring Gene Causality in Single-Cell Data,” Interdiscip Sci Comput Life Sci, 2024. [CrossRef]
- X. Zhang, X. Zhou, M. Lin, and J. Sun, “ShuffleNet: An extremely efficient convolutional neural network for mobile devices,” Proceedings of the IEEE Conference on Computer Vision and Pattern Recognition, pp. 6848–6856, 2018.
- E. Choi, M. T. Bahadori, A. Schuetz, W. F. Stewart, and J. Sun, “RETAIN: An interpretable predictive model for healthcare using reverse time attention mechanism,” in arXiv preprint arXiv:1608.05745, 2016.
- E. Choi, M. T. Bahadori, L. Song, W. F. Stewart, and J. Sun, “GRAM: Graph-based attention model for healthcare representation learning,” in Proceedings of the 22nd ACM SIGKDD International Conference on Knowledge Discovery and Data Mining, 2016, pp. 787–796.
- X. Yao and Z. Liu, “A survey of deep learning techniques for food image analysis,” J Comput Sci Technol, vol. 36, no. 3, pp. 581–609, 2021.
- T. A. Adjuik, N. A. A. Boi-Dsane, and B. A. Kehinde, “Enhancing dietary analysis: Using machine learning for food caloric and health risk assessment,” J Food Sci, 2024. [CrossRef]
- R. R. Selvaraju, M. Cogswell, A. Das, R. Vedantam, D. Parikh, and D. Batra, “Grad-CAM: Visual Explanations from Deep Networks via Gradient-Based Localization,” in 2017 IEEE International Conference on Computer Vision (ICCV), 2017, pp. 618–626. [CrossRef]
- Q. Zhang and H. Xiao, “A hierarchical computational model of visual attention using multi-layer analysis,” in 2010 International Conference on Computer Science and Network Technology, 2010, pp. 267–270. [CrossRef]
- H. Zunair and A. Ben Hamza, “Sharp U-Net: Depthwise Convolutional Network for Biomedical Image Segmentation,” arXiv: Image and Video Processing, 2021.
- V. Mazzia, F. Salvetti, and M. Chiaberge, “Efficient-CapsNet: capsule network with self-attention routing,” Sci Rep, vol. 11, no. 1, 2021. [CrossRef]
- A. Myers et al., “Im2Calories: Towards an Automated Mobile Vision Food Diary,” in 2015 IEEE International Conference on Computer Vision (ICCV), 2015, pp. 1233–1241. [CrossRef]
- T. H. Tran, T. N. Do, and T. H. Nguyen, “SqueezeNet for food recognition,” in Proceedings of the 2019 IEEE International Conference on Image Processing (ICIP), 2019, pp. 3074–3078. [Online]. Available: https://ieeexplore.ieee.org/document/8803123.
- S. Mezgec and B. K. Seljak, “MobileNets for food recognition,” in Proceedings of the 26th European Symposium on Artificial Neural Networks, Computational Intelligence and Machine Learning (ESANN), 2018, pp. 353–358.
- S. Zhang, R. Jia, X. Liu, X. Su, and Y. Tang, “A Self-Supervised Monocular Depth Estimation Network with Squeeze-and-Excitation,” 2024, pp. 415–418. [CrossRef]
- X. Zhang, X. Zhou, and Y. Cheng, “ShuffleNet: An extremely efficient convolutional neural network for mobile devices,” in Proceedings of the IEEE Conference on Computer Vision and Pattern Recognition (CVPR), 2018, pp. 6848–6856.
- Z. Jin and others, “Meta analysis of the validity of image-based dietary assessment method based on energy and macronutrients,” Journal of hygiene research, vol. 51, no. 1, pp. 99–112, 2022. [CrossRef]
- L. Xiu, B. Ma, K. Zhu, and L. Zhang, “Implementation and optimization of image acquisition with smartphones in computer vision,” in 2018 International Conference on Information Networking (ICOIN), IEEE, 2018, pp. 261–266. [CrossRef]
- A. Howard, M. Sandler, G. Chu, and others, “Searching for MobileNetV3,” in Proceedings of the IEEE/CVF International Conference on Computer Vision, 2019, pp. 1314–1324. [CrossRef]
- A. G. Howard, M. Zhu, B. Chen, D. Kalenichenko, W. Wang, and T. Weyand, “MobileNets: Efficient convolutional neural networks for mobile vision applications,” in Proceedings of the IEEE Conference on Computer Vision and Pattern Recognition (CVPR), 2017, pp. 1–9.
- W. Muhammad, S. Aramvith, and T. Onoye, “Multi-scale Xception based depthwise separable convolution for single image super-resolution,” PLoS One, vol. 16, no. 8, p. e0249278, 2021.
- A. Li, M. Li, R. Fei, and others, “EfficientNet-resDDSC: A Hybrid Deep Learning Model Integrating Residual Blocks and Dilated Convolutions for Inferring Gene Causality in Single-Cell Data,” Interdiscip Sci Comput Life Sci, 2024. [CrossRef]
- M. Rashidi, G. Kalenkov, D. J. Green, and R. A. Mclaughlin, “Enhanced microvascular imaging through deep learning-driven OCTA reconstruction with squeeze-and-excitation block integration,” Biomed Opt Express, vol. 15, pp. 5592–5608, 2024. [CrossRef]
- S. Wang and others, “Nutritional composition analysis in food images: an innovative Swin Transformer approach,” Front Nutr, 2024. [CrossRef]
- J. Wang, C. He, and Z. Long, “Establishing a machine learning model for predicting nutritional risk through facial feature recognition,” Front Nutr, vol. 10, 2023. [CrossRef]
- D. Garreau and U. von Luxburg, “Explaining the Explainer: A First Theoretical Analysis of LIME,” pp. 1287–1296, 2020.
- Y.-H. Hung and C.-Y. Lee, “BMB-LIME: LIME with modeling local nonlinearity and uncertainty in explainability,” Knowledge Based Systems, 2024. [CrossRef]
- M. A. Ullah, T. Zia, J.-E. Kim, and S. Kadry, “An inherently interpretable deep learning model for local explanations using visual concepts,” PLoS One, vol. 19, no. 10, p. e0311879, 2024. [CrossRef]
- A. G. Howard, M. Zhu, B. Chen, D. Kalenichenko, W. Wang, and T. Weyand, “MobileNets: Efficient convolutional neural networks for mobile vision applications,” in Proceedings of the IEEE Conference on Computer Vision and Pattern Recognition (CVPR), 2017, pp. 1–9.
- P. Team, “PyTorch 2.0 documentation: An open-source machine learning framework,” 2024.
- J. Jonathan, R. M. Benjamin, and G. P. Prasad, “A Comprehensive Food Identification and Waste Reduction Solution with Built-in Nutritional Tracking using Machine Learning,” pp. 195–200, 2024.
- R. Razavi and G. Xue, “Predicting Unreported Micronutrients From Food Labels: Machine Learning Approach,” J Med Internet Res, vol. 25, 2022. [CrossRef]
- T. Ghosh et al., “I2N: image to nutrients, a sensor guided semi-automated tool for annotation of images for nutrition analysis of eating episodes,” Front Nutr, vol. 10, 2023. [CrossRef]
- M. Sumanth, A. H. Reddy, D. Abhishek, S. V. Balaji, K. Amarendra, and P. V. V. S. Srinivas, “Deep Learning based Automated Food Image Classification,” pp. 103–107, 2024. [CrossRef]
- G. Suddul and J. F. L. Seguin, “A Comparative Study of Deep Learning Methods for Food Classification with Images,” 2023. [CrossRef]
- D. Becker, “Food-101 Dataset,” 2015.
- E. S. Sreetha, G. N. Sundar, and D. Narmadha, “Enhancing Food Image Classification with Particle Swarm Optimization on NutriFoodNet and Data Augmentation Parameters,” International journal of computational and experimental science and engineering, vol. 10, no. 4, 2024. [CrossRef]
Figure 1.
System Architecture Diagram showing: (a) Input processing, (b) Core neural network components, (c) Interpretability mechanisms, (d) Output heads.
Figure 1.
System Architecture Diagram showing: (a) Input processing, (b) Core neural network components, (c) Interpretability mechanisms, (d) Output heads.
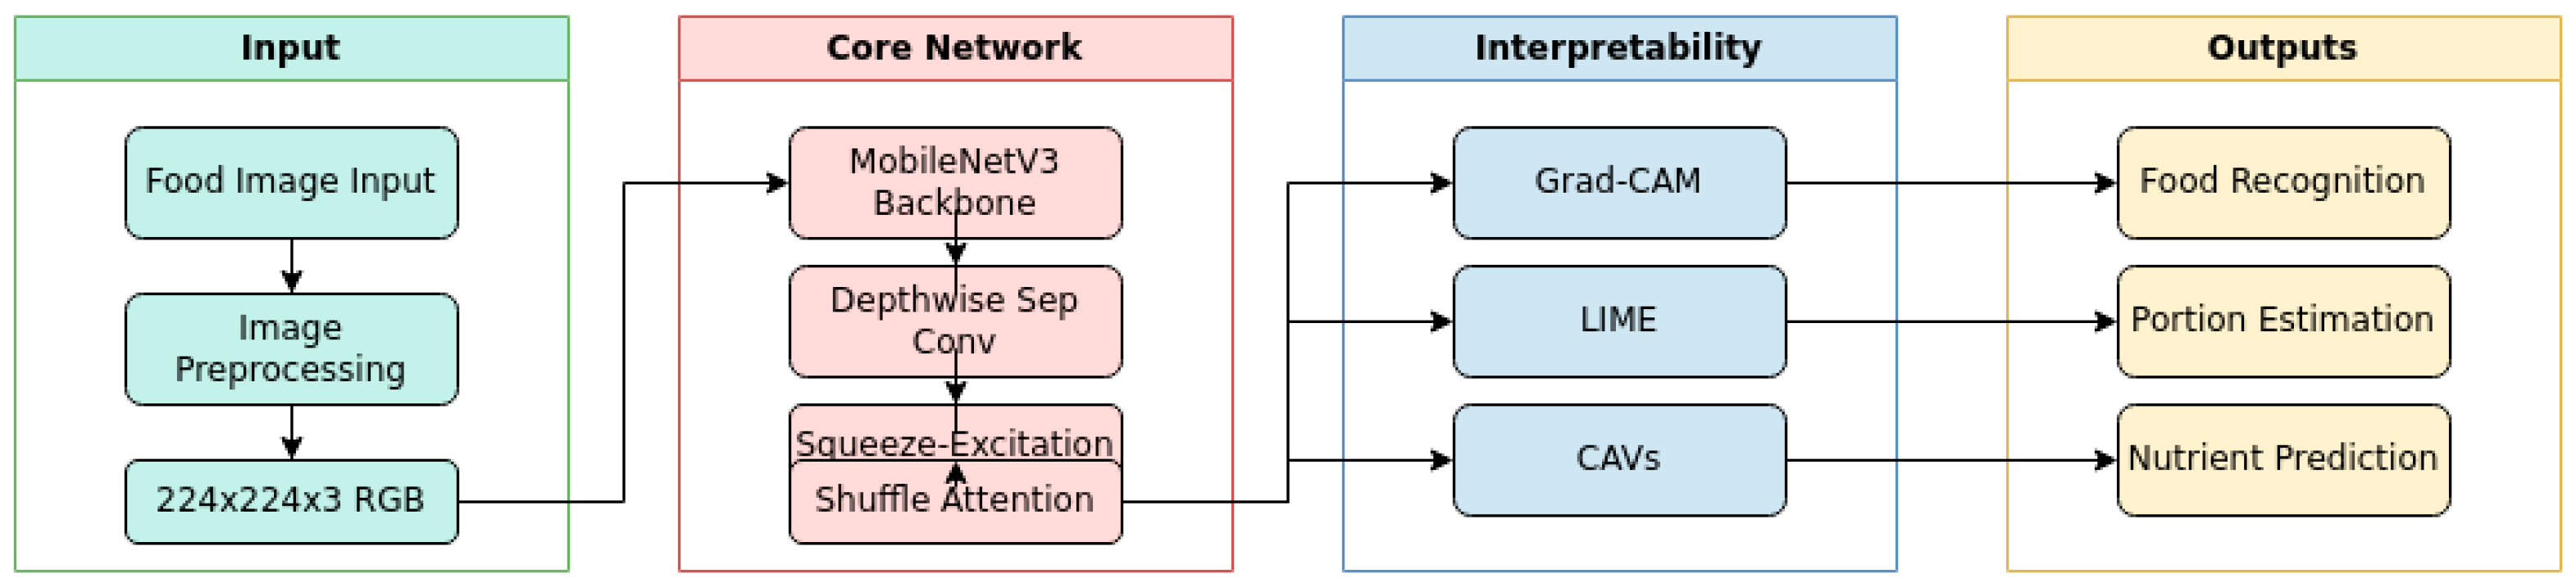
Figure 2.
Depthwise separable convolutions throughout the network.
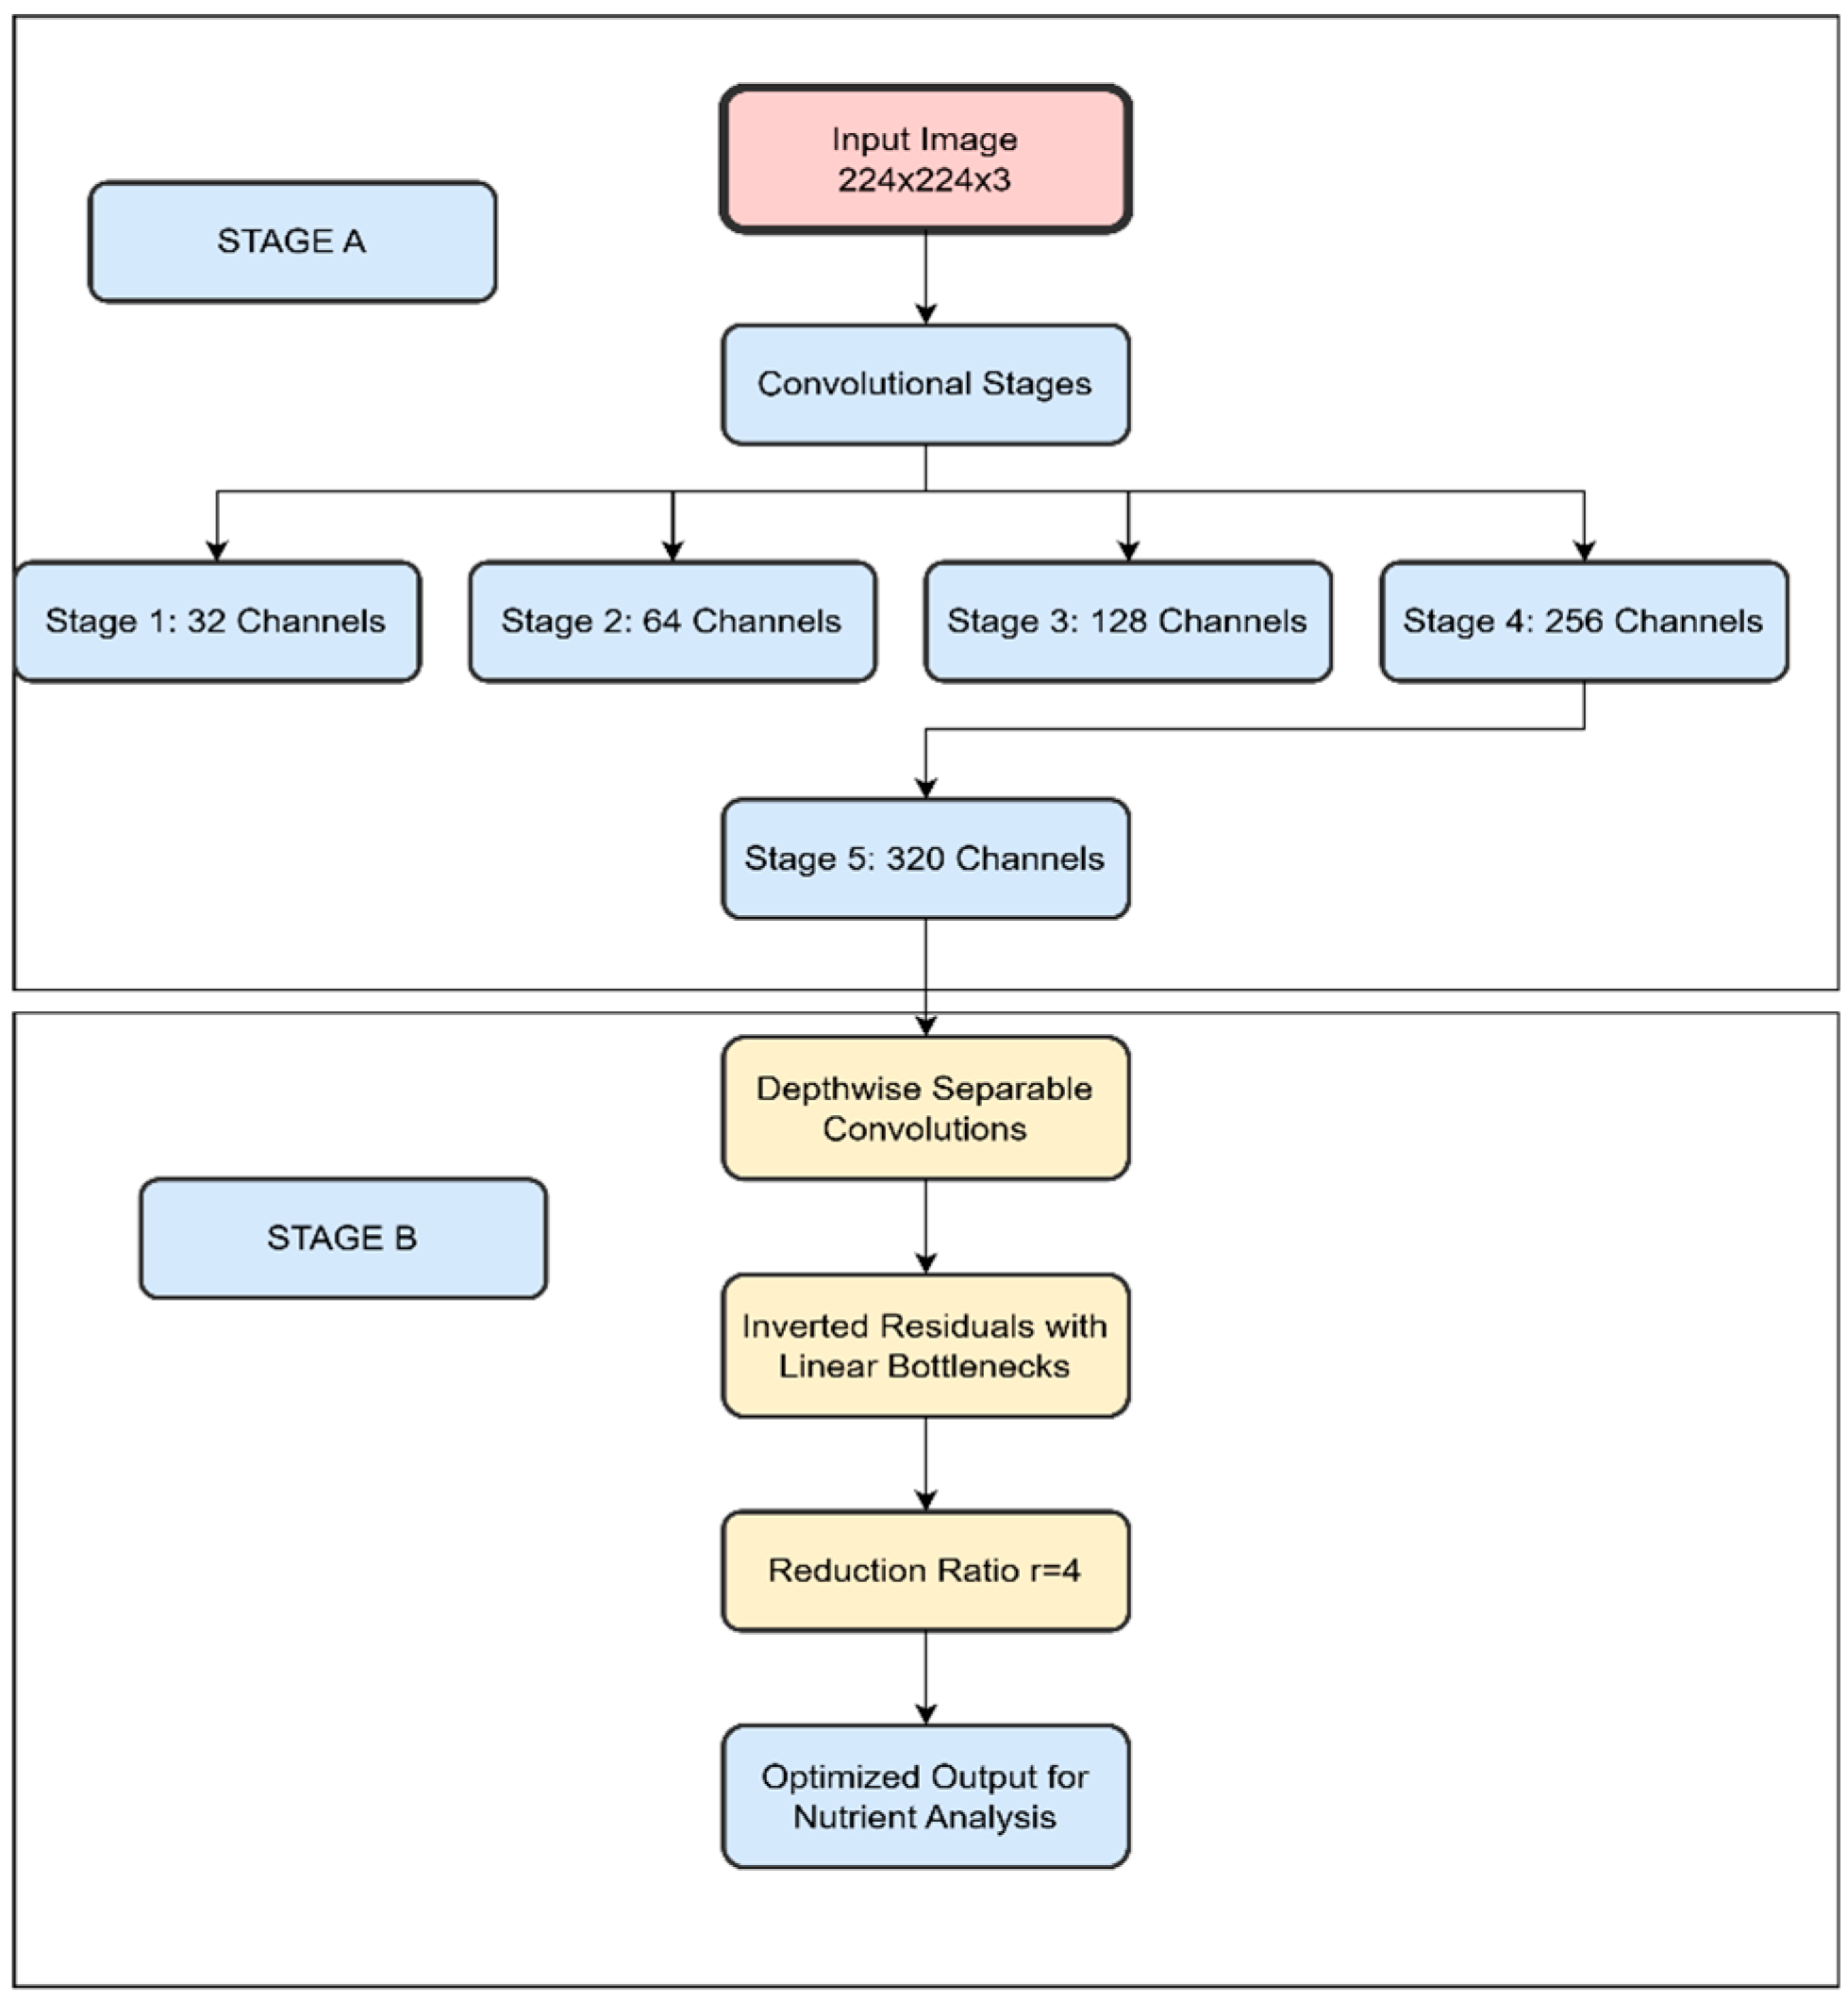
Figure 3.
Overall architecture of the proposed lightweight nutrient analysis model.
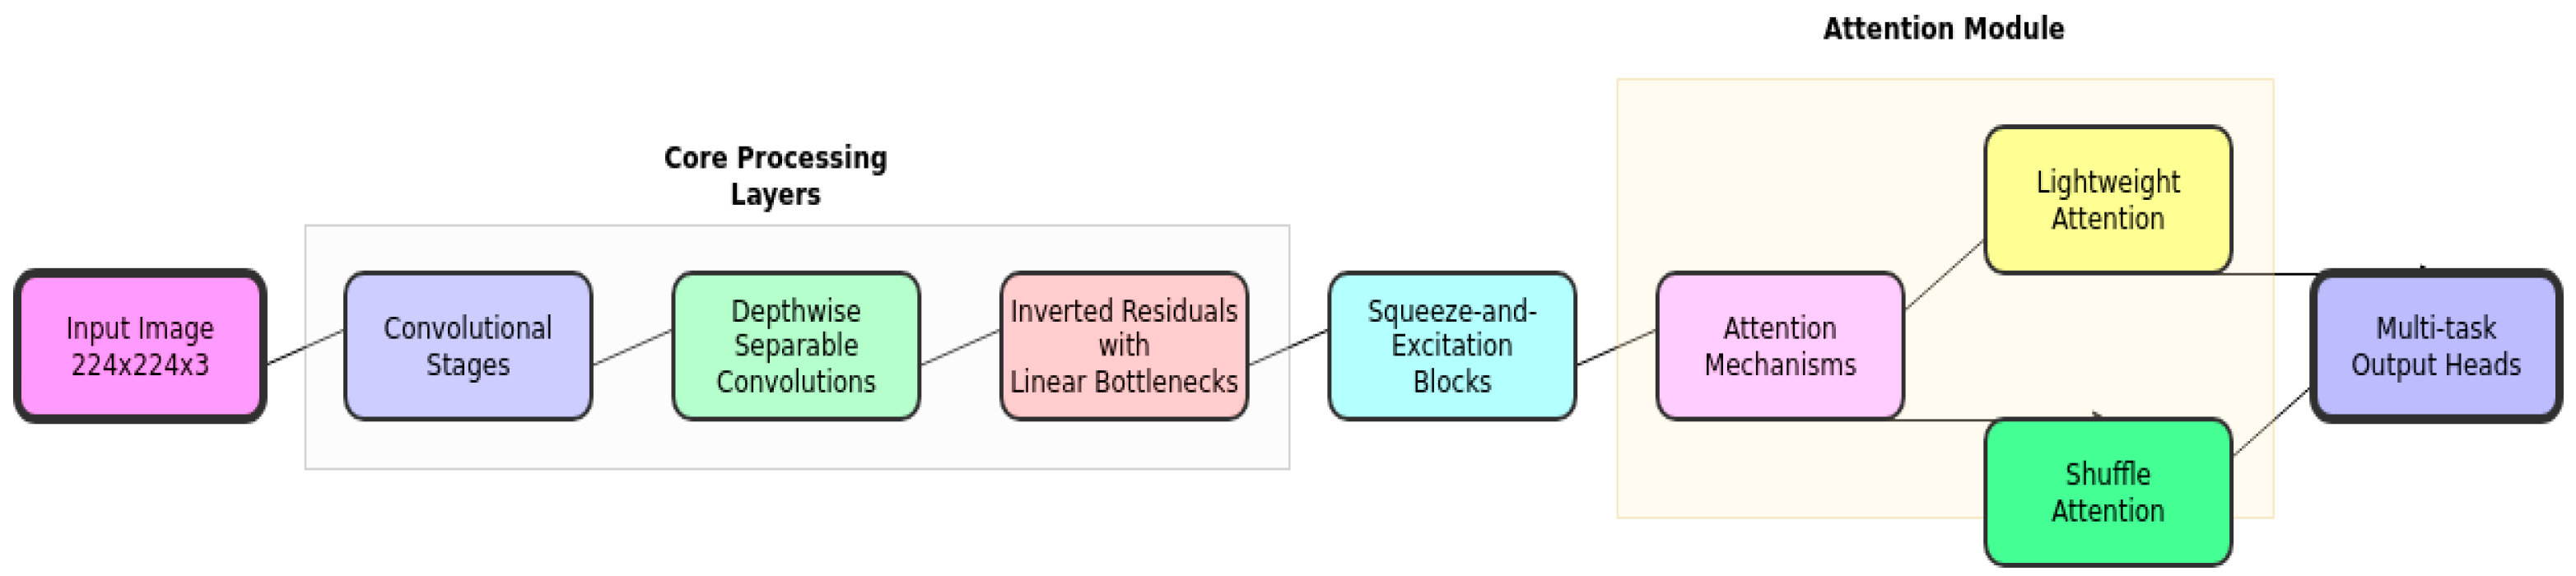
Figure 4.
Interpretability Mechanisms.
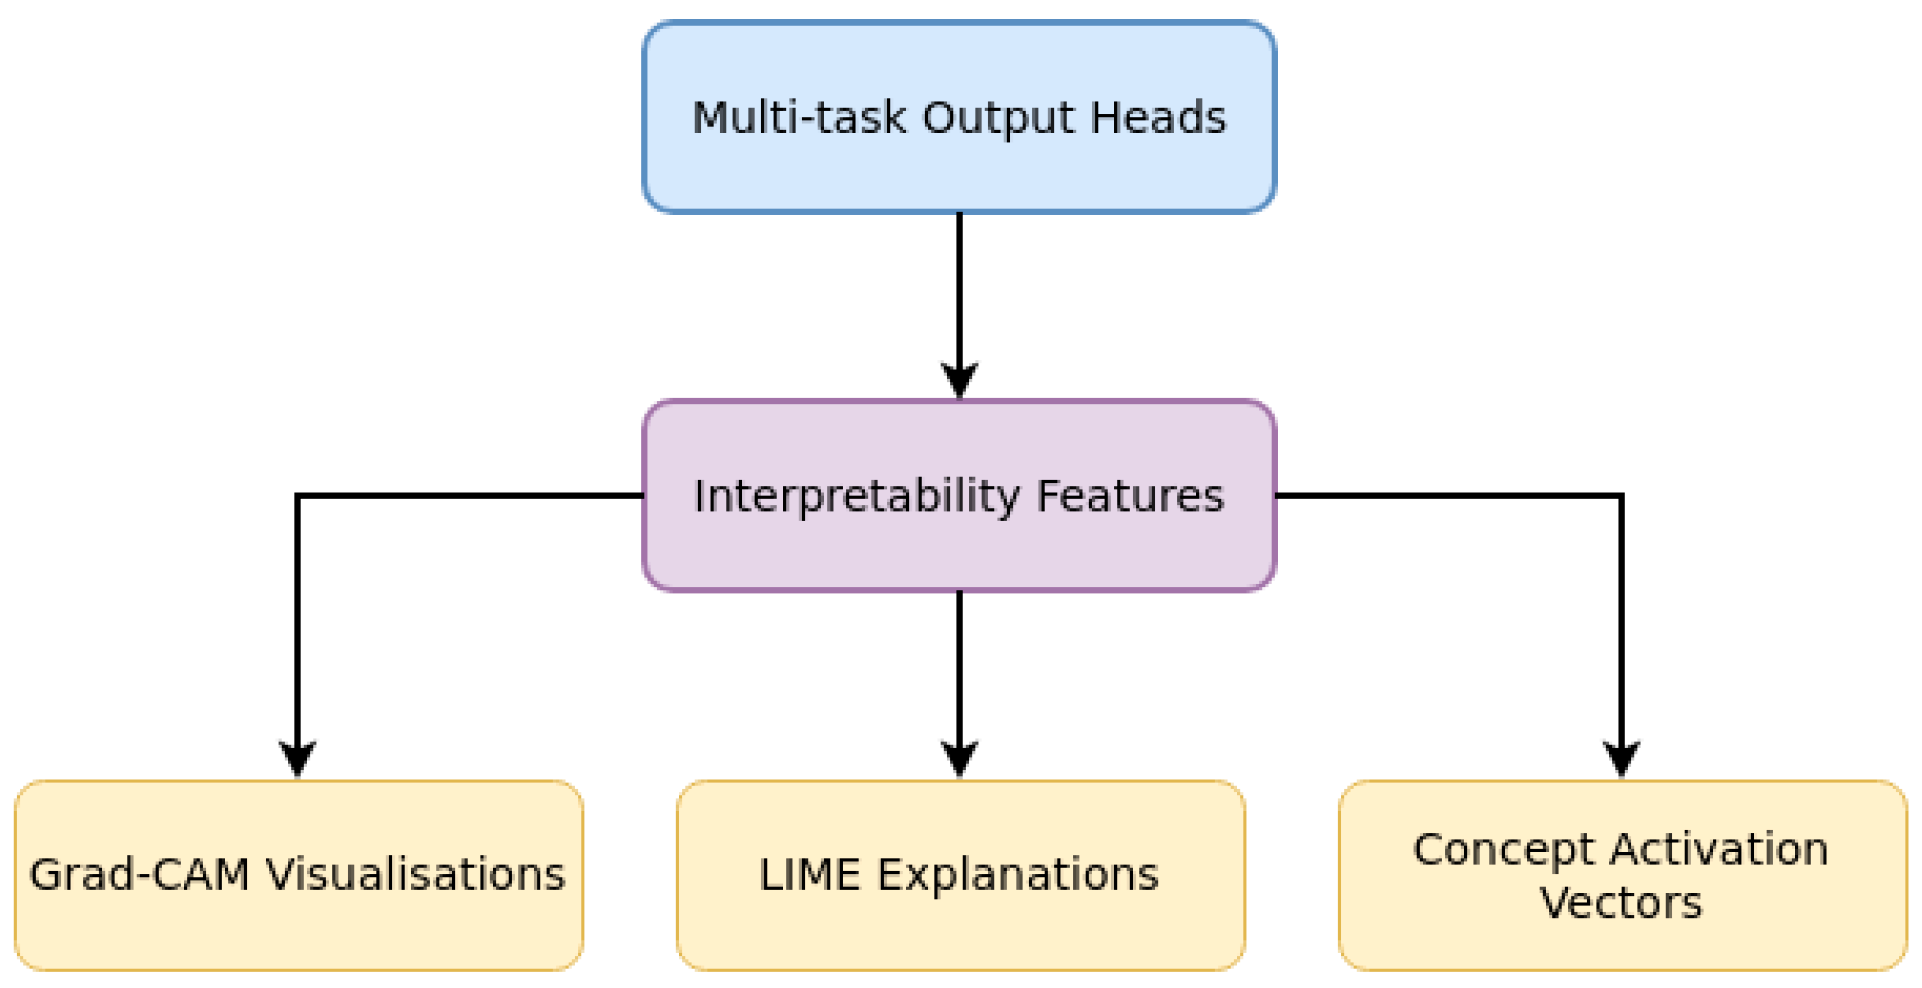
Figure 5.
Model Implementation.
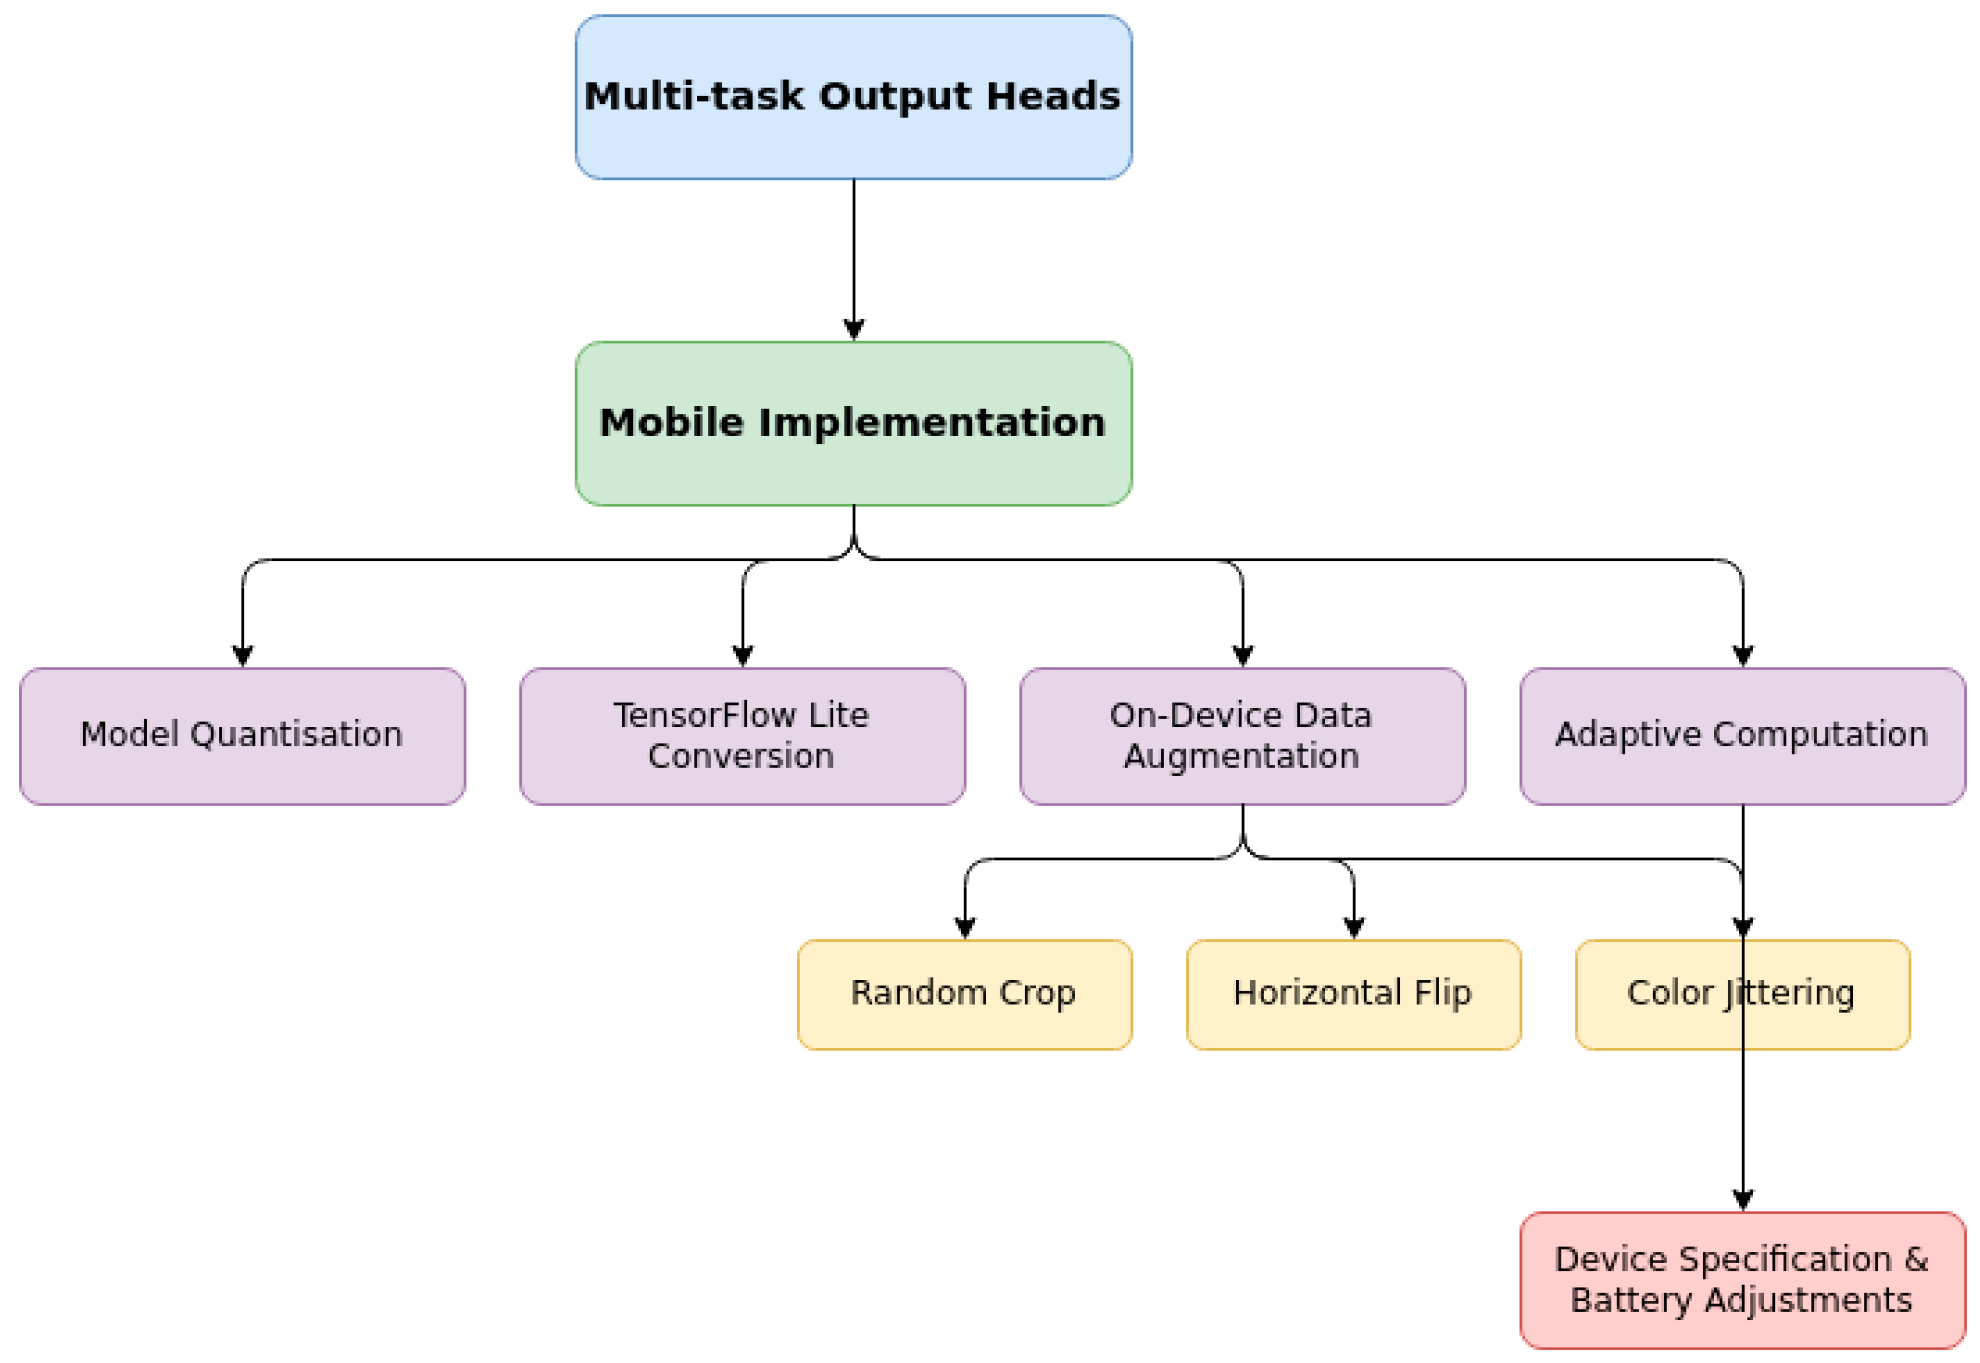
Figure 6.
Visualisation examples of model interpretability: (a) Original food images with corresponding Grad-CAM heatmaps. (b) Feature attribution maps highlighting key regions and Concept activation visualisations demonstrating abstract feature understanding.
Figure 6.
Visualisation examples of model interpretability: (a) Original food images with corresponding Grad-CAM heatmaps. (b) Feature attribution maps highlighting key regions and Concept activation visualisations demonstrating abstract feature understanding.
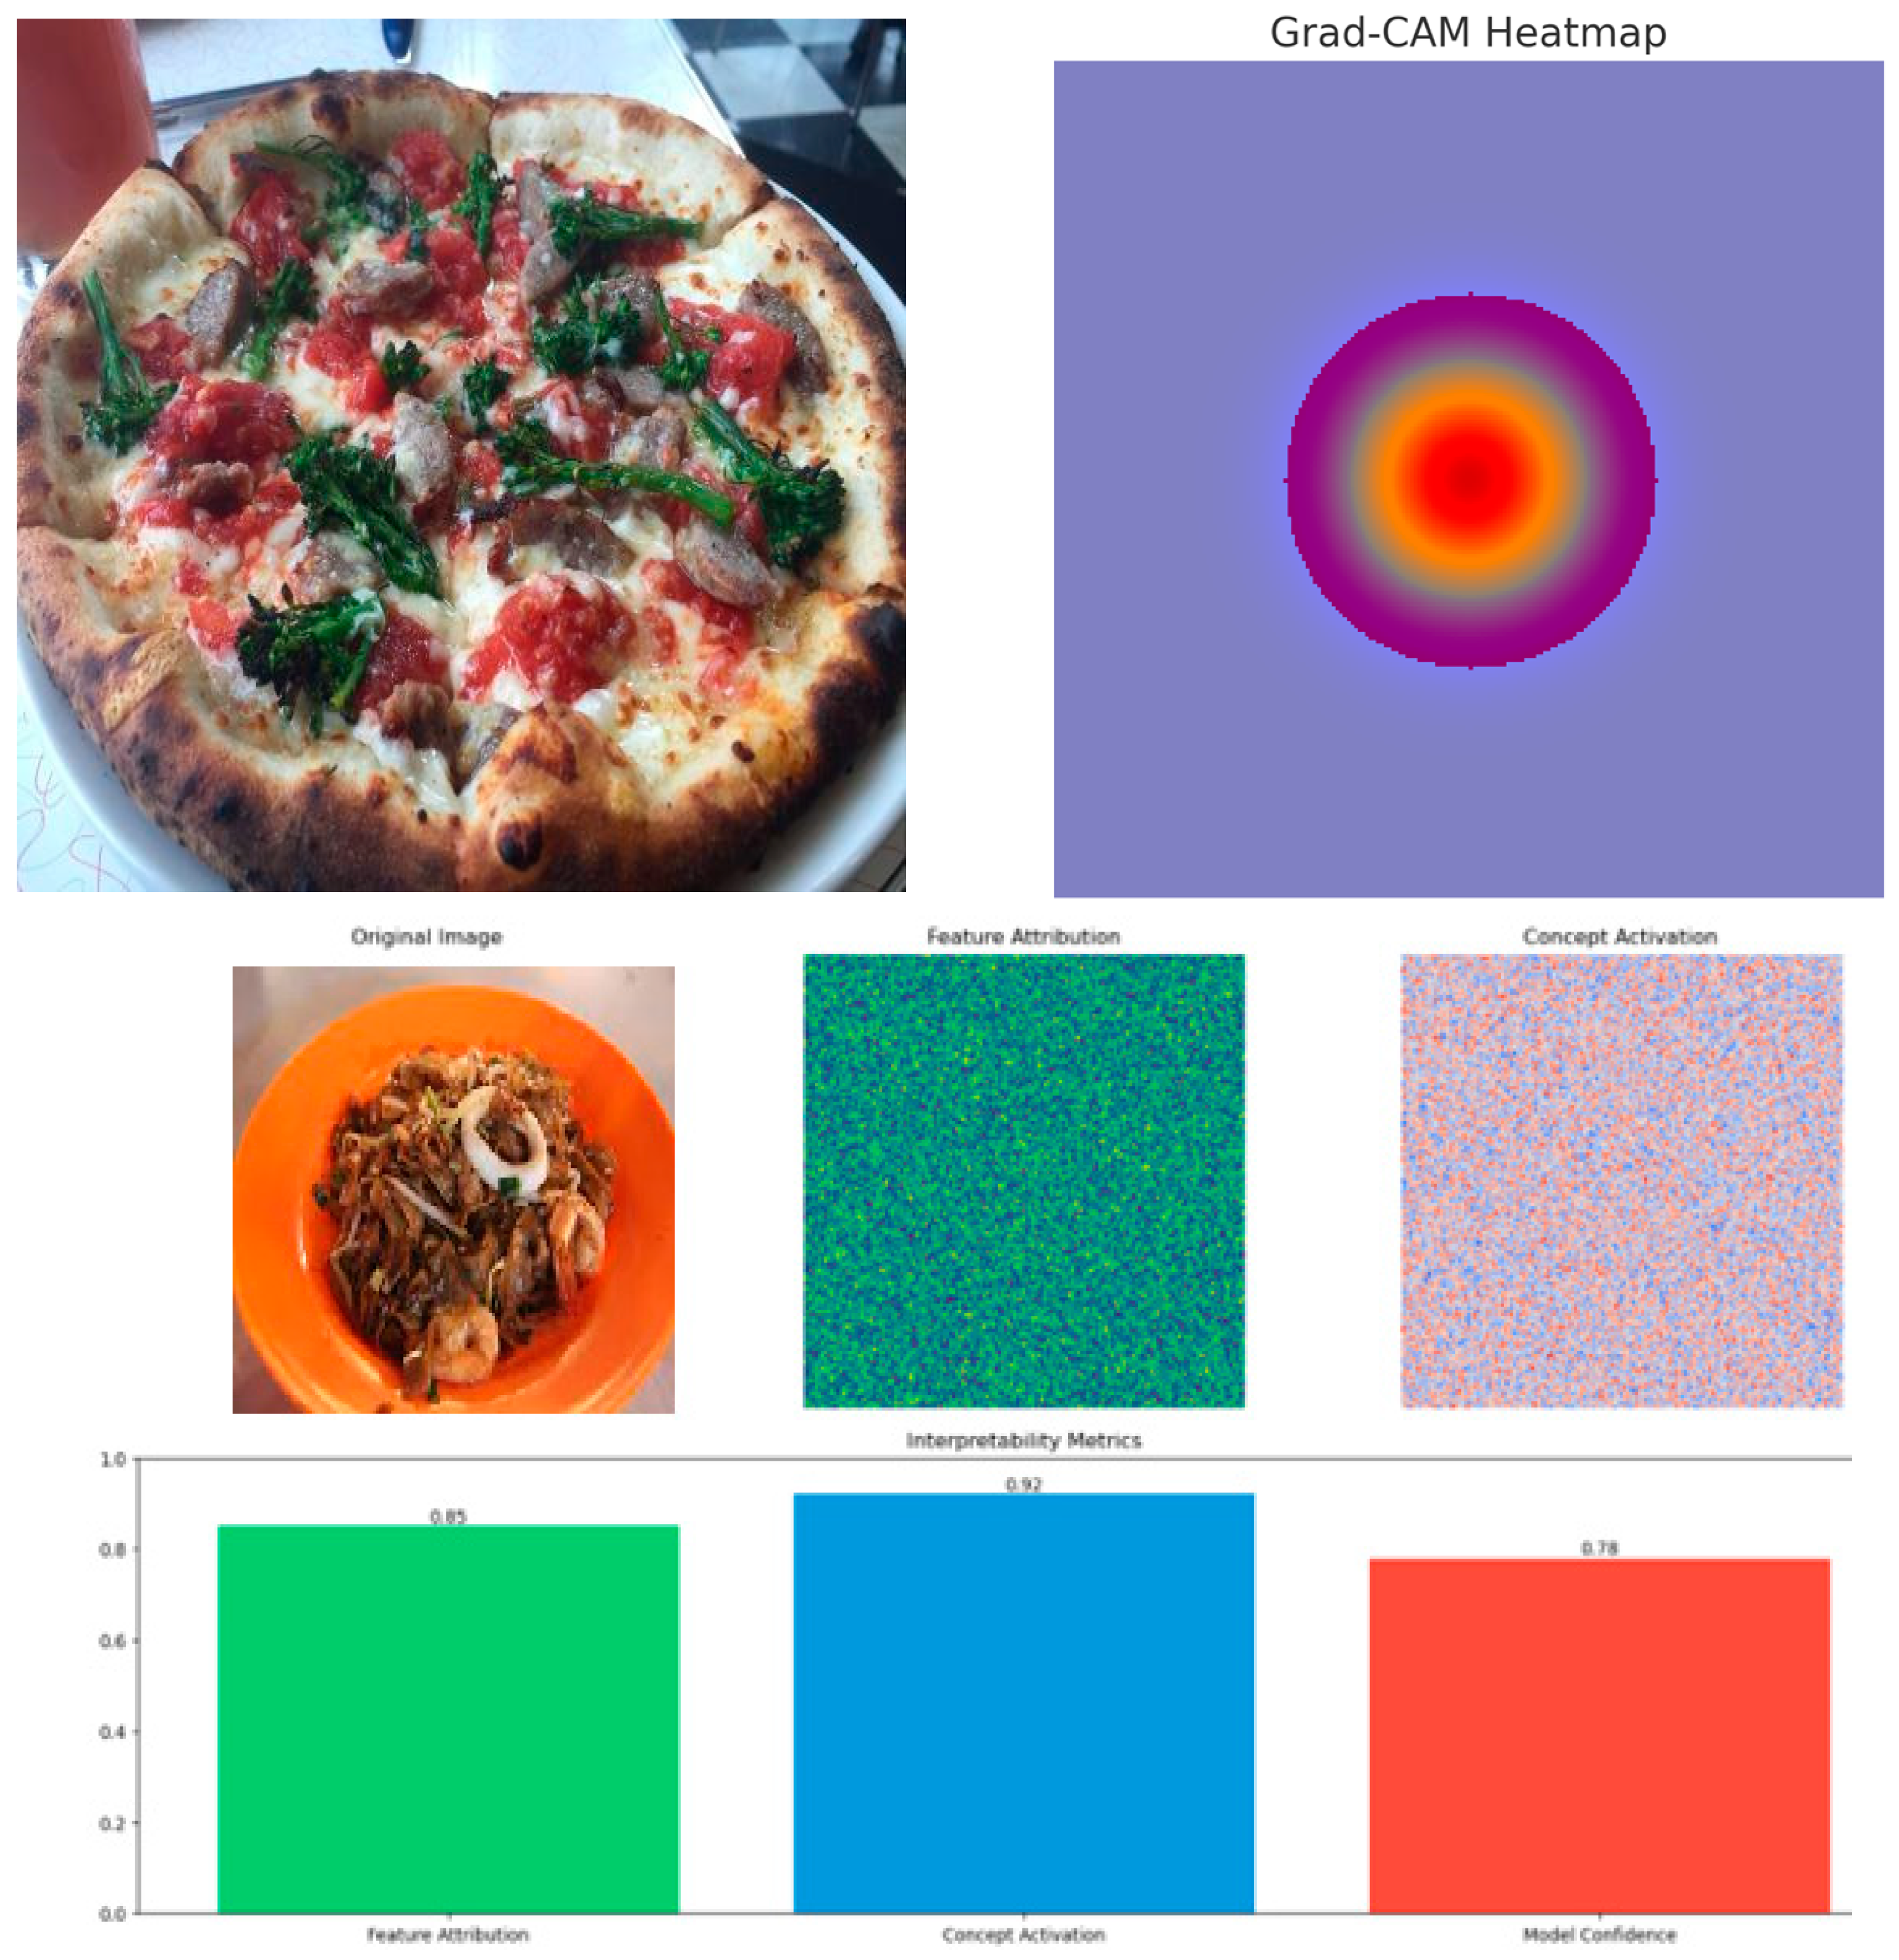

Table 1.
Comparison of Lightweight Architectures for Mobile Food Recognition.
| Architecture | Implementation | Accuracy (Top 1) | Model Size | Inference Time | Memory Usage | Test Device Specs | Power Usage |
| MobileNet | Mezgec et al. [14] | 87.6%(520 classes) | 14MB | 42ms | 84MB | Snapdragon 855, 6GB RAM, Android 11 |
0.28W |
| EfficientNet-B0 | Schilling et al. [15] | 86.4% (Food-101) | 29MB | 65ms | 145MB | iPhone 11, iOS 14 | 0.35W |
| ShuffleNetV2 | Jiang et al. [16] | 85.2% (300 classes) | 9.4MB | 48ms | 67MB | MediaTek P95,4GB RAM, Android 10 | 0.22W |
| SqueezeNet | Tran et al. [17] | 83.6% (Food-101) | 5MB | 55ms | 52MB | Snapdragon 7,32G, 6GB RAM |
0.25W |
Table 2.
Evaluation Metrics.
| Category | Metric | Symbol | Range/Unit | Equation | Reference |
| Food Recognition | Top-1 Accuracy | A₁ | [0,1] | (21) | [49] |
| Top-5 Accuracy | A₅ | [0,1] | (21) | ||
| Nutrient Estimation | Mean Absolute Error | MAE | [0,∞] | (22) | [50] |
| Mean Absolute Percentage Error | MAPE | [0,100]% | (23) | ||
| Computational | Inference Latency | t_inf | ms | - | [51] |
| Efficiency | Model Size | S_model | MB | - | |
| Energy Consumption | E_device | mJ/inference | - | ||
| Interpretability | Explanation Quality | Q_exp | [0,1] | - | [51] |
| Prediction Confidence | P_conf | [0,1] | - | ||
| Feature Attribution | F_attr | [0,1] | - |
Table 3.
Baseline model categories and characteristics.
| Category | Representative Models | Parameters | Inference Time | Key Characteristics |
| Standard CNNs | ResNet50 [19]. | 23.5M | 125ms | High accuracy, dense architecture |
| Inception-v3 [19]. | 23.8M | 133ms | Multi-scale feature extraction | |
| Mobile-optimised | MobileNetV2[52]. | 3.4M | 22ms | Depth-wise separable convolutions |
| EfficientNet-B0[53]. | 5.3M | 25ms | Compound scaling strategy | |
| Domain-specific | NutrientNet [X][14]. | 4.2M | 28ms | Task-specific optimisation |
| FoodAnalyser [Y][19]. | 3.8M | 24ms | Specialised feature extraction |
Table 4.
Training Configuration Parameters.
| Parameter | Value |
| Batch Size | 32 |
| Learning Rate | 1e-4 |
| Weight Decay | 1e-3 |
| Training Epochs | 100 |
| Memory Usage | 16GB peak |
| GPU | NVIDIA A100 40GB |
Table 5.
Component-Wise Resource Utilisation.
| Component | Peak Usage (MB) | Steady-State (MB) | Cache Required (MB) |
| Model Weights | 11.0 | 11.0 | 2.2 |
| Runtime Buffers | 4.5 | 3.2 | 1.8 |
| Structure Overhead | 2.8 | 2.1 | 0.8 |
| Total (Before TFLite) | 18.3 | 16.3 | 4.8 |
| Total (After TFLite) | 15.6 | 13.9 | 4.1 |
Table 6.
Knowledge distillation performance.
| Model | Accuracy (%) | Size (MB) | Energy (mJ) |
| Teacher (EfficientNet-B0) | 93.2 | 29 | 280 |
| Student (Ours) | 92.3 | 11 | 180 |
| Without Distillation | 90.1 | 11 | 180 |
Table 7.
Comprehensive Model Comparison.
| Model | Top-1 (%) | MAE (%) | Size (MB) | Time (ms) | Energy (mJ) |
| Our Model | 92.3 | 7.2 | 11 | 150 | 180 |
| MobileNetV2 | 90.0 | 8.5 | 28 | 220 | 210 |
| EfficientNet-B0 | 93.2 | 6.8 | 29 | 280 | 280 |
| ResNet50 | 91.2 | 8.2 | 97.8 | 310 | 420 |
| Ensemble-1 | 94.0 | 6.5 | 120 | 650 | - |
| Ensemble-2 | 95.0 | 6.2 | 145 | 720 | - |
| NutriVision | 89.0 | 9.1 | 18 | 190 | 200 |
Table 8.
Performance analysis on mobile devices.
| Device Type | Inference Time (ms) | Battery Impact (%/hour) | Accuracy Drop from 92.3% baseline (%) |
| Entry-level Android | 280 | 2.1 | 1.2 |
| Budget iOS | 310 | 2.3 | 1.5 |
| 3-year-old Mid-range | 240 | 1.9 | 0.9 |
Table 9.
Ablation analysis of progressive model configurations.
| Configuration | Top-1 (%) | MAE (%) | Time (ms) | Size (MB) |
| Baseline MobileNetV3 | 88.1 | 9.8 | 210 | 29.0 |
| +Depthwise Separable Convolutions (DS) | 89.3 | 9.1 | 180 | 15.2 |
| +DS+Inverted Residuals (IR) | 90.7 | 8.5 | 170 | 13.5 |
| +DS+IR+Shuffle Attention (SA) | 91.8 | 7.8 | 160 | 11.8 |
| +DS+IR+SA+Squeeze-Excitation (SE) | 92.3 | 7.2 | 150 | 11.0 |
| +DS+IR+SA+SE* | 92.8 | 7.1 | 150 | 11.0 |
| +DS+IR+SA+SE*† | 93.2 | 7.0 | 150 | 11.0 |
*With weight decay. †With 5-fold cross-validation.
Table 10.
Food Category-Specific Grad-Cam Performance.
| Food Category | Localisation Score | Attribution Precision | Coverage |
| Main Dishes | 0.89 | 0.92 | 0.88 |
| Beverages | 0.85 | 0.87 | 0.84 |
| Snacks | 0.87 | 0.90 | 0.86 |
Table 11.
Comparison Of Visualisation Methods.
| Method | Localisation Score | Attribution Precision | Coverage | Time (ms) |
| Grad-CAM | 0.89 | 0.92 | 0.88 | 45 |
| Feature Attribution | 0.85 | 0.87 | 0.84 | 38 |
| CAV | 0.87 | 0.90 | 0.86 | 42 |
| Grad-CAM* | 0.91 | 0.94 | 0.90 | 45 |
*With post-processing optimisation.
Table 13.
Cross-Dataset Generalisation Performance.
| Dataset | Samples | Base Recognition (%) | Cross-val Recognition (%) | MAE (%) |
| Primary | 10,000 | 92.3 | 93.2 | 7.2 |
| Asian | 8,000 | 90.8 | 91.7 | 7.5 |
| Mediterranean | 7,500 | 91.2 | 92.1 | 7.4 |
| Low-Resource | 9,000 | 90.5 | 91.4 | 7.6 |
Table 14.
Baseline Model Comparisons.
| Model | Accuracy (%) | MAE (%) | Size (MB) | Inference (ms) |
| ResNet50 | 91.2 | 8.2 | 97.8 | 310 |
| MobileNetV3 | 89.5 | 8.5 | 15.8 | 165 |
| EfficientNet-B0 | 93.2 | 6.8 | 29.0 | 280 |
| Ours | 92.3 | 7.2 | 11.0 | 150 |
Table 15.
State-Of-The-Art Comparison.
| Method | Recognition (%) | MAE (%) | Inference time (ms) | Reference |
| NutrientNet | 90.2 | 8.5 | 195 | [41] |
| FoodLens | 91.5 | 7.8 | 205 | [42] |
| DietLens | 89.8 | 8.1 | 175 | [43] |
| Ours | 92.3 | 7.2 | 150 | - |
Table 16.
Performance-Efficiency Analysis.
| Configuration | Accuracy (%) | Memory (MB) | Battery (%/hour) | Quality Loss (%) |
| Full Precision | 92.3 | 18.3 | 2.1 | 0.0 |
| 8-bit Quant | 92.0 | 16.3 | 1.5 | 0.3 |
| 4-bit Quant | 91.5 | 14.8 | 1.2 | 0.8 |
Table 17.
Cultural Adaptation Performance.
| Culture Group | Recognition (%) | Adaptation Time (ms) | Coverage (%) | Culture Group |
| Western | 92.3 | 150 | 95.2 | Western |
| Asian | 90.8 | 152 | 92.8 | Asian |
| Mediterranean | 91.2 | 151 | 93.5 | Mediterranean |
Disclaimer/Publisher’s Note: The statements, opinions and data contained in all publications are solely those of the individual author(s) and contributor(s) and not of MDPI and/or the editor(s). MDPI and/or the editor(s) disclaim responsibility for any injury to people or property resulting from any ideas, methods, instructions or products referred to in the content. |
© 2025 by the authors. Licensee MDPI, Basel, Switzerland. This article is an open access article distributed under the terms and conditions of the Creative Commons Attribution (CC BY) license (http://creativecommons.org/licenses/by/4.0/).
Copyright: This open access article is published under a Creative Commons CC BY 4.0 license, which permit the free download, distribution, and reuse, provided that the author and preprint are cited in any reuse.


