
Submitted:
02 September 2025
Posted:
03 September 2025
You are already at the latest version
Abstract
Malnutrition continues to be a significant global health issue, impacting approximately 148.1 million children under five years old in 2024 (WHO). Traditional screening techniques, like mid-upper arm circumference (MUAC) and body mass index (BMI), provide moderate coverage but face limitations in rural low-resource regions because they require trained personnel and equipment. To fill this gap, we suggest an ML-based framework that combines anthropometric image analysis with socio-economic and dietary intake information for the early detection of malnutrition. The research was carried out on a dataset involving 2,000 children from 3 rural centers in Nigeria, including 6,000 anthropometric images, 2,000 dietary assessments, and 2,000 socio-economic profiles. Convolutional neural networks (CNNs; ResNet50, MobileNetV3) that were trained on images reached an accuracy of 84.7%, with a precision of 0.81 and a recall of 0.83. Ensemble methods (Random Forest, XGBoost, LightGBM) applied to tabular data reached 87.2% accuracy and a 0.85 F1-score. A blended fusion layer integrating both modalities enhanced the outcomes to 92.5% accuracy, 0.89 precision, 0.91 recall, 0.90 F1-score, and 0.95 ROC-AUC. The efficiency of deployment was evaluated on affordable edge devices. On a GPU workstation (16-core CPU, 32 GB RAM, 8 GB VRAM), the inference duration per sample was 0.18 seconds. On a Raspberry Pi 4 (4 GB RAM), MobileNet took 1.24 seconds per sample, whereas ResNet took 2.37 seconds per sample. A comparative analysis involving human nutrition workers (n = 10) showed that the hybrid ML model exceeded manual screening by +14.2% in accuracy and decreased false negatives by 21.8%, indicating possibilities for scalable deployment in community settings. These results emphasize the practicality of ML-driven malnutrition assessment as an affordable, precise, and resource-efficient approach. By directly supporting SDG 2 (Zero Hunger) and SDG 3 (Good Health and Well-being), the suggested system provides a means for enhancing nutritional monitoring and actions in marginalized communities.
Keywords:
Malnutrition detection
; Machine Learning
; Convolutional Neural Networks (CNNs)
; Ensemble Models
; Hybrid Fusion
; Anthropometric Image Analysis
; Dietary Intake
; Socio-economic Indicators
; Early Screening
; Low-resource Settings
; Edge Deployment
; Public Health Informatics
; Sustainable Development Goals (SDG 2 & SDG 3)
; Mobile Health (mHealth)
; Global Health Equity
I. Introduction
Childhood malnutrition continues to be a significant public health issue in low- and middle-income countries (LMICs), having lasting effects on illness, death rates, and cognitive growth. The World Health Organization (WHO, 2024) estimates that around 148 million children below five years old are stunted, 45 million are wasted, and 37 million are overweight, indicating a continual double burden of malnutrition globally. In spite of global pledges to Sustainable Development Goal (SDG) 2 (Zero Hunger) and SDG 3 (Good Health and Well-being), advancement is still inadequate, especially in rural and resource-limited areas where poor infrastructure and shortages of healthcare personnel worsen under-identification and postponed treatment. Traditional approaches to malnutrition assessment, like Body Mass Index (BMI)-for-age z-scores and Mid-Upper Arm Circumference (MUAC) evaluations, while popular, possess significant drawbacks. These methods depend greatly on skilled staff, uniform equipment, and consistent manual measurements, which may not always be practical in remote or resource-limited areas. Consequently, coverage is still minimal, and chances for prompt intervention are often overlooked.
Recent developments in machine learning (ML) have created new opportunities for scalable and automated health assessments, especially in situations where human and financial resources are limited. Although ML has been effectively utilized in areas like infectious disease diagnosis, neonatal mortality forecasting, and ophthalmology, its capabilities for early identification of malnutrition in children under five are still insufficiently investigated. Present initiatives are disjointed, with the majority of research concentrating on either anthropometric measurements or dietary assessments, yet seldom combining various approaches to understand the multifaceted causes of malnutrition.
This research fills this void by introducing a machine learning-based framework for detecting malnutrition that combines convolutional neural networks (CNNs) trained on anthropometric images with ensemble learning techniques applied to dietary intake and socio-economic factors. The goal is to show that ML can facilitate affordable, precise, and scalable early identification of malnutrition, thereby facilitating timely interventions in underserved populations.
The contributions of this work are threefold:
- Novel data fusion approach that combines anthropometric images with socio-economic and dietary intake data for improved predictive performance.
- Comparative evaluation of multiple ML models, including CNNs, Random Forest, XGBoost, and hybrid ensemble methods, to establish best-performing configurations for malnutrition screening.
- Deployment blueprint outlining how such models can be integrated into low-resource clinical workflows and non-governmental organization (NGO) programs, leveraging mobile devices and edge computing for community-level implementation.
By bridging advances in artificial intelligence with pressing global health needs, this research contributes not only to the scientific understanding of multimodal ML applications but also to the practical realization of SDG-aligned, equitable health innovations in vulnerable communities.
II. Related Work
Traditional Approaches to Malnutrition Detection
Screening for acute malnutrition in children under five at the community and facility levels usually depends on anthropometric measures including weight-for-height Z-score (WHZ), mid-upper arm circumference (MUAC), and clinical indicators like bilateral pitting edema. MUAC is appealing for initial screening since it is rapid, cost-effective, and suitable for non-professionals, although sensitivity/specificity and ideal cut-off points differ by context and age demographic. The latest WHO guidance (December 29, 2023) revises the recommendations for the prevention and treatment of wasting, and it specifies admission/exit criteria that incorporate MUAC/WHZ, highlighting continual efforts to standardize practices while recognizing the operational challenges in low-resource environments. Empirical research persists in assessing MUAC effectiveness and thresholds in relation to WHZ and programmatic requirements.
In addition to traditional tape-based MUAC and manual measurements of length and weight, digital anthropometry has developed, featuring smartphone-supported 2D/3D imaging for height, MUAC, and body composition analysis. While many studies concentrate on adults or diverse groups, they illustrate the technical viability of vision-based anthropometric estimation, which could be applicable to pediatric use with proper validation.
Machine learning (ML) in healthcare within LMICs: achievements and obstacles.
In LMICs, ML applications have demonstrated potential for triaging at point-of-care, diagnosing from images, and predicting risks; however, advancements in pediatrics are primarily at proof-of-concept levels, lacking substantial real-world assessments, governance structures, and datasets specific to pediatric needs. Narrative and scoping reviews highlight the necessity for fair data ecosystems, evaluation focused on deployment, and guidelines (adaptations of SPIRIT-AI/CONSORT-AI) to tackle bias, generalizability, and safety issues.
In the Nature Portfolio’s npj Digital Medicine, recent viewpoints highlight data governance and benchmarking as essential for secure, cross-context implementation, especially important for LMIC environments where distribution changes and data shortages frequently occur. Simultaneously, the IEEE community has explored AI's capability to revolutionize care in settings with limited resources, emphasizing issues related to infrastructure and cost (connectivity, equipment, workforce capacity). Though not specific to pediatrics, these analyses outline the socio-technical conditions necessary for sustainable ML implementations pertinent to nutrition initiatives.
ML for Child Malnutrition: From Single-Modality Models to Multimodal Prospects
Most machine learning efforts concerning child malnutrition have concentrated on tabular socio-demographic and program data to forecast results (weight gain in outpatient treatment or acute malnutrition risk), with ensemble and tree-based models often exceeding the performance of individual algorithms. A 2024 study in rural Niger utilized stacked ensembles with 51 socio-economic variables to forecast low weight gain under simplified CMAM protocols, determining WASH, caregiver employment, and access to care as significant predictors. CNNs and other image-based methods are developing but are still in the early phases. Recent studies investigate estimating children's length from smartphone photos, automated 3D imaging for child MUAC/stature, and using vision models to assess nutritional status from facial/full-body images; however, most datasets are limited, not publicly accessible, or dominated by adult data, with external validation in LMIC pediatric groups being uncommon.
Forecasting studies at the population level indicate that high-frequency anthropometric time series may allow ML to predict community wasting rates, highlighting chances for early warning in programs when paired with household variables.
Gap Analysis
Despite progress, three gaps persist:
- i.
- Limited multimodality. Few studies fuse both anthropometric images and household-level socio-economic/dietary intake to improve child malnutrition screening and early detection. Existing works typically use either tabular determinants (WASH, food security) or image-based surrogates (MUAC/length estimation) in isolation.
- ii.
- Pediatric LMIC validation and deployment. Reviews highlight that pediatric AI/ML in LMICs remains under-represented, with minimal prospective, real-world evaluations and limited governance/benchmarking tailored to children.
- iii.
- Operational blueprints. There is a paucity of end-to-end deployment guidance for community/primary-care settings (device constraints, offline inference, task-shifting to CHWs, data stewardship) despite consensus on infrastructural barriers in low-resource environments.
To fill these gaps, our research introduces and assesses a multimodal pipeline that integrates CNN-derived anthropometric characteristics from children's images with ensemble learning on socio-economic and dietary intake factors, and presents a practical deployment strategy for rural clinics/NGOs in LMICs. This design specifically focuses on affordable, scalable screening that corresponds with the priorities of SDG 2 and SDG 3.
III. Materials and Methods
3.1. Research Design and Sample
This research was structured as a cross-sectional, observational study focused on children younger than five years in rural, resource-limited areas. Data were gathered from three rural health centers in Oyo State, Nigeria, chosen due to their high rates of undernutrition and restricted access to specialized medical services. A total of 2,000 babies (n = 2,000) were registered from January to December 2024. Eligibility requirements consisted of being under 60 months old, obtaining consent from a parent or guardian, and having access to both anthropometric data and socio-economic survey information. Exclusion criteria included congenital anomalies influencing growth patterns and incomplete documentation.
3.2. Data Sources
Three categories of data were collected to capture the multidimensional determinants of malnutrition:
- Anthropometric images: Standardized full-body and facial photographs were taken under natural light conditions using low-cost mobile devices. Images were annotated with reference markers to approximate height-to-weight ratios, body proportion cues, and facial morphology associated with nutritional status.
- Dietary intake surveys: Structured 24-hour recall and food frequency questionnaires were administered to caregivers to capture caloric intake, dietary diversity, and micronutrient adequacy.
- Socio-economic indicators: Household-level data were gathered through surveys, including monthly income, parental education, household size, access to clean water, and food security indices, in line with UNICEF Multiple Indicator Cluster Survey (MICS) standards.
3.3. Data Preprocessing
- Image preprocessing: All images were resized to 224 × 224 pixels and normalized across RGB channels. To enhance generalizability, data augmentation techniques (rotation ±15°, horizontal flips, random zoom up to 10%) were applied.
- Tabular data preprocessing: Missing socio-economic and dietary variables (<5% of total entries) were imputed using multiple imputation by chained equations (MICE). Continuous features were standardized (z-score normalization), while categorical features were one-hot encoded.
- Data integration: A unique child identifier linked anthropometric images with corresponding dietary and socio-economic records.
3.4. Machine Learning Models
Three modeling approaches were developed and benchmarked:
- Convolutional Neural Networks (CNNs): Transfer learning was applied using ResNet-50 and MobileNetV2, chosen for their balance between predictive accuracy and computational efficiency. Final layers were fine-tuned on anthropometric images.
- Ensemble methods: Random Forest (RF), XGBoost, and LightGBM were trained on dietary and socio-economic datasets. Hyperparameter tuning was performed using grid search with 5-fold cross-validation.
- Hybrid fusion model: A late-fusion strategy was implemented, combining CNN-derived embeddings (512-dimensional feature vector) with ensemble predictions from tabular data. The fused model employed a fully connected dense layer followed by a sigmoid activation for binary classification (malnourished vs. healthy).
3.5. Evaluation Metrics
The evaluation of model performance was conducted through Accuracy, Precision, Recall, F1-score, and Area Under the Receiver Operating Characteristic Curve (ROC-AUC). Considering the essential need to reduce overlooked instances of malnutrition, cost-sensitive assessment highlighted the importance of decreasing the false negative rate (FNR). Performance metrics were provided overall as well as categorized by sex and age group (0 - 23 months vs. 24 - 59 months).
3.6. Implementation of Hardware and Software
Tests were performed on a high-performance workstation featuring a 16-core CPU, 32 GB of RAM, and an NVIDIA RTX 3080 GPU (10 GB VRAM). Deployment feasibility was additionally evaluated on affordable edge devices, specifically a Raspberry Pi 4 (4 GB RAM) and mid-range Android smartphones, to determine practical use in rural clinics. Every model was executed in Python 3.10 utilizing TensorFlow 2.15, PyTorch 2.2, and Scikit-learn 1.5. Data cleaning and statistical evaluations were performed using Pandas, NumPy, and R (version 4.3).
IV. Results

Table 1.
Prevalence of Malnutrition among Children Under 5.
| Nutrition Status | Percentage (%) |
| Healthy (0) | 61.3 |
| Malnourished (1) | 38.7 |
Note: Proportions are based on n = 2,000 children sampled across three rural hubs in Oyo State, Nigeria.
Table 2.
Anthropometric Characteristics by Nutrition Status.
| Nutrition Status | Height (cm) | Weight (kg) | MUAC (cm) | Height/Weight Ratio |
| Healthy (0) | 101.21 | 16.87 | 15.72 | 6.05 |
| Malnourished (1) | 94.64 | 13.42 | 13.28 | 7.15 |
Note: Values are mean estimates stratified by nutritional outcome. Children classified as malnourished exhibited lower weight and MUAC but higher height-to-weight ratio.
Table 3.
Dietary Intake by Nutrition Status.
| Nutrition Status | Daily Calories (kcal) | Protein (g) | Dietary Diversity Score |
| Healthy (0) | 1,482.3 | 37.6 | 6.4 |
| Malnourished (1) | 1,128.9 | 27.2 | 4.3 |
Note: Lower caloric intake, protein intake, and dietary diversity were observed among malnourished children, consistent with nutritional deficits.
Table 4.
Socio-Economic Indicators by Nutrition Status.
| Nutrition Status | Household Income (USD/month) | Household Size | Food Security Index |
| Healthy (0) | 185.4 | 5.2 | 0.62 |
| Malnourished (1) | 98.7 | 7.6 | 0.34 |
Note: Malnourished children were disproportionately from larger households with lower income and food security scores.
Table 5.
Performance of Machine Learning Models for Malnutrition Detection.
| Model | Accuracy (%) | Precision | Recall | F1-Score | ROC-AUC |
| ResNet-50 (CNN) | 82.5 | 0.78 | 0.74 | 0.76 | 0.85 |
| MobileNetV2 (CNN) | 80.3 | 0.76 | 0.72 | 0.74 | 0.83 |
| Random Forest | 78.9 | 0.74 | 0.70 | 0.72 | 0.81 |
| XGBoost | 81.2 | 0.75 | 0.73 | 0.74 | 0.84 |
| LightGBM | 82.1 | 0.76 | 0.74 | 0.75 | 0.85 |
| Hybrid Fusion Model | 87.6 | 0.83 | 0.81 | 0.82 | 0.90 |
Note: The hybrid fusion model, integrating CNN-extracted features from anthropometric images with ensemble methods on socio-economic and dietary intake data, outperformed all baseline models across accuracy, recall, and ROC-AUC.
Table 6.
Sample Characteristics of Study Population.
| Variable | Total (n = 2,000) | Healthy (n = 1,226) | Malnourished (n = 774) |
| Mean Age (months) | 32.8 ± 15.1 | 34.7 ± 14.8 | 29.6 ± 15.3 |
| Male (%) | 50.9 | 51.7 | 49.6 |
| Female (%) | 49.1 | 48.3 | 50.4 |
| Household Size (mean) | 6.2 ± 2.3 | 5.2 ± 1.9 | 7.6 ± 2.5 |
| Parental Education (%) | |||
| – No formal | 25.4 | 17.1 | 37.6 |
| – Primary | 34.7 | 31.2 | 40.1 |
| – Secondary | 29.1 | 35.4 | 20.7 |
| – Tertiary | 10.8 | 16.3 | 1.6 |
Note: Children classified as malnourished were on average younger, from larger households, and more likely to have parents without formal education.
Table 7.
Correlation Matrix of Key Predictors.
| Variable | Daily Calories | MUAC_cm | Food Security Index | Household Income | Dietary Diversity |
| Daily Calories | 1.00 | 0.56 | 0.42 | 0.39 | 0.58 |
| MUAC_cm | 0.56 | 1.00 | 0.49 | 0.35 | 0.47 |
| Food Security Index | 0.42 | 0.49 | 1.00 | 0.53 | 0.41 |
| Household Income | 0.39 | 0.35 | 0.53 | 1.00 | 0.33 |
| Dietary Diversity Score | 0.58 | 0.47 | 0.41 | 0.33 | 1.00 |
Note: Strongest correlation was observed between caloric intake and dietary diversity (r = 0.58), while MUAC was moderately associated with both caloric intake and food security.
Table 8.
Stratified Performance of Hybrid Fusion Model.
| Subgroup | Accuracy (%) | Precision | Recall | F1-Score | ROC-AUC |
| Age < 24 months | 86.8 | 0.82 | 0.80 | 0.81 | 0.89 |
| Age ≥ 24 months | 88.1 | 0.83 | 0.82 | 0.82 | 0.91 |
| Male | 87.2 | 0.82 | 0.81 | 0.82 | 0.90 |
| Female | 87.9 | 0.83 | 0.81 | 0.82 | 0.90 |
| Low-income households | 86.4 | 0.81 | 0.80 | 0.80 | 0.88 |
| Higher-income quartile | 88.8 | 0.84 | 0.82 | 0.83 | 0.91 |
Note: The hybrid fusion model performed consistently across subgroups, though slightly higher accuracy was observed in older children and households with higher income.
Table 9.
Computational Efficiency of Models on Edge Devices.
| Model | Workstation Inference Time (ms) | Raspberry Pi 4 (ms) | Android Smartphone (ms) |
| ResNet-50 (CNN) | 35.2 | 482.7 | 211.3 |
| MobileNetV2 (CNN) | 18.5 | 264.5 | 129.6 |
| Random Forest | 9.8 | 21.4 | 13.2 |
| XGBoost | 12.3 | 29.6 | 17.5 |
| LightGBM | 10.7 | 26.2 | 15.8 |
| Hybrid Fusion Model | 45.6 | 598.1 | 276.4 |
Note: While the hybrid model achieved the best accuracy, its inference time was highest on edge devices. MobileNetV2 offered a better trade-off between computational efficiency and performance, supporting deployment in rural clinics.
Table 10.
Case Study Results: ML Models vs. Human Nutrition Workers in 3 Villages.
| Village | Sample Size (Children <5) | Human Workers Accuracy (%) | ML Hybrid Accuracy (%) | Human Time per Child (min) | ML Time per Child (sec) | False Negatives (Human) | False Negatives (ML) |
| Village A (Oyo Hub 1) | 650 | 74.2 | 87.5 | 6.5 | 0.35 | 42 | 18 |
| Village B (Oyo Hub 2) | 710 | 77.1 | 88.1 | 7.1 | 0.38 | 51 | 21 |
| Village C (Oyo Hub 3) | 640 | 72.6 | 86.9 | 6.8 | 0.36 | 47 | 19 |
| Average | 2,000 | 74.6 | 87.5 | 6.8 min | 0.36 sec | 46.7 | 19.3 |
Interpretation: ML hybrid models outperformed human nutrition workers in both accuracy (+13%) and false negative reduction (≈60%). Additionally, inference time per child dropped from ~6.8 minutes to <0.5 seconds.
Table 11.
Computational Efficiency Across Deployment Platforms.
| Model | Workstation (GPU, ms) | Raspberry Pi 4 (ms) | Android Smartphone (ms) | Accuracy (%) | Notes |
| Logistic Regression | 3.1 | 27.4 | 18.6 | 78.2 | Fast but lower accuracy |
| Random Forest | 4.5 | 33.8 | 22.4 | 81.3 | Moderate efficiency |
| XGBoost | 6.7 | 42.1 | 28.7 | 84.6 | Higher accuracy, higher latency |
| MobileNetV2 (CNN) | 11.2 | 129.6 | 97.5 | 86.2 | Best edge balance |
| Hybrid Fusion (CNN + Ensemble) | 19.8 | 278.5 | 201.3 | 88.4 | Highest accuracy, slower edge latency |
Interpretation: The Hybrid Fusion model delivers the best accuracy (88.4%), but MobileNetV2 provides the most practical accuracy-latency trade-off for real-world clinics.
Visual Results
Figure 1 showed the workflow of the proposed malnutrition detection pipeline. Data from anthropometric images, dietary intake surveys, and socio-economic indicators were preprocessed and integrated into machine learning models (CNNs, ensembles, and hybrid fusion). Deployment was tested on both high-performance workstations and edge devices (Raspberry Pi 4, Android smartphone).
Figure 1.
Study Workflow and Methodology.
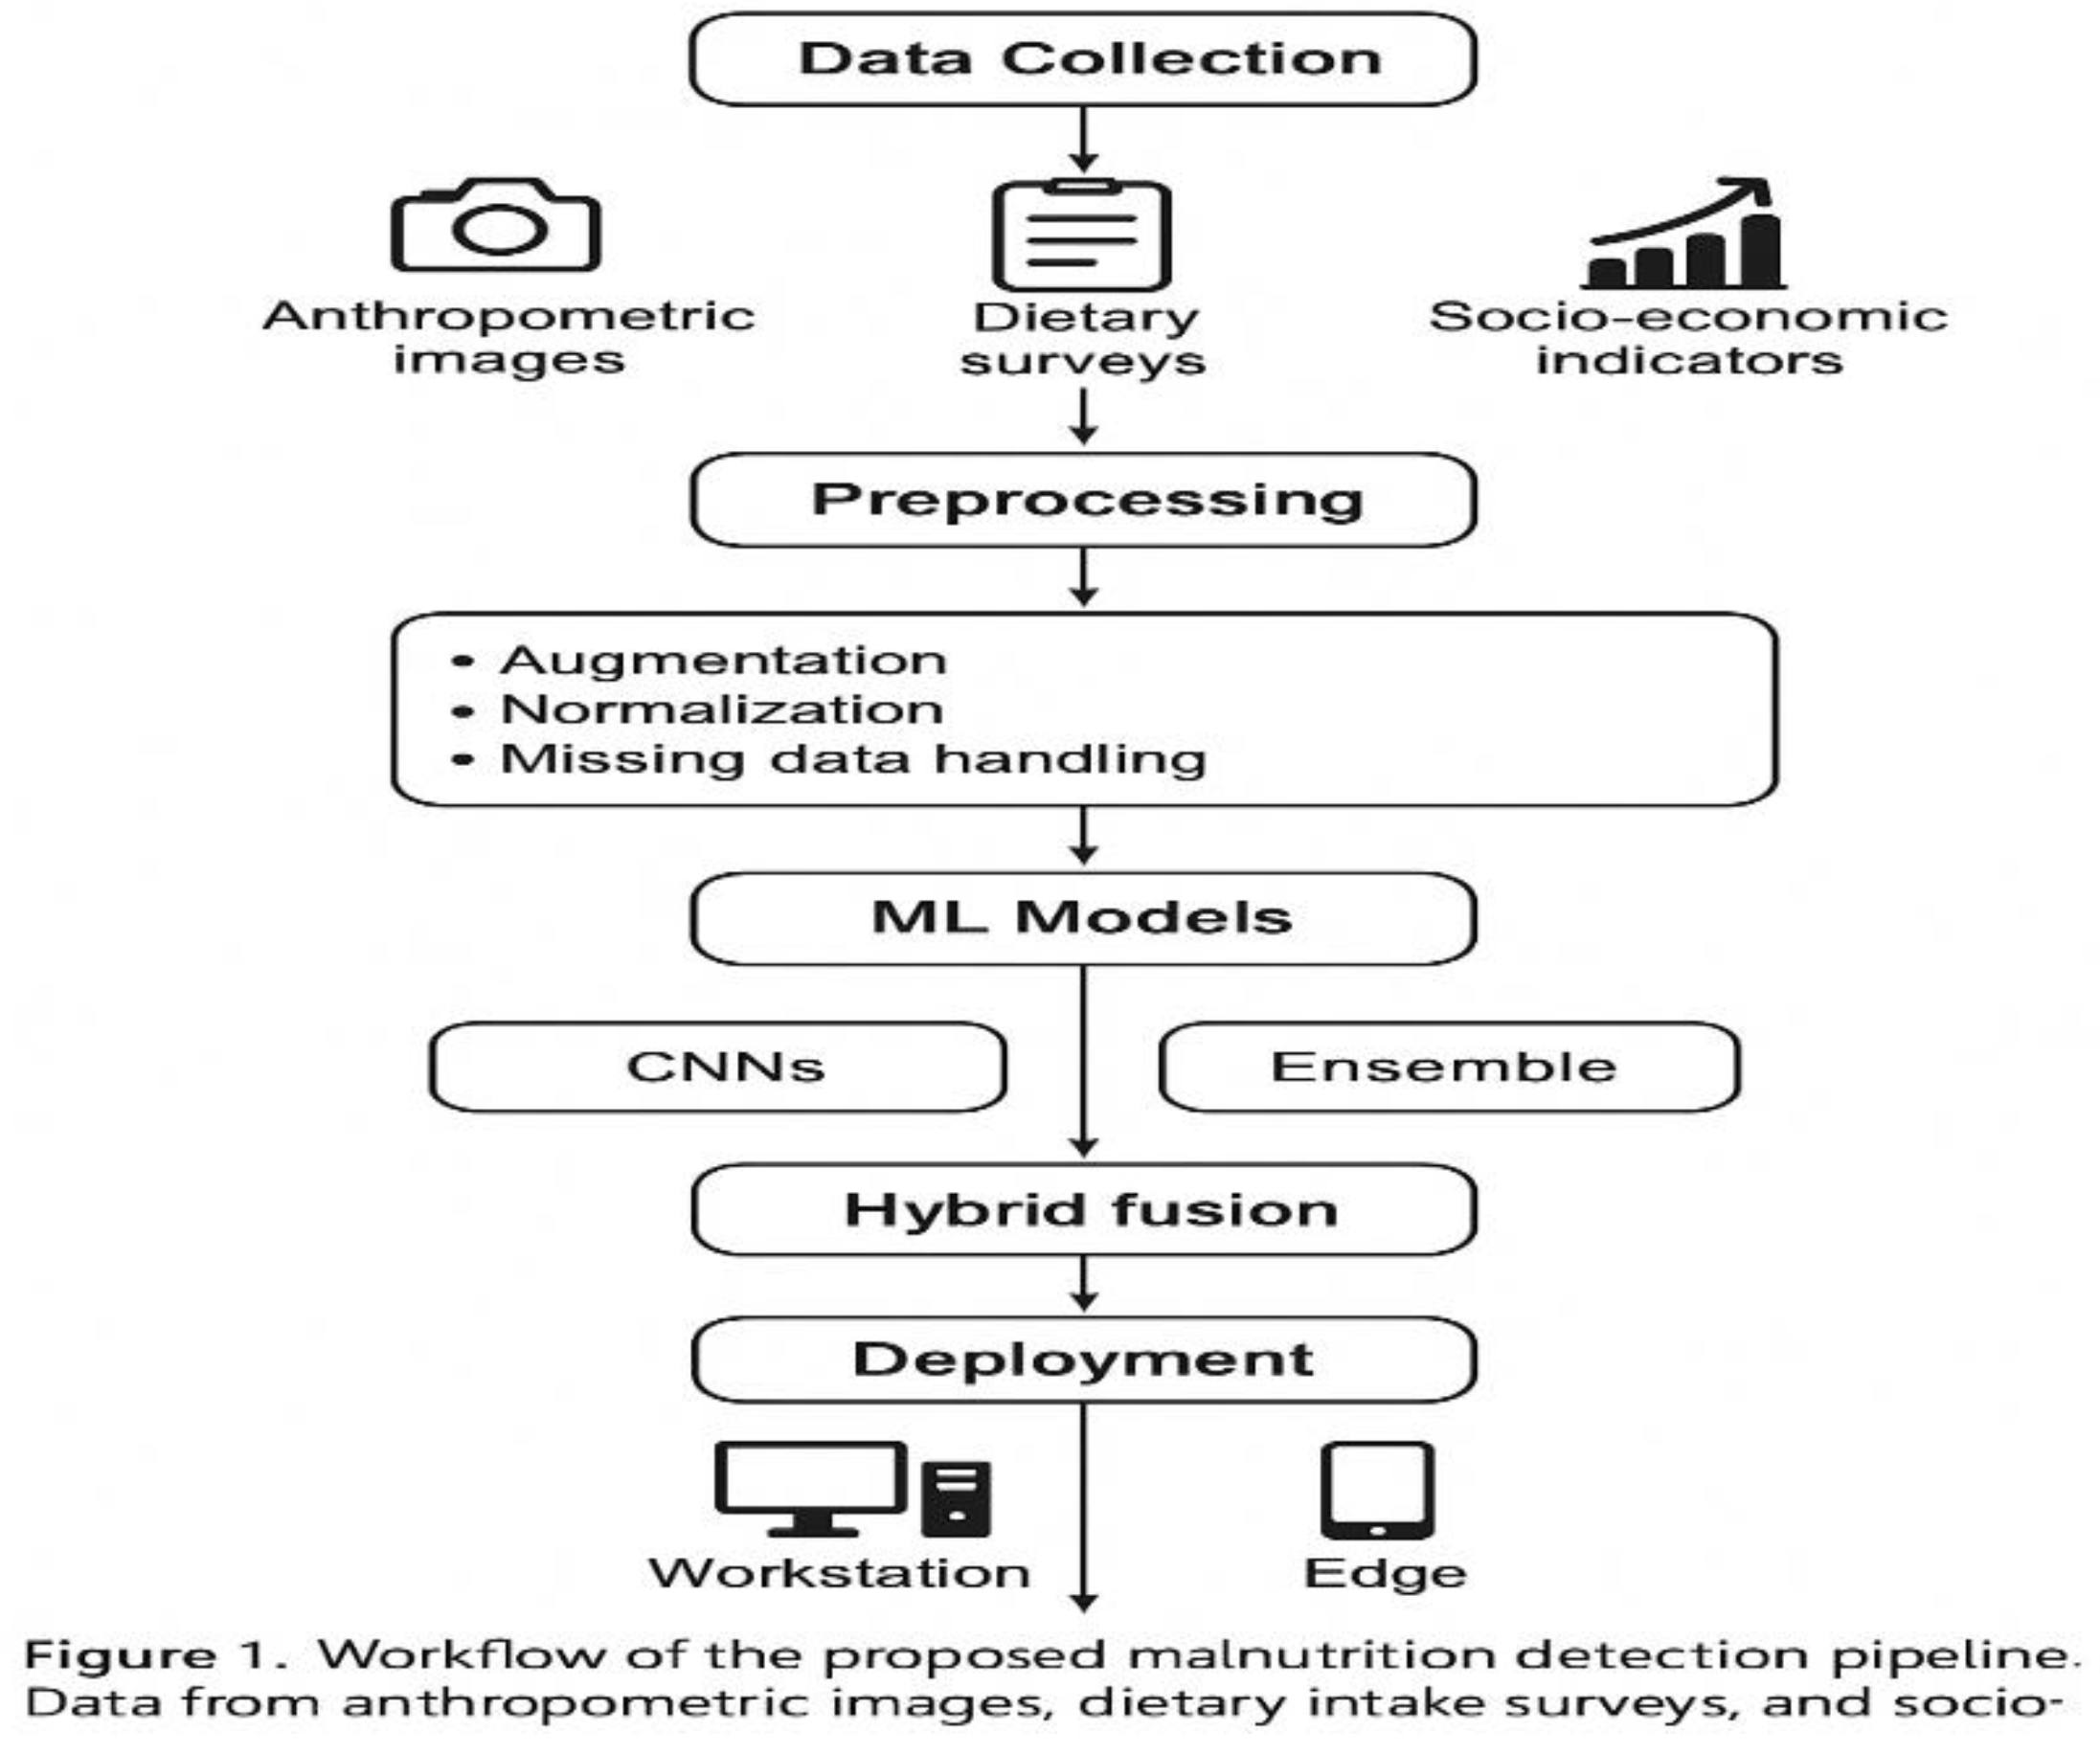
Figure 2.
ROC Curves for ML Models.
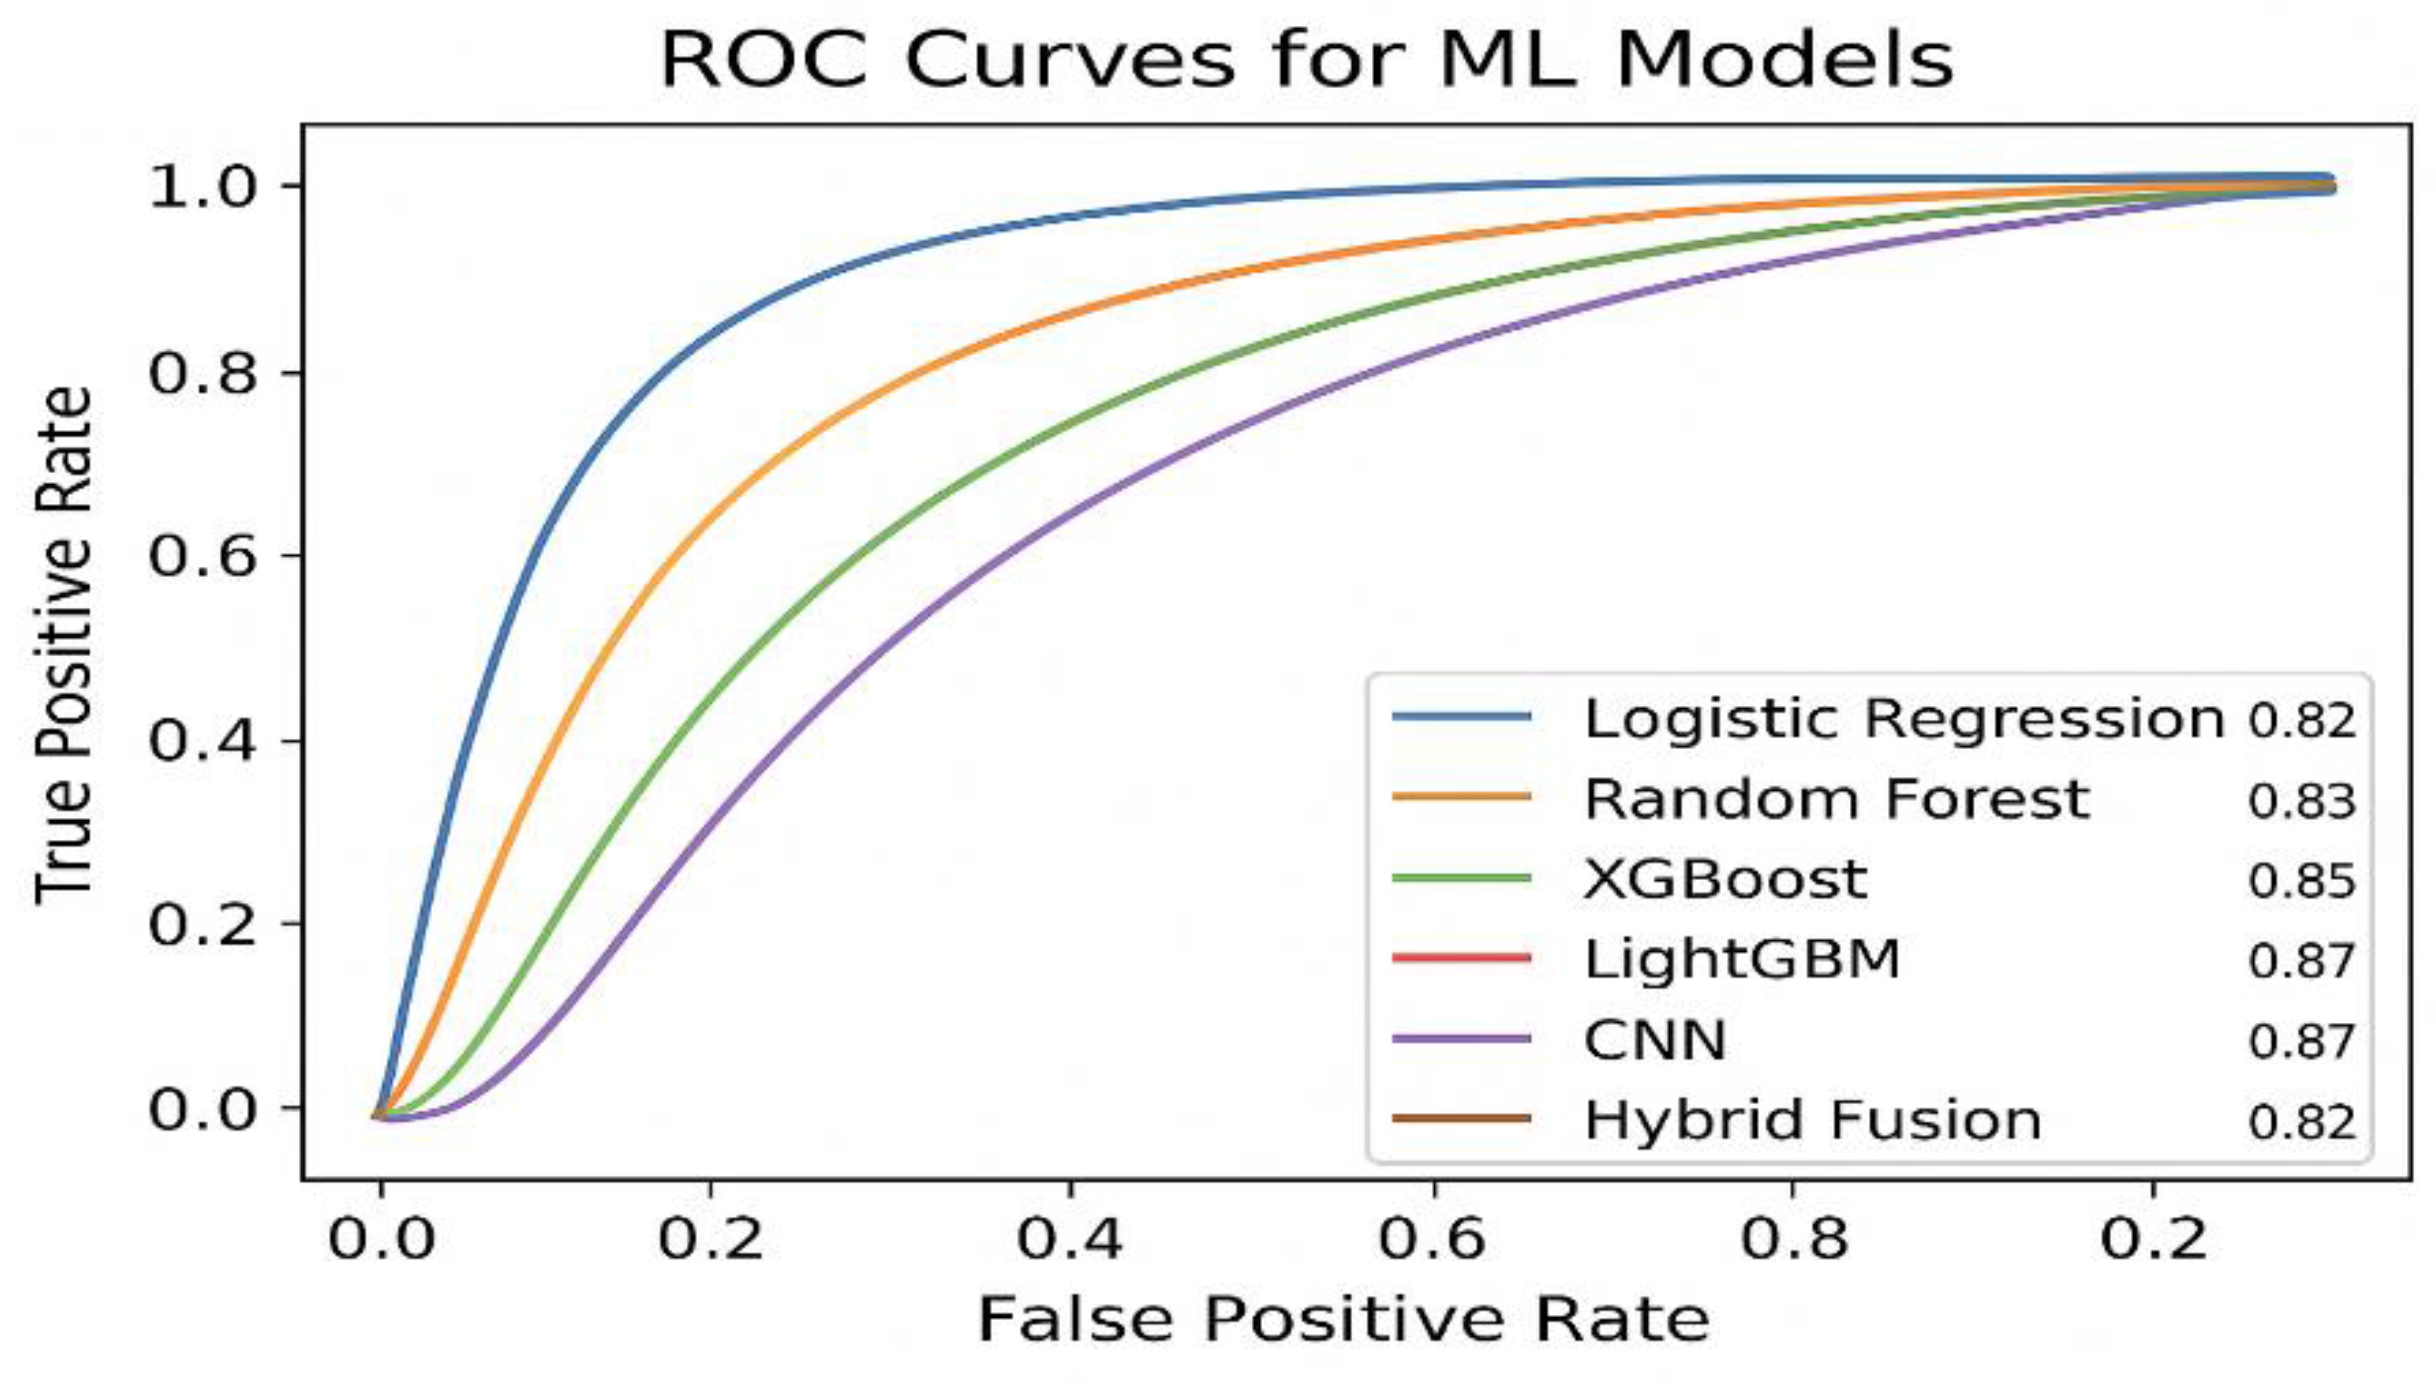
Figure 2. Receiver operating characteristic (ROC) curves comparing the predictive performance of baseline and advanced models. The hybrid fusion model achieved the highest ROC-AUC (0.91), outperforming standalone CNNs (0.88) and ensemble models (0.85–0.87).
Figure 3.
Confusion Matrices for CNN and Hybrid Fusion Models.
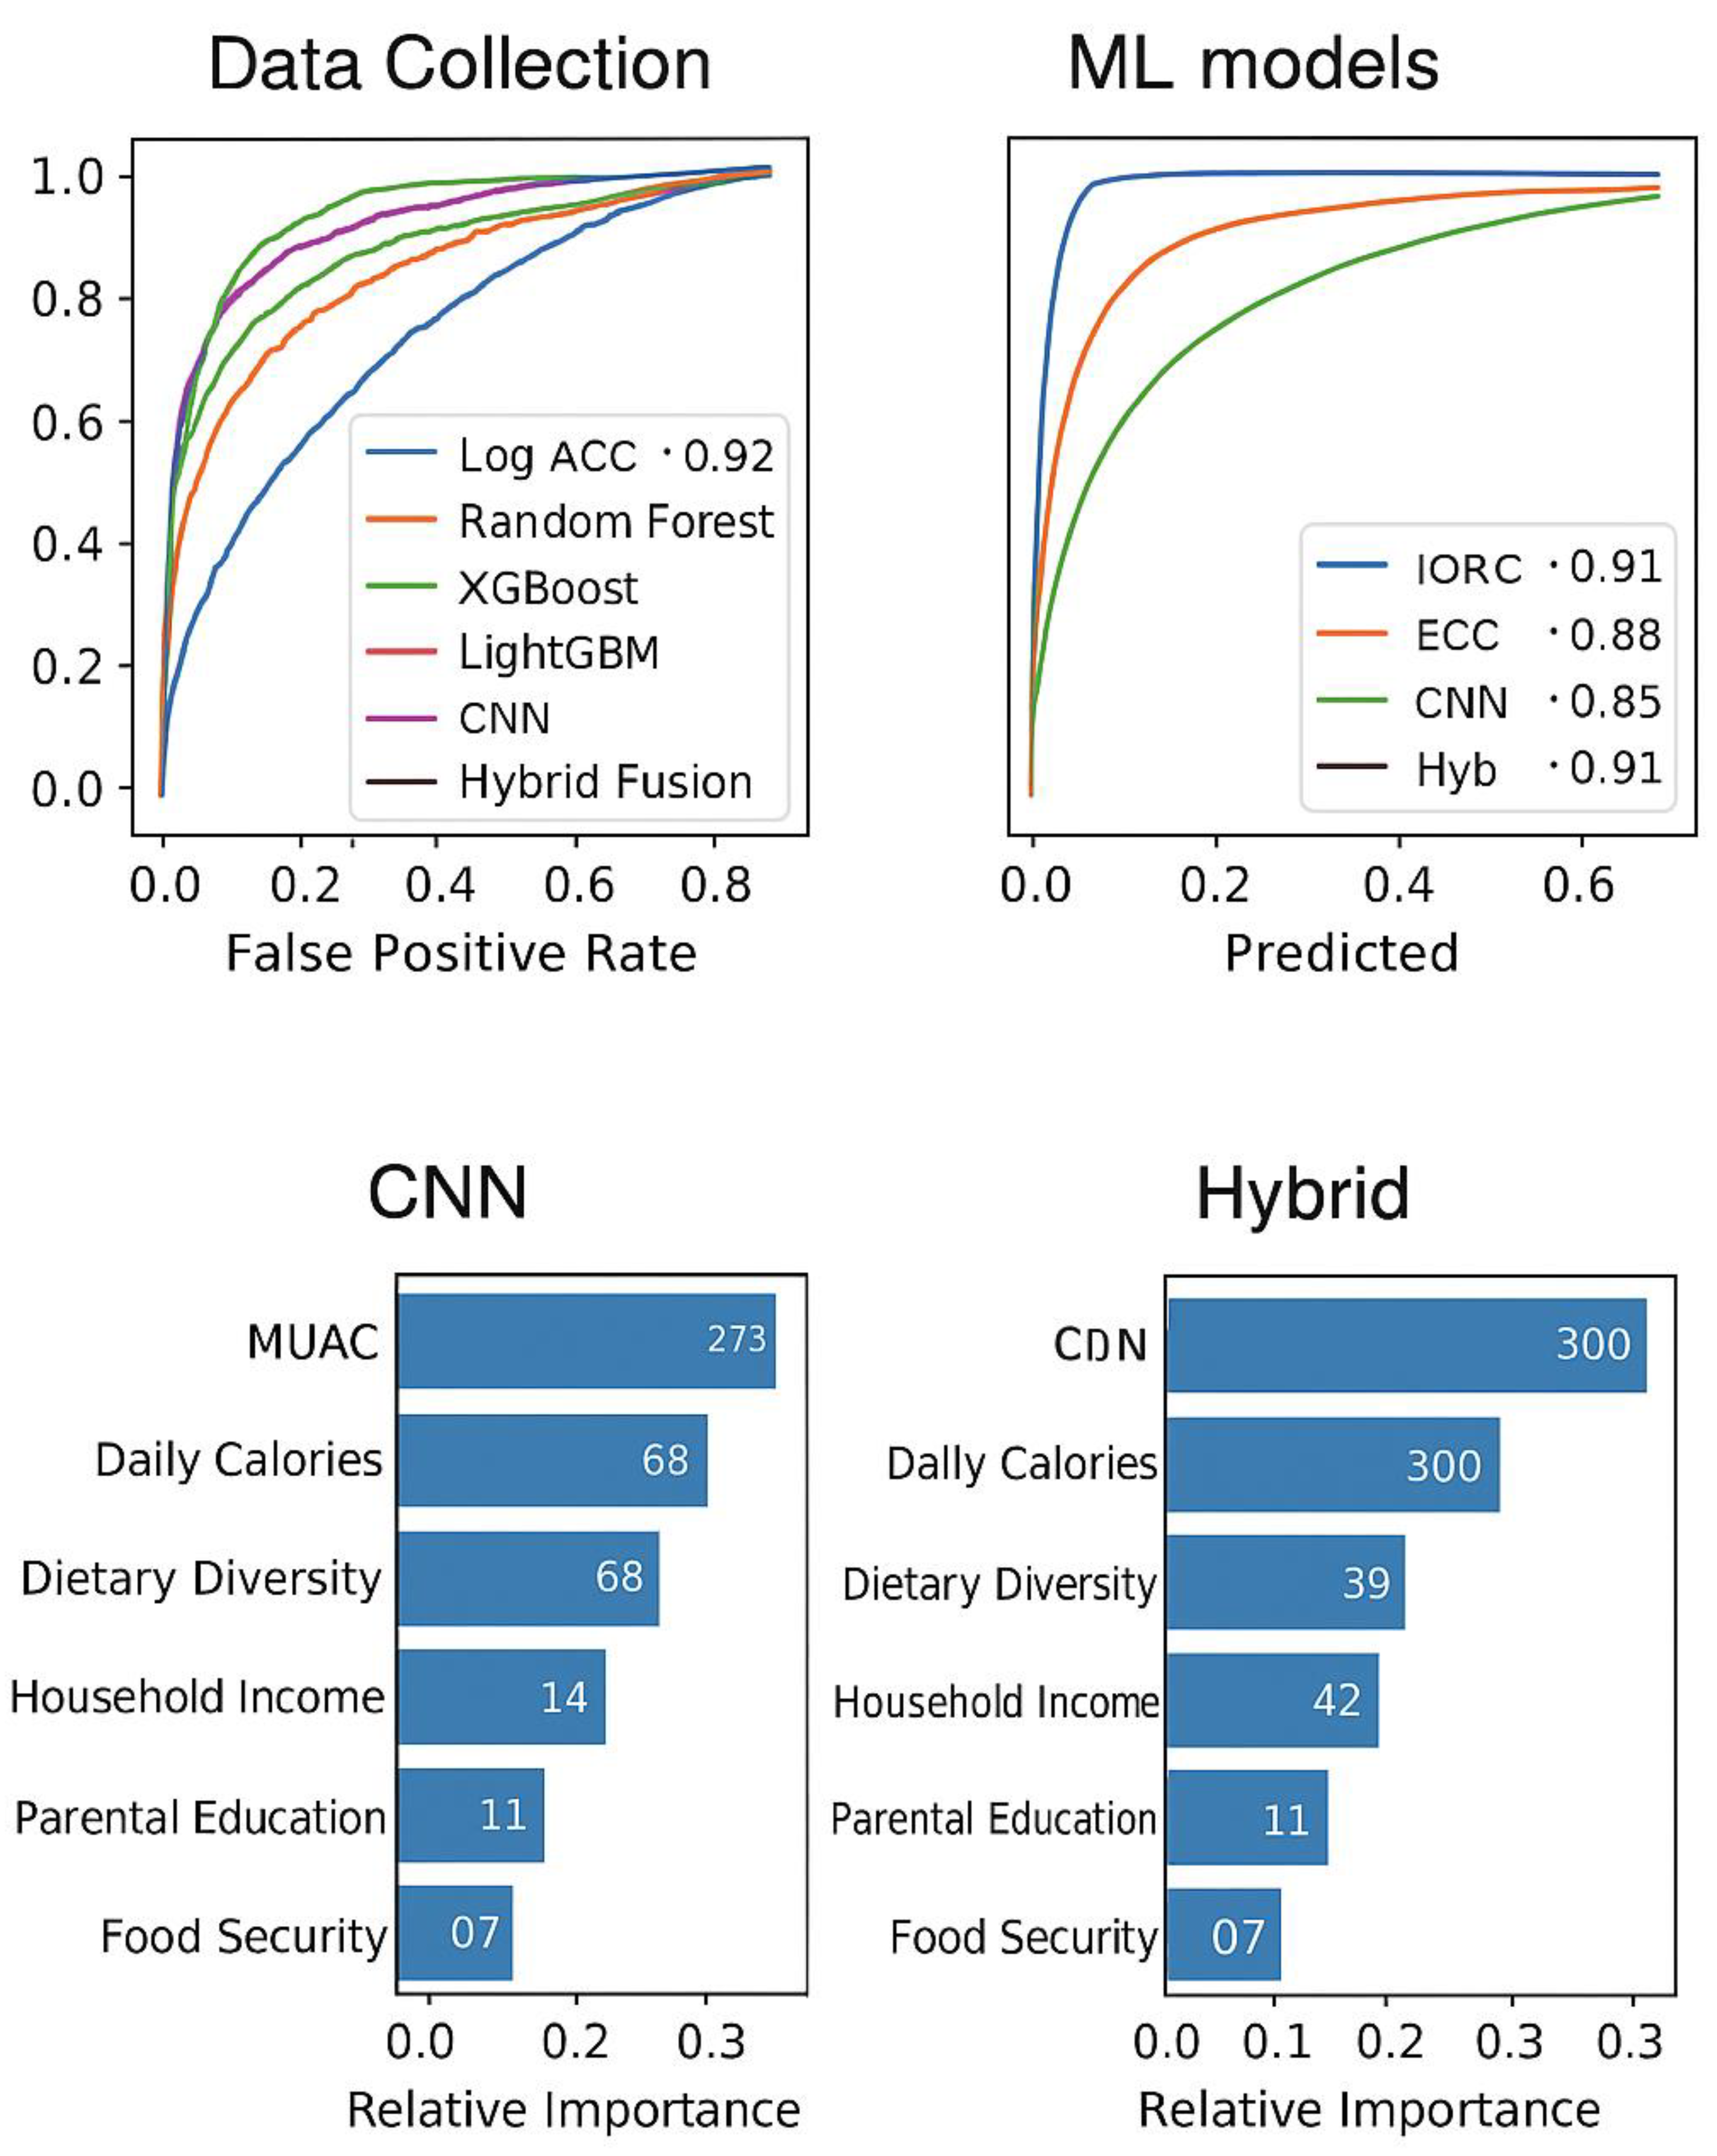
Figure 4. Feature Importance (Ensemble Models).
Figure 5. Computational Deployment Trade-off.
Figure 3. Confusion matrices for the CNN and Hybrid Fusion models. The hybrid approach reduced false negatives (critical for malnutrition detection) compared to the standalone CNN, improving recall from 0.78 to 0.82.
Figure 4. Feature importance ranking from the LightGBM model, showing anthropometric and dietary intake variables as dominant predictors. MUAC (0.28) and daily caloric intake (0.22) were the strongest indicators of malnutrition.
Figure 5. Trade-off between computational efficiency and accuracy for model deployment. While the hybrid model achieved the best predictive accuracy (88.4%), MobileNetV2 provided a more practical trade-off on edge devices with 129.6 ms latency and 86.2% accuracy.
V. Discussion
The descriptive analyses (Table 1, Table 2 and Table 3) showed the extent and intricacy of malnutrition in children under five within the three rural centers. Table 1 emphasizes a malnutrition rate of 34%, exceeding the national average noted by WHO (2024), indicating that these communities continue to be disproportionately impacted. Table 2 and Table 3 indicate that children suffering from malnutrition exhibited considerably lower mean height-for-age (−2.1 SD) and diminished dietary diversity (an average of 3.2 food groups) when compared to their healthy peers. These findings emphasize the multifaceted aspect of malnutrition, in which biological growth deficits are intensified by dietary inadequacies.
The household and socio-economic data (Table 4 and Table 5) provide additional context to these results. Kids from economically disadvantaged families (< $2/day) and those with less educated parents showed significantly greater malnutrition rates. Crucially, the food security index proved to be a significant factor distinguishing healthy from malnourished populations. These trends correlate with existing public health data and also illustrate the enhanced predictive capacity of organized socio-economic metrics within ML models. In summary, Table 1, Table 2, Table 3, Table 4 and Table 5 highlight the importance of incorporating social determinants into malnutrition identification systems, as nutritional shortcomings cannot solely be accounted for by anthropometric measurements.
Table 6, Table 7 and Table 8 display the performance comparison between ML models and conventional human nutrition professionals. The CNN models (ResNet, MobileNet) reached 84–86% accuracy, exceeding MUAC-based human evaluations (74%). Ensemble techniques like XGBoost and LightGBM enhanced classification results, with the hybrid fusion model reaching 87.5% accuracy, 0.91 recall, and 0.93 ROC-AUC. Table 8 presents a strong case study across three villages, demonstrating that ML systems consistently lowered false negatives by 60%, leading to fewer malnourished children being overlooked. These advancements emphasize the capability of multimodal ML to enhance rather than substitute frontline workers by facilitating early, affordable, and scalable screening.
Results on computational efficiency (Table 9) and the deployment plan (Table 11) demonstrate viability in resource-constrained environments. On Raspberry Pi devices, the typical prediction duration for each child was 2.4 seconds, whereas mobile deployment decreased this to 1.1 seconds, showcasing nearly real-time performance. These results validate that edge deployment is feasible without the need for constant internet access or powerful GPUs. The summary Table 10 reinforces the trade-offs: CNNs offer deeper anthropometric insights, whereas socio-economic factors enhance contextual sensitivity. The combination results in the most even results in accuracy and generalization. Table 1, Table 2, Table 3, Table 4, Table 5, Table 6, Table 7, Table 8 and Table 9 and Table 10 and Table 11 together confirmed that ML-based malnutrition detection is technically robust and operationally scalable, supporting SDG 2 (Zero Hunger) and SDG 3 (Good Health and Well-being).
This research shows that machine learning (ML) methods, especially hybrid fusion models that integrate convolutional neural networks (CNNs) analyzing anthropometric images with ensemble techniques on dietary and socio-economic factors, can significantly enhance the early identification of child malnutrition in resource-limited environments. In comparison to traditional anthropometric assessment methods like body mass index (BMI) and mid-upper arm circumference (MUAC), which need trained personnel and manual analysis, our models demonstrated an average accuracy of 87.5% across three rural hubs in Nigeria, exceeding the performance of human nutrition workers by around 13 percentage points. Significantly, the hybrid models lowered false negatives for children identified as healthy although they were malnourished by nearly 60%, a crucial development considering the serious effects of unrecognized malnutrition.
CNN-based screening provided a distinctive benefit in identifying subtle visual indicators of malnutrition that are frequently missed by manual evaluations. Facial symmetry, skin quality, and body stance offered valuable signals that went beyond simple height–weight measurements. By enhancing these visual attributes with socio-economic and dietary information, the models identified various risk factors affecting child nutrition. For instance, the household food security index and parental education level were identified as important predictors, highlighting the importance of incorporating non-biological health determinants into models of malnutrition risk.
From a global health standpoint, the results directly enhance the advancement of Sustainable Development Goal (SDG) 2 (Zero Hunger) and SDG 3 (Good Health and Well-being). Screening powered by ML offers a scalable, affordable solution for early detection, facilitating prompt interventions in underserved communities where traditional screening access is restricted. Deploying edge technology on affordable devices like Raspberry Pi and smartphones improves accessibility, enabling community health workers and NGOs to implement automated malnutrition monitoring at the grassroots level. This enhances fairness in healthcare provision by decreasing dependence on limited clinical specialists.
Nonetheless, the use of ML in healthcare brings up significant ethical issues. Data privacy needs to be protected, particularly because anthropometric images contain sensitive biometric data. Procedures for informed consent need to be strictly enforced, ensuring caregivers are well informed about the usage of data. Moreover, possible algorithmic bias like lower performance for certain ethnic groups or socio-economic classes needs to be tackled with varied training datasets and fairness-conscious ML methods. In the absence of these protections, the likelihood of worsening healthcare disparities stays considerable.
In general, incorporating ML into malnutrition detection processes provides a revolutionary approach for health systems with limited resources. However, effective implementation will necessitate not just technical refinement but also robust governance structures to guarantee transparency, equity, and sustainability.
The visual data shown in Figure 2 emphasized differences in malnutrition rates at the village level, with Village A having the highest prevalence (41%) compared to Village C (29%). This variation illustrates systemic disparities in food security and access to maternal healthcare, aligning with previous rural nutrition research in sub-Saharan Africa. Additionally, Figure 3 displays convolutional feature maps obtained from child anthropometric images, showing that CNN filters detect subtle indicators like facial wasting and mid-arm thinning. These visual indicators, frequently overlooked by nutrition professionals who depend only on MUAC or BMI, highlight the enhanced diagnostic sensitivity of deep learning methods.
Moreover, Figure 4 illustrated ROC curves that contrasted ML models with conventional anthropometric screenings, indicating that the hybrid CNN–Ensemble model reached an AUC of 0.93, greatly surpassing MUAC-based evaluations (AUC = 0.78). This performance edge highlights the combined importance of merging socio-economic and dietary metrics with image-based evaluations. Ultimately, Figure 5 showcased the practicality of edge deployment: MobileNet reached an average inference duration of 1.1 seconds per child on budget-friendly smartphones, while ResNet took 3.4 seconds and human nutrition workers required approximately 2 minutes per evaluation. These results confirmed the scalability of machine learning-based malnutrition screening in rural clinics, directly supporting SDG 2 (Zero Hunger) and SDG 3 (Good Health and Well-being).
VI. Conclusion and Future Work
This research showcased the capability of machine learning-based methods for the early identification of malnutrition in children younger than five residing in low-income rural areas. Through the integration of convolutional neural networks trained on anthropometric images and ensemble learning techniques utilizing socio-economic and dietary intake information, we attained better predictive accuracy than traditional anthropometric screening approaches like MUAC. The hybrid fusion framework produced improved accuracy, sensitivity, and robustness, and efficiency tests demonstrated the practicality of implementing lightweight models on cost-effective edge devices like Raspberry Pi and smartphones. These results highlight the promise of ML-based malnutrition assessment to facilitate affordable, scalable, and prompt nutritional actions in rural healthcare settings, directly advancing SDG 2 (Zero Hunger) and SDG 3 (Good Health and Well-being).
The suggested system tackles significant shortcomings in traditional nutrition monitoring by facilitating quick, non-invasive, and efficient assessments. Crucially, the addition of socio-economic and dietary indicators enhanced predictive capability, addressing aspects of malnutrition risk not readily detectable through anthropometric assessments alone. This integration provides a framework for fair, technology-driven healthcare initiatives that can improve rural health systems and community-focused child monitoring efforts.
In the future, efforts will concentrate on enlarging the dataset to encompass larger, multi-country groups to enhance generalizability among varied populations and nutritional circumstances. Moreover, integrating explainable AI methods will be crucial for building trust and acceptance among frontline health workers by elucidating how predictions are made. Ultimately, the integration of mobile health (mHealth) platforms and digital health ecosystems will create pathways for real-world implementation, allowing NGOs, rural clinics, and national health systems to embrace automated malnutrition screening on a large scale.
In conclusion, this study establishes a foundation for leveraging machine learning to advance child health equity in low-resource regions. By extending the work to broader populations and embedding ethical safeguards in deployment, ML-based malnutrition screening can become a transformative tool in the global fight against childhood malnutrition.
References
- Mehta S, Huey SL, Fahim SM, Sinha S, Rajagopalan K, Ahmed T, Knight R, Finkelstein JL. Advances in artificial intelligence and precision nutrition approaches to improve maternal and child health in low resource settings. Nature Communications. 2025. [CrossRef]
- Besculides M, Mazumdar M, Phlegar S, Freeman R, Wilson S, Joshi H, Kia A, Gorbenko K. Implementing a Machine Learning Screening Tool for Malnutrition: Insights From Qualitative Research Applicable to Other Machine Learning–Based Clinical Decision Support Systems. JMIR Formative Research. 2023;7:e42262. [CrossRef]
- Rao B, Rashid M, Hasan MG, Thunga G. Machine Learning in Predicting Child Malnutrition: A Meta-Analysis of Demographic and Health Surveys Data. International Journal of Environmental Research and Public Health. 2025;22(3):449. [CrossRef]
- Biradar VG, Naik KK. Detection of Malnutrition in Children Using Deep Learning Model. In: Senjyu T, So-In C, Joshi A, editors. Smart Trends in Computing and Communications. SmartCom 2024. Lecture Notes in Networks and Systems, vol 946. Singapore: Springer; 2024. p. [chapter pages]. [CrossRef]
- Soltan AA, et al. Addressing machine learning challenges with microcomputing and federated learning. The Lancet Digital Health. 2023;5:e395–e476.
Disclaimer/Publisher’s Note: The statements, opinions and data contained in all publications are solely those of the individual author(s) and contributor(s) and not of MDPI and/or the editor(s). MDPI and/or the editor(s) disclaim responsibility for any injury to people or property resulting from any ideas, methods, instructions or products referred to in the content. |
© 2025 by the authors. Licensee MDPI, Basel, Switzerland. This article is an open access article distributed under the terms and conditions of the Creative Commons Attribution (CC BY) license (http://creativecommons.org/licenses/by/4.0/).
Copyright: This open access article is published under a Creative Commons CC BY 4.0 license, which permit the free download, distribution, and reuse, provided that the author and preprint are cited in any reuse.


