Submitted:
12 March 2025
Posted:
13 March 2025
You are already at the latest version
Abstract
Plants are an important ecological component of river and lake riparian zones, and the monitoring of plants growth is necessary for the protection of water environment. The traditional manual inspection mode of riparian zone plants is time-consuming and laborious, and the use of artificial intelligence inspection mode has the advantages of high efficiency and real-time. However, for engineering application scenarios such as unmanned aircraft and unmanned boats, the current methods for plant identification in river and lake riparian zones can hardly meet the edge computing deployment requirements such as high accuracy and low computation capacity at the same time. In this study, we constructed a lightweight multiscale Yolo-Mamba network, called MSYM. MSYM's multiscale channel backbone network realizes selective feature combination and convolution (MCC), and improves the information interactivity between feature channels. In addition, the multi-channel visual state space block (MVSS block) is designed to superimpose and fuse multiple scanning modes to improve the efficiency by adopting the multi-channel scanning mode for the computational complexity requirement. At the same time, we constructed a sample bank of plants in the riparian zones of rivers and lakes, which is based on the spatial and temporal patterns of plants in the riparian zones of rivers and lakes, and a sample bank of plants in the riparian zones of rivers and lakes, which is based on the coupling of watersheds with climatic patterns. The experimental results demonstrate that the proposed model achieves excellent recognition accuracy under the application environments of unmanned aerials photography and unmanned boat cruising, with Precision\Recall\F1\IoU reaching 0.947\0.872\0.908\0.831, and FLOPs reduced from 12.1 by yolov8n to 4.1.
Keywords:
unmanned boat
; river and lake environments
; Mamba
; Yolo
; water ecosystem
; plants recognition
1. Introduction
River and lake riparian zones serve as ecological transition zones between terrestrial and aquatic ecosystems, providing crucial habitat for a diverse range of species including birds, fish, insects and other organisms, and supporting efforts to protect ecological diversity [1]. Meanwhile, the construction of reasonable vegetation space can help prevent soil erosion, mitigate riparian erosion and reduce flood risk [2]. However, in recent years, human activities and inadequate control have led to varying degrees of damage to the riparian zones [3]. As such, monitoring plant growth has become a key priority for the spatial control of riparian zones.
Intelligent recognition models have emerged as an important component of the digital twin model platform, forming the overall framework of our digital twin water conservancy. Utilizing satellite remote sensing [4], unmanned aerial remote sensing [5], video monitoring, unmanned boat cruising [6] and other “air, sky, earth, and water” front-end perception technologies, we combine artificial intelligence with water-specific business scenarios to enable intelligent identification and early warnings/predictions of various phenomena in river and lake management/care. This helps improve the intelligent informatization of departmental supervision and law enforcement. Specifically, the synergistic work of unmanned aerials and unmanned boats can achieve efficient monitoring and precise intervention in large-scale ecological restoration, with unmanned devices being easy to operate and available in various configurations, sizes and specialized features adaptable to all water environments. Carrying multiple camera types can remotely acquire plant images in real-time, enabling efficient, safe and accurate ecological environment monitoring in riparian zones, and proving more flexible and safer than traditional manned methods [7]. By integrating intelligent identification models with unmanned aerial and unmanned boats, we can improve inspection frequency and efficiency, count species, quantity and growth status of plants, but arithmetic limitations make it challenging to fully deploy the model framework for unmanned devices, subject to lightweight operations. The high computational effort of the model reduces endurance and limits scope.
Plant images have strong temporal and spatial characteristics compared to people and objects in nature images:
- First, the color and lushness of the plant's leaves vary significantly from season to season. For example, the leaves are usually green and lush in the spring and summer, yellow or falling off in the fall and winter. The same type has different growth cycles, including flowering, fruiting, and defoliation. Each of these periods will have unique visual characteristics.
- In addition, plant morphological structures such as trunks, branches, leaves, flowers, etc., the thickness of the trunks, the angle of the branches, the length, width, and density of the leaves, and the color pattern of the flowers provide different local features of the images for accurately determining the current growth status of the plants.
-
Finally, using unmanned aerials or unmanned boats to acquire image data of plants along the riparian can be affected by light, water spray, and shadows. At the same time, some plants are extremely similar in form, especially in the fall and winter seasons when only the trunks of the trees become challenging to distinguish.
- However, the image data used in many current plant recognition methods do not fully account for the above spatial and temporal heterogeneity, leading to errors or omissions in recognition.
- Therefore, based on the above practical requirements as well as application difficulties, the main contributions of this paper are as follows:
- We propose a multi-scale visual state space block (MVSS) based on the Mamba structure. This block combines and integrates multiple scanning modalities to reduce computational complexity and enhance the efficiency of feature extraction. Additionally, we incorporate the MVSS block to replace the YoloV8 backbone, creating the overall framework for our model.
- We propose a selective channel grouping convolution to address the issue of insufficient information processing in the original channel grouping convolution (MCC). Specifically, we slice the input feature maps along the channel dimension, group them for convolution, and overlay them. This approach enhances the interaction of information across different dimensions.
- Based on the Tupu theory and the idea of the three laws of geography, images were collected for the common plant categories of river and lake ecology including aquatic plants, terrestrial trees, and invasive species. A spatial-temporal sample dataset of riparian zone plants was constructed. Each category integrates different watershed environments, different seasonal factors, and different growth periods.
The rest of this paper is organized as follows: Section 2 discusses existing work related to deep learning-based plant identification methods using Mamba models. Section 3 details the specific method proposed in this paper. Section 4 covers the construction of the dataset and analyzes the experimental results. Finally, Section 5 presents the conclusion.
2. Related Works
2.1. Deep Learning-Based Plants Recognition Methods
Convolutional neural networks can extract higher dimensional spatial features than traditional statistical or machine learning methods and effectively capture local image details through convolutional kernels. Overhead images from unmanned aerial vehicles provide clear views of tree canopies and are commonly used for identification and segmentation of tree species.
Moritake et al. [8] verified that the ResNet\Swin\ViT\ConvNeXt outperforms human observers in the classification accuracy of tree species. Beloiu et al. [9] verified that Faster R-CNN can accurately classify the four categories of Norway spruce, silver fir, Scots pine, and European beech using to train the model for single and multiple tree species, respectively. Zhang et al. [10] proposed a scale sequence residual method, SS Res U-Net, for frailejones tree extraction. The features learned on small scales are gradually transferred to larger scales to achieve multi-scale information fusion while preserving the fine spatial details of interest. Santos et al. [11] evaluated the effectiveness of the Faster R-CNN, YOLOv3, and RetinaNet methods for the endangered tree (Dipteryx alata Vogel). Ventura et al. [12] proposed HR SFANet based on the structure of SFANet to predict single trees in urban environments and then localize them using a peak finding algorithm. Lv et al. [13] proposed an attention-coupled network MCAN to improve the feature extraction ability of the model through a convolutional block attention module, enhance the local detail information detection ability, and improve the individual tree extraction accuracy. Choi et al. [14] predicted tree height, diameter, and location of street trees in Google Street View images based on the Yolo model, which estimates tree profile parameters by determining the tree's relative position to the surface interface.
Transformer [15,16] can better capture long-distance dependencies, and more and more scholars have begun to explore how to introduce the self-attention mechanism into image feature extraction methods. Yuan et al. [17] proposed a lightweight attention-enhanced Yolo method via the necking network CACSNet to enhance the detection of single-grained diseased trees and optimize the loss function to improve localization accuracy. Amirkolaee et al. [18] proposed a semi-supervised TreeFormer for tree counting in satellite imagery. Firstly, multi-scale features are acquired by the Transformer encoder, and subsequently, the encoder output is processed using a designed feature fusion module and a tree density regressor. Finally, tree counter markers are introduced to regulate the network by calculating global tree counts for labeled and unlabeled images. Gibril et al. [19] proposed a SwinT-based instance segmentation framework for detecting individuals of date palm trees.
Satellite remote sensing and airborne remote sensing images are limited to the canopy, while trunks and branches provide essential features for classifying specific tree species [20]. Managing urban greening often requires monitoring tree diseases, tree growth status, and tree species, which is usually done with natural images from flat or overhead viewpoints. Li et al. [21] proposed TrunkNet, a tree trunk detection method for urban scenes, which adds a texture attention module to increase the attention to the bark features and improve the detection accuracy. Benchallal et al. [22] proposed a semi-supervised ConvNeXt method to fully use many unlabeled data to train the model for weed species identification and characterization without labeled data. Qian et al. [23] increased the multi-scale feature fusion capability of the network by adding RFB and SA modules that realized real-time identification and monitoring of Eichhornia crassipes under different environmental and weather conditions. Li et al. [24] proposed a tree species identification and factor explanation model Ev2S_SHAP to explain the effects of environmental and foliage factors on tree identification and recognition accuracy. Sun et al. [25] provided a dataset of plant images in a natural scene based on residual modeling for large-scale plant species classification.
Existing plant recognition methods typically use datasets limited to a single viewpoint image. We address this limitation by constructing a dataset that aligns with the spatial-temporal characteristics of plants in terms of climate and watershed, enabled by unmanned equipment application scenarios. We also design a new YOLO structure to enhance the extraction accuracy of multiscale feature information.
2.2. Mamba-Based Image Recognition Methods
The multi-head self-attention mechanism brings O(n2) quadratic time complexity, and although the training method can be processed in parallel, the inference process is relatively slow. Mamba [26] introduces a hidden structured state space sequence model into the input-to-output steganography process to achieve linear computational complexity. Since natural images do not have apparent sequential relationships compared to, for example, language, how image blocks are scanned has been a focus of researchers. For example, local scanning is able to capture richer detail information by dividing the image into smaller graphic blocks and then scanning each image block locally and separately [27].
VMamba [28] proposed an SS2D module using a four-way scanning strategy, i.e., scanning from all four corners of the feature map simultaneously to ensure that each element in the feature integrates information from all other locations in a different direction, resulting in a global sensory field. EfficientVMamba [29] integrated a selective scanning method based on atrous through efficient jump sampling that utilizes both global and local representations of features.
Many base models combined with Mamba have demonstrated powerful performance, including image classification, target detection, and semantic segmentation. Mamba-YOLO [30] builds on the YOLO architecture by combining the wavelet transform with the LSBlock and RGBlock modules to improve the modeling of local image dependencies for more accurate detection.VM-UNet [31] Based on the encoder-decoder structure of UNet, VSS blocks employing a new fusion mechanism is introduced to preserve spatial information at different scales of the network. The results show that VM-UNet outperforms multiple types of UNet for medical image segmentation. MambaVision [32] proposes a hybrid Mamba-Transformer architecture, and the experimental results show that adding self-attention blocks to the last layers of the Mamba architecture improves the modeling ability of the model to capture spatial dependencies over long distances.
Currently, Mamba has also been widely used in remote sensing. Chen et al. [33] proposed a multipath scanning activation mechanism to improve the modeling ability of the mamba structure for non-causal data. Yao et al. [34] addressed the problem of high computational complexity due to the difficulty of parallelizing the classification task of hyperspectral images. They proposed the PSS and GSSM to simplify the order in the state domain learning and correcting spectra in the spatial, spectral domain. Zhao et al. [35] proposed RS-Mamba to globally model the background of an image in multiple directions by using an omnidirectional selective scanning module to capture large spatial features from all directions. Extensive experiments on semantic segmentation and change detection tasks for various types of features proved better efficiency and accuracy than Transformer.
This paper addresses the high computational effort of the Mamba structure by pre-emptively reducing the number of channels with convolution to ensure unchanged scanning diversity (i.e., forward, reverse, forward flip, and reverse flip), thereby improving the ability to characterize local information in plant images.
3. Methods
3.1. State Space Model
The sequence transformation structure used in Mamba is derived from the structured state-space sequence model S4 [26], which effectively solves the problem of high computational complexity and difficulty in modeling long and complex sequences of traditional sequence models. It maps the input sequence to the output sequence by hiding the state-space representation . The process is expressed using the following linear ordinary differential equation:
where denotes the size of the state space, denotes the parameters of the state space evolution process, and denote the neural network training parameters. is the derivation of the state space representation.
In order to be able to handle discretized data, a learnable step parameter is introduced. The continuous parameters and are transformed to obtain the discrete parameters and using zero-order holding.
The discretization leads to the new expression equation as follows:
where and denote the state at the current moment and the previous moment, respectively.
Finally, the SSM blocks are represented as convolutional computations to realize parallel computation in neural networks.
where is the convolution kernel, is the length of the sequence , and , are the input and output sequences, respectively.
3.2. Overall Structure of MSYM
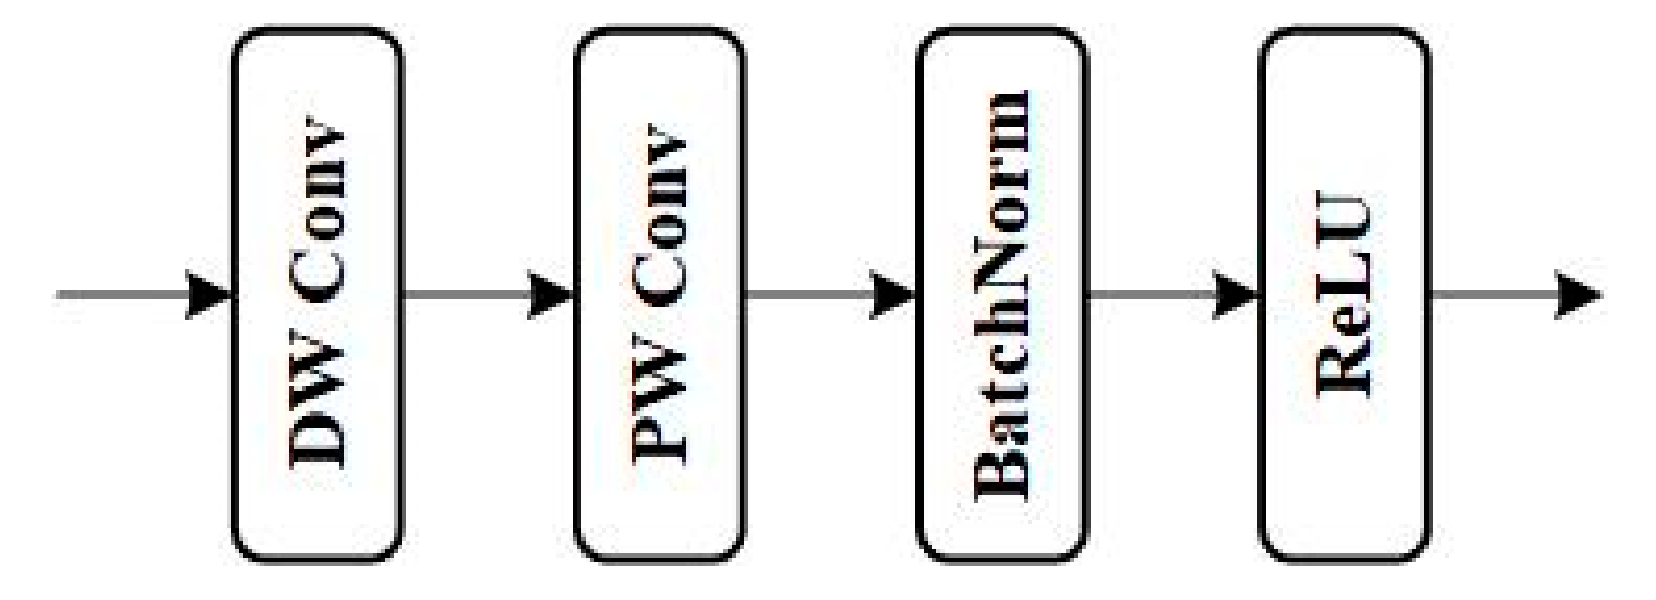
The proposed MSYM structure is shown in Figure 1. It consists of three main parts: the MSYM backbone network, the neck network, and the segmentation head. The backbone network first expands the input channel through an initial convolution (InitConv). Then, it is stacked by the combination of multiple MVSS blocks and depth-divisible convolution. The MVSS blocks adopt multi-scale channel convolution (MCC) and multi-channel scan (MC Scan) to extract image features at different scales. Both the neck network and segmentation head use the original structure in Yolov8 [36]. The InitConv has a 3×3 convolutional kernel. The depth block combines depthwise convolution (DW Conv) and pointwise convolution (PW Conv) to improve feature fusion capability and computational efficiency. Finally, it will go through batch normalization (BN) and ReLU activation function.
Figure 1.
Overall structure of MSYM.
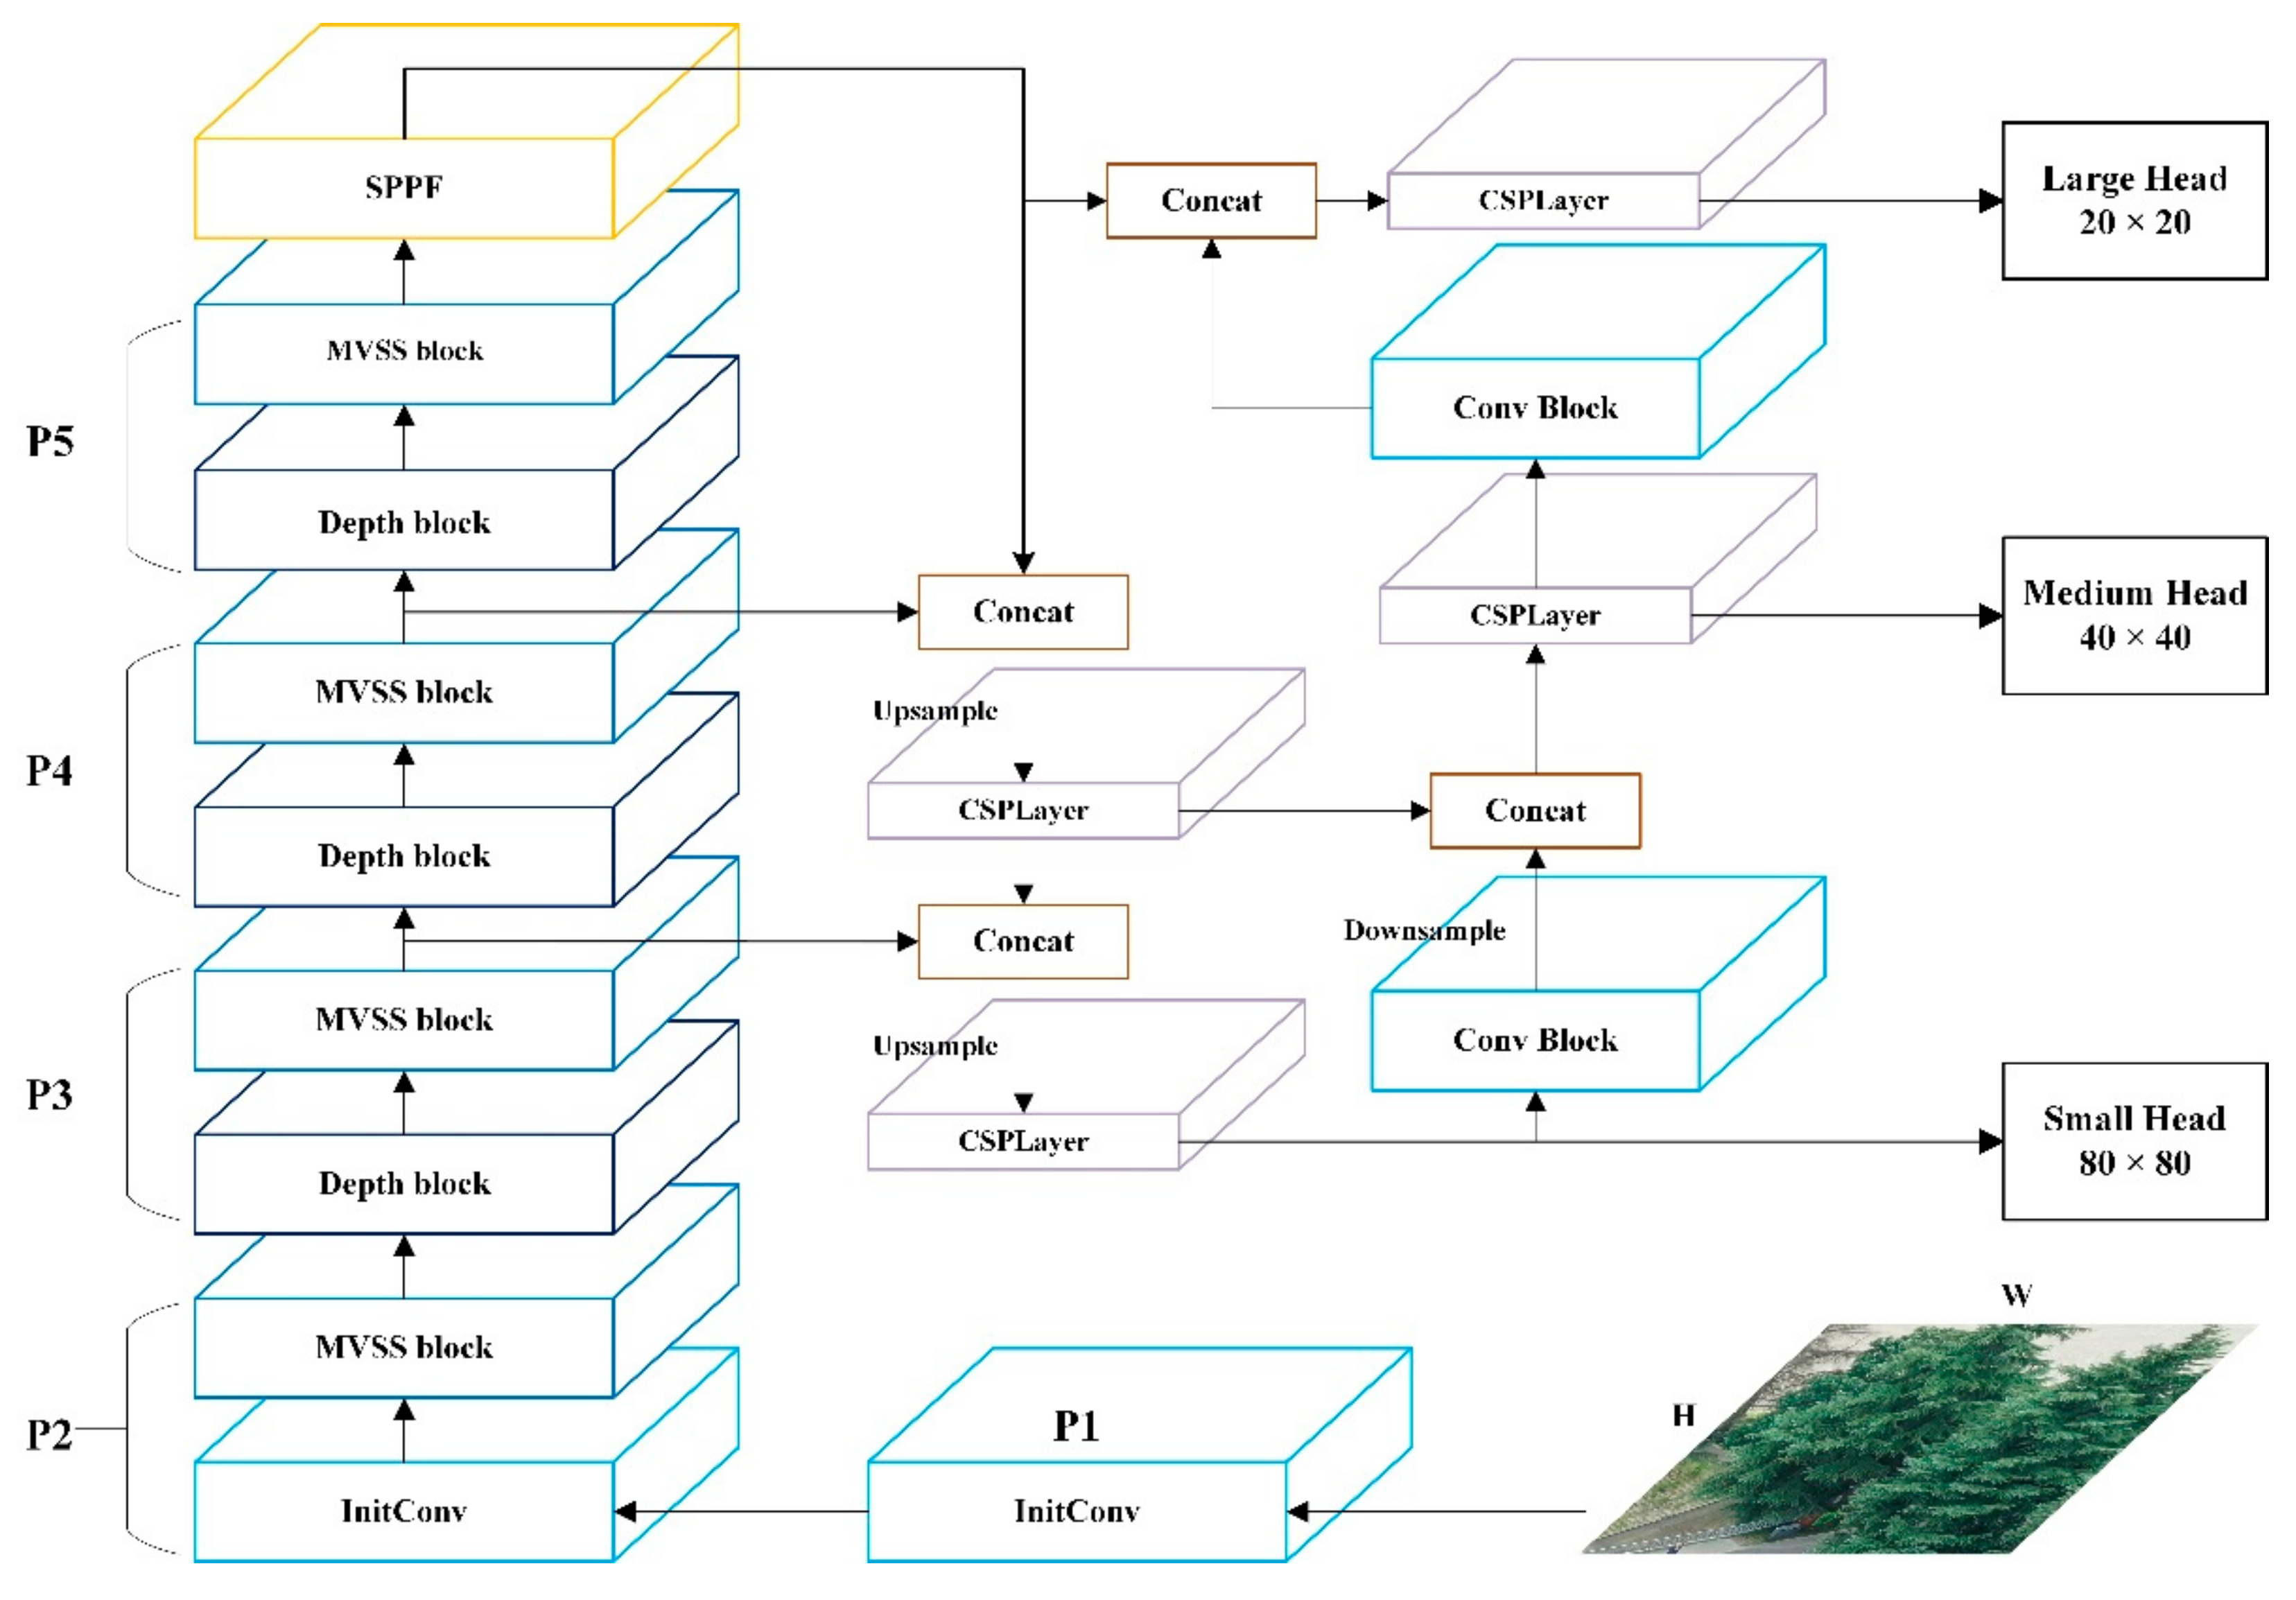
Figure 2.
Depth block structure.
3.3. Multi-scale Channel Convolution
As shown in Figure 3, multi-scale channel convolution (MCC) is the primary convolution operation of MSYM. It is based on the multi-scale convolution of residual blocks [37], which enhances information interaction between channel groupings. In contrast, to deepen feature computation, the order is randomly disrupted after grouping and reordered after convolution.
The input X first enters the main path through a 1 × 1 convolution, batch normalization, and ReLU activation function. With uniform division into s groups along the channel dimension, each group processes different features. Taking s=4 as an example, the second group passes through a 3×3 convolution, batch normalization, and ReLU activation function; starting from the third group, the output features of the previous group are combined with the input features of the next layer to form new inputs. The first group in the original multi-scale convolutional residual block is not convolved, and here, the output of the fourth group is combined with the first group and also convolved with a 3×3 size, batch normalized, and ReLU activated. After each group processes features independently as above, they are concatenated into a composite feature vector by Concatenate and restored to the original dimension by 1×1 convolution with batch normalization to get X2.
In short connected paths, the initial input and final output of the main path are directly connected. The input is processed by 1×1 convolution operation with batch normalization to obtain X1. Finally, the output features of the two paths are superimposed, and the final feature output result Y of this MCC is obtained by the ReLU activation function.
3.4. MVSS Block
3.4.1. Multi-Channel Visual State Space Block
Mamba is used in MVSS instead of a convolutional approach to improve the recognition of long-distance relationships in images. At the same time, it avoids the problem of excessive global computation in self-attention and is suitable for lightweight deployment.
The specific structure of the multi-channel visual state space block MVSS block is shown in Figure 4.
where the input is convolved with MCC as described above to obtain . A split-channel fusion scan is performed using MC Scan, and after using a different scan order for each group, it is re-stacked and residually concatenated with the original input to obtain . Finally, the output of the MVSS Block is obtained as after a depth-separable convolution, batch normalization with SiLU activation function.
The multiscale scanning MC Scan aims to combine more image location information while maintaining a consistent dimension for the feature map. Specifically, the primary path input Y is first passed through a linear layer, a deep convolution, and a SiLU activation function. Subsequently, the secondary path is fused with the output of the primary path by point-by-point multiplication of the spatial features after passing through the linear layer and SiLU activation function using MC Scan. The fused result is normalized by layers and finally the result is output through a linear layer.
3.4.2. Multi-Channel Scan
The Multi-channel Scan (MC Scan) method is shown in Figure 5. It includes two parts: multi-channel scan and multi-channel merge. Firstly, the feature is input, and the channel dimension is reduced to after 1×1 convolution to get. Multi-Channel Scanning: is duplicated into four copies, and four scanning modes (1) forward, (2) reverse, (3) forward flip, and (4) reverse flip are performed respectively, and stacked together to obtain . can keep the channel dimension unchanged and has multiple scanning information. The multi-channel merge use a 1×1 convolution to amplify the channel to to get , and the final output is obtained by summing the feature results in the scanning order.
4. Experiments
4.1. Dataset and Evaluation Metrics
4.1.1. River and Lake Riparian Zone Plant Dataset
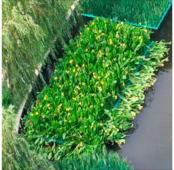
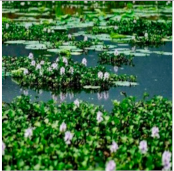
The original data of this paper's dataset comes from videos taken by unmanned aerials and unmanned boats along rivers and lakes all over the country. After comparison and confirmation with the actual species and expert identification, the species in the vegetation dataset of rivers and lakes are categorized as shown in Table 1 below, which contains 5,400 vegetation images in 11 categories. Including aquatic plants and terrestrial trees. The river and lake riparian zone vegetation dataset is randomly divided into training sets, validation sets, and test sets according to the ratio of 8:1:1.
4.1.2. River-Lake Basin Coupling Plant Phenology Data Set
- Phenology data
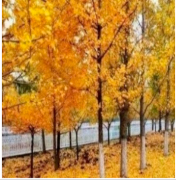
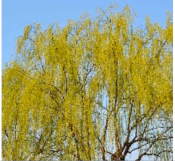
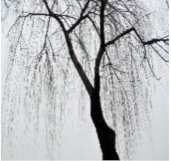
Firstly, some unmanned aerial and boat images were taken at a distance from the shore, and vegetation texture information was not obvious. Therefore, additional close-up photos of various vegetation types were crawled from the network, which were rich in texture details and located in different scenarios. These images increased the diversity of the dataset's vegetation images. Secondly, vegetation presents different geometric, textural, and spectral attributes in different environments and seasons. If these couplings are not considered, the actual application range of the trained deep learning model will be limited. Therefore, images of various vegetation types in the lush, deciduous, and other periods were supplemented to increase the robustness of the vegetation dataset for river and lake riparian zones. Table 2 shows willow tree data.
- 2.
- Sample Data Augmentation
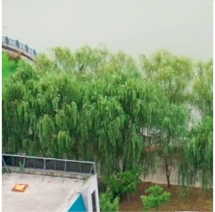
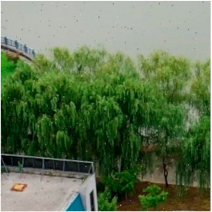
In actual river and lake applications, meteorological conditions such as rainy and cloudy days are often encountered, leading to poor image quality (e.g., blurred images, image blocking, low light, etc.). Meanwhile, the shooting view angle cannot be stabilized at the ideal position for an extended period (e.g., elevation view angle, top view angle, side view angle, etc.). In this paper, we utilize random combinations of increased Gaussian noise, brightness/contrast adjustment, random angle rotation, flipping, and other random combinations for sample data enhancement. Importantly, this process balances the number of samples for each vegetation type, reducing category feature bias. Table 3 below illustrates the sample data enhancement effect.
4.1.3. Evaluation Metrics
In this paper, we use Precision, Recall, F1-Score, and IoU as the metrics for semantic segmentation accuracy evaluation. Precision is the proportion of true positive samples among the predicted positive samples, which measures the “false detection rate” of the model. Recall is the proportion of true positive samples that are correctly detected, which measures the “miss detection rate” of the model. F1 is a comprehensive index that balances the precision and recall. IoU calculates the overlapping rate of predictions and truth values, i.e., the ratio of their intersection and concatenation. The formula is as follows:
This paper uses FLOPs to measure model complexity. FLOPs are the number of floating point operations required for inference on a single image. It measures the computational efficiency, and high FLOPs may limit the application on low-computing-power devices.
4.2. Results
As shown in the Table 4 below, the confusion matrix was used to visualize the correspondence between the predictions of this method and the real labels. Among them (1) cypress (2) lotus (3) iris (4) chicken trefoil (5) willow (6) reed (7) eichhornia crassipes (8) sequoia (9) pine (10) ginkgo (11) camphor.
For Precision, ginkgo reached the highest value of 0.985 and eichhornia crassipes the lowest of 0.895, while for Recall, eichhornia crassipes reached the highest of 0.966 and gginkgo the lowest of 0.806. The composite indicators F1 and IoU were both the highest for cypress at 0.959 and 0.921 respectively, and the lowest for willow at 0.859 and 0.753 respectively.
We further analyzed the results of the confusion matrix in terms of plants characteristics in conjunction with the evaluation metrics. 2, 3, 6, and 7, the four categories of aquatic plants, were often confused during the non-flowering period. 4, 5, 8, and 10, the four categories of woody plants, had significant differences in leaf color and morphology. During the deciduous period, it is difficult to distinguish between them based on trunk characteristics alone at low resolution.
4.3. Comparison Experiments
We choose the yolov8n model with the smallest number of parameters to compare with the backbone network using only multi-scale channel convolution MCC to verify the feasibility of the MYSM proposed in this paper. The experimental results are shown in Table 5.
As shown in Table 5, yolov8n shows very efficient performance, but the computation is the highest 12.0. while MCC-backbone in Precision\F1\IoU is slightly reduced 0.956\0.941\0.888 from 0.969\0.946\0.898, and Recall is able to be flat, but the FLOPs are reduced from 12.0 to 10.3. Our proposed MSYM takes full consideration of the lightweighting of the model and significantly reduces the FLOPs to 4.1, which sacrifices a certain degree of accuracy but drastically reduces the computational requirements and is suitable for a wide range of application scenarios such as the regulation of plants in riparian zones with rivers and lakes.
4.4. Ablation Experiments
The MSYM proposed in this paper mainly consists of multi-scale channel convolution MCC and multi-channel scanning MC Scan. in order to evaluate the effectiveness of each module of the method, we carried out comparative experiments on the constructed dataset, and gradually added improvement schemes. Where, + MCC without MC Scan refers to using MCC with unimproved Mamba; + MC Scan without MCC refers to Mamba without MCC but after using the improved scanning method; + MCC and + MC Scan refers to the complete model structure proposed in this paper. The specific experimental results are shown in Table 6.
After the introduction of MC convolution and Mamba mechanism, the computational complexity is increased, sacrificing a certain Precision, which is reduced from 0.969 to 0.956, and Recall is basically equal.
For a larger range of image tasks such as plants segmentation, after using the reduced-channel MC Scan approach in the Mamba structure, the FLOPs are significantly reduced from 11.5 to 4.0 and 4.1, indicating that the MC Scan is able to fulfill the task of reducing the computation well and is more suitable to be deployed and run on an unmanned device. And after using MCC, Precision rises from 0.843 to 0.947 and Recall from 0.739 to 0.872, indicating that selective combined convolution after grouping the feature map channels can improve the utilization efficiency of model information.
4.5. Visualization and Disscusions
In order to verify the recognition effect of the model proposed in this paper under the working viewpoint of unmanned aerials and unmanned boats, we conducted empirical experiments. Fig. 6 demonstrates the segmentation results of plant.
As shown in Figure 6, the first and third rows are the original images, and the second and fourth rows are the corresponding recognition segmentation results. In (a) and (c), the occluded plants circled are missed; in (b), the circled plants are still well segmented even if only the branches are left, but their specific types remain to be examined. The eichhornia crassipes was not recognized in (d) because of the high flight altitude and low image clarity; the distant trees in (f) are blurred and unrecognizable. The segmentation of the fallen iris in (g) is inaccurate.
Although the reeds in (e) have been segmented very accurately as a result, a closer look reveals that there is still lotus leaves mixed in the original image, which is a class of phenomena that is difficult to deal with.
In most cases, accurate plants recognition and segmentation can be achieved. Due to the limitations of image resolution and camera viewpoint, the segmented boundaries are still inaccurate in some cases. Future research will focus on how to deal with more complex water environments, such as occlusion situations and low-resolution situations.
5. Conclusions
To address the current needs of intelligent identification models for ecological environment regulation in river and lake riparian zones, this paper proposes a lightweight model called MSYM, suitable for deployment in unmanned boats and drones for identifying and counting plants in the watershed range. MSYM is based on the architecture of YOLOv8 and adopts the multiscale channel convolution (MCC) as the base convolution block of the backbone network, enhancing the feature channel's information interaction ability. Meanwhile, a multi-scale visual state space (MVSS) block is proposed, overlaying and integrating multiple scanning methods to reduce computational complexity and ensure efficient feature extraction. Finally, a sample dataset containing 11 plant types is constructed, considering seasons and growth cycles to improve the model's spatial-temporal generalization ability. The study shows that the proposed method achieves excellent recognition results on the test set, with accuracy evaluation metrics Precision, Recall, F1, and IoU reaching 0.947, 0.872, 0.908, and 0.831, respectively. The computational efficiency evaluation metric FLOPs is 4.1.
For future work, we plan to conduct follow-up research in two aspects: (1) Refine the plant classification system and enable more comprehensive plant statistics from different monitoring viewpoints (air, ground, and water) and weather conditions, including plant number, planted area, plant diseases, etc. (2) The current model has high computational cost, and the segmentation process needs further optimization for improved engineering application efficiency.
Author Contributions
Conceptualization, L.J. and X.W.; methodology, X.W.; resources, J.Z. and R.W.; data curation, K.W.; writing—original draft preparation, C.L.; writing—review and editing, X.W. All authors have read and agreed to the published version of the manuscript.
Funding
This research was funded by the Department of Water Ecology and Environment, China Institute of Water Resources and Hydropower Research, grant number WE110145C082023; the Department of Water Ecology and Environment, China Institute of Water Resources and Hydropower Research, grant number WE0145C032024.
Data Availability Statement
Unfortunately, the data is not available due to the supervision of the State Key Laboratory of Water Cycle and Water Security in River Basin.
Conflicts of Interest
The authors declare no conflicts of interest.
Abbreviations
The following abbreviations are used in this manuscript:
| MSYM | Multi scale Yolo Mamba |
| MVSS | Multi-channel visual state space block |
| MCC | Multi-scale Channel Convolution |
| BN | batch normalization |
References
- Fiorentini, Nicholas, et al. "Remote Sensing and Machine Learning for Riparian Vegetation Detection and Classification." 2023 IEEE International Workshop on Metrology for Agriculture and Forestry (MetroAgriFor). IEEE, 2023.
- Reid, Andrea J., et al. "Emerging threats and persistent conservation challenges for freshwater biodiversity." Biological reviews 94.3 (2019): 849-873.
- Hu, Jinlong, et al. "Landscape ecological security of the lijiang river basin in China: Spatiotemporal evolution and pattern optimization." Sustainability 16.13 (2024): 5777.
- Huylenbroeck, Leo, et al. "Using remote sensing to characterize riparian vegetation: A review of available tools and perspectives for managers." Journal of environmental management 267 (2020): 110652.
- Song, Fei, et al. "UAV Quantitative Remote Sensing of Riparian Zone Vegetation for River and Lake Health Assessment: A Review." Remote Sensing 16.19 (2024): 3560.
- Procop, Ionut, et al. "Semi-Autonomous System for Lakes and Rivers Depollution." 2022 26th International Conference on System Theory, Control and Computing (ICSTCC). IEEE, 2022.
- Huang, Ziyi, et al. "Dynamic Path-Planning Approach of Garbage Cleanup Oriented Unmanned Ship Based on Simplified Flow Velocity Prediction." Contemporary Mathematics (2024): 1672-1694.
- Moritake, Koma, et al. "Sub-alpine shrub classification using UAV images: Performance of human observers vs DL classifiers." Ecological Informatics 80 (2024): 1-16.
- Beloiu, Mirela, et al. "Individual tree-crown detection and species identification in heterogeneous forests using aerial RGB imagery and deep learning." Remote Sensing 15.5 (2023): 1463.
- Santos, Anderson Aparecido dos, et al. "Assessment of CNN-based methods for individual tree detection on images captured by RGB cameras attached to UAVs." Sensors 19.16 (2019): 3595.
- Santos, Anderson Aparecido dos, et al. "Assessment of CNN-based methods for individual tree detection on images captured by RGB cameras attached to UAVs." Sensors 19.16 (2019): 3595.
- Ventura, Jonathan, et al. "Individual tree detection in large-scale urban environments using high-resolution multispectral imagery." International Journal of Applied Earth Observation and Geoinformation 130 (2024): 103848.
- Lv, Lujin, et al. "A deep learning network for individual tree segmentation in UAV images with a coupled CSPNet and attention mechanism." Remote Sensing 15.18 (2023): 4420.
- Choi, Kwanghun, et al. "An automatic approach for tree species detection and profile estimation of urban street trees using deep learning and Google street view images." ISPRS Journal of Photogrammetry and Remote Sensing 190 (2022): 165-180.
- Vaswani A, Shazeer N, Parmar N, et al. Attention is all you need[C] //Proceedings of the 31st International Conference on Neural Information Processing Systems. New York: ACM Press, 2017: 6000-6010.
- Dosovitskiy A, Beyer L, Kolesnikov A, et al. An image is worth 16x16 words: Transformers for image recognition at scale[OL]. [2022-02-25]. arxiv, arXiv:2010.11929.
- Yuan, Quanbo, et al. "A Lightweight Pine Wilt Disease Detection Method Based on Vision Transformer-Enhanced YOLO." Forests 15.6 (2024): 1050.
- Amirkolaee, Hamed Amini, Miaojing Shi, and Mark Mulligan. "TreeFormer: a Semi-Supervised Transformer-based Framework for Tree Counting from a Single High Resolution Image." IEEE Transactions on Geoscience and Remote Sensing (2023).
- Gibril, Mohamed Barakat A., et al. "Deep convolutional neural networks and Swin transformer-based frameworks for individual date palm tree detection and mapping from large-scale UAV images." Geocarto International 37.27 (2022): 18569-18599.
- Carpentier, Mathieu, Philippe Giguere, and Jonathan Gaudreault. "Tree species identification from bark images using convolutional neural networks." 2018 IEEE/RSJ International Conference on Intelligent Robots and Systems (IROS). IEEE, 2018.
- Li, Rao, et al. "Tree trunk detection in urban scenes using a multiscale attention-based deep learning method." Ecological Informatics 77 (2023): 102215.
- Benchallal, Farouq, et al. "ConvNeXt based semi-supervised approach with consistency regularization for weeds classification." Expert Systems with Applications 239 (2024): 122222.
- Qian, Yukun, et al. "Real-time detection of Eichhornia crassipes based on efficient Yolov5." Machines 10.9 (2022): 754.
- Li, Ziyang, et al. "Urban street tree species identification and factor interpretation model based on natural images." Urban Forestry & Urban Greening 101 (2024): 128512.
- Sun, Yu, et al. "Deep learning for plant identification in natural environment." Computational intelligence and neuroscience 2017.1 (2017): 7361042.
- Gu, Albert, and Tri Dao. Mamba: Linear-time sequence modeling with selective state spaces. arxiv, 2023; arXiv:2312.00752.
- Zhu, Lianghui, et al. "Vision mamba: Efficient visual representation learning with bidirectional state space model.". arxiv, 2024; arXiv:2401.09417.
- Liu, Yue, et al. "VMamba: Visual State Space Model.". arxiv, 2024; arXiv:2401.10166.
- Pei, Xiaohuan, Tao Huang, and Chang Xu. "Efficientvmamba: Atrous selective scan for light weight visual mamba.". arxiv 2024, arXiv:2403.09977.
- Wang, Zeyu, et al. "Mamba YOLO: SSMs-Based YOLO For Object Detection.". arxiv, 2024; arXiv:2406.05835.
- Ruan, Jiacheng, Jincheng Li, and Suncheng Xiang. "Vm-unet: Vision mamba unet for medical image segmentation.". arxiv, 2024; arXiv:2402.02491.
- Hatamizadeh, Ali, and Jan Kautz. "Mambavision: A hybrid mamba-transformer vision backbone.". arxiv, 2024; arXiv:2407.08083.
- Chen, Keyan, et al. "Rsmamba: Remote sensing image classification with state space model." IEEE Geoscience and Remote Sensing Letters (2024).
- Yao, Jing, et al. "Spectralmamba: Efficient mamba for hyperspectral image classification.". arxiv, 2024; arXiv:2404.08489.
- Zhao, Sijie, et al. "Rs-mamba for large remote sensing image dense prediction.". arxiv, 2024; arXiv:2404.02668.
- Yaseen, M. "What is YOLOv8: An in-depth exploration of the internal features of the next-generation object detector. arxiv, 2024; arXiv:2408.15857. [Google Scholar]
- Liu, Yuan, et al. "MS-CNN: multiscale recognition of building rooftops from high spatial resolution remote sensing imagery." International Journal of Remote Sensing 43.1 (2022): 270-298.
Figure 3.
Multi-scale channel convolution structure.
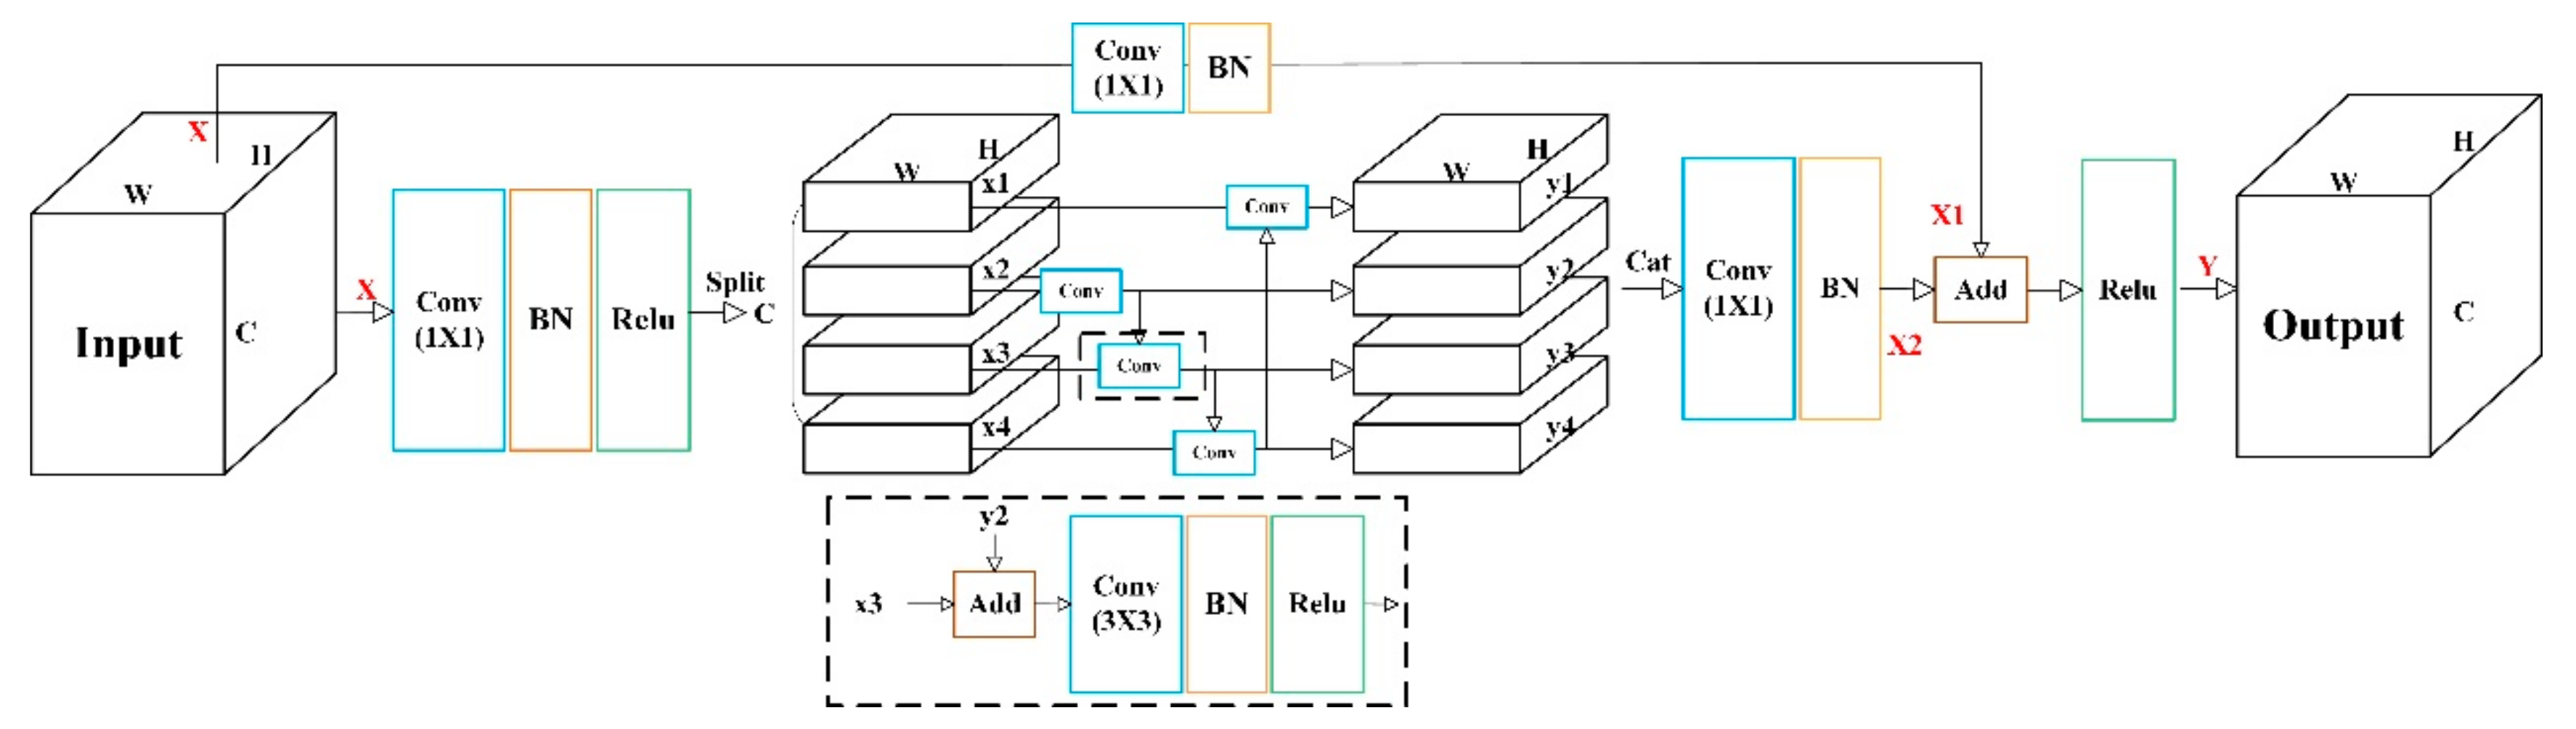
Figure 4.
MVSS structure.
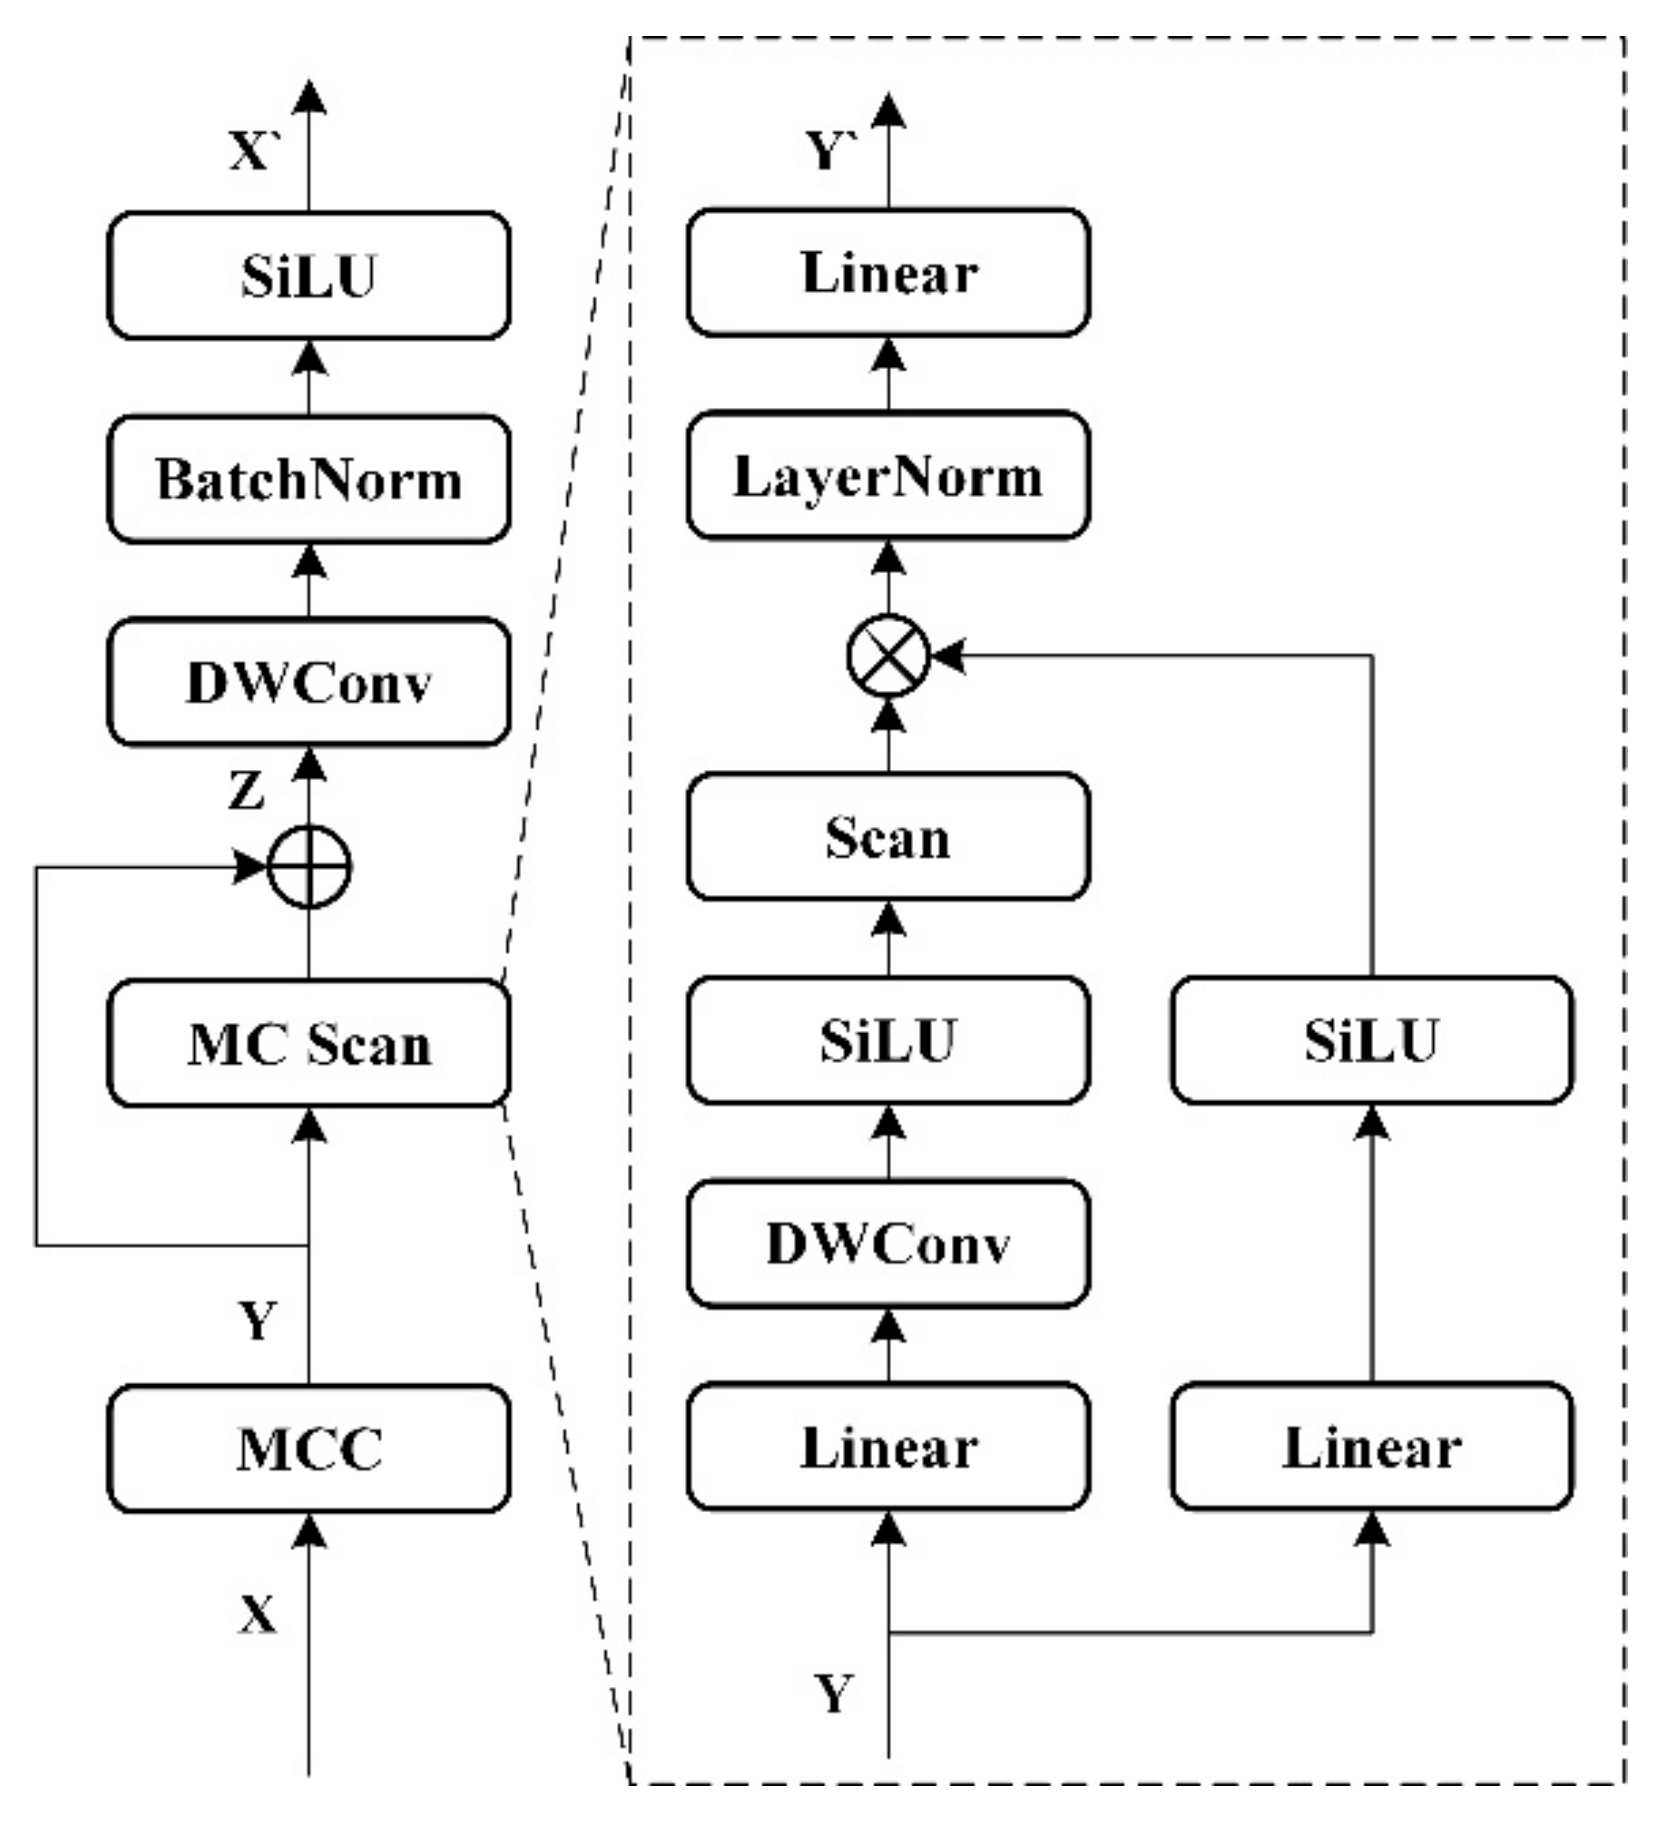
Figure 5.
Multi-channel Scan Process.
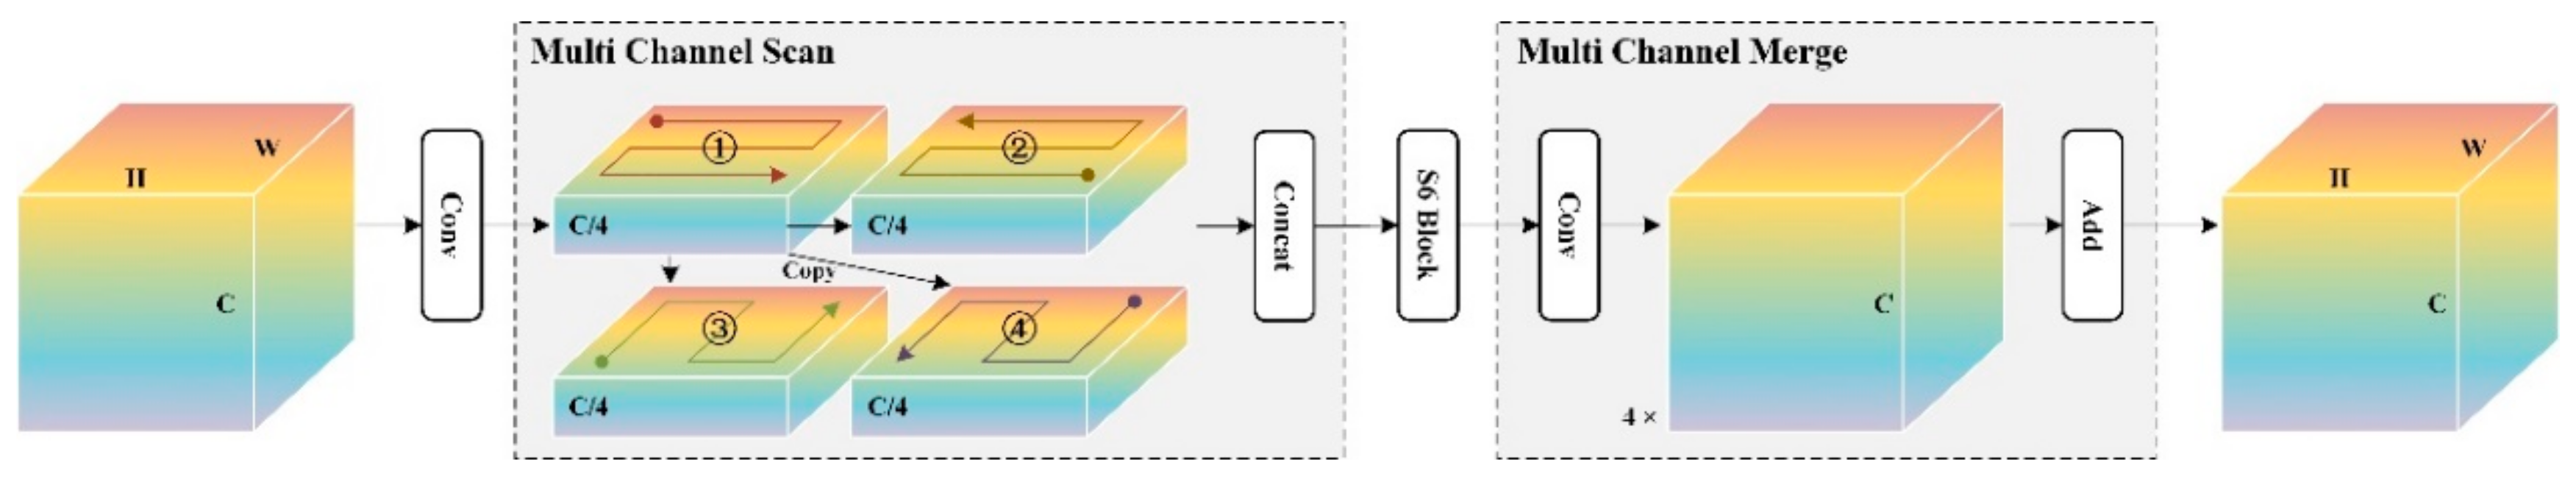
Figure 6.
Results from actual work scene.
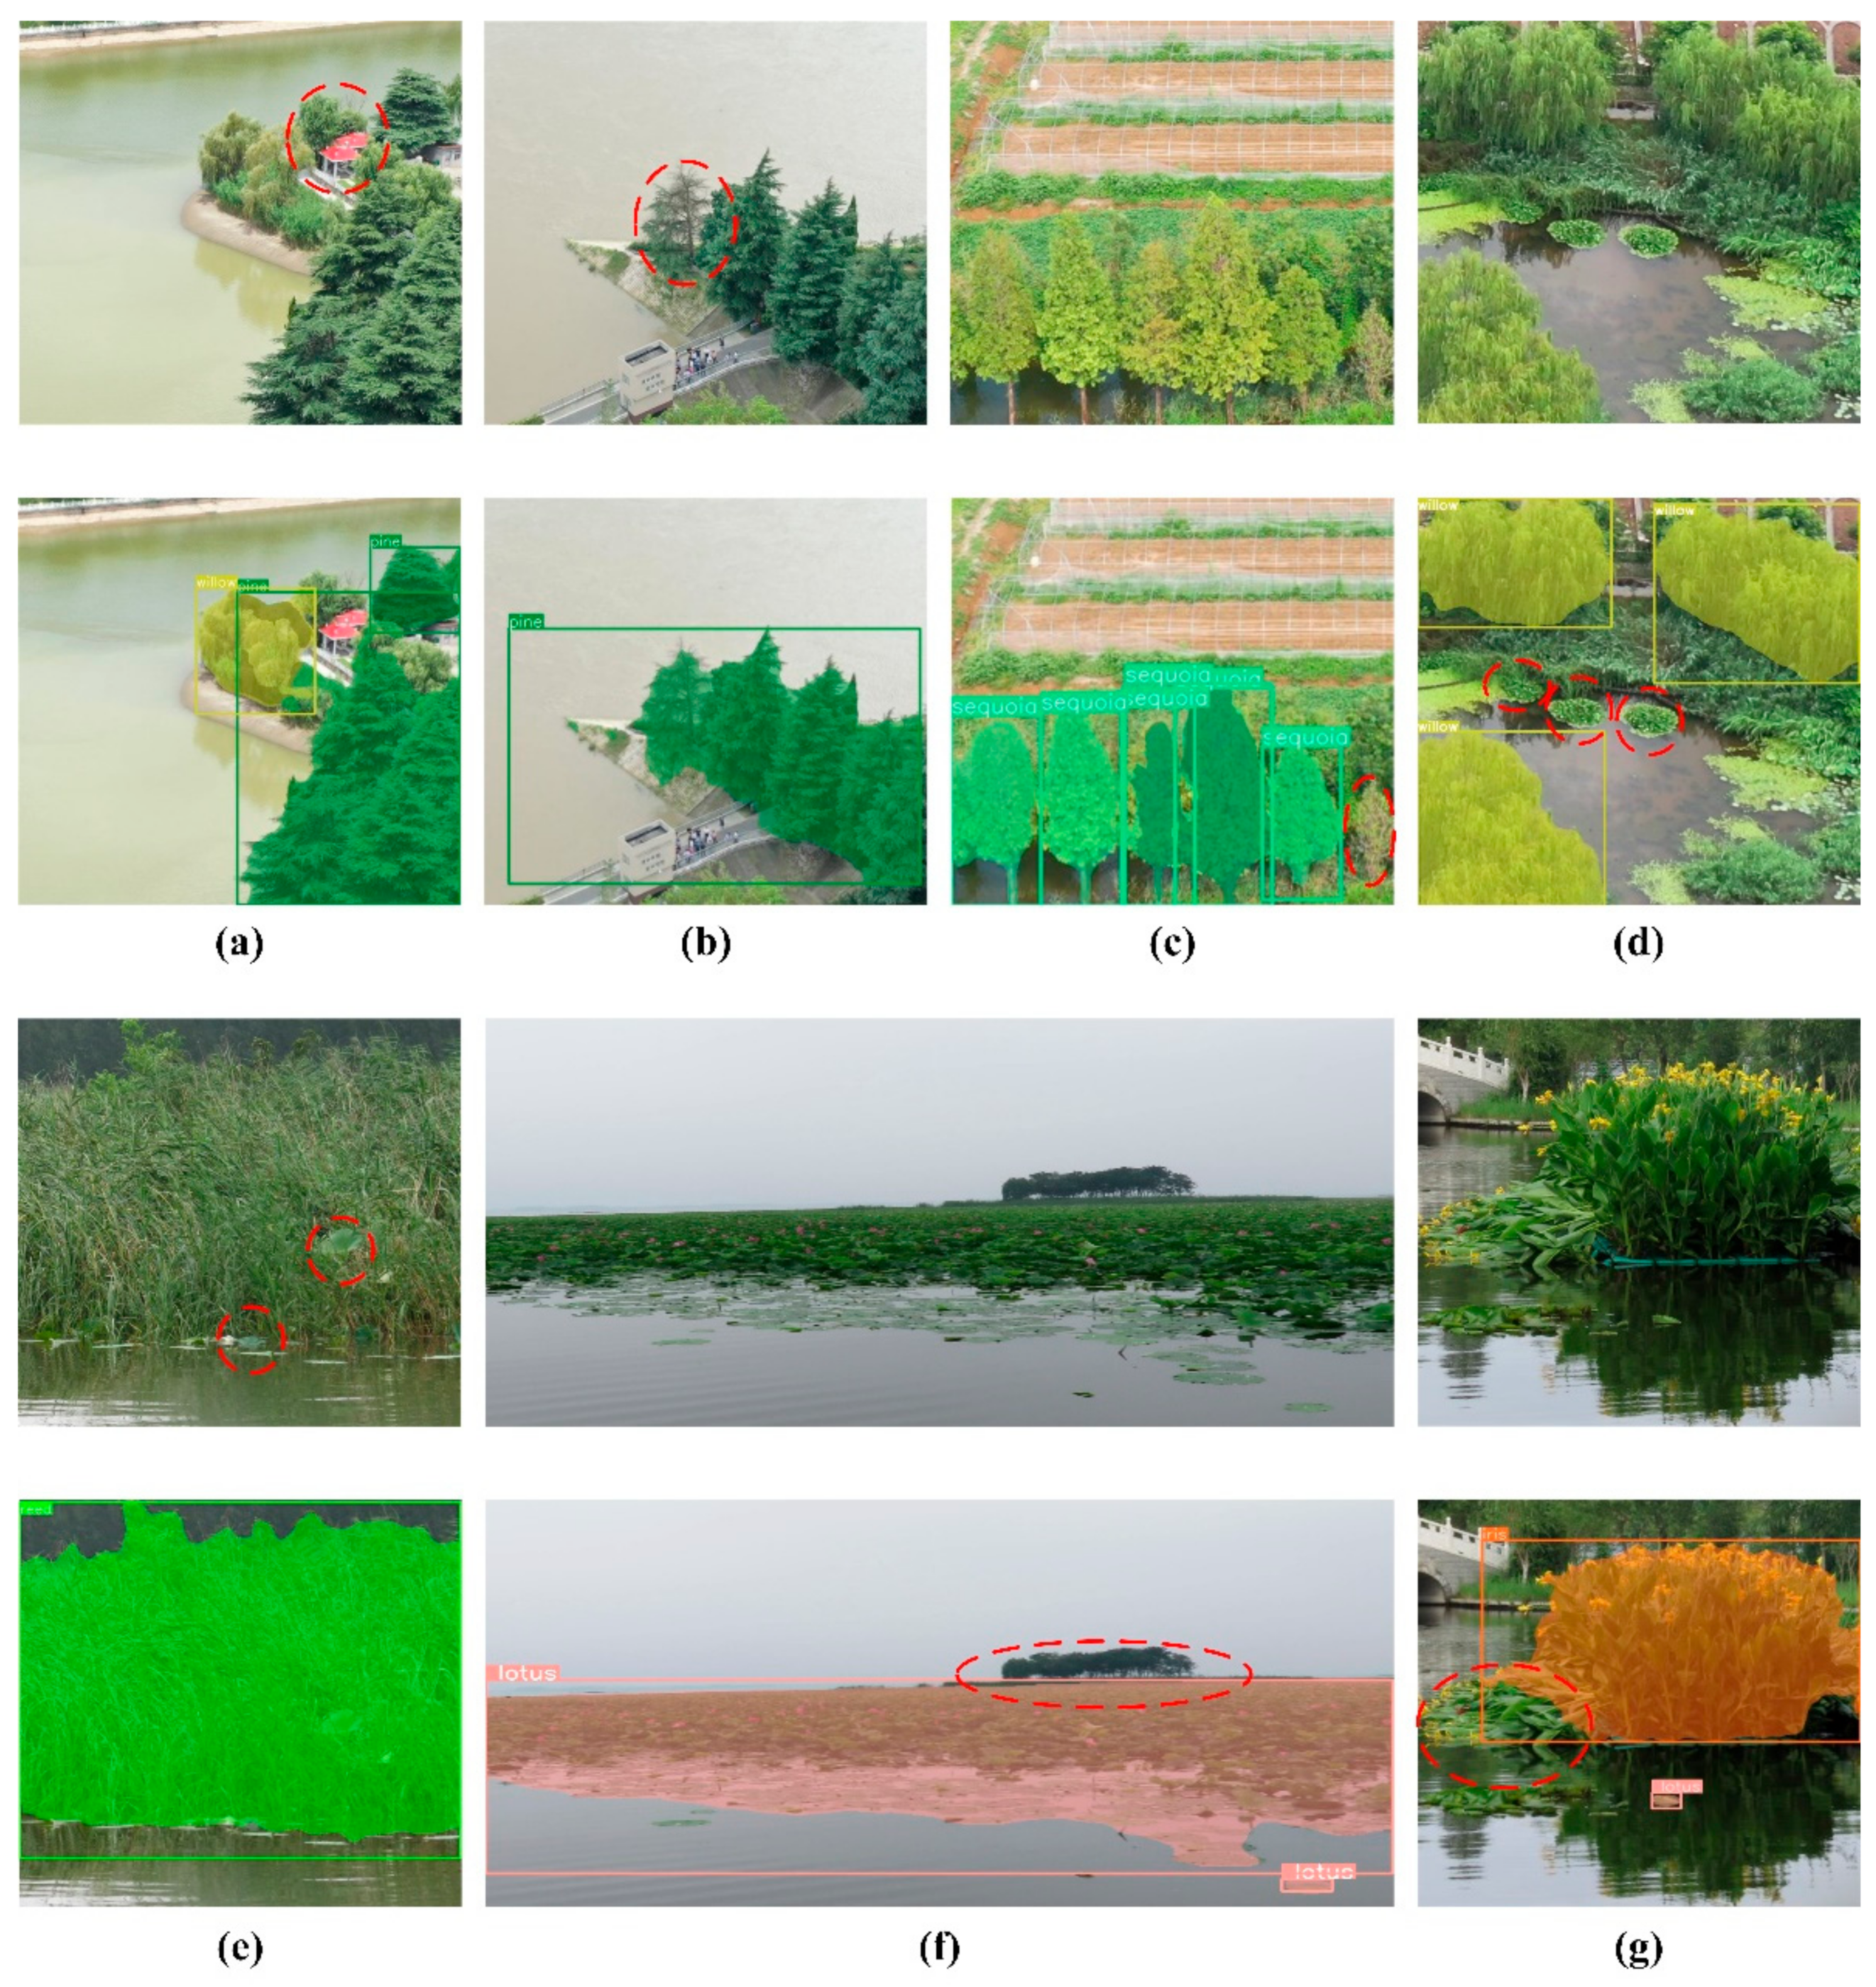

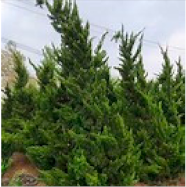
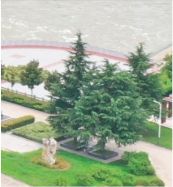
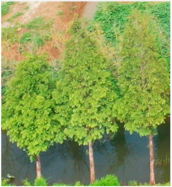
Table 1.
Types of plant datasets for riparian zones of rivers and lakes.
| Type | Willow | Cypress | Pine | Sequoia |
| Example | 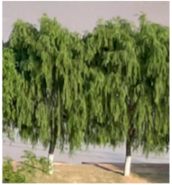 |
 |
 |
 |
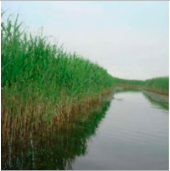
| Type | Lotus | Reed | Iris | Eichhornia crassipes |
| Example | 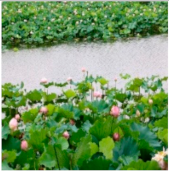 |
 |
 |
 |
| Type | Chicken trefoil | Ginkgo | Camphor | |
| Example | 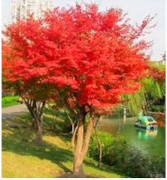 |
 |
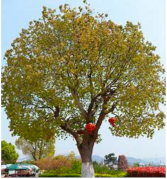 |
Table 2.
Seasonal characteristics of willow.
| Type | Spring | Fall | Leaf-off | Branch |
| Example | 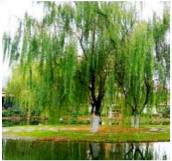 |
 |
 |
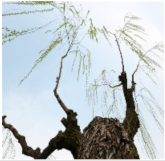 |
Table 3.
Sample data augmentation effects.
| Original | Dark + Noise | Rotation + Noise |
 |
 |
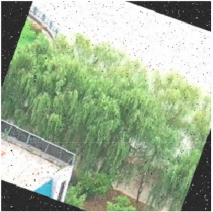 |
Table 4.
Confusion matrix results.
| True | Metrics | |||||||||||||||
| 1 | 2 | 3 | 4 | 5 | 6 | 7 | 8 | 9 | 10 | 11 | Precision | Recall | F1 | IoU | ||
| Predicted | 1 | 0.96 | 0 | 0 | 0 | 0 | 0 | 0 | 0 | 0 | 0 | 0 | 0.971 | 0.947 | 0.959 | 0.921 |
| 2 | 0 | 0.86 | 0 | 0 | 0 | 0 | 0 | 0 | 0 | 0 | 0 | 0.971 | 0.810 | 0.883 | 0.791 | |
| 3 | 0 | 0 | 0.83 | 0 | 0 | 0 | 0.03 | 0 | 0 | 0 | 0 | 0.944 | 0.842 | 0.890 | 0.802 | |
| 4 | 0 | 0 | 0 | 0.88 | 0.01 | 0 | 0 | 0.01 | 0 | 0.01 | 0 | 0.979 | 0.883 | 0.929 | 0.867 | |
| 5 | 0 | 0 | 0 | 0 | 0.87 | 0 | 0 | 0 | 0 | 0 | 0 | 0.916 | 0.809 | 0.859 | 0.753 | |
| 6 | 0 | 0.01 | 0.05 | 0 | 0 | 0.90 | 0 | 0 | 0 | 0 | 0 | 0.939 | 0.896 | 0.917 | 0.847 | |
| 7 | 0 | 0.01 | 0 | 0 | 0 | 0 | 0.95 | 0 | 0 | 0 | 0 | 0.895 | 0.966 | 0.929 | 0.868 | |
| 8 | 0.01 | 0 | 0 | 0.01 | 0 | 0 | 0 | 0.92 | 0 | 0 | 0 | 0.944 | 0.853 | 0.896 | 0.812 | |
| 9 | 0 | 0 | 0 | 0 | 0.01 | 0 | 0 | 0 | 0.88 | 0 | 0.01 | 0.943 | 0.823 | 0.879 | 0.784 | |
| 10 | 0 | 0 | 0 | 0 | 0 | 0 | 0 | 0 | 0 | 0.81 | 0 | 0.985 | 0.806 | 0.887 | 0.79 | |
| 11 | 0 | 0 | 0 | 0.01 | 0 | 0 | 0 | 0 | 0 | 0 | 0.95 | 0.935 | 0.957 | 0.946 | 0.897 | |
Table 5.
Results of comparison experiments.
| Models | Precision | Recall | F1 | IoU | FLOPs |
| yolov8n | 0.969 | 0.925 | 0.946 | 0.898 | 12.0 |
| MCC-backbone | 0.956 | 0.926 | 0.941 | 0.888 | 10.3 |
| MYSM | 0.947 | 0.872 | 0.908 | 0.831 | 4.1 |
Table 6.
Results of ablation experiments.
| Models | Precision | Recall | F1 | IoU | FLOPs |
| +MCC without MC Scan | 0.956 | 0.920 | 0.938 | 0.883 | 11.5 |
| + MC Scan without MCC | 0.843 | 0.739 | 0.788 | 0.650 | 4.0 |
| +MCC and + MC Scan | 0.947 | 0.872 | 0.908 | 0.831 | 4.1 |
Disclaimer/Publisher’s Note: The statements, opinions and data contained in all publications are solely those of the individual author(s) and contributor(s) and not of MDPI and/or the editor(s). MDPI and/or the editor(s) disclaim responsibility for any injury to people or property resulting from any ideas, methods, instructions or products referred to in the content. |
© 2025 by the authors. Licensee MDPI, Basel, Switzerland. This article is an open access article distributed under the terms and conditions of the Creative Commons Attribution (CC BY) license (http://creativecommons.org/licenses/by/4.0/).
Copyright: This open access article is published under a Creative Commons CC BY 4.0 license, which permit the free download, distribution, and reuse, provided that the author and preprint are cited in any reuse.


