I. Introduction
Blood related health issues pose a serious health concern for both patients and healthcare professionals worldwide. There are numerous health problems which are primarily detected through the blood report of the patient, which include ‘Anaemia’, ‘Vitamin B12 Deficiency’, ‘Chronic Obstructive Pulmonary Disease (COPD)’, ‘Bleeding Disorders’, ‘Macrocytic Anaemias’, ‘Microcytic Anaemias’ or any genetic disorders like ‘Thalassemia’. These diseases can lead to severe health complications if not detected and managed in a timely manner [
2]. The traditional method of detecting these diseases is to get a blood report generated in the pathology lab and then get that report checked by the doctor in order to know if there is a problem or not. This process is time consuming and includes a lot of man force involved in it. Artificial Intelligence is known to automate the tasks and optimizing it for the good of the user. In this case the first-hand analysis of the blood report in order to check the potential risk of presence of any of these diseases can be automated by incorporating artificial intelligence in the process. This approach of diagnosing the presence of a disease can save a lot of time for patients while enabling healthcare professionals to have a little bit of reduced workload. Incorporation of artificial intelligence in detecting the potential risk of a blood related disease is technically a binary classification task. Using the machine learning classification algorithms for automating the task of analysing the blood reports for disease risk assessment is the way to bring AI in this process. There are several machine learning models for performing a binary classification ranging from regressions to probabilistic distributions like Logistic Regression, Decision Tree Classifier, or XGBoost.
A. Problem Statement and Research Objectives
The accurate and in-time assessment of health issues related to blood is very crucial in effective diagnosis and treatment of the disease. Traditional diagnostic methods involve manual interpretation of blood reports at multiple levels which is time consuming, subjective, and prone to human error. Therefore, there is a need for automated and trustworthy machine learning model to analyze blood reports of patients and provide an accurate prediction regarding the potential risk of any kind of blood related disease.
The objective of this research paper is to develop such machine learning model and test their performance for the predictive task. Moreover, this study also explores the performance of the machine learning models by checking the process of the prediction made by them using the explainable artificial intelligence, which shows how predictions are being made by the machine learning models. The analysis of processing of the machine learning model through XAI enables us to decide for the best model to use for the task.
II. Literature Review
The use of Artificial Intelligence and Machine Learning algorithms in the healthcare sector to alleviate the workload of healthcare professionals and enhance the convenience for patients is a growing trend for several years now. Disease diagnosis is one of the many applications of machine learning algorithms in healthcare sector. Based on the domain of this research project, there have been earlier studies presenting AI and ML based solutions for similar problems. This section of the research paper aims to analyse the current studies and understand the current state-of-art situation in the domain.
Presenting a survey on various machine learning approaches for detecting thalassemia and performing classification [
10] explains that in diagnosing thalassemia, doctors rely on two types of tests: a complete blood count (CBC) and a special haemoglobin test. Based on these reports, [
10] presents the result of the survey which analyse the performance of different classification machine learning models to distinguish between thalassemia minor alpha and thalassemia major beta patients. The survey and analysis clearly found and observed that certain machine learning algorithms such as decision tree, SVM, KNN and ANN provide better accuracy in detecting and predicting the thalassemia disease. Similar to this study, [
8] presents a study for Beta Thalassemia carriers detection using federated learning algorithms using a dataset generated through the HPLC reports of 5066 patients. The best accuracy by the FL-based model as recorded by [
8] is 92.38%.
Furthermore, the study presented on blood disease detection using classical machine learning algorithms, a topic similar to this study [
11] presents a list of machine learning algorithms along with their performance metrics which perform the blood analysis and analysing the presence of any possible disease. The best machine learning model among many used is claimed to be ‘LogitBoost’ with an accuracy of 98.16%. Going one step deeper in the analysis, [
18] presents their study on predicting the level of anaemia among Ethiopian pregnant women using homogeneous ensemble machine learning algorithms. They believe that using machine learning for such predictions can reduce the diagnosis and contribute to saving deaths caused by anaemia in pregnant women. The best accuracy among all the classification models trained is recorded at 97.6% by the cat boost algorithm. Similarly, [
2] presents their study on using machine learning algorithms for Anaemia disease prediction. To train the model, they used the CBC report of 200 patients and trained 3 classification machine learning models, among which accuracy of the Naïve Bayes algorithm is recorded as the best one with 96.09% accuracy and the MAE at 0.0333.
Interestingly, [
15] presents their research on detecting anaemia from retinal fundus images. Understanding the severity of the disease and its connection with the retinal fundus, [
15] presents deep learning based predictive model which detects the presence or risk anaemia through retinal fundus images with best accuracy of 97.5%.
From the analysis of previous work in the field it can be concluded that studies have experimented the incorporation of Artificial Intelligence and Machine Learning algorithms in detecting or predicting the presence of blood related diseases like Anaemia, Thalassemia or more. And many of them has presented remarkable conclusions. However, all of the studies were found to present a machine learning or AI based solutions for predicting the presence of a specific blood related disease or health issue, none of the studies were found to address the concern of first-hand diagnosis of presence of any kind of blood related disease based on a basic regular blood report of the patient. In addition, no study was found to explore the area of explainable AI to analyse the processing of the proposed machine learning algorithms, which challenges the trust worthiness of the presented solutions.
To overcome these gaps in the research, this study presents a comparative analysis of machine learning model for initial or first-hand diagnosis of potential presence of any blood related disease based on a basic blood report of the patient and also explores the interpretability of these models through explainable AI (XAI).
III. Data Collection and Preprocessing
The raw dataset used to train, validate, and test the machine learning model for this project contains the blood report of 1073 patients of a hospital in Iraq. The blood report contain 12 different health parameters and the values as per the tests. The information about various healthcare parameters along with the normal range for each is as listed in the table below. The dataset used was made available by a Haematology centre in a hospital in Iraq. The motive of using this dataset is to test and compare the performance of various machine learning classification models and compare them to find the best one. The raw form of this dataset had multiple missing values, whereas the columns ‘HBF’ and ‘Iron’ were almost empty with only 5% of nonempty cells in them.
As these values can only be computed through a laboratory test and no other method can be used to fill up these many empty values, these columns were dropped. The column ‘RBC’ also had 35% of missing values in the dataset. The cells with no data were filled with the ‘RBC count’ obtained by calculating the RBC count through other 2 columns of the dataset using formula (2) below.
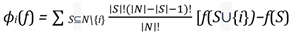
The resulting dataset with no null values had 9 features for 1027 different patients. This is the dataset which is finally used for training and testing the machine learning models and compare their performances. The 9 features of the dataset contains unique and important information about a patient’s blood health and thus are significantly important for the prediction. The 9 features of the dataset are all numerical features, and the distribution of these can be seen in the graphs in
Figure 1. The distribution of ‘Age’ throughout the dataset after treating the unrealistic outliers can be seen as a right skewed distribution, while the line graphs for other medical variables has sudden hikes in the graph. These sudden hikes in the line graphs for ‘MCV’, ‘MCH’ or ‘RBC’ variables shows the presence of abnormal value of the variable and thus the potential risk towards a blood related disease.
Abnormally high or low values of the variables is a clear indication of the risk or a health problem in the human body. However, these are not the only indications. If the blood report records the values of these values outside of the normal range as mentioned in
Table 1, then there is a potential risk of some issue in the body. The severity of the problem depends on difference between the recorded value and the safe value. However, in this research paper, we are predicting the potential risk of a disease and anything outside the normal range can be a sign of an underlying disease, we formulated the conditional formula to mark the records as ‘Risk’ or ‘No Risk’. The conditions used are formulated below in a pseudo code below.
if MCV < 80 or MCV > 100 or HBG < 10 or HBG >
18 or MCH < 25 or MCH > 32 or RBC > 5.5 or HBA2 > 3.5 or HBA > 99 :
return 'Risk'
else:
Based on these conditions, all the records with values return 'No Risk' out of the specified safe range of these variables will be filtered and flashed as ‘Risk’ to the healthcare professional, who later can examine the reports personally to check what is the real issue with the patient. For this task, we need a binary classification machine learning model to accurately identify the abnormality and flashes if the algorithm identifies ‘Risk’.
IV. Machine Learning Models
A. Logistic Regression
Logistic Regression is regression-based classification model used for binary classification tasks. This is statistical model where the goal is to predict the probability of an instance belonging to a class. In logistic regression, the independent or input variables are linearly combined using weights and coefficients and further transformed using an activation (logistic or sigmoid) function. This transformation maps the linear combination to a probability value in the range [0, 1], representing the likelihood of the instance belonging to the positive class. The mathematical equation for the logistic regression model can be seen in equation (3) below.
where, p
(y=1 | X) is the probability of the positive class for X as the given input feature., w
0, w
1, ..., w
n are the model coefficients or weights, x
1, x
2, ..., x
n represents the input features, exp(x) represents the exponential function.
B. Random Forest Classifier
Random Forest Classifier is a machine learning model which combines multiple decision trees and use their outputs to formulate the final predictions. It is a powerful and versatile algorithm known for its ability to handle complex datasets with high accuracy score. The workflow of Random Forest Classifier algorithm is as: Random Sampling, Building Decision Trees, Voting for Predictions, and at last Ensemble Aggregation. The random forest classifier algorithm is known for its accuracy and ability of work well with big and complex and multidimensional datasets while managing to avoid overfitting. The key aspects of this algorithm are: Random feature selection, Bootstrap aggregating, Decision tree diversity, Prediction confidence.
C. Decision Tree Classifier
The Decision Tree Classifier is a supervised learning algorithm which can be used for both classification and regression tasks. This algorithm builds a tree like model for decision making and generating the possible consequences of that. The process in which the algorithm processed the data and generates the output is to first select the best feature to perform the split, then split the data, repeat this process until you reach the saturation and at the end assign the class labels. The formula used to determine the split the dataset into homogeneous subsets in decision tree algorithm can either be the Gini Impurity, Entropy, or Information Gain. Here, Gini Impurity is a measure of the degree of impurity in a node. In quantifies the probability of misclassifying a randomly chosen element is the node. Whereas Entropy is a measure of the level of impurity or disorder is a node and Information Gain measures the reduction in entropy or impurity achieved by splitting the dataset on a particular feature. The formulas for these are given in the equations below.
where, p(i) is the probability of an element belonging to class ‘i’ in the node, IG is Information Gain, and WAE is Weighted Average Entropy.
The resulting decision tree represents a hierarchical structure of decision rules, where each internal node represents a test on a feature, and each leaf node represents a class label or a regression value. The final prediction of the algorithm is based on the class label assigned to the leaf node at the end of the decision tree structure.
D.Extreme Gradient Boosting (XGBoost)
XGBoost or Extreme Gradient Boosting is an ensemble learning algorithm which combines the power of gradient boosting with the set of enhancements to improve the performance and generalization of the machine learning model. This model is based on the concept of boosting which created a strong learner i.e., Robust predictive model, by combining multiple weak learners i.e., Individual Decision Trees. The formula used in XGBoost algorithm for updating model’s predictions at each iteration is given below in equation (7)
Where ‘learning rate’ is a hyperparameter that controls the contribution of each tree to the Dinal prediction, and ‘tree prediction’ is the output of the newly added decision tree. The Dinal prediction of this model is the sum of the predictions from all the individual trees.
V. Experimental Setup and Evaluation Metrics
The dataset obtained after removing the null values and treating the outliers has 10 features including the target variable ‘Risk’. The column containing the unique ID for each new instance is not very relevant and contributing to the final prediction and therefore is dropped given us the dataset of shape (1027, 9). This dataset is further divided into the set of independent features and the target variable. After getting two datasets as X and y for independent and target features respectively, the test, train, and validation split is performed keeping the test size at 0.2 and random state at 42 first for train and test split and then for test and validation split. As the original dataset is imbalanced for the number of records/instances for each class, the training dataset obtained after the random split is also imbalanced. Thus, using the ‘smote’ function on training datasets, random oversampling is performed to obtain a balanced dataset to train the machine learning models. Random under sampling is performed only on the training dataset in order to prevent data leakage among train, validation, and test datasets. The shape of final training dataset is (1156, 8) and (1156, 1) for input variables and target feature. These datasets are used to train the machine learning models for performing the prediction for assessing the risk of any kind of blood related disease based on the blood report of the patient.
The evaluation metrics used to assess the performance of the machine learning models are Precision, Recall, and F1 Score which are calculated with the help of the confusion metrics. The formulas for calculating the value of these parameters are mentioned in equation (13) to (15) below, where TP is for true positive values and FP is for false positive values.
where, P and R in equation (11) is Precision and Recall, respectively.
The value of these evaluation metrices along with the confusion metrics for the test set for all the machine learning models trained on our dataset in this research project is recorded in
Table 2.
VI. Explainable AI (XAI) Analysis
The machine learning models present today are all black box models, which means, the process followed by these models to generate the predictions is not visible to the developers or users. The only thing we can see is their output and accuracy score as compared to the original value of the target variable. This lack of interpretability of the machine learning models makes it hard to trust them and their predictions. To overcome this problem, we have Explainable Artificial Intelligence (XAI) which helps us understand the processing of the models and know which features are contributing the most or least in the final prediction generated by the black box model. We use ‘SHAP (SHapley Additive exPlanations)’ library in python which generates shap values using the formula given below. Based on the shap values, we can understand the feature importance in model predictions.
where: ϕi(f) is the Shapley value for feature i in the function f, N is the set of all features, S is a subset of features excluding the feature i, |S| denotes the number of features in subset S, |N| represents the total number of features, f(S ∪{i}) is the output of the function f when including feature i in the subset S, and f(S) is the output of the function f when excluding feature i from the subset S.
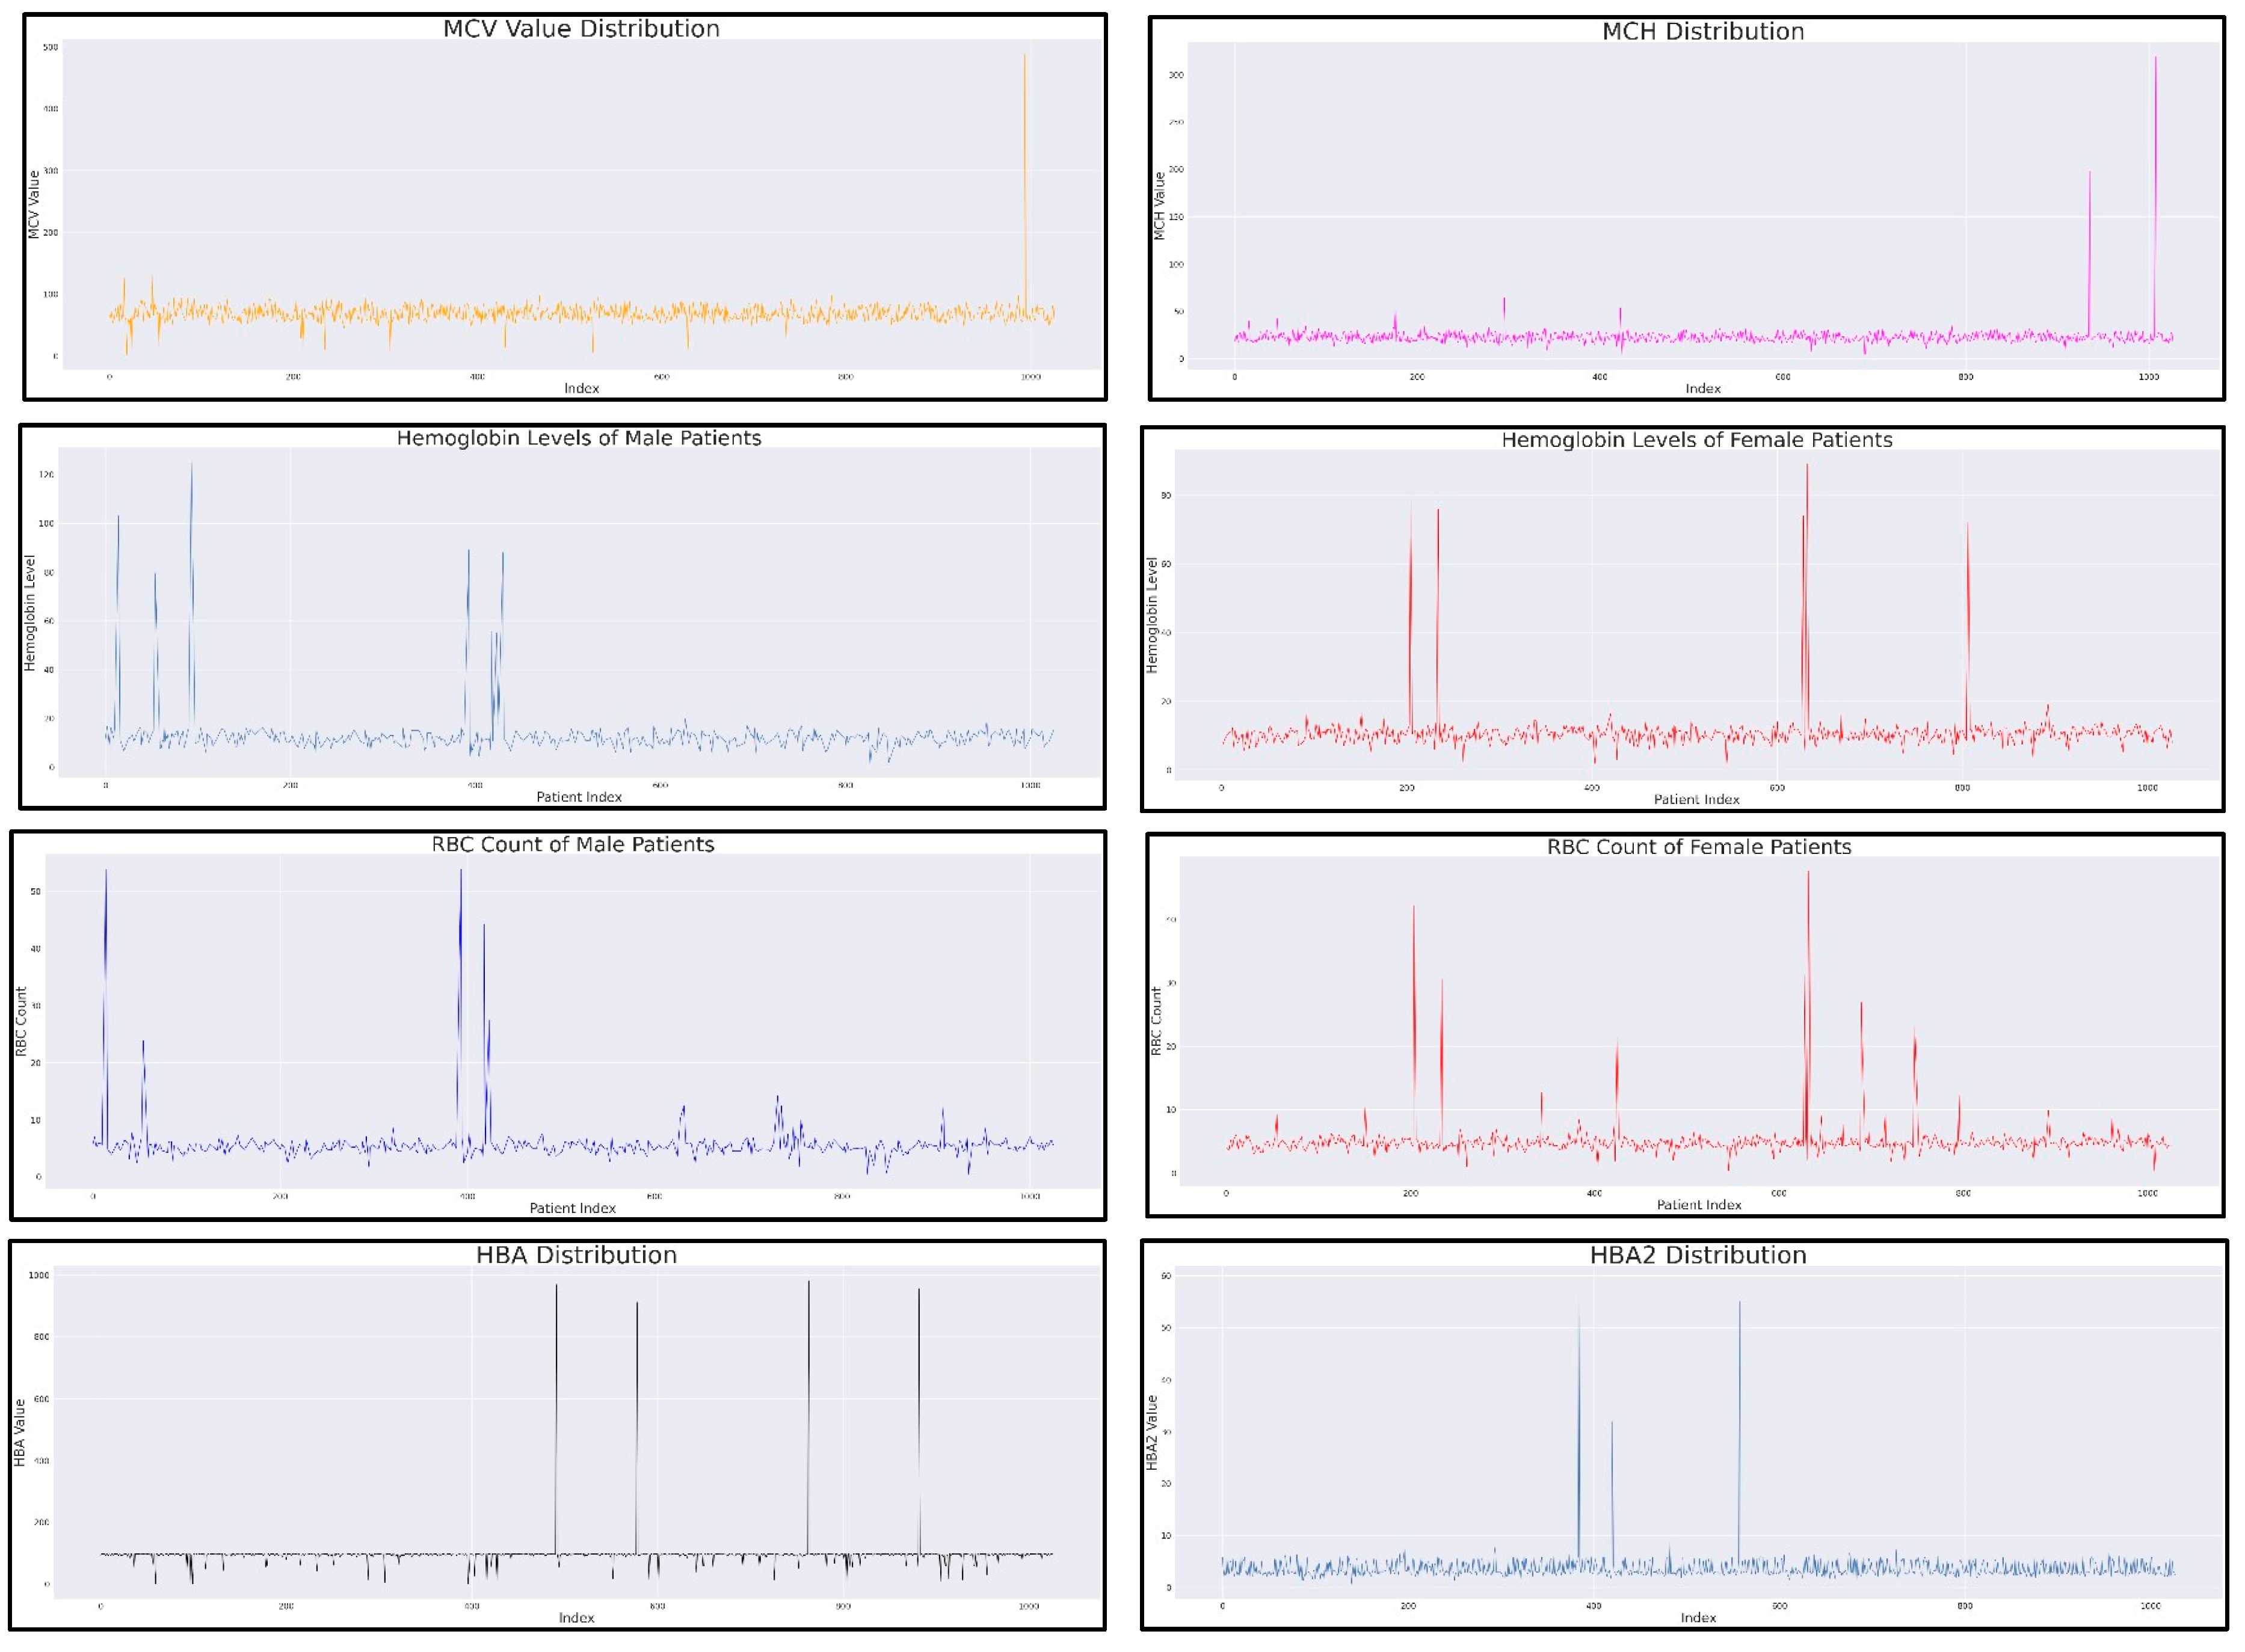
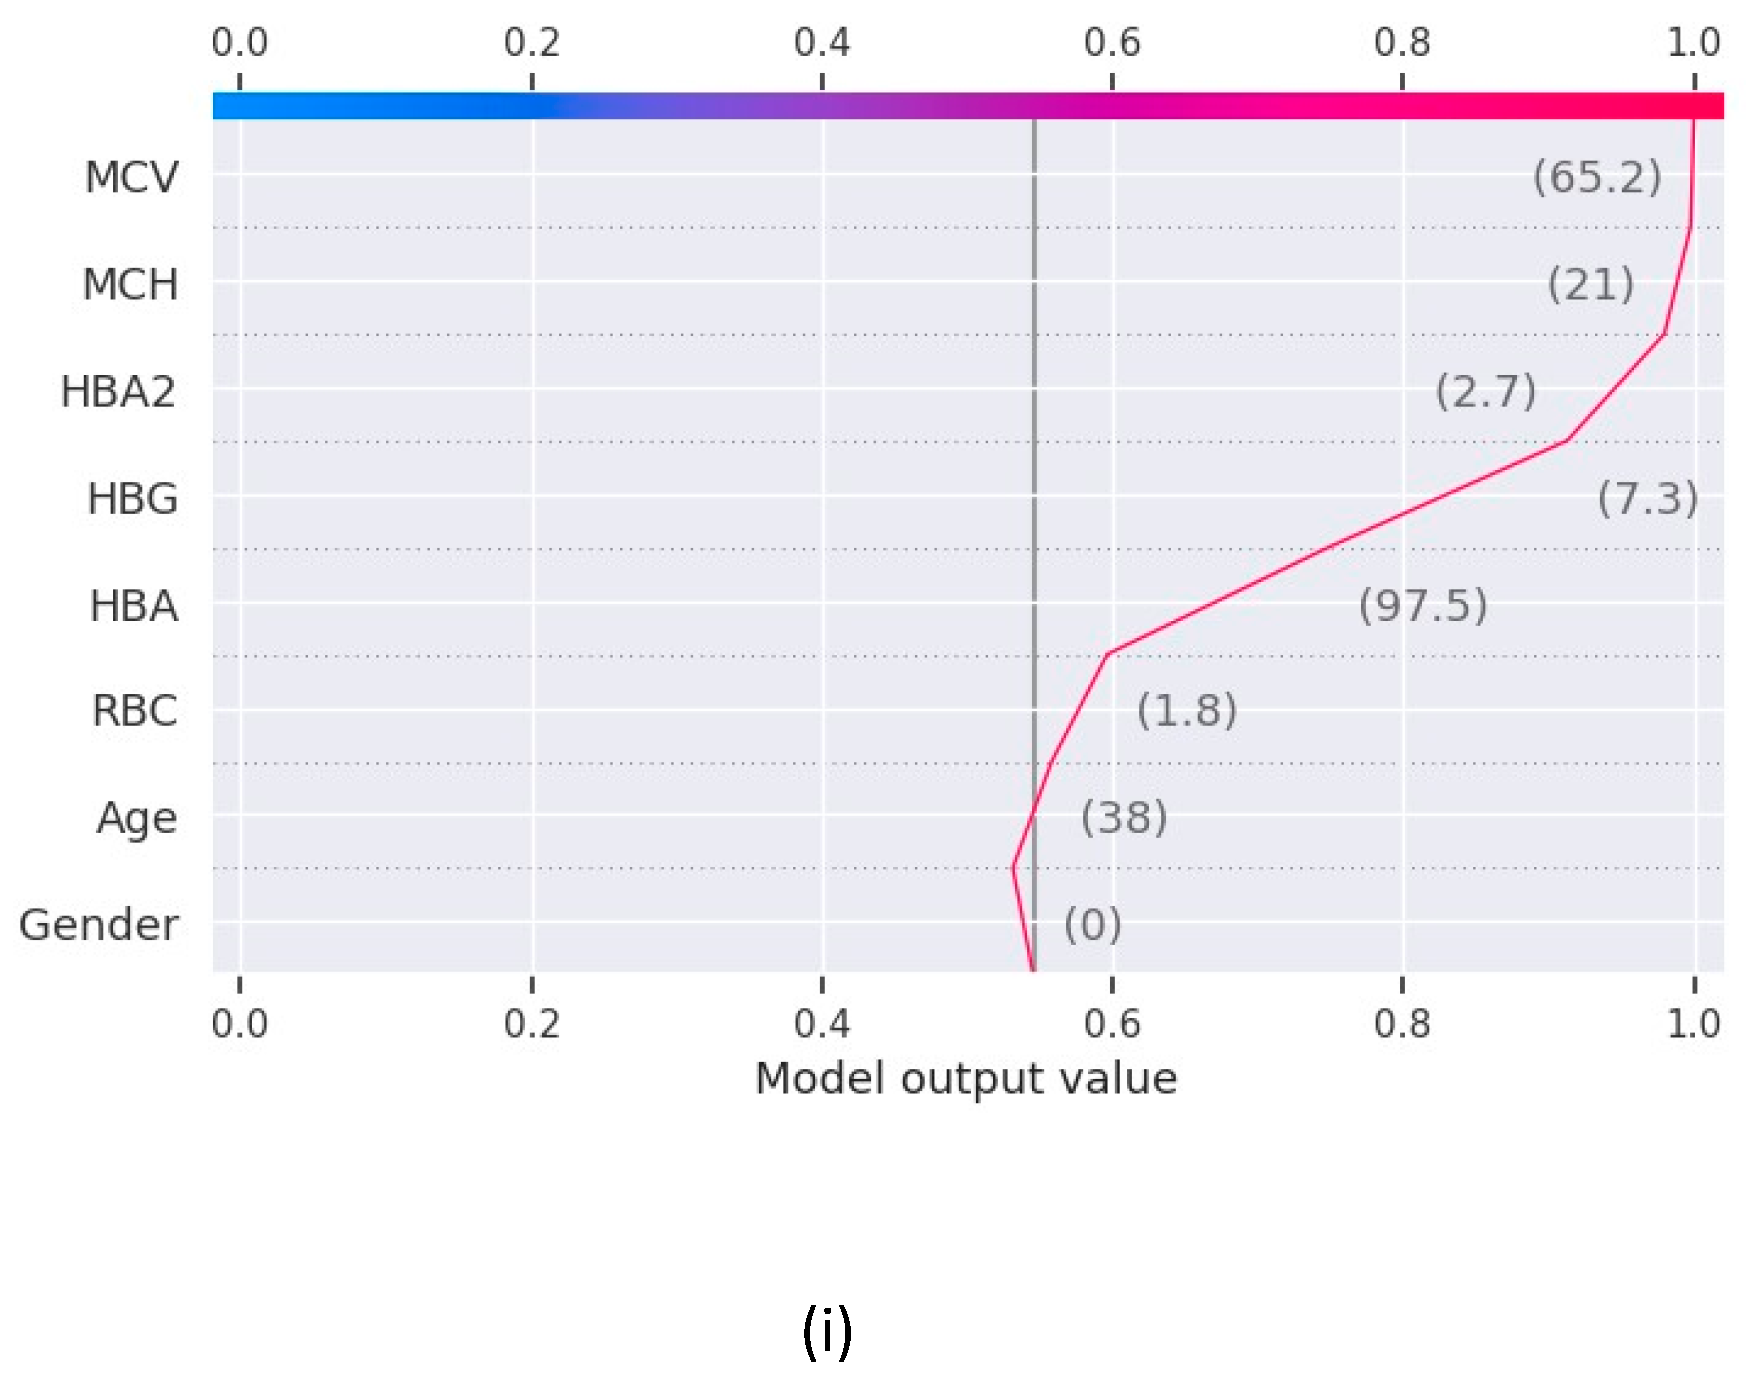
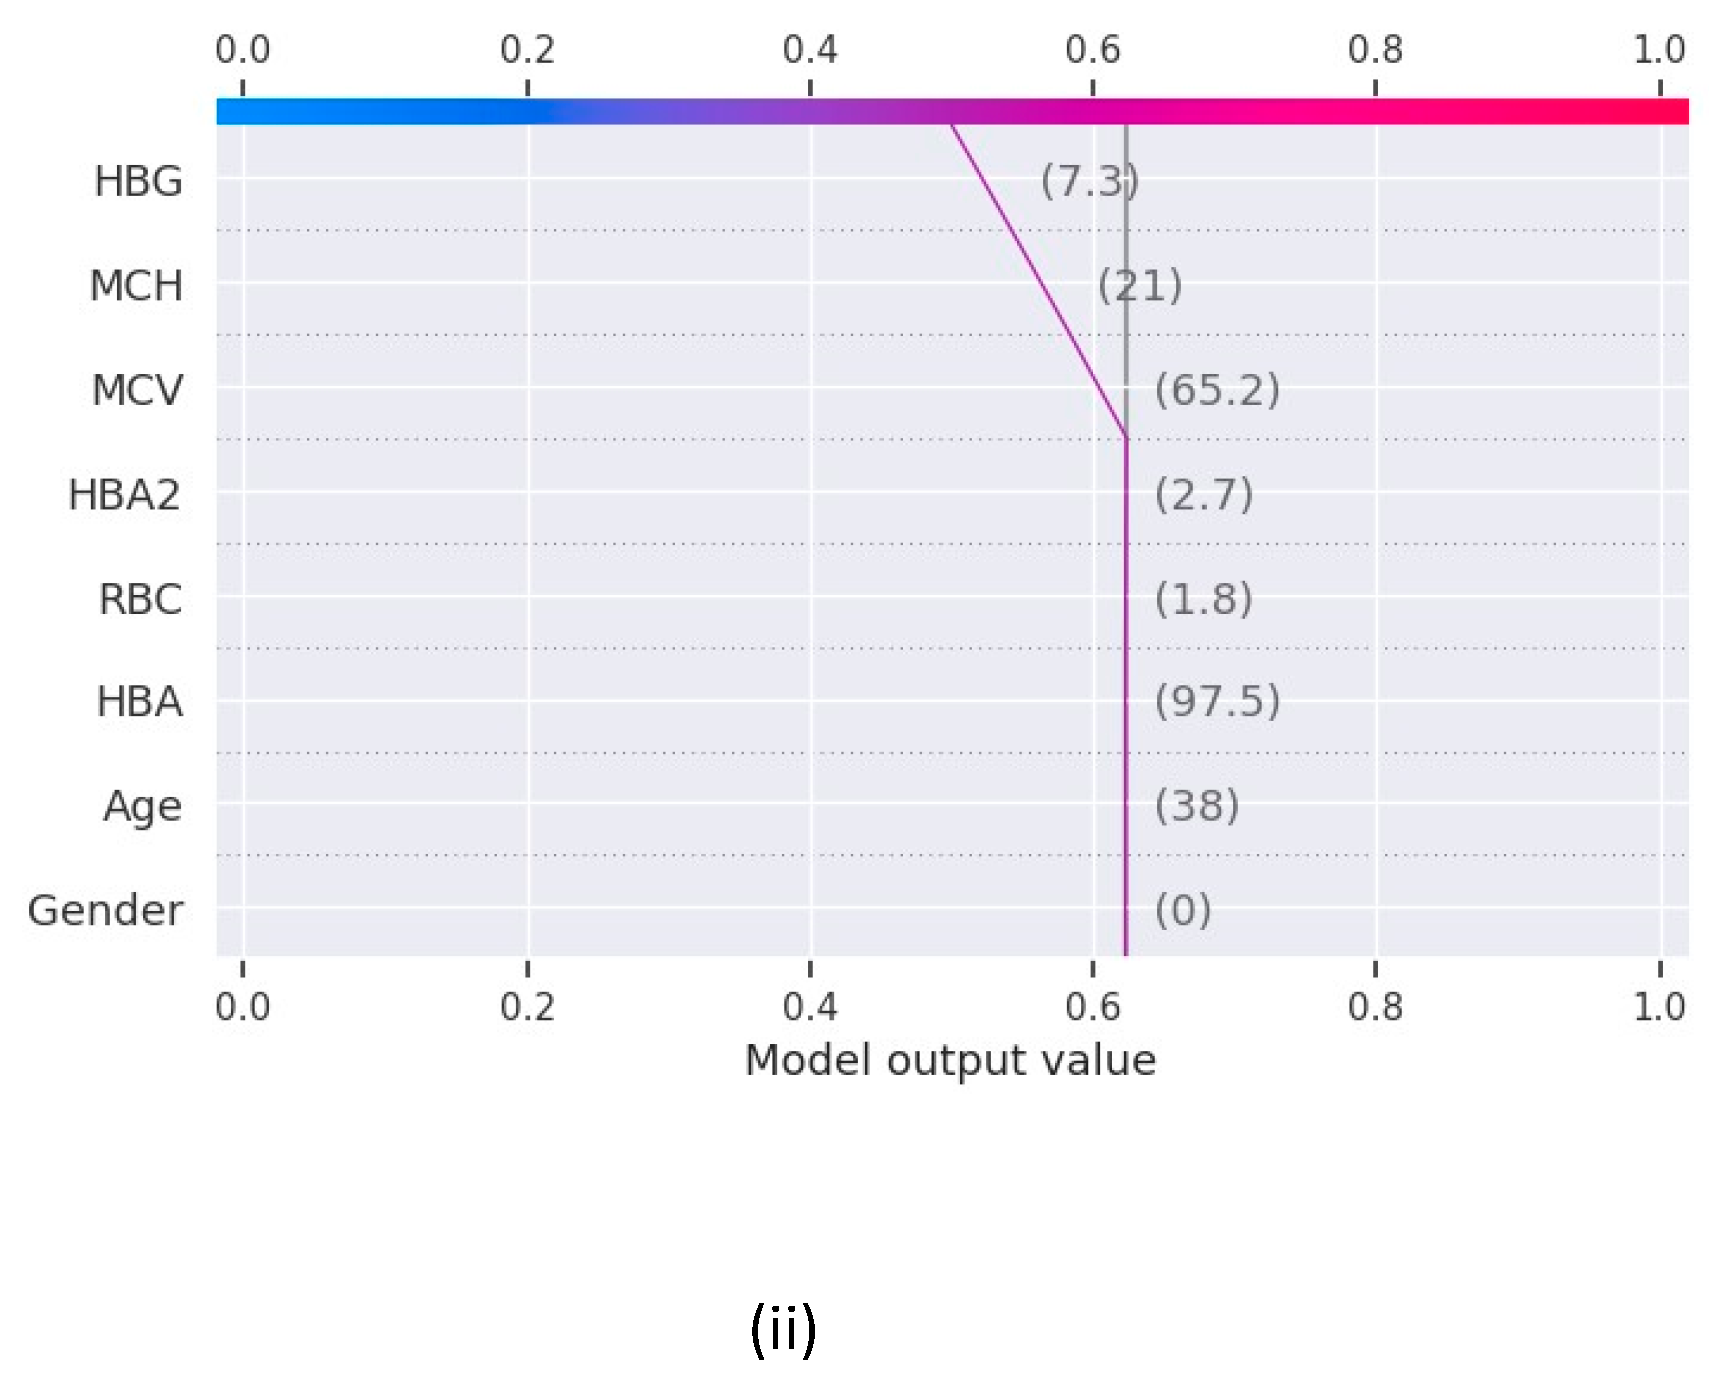
The force plot in
Figure 2 shows the contribution of features to derive the values of the function f(x) for Random Forest and XGBoost and the features contributing the maximum in the final prediction for base value 0.5 in both the models.
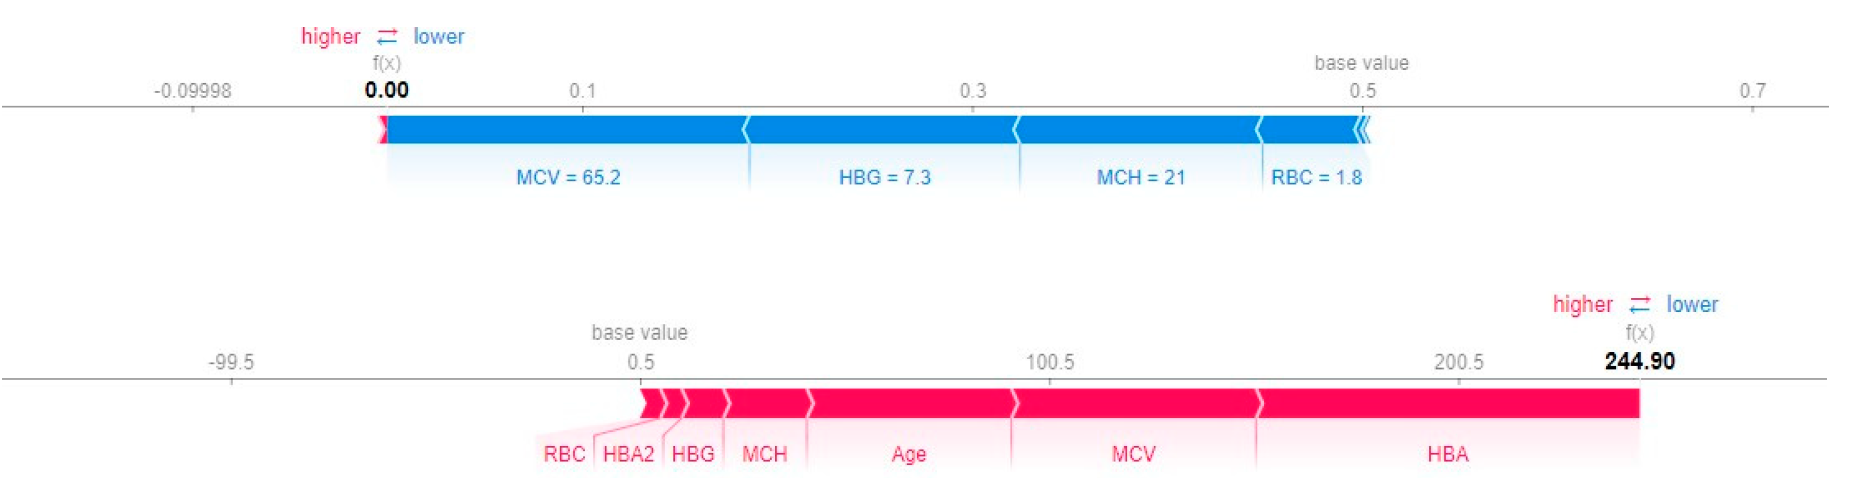
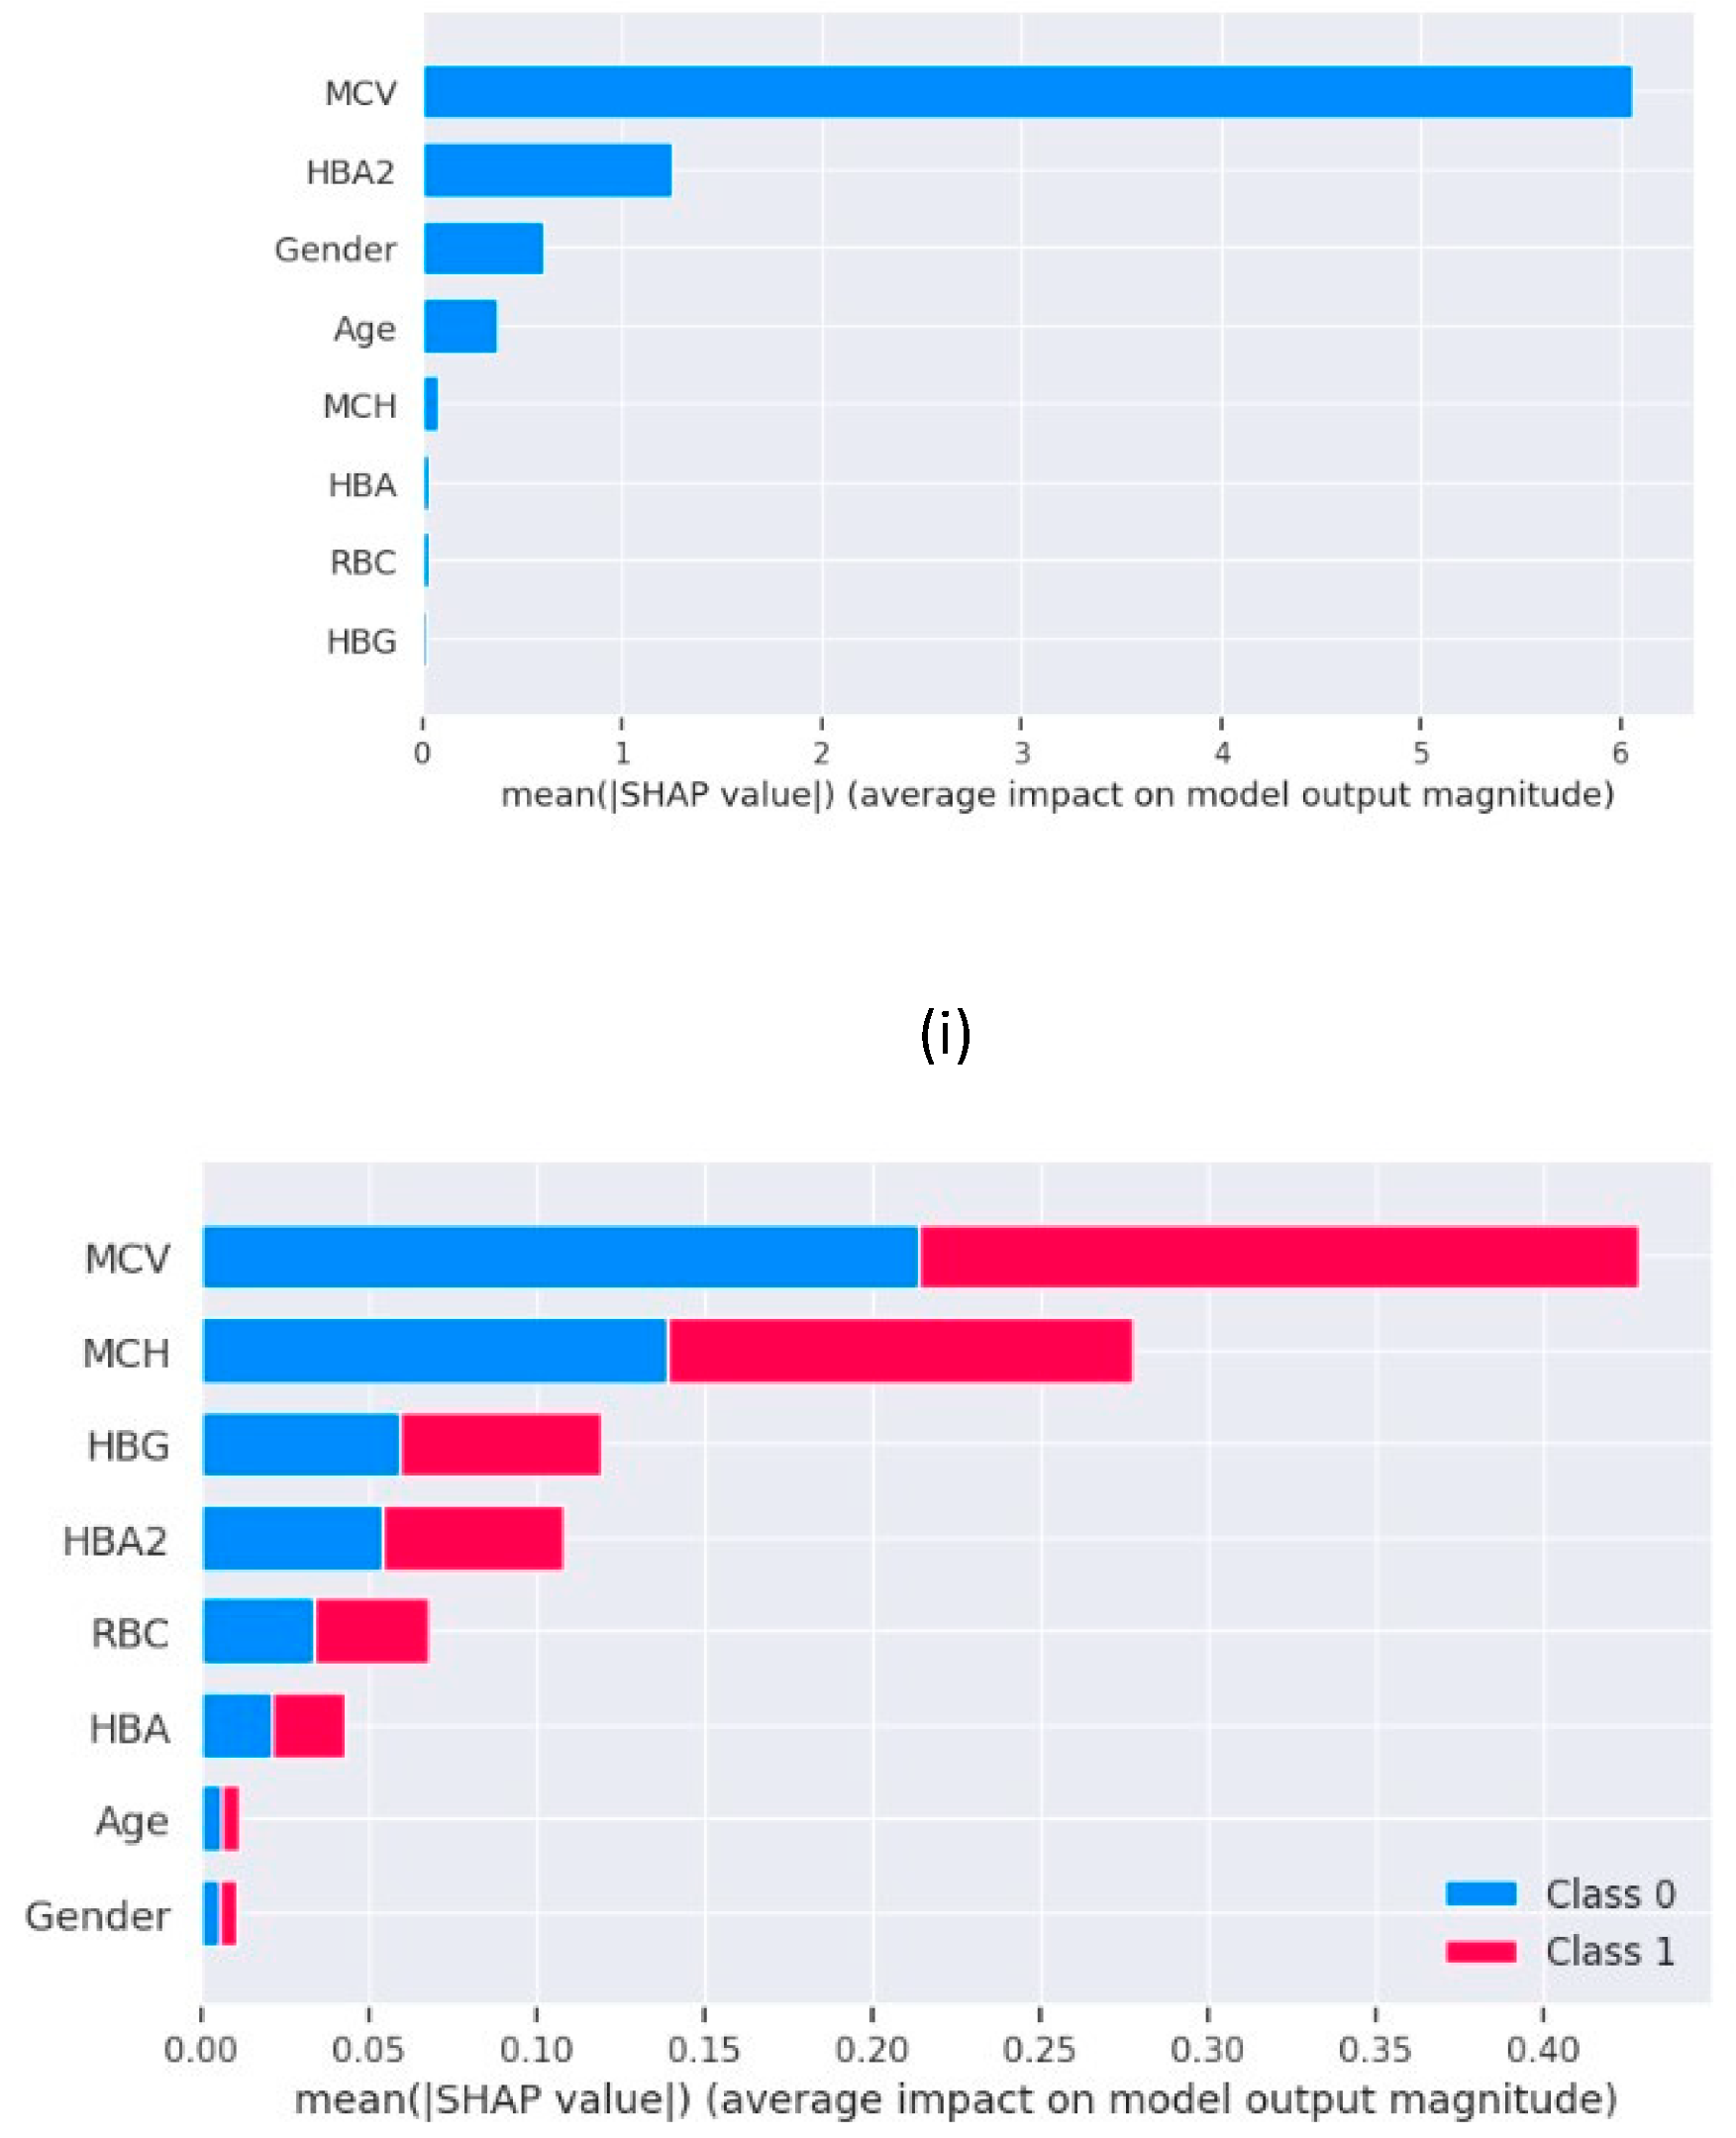
For our machine learning models, we generated the XAI graphs further assess their processing and find out the best one of them to perform the blood related disease risk analysis based on the blood report of the patient.
Figure 3 has the summary plots for Logistic Regression and Random Forest which shows the feature importance in the form of a bar chart. The decision plot, which are used to understand the models such as decision tree also shows the feature importance in the form of an X-Y chart as in
Figure 4.
Here, we have the plots for XGBoost and Decision Tree.
VII. Results(ii)
The results as recorded by the evaluation metrics demonstrate that all the models achieved commendable performance in predicting blood disease risk. Logistic regression achieved the test accuracy of 91% while all the other models a perfect accuracy of 100%. Notably, the value of recall, precision, and F1 score for Decision Tree, Random Forest and XGBoost is 1.00 while Logistic Regression is slightly under performed with F1 score of 0.93. The AUC-ROC value for these machine learning models are recorded as 0.93 for logistic regression and 1.00 for all others. Furthermore, to unravel the black box nature of these machine learning models, we used XAI techniques to gain insights into their decision making. Through the shap graphs, we observed that abnormally high or low values for haemoglobin, MCV, MCH or HBA are strong indication of presence of any potential disease in the body.
VIII. Discussion
In this research project we are presentive a comparative analysis of different machine learning models and their performance in predicting the risk of any blood related disease using the medical details of a patient obtained by a regular blood report. There are several medical problems which have direct connection with the quality of blood. A lot of diseases are diagnosed trough a blood report as a first-hand diagnosis, and if anything odd is found in it, other specific tests are done. This process of disease diagnosis is multistep where blood report analysis is the most important and fundamental step. The objective of this research project is to initiate the idea of incorporating machine learning and artificial intelligence at the very early stages of diagnosis in healthcare. The incorporation of machine learning at early stages of diagnosis, or for first-hand diagnosis tasks can save a lot of time and human effort increasing the productivity of healthcare processes incredibly. The traditional way of blood report analysis involve multiple levels in order to first get the blood tests done and then again, a series of levels to get it checked by a doctor. This research project aims to provide a solution to make this process automated and save a lot of time and manpower which can be used better elsewhere.
The dataset used to perform the analysis and train the machine learning models to check their capabilities in performing as a smart first-hand diagnostic machine in real life, a medical dataset was used which is provided by a hospital in Iraq. This dataset had the details of various medical parameters as recorded by a regular blood test. The dataset had the data of 1027 patients, as obtained after data cleaning, and was very well structured to be used for our project. The dataset had 10 medical parameters as the features ranging from simple features like age to clinical features like MCV and MCH. The line graphs for these features showed some sudden steep peaks as the graph read an abnormally high values for these clinical parameters. This visualization showed the presence of records which are to be marked ‘risk’ for the presence of a blood related disease. But the diagnosis is not this simple, there are many underlying reasons to classify the report as ‘risk’ or ‘no risk’ other than abnormally high or low values of RBC count of MCV. As the dataset did not have the target column, a function was made to identify the instances which might be at risk versus those which are normal and safe. This function was used to create a target column and have a final dataset which could now be used for training the machine learning models.
The results obtained from our experiments, analysing the performance of different machine learning models and insights gained through XAI. We begin by evaluating the performance of the machine learning models employed in our study. Logistic Regression, Decision Tree, Random Forest and XGBoost are the 4 machine learning models trained and tested on a comprehensive dataset consisting the various clinical parameters of 1027 patients. The evaluation metrics used include accuracy, precision, recall and F1 score. The comparative analysis of the machine learning models revealed distinct strengths and weaknesses among the regression models and decision trees. Though regression model serves great accuracy of 91%, the low recall values does not make it the best choice for the prediction. Whereas the models based on decision tree i.e., Random Forest, XGBoost and Decision Tree delivers the best test accuracy of 100% and perfect scores for recall, precision and f1score as 1.00 for all three, makes them the perfect models to be used for blood disease risk assessment. In addition to this, the results from the explainable AI graphs, the features contributing maximum to the predictions presented by the model are MCV, MCH, HBG and HBA. The value of these features influence the prediction the most as compared to other features. One of the underlying observations of the analysis is that the normal values of haemoglobin levels were strongly associated with the decreased risk of presence of a blood related disease, while elevated MCV and RBC count indicated the potential risk factors.
Conclusion
The objective of this study is to perform a comparative analysis of machine learning models for first hand blood disease risk assessment. The dataset used for this is a clinical dataset consisting of details of several clinical parameters of 1027 patients as provided by a healthcare institute in Iraq. The four machine learning models trained for the risk assessment are Logistic Regression, Decision Tree, Random Forest and XGBoost, and the best test accuracy with perfect f1 score is recorded as 100% for Decision Tree, Random Forest and XGBoost. Diving deep into the processing of these models through XAI, we observed that a healthy normal value of haemoglobin and good RBC count are associated with decreased risk of blood related disease whereas the abnormally high values of MCV, MCH, RBC and HBA strongly indicate the presence of a clinical problem in the body. As a conclusion to this study, the best models found for blood related risk assessment is the classification models based on the concept of decision trees. Future directions could involve using a bigger dataset with large number of instances and more clinical parameters to better assess the situation of patient’s body who is being examined and increasing the efficiency of the predictive model.
References
- Bryant BJ, Hopkins JA, Arceo SM, Leitman SF. Evaluation of low red blood cell mean corpuscular volume in an apheresis donor population. Transfusion. 2009 Sep;49(9):1971-6. [CrossRef] [PubMed] [PubMed Central]
- Jaiswal, Manish & Srivastava, Anima & Siddiqui, T.J. (2019). Machine Learning Algorithms for Anemia Disease Prediction: Select Proceedings of IC3E 2018. [CrossRef]
- Khera R, Singh T, Khuana N, Gupta N, Dubey AP. HPLC in characterization of hemoglobin profile in thalassemia syndromes and hemoglobinopathies: a clinicohematological correlation. Indian J Hematol Blood Transfus. 2015 Mar;31(1):110-5. [CrossRef] [PubMed] [PubMed Central]
- George, E.; Jamal, A.R.; Khalid, F.; Osman, K.A. High performance liquid chromatography (HPLC) as a screening tool for classical Betathalassaemia trait in malaysia. Malays J Med Sci. 2001, 8, 406. [Google Scholar] [PubMed] [PubMed Central]
- Liu, K.-Z.; Tsang, K.; Li, C.; Shaw, A.; Mantsch, H. Infrared spectroscopic identification of betathalassemia. Clinical chemistry 2003, 49, 1125–1132. [Google Scholar] [CrossRef] [PubMed]
- Uçucu, S. , Karabıyık, T. & Azik, F. (2023). Machine learning models can predict the presence of variants in hemoglobin: artificial neural network-based recognition of human hemoglobin variants by HPLC. Turkish Journal of Biochemistry, 48(1), 5-11. [CrossRef]
- Ferih K, Elsayed B, Elshoeibi AM, Elsabagh AA, Elhadary M, Soliman A, Abdalgayoom M, Yassin M. Applications of Artificial Intelligence in Thalassemia: A Comprehensive Review. Diagnostics (Basel). 2023 Apr 26;13(9):1551. [CrossRef] [PubMed] [PubMed Central]
- Shoaib Farooq, M. , & Younas, H. A. (2023). Beta Thalassemia Carriers detection empowered federated Learning. arXiv e-prints, arXiv-2306.
- Egejuru, Ngozi & Olusanya, Olayinka & Asinobi, Adanze & Omotayo Joseph, Adeyemi & Adebayo, Victor & Idowu, Peter. (2019). Using Data Mining Algorithms for Thalassemia Risk Prediction. Journal of Biomedical Science and Engineering. 7. 3344. [CrossRef]
- Mohammed, M.Q.; Al-Tuwaijari, J.M. A Survey on various Machine Learning Approaches for thalassemia detection and classification. Turkish Journal of Computer and Mathematics Education (TURCOMAT) 2021, 12, 7866–7871. [Google Scholar]
- Alsheref, F.K.; Gomaa, W.H. Blood diseases detection using classical machine learning algorithms. International Journal of Advanced Computer Science and Applications 2019, 10. [Google Scholar]
- Golino, H.F.; Amaral, L.S.D.B.; Duarte, S.F.P.; Gomes, C.M.A.; Soares, T.D.J.; Reis, L.A.D.; Santos, J. Predicting increased blood pressure using machine learning. Journal of obesity 2014. [Google Scholar]
- Endalamaw, B., Abuhay, T. M., & Shibabaw, D. (2022, January). Predicting the Level of Anemia among Ethiopian Pregnant Women using Homogeneous Ensemble Machine Learning Algorithm. In Proceeding of the 2 nd Deep Learning Indaba-X Ethiopia Conference 2021.
- Geetha, V.; Gomathy, C.K.; Keerthi, K.; Pavithra, N. Diagnostic Approach To Anemia In Adults Using Machine Learning. Journal of Pharmaceutical Negative Results 2022, 3713–3717. [Google Scholar]
- Mitani, A.; Huang, A.; Venugopalan, S.; Corrado, G.S.; Peng, L.; Webster, D.R.; Varadarajan, A.V. Detection of anaemia from retinal fundus images via deep learning. Nature Biomedical Engineering 2020, 4, 18–27. [Google Scholar] [PubMed]
- Bryant BJ, Hopkins JA, Arceo SM, Leitman SF. Evaluation of low red blood cell mean corpuscular volume in an apheresis donor population. Transfusion. 2009 Sep;49(9):1971-6. [CrossRef] [PubMed] [PubMed Central]
- Mohammed, M.Q.; Al-Tuwaijari, J.M. A Survey on various Machine Learning Approaches for thalassemia detection and classification. Turkish Journal of Computer and Mathematics Education (TURCOMAT) 2021, 12, 7866–7871. [Google Scholar]
- Dejene, B.E.; Abuhay, T.M.; Bogale, D.S. Predicting the level of anemia among Ethiopian pregnant women using homogeneous ensemble machine learning algorithm. BMC Medical Informatics and Decision Making 2022, 22, 1–11. [Google Scholar] [CrossRef] [PubMed]
|
Disclaimer/Publisher’s Note: The statements, opinions and data contained in all publications are solely those of the individual author(s) and contributor(s) and not of MDPI and/or the editor(s). MDPI and/or the editor(s) disclaim responsibility for any injury to people or property resulting from any ideas, methods, instructions or products referred to in the content. |
© 2025 by the authors. Licensee MDPI, Basel, Switzerland. This article is an open access article distributed under the terms and conditions of the Creative Commons Attribution (CC BY) license (http://creativecommons.org/licenses/by/4.0/).