Submitted:
05 June 2024
Posted:
12 June 2024
You are already at the latest version
Abstract
One of the most prevalent illnesses, diabetes does not directly result in patient mortality. But, it increases the risk of death. Any disease that may be predicted in its early stages can lessen its fatal effects while also enhancing the quality of the healthcare system. For the early-stage prediction of diabetes or such types of non-communicable diseases, we need the proper set of influential features. This research has developed a machine learning-based disease prediction model to identify the influential features for diabetes prediction and give a near-perfect classification accuracy. This model includes Min-Max normalization for data normalization, Isolation Forest (iForest) for outlier removal, Synthetic Minority Oversampling Technique (SMOTE) for oversampling, Random Forest based Recursive Feature Elimination (RFE-RF) test, Chi-Square test, and Minimum Redundancy Maximum Relevancy (mRMR) test based feature selection methods for identifying the influential features, and Support Vector Machine (SVM), K Nearest Neighbor (KNN), and Naive Bayes (NB) for the classification. The results clarify that the proposed model outperforms the previous models and studies. The SVM has attained an accuracy of 99.58% in classification using the five features chosen from the Chi-Square test. Lastly, SHAP, an explainable AI model, has been used to assess the classifier model’s performance. These selected features and the classifier model can be used for early-stage diabetes prediction.
Keywords:
communicable disease
; diabetes
; feature selection
; imbalanced dataset
; insulin
; kernel function
; outliersamples
1. Introduction
Diabetes which is a non-communicable disease is very prevalent around the world. High blood glucose levels resulting from deficiencies in insulin secretion, activity, or both define this metabolic disease. In 2019, it was anticipated that 8.8% of the world’s population had diabetes, making it a serious public health issue that impacts millions of people. [1]. Research has shown that in 2045, 645 million people worldwide will be affected by diabetes [2]. The situation is worse in developing countries like ours. There will be 228 million diabetics in developing nations by the year 2030 [3]. The Diabetes Association of Bangladesh claims that the number of diabetes patients in Bangladesh is more than 13 million. When considering the number of persons with diabetes, Bangladesh is ranked eighth among the top 10 nations worldwide [4].
There are three primary forms of diabetes. Type 1: The immune system targets the insulin-producing cells in the pancreas in this particular kind of diabetes, which is an autoimmune illness. Because of this, the body is unable to manufacture insulin, which raises blood glucose levels. Type 2: When the body experiences insulin resistance or is unable to create enough insulin to fulfill the body’s requirements, it develops. It is the most prevalent kind of diabetes. Type 2 diabetes is frequently linked to being overweight, a poor diet, and inactivity. Another one is Gestational Diabetes. Gestational diabetes develops during pregnancy and often goes away once the baby is born. Women who have gestational diabetes run a higher risk of getting type 2 diabetes in the future if it is not appropriately managed.
Diabetes is not directly responsible for death in humans, but the risk of premature death is twice as high in patients with diabetes [5]. Patients suffering from diabetes are more likely to have problems such as foot ulcers, renal disease, heart disease, and stroke [6]. Due to long-term uncontrolled diabetes, complications like hyperosmolar hyperglycemia, and diabetic ketoacidosis may occur [5]. Diabetes-related complications account for 46.2% of all fatalities globally [7]. The cost of treating diabetes is much higher than other diseases. In 2017, approximately US$ 727 billion was spent on diabetes-related treatment worldwide [8].
The damage caused by diabetes can be reduced to a great extent through early diagnosis and proper diet and exercise. Concerned about the increasing risk of diabetes, researchers are investigating how to diagnose diabetes at an early stage using machine learning, a part of artificial intelligence. As a result of long-term research, machine learning is showing good results in diagnosing diabetes [9] [10]. But, due to the nature of data, missing values, class imbalance issues, and outlier samples, in many cases, machine learning cannot provide accurate results or cause complications in diabetes prediction. If these problems are solved, it will be possible to diagnose diabetes more effectively. According to research, the performance of machine learning algorithms may be further enhanced by employing Isolation Forest (iForest) to exclude outlier samples [11] and Synthetic Minority Oversampling Technique (SMOTE) for oversampling to address the class imbalance issue [12] [13]. No prior machine learning research combined the usage of iForest to eliminate outlier samples and SMOTE to address class imbalance concerns to enhance the performance of the SVM in diabetes diagnosis.
In this study, we have focused on both figuring out the influential features that help to predict diabetes and enhancing the classifier model’s performance. After resolving the missing value using the data that was gathered, we have utilized Min-Max normalization. Following that, the outlier samples were eliminated using Isolation Forest. To find the influential features, the dataset sans outlier samples has been taken into consideration. The Chi-Square test, the minimum redundancy maximum relevancy (mRMR) test, and the Recursive Feature Elimination based on Random Forest (RFE-RF) test have been imposed on the dataset. Then, the SMOTE has been utilized for oversampling to solve the class imbalance issue as the dataset contains few numbers of positive class data. After that, the classifier models were trained with a newly formed class-balanced dataset containing only the selected features. The effectiveness of the classifier models is then assessed and compared to the findings of earlier studies. As performance evaluation metrics, we have considered accuracy (acc), sensitivity (sen), specificity (spe), Matthew’s Correlation Coefficient (MCC), F1 Score, and Area Under Curve (AUC). The performance of our proposed prediction model beats the earlier findings. Finally, the SHapley Additive exPlanations (SHAP) have been employed to elucidate the significance of the chosen features in classification.
The remainder of the paper is structured as follows. Section 2 provides a summary of the literature review. Section 3 represents the dataset description, methods used for outlier removal, solving class imbalance issues, feature selection, and classification. Section 3 also discusses performance evaluation matrices and the prediction model for diabetes prediction in this research. Section 4 discusses the experimental setup and steps followed in this research. Section 4 also contains the output of each step and the value of the parameters. Section 5 discusses the results of the classifier models and also represents the comparison of the result with previous research. Finally, Section 6 summarizes the research and discusses future work.
2. Literature Review
This Section represents the previous studies related to machine learning models for diabetes prediction, outlier detection methods, and oversampling methods for class imbalance issues.
2.1. Machine Learning Based Diabetes Prediction Models
Diabetes does not kill people directly, but it carries a higher risk of stroke. Diabetes cannot be fully cured. A healthy diet and regular exercise can help to manage diabetes effectively [14]. If it is possible to predict diabetes in the early stage, the complications of diabetes can be reduced to a great extent. Early prediction helps patients take preventive measures against diabetes.
Using machine learning, early diabetes prediction models can be developed by analyzing the individual’s current risk factors. In this regard, machine learning researchers have investigated in the past and developed early-stage prediction models. Patil, Joshi, and Toshniwal [15] used K-means clustering for outlier removal and the C4.5 classifier on the Pima Indian dataset. The best classification accuracy was attained by them, coming in at 92.38%. Another research [16], collected a large dataset consisting of 13,647,408 samples from different ethnic groups in Kuwait. They used logistic regression, K-Nearest Neighbors (KNN), Multi-factor Dimensionality Reduction (MDR), and Support Vector Machine (SVM) as classifier models. Wu, Yang, Huang, He, and Wang [17] developed a prediction model consisting of an improved version of K-means clustering and logistic regression. The outlier samples were detected by improved K-means clustering. Then, logistic regression was used as the classifier. They found out that they outperformed the previous models. Alam and his team [18] used data mining and machine learning for early-stage diabetes prediction. They discovered a significant correlation between body mass index (BMI) and blood glucose levels and diabetes. As a prediction model, they employed K-means clustering, Random Forest, and Artificial Neural Networks (ANN). They concluded that ANN outperforms others and achieved 75.7% classification accuracy. Fitriyani, Syafrudin, Alfian, and Rhee [19] studied a well-known dataset named Dr. John Schorling’s diabetes dataset. They used iForest for outlier removal and the synthetic minority oversampling technique Tomek link (SMOTETomek) for oversampling. For prediction, they developed an ensemble-based learning model combining Multi-Layer Perceptron (MLP), Support Vector Machine (SVM), Decision Tree as a first-level learner, and Logistic Regression (LR) as a second-level learner. They identified 9 features as important features and achieved precision: 94.49%, recall: 98.62%, F1: 96.32%, AUC: 0.99, and Accuracy: 96.74%. Islam, Ferdousi, Rahman, and Bushra [20] collected data from the Sylhet Diabetes Hospital, Bangladesh. Different machine learning models were examined, and they came to the conclusion that Random Forest performed better than the others when it came to the data they had gathered. Islam, Rahman, Abedin, Ahammed, Ali, Ahmed, and Maniruzzaman [21] studied the National Health and Nutrition Examination Surveys (NHANES) diabetes dataset. They used Logistic Regression, Naïve Bayes, J48, Multi-layer Perceptron, and Random Forest (RF) as classifier models and the best classification accuracy, AUC were 95.9%, and 0.946 respectively. Deberneh and Kim [22] developed a diabetes prediction model combining feature selection and classification. They used the dataset of Electronic Medical Record, Hanaro Medical Foundation, Seoul, South Korea. Using ANOVA tests, chi-squared tests, and RFE, they selected 12 features as influential features. For classification, they utilized Logistic Regression, Random Forest, SVM, and eXtreme Gradient Boosting (XGBoost) and achieved 77.87% classification as the best. Syed and Khan [23] solved the class imbalance problem using SMOTE for oversampling. They used the Chi-Square test and Binary Logistic Regression for feature selection and selected 10 features. For classification purposes, Decision Tree (DT), Support Vector Machine, Decision Jungle, Logistic Regression, Boosted DT, and Neural Network were used. Their best classification accuracy, precision, recall, AUC, and F1 score were 82.1%, 77.6%; 89.0%; 0.86, and 82.9% respectively.
2.2. Outlier Detection Method
One of the most challenging problems in machine learning is dealing with outlier samples. In computer science, the process of identifying data points that deviate from the norm is known as outlier detection. The Isolation Forest (iForest) [24] is a decision tree-based outlier detection method. Some previous research has elicited that the iForest can contribute to improving the accuracy of the classifier model by removing the outlier data points.
Ijaz, Attique, and Son [25] developed a Random Forest-based cervical cancer forecasting method. For outlier identification, they employed iForest and density-based spatial clustering of applications with noise (DBSCAN), and for oversampling, they used SMOTE and SMOTETomek. They discovered that the performance of the iForest with SMOTE and SMOTETomek is superior to the DBSCAN with SMOTE and SMOTETomek. A deep learning-based heart disease prediction model was put out in another study [26] for the UCI machine learning heart disease dataset. They found that the isolation forest-based outlier removal method improved the classification accuracy by removing outlier samples. Rezaei, Woodward, Ramirez, and Munroe [27] developed a cardiovascular diseases prediction model using Isolation Forest for outlier detection, SMOTE for oversampling, and ensemble learning for classification. They studied the UK Biobank ECG repository focusing on the binary classification of Atrial Fibrillation and Ventricular Arrhythmia. Their proposed method was more effective than others in improving classification accuracy.
2.3. Oversampling Method for Solving Class Imbalance Issue
Class imbalance is another obstacle in machine learning which occurs when the number of positive cases and negative are not equal for binary classification problems. The classification model becomes biased to a specific class if the dataset is class imbalanced and the test result is not accurate. So, one crucial area of machine learning research is resolving the class imbalance issue. Over- and under-sampling are methods that can be used to address this issue. Data duplication from the minority class is the result of oversampling. As a potential remedy for the class imbalance issue, the Synthetic Minority Oversampling Technique (SMOTE) [28] may help to raise the prediction models’ classification accuracy.
Using Random Forest as a classifier, Density-based Spatial Clustering of Applications with Noise (DBSCAN) as an outlier removal technique, and Synthetic Minority Oversampling Technique (SMOTE) as the oversampling technique, Ijaz, Alan, Syafrudin, and Rhee [29] developed a type 2 diabetes and hypertension prediction model. They demonstrated how the SMOTE may address the class imbalance problem and increase the classifier model’s accuracy. Another research [30] developed a model to identify diesel brands using tree-based feature selection, SMOTE for oversampling, and XGBoost-based ensemble learning for classification. According to their results, the classification gained by the combination of Tree-SMOTE-XGBoost is 19.33% higher than the accuracy gained by the XGBoost. Sridhar and Sanagavarapu [31] proposed a machine failure prediction model using SMOTE for oversampling and Random Forest for classification. They found that the AUC score increased by 7.83% if SMOTE was used as the oversampling technique.
3. Data and Prediction Model
The proposed diabetes prediction model, the dataset, and the methodologies included in the prediction model are all covered in this section. The description of the dataset in use is described first.
3.1. Description of the Dataset
We have investigated a well-known type 2 diabetes dataset that Dr. J. Schorling [32] presented. The dataset contains information on 403 of the 1046 people who took part in a research to find out how common diabetes, obesity, and other cardiovascular risk factors are among African Americans in central Virginia. The dataset contains 19 attributes namely id, chol, stab.glu, hdl, ratio, glyhb, location, age, gender, height, weight, frame, bp.1s, bp.1d, bp.2s, bp.2d, waist, hip, time.ppn. The attribute ’id’ has no medical significance. It is just used to number the samples. bp.2s, bp.2d have no value for 262 samples. That means these attributes have a missing value for 65% samples. These two attributes have not been considered in the final dataset. Besides this, 29 samples have a lot of missing values for different attributes. These 29 samples have not also been considered in the final dataset. After ignoring the samples having missing value problems, the final dataset contains 374 samples and 16 attributes. Table 1 describes the final dataset used in this research and also represents data distributions. The dataset contains 58 positive samples and 316 negative samples.
3.2. Proposed Model for Diabetes Prediction
This subsection describes the proposed diabetes prediction model. The proposed prediction model combines data pre-processing, removing outlier samples, solving class imbalance issues, and classification. The missing value problem and data normalization are performed at the data pre-processing stage. For normalization, Min-Max normalization is used. The Isolation Forest is used to remove the outlier samples. After removing outliers, feature selection is performed. For feature selection, three well-known feature selection methods namely the Chi-Square test, the Minimum Redundancy and Maximum Relevancy (mRMR) test, and the Random Forest based Recursive Feature Elimination (RFE-RF) test have been used. Then, the class imbalance issue is solved by oversampling. For oversampling, the Synthetic Minority Oversampling Technique (SMOTE) is used. After oversampling, the classifier models are trained with the training samples. The Support Vector Machine, the K-Nearest Neighbors (KNN), and the Naive Bayes (NB) are utilized here as the classifier models. Then, the test samples are tested separately for each classifier model. In the result analysis stage, the classifier models are compared among themselves. The best one is also compared with the previous models. Figure 1 represents the details of the proposed diabetes prediction model.
3.3. Methods
The techniques included in the suggested diabetes prediction model are described in this subsection.
3.3.1. Min-Max Normalization
Data normalization is a very important part of data pre-processing. Data normalization is used to scale the features in a similar range. By normalizing the features, it is possible to increase the prediction model’s accuracy and stability.
Min-Max normalization is a very renowned normalization technique in machine learning. The Min-Max normalization transforms the data in the scale of [0,1]. The highest value of a specific feature is replaced by the value 1 and the lowest by the value 0. The mathematical equation for Min-Max normalization is
Here, is the value of the attribute for the sample i. and are the maximum value and the minimum value respectively of that attribute. is the new value of after normalization.
3.3.2. Isolation Forest
Isolation Forest (iForest), an unsupervised machine learning approach, is developed on decision trees and is mostly used to identify outlier data. The main idea of iForest is the random split of the data points and building up trees. First, an attribute is selected randomly as the splitting feature of the data points. Then an arbitrary threshold value is selected within the range of the selected attribute. This threshold value is used to split the samples into two groups. The samples which have a value greater than the threshold are in one group and others are in another group. This random splitting process is being repeated on the newly separated groups recursively until no further split on the new group or fulfills certain criteria.
The tree generated by this process is used to detect the outliers. Data points that are isolated after a few splits, i.e. those with lower-level values are outlier data points. The more accurate the tree construction, the easier and more effective it is to find outlier samples. The anomaly score is calculated for each sample in Isolation Forest. The anomaly score is calculated as
Here, n denotes the sample size, denotes the average cost of an unsuccessful search in Binary Search Tree (BST), and is the cost of a sample x. In iForest, cost means the path length of a node from the root of the BST.
3.3.3. Synthetic Minority Oversampling Technique (SMOTE)
SMOTE is an oversampling technique that generates synthetic data points using the existing data points from the minority class rather than oversampling by replacement. For generating synthetic data points, SMOTE uses the feature space rather than the sample space of the existing data points from the minority class. SMOTE follows a simple but very fruitful use of K-Nearest Neighbors. SMOTE selects a random value of K depending on the amount of oversampling required. These K neighbors are taken into account while creating synthetic data points for a particular minority class data point. First, a data point from the minority class is chosen, and the K neighbors are found, in order to create synthetic data points. Then, the vector difference between the selected data point and one of its neighbors is multiplied by a random value between [0,1] and added to the selected data point. The newly generated data point is actually a synthetic data point [28]. In this way, oversampling is performed in SMOTE.
3.3.4. Chi-Square Test
The Chi-squared test [33] is used to determine whether there is a statistically significant difference between the actual outcomes and the results that were perceived in one or more areas of a probability chart. Groups of measures that are typically mutually exclusive are created. The test statistic calculated from the measurements confirms chi-square frequency correlations, which is consistent with the null hypothesis that there are no differences between the groups in the population. Assessing how appropriate the perceived rates would be if the null hypothesis were true is the main objective of the investigation. The Chi-Square is calculated as in equation 3.
Here, is the Chi-Square, and denote the observed and expected values respectively.
3.3.5. Minimum Redundancy and Maximum Relevancy (mRMR) Test
The mRMR test [34] chooses a selection of characteristics from a dataset that optimizes relevance to the target variable while reducing redundancy among the chosen features. This problem is solved by mRMR by taking relevance and redundancy into account simultaneously. Redundancy assesses the similarity or overlap between characteristics, while relevance gauges how useful a feature is in forecasting the target variable. In order to determine which attributes are most valuable, the algorithm attempts to strike a compromise between these two factors. The merit value for each feature is determined by mRMR based on the relevance and redundancy scores. The algorithm then iteratively chooses the characteristics with the highest merit value, making sure that the chosen features share as little information as possible with one another. This procedure is carried out again until the required number of characteristics is attained.
3.3.6. Recursive Feature Elimination based Random Forest (RFE-RF) Test
RFE is a method that recursively chooses features by training a model on the entire feature set and then removing the features that are deemed to be the least significant based on their importance rankings. A predetermined number of characteristics is attained by repeating this method. The feature importance or coefficients of the underlying model are often examined to determine the importance rankings.
Random Forest (RF) is an ensemble learning technique that blends various decision trees to generate predictions. A random subset of characteristics and data samples are used to train each decision tree in the forest. The resilience and versatility of Random Forest are well recognized.
RFE-RF [35] combines the RFE and the RF. First, it trains the Random Forest model using all features. Then, it ranks the features based on the Random Forest Model. Next, it eliminates the least scored feature. This procedure is repeated recursively until a desired number of features is selected.
3.3.7. Support Vector Machine (SVM)
The Support Vector Machine [36] is a supervised machine learning model mostly used for binary classification. SVM seeks to identify the ideal decision boundary that can discretize the data points of classes with the greatest margin..
Suppose, are data points and are class label of . w is the weight vector of the classification model. The decision boundary described in equation 4 can classify the data points correctly.
This decision boundary can be found by solving the following constrained optimization problem.
Here, b is the bias. The decision function becomes
Noisy data points lead to misclassification. To solve miss-classification due to noisy data, is introduced. Another parameter C is introduced to balance the training accuracy and generalization ability. A boundary line may not always be able to distinguish between data points due to the complexity of the data. For a hyperplane to be able to divide the data points, data must be transformed to a higher dimension. The kernel function aids in this data translation into a higher dimension. The optimization problem becomes
Here, works as a data transformation function. We have to find such that
actually denotes the kernel function . The optimal classification function becomes
3.3.8. K-Nearest Neighbors (KNN)
K-Nearest Neighbors [37] is a well-known supervised classification algorithm in machine learning. KNN considers only K samples for the classification purpose of test data. The optimal value of K is determined during the training phase of the classification model. For assigning the class label of a test data point, the classifier model considers the K nearest neighbors as per Euclidean distance and counts the class label of the neighbors. The category for which the neighbor count is highest is the one to which the classifier allocates the new data points.
3.3.9. Naive Bayes (NB)
Naive Bayes classifier or Bayesian Classifier based on Bayes theorem is a supervised learning model used in data mining and machine learning [38]. Naive Bayes classifier uses the likelihood, prior and evidence probability to determine the probability of being a specific class labeled data.
Suppose, T is an n-dimensional training data set associated with their class label . Each data point X is represented in n-dimensional vector space as . The NB Classier assigns class label to the data point X if the posterior probability of class is the highest for X. According to Bayes theorem, the posterior probability is defined as
As is the same for all classes. So, is needed to be maximized.
To reduce the computational complexity, NB assumes that the attributes are conditionally independent. Thus,
3.3.10. SHAP
SHAP (SHapley Additive exPlanations)[39] explains machine learning model output using ideas from cooperative game theory. Shapley values are a way to divide the overall gain across features according to how much each feature contributes to the overall accuracy. Considering a model f and a prediction , the Shapley value for feature i is determined as follows:
3.3.11. Performance Metrics
In this research, we have considered six performance metrics namely accuracy, sensitivity, specificity, Mathew’s correlation coefficient (MCC), F1 score, and Area Under the Curve (AUC). These can be calculated from the confusion matrix. The confusion matrix has four outcomes namely true positive (TP), false positive (FP), false negative (FN), and true negative (TN). TP outcomes are classified as positive and their actual class labels are also positive. If the actual class label is negative and classified as positive, these are called FP. Similarly, a positive class labeled test data can be classified as negative, these cases are called FN. When the negative class labeled test data is classified correctly, then it is called TN. The performance metrics can be defined using these outcomes.
Accuracy (acc) denotes the correctness of classification.
Sensitivity (sen) denotes the model’s ability to classify the positive class labeled data correctly. It is defined in terms of TP and FN.
Specificity (spe) is a similar measurement to sensitivity. Specificity measures the model’s correctness in classifying the negative class data. Specificity is defined as in equation 16.
Matthew’s Correlation Coefficient (MCC) is a statistic used to rate the accuracy of binary classification. MCC calculates the discrepancy between the expected and actual classes.
Accuracy is not always a good metric for classification model evaluation where the dataset is class imbalanced. In those cases, the F1 score can be a good choice as it considers both precision and recall at a time.
Another performance indicator, Area Under the Curve (AUC), is utilized as the summary of the Receiver Operator Characteristic (ROC) and indicates the model’s capability to discriminate between positive class and negative class. The true positive rate (TPR) is shown against the false positive rate (FPR) on the ROC probability curve.
The value of AUC ranges [0,1]. AUC=1 denotes that the models can classify the samples perfectly. On the other hand, AUC=0 denotes that the model predicates the positive class as negative and the negative class as positive.
4. Experimental Analysis
This section discusses the experimental analysis and tabulates the results of the experiments. The Section 3.1 describes the dataset used in this research. After data collection, we split the dataset into training and testing sets as they are not separated from the original dataset. The total number of samples is 374 after removing the missing value problem. We randomly select 80% of the total sample as the training set and the rest 20% as the testing set. The training set consists of 299 samples among which 46 samples are positive cases. And, the testing set consists of 75 samples. Then, we apply the Support Vector Machine, Naive Bayes, and K-Nearest Neighbors classifier on the training dataset. For cross-validation, we use ten-fold cross-validation in all cases. We use the radial basis function (RBF) as the kernel function for the SVM classifier. After the model training, we evaluate the models using the testing dataset. Table 2 tabulates the results of the classifier models without using any data pre-processing.
In the next, we normalize the dataset using min-max normalization and remove the outlier samples using iForest. Now the data set consists of 355 samples. We separate 80% data as training data and 20% data as testing data by random selection. Now the training set and testing set consist of 284 and 71 samples respectively. Then, we apply the classifier models to the normalized and outlier-removed data. The results of the classifier models are tabulated in Table 3.
The influential features are selected using the Chi-Square test, the mRMR test, and the RFE-RF test. In all cases, we consider the top five features according to the feature ranking resulting from the feature selection methods. The name of the selected features and the corresponding Chi-Square scores are tabulated in Table 4. Figure 2 represents the bar chart of the feature name and score of selected features from the Chi-Square test. Table 5 tabulates the selected feature names and the mRMR scores. Figure 3 represents the bar chart of the selected features from the mRMR test. The selected features and the RFE-RFE scores are tabulated in Table 6. Figure 4 represents the bar chart of the selected features from the RFE-RF test.
After feature selection, new datasets are compiled. Now the training datasets consist of 284 samples with 5 features and the testing dataset consists of 71 samples with 5 features. The KNN is applied to the datasets with the selected features from different feature selection methods. The KNN classifier model is programmed in R programming language using the caret package. The ten-fold cross-validation is used during the training of the classifier model. The best K value is selected during cross-validation and considered in the testing phase. The performance of the KNN classifier for different feature selection methods is tabulated in Table 7.
We apply the Naive Bayes classifier to the data set consisting of the selected features from different feature selection methods. We use the Laplace smoothing with the value 3 in the Naive Bayes classifier. We also program the Naive Bayes classifier in R programming language using the e1071 package. The results of Naive classifiers are recorded in Table 7.
Next, we apply the Support Vector Machine as the classifier on the training datasets with selected features from different feature selection methods. We use the radial basis function (RBF) as the kernel function in SVM. For cross-validation, we follow the ten-fold cross-validation method here. During the model tuning, we consider the cost and gamma value in the range between . We also consider the class weighting factor during the model tuning. The best model from the model tuning is selected as the final SVM classifier. We program the SVM classifier in R programming language using the e1071 package. The performance of the SVM classifier on the different selected feature sets is tabulated in Table 7.
The current training datasets are class-imbalanced. The number of positive class samples and negative class samples are 249 and 35 samples respectively. We apply the SMOTE for oversampling to solve the class imbalance issue on the feature-selected training datasets. After solving the class imbalanced issue, the positive class and negative class contain an equal number of samples and it is 249. We also apply the SMOTE on the training dataset which contains all features. Then, we apply the classifiers on the class-balanced training dataset for building the classifier model. The performance of the classifier models on the different feature-selected datasets and all feature-contained dataset are recorded in Table 8.
To describe the classification model, we have finally implemented the SHAP. The best SVM model in our experiment is the one that was created after class imbalance problems were resolved. To make the swarm plot, we took into account every test sample.
From Figure 5, the `glyhb’ has a strong negative impact on classification at low values. Comparably, low `stab.glu’ values significantly impair classification. Similar to `ratio’, `age’, and `waist’ have an impact on classification, although not as much as `glyhb’.
The significance of every feature in classification is demonstrated by the waterfall plot. A positive class and a negative class labeled data have been chosen at random in this instance. The waterfall plot for the positive class test data is shown in Figure 6. The `glyhb’ has the maximum importance in positive class data classification and `stab.glu’ is the second one. Figure 7 has shown the waterfall plot for the negative class test data. In this case, the `glyhb’ is also the most important factor for classification.
5. Result Analysis
This section discusses the results of the experiments performed in Section 4. The SVM performs better than other classifier models on the preliminary dataset without any data pre-processing. The SVM achieves classification accuracy 96.20%, sensitivity 76.25%, specificity 100%, MCC 0.854, F1 score 0.8649, and AUC 0.8813. Comparing Table 2 and Table 3, we can say that the performances of the classifiers in all cases are improved after data normalization and removing outliers. The SVM outperforms other classifiers again and archives accuracy 97.82%, sensitivity 85%, specificity 99.68%, MCC 0.8983, F1 score 0.9073, and AUC 0.9234. The selected features and the corresponding scores from different feature selection methods are recorded in Table 4, Table 5, and Table 6. Observing Figure 2, Figure 3, and Figure 4, we can decide that the impact of glyhb is the most among the selected features. The impact of stab.glu is the second highest. The glyhb, stab.glu, and age are common in all cases. The ratio and waist are common in two cases. The result of feature selection is also similar to the result of the SHAP.
From Table 3 and Table 7, it is clear that the performances of the classifiers are also improved after feature selections. The SVM does better than other classifiers in all feature selection cases. For the selected features from the Chi-Square test, the SVM achieves the best classification performance. The accuracy, sensitivity, specificity, MCC, F1 score, and AUC are 99.51%, 97.78%, 99.76%, 0.9777, 0.9804, and 0.9877 respectively.
Observing Table 3, and Table 8, we can say that the performance of the SVM classifier is improved after solving the class imbalance issue using the SMOTE. The classification accuracy, sensitivity, specificity, MCC, F1 score, and AUC are increased by 0.42%, 1.11%, 0.32%, 0.0202, 0.01727, and 0.0072 respectively. From Table 7 and Table 8, we observe that the classification performance of the SVM is increased in most of the cases after applying the SMOTE. For the Chi-Suare test, after applying the SMOTE, the SVM achieves the best classification performance. The accuracy, sensitivity, specificity, MCC, F1 score, and AUC are 99.58%, 97.78%, 99.84%, 0.9801, 0.9824, and 0.9881 respectively.
We also compare the performance of our proposed model with previous research. Table 9 shows the comparison between the proposed diabetes prediction model and the previous studies. Our proposed model does better than previous studies though we consider less number of features.
6. Conclusion and Future Work
In this research, we develop a diabetes prediction model using machine learning. We solve the missing value problem and normalize the dataset using Min-Max normalization. We remove the outlier data samples using the Isolation Forest and solve the class imbalance issue by oversampling using the SMOTE. We utilize three well-known feature selection methods namely the Chi-Square test, mRMR test, and RFE-RF test for selecting the influential features for diabetes prediction. The selected features from these feature selection methods are from physical observation of the patients. No selected feature is related to hormonal tests or complex pathological tests. The SVM, KNN, and NB are used as the diabetic prediction methods. The SVM achieves the best overall classification performance on the dataset with the selected features from the Chi-Square test. In this case, the SVM achieves accuracy 99.58%, sensitivity 97.78%, specificity 99.84%, MCC 0.9801, F1 score 0.9824, and AUC 0.9881. Lastly, the SHAP has also identified the importance of each selected feature for classification separately. The SHAP model has determined that there is a considerable impact of `glyhb’ and `stab.glu’ on diabetes detection.
In the future, we will study more diabetes datasets using this diabetes prediction model. We will also study other diseases like hypertension, coronary artery disease (CAD), and coronary kidney disease (CKD) datasets. We will also investigate other outlier removal methods and oversampling methods.
References
- R. Thomas, S. Halim, S. Gurudas, S. Sivaprasad, and D. Owens, “Idf diabetes atlas: A review of studies utilizing retinal photography on the global prevalence of diabetes related retinopathy between 2015 and 2018,” Diabetes research and clinical practice, vol. 157, p. 107840, 2019. [CrossRef]
- G. D. Kalyankar, S. R. Poojara and N. V. Dharwadkar, “Predictive analysis of diabetic patient data using machine learning and Hadoop,” 2017 International Conference on I-SMAC (IoT in Social, Mobile, Analytics and Cloud) (ISMAC), Palladam, India, 2017, pp. 619–624. [CrossRef]
- S. Wild, G. Roglic, A. Green, R. Sicree, and H. King, “Global prevalence of diabetes: Estimates for the year 2000 and projections for 2030,” Diabetes Care, vol. 27, no. 5, pp. 104–1053, 2004. [CrossRef]
- Diabetes Newsletter. Issue 100 February 2023., 2023. [Online]. Available: https://www.dab-bd.org/diabetes_newsletter.php. Accessed on: May 13, 2023.
- W. H. Organization, “Diabetes fact sheet N 312. October 2013,” Archived from the original on, vol. 26, 2013.
- E. Saedi, M. R. Gheini, F. Faiz, and M. A. Arami, “Diabetes mellitus and cognitive impairments,” World journal of diabetes, vol. 7, no. 17, p. 412, 2016. [CrossRef]
- World Health Organization. (2016). Projections of Mortality and Causes of Death, 2016 to 2060. [Online]. Available: https://www.who. int/healthinfo/global_burden_disease/projections/en/.
- A. D. Association, “Economic costs of diabetes in the us in 2017,” Diabetes care, vol. 41, no. 5, pp. 917–928, 2018. [CrossRef]
- B.M. Patil, R.C. Joshi, and D. Toshniwal, "Hybrid prediction model for Type-2 diabetic patients", Expert Systems with Applications, vol. 37, no. 12, pp. 8102–8108, 2010. [CrossRef]
- H. Wu, S. Yang, Z. Huang, J. He, and X. Wang, “Type 2 diabetes mellitus prediction model based on data mining,” Informatics in Medicine Unlocked, vol. 10, pp. 100–107, 2018. [CrossRef]
- R. Domingues, M. Filippone, P. Michiardi, and J. Zouaoui, “A comparative evaluation of outlier detection algorithms: Experiments and analyses,” Pattern Recognit., vol. 74, pp. 406–421, Feb. 2018. [CrossRef]
- G. Douzas, F. Bacao, and F. Last, “Improving imbalanced learning through a heuristic oversampling method based on k-means and SMOTE,” Information Sciences, vol. 465, pp. 1–20, 2018. [CrossRef]
- B. Yan, G. Han, M. Sun and S. Ye, "A novel region adaptive SMOTE algorithm for intrusion detection on imbalanced problem," 2017 3rd IEEE International Conference on Computer and Communications (ICCC), Chengdu, China, 2017, pp. 1281-1286. [CrossRef]
- A. Alloubani, A. Saleh, and I. Abdelhafiz, "Hypertension and diabetes mellitus as a predictive risk factors for stroke," Diabetes Metabolic Syndrome, Clin. Res. Rev., vol. 12, no. 4, pp. 577–584, Jul. 2018. [CrossRef]
- B.M. Patil, R.C. Joshi, and D. Toshniwal, "Hybrid prediction model for Type-2 diabetic patients," Expert Systems with Applications, vol. 37, nn. 12, pp. 8102–8108, 2010. [CrossRef]
- B. Farran, A.M. Channanath, K. Behbehani, and T.A. Thanaraj,“Predictive models to assess risk of type 2 diabetes, hypertension and comorbidity: machine-learning algorithms and validation using national health data from Kuwait–a cohort study.” BMJ open, vol. 3, May, 2013. [CrossRef]
- H. Wu, S. Yang, Z. Huang, J. He, and X. Wang, "Type 2 diabetes mellitus prediction model based on data mining,"Informatics in Medicine Unlocked, vol. 10, pp. 100–107, 2018. [CrossRef]
- T. M. Alam, M. A. Iqbal, Y. Ali, A. Wahab, S. Ijaz, T. I. Baig, A. Hussain, M. A. Malik, M. M. Raza, S. Ibrar, Z. Abbas, "A model for early prediction of diabetes,"Informatics in Medicine Unlocked, vol. 16, pp. 100204, 2019. [CrossRef]
- N. L. Fitriyani, M. Syafrudin, G. Alfian, and J. Rhee, “Development of disease prediction model based on ensemble learning approach for diabetes and hypertension,” IEEE Access, vol. 7, p. 144777, 2019. [CrossRef]
- M. F. Islam, R. Ferdousi, S. Rahman, and H. Y. Bushra, “Likelihood prediction of diabetes at early stage using data mining techniques,” Computer Vision and Machine Intelligence in Medical Image Analysis, Springer, pp. 113–125, 2020.
- M. M. Islam, M. J. Rahman, M. M. Abedin, B. Ahammed, M. Ali, N. F. Ahmed and M. Maniruzzaman, “Identification of the risk factors of type 2 diabetes and its prediction using machine learning techniques”, Health Systems, Taylor & Francis, pp. 1-12, 2022.
- H. M. Deberneh, and I. Kim. "Prediction of Type 2 diabetes based on machine learning algorithm." International journal of environmental research and public health, MDPI, no. 6, p. 3317, 2021. [CrossRef]
- A. H. Syed, and T. Khan. "Machine learning-based application for predicting risk of type 2 diabetes mellitus (T2DM) in Saudi Arabia: a retrospective cross-sectional study." IEEE Access, vol. 8, pp. 199539-199561, 2022. [CrossRef]
- F. T. Liu, K. M. Ting and Z. -H. Zhou, "Isolation Forest," 008 Eighth IEEE International Conference on Data Mining, Pisa, Italy, 2008, pp. 413-422. [CrossRef]
- M. F. Ijaz, M. Attique, and Y. Son, “Data-Driven Cervical Cancer Prediction Model with Outlier Detection and Over-Sampling Method”,Sensors, vol. 20, no. 10, 2020, Art. no. 2809. [CrossRef]
- R. Bharti, A. Khamparia, M. Shabaz, G. Dhiman, S. Pande, and P. Singh, "Prediction of Heart Disease Using a Combination of Machine Learning and Deep Learning", Computational Intelligence and Neuroscience, vol. 2021, 2021, Art. no. 8387680. [CrossRef]
- M. J. Rezaei, J. R. Woodward, J. Ramirez and P. Munroe, "Combination of Isolation Forest, SMOTE and Ensemble Learning for the classification of Atrial Fibrillation and Ventricular Arrhythmia," 2021 International Conference on Biomedical Innovations and Applications (BIA), Varna, Bulgaria, 2022, pp. 45-50. [CrossRef]
- N. V. Chawla, K. W. Bowyer, L. O. Hall, and W. P. Kegelmeyer, "SMOTE: Synthetic Minority Over-Sampling Technique," Journal of Artificial Intelligence Research, vol. 16, pp.321-57, 2002.
- M. F. Ijaz, G. Alan, M. Syafrudin, and J. Rhee, “Hybrid prediction model for type 2 diabetes and hypertension using dbscan-based outlier detection, synthetic minority over-sampling technique (smote), and random forest,” Applied Sciences, vol. 8, no. 8, Aug. 2018, Art. no. 1325. [CrossRef]
- S. Wang, S. Liu, J. Zhang, X. Che, Y. Yuan, Z. Wang, D. Kong, "A new method of diesel fuel brands identification: SMOTE oversampling combined with XGBoost ensemble learning," Fuel, vol. 282, p. 118848, 2020. [CrossRef]
- S. Sridhar and S. Sanagavarapu, "Handling Data Imbalance in Predictive Maintenance for Machines using SMOTE-based Oversampling," 2021 13th International Conference on Computational Intelligence and Communication Networks (CICN), Lima, Peru, 2021, pp. 44-49. [CrossRef]
- J. P.Willems, J. T. Saunders, D. E. Hunt, and J. B. Schorling,"Prevalence of coronary heart disease risk factors among rural blacks: A community based study," Southern Medical Journal, vol. 90, no. 8, pp. 814–820, Aug. 1997. [CrossRef]
- A. Ugoni, and B.F. Walker, "The Chi square test: an introduction," COMSIG review, vol. 4, no. 3, pp. 61–64, 1995.
- H. Peng, F. Long and C. Ding, "Feature selection based on mutual information criteria of max-dependency, max-relevance, and min-redundancy," IEEE Transactions on Pattern Analysis and Machine Intelligence, vol. 27, no. 8, pp. 1226–1238, Aug. 2005. [CrossRef]
- P.M. Granitto, C. Furlanello, F. Biasioli, F. Gasperi, "Recursive feature elimination with random forest for PTR-MS analysis of agroindustrial products." Chemometrics and intelligent laboratory systems, vol. 83, no. 2, pp. 83-90, 2006. [CrossRef]
- C. Corinna and V. Vapnik, "Support-Vector Networks," Machine Learning, Vol. 20, No. 3, pp. 273-297, 1995. [CrossRef]
- T. Cover and P. Hart, "Nearest neighbor pattern classification," IEEE Transactions on Information Theory, vol. 13, no. 1, pp. 21–27, January 1967. [CrossRef]
- P. Langley, W. Iba, and K. Thompson, "An analysis of Bayesian classifiers," Aaai, vol. 90, pp. 223–228, 1992.
- S. M. Lundberg, and S.-L. Lee, "A unified approach to interpreting model predictions", Advances in Neural Information Processing Systems, 2017.
Figure 1.
The Proposed Diabetes Prediction Model Workflow Diagram
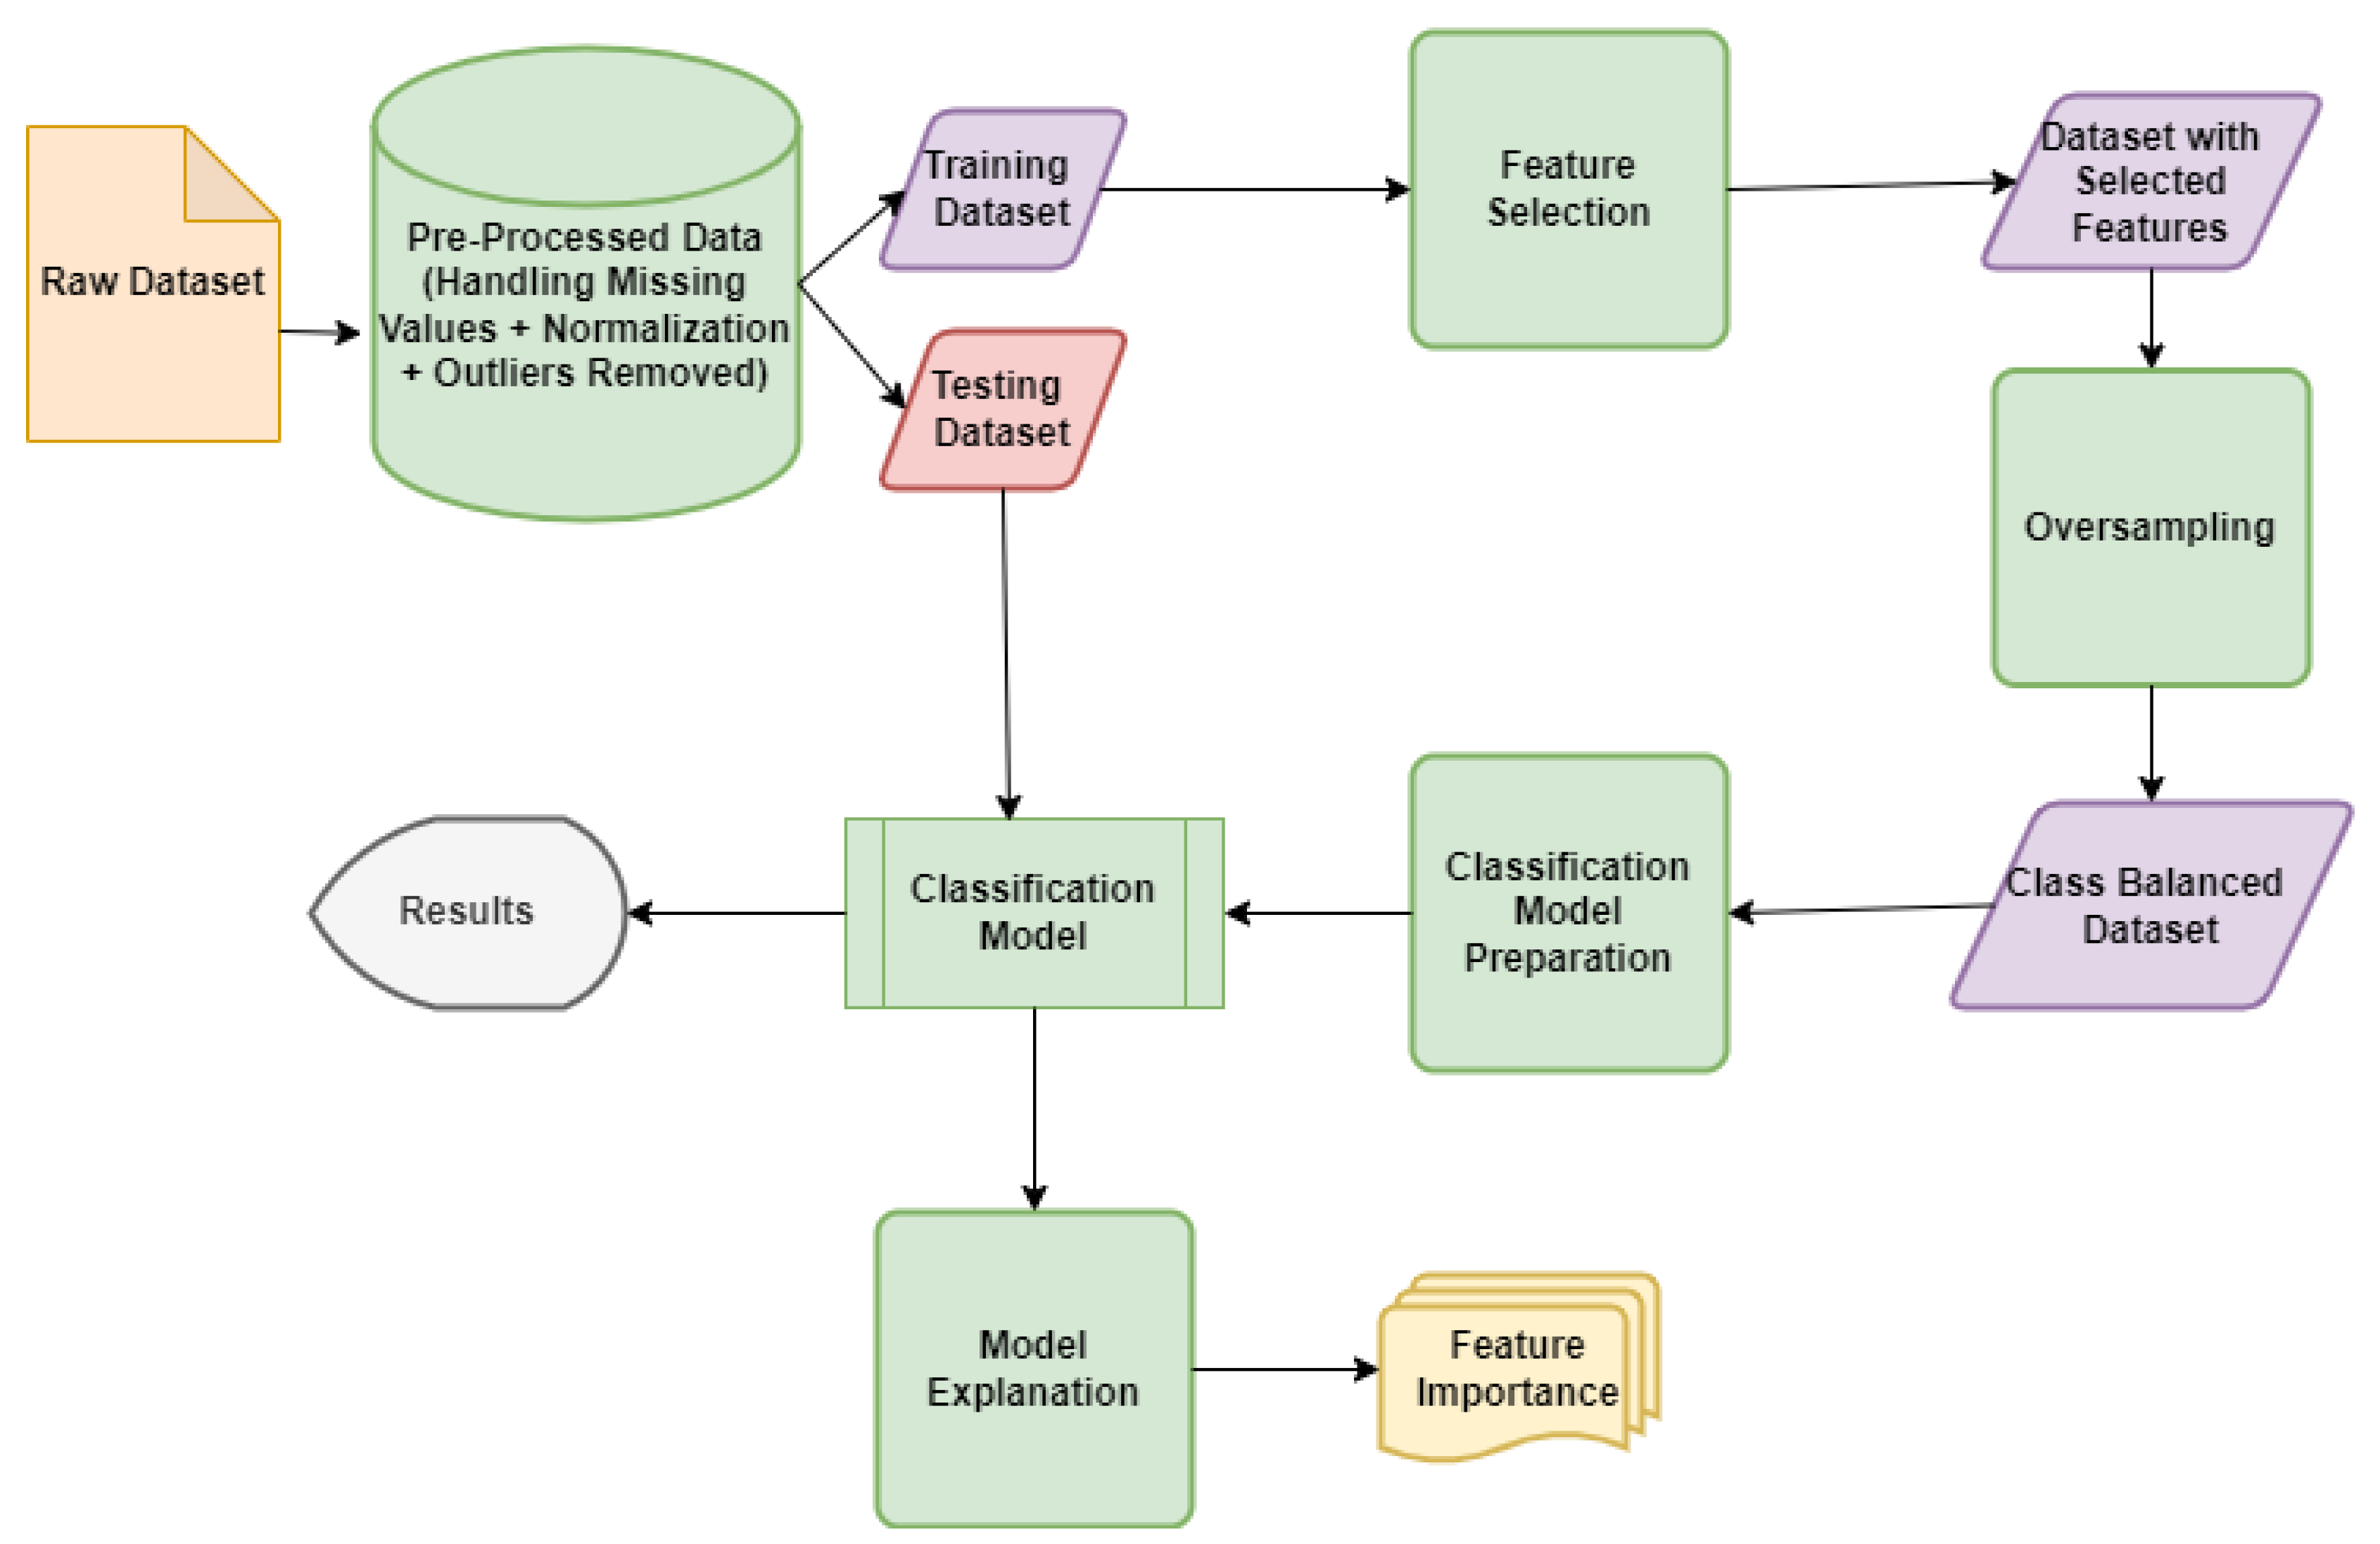
Figure 2.
Bar Chart of the Chi-Square Score Values of the Top Five Features Selected from the Chi-Square Test
Figure 2.
Bar Chart of the Chi-Square Score Values of the Top Five Features Selected from the Chi-Square Test
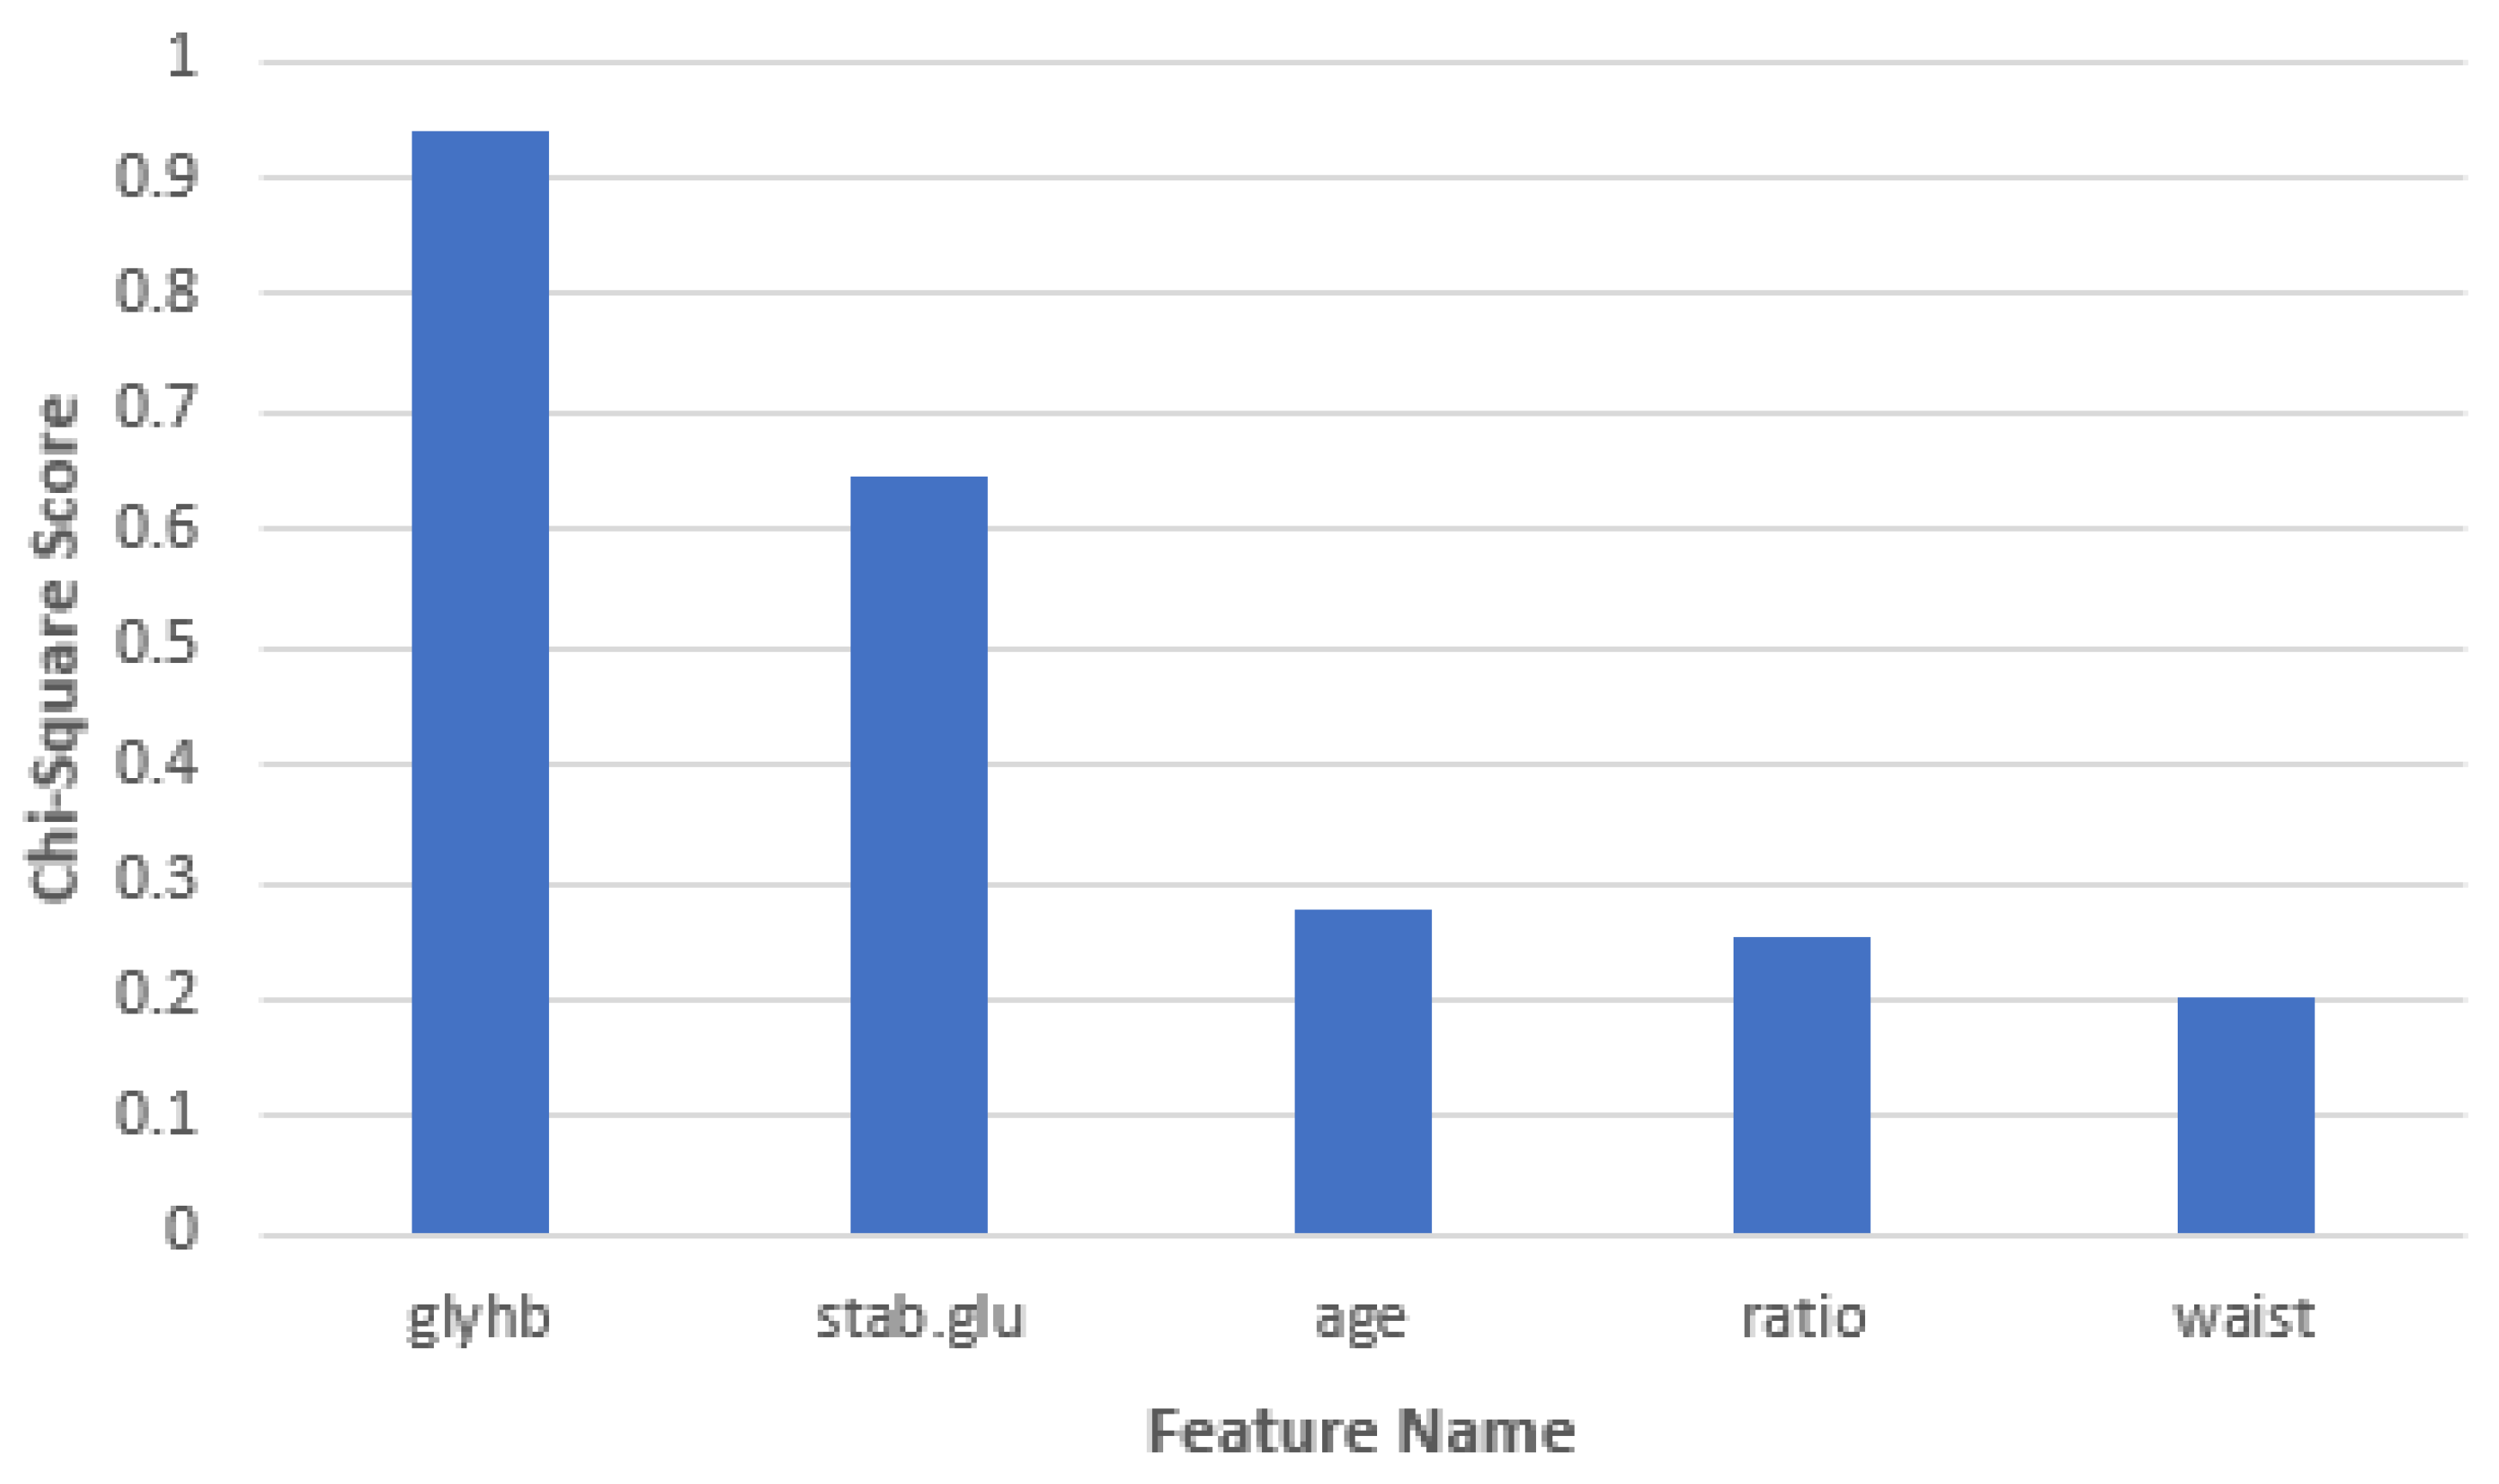
Figure 3.
Bar Chart of the mRMR Score Values of the Top Five Features Selected from the mRMR Test
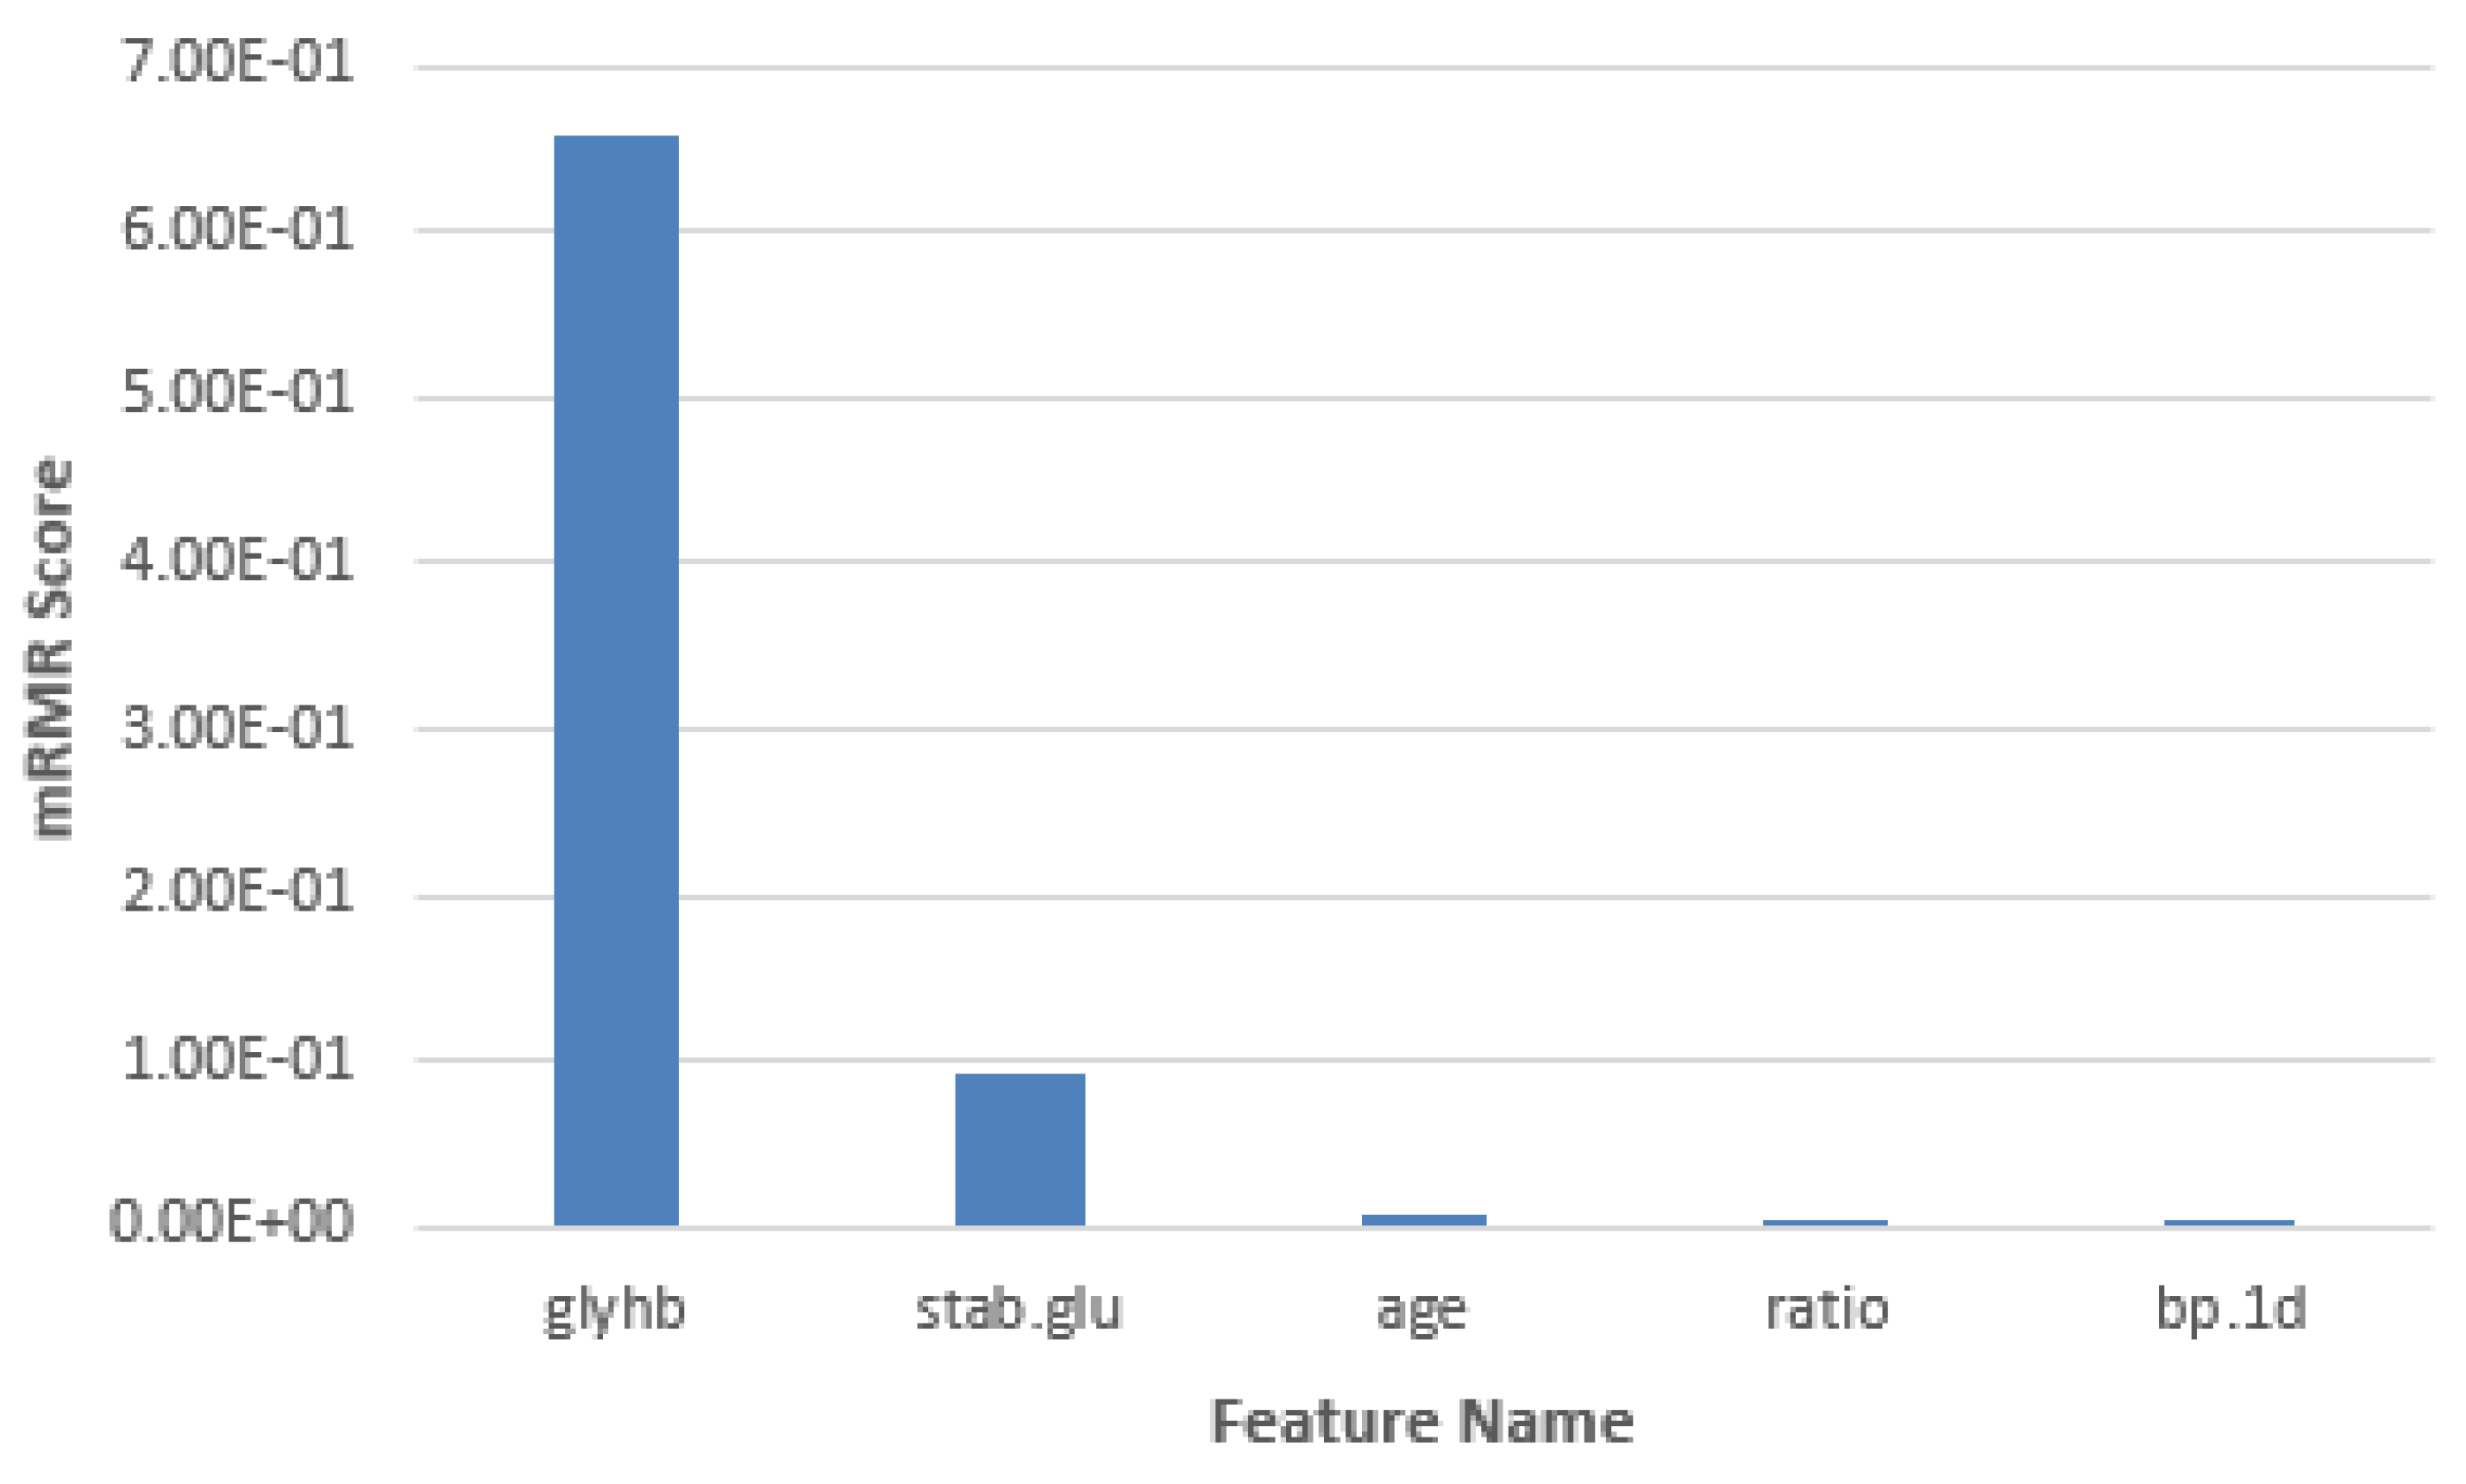
Figure 4.
Bar Chart of the RFE-RF Score Values of the Top Five Features Selected from the REF-RF Test
Figure 4.
Bar Chart of the RFE-RF Score Values of the Top Five Features Selected from the REF-RF Test
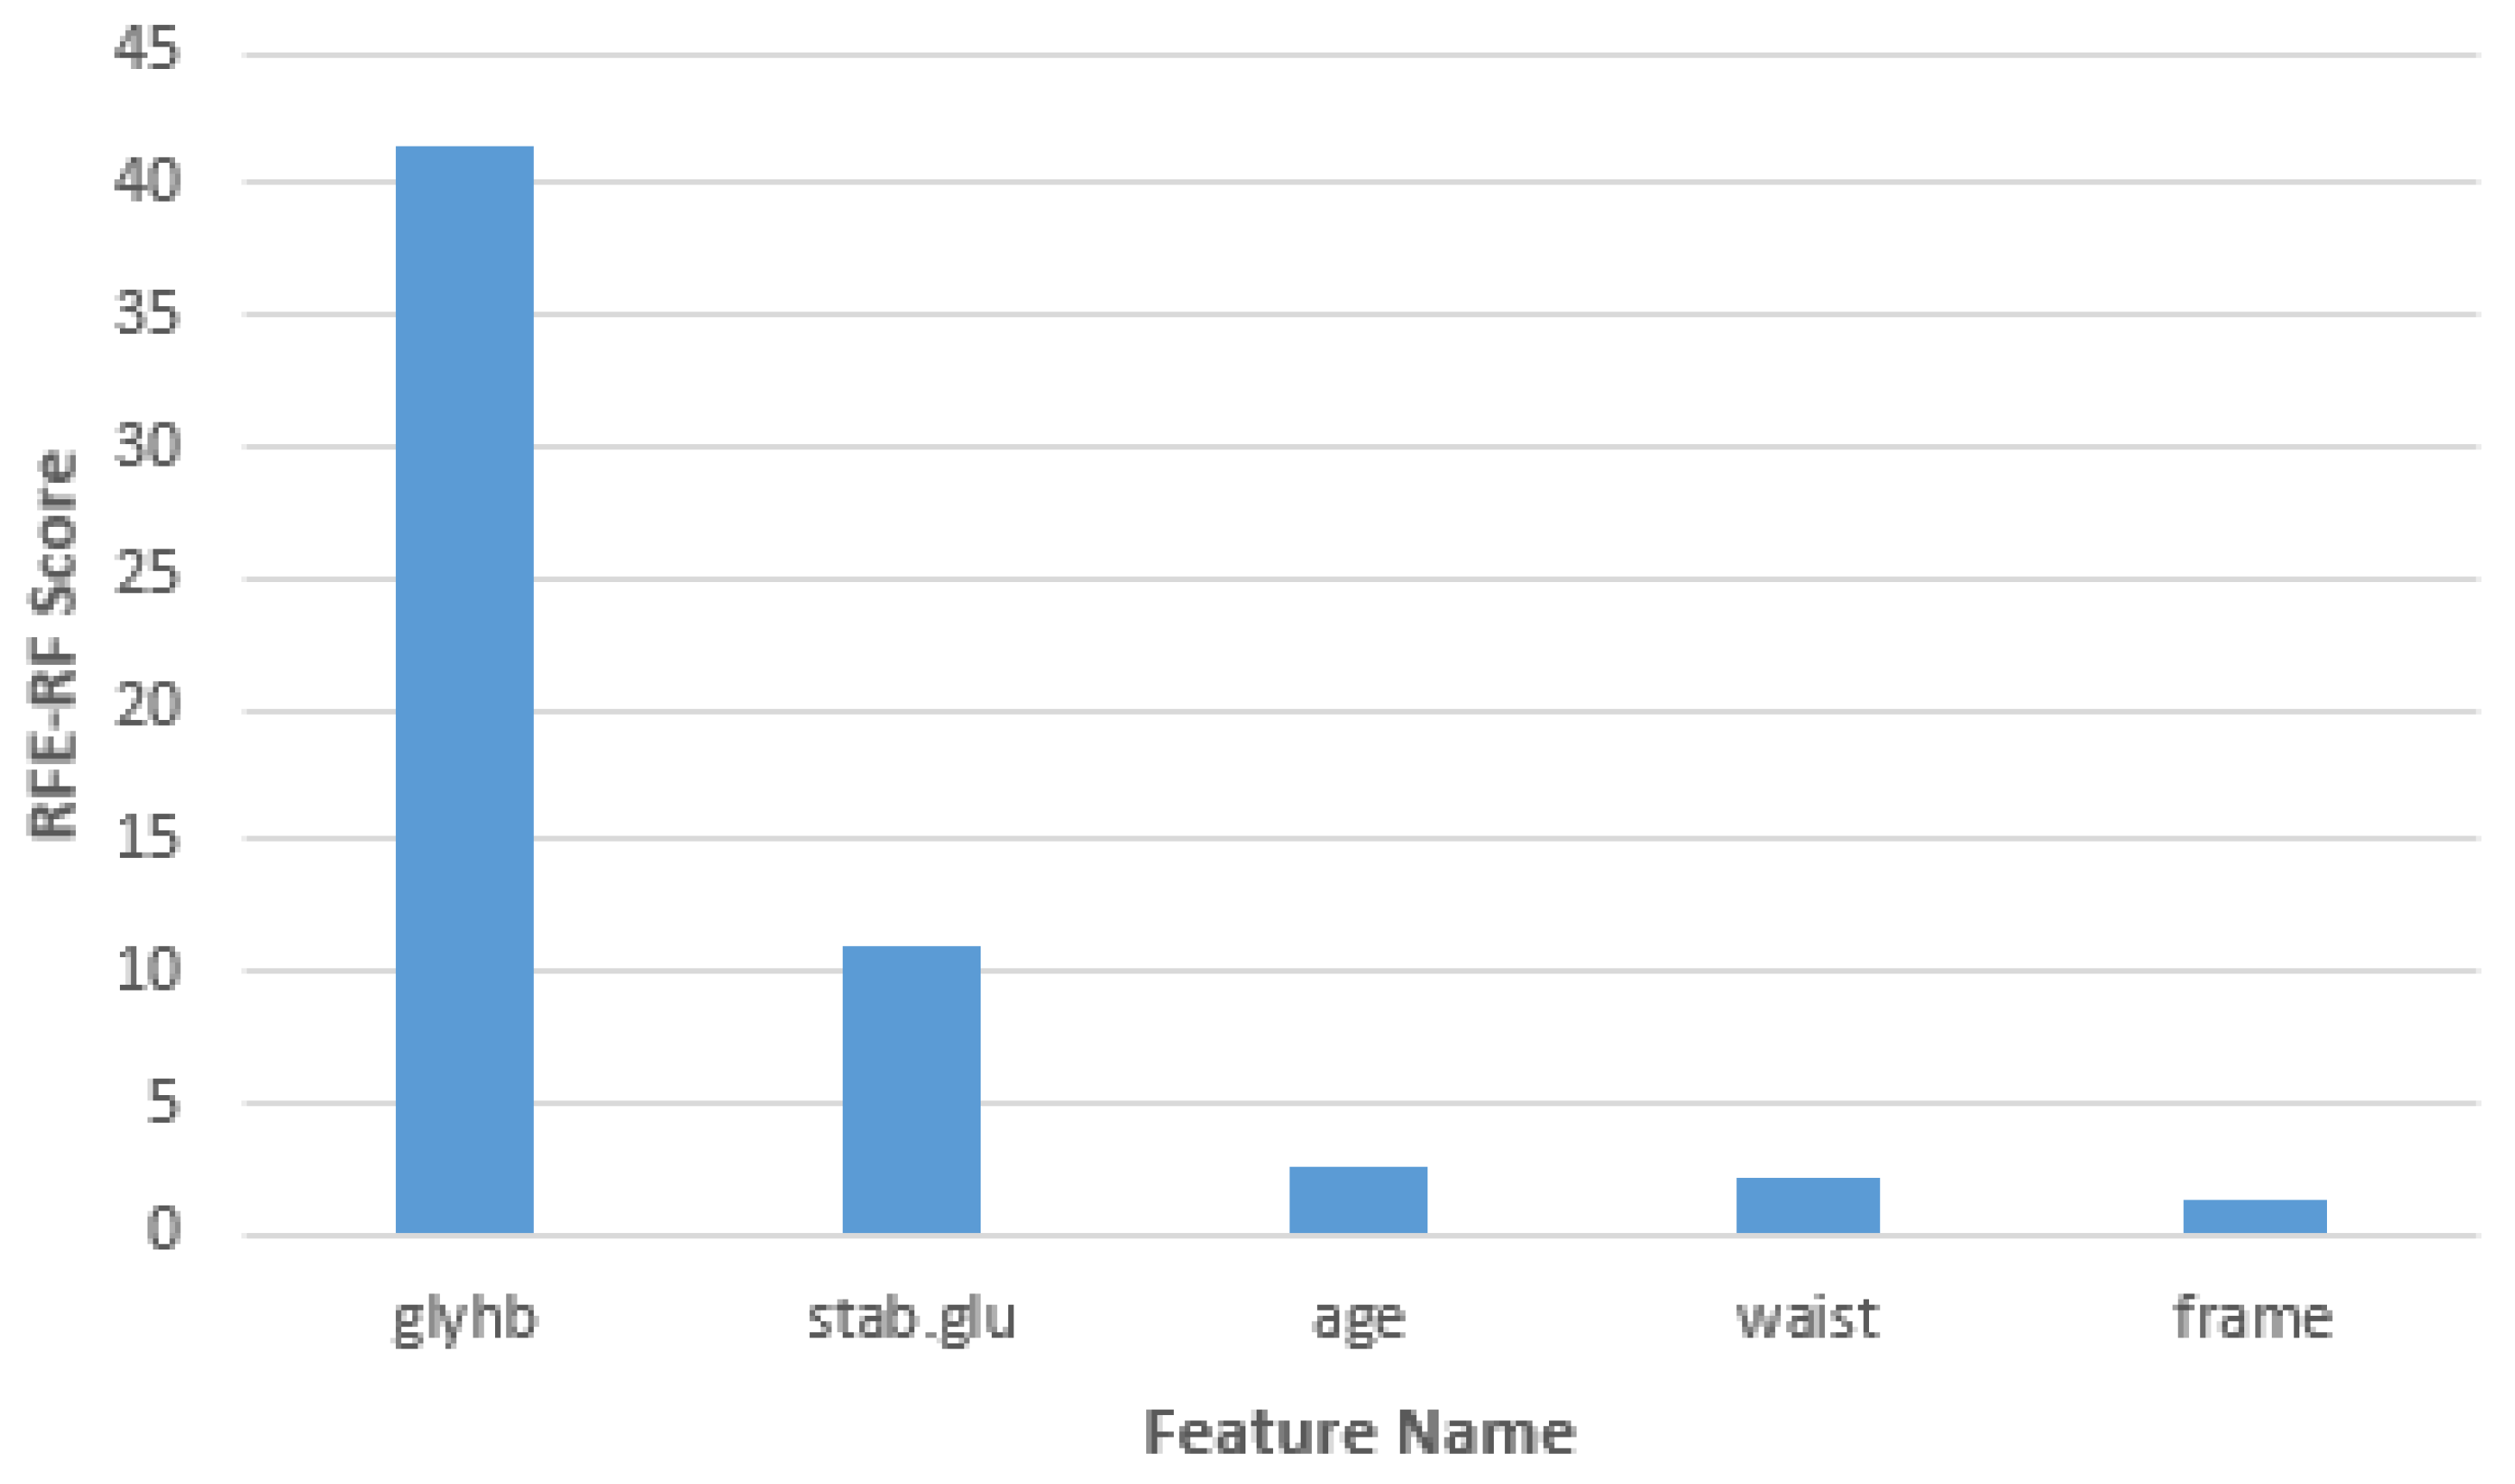
Figure 5.
Swarm plot considering all test data samples.
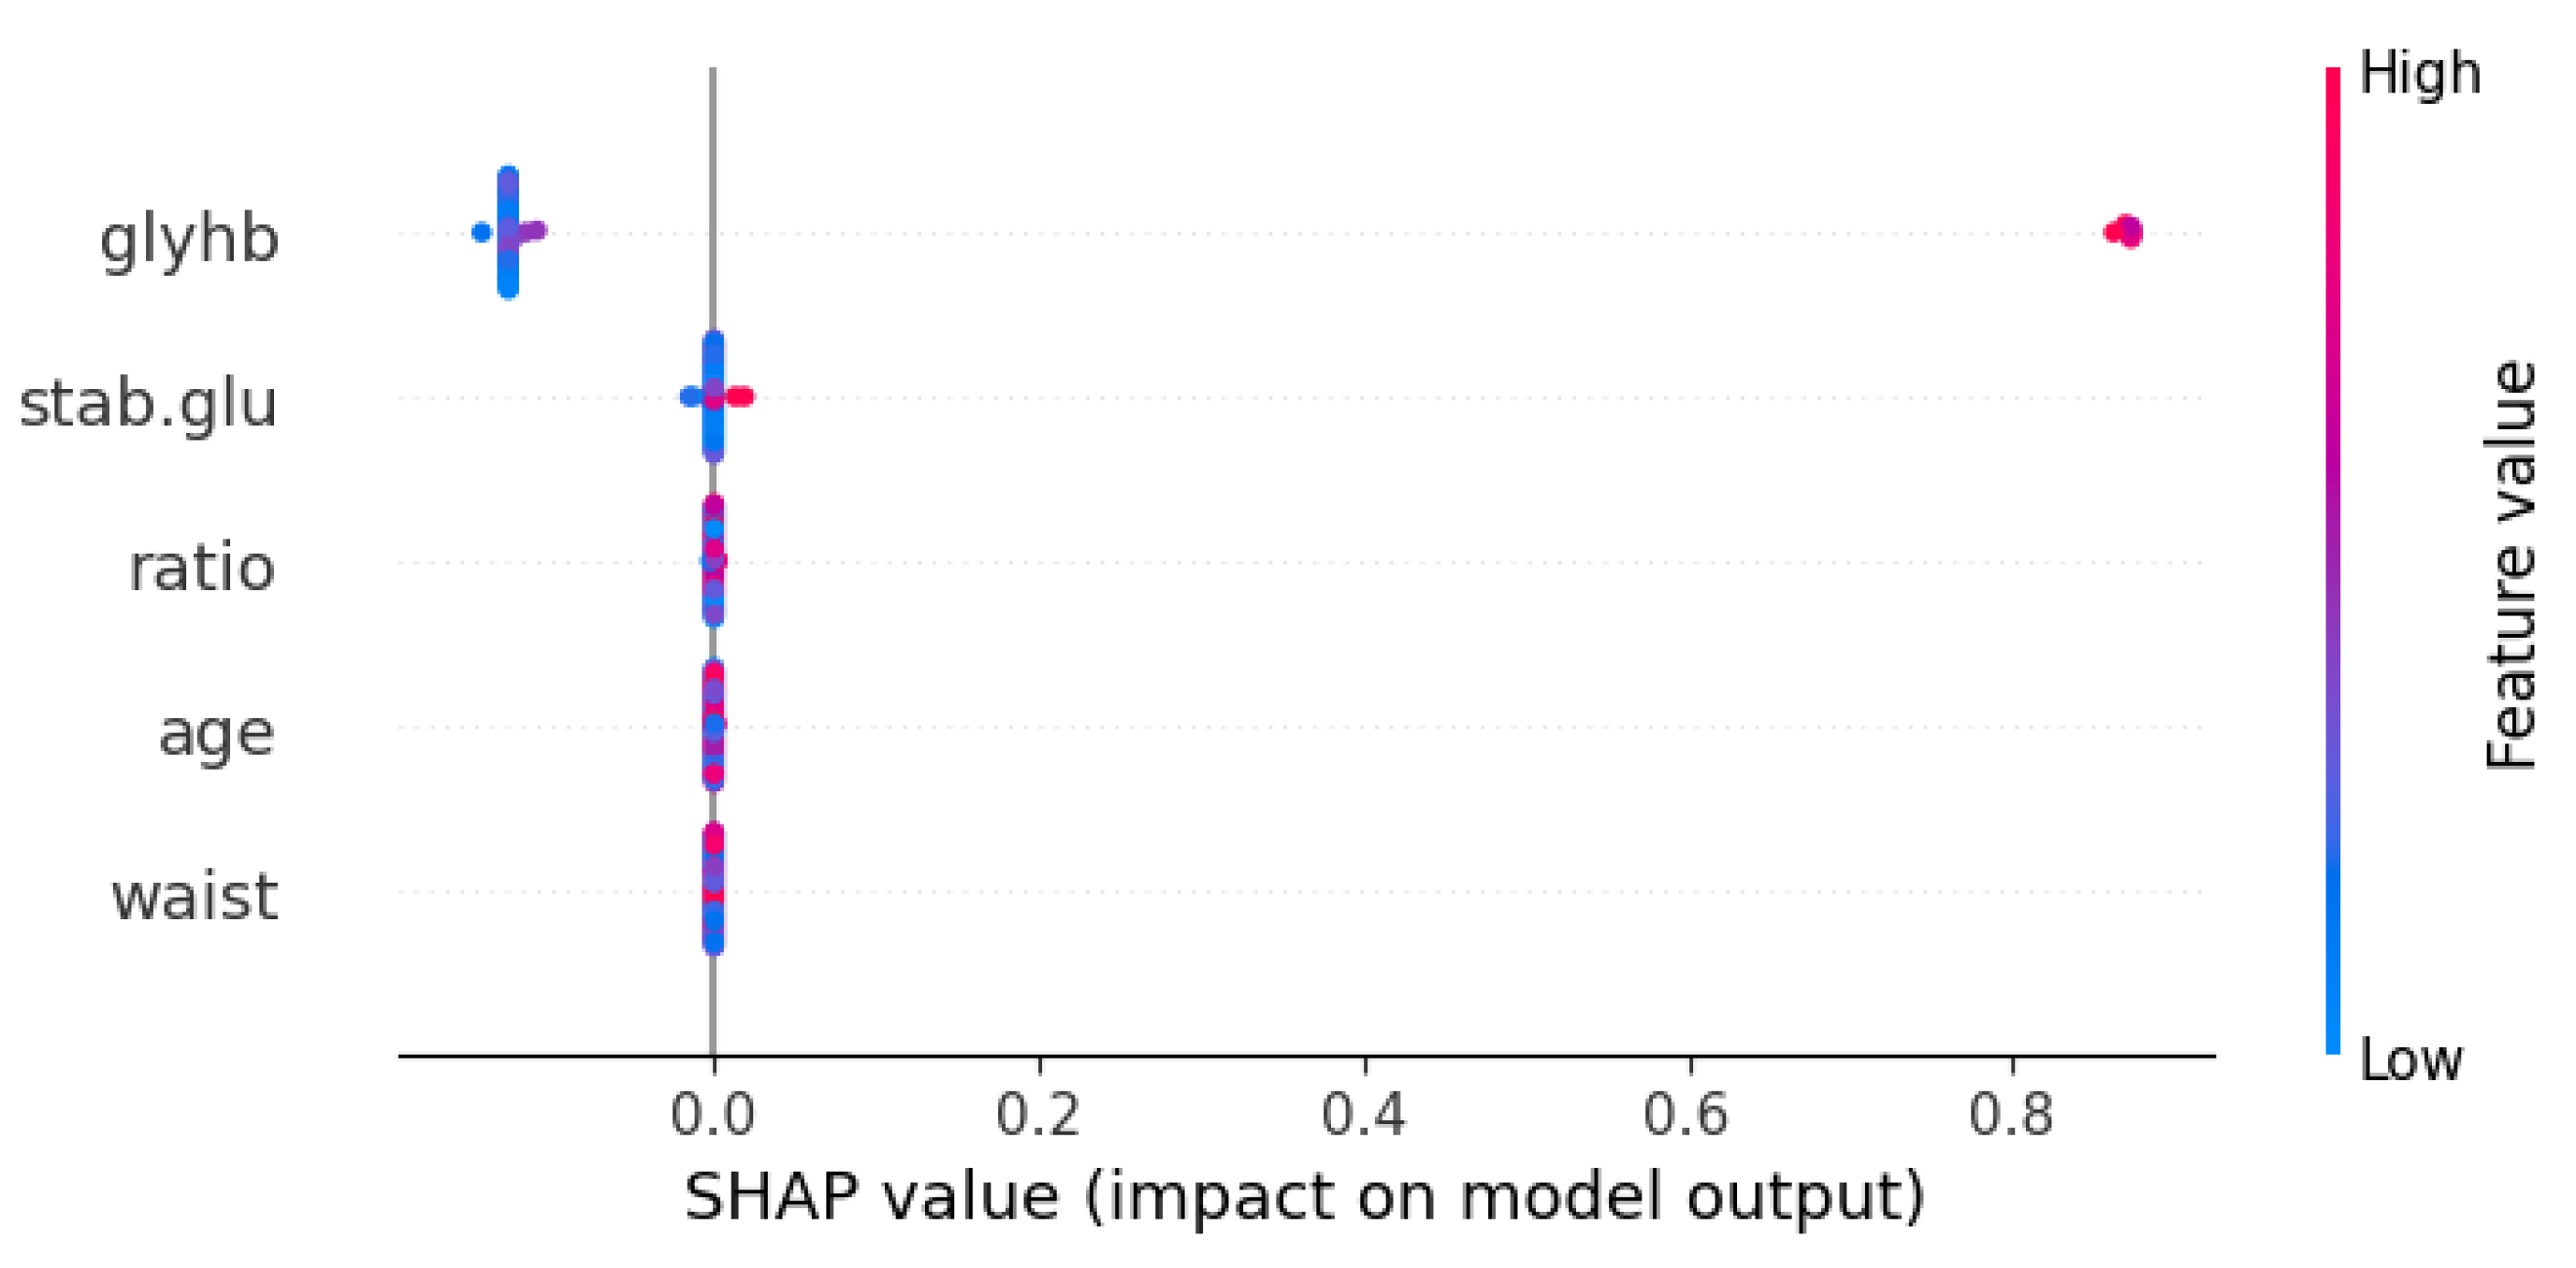
Figure 6.
Waterfall plot for a randomly selected positive sample.
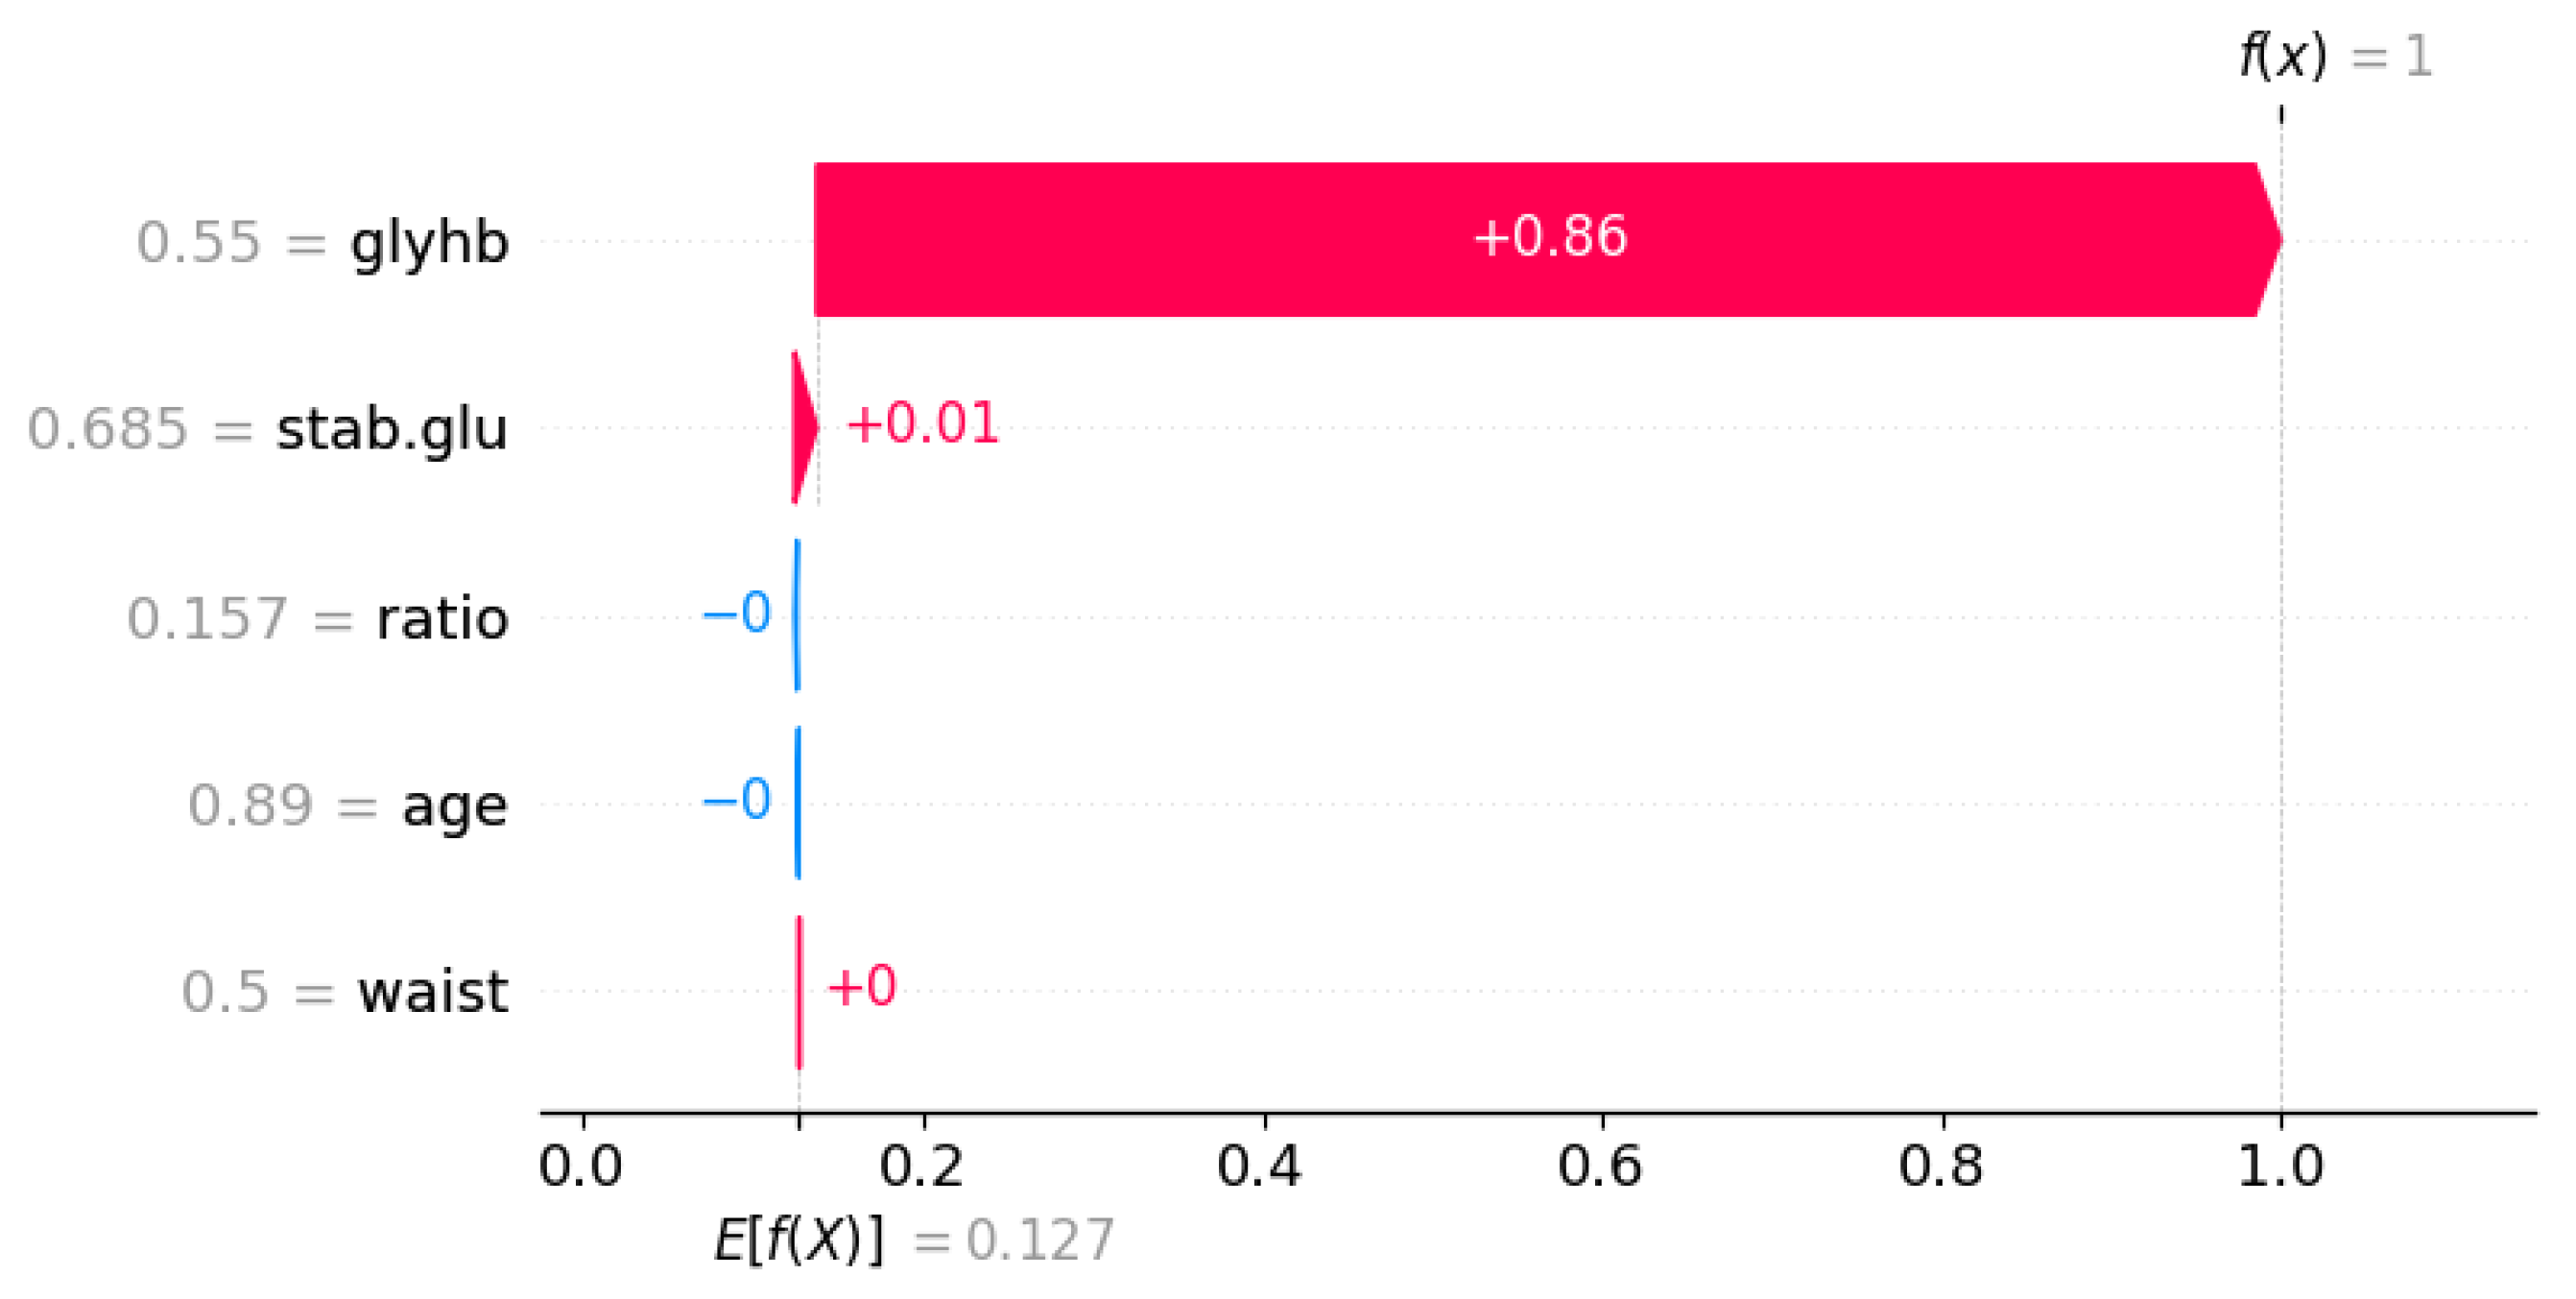
Figure 7.
Waterfall plot for a randomly selected negative sample.
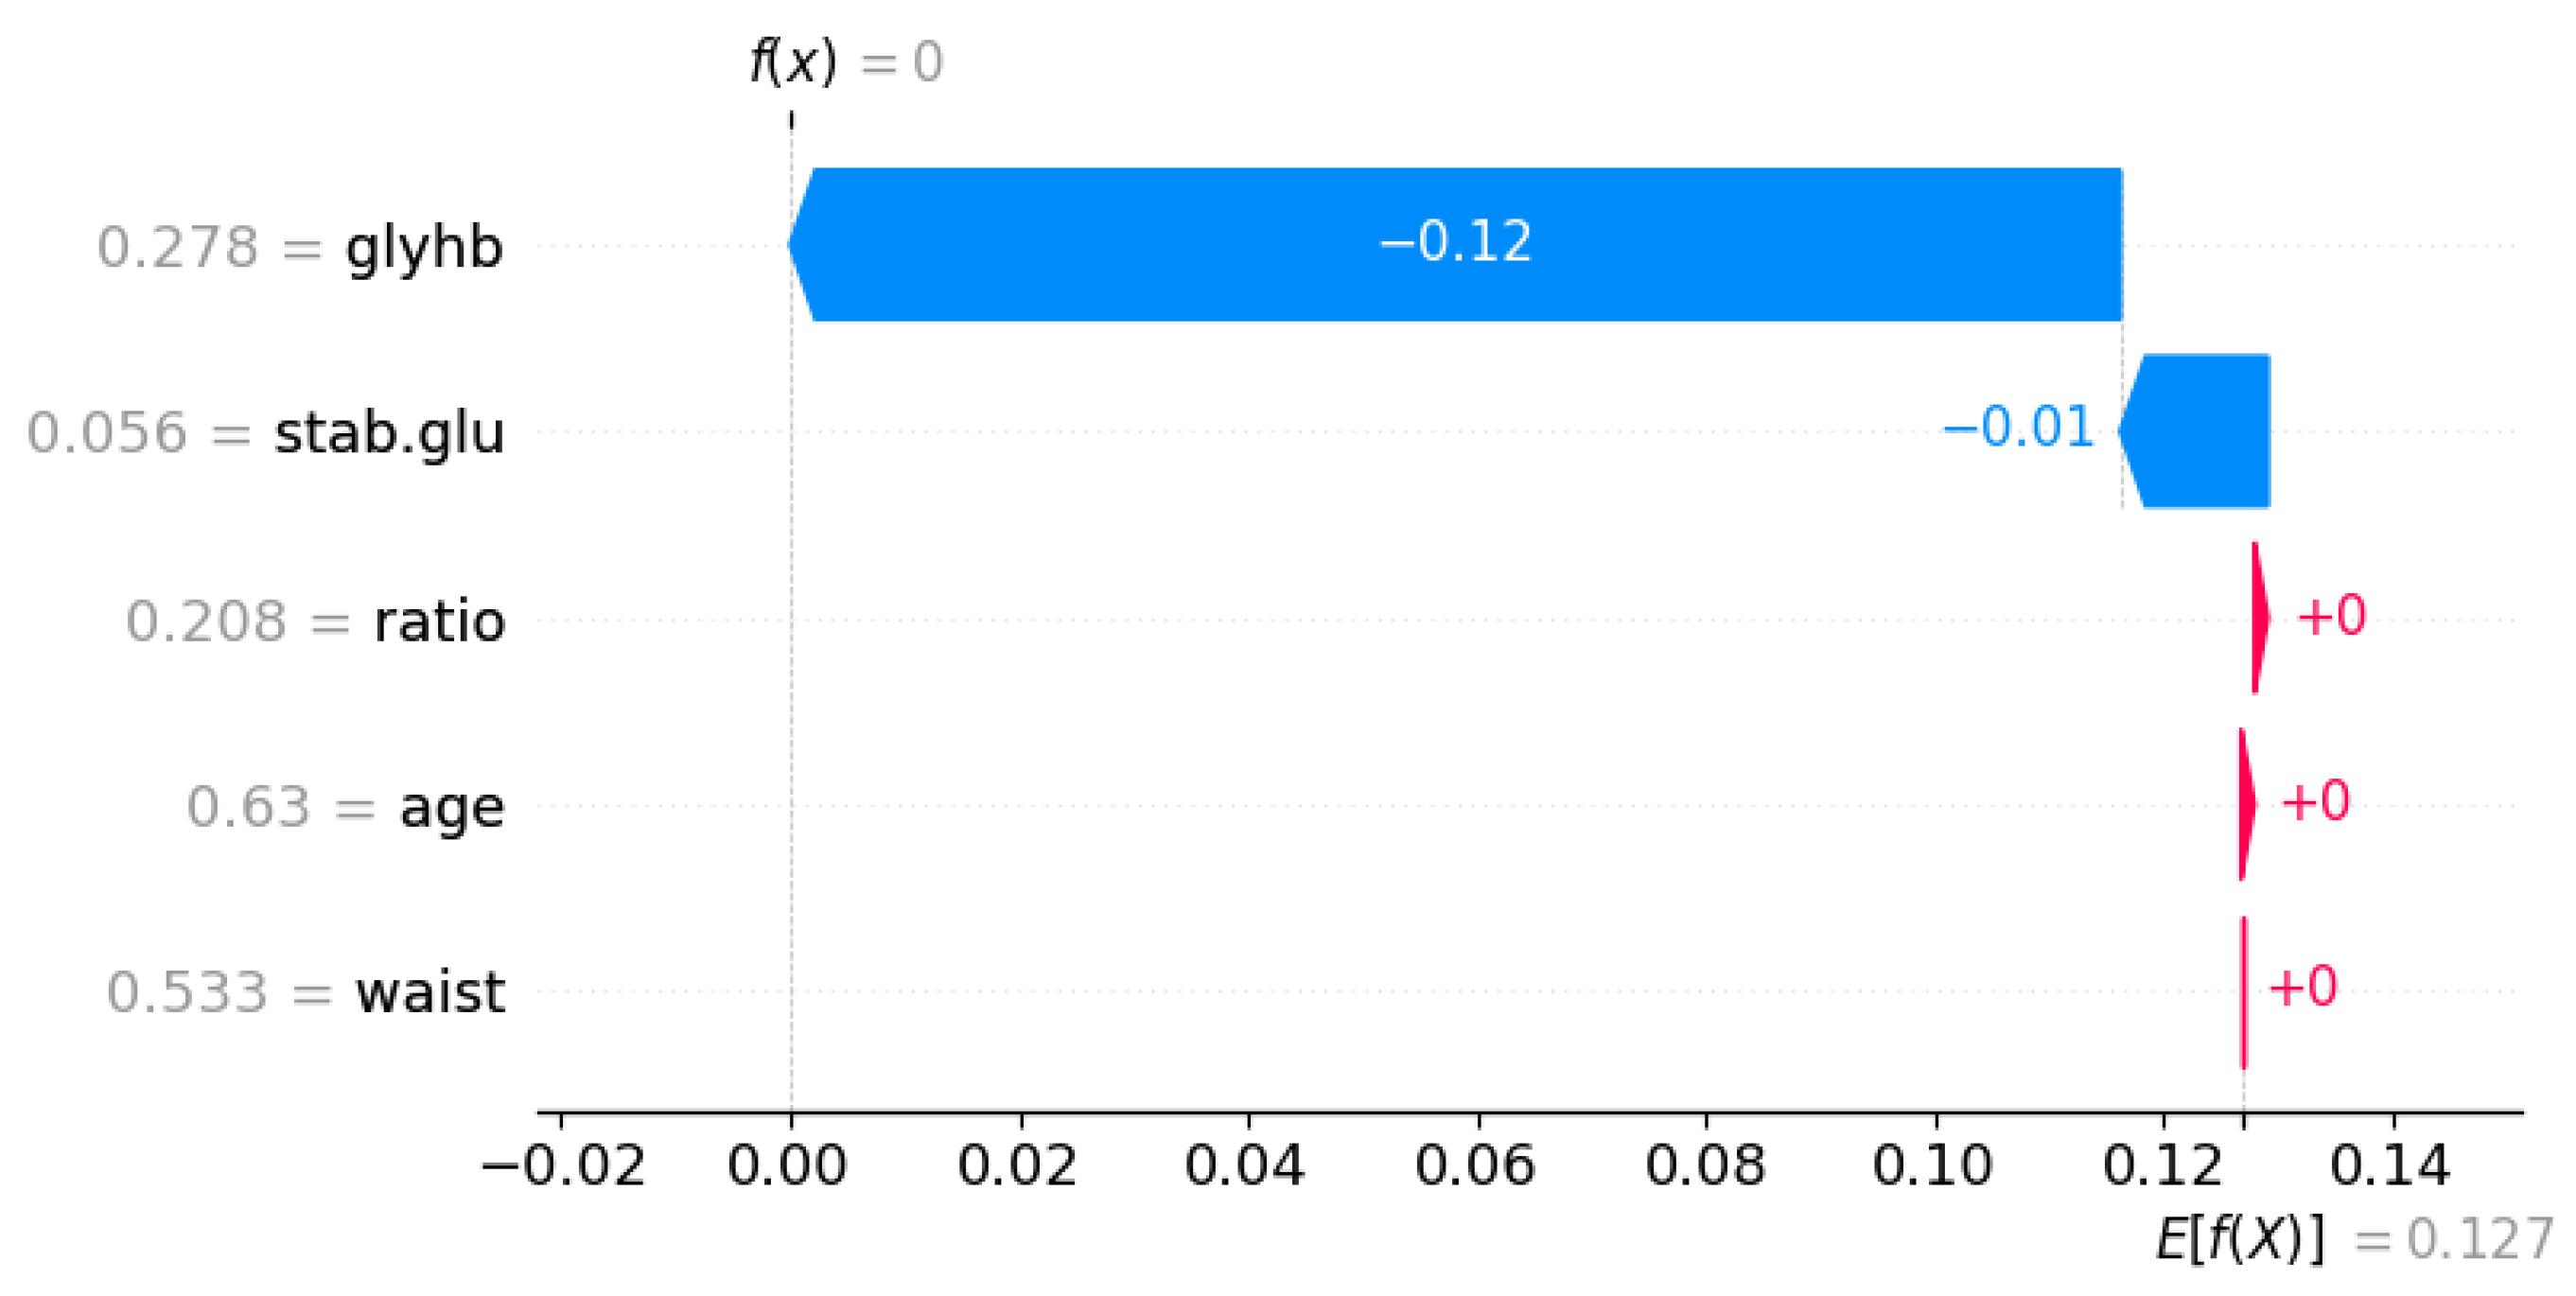

Table 1.
Dataset Details: Attribute name and statistical description of the attributes.
| Symbol | Attribute Name | Data Type | Mean | Standard Deviation | Minimum | Maximum |
|---|---|---|---|---|---|---|
| chol | Total cholesterol | Numeric | 207.604 | 44.757 | 78.000 | 443.000 |
| stab.glu | Stabilized glucose | Numeric | 107.684 | 54.139 | 48.000 | 385.000 |
| hdl | High density lipoprotein | Numeric | 50.414 | 17.463 | 12.000 | 120.000 |
| ratio | Cholesterol/hdl ratio | Numeric | 4.528 | 1.757 | 1.500 | 19.299 |
| glyhb | Glycosylated hemoglobin | Numeric | 5.606 | 2.219 | 2.680 | 16.110 |
| location | Location | Nominal | - | - | - | - |
| age | Age | Numeric | 46.898 | 16.615 | 19.000 | 92.000 |
| gender | Gender | Nominal | - | - | - | - |
| height | Height | Numeric | 66.000 | 3.920 | 52.000 | 76.000 |
| weight | Weight | Numeric | 177.957 | 40.604 | 99.000 | 325.000 |
| frame | A factor | Nominal | - | - | - | - |
| bp.1s | First systolic blood pressure | Numeric | 137.396 | 23.185 | 90.000 | 250.000 |
| bp.1d | First diastolic blood pressure | Numeric | 83.393 | 13.559 | 48.000 | 124.000 |
| waist | Waist | Numeric | 37.957 | 5.785 | 26.000 | 56.000 |
| hip | Hip | Numeric | 43.093 | 5.649 | 30.000 | 64.000 |
| time.ppn | Postprandial time when labs were drawn | Numeric | 335.589 | 309.270 | 5.000 | 1560.000 |
Table 2.
Classification Model’s Performance on the Dataset without Data Pre-Processing.
| Classifiers Name | Acc | Sen | Spe | MCC | F1 | AUC |
|---|---|---|---|---|---|---|
| KNN(K=5) | 0.88 | 0.33 | 0.98 | 0.46 | 0.47 | 0.66 |
| NB | 0.97 | 1 | 0.97 | 0.91 | 0.92 | 0.98 |
| SVM(RBF) | 0.962 | 0.7625 | 1 | 0.854 | 0.8649 | 0.8813 |
Table 3.
Classification Model’s Performance on the Pre-processed Dataset using all the Features.
| Classifiers Name | Acc | Sen | Spe | MCC | F1 | AUC |
|---|---|---|---|---|---|---|
| KNN(K=5) | 0.9 | 0.22 | 1 | 0.44 | 0.37 | 0.61 |
| NB | 0.972 | 1 | 0.97 | 0.89 | 0.9 | 0.984 |
| SVM(RBF) | 0.9782 | 0.85 | 0.9968 | 0.8983 | 0.9073 | 0.9234 |
Table 4.
Selected Feature’s Name from the Chi-Square Test and their Corresponding Chi-Square Score
| Feature Name | Chi-Square Score |
|---|---|
| Glycosylated hemoglobin | 0.942140826 |
| Stabilized glucose | 0.648116177 |
| Age | 0.276345332 |
| Cholesterol/hdl ratio | 0.253842938 |
| Waist | 0.204076578 |
Table 5.
Selected Feature’s Name from the mRMR Test and their Corresponding mRMR Score
| Feature Name | Chi-Square Score |
|---|---|
| Glycosylated hemoglobin | 0.6569431 |
| Stabilized glucose | 0.09282437 |
| Age | 0.005962992 |
| Cholesterol/hdl ratio | 0.004957832 |
| First diastolic blood pressure | 0.00004741571 |
Table 6.
Selected Feature’s Name from the RFE-RF Test and their Corresponding RFE-RF Score
| Feature Name | Chi-Square Score |
|---|---|
| Glycosylated hemoglobin | 41.55193166 |
| Stabilized glucose | 10.90469737 |
| Age | 2.606353872 |
| Waist | 2.215980719 |
| Frame | 1.327181895 |
Table 7.
Performance of the Classifiers for Each Feature Selection Technique.
| Classifiers Name | Acc | Sen | Spe | MCC | F1 | AUC |
|---|---|---|---|---|---|---|
| Chi-square Test | ||||||
| KNN(K=5) | 0.9577465 | 0.7777778 | 0.983871 | 0.8014133 | 0.8235294 | 0.8808 |
| NB | 0.971831 | 1 | 0.9677419 | 0.8898252 | 0.9 | 0.9839 |
| SVM(RBF) | 0.9950704 | 0.9777778 | 0.9975806 | 0.9776788 | 0.9803922 | 0.9876792 |
| mRMR Test | ||||||
| KNN(K=5) | 0.9577465 | 0.7777778 | 0.983871 | 0.8014133 | 0.8235294 | 0.8808 |
| NB | 0.971831 | 1 | 0.9677419 | 0.8898252 | 0.9 | 0.9839 |
| SVM(RBF) | 0.9943662 | 0.9777778 | 0.9967742 | 0.974552 | 0.9777778 | 0.987276 |
| RFE-RF Test | ||||||
| KNN(K=5) | 0.915493 | 0.444444 | 0.983871 | 0.5569598 | 0.5714286 | 0.7142 |
| NB | 0.971831 | 1 | 0.9677419 | 0.8898252 | 0.9 | 0.9839 |
| SVM(RBF) | 0.993662 | 0.9666667 | 0.9975806 | 0.9695377 | 0.9722222 | 0.9821237 |
Table 8.
Performance of the Classifiers after Oversampling.
| Classifiers Name | Acc | Sen | Spe | MCC | F1 | AUC |
|---|---|---|---|---|---|---|
| All Features | ||||||
| KNN(K=5) | 0.8591549 | 0.6666667 | 0.8870968 | 0.4763824 | 0.5454545 | 0.7769 |
| NB | 0.9577465 | 1 | 0.9516129 | 0.8448134 | 0.8571429 | 0.9758 |
| SVM(RBF) | 0.9823944 | 0.8611111 | 1 | 0.9184793 | 0.9246324 | 0.9305556 |
| Chi-square Test | ||||||
| KNN(K=5) | 0.9577465 | 1 | 0.9516129 | 0.8448134 | 0.8571429 | 0.9758 |
| NB | 0.971831 | 1 | 0.9677419 | 0.8898252 | 0.9 | 0.9839 |
| SVM(RBF) | 0.9957746 | 0.9777778 | 0.9983871 | 0.9801413 | 0.9823529 | 0.9880824 |
| mRMR Test | ||||||
| KNN(K=5) | 0.9577465 | 1 | 0.9516129 | 0.8448134 | 0.8571429 | 0.9758 |
| NB | 0.9577465 | 1 | 0.9516129 | 0.8448134 | 0.8571429 | 0.9758 |
| SVM(RBF) | 0.9953052 | 0.962963 | 1 | 0.9784322 | 0.9803922 | 0.9814815 |
| RFE-RF Test | ||||||
| KNN(K=5) | 0.9577465 | 1 | 0.9516129 | 0.8448134 | 0.8571429 | 0.9758 |
| NB | 0.943662 | 1 | 0.9354839 | 0.8047625 | 0.8181818 | 0.9677 |
| SVM(RBF) | 0.9906103 | 0.9259259 | 1 | 0.9560093 | 0.9583333 | 0.962963 |
Table 9.
Performance Comparison among the Proposed Model and Previous Studies Considering the Number of Features and Classification Accuracy
Disclaimer/Publisher’s Note: The statements, opinions and data contained in all publications are solely those of the individual author(s) and contributor(s) and not of MDPI and/or the editor(s). MDPI and/or the editor(s) disclaim responsibility for any injury to people or property resulting from any ideas, methods, instructions or products referred to in the content. |
© 2024 by the authors. Licensee MDPI, Basel, Switzerland. This article is an open access article distributed under the terms and conditions of the Creative Commons Attribution (CC BY) license (http://creativecommons.org/licenses/by/4.0/).
Copyright: This open access article is published under a Creative Commons CC BY 4.0 license, which permit the free download, distribution, and reuse, provided that the author and preprint are cited in any reuse.


