
Submitted:
10 March 2025
Posted:
12 March 2025
You are already at the latest version
Abstract
This paper explores the application of artificial intelligence (AI) in forecasting Saudi Arabia’s non-oil export trajectories, aligning with the Kingdom’s Vision 2030 objectives for economic diversification. A range of machine learning models, including LSTM, Transformers, Ensemble Stacking, Random Forest, and XGBRegressor, were employed to analyse historical export and GDP data. Among these, the Advanced Transformer model demonstrated superior predictive accuracy, achieving a MAPE of 0.73%, underscoring its ability to capture complex temporal dependencies. The non-linear Blending Ensemble, which integrates Random Forest, XGBRegressor, and AdaBoost, exhibited robust predictive performance (MAPE 1.23%), leveraging the diverse strengths of its base regressors. Additionally, the Temporal Fusion Transformer (TFT), incorporating GDP data, provided insights into macroeconomic influences, though with a higher MAPE of 5.48%, indicating the challenges associated with integrating economic indicators into forecasting models. An analysis of feature importance, utilizing SHAP and Partial Dependence Plots, revealed that recent export values (lag1, lag2, lag3, and lag10) were the most influential predictors. These findings reinforce the transformative role of AI-driven forecasting methodologies, offering data-driven insights to support decision makers and economic strategists in formulating policies that promote sustainable economic growth.
Keywords:
Artificial Intelligence
; Machine Learning
; Economic Forecasting
; Non-Oil Exports
; Time-Series Forecasting
; Transformer Models
; Ensemble Learning
; Explainable AI
; In-dustrial Data Mining
; Trade Prediction
1. Introduction
Kingdom of Saudi Arabia (KSA) is strategically diversifying its economy as part of its Vision 2030, moving away from its traditional reliance on oil revenues to foster a more robust, versatile economic landscape. This pivot necessitates innovative approaches to understanding and predicting economic dynamics, particularly in non-oil export sectors which are poised to play a pivotal role in the nation’s future economic stability and growth [1,2]. Artificial Intelligence (AI) presents a groundbreaking opportunity to enhance the accuracy and efficiency of these predictions, leveraging advanced computational techniques to analyze complex, voluminous datasets more effectively than traditional statistical methods [3,4,5].
The challenge lies in the need for precise and reliable forecasting methods to guide economic planning and policy decisions. Accurate forecasts are essential for Saudi Arabia to effectively navigate its economic diversification and achieve sustainable growth. Indeed, the integration of AI into economic forecasting represents not merely a technological upgrade but a paradigm shift in how data-driven insights can inform strategic decision-making processes.
This research focuses on employing a suite of sophisticated machine learning models, including Long Short-Term Memory networks (LSTM), Transformers, and XGBoost, to analyze and predict the future trajectories of Saudi Arabia’s non-oil exports. These models were selected for their proven capability in handling sequential data and their applicability in decoding complex patterns within time-series datasets, a common characteristic of export data [6,7,8,9,10].
During the experiments of this study, baseline of the aforementioned models and their advanced versions were used. LSTM and Deep LSTM are designed to handle time-series data by maintaining long-term memory and capturing complex patterns. Transformers use self-attention mechanisms to process data in parallel, enhancing efficiency and accuracy. The XGBRegressor and Random Forest methods utilize decision trees to boost performance and control overfitting, while the AdaBoostRegressor combines weak learners to form a strong predictive model. The Temporal Fusion Transformer (TFT) further enhances forecasting by integrating LSTM-based sequence encoding with attention mechanisms, effectively capturing both short-term and long-term temporal dependencies. Overall, we found the Transformer model, with its sophisticated configurations, achieved the highest predictive accuracy.
In addition, Explainable AI (XAI) tools were employed in this study to identify key features like recent export lags, providing interpretability and transparency in the model’s predictions. The Ensemble Blending Model, which combines Random Forest, XGBoost, and AdaBoost through an XGBoost Regressor as the meta-learner, leverages the strengths of these base models to achieve robust predictions. Namely, the XAI techniques, including SHAP Force Plots, Feature Importance analysis, and Partial Dependence Plots, revealed the critical role of recent temporal lags (lag1, lag2, and lag3) in shaping forecast outcomes. Moreover, the Ensemble Stacking model, which utilizes the Ridge Regression as the meta-learner, balances the diverse strengths of the base models to produce a harmonized and accurate predictive framework [6,7,10,11,12,13,14,15].
Furthermore, by incorporating the Gross Domestic Product (GDP) data as a contextual feature, the model generates forecasts that offer valuable macroeconomic insights. Indeed, the inclusion of GDP indicators in these models allows for a nuanced understanding of how broader economic conditions affect export performance [16]. However, our preliminary findings indicate that integrating GDP data may not always enhance predictive accuracy. For instance, the Transformer model incorporating GDP data exhibited a slight increase in the Mean Absolute Percentage Error (MAPE) values, suggesting that certain macroeconomic indicators might introduce noise rather than clarity into the predictive models. Conversely, the advanced Transformer model, which processes export data without GDP inclusion, achieved a markedly lower MAPE, illustrating its superior capability in isolating and learning the inherent patterns within the export data itself [17].
No doubt that the leveraging of AI into Saudi Arabia’s economic forecasting toolkit aligns with the broader objectives of Vision 2030 by promoting more informed, data-driven policymaking. In terms of enhancing the precision of export forecasts, this study not only supports economic diversification plans but also provides valuable insights that could influence policy decisions, investment strategies, and economic reforms aimed at ensuring KSA’s long-term economic sustainability and growth. This study not only tests the efficacy of AI models in economic forecasting but also critically evaluates the impact of integrating various economic indicators into these models. The outcomes of this research are expected to contribute significantly to the academic literature on economic forecasting and provide practical insights for policymakers and economic strategists in Saudi Arabia and beyond [18].
Overall, the contributions of this paper can be summarized as follows:
- 1)
- Develops an advanced Transformer model achieving unparalleled accuracy (MAPE: 0.73%), demonstrating AI’s potential for economic diversification.
- 2)
- Introduces Blending and Stacking models, combining diverse algorithms with Explainable AI to improve prediction robustness and transparency.
- 3)
- Explores GDP integration in the Transformer and Temporal Fusion Transformer (MAPEs 2.67% and 5.48% respectively), offering new macroeconomic insights despite noise challenges, advancing contextual forecasting.
- 4)
- Provides AI-driven trade forecasting insights, supporting economic diversification and enable real-time policymaking aligned with Vision 2030 objectives.
- 5)
- Establishes a new benchmark for AI-based economic forecasting, addressing gaps in prior studies through comprehensive model evaluation and enhancement.
The remainder of this paper is structured as follows: Section 2 presents a review of recent works in the literature related to non-oil export forecasting. Section 3 details the materials used in this study, including the dataset and methodological framework. Section 4 provides a comprehensive analysis of the experimental results. Section 5 discusses the key findings, limitations, and broader implications of the study. Finally, Section 6 concludes the paper and outlines potential directions for future research.
2. Literature Review
The integration of AI into economic forecasting offers a transformative approach to predicting market trends, particularly in Saudi Arabia’s export sector. This section explores the application of AI methodologies across various domains, including energy demand, stock market predictions, Small and Medium Enterprises (SMEs) export values, and broader export diversification efforts within Saudi Arabia. By examining recent studies, this review highlights AI’s role in enhancing the accuracy and efficiency of economic forecasts, supporting the country’s strategic diversification and planning efforts [6,19,20].
Saudi Arabia is undergoing a crucial economic transformation, shifting from an oil-dependent economy to a more diversified landscape. In this context, AI-driven forecasting serves as a powerful tool, offering valuable insights for policymakers and strategic planners. This review synthesizes key research findings on AI applications in forecasting Saudi Arabia’s export trajectories, providing an overview of methodologies and their implications across various sectors.
Al-Fattah [21] introduced GANNATS, a model combining genetic algorithms, artificial neural networks, and data mining techniques to forecast gasoline demand in Saudi Arabia. Utilizing historical gasoline demand data from 1971 to 2016 for model validation and 2017 data for testing, the model achieved 93.5% accuracy rate, demonstrating AI’s potential in energy forecasting.
Jarrah and Derbali [6] applied LSTM to predict the Saudi stock market indices, including opening, lowest, highest, and closing prices. To enhance accuracy, they incorporated Exponential Smoothing (ES) for noise reduction. The model, trained on Saudi Stock Exchange (Tadawul) data, achieved 97.49% accuracy in forecasting closing prices over a seven-day horizon.
Jitsakul and Whasphuttisit [19] explored time series forecasting for SMEs’ export values to Saudi Arabia using Moving Average, Decomposition, and Winter’s Method. Their dataset spanned 2017 to 2021 (60 months), with the first four years used for training and the final year for validation. The decomposition model demonstrated the best performance, highlighting its suitability for export trend analysis. Haque [20] assessed Saudi Arabia’s export diversification, emphasizing the importance of non-mineral exports. AI-driven analysis provided deeper insights into diversification trends, offering strategic guidance to reduce the country’s reliance on oil exports.
Yoo and Oh [7] proposed a Seasonal LSTM (SLSTM) model to forecast agricultural product sales, incorporating seasonal attributes (week, month, quarter) into historical time-series data. Their results showed that SLSTM outperformed AutoARIMA, Prophet, and standard LSTM in reducing error rates. These findings underscore SLSTM’s potential for enhancing supply chain stability through improved forecast accuracy.
In a broader international context, Dave et al. [8] developed a hybrid ARIMA-LSTM model to forecast Indonesia’s export volumes. While ARIMA efficiently handled linear data trends, LSTM captured non-linear patterns, resulting in superior accuracy. Their model achieved a MAPE of 7.38% and RMSE of 1.66 × 10¹3, offering a robust forecasting tool for economic planning and policymaking. Sirisha et al. [9] compared ARIMA, SARIMA, and LSTM models, finding that LSTM outperformed the statistical models, achieving 97.5% accuracy in financial forecasting, particularly for datasets with long-term dependencies.
Despite these sincere efforts, previous studies have not fully explored Transformer-based models for predicting trade patterns, often they were relying on traditional methods such as LSTM and Random Forest without conducting comprehensive comparative analyses. Additionally, while some research incorporates macroeconomic indicators like GDP, the integration has often been limited or insufficiently optimized, sometimes introducing noise rather than improving predictive accuracy. The role of ensemble learning approaches, such as Blending and Stacking, remains underexplored, particularly in economic forecasting, where combining multiple algorithms could enhance prediction stability and robustness.
Moreover, previous studies have largely overlooked the explainability of AI models, making it difficult for decision makers to trust and interpret AI-driven forecasts. Finally, a crucial gap in literature is the lack of integration of global economic factors—such as commodity prices, exchange rates, and trade policies—which are essential for building more reliable, context-aware forecasting models. Addressing these limitations is crucial for advancing AI-based trade forecasting and supporting data-driven economic policymaking.
3. Materials and Methods
3.1. Data Description
3.1.1. Exports Value by Harmonized System (HS)
The dataset used in this paper comprises detailed records of Saudi Arabia’s total exports from 2015 to 2022, organized on a monthly basis. Exports are classified into 21 main categories, referred to as HS Sections, and further divided into 97 subcategories, known as HS Chapters, as shown in Figure 1 and Figure 2. The valuation of exported goods follows the Free on Board (FOB) delivery terms, which account for the cost of goods along with any additional expenses incurred until they are loaded onto the shipping vessel. As a result, the recorded export values represent all costs up to the point of departure from the export office.
3.1.2. Gross Domestic Product (GDP)
Gross Domestic Product (GDP) is a key economic indicator that measures the total value of goods and services produced by a country within a specific period, regardless of whether production takes place domestically or abroad. It plays a vital role in evaluating economic activity and overall economic performance. In this paper, GDP data for Saudi Arabia is collected from 2015 to 2022 on a quarterly basis and is categorized into 17 main sectors, including manufacturing, government services, and construction, as shown in Figure 3.
3.1.3. Data Sources and Preprocessing Procedure
The export and GDP data used in this paper are obtained from official governmental sources. Export data is sourced from the King Abdullah Petroleum Studies and Research Center (KAPSARC) [18], while GDP data is provided by the Saudi Arabian Monetary Authority (SAMA) [22]. Before analysis, the data underwent a preprocessing phase that included cleaning, normalization, and aggregation to ensure accuracy and focus on total values. Given the time-series nature of the data, transformation steps were applied to facilitate trend visualization and enhance the effectiveness of the machine learning models used in this paper.
3.2. Methodology
The methodology adopted in this paper follows a quantitative research framework, analysing a comprehensive dataset of export values categorized by the Harmonized System and supplemented with GDP figures to assess economic impact. The research pipeline consists of several steps. First, data preprocessing is performed to ensure consistency, followed by aggregation based on HS sections. Next, time-series transformation techniques are applied to facilitate trend visualization.
This paper employs a range of AI models, including LSTM, Deep LSTM, Transformer, Non-Linear Blending Ensemble, XGBRegressor, Ensemble Stacking, TFT, AdaBoostRegressor, and Random Forest [23]. Additionally, a separate iteration integrates GDP data into the Transformer model to examine the influence of broader economic indicators on forecast accuracy [24]. Model performance is evaluated using multiple metrics, including Mean Squared Error (MSE), Root Mean Squared Error (RMSE), Mean Absolute Deviation (MAD), and Mean Absolute Percentage Error (MAPE).
3.2.1. Transformer
The Transformer [25] is a deep learning architecture originally introduced for Natural Language Processing (NLP) but has been widely adopted for time-series forecasting due to its ability to capture long-range dependencies. Unlike traditional recurrent models, which process data sequentially, the Transformer operates in parallel, significantly improving computational efficiency [26].
The core component of the standard Transformer is the self-attention mechanism, which enables the model to assign different levels of importance to various time steps in a sequence when making predictions. This is particularly valuable for economic forecasting, where past export trends influence future outcomes. The standard Transformer applies multiple attention heads to extract diverse patterns from the data. Each attention head typically has a head size of 64. Each head independently computes self-attention and is later combined, allowing the model to focus on different aspects of the input sequence. The self-attention mechanism follows the scaled dot-product attention formula:
where Q, K, and V represent the query, key, and value matrices, respectively, and dk is the dimension of the keys and queries. The outputs of the self-attention mechanism are then passed through fully connected layers with ReLU activation functions, introducing non-linearity to enhance feature extraction and representation learning.
Since the standard Transformer lacks recurrence and convolutional structures, it does not inherently retain temporal ordering within time-series data. However, capturing the sequential nature of time series is crucial for forecasting tasks. To address this, positional encoding techniques are applied to enrich the temporal context of the input sequence [27]. In this paper, we adopt the sinusoidal positional encodings approach, which can be defined as.
where pos is the position index and dmodel is the embedding size. The final layer generates export forecasts through fully connected dense layers, optimizing predictions using the Mean Squared Error (MSE) loss function for effective error minimization [25].
PE(pos, 2i) = sin (pos/100002i/dmodel)
PE(pos, 2i+1) = cos (pos/100002i/dmodel)
3.2.2. Advanced Transformer
Building on the standard Transformer architecture, the Advanced Transformer developed in this research maintains the original structure while introducing a key enhancement: increasing the attention head size to 128. This modification enables the model to capture more intricate dependencies within the export data, enhancing its ability to recognize complex patterns and improve forecasting accuracy.
3.2.3. Long Short-Term Memory (LSTM)
LSTM is a type of recurrent neural network (RNN) designed to learn long-term dependencies in sequential data. It is particularly suited for time-series forecasting as it retains information over extended periods while mitigating the vanishing gradient problem, which affects traditional RNNs [28].
3.2.4. Deep LSTM
Deep LSTM extends the standard LSTM architecture by incorporating multiple stacked LSTM layers. This deeper structure enables the model to capture more complex patterns within time-series data, enhancing predictive performance [29].
3.2.5. XGBRegressor
XGBRegressor is a regression implementation of the XGBoost algorithm, which leverages gradient boosting on decision trees. It is widely used for its high efficiency and strong performance in handling structured and tabular data [30].
3.2.6. Random Forest
Random Forest is an ensemble learning technique that constructs multiple decision trees during training. It improves prediction accuracy by averaging the outputs of individual trees while reducing overfitting through random feature selection.
3.2.7. AdaBoostRegressor
AdaBoostRegressor is an ensemble learning method that builds a strong predictive model by iteratively combining multiple weak learners, typically decision trees. It adjusts the weights of weak learners to focus more on difficult training instances, progressively enhancing overall model performance.
3.2.8. Temporal Fusion Transformer (TFT):
The TFT integrates LSTM-based sequence encoding with attention mechanisms to capture temporal dependencies and contextual data patterns [31]. Its architecture consists of the following components:
- LSTM Encoder: Extracts sequential information and retains long-term dependencies.
- Transformer Blocks: Utilize multi-head attention mechanisms to enhance the model’s focus on relevant temporal features, capturing long-range dependencies.
- Dense Layers: Serve as the final prediction layers, incorporating GDP data as contextual input to forecast export values.
The model was trained for 400 epochs, achieving convergence in both training and validation loss. The inclusion of GDP data allows the model to account for macroeconomic factors influencing export trends while maintaining predictive accuracy.
3.2.9. Ensemble Stacking
The stacking model [32] integrates multiple base learners, including Random Forest, XGBoost, and AdaBoost, into a unified predictive framework. Each base learner is independently trained on the dataset, and their predictions are combined as input features for the meta-learner.
- Base Models: Random Forest captures non-linear patterns, XGBoost focuses on gradient boosting optimization, and AdaBoost reduces variance and bias in predictions.
- Meta-Learner: Ridge Regression aggregates the outputs of the base models while applying regularization to prevent overfitting.
This ensemble approach leverages the strengths of diverse models to achieve balanced performance across different data characteristics.
3.2.10. Ensemble Blending
The non-linear blending model combines Random Forest, XGBoost, and AdaBoost as base regressors, using an XGBoost Regressor as the meta-learner [32].
- Base Models: Each model independently predicts export values, with Random Forest reducing variance, XGBoost optimizing through gradient boosting, and AdaBoost balancing bias.
- Meta-Learner: The XGBoost Regressor integrates the predictions of the base models to capture both linear and non-linear dependencies in the data.
To enhance interpretability, Explainable AI (XAI) techniques, such as SHAP Force Plots and Partial Dependence Plots (PDPs), were employed to analyse the blending model’s predictions [33].
3.2.11. Performance Metrics Formulas
The performance of the forecasting models is evaluated using four metrics, as follows:
- The Mean Squared Error (MSE), which is calculated as:
This metric measures the average squared difference between the actual values (Yi) and the predicted values (), where n is the number of samples. It indicates the average magnitude of error in the model’s predictions.
- The Root Mean Squared Error (RMSE), which is the square root of MSE:
This is the square root of the MSE. It provides errors in the same units as the original data, making it more interpretable.
- The Mean Absolute Deviation (MAD) reflects the average absolute differences:
This metric measures the average absolute difference between the actual values (Yi) and the predicted values (). It is less sensitive to outliers compared to MSE and RMSE. Also, and unlike MSE or RMSE, MAD is not squared, making it more interpretable in real-world units, i.e. lower MAD means better accuracy.
- The Mean Absolute Percentage Error (MAPE) expresses accuracy as a percentage using the following form,
This metric expresses the accuracy of predictions as a percentage of the actual values. It provides an intuitive measure of prediction accuracy in terms of percentage error (we can say it represents the relative prediction error).
These four metrics provide a comprehensive view of model performance, highlighting different aspects of errors in predictions. In the following, we show the performance of the aforementioned methods across these four metrics.
4. Experimental Results and Analysis
This paper assesses the performance of various AI models in forecasting Saudi Arabia’s non-oil export volumes. Table 1 presents the performance metrics for each model, providing a comprehensive quantitative analysis of their forecasting capabilities. The following subsections compare the models based on their accuracy and predictive effectiveness.
4.1. Advanced Transformer
The Advanced Transformer model demonstrated the best performance among all models. Since MAPE represents the relative prediction error, a lower value indicates higher accuracy. The Advanced Transformer achieved a MAPE of 0.73%, the lowest among all models, as shown in Figure 4. It also attained the lowest MAD value (452), confirming its stability, reliability, and precision in forecasting non-oil exports. This reinforces its best-in-class performance. Moreover, with an MSE of 246,510 and an RMSE of 496, it effectively captures complex non-linear patterns in export data while remaining unaffected by GDP data [22].
This robustness makes the Advanced Transformer particularly suitable for forecasting scenarios with intricate data relationships. It improves upon the standard Transformer by incorporating a larger head size (128), meaning that each attention head processes 128-dimensional feature representations. This allows the model to capture more complex dependencies within the data, leading to enhanced forecasting accuracy. Additionally, more advanced configurations further optimize its performance.
4.2. Standard Transformer
The standard Transformer model also exhibited strong performance, achieving a MAPE of 0.76%, and MAD of (482), as shown in Figure 5. Although its MSE and RMSE values were slightly higher than those of the Advanced Transformer, it remains highly effective for economic forecasting tasks. Compared to the Advanced Transformer, this model uses a smaller head size (64) and a simpler configuration, which slightly reduces its predictive accuracy but maintains computational efficiency. Briefly, the larger attention heads allow the model to capture deeper patterns and dependencies in export trends.
4.3. Ensemble Blending
The nonlinear Ensemble Blending model achieved a MAPE of 1.23% and MAD of (931), demonstrating strong predictive performance in forecasting non-oil exports. By integrating Random Forest, XGBoost, and AdaBoost, the Ensemble Blending model effectively captures both linear and non-linear dependencies within the data. The blending approach combines predictions from multiple base models using an XGBoost Regressor as the meta-learner, which can be represented as follows,
where:
- is the final prediction of the blending model.
- are the prediction from rom Random Forest, XGBoost, and AdaBoost, respectively.
- Meta(.) represents the XGBoost Regressor, which combines the predictions of base models.
4.3.1. Analysis of Ensemble Blending Performance
Explainable AI techniques, such as SHAP force plots, were employed to interpret the ensemble blending model’s decision-making process, as shown in Figure 6. These plots revealed that recent export lags (lag1, lag2, lag3) were the most influential features, contributing significantly to the model’s predictive power. In other words, the most recent historical export values play a crucial role in predicting future exports. The SHAP analysis further highlighted that the XGBoost model played a dominant role in the ensemble predictions, while the Random Forest and AdaBoost models provided complementary insights, enhancing model robustness. This confirms that the ensemble blending model effectively captures short-term export trends, making it highly responsive to recent economic fluctuations.
To further analyze feature importance, a feature importance plot was generated, as shown in Figure 7, confirming the significant role of lag1, lag2, and lag3, while features such as lag6 and lag9 exhibited minimal impact. This suggests that older historical data contributes less to the prediction, possibly due to shifting market conditions. Overall, the dominance of recent lags confirms that the Ensemble Blending model prioritizes short-term trends over long-term dependencies, which aligns well with the dynamic nature of trade and economic forecasting.
Toward further analyse model performance, Partial Dependence Plots (PDPs) were applied to the base models (Random Forest, XGBoost, and AdaBoost) to examine how key features influence export value predictions. Figure 8, Figure 9 and Figure 10 illustrate these dependencies for AdaBoost, Random Forest, and XGBoost, respectively. The PDP illustrations reveal that lag1 and lag2 have the strongest positive impact on export predictions across all models, which asserts the same conclusion that the most recent export values play a crucial role in shaping future predictions. Conversely, features such as lag6 and lag9 exhibit minimal influence, suggesting that older historical data contributes less to the forecasting process. This trend is consistent across the three models, reinforcing the notion that short-term economic fluctuations drive trade forecasts more than long-term patterns.
4.3.2. Forecasting Performance of the Ensemble Blending Model
The forecasting capabilities of the Ensemble Blending model were evaluated by comparing its predicted export values with actual data from 2015 to 2022. As shown in Figure 11, we can get the following findings,
- The model effectively captured key export trends, particularly during the post-2020 recovery phase, highlighting its ability to track complex economic fluctuations with high accuracy.
- The alignment between predicted and actual export values indicates that the Blending model successfully models temporal dependencies and adapts to market shifts.
- This performance further validates the model’s ability to balance short-term accuracy and long-term stability, making it a robust choice for economic forecasting.
4.4. Temporal Fusion Transformer (TFT) with GDP
The TFT integrates GDP data to incorporate macroeconomic factors into non-oil export forecasting, where it achieved a MAPE of 5.48%. However, it is higher than the Advanced Transformer and Blending models, it demonstrates the potential of contextual data in improving predictions. TFT combines LSTM-based sequence encoding with attention mechanisms to capture temporal dependencies,
where:
- is the final prediction of the TFT model.
- LSTM (X) represents the LSTM encoder output for the input sequence X.
- Transformer (·) applies the attention mechanism for long-range dependencies.
- Dense (·) represents fully connected layers for final predictions.
The TFT architecture effectively captures both short- and long-term dependencies by combining sequence encoding with attention mechanisms. The inclusion of GDP data provided additional insights into the broader economic context influencing exports. However, the slightly higher error rate indicates that GDP data may introduce noise or require further feature engineering for optimal integration.
Figure 12 illustrates the TFT model’s forecast for 2021–2022 compared to actual export values. Additionally, training and validation loss plots in Figure 13 demonstrate stable convergence over 400 epochs, highlighting the model’s reliability. Given its ability to handle multi-feature inputs, TFT offers valuable insights for decision makers interested in the interplay between macroeconomic indicators and export performance.
4.5. Ensemble Stacking
The Stacking model aggregates predictions from Random Forest, XGBoost, and AdaBoost, using Ridge Regression as the meta-learner. While it achieved a MAPE of 16.45%, which is higher than the Blending model, the Stacking approach demonstrated the ability to balance linear and non-linear dependencies, according to the following form,
where:
- is the final prediction of the Stacking approach.
- are the prediction from rom Random Forest, XGBoost, and AdaBoost, respectively.
- Ridge(.) represents the Ridge Regressor as the meta-learner, applying regularization to prevent overfitting.
Figure 14 compares the Stacking approach’s forecast with the actual export values. Ridge Regression as the meta-learner helps ensure generalizability, but the higher error rates indicate that further tuning or additional meta-features may be required to improve performance, particularly in modelling highly non-linear export data.
4.6. LSTM and Deep LSTM
The LSTM model demonstrated strong performance, achieving a MAPE of 1.44%, MSE of 1,180,754, and RMSE of 1,086, highlighting its effectiveness in capturing temporal dependencies in export data, as shown in Figure 15. However, the Deep LSTM model performed significantly worse, with a MAPE of 4.52%, MSE of 31,972,707, and RMSE of 5,654, as shown in Figure 16. This outcome is unexpected, as deeper architecture is generally assumed to enhance learning capacity. The results indicate that overfitting, increased model complexity, or suboptimal hyperparameters may have negatively impacted the Deep LSTM’s ability to generalize effectively [10].
The LSTM model utilizes gate functions to regulate the flow of information, ensuring the retention of relevant features while mitigating the vanishing gradient problem. Deep LSTM extends this architecture by stacking multiple layers, where the output of each layer serves as the input for the next, allowing the model to capture more complex representations. However, increased depth does not always lead to improved performance, as excessive complexity can result in overfitting, gradient instability, or difficulties in optimizing the model, ultimately reducing its generalization capability [34].
4.7. Random Forest and XGBoost
Traditional machine learning models, Random Forest and XGBoost, exhibited significantly higher error rates, with MAPEs of 15.39% and 13.36%, respectively, as shown in Figure 17 and Figure 18. The high MSE and RMSE values indicate challenges in capturing the non-linear dependencies within export data, suggesting that these models may struggle with the complexity of economic forecasting tasks [7].
The Random Forest combines predictions from multiple decision trees, as follows,
where is the prediction from the t-th tree, and T is the total number of trees.
The XGBoost follows a boosting approach, combining multiple weak learners into a strong model using the following form,
where is the updated prediction after adding the new model at iteration t, represents the model from the previous iteration, is the learning rate, and is the model (weak learner) learned at iteration t.
4.8. AdaBoost Regressor
The AdaBoost Regressor, which is not typically optimized for time-series forecasting, achieved an MAPE of 14.10%, MSE of 428,840,065, RMSE of 20,708, and MAD of 13,515, as shown in Figure 19. These results indicate that AdaBoost can contribute to regression tasks but is generally less effective than specialized time-series models like LSTM or Transformer.
AdaBoost builds a strong learner by iteratively improving weak learners:
where represents the weights of each regressor, and is the prediction from each learner. The model iteratively adjusts these weights to focus more on instances that were previously mispredicted, improving its learning over time.
4.9. Transformers with GDP
Incorporating GDP data into the Transformer model slightly reduced its forecasting accuracy, leading to a MAPE of 2.67% and increased MSE and RMSE values of 5,474,217 and 2,339, respectively, as shown in Figure 20. This indicates that adding GDP data may introduce noise or interfere with the model’s ability to capture more relevant predictive patterns. The results indicate that while GDP provides valuable macroeconomic context, its integration requires careful feature engineering to avoid diminishing model accuracy [35].
5. Discussion
5.1. AI’s Role in Economic Forecasting
This research shown in this paper highlights the transformative role of AI in forecasting Saudi Arabia’s non-oil export volumes, supporting the country’s Vision 2030 objectives. By leveraging advanced AI models such as LSTM, Transformers, XGBRegressor, and ensemble learning techniques, this research demonstrates how historical export data can be effectively utilized to improve predictive accuracy.
Among all models, the Advanced Transformer (without GDP) achieved the highest accuracy, with a MAPE of 0.73%, outperforming the standard Transformer, which attained a MAPE of 0.76%. These results indicate that Transformer-based architectures, particularly when optimized, are highly effective for economic forecasting tasks. Furthermore, the Advanced Transformer, built upon the standard Transformer, enhances its ability to capture intricate relationships in time-series data by increasing the attention head size to 128. This modification significantly improves forecasting accuracy compared to the standard Transformer, reinforcing its effectiveness as a powerful tool for economic and trade forecasting.
The paper also demonstrates the effectiveness of ensemble learning techniques, particularly the Ensemble Blending model, which integrates Random Forest, XGBRegressor, and AdaBoost with XGBoost as the meta-learner, achieving a MAPE of 1.23%. This highlights how blending different learning algorithms enhances forecasting robustness by capturing both linear and non-linear dependencies. Similarly, the Ensemble Stacking model, which employs Ridge Regression as a meta-learner, aggregates predictions from Random Forest, XGBoost, and AdaBoost, balancing different model strengths to adapt to diverse data distributions.
The incorporation of Explainable AI (XAI) techniques, such as SHAP Force Plots, Partial Dependence Plots, and Feature Importance visualizations, was pivotal in understanding model decision-making. These techniques revealed that recent export lags (lag1, lag2, lag3) were the most influential predictors, further validating the models’ ability to leverage short-term historical patterns for accurate forecasting. The XAI analysis also provided insights into how different base and meta-models interact, enhancing transparency and interpretability in AI-driven forecasting.
5.2. Impact of GDP Data on Forecasting Accuracy
An important finding of this research is the variable impact of incorporating GDP data into forecasting models. While GDP is a key macroeconomic indicator, its integration into the Temporal Fusion Transformer (TFT) led to a higher MAPE of 5.48%, suggesting that its inclusion introduced noise rather than improving prediction accuracy. Similarly, using the Transformer model on export data alone resulted in a MAPE of 0.76%, but adding GDP raised the MAPE to 2.67%. This could be attributed to the fact that GDP, as an aggregate economic measure, may not exhibit a direct short-term relationship with monthly export fluctuations.
Conversely, the Advanced Transformer without GDP outperformed all other models, underscoring the challenges of integrating broad economic indicators into deep learning architectures. These results emphasize the need for careful feature selection and preprocessing when incorporating macroeconomic variables. Future research could explore alternative feature engineering techniques, such as dimensionality reduction, attention-based filtering, or lagged transformations of GDP, to better harness its predictive potential.
5.3. Integration with Existing Literature
This paper contributes to the growing body of research on AI-driven economic forecasting and aligns with previous works on AI applications in macroeconomic modeling. For example, Al-Fattah’s work [21] on gasoline demand forecasting and Haque’s study [20] on export diversification illustrate how AI can enhance economic predictions across different sectors. By integrating findings from these efforts, this research further strengthens the case for AI as a viable tool for economic planning beyond non-oil exports.
5.4. Methodological Strengths and Weaknesses
The research shown in this paper adopts a comprehensive methodological approach, leveraging a diverse range of AI techniques and a robust dataset to evaluate forecasting performance. The use of ensemble learning, deep learning architectures, and interpretability tools ensures a well-rounded analysis of model effectiveness. However, a key limitation is that GDP data was only applied to the Advanced Transformer and Ensemble models, leaving room for further exploration with other AI models such as LSTM, XGBoost, or additional hybrid approaches. The step-by-step methodology adopted in this study ensures that the impact of GDP integration is systematically evaluated before extending it to other models. This controlled approach allows for more targeted improvements in feature engineering and model adaptation, ensuring that future research builds upon these findings with greater precision.
6. Conclusions
This paper underscores the potential of artificial intelligence in enhancing non-oil export forecasting for Saudi Arabia, contributing to data-driven economic decision-making. The findings demonstrate that the Advanced Transformer model, when applied without GDP data, achieved the highest predictive accuracy, indicating its efficacy in capturing complex trade patterns. In contrast, the inclusion of GDP data marginally reduced forecasting performance, highlighting the challenges associated with integrating macroeconomic indicators into AI models. The paper further validates the effectiveness of ensemble learning techniques, particularly Non-Linear Blending, in leveraging the strengths of multiple models to enhance predictive robustness. Additionally, the application of Explainable AI techniques, including SHAP analysis, provided critical insights into model decision-making. The findings of this paper reinforce the value of interpretable AI models in economic forecasting, offering transparency and trustworthiness in data-driven policymaking. Future research may focus on refining feature selection and data integration frameworks, particularly in the incorporation of macroeconomic indicators, to mitigate potential noise and improve model generalizability. Additionally, expanding the application of ensemble learning and XAI techniques could further enhance model performance, ensuring both accuracy and interpretability. Advancing hybrid AI architectures and optimizing preprocessing methodologies will be critical to developing more adaptive and reliable economic forecasting models.
Acknowledgments
This work was supported by the Deanship of Scientific Research, Vice Presidency for Graduate Studies and Scientific Research, King Faisal University, Saudi Arabia [Grant No. KFU250943].
References
- Hasanov, F.J.; Javid, M.; Joutz, F.L. Saudi non-oil exports before and after covid-19: Historical impacts of determinants and scenario analysis. Sustainability 2022, 14, 2379. [Google Scholar] [CrossRef]
- Available online: https://www.vision2030.gov.sa/media/rc0b5oy1/saudivision203.pdf.
- Ahmed, A.; Xi, R.; Hou, M.; Shah, S.A.; Hameed, S. Harnessing big data analytics for healthcare: A comprehensive review of frameworks, implications, applications, and impacts. IEEE Access 2023. [Google Scholar]
- Alreshidi, I.; Moulitsas, I.; Jenkins, K.W. Advancing aviation safety through machine learning and psychophysiological data: A systematic review. IEEE Access 2024. [Google Scholar] [CrossRef]
- Liu, Z.; Zhang, A. Sampling for big data profiling: A survey. IEEE Access 2020, 8, 72713–72726. [Google Scholar]
- Jarrah, M.; Derbali, M. Predicting saudi stock market index by using multivariate time series based on deep learning. Applied Sciences 2023, 13, 8356. [Google Scholar]
- Yoo, T.-W.; Oh, I.-S. Time series forecasting of agricultural products’ sales volumes based on seasonal long short-term memory. Applied sciences 2020, 10, 8169. [Google Scholar]
- Dave, E.; Leonardo, A.; Jeanice, M.; Hanafiah, N. Forecasting Indonesia exports using a hybrid model arima-lstm. Procedia Computer Science 2021, 179, 480–487. [Google Scholar]
- Sirisha, U.M.; Belavagi, M.C.; Attigeri, G. Profit prediction using arima, sarima and lstm models in time series forecasting: A comparison. IEEE Access 2022, 10, 124715–124727. [Google Scholar]
- Reza, S.; Ferreira, M.C.; Machado, J.J.; Tavares, J.M.R. A multi head attention-based transformer model for traffic flow forecasting with a comparative analysis to recurrent neural networks. Expert Systems with Applications 2022, 202, 117275. [Google Scholar]
- Islam, M.; Shuvo, S.S.; Shohan, J.A.; Faruque, O. Forecasting of pv plant output using interpretable temporal fusion transformer model. In Proceedings of the 2023 North American Power Symposium (NAPS). 2023; pp. 01–06.
- Hasan, M.; Abedin, M.Z.; Hajek, P.; Coussement, K.; Sultan, M.N.; Lucey, B. A blending ensemble learning model for crude oil price forecasting. Annals of Operations Research 2024, 1–31. [Google Scholar]
- Pavlyshenko, B. Using stacking approaches for machine learning models. In Proceedings of the 2018 IEEE second international conference on data stream mining & processing (DSMP). 2018; pp. 255–258.
- Carta, S.; Podda, A.S.; Recupero, D.R.; Stanciu, M.M. Explainable ai for financial forecasting. In Proceedings of the International Conference on Machine Learning, Optimization, and Data Science; Springer, 2021; pp. 51–69. [Google Scholar]
- Wang, H.; Li, X. Research on iron ore price prediction based on adaboost-svr. In Proceedings of the 2022 11th International Conference of Information and Communication Technology (ICTech)). 2022; pp. 390–393.
- Baumeister, C.; Gu´erin, P. A comparison of monthly global indicators for forecasting growth. International Journal of Forecasting 2021, 37, 1276–1295. [Google Scholar]
- Kozik, R.; Pawlicki, M.; Chora’s, M. A new method of hybrid time window embedding with transformer-based traffic data classification in iot-networked environment. Pattern Analysis and Applications 2021, 24, 1441–1449. [Google Scholar] [CrossRef]
- Exports value by harmonized system. 2024. Available online: https://datasource.kapsarc.org/explore/dataset/exports-value-by-harmonized-system/table/?disjunctive.hssection&disjunctive.hschapter&sort=timeperiod.
- Jitsakul, W.; Whasphuttisit, J. Forecasting the export value of smes using time series analysis. In Proceedings of the 2022 7th International Conference on Business and Industrial Research (ICBIR). 2022; pp. 671–676.
- Haque, M.I. Assessing the progress of exports diversification in saudi arabia: growth-share matrix approach. Problems and Perspectives in Management 2020, 18, 118. [Google Scholar]
- Al-Fattah, S.M. A new artificial intelligence gannats model predicts gasoline demand of saudi arabia. Journal of Petroleum Science and Engineering 2020, 194, 107528. [Google Scholar] [CrossRef]
- Gross domestic product by kind of economic activity at current prices quarterly. 2024. Available online: https://datasource.kapsarc.org/explore/dataset/saudi-arabia-gross-domestic-product-by-kind-of-economic-activity-at-current-pric/information/.
- Makridakis, S.; Spiliotis, E.; Assimakopoulos, V. Statistical and machine learning forecasting methods: Concerns and ways forward. PloS one 2018, 13, e0194889. [Google Scholar]
- Batarseh, F.; Gopinath, M.; Nalluru, G.; Beckman, J. Application of machine learning in forecasting international trade trends. arXiv 2019, arXiv:1910.03112. [Google Scholar]
- Vaswani, A.; Shazeer, N.; Parmar, N.; Uszkoreit, J.; Jones, L.; Gomez, A.N.; Kaiser, Ł.; Polosukhin, I. Attention is All you Need. Advances in Neural Information Processing Systems 2017, 30. [Google Scholar]
- Foumani, N.M.; Tan, C.W.; Webb, G.I.; et al. Improving position encoding of transformers for multivariate time series classification. Data Min Knowl Disc 2024, 38, 22–48. [Google Scholar]
- Peng, B.; et al. RWKV: Reinventing RNNs for the Transformer Era. In Findings of the Association for Computational Linguistics: EMNLP; Singapore, 2023; pp. 14048–14077. [Google Scholar]
- Hochreiter, S.; Schmidhuber, J. Long short-term memory. Neural Computation 1997, 9, 1735–1780. [Google Scholar]
- Sagheer, K. Time Series Forecasting of Petroleum Production using Deep LSTM Recurrent Networks. Neurocomputing 2019, 323, 203–213. [Google Scholar]
- Chen, T.; Guestrin, C. XGBoost: A Scalable Tree Boosting System. In Proceedings of the 22nd ACM SIGKDD International Conference on Knowledge Discovery and Data Mining; 2016; pp. 785–794. [Google Scholar]
- Lim, B.; Arık, S.Ö.; Loeff, N.; Pfister, T. Temporal Fusion Transformers for interpretable multi-horizon time series forecasting. International Journal of Forecasting 2021, 37, 1748–1764. [Google Scholar]
- Chatzimparmpas, A.; Martins, R.M.; Kucher, K.; Kerren, A. Empirical Study: Visual Analytics for Comparing Stacking to Blending Ensemble Learning. In Proceedings of the 2021 23rd International Conference on Control Systems and Computer Science (CSCS), Bucharest, Romania; 2021; pp. 1–8. [Google Scholar]
- Lundberg, S.M.; Lee, S.-I. A unified approach to interpreting model predictions. In Proceedings of the 31st International Conference on Neural Information Processing Systems (NIPS'17). 2017.
- Hu, Y.; Wei, R.; Yang, Y.; Li, X.; Huang, Z.; Liu, Y.; He, C.; Lu, H. Performance Degradation Prediction Using LSTM with Optimized Parameters. Sensors 2022, 22, 2407. [Google Scholar] [CrossRef] [PubMed]
- Maccarrone, G.; Morelli, G.; Spadaccini, S. GDP Forecasting: Machine Learning, Linear or Autoregression? Frontiers in Artificial Intelligence 2021, 4, 757864. [Google Scholar] [PubMed]
Figure 1.
Top 5 HS Sections by Total Export Value.
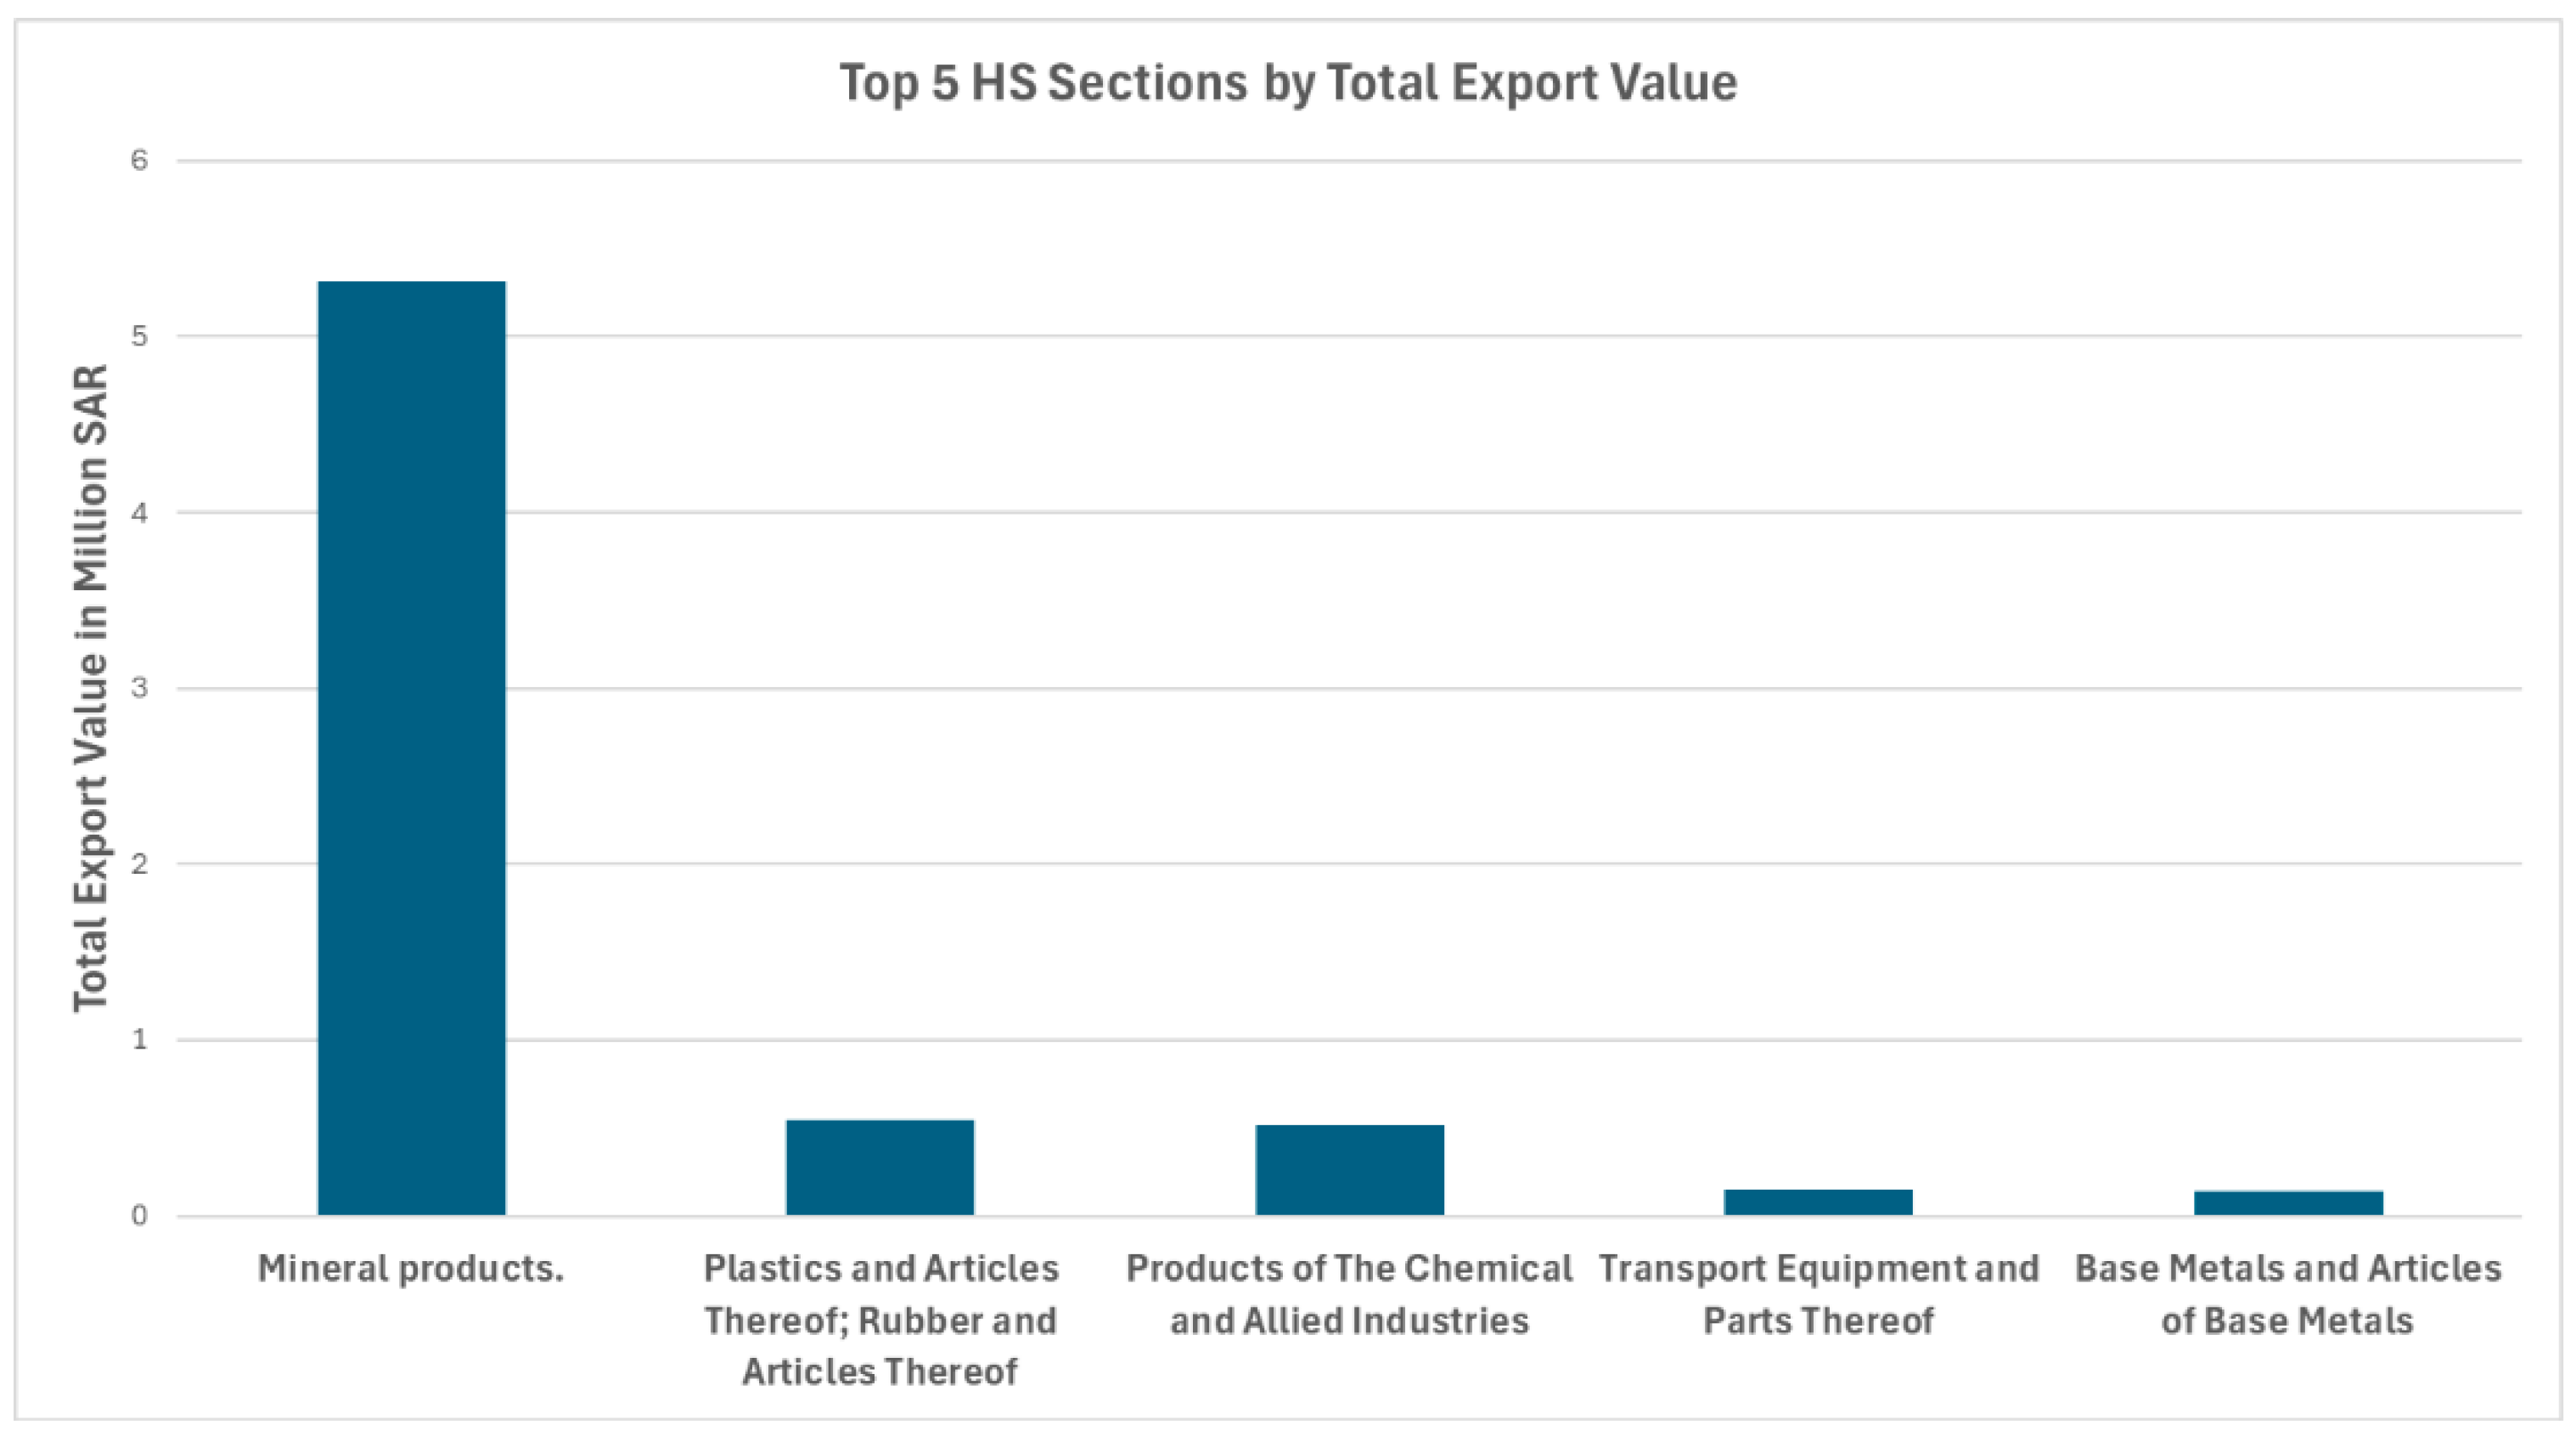
Figure 2.
Top 5 HS Sections by Trend of Total Export Value.
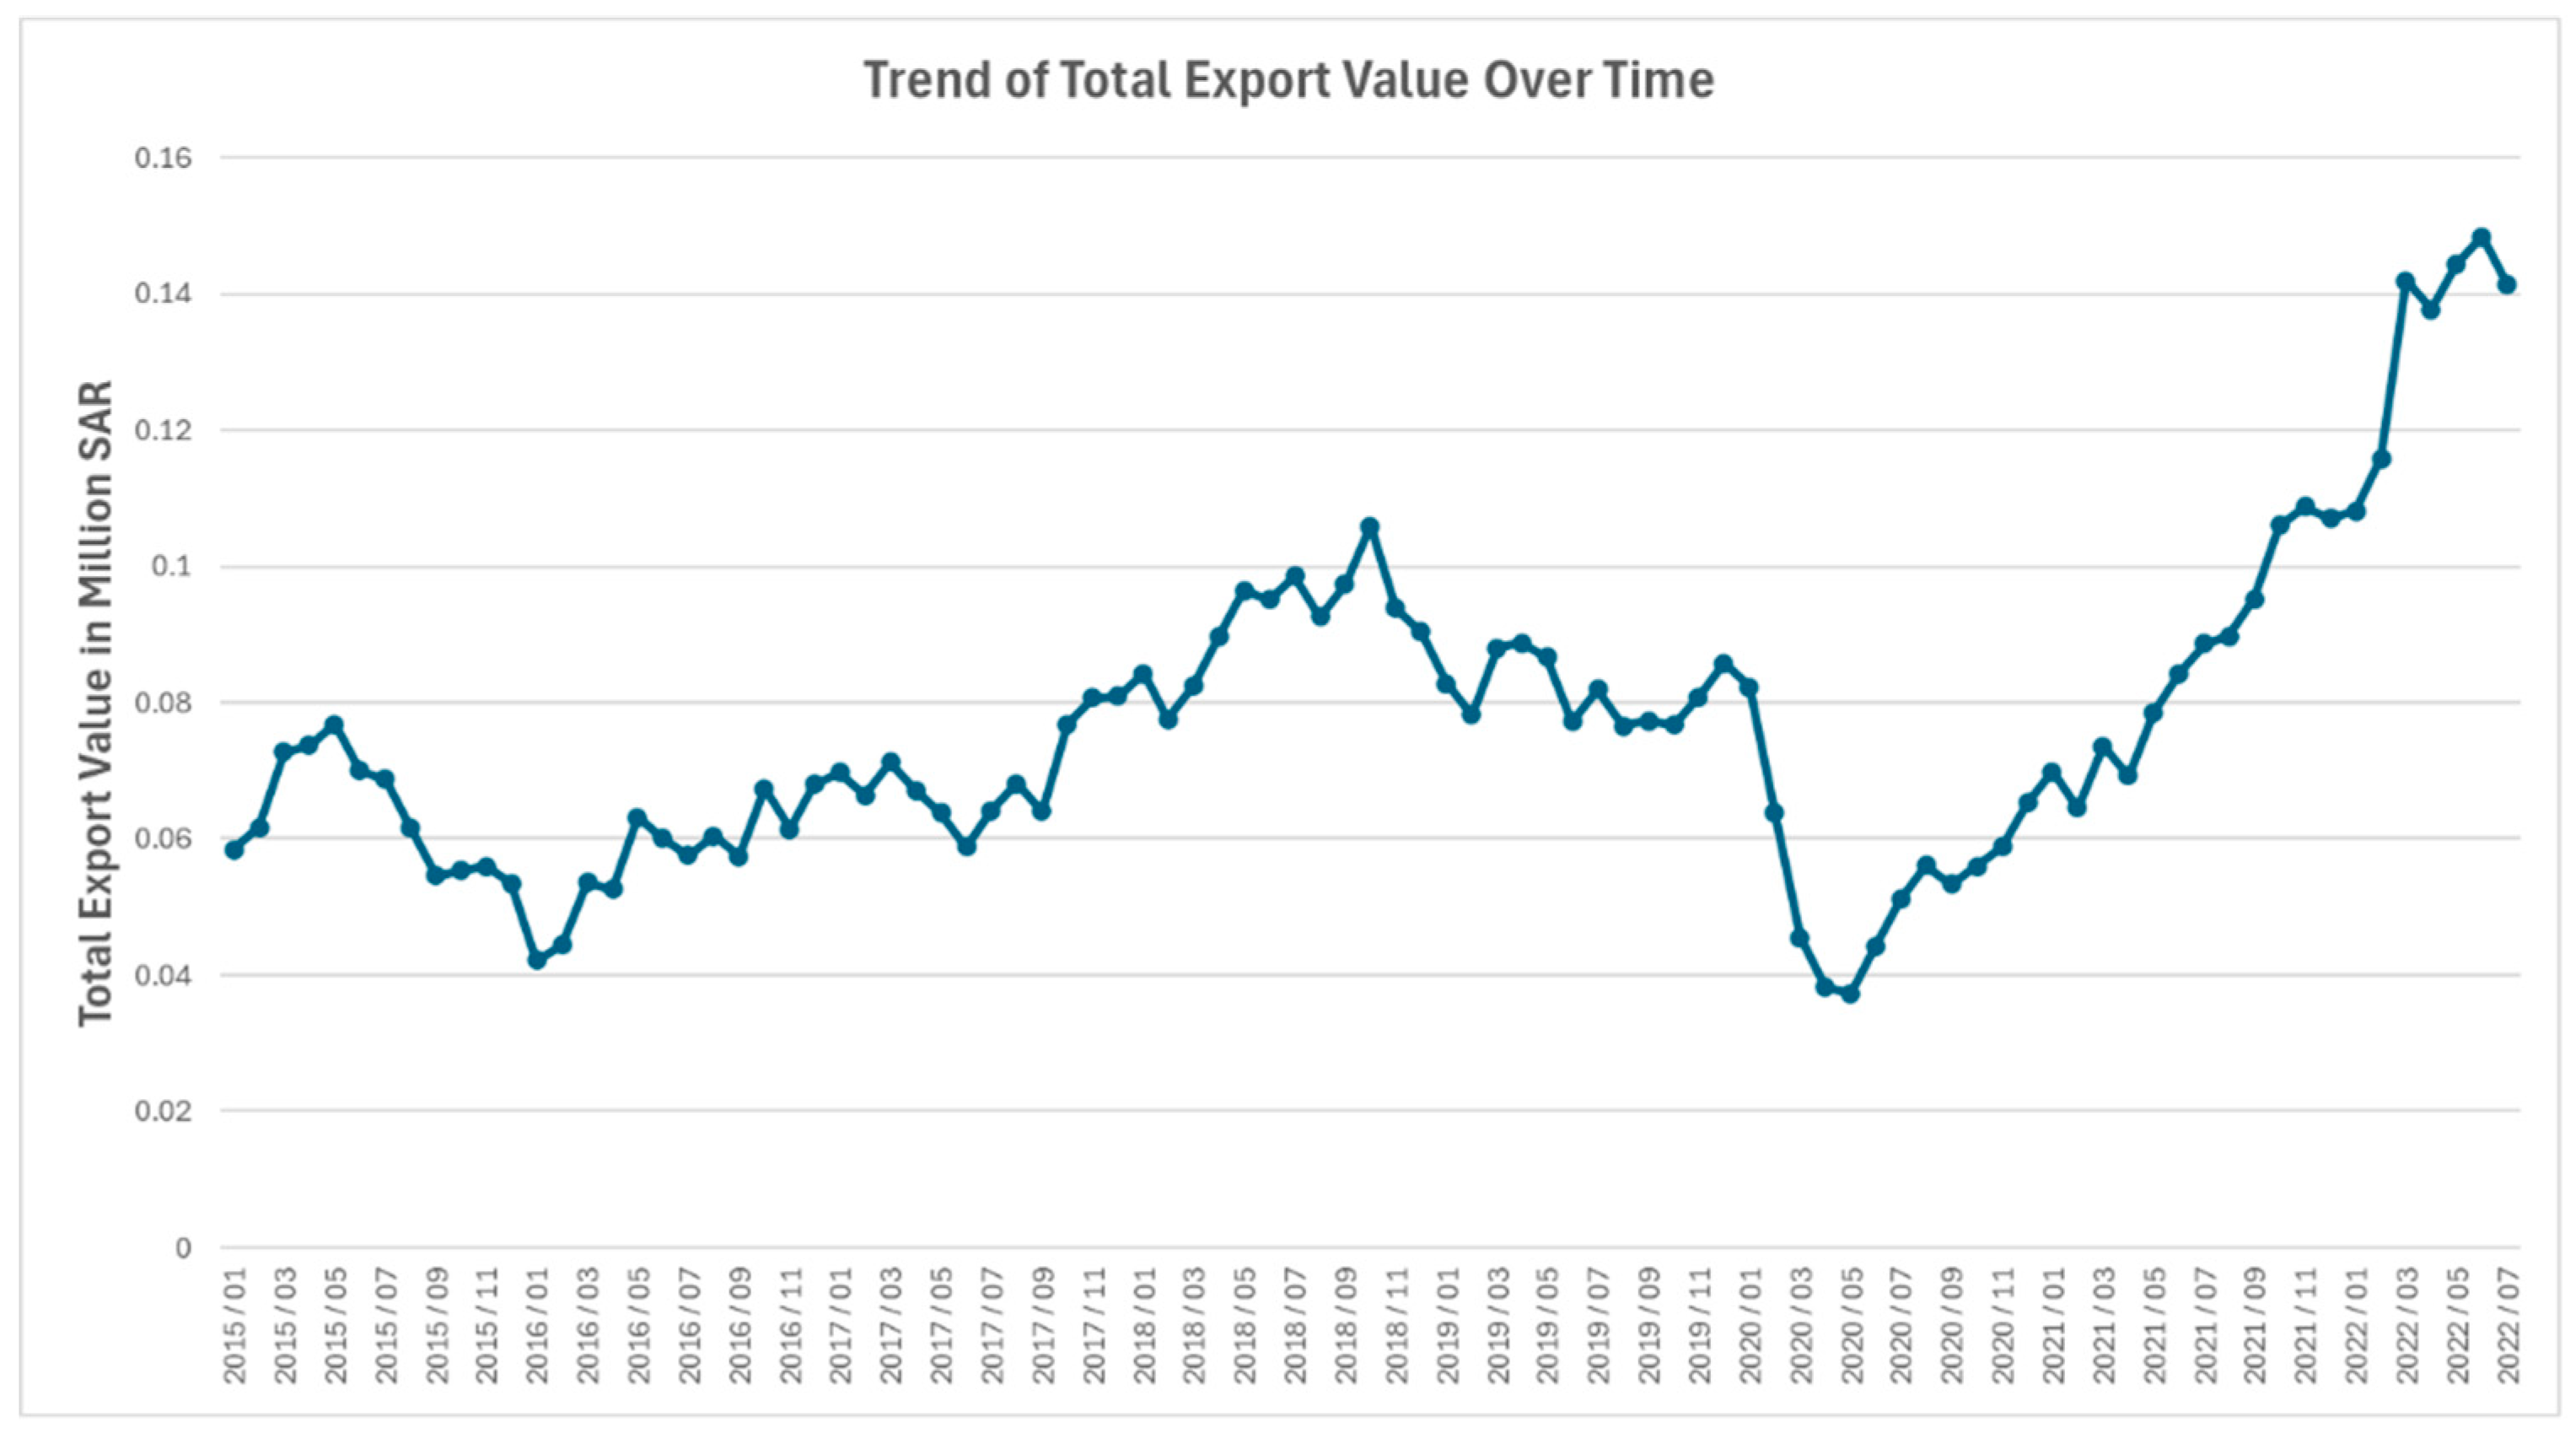
Figure 3.
Gross Domestic Product (GDP).
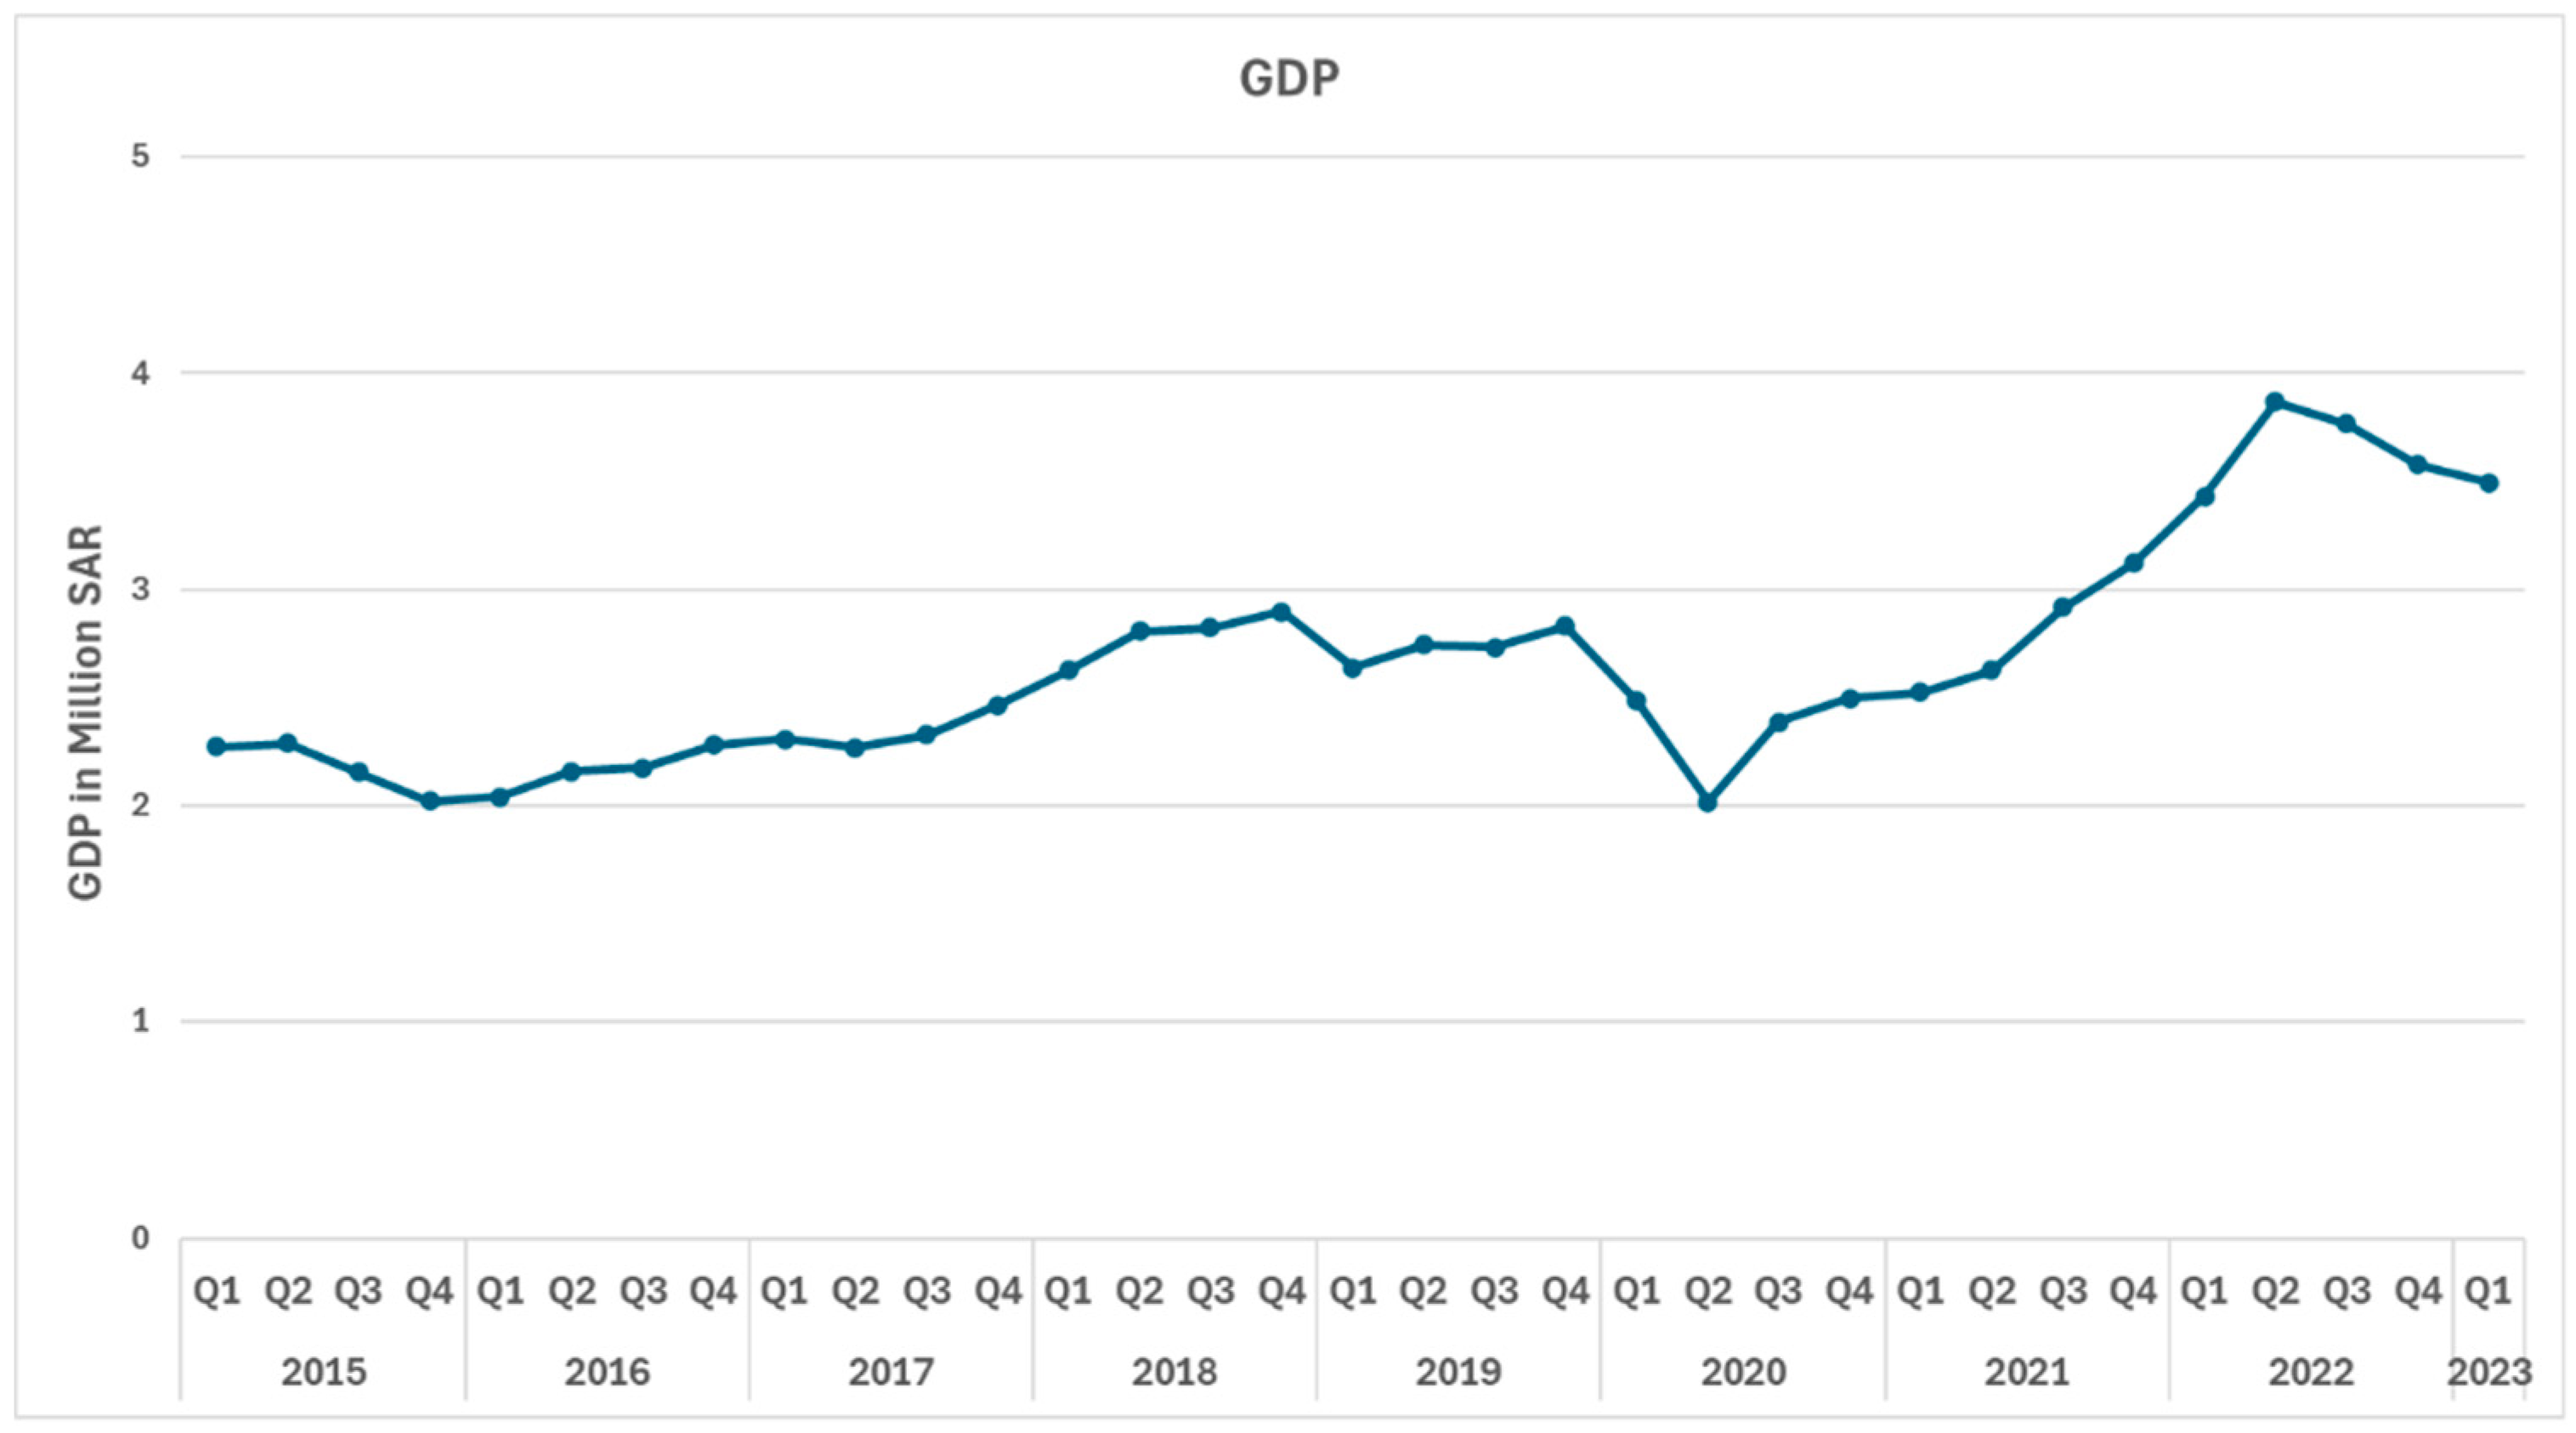
Figure 4.
Total Export Value Forecast with Advanced Transformer.
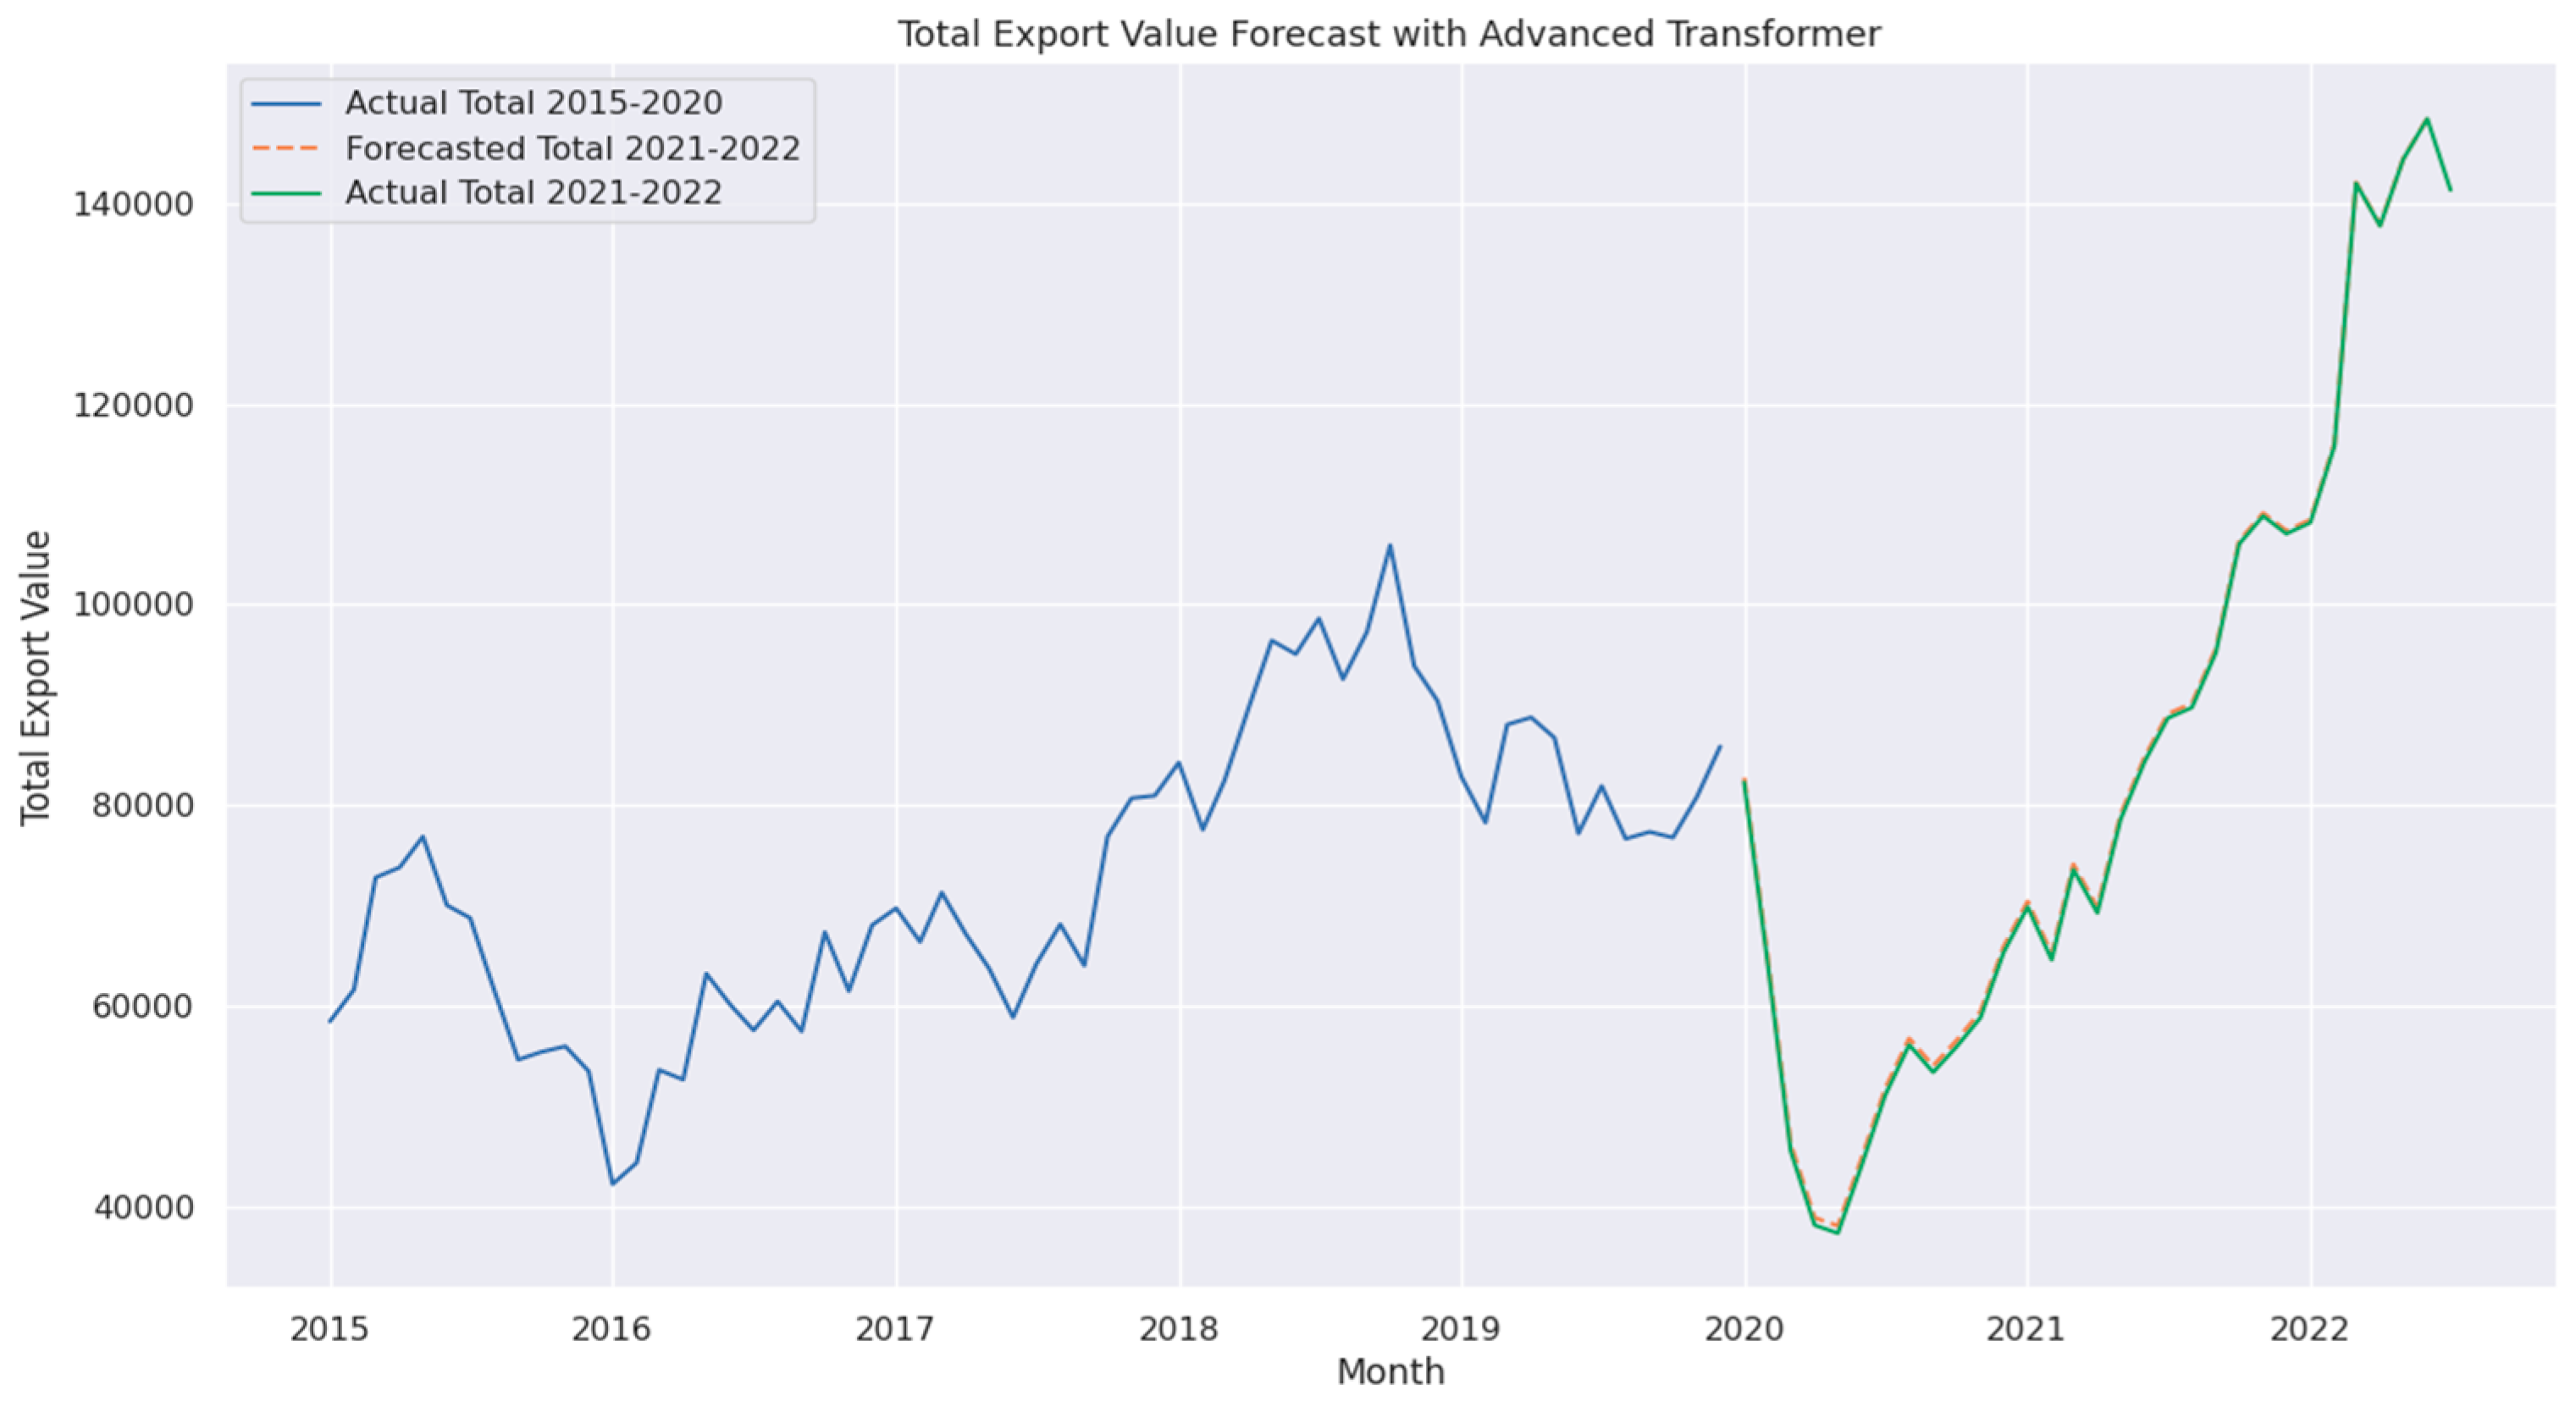
Figure 5.
Total Export Value Forecast with Transformer.
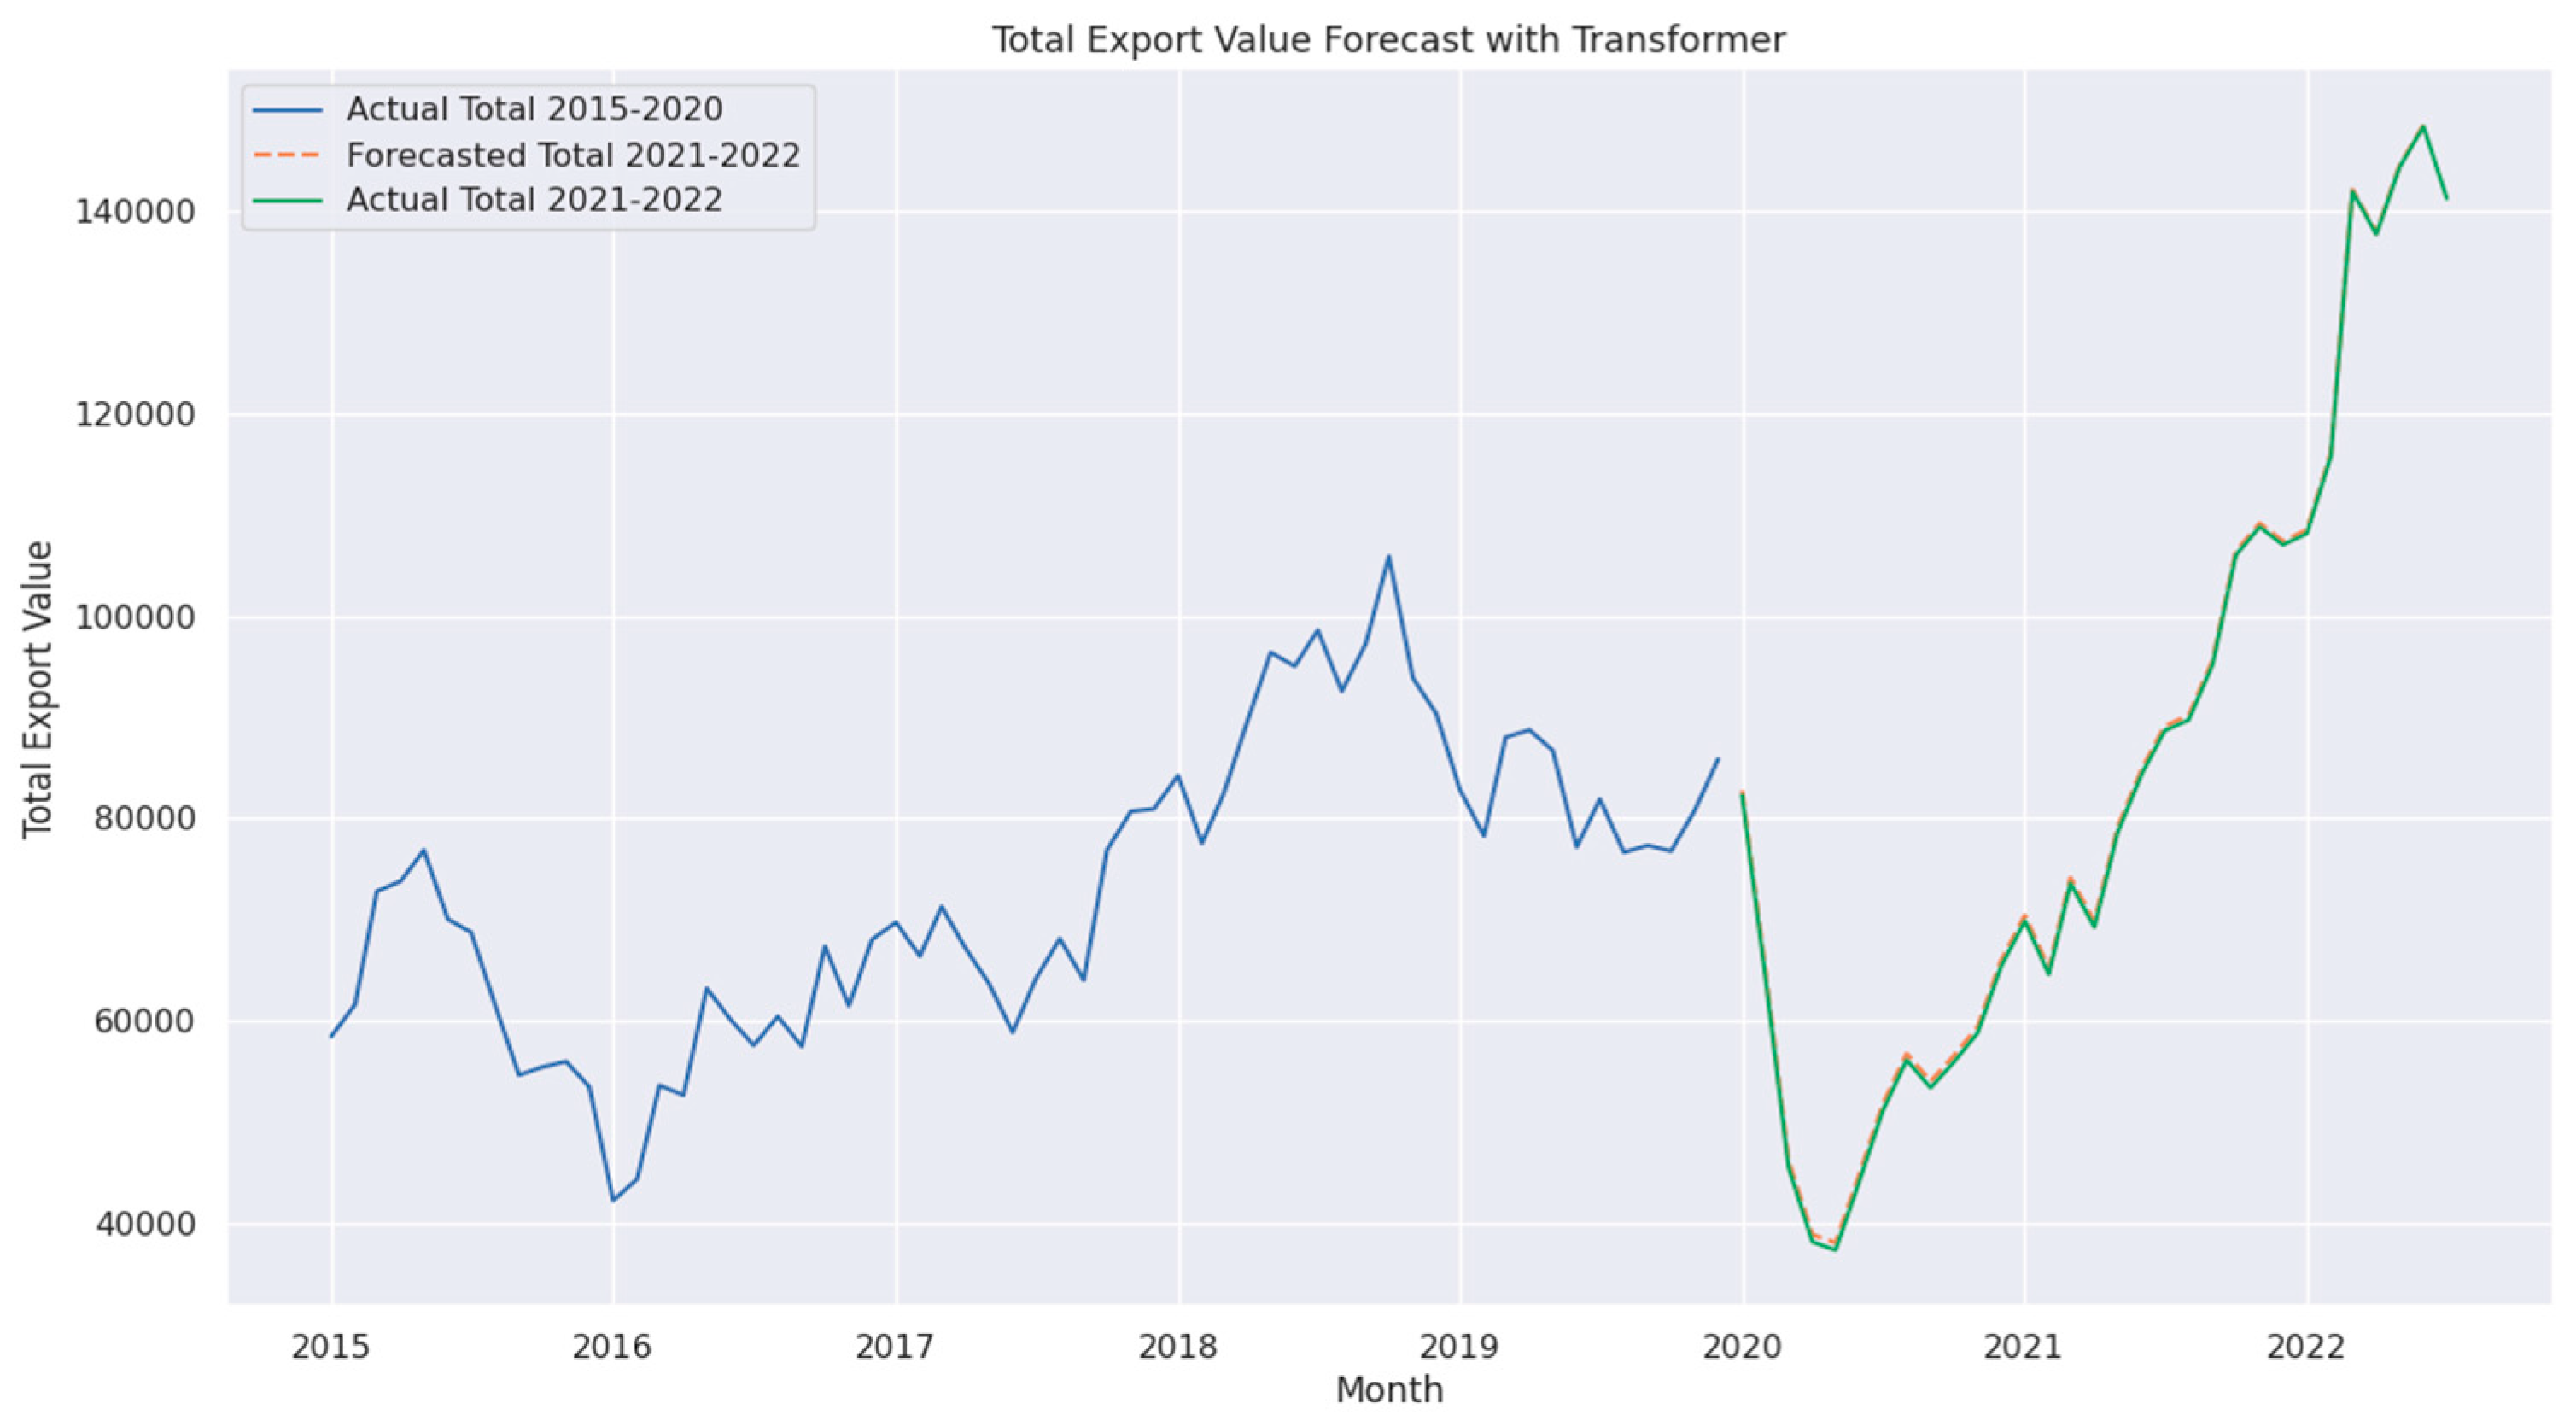
Figure 6.
SHAP force plot for the Ensemble Blending model.
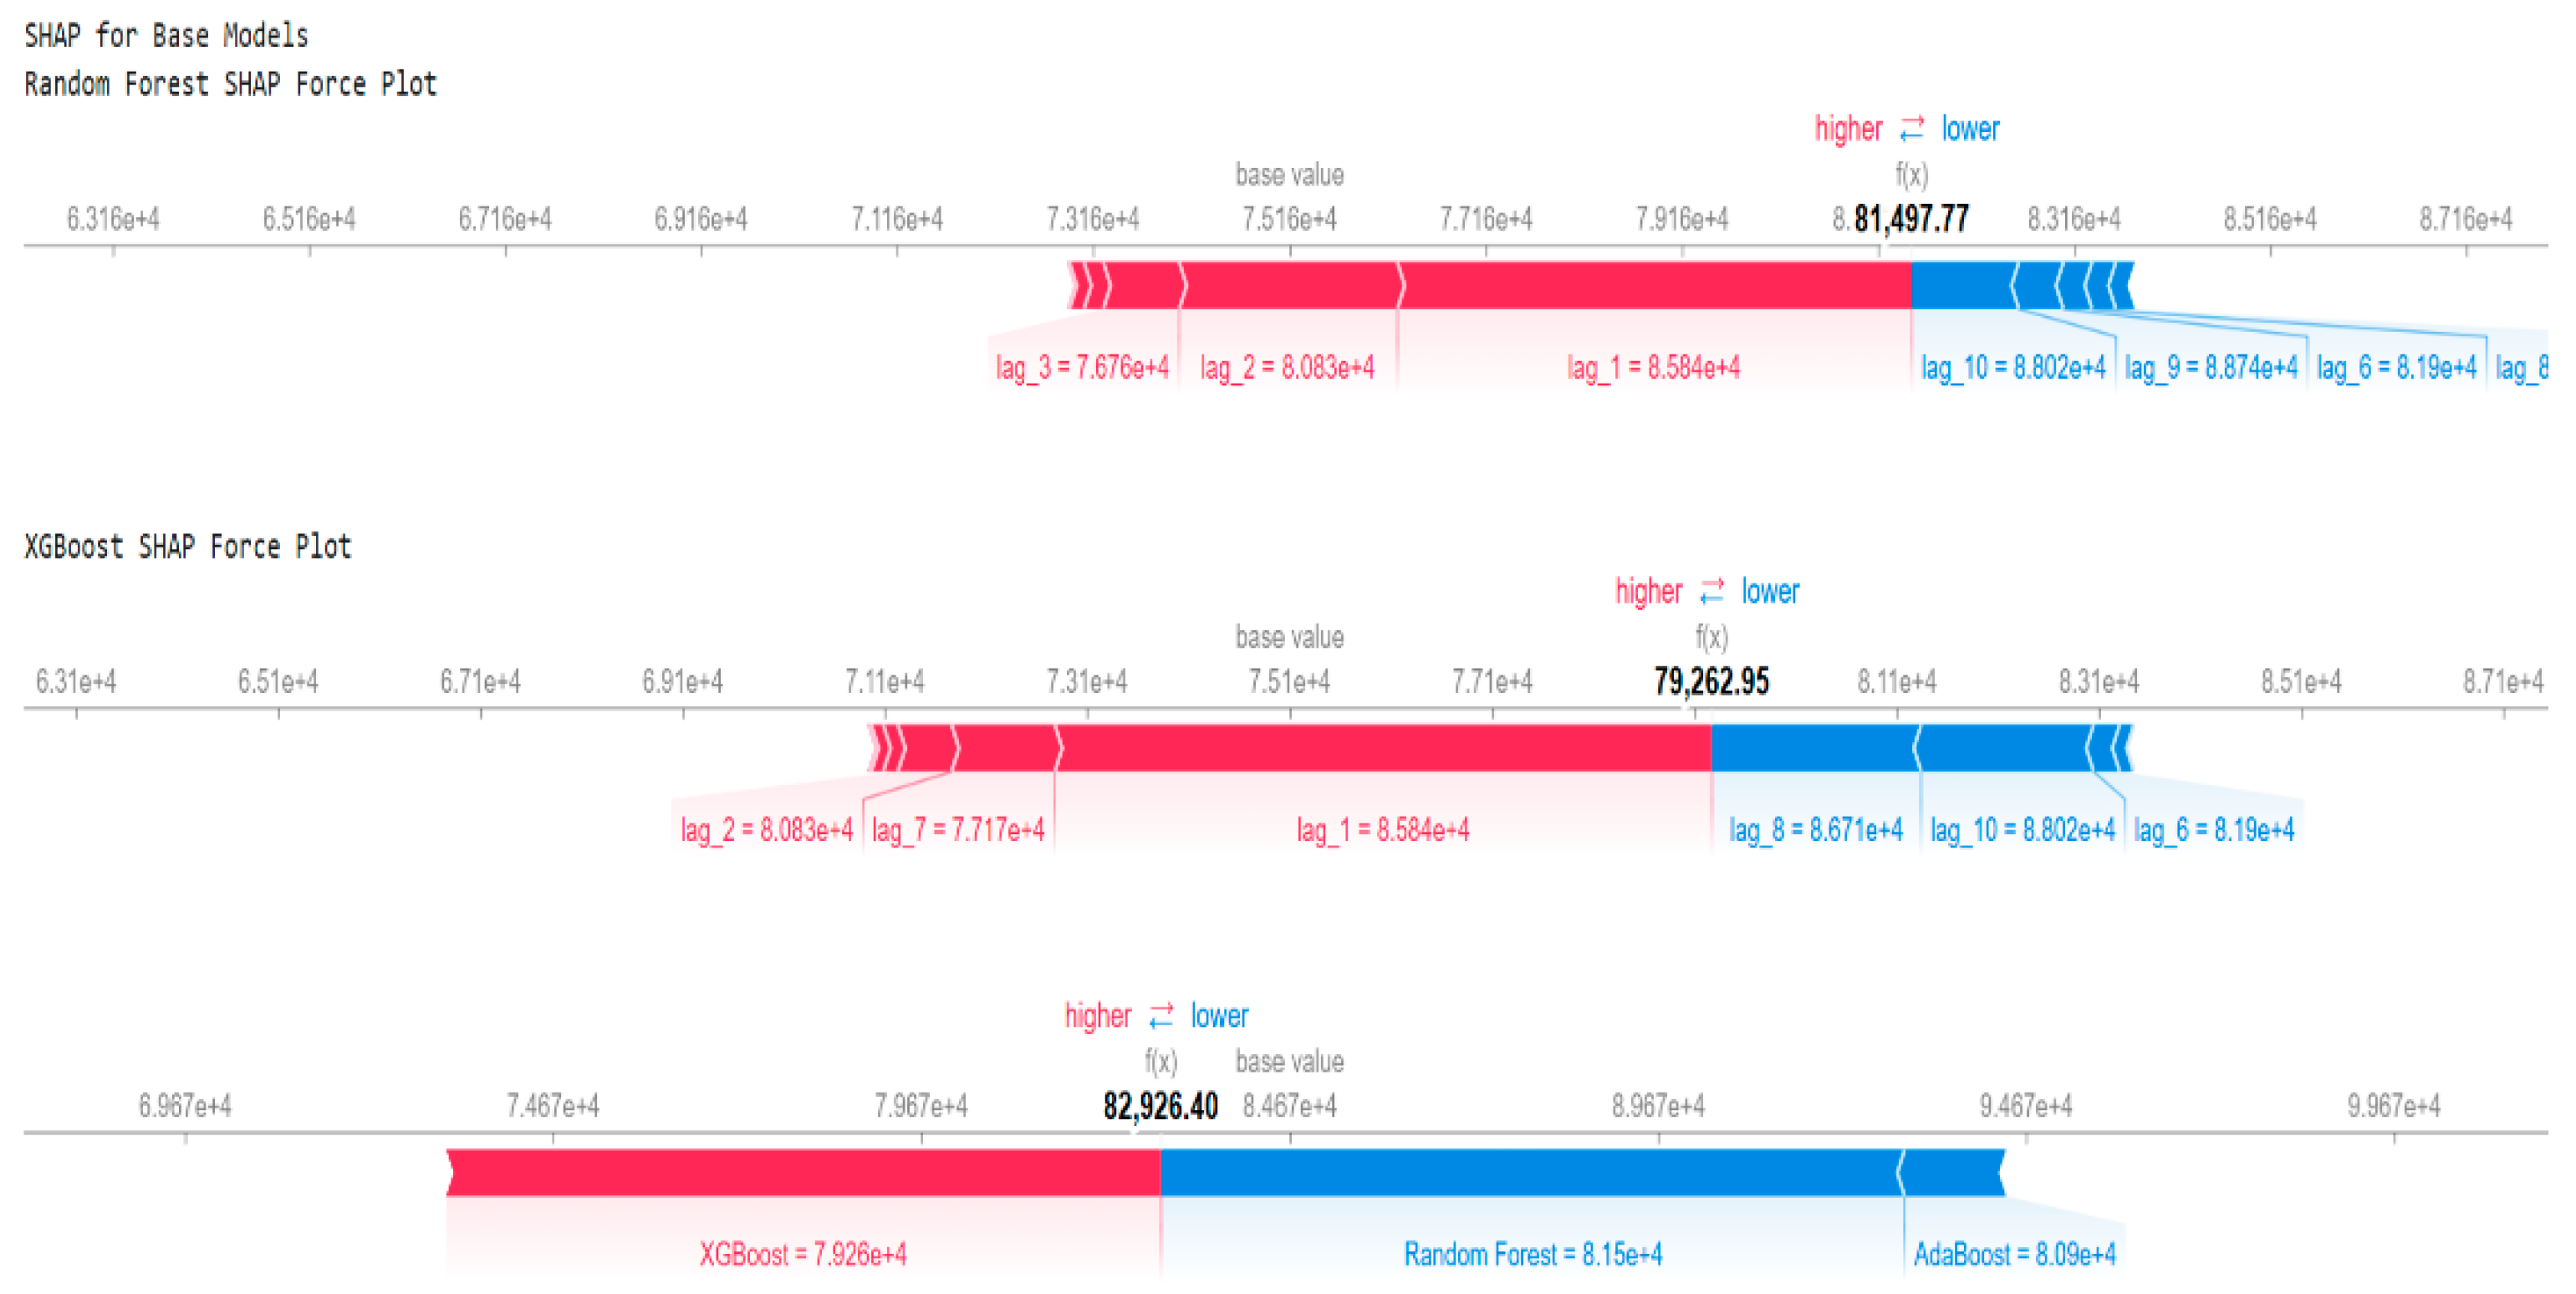
Figure 7.
Feature importance plot for the Ensemble Blending model.
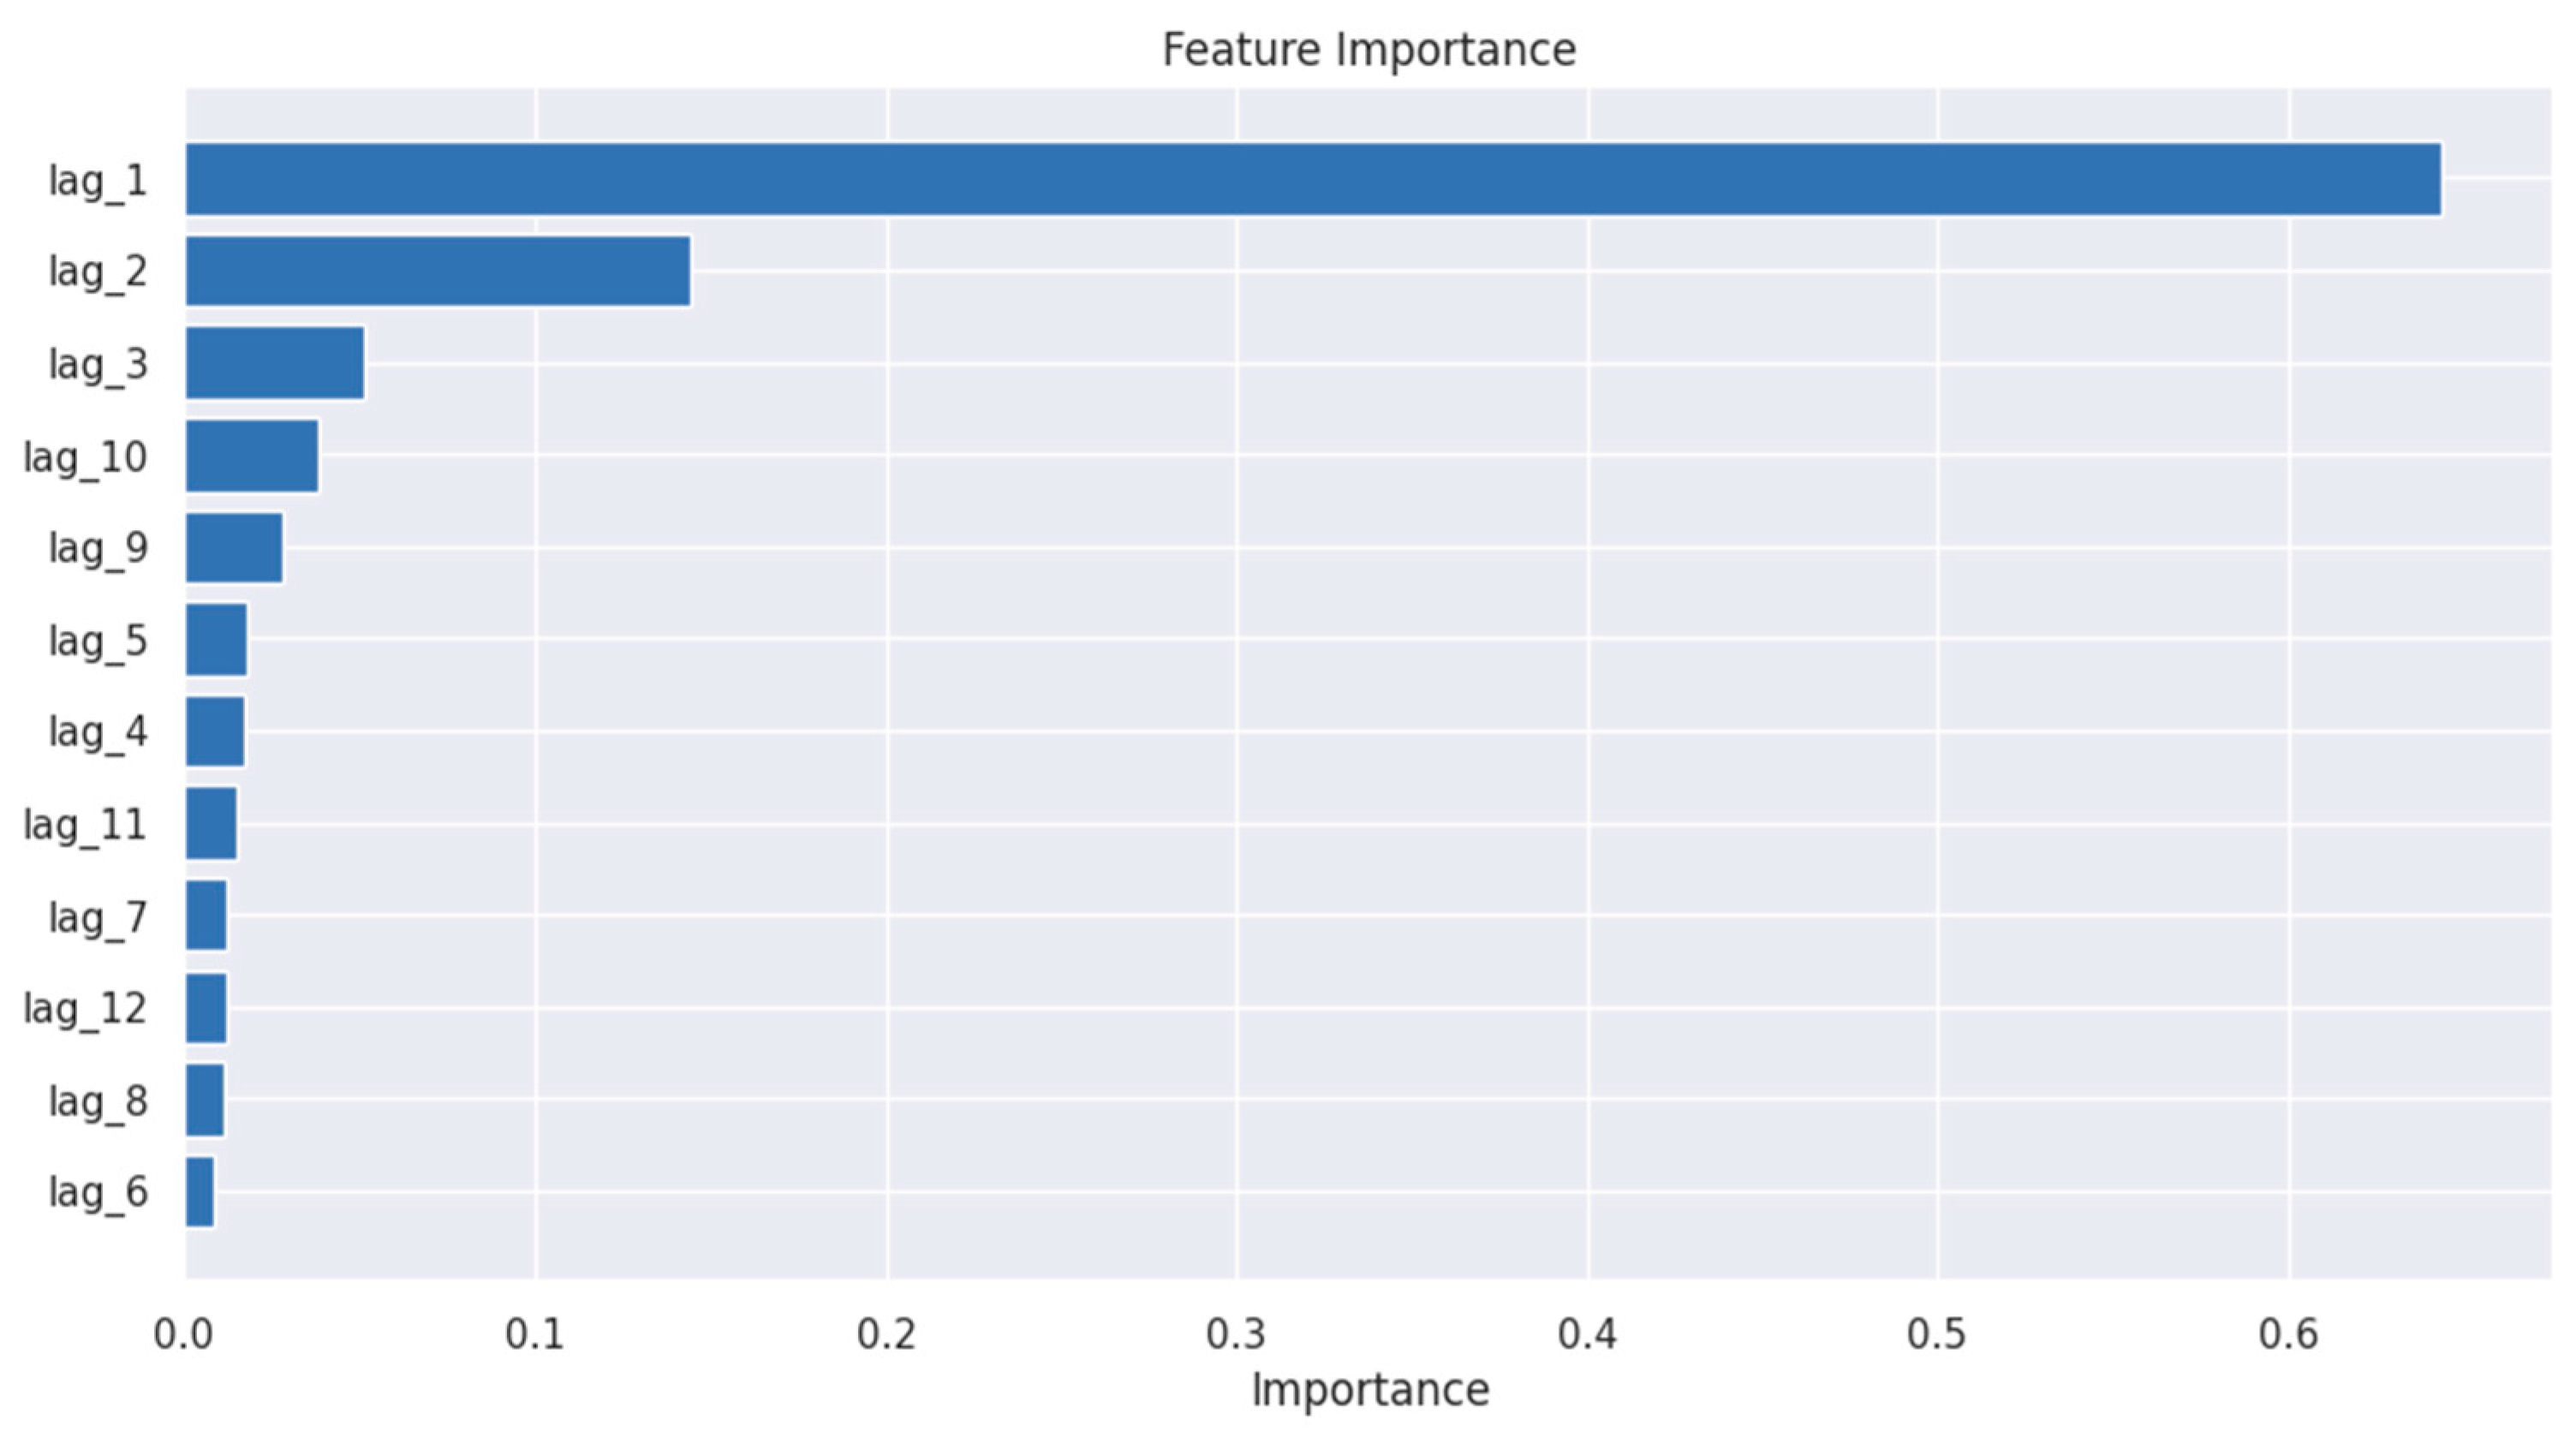
Figure 8.
Partial Dependence Plots for AdaBoost.
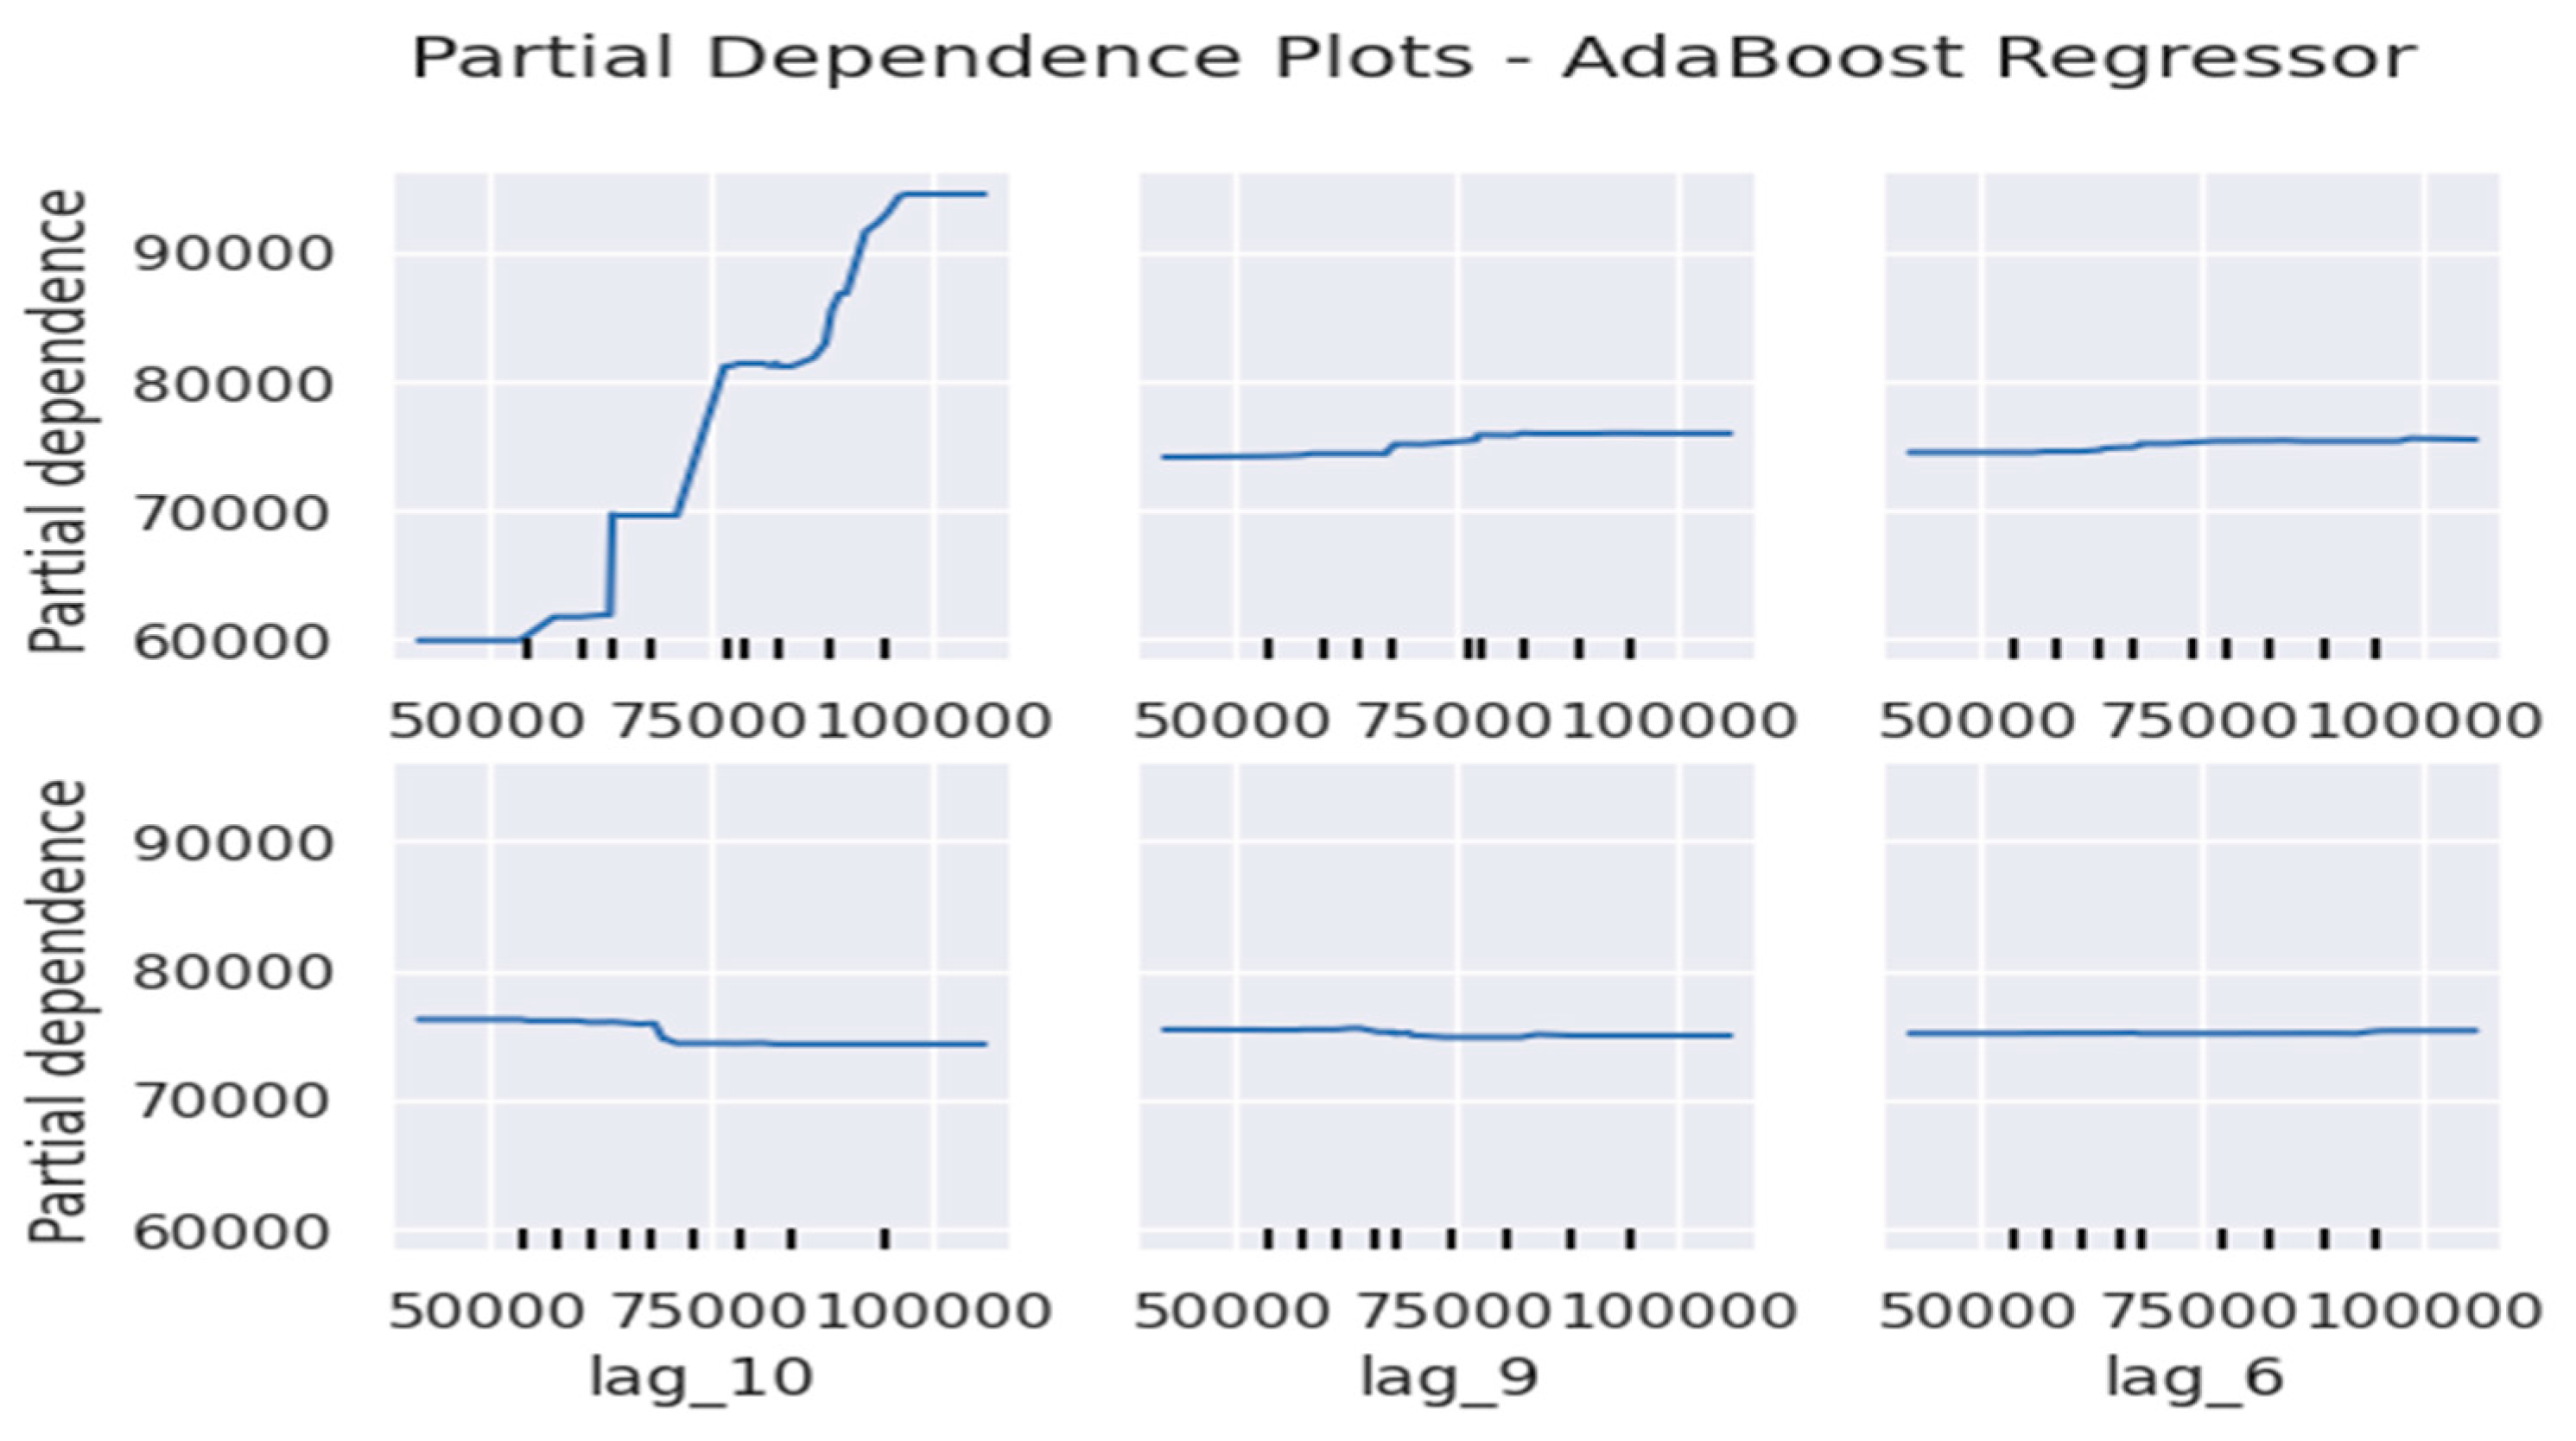
Figure 9.
Partial Dependence Plots for Random Forest.
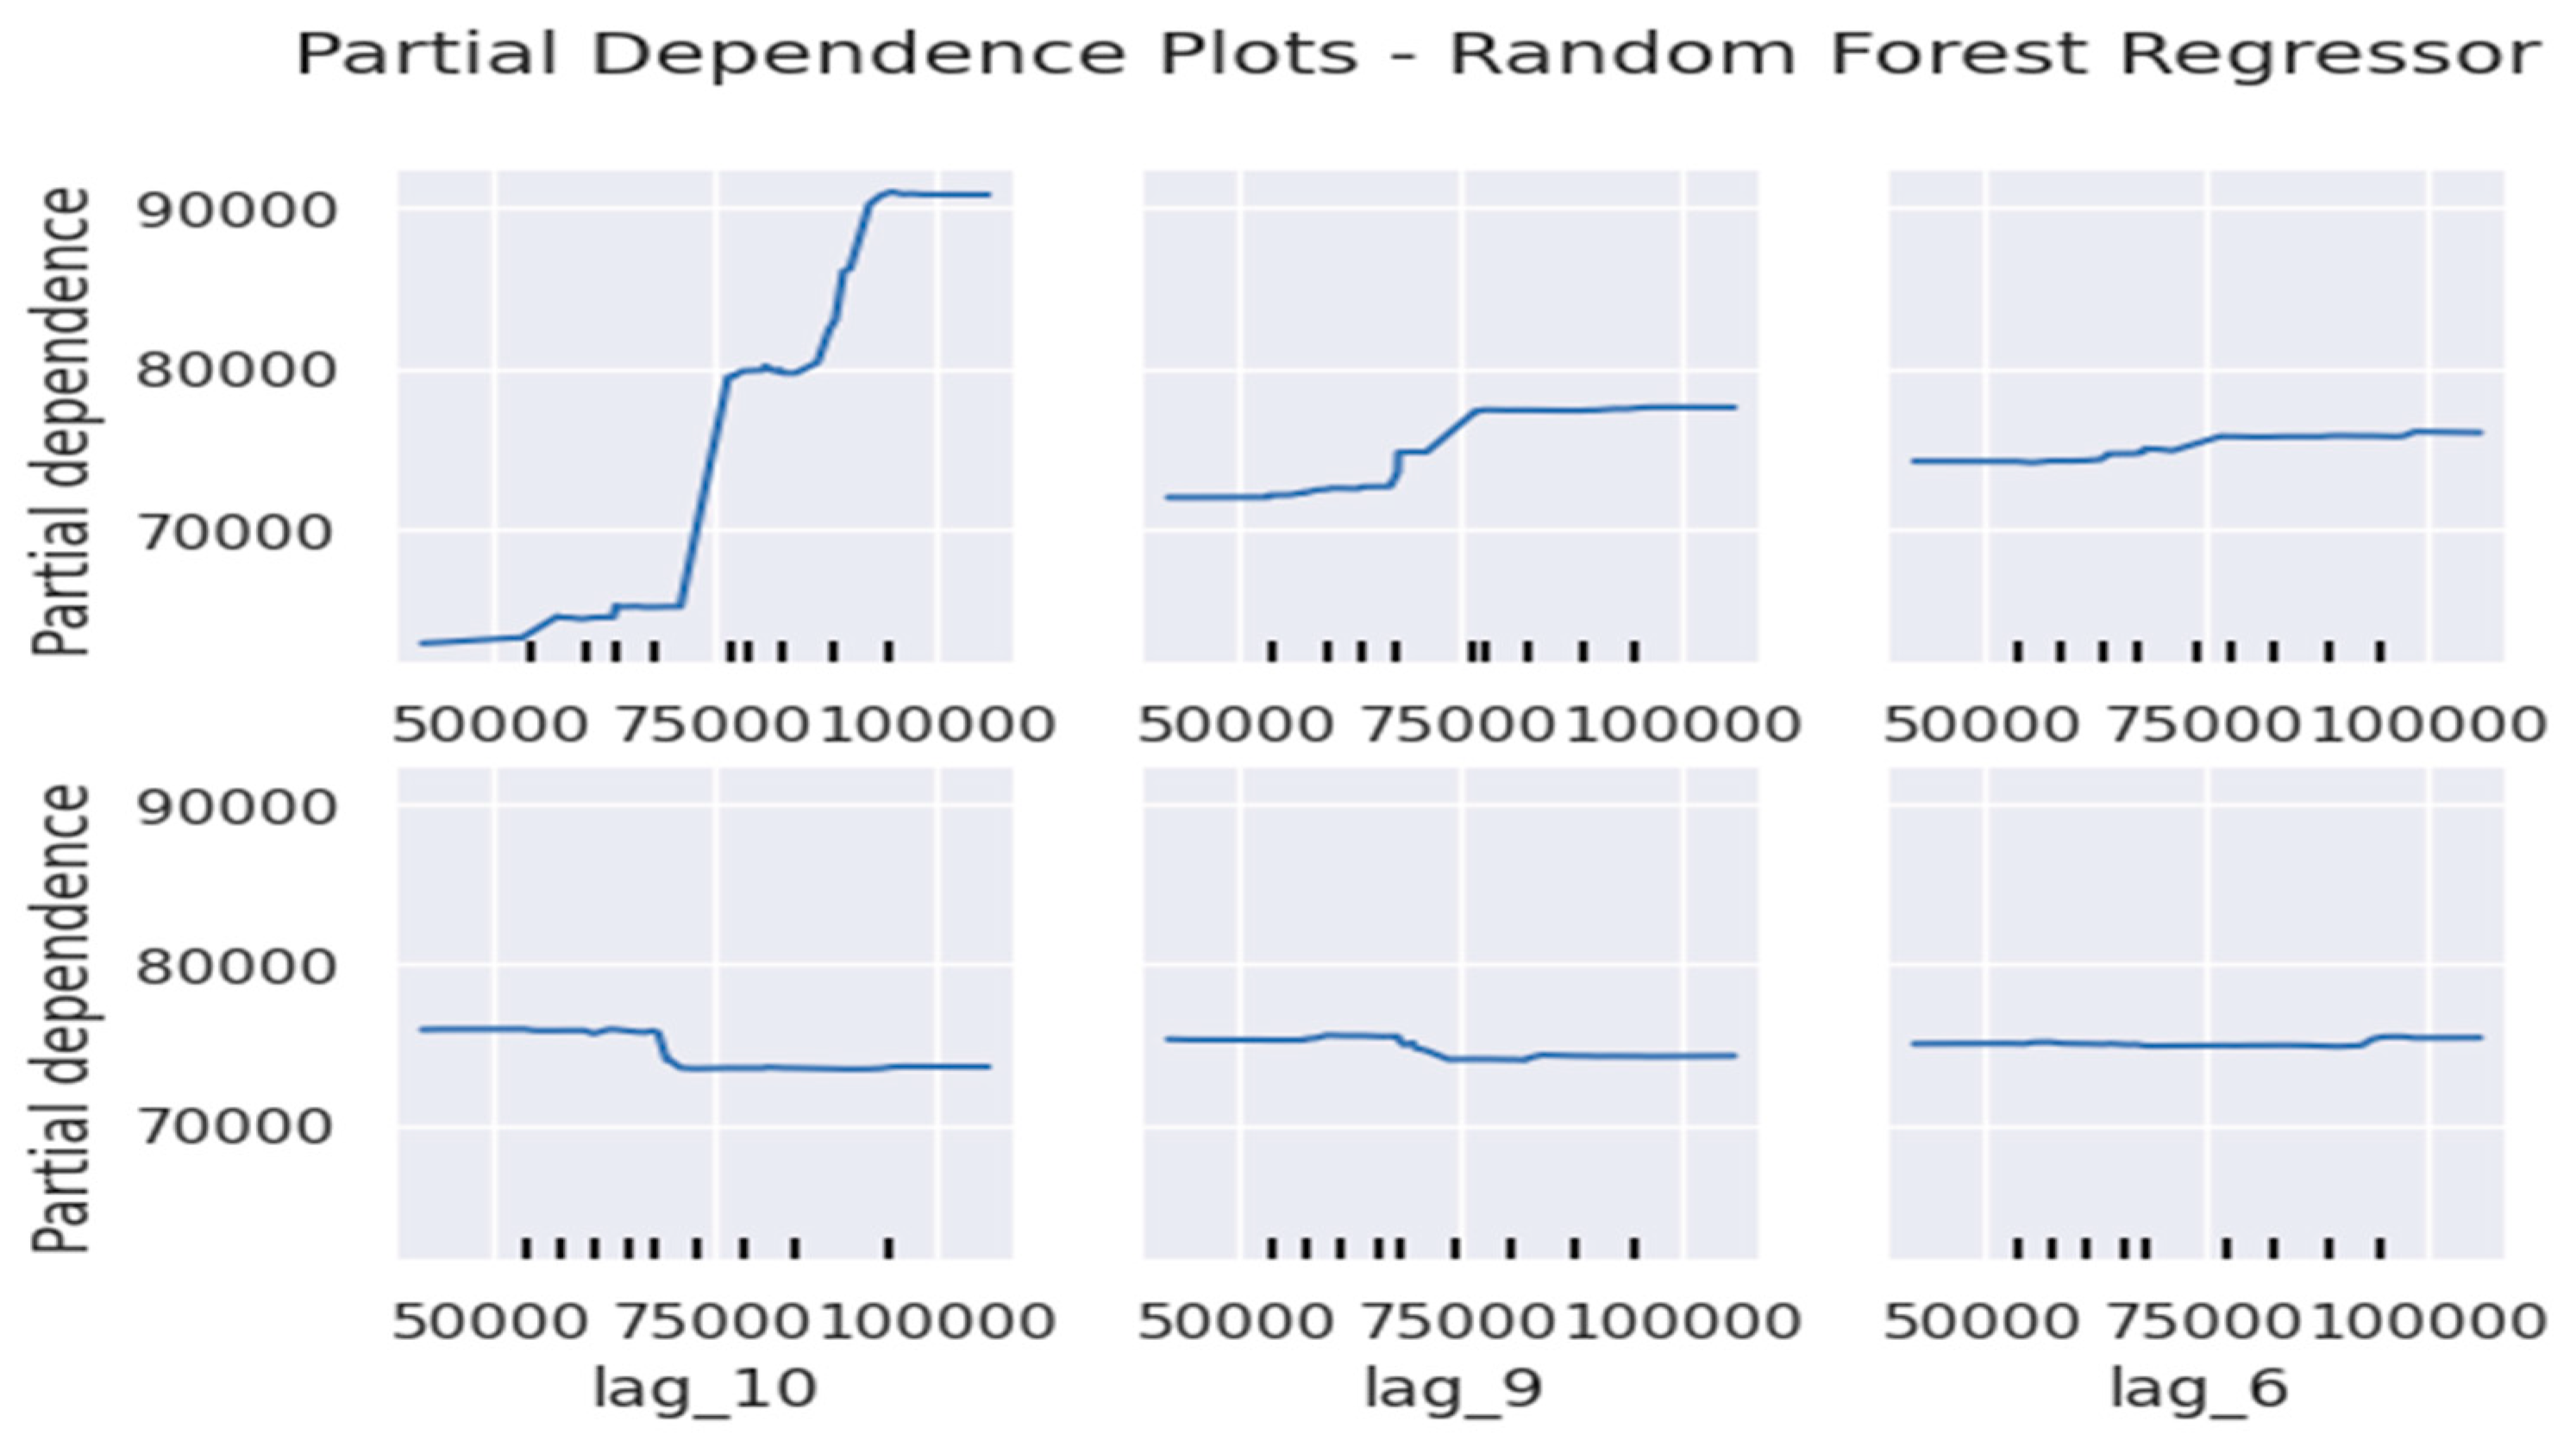
Figure 10.
Partial Dependence Plots for XGBoost.
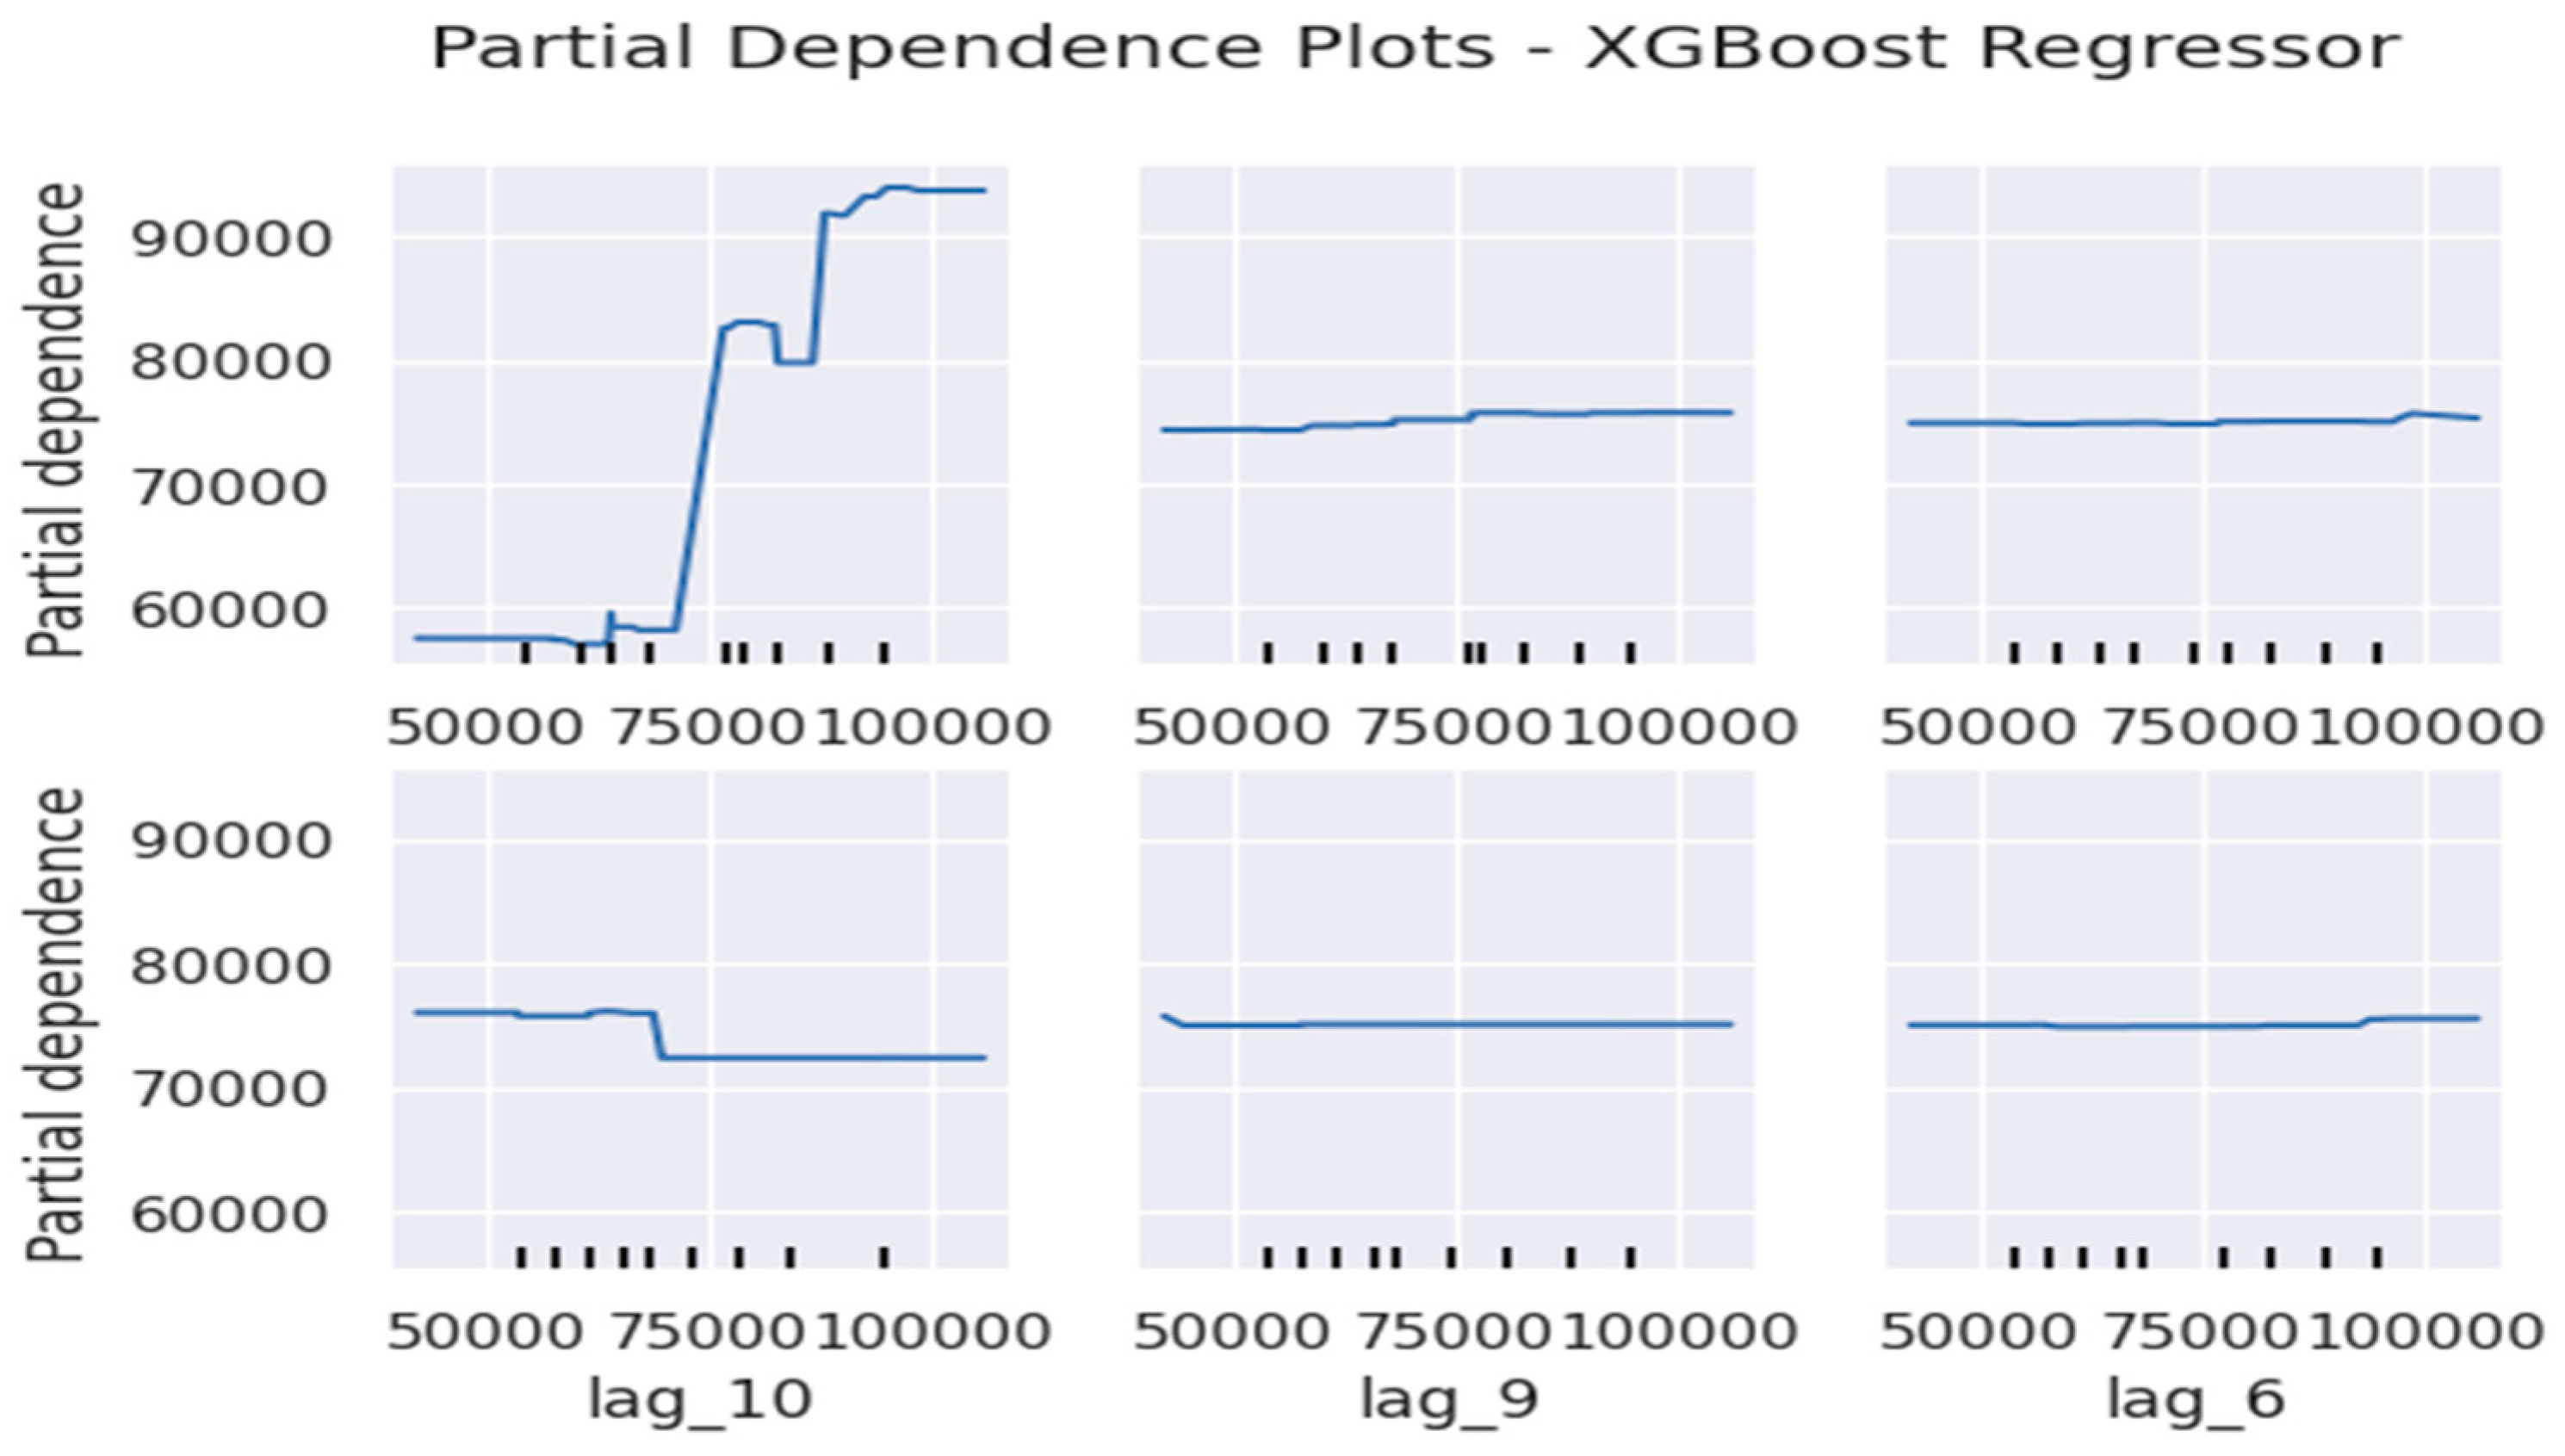
Figure 11.
Total Export Value Forecast with Non-Linear Blending Ensemble.

Figure 12.
Total Export Value Forecast with Non-Linear Blending Ensemble.
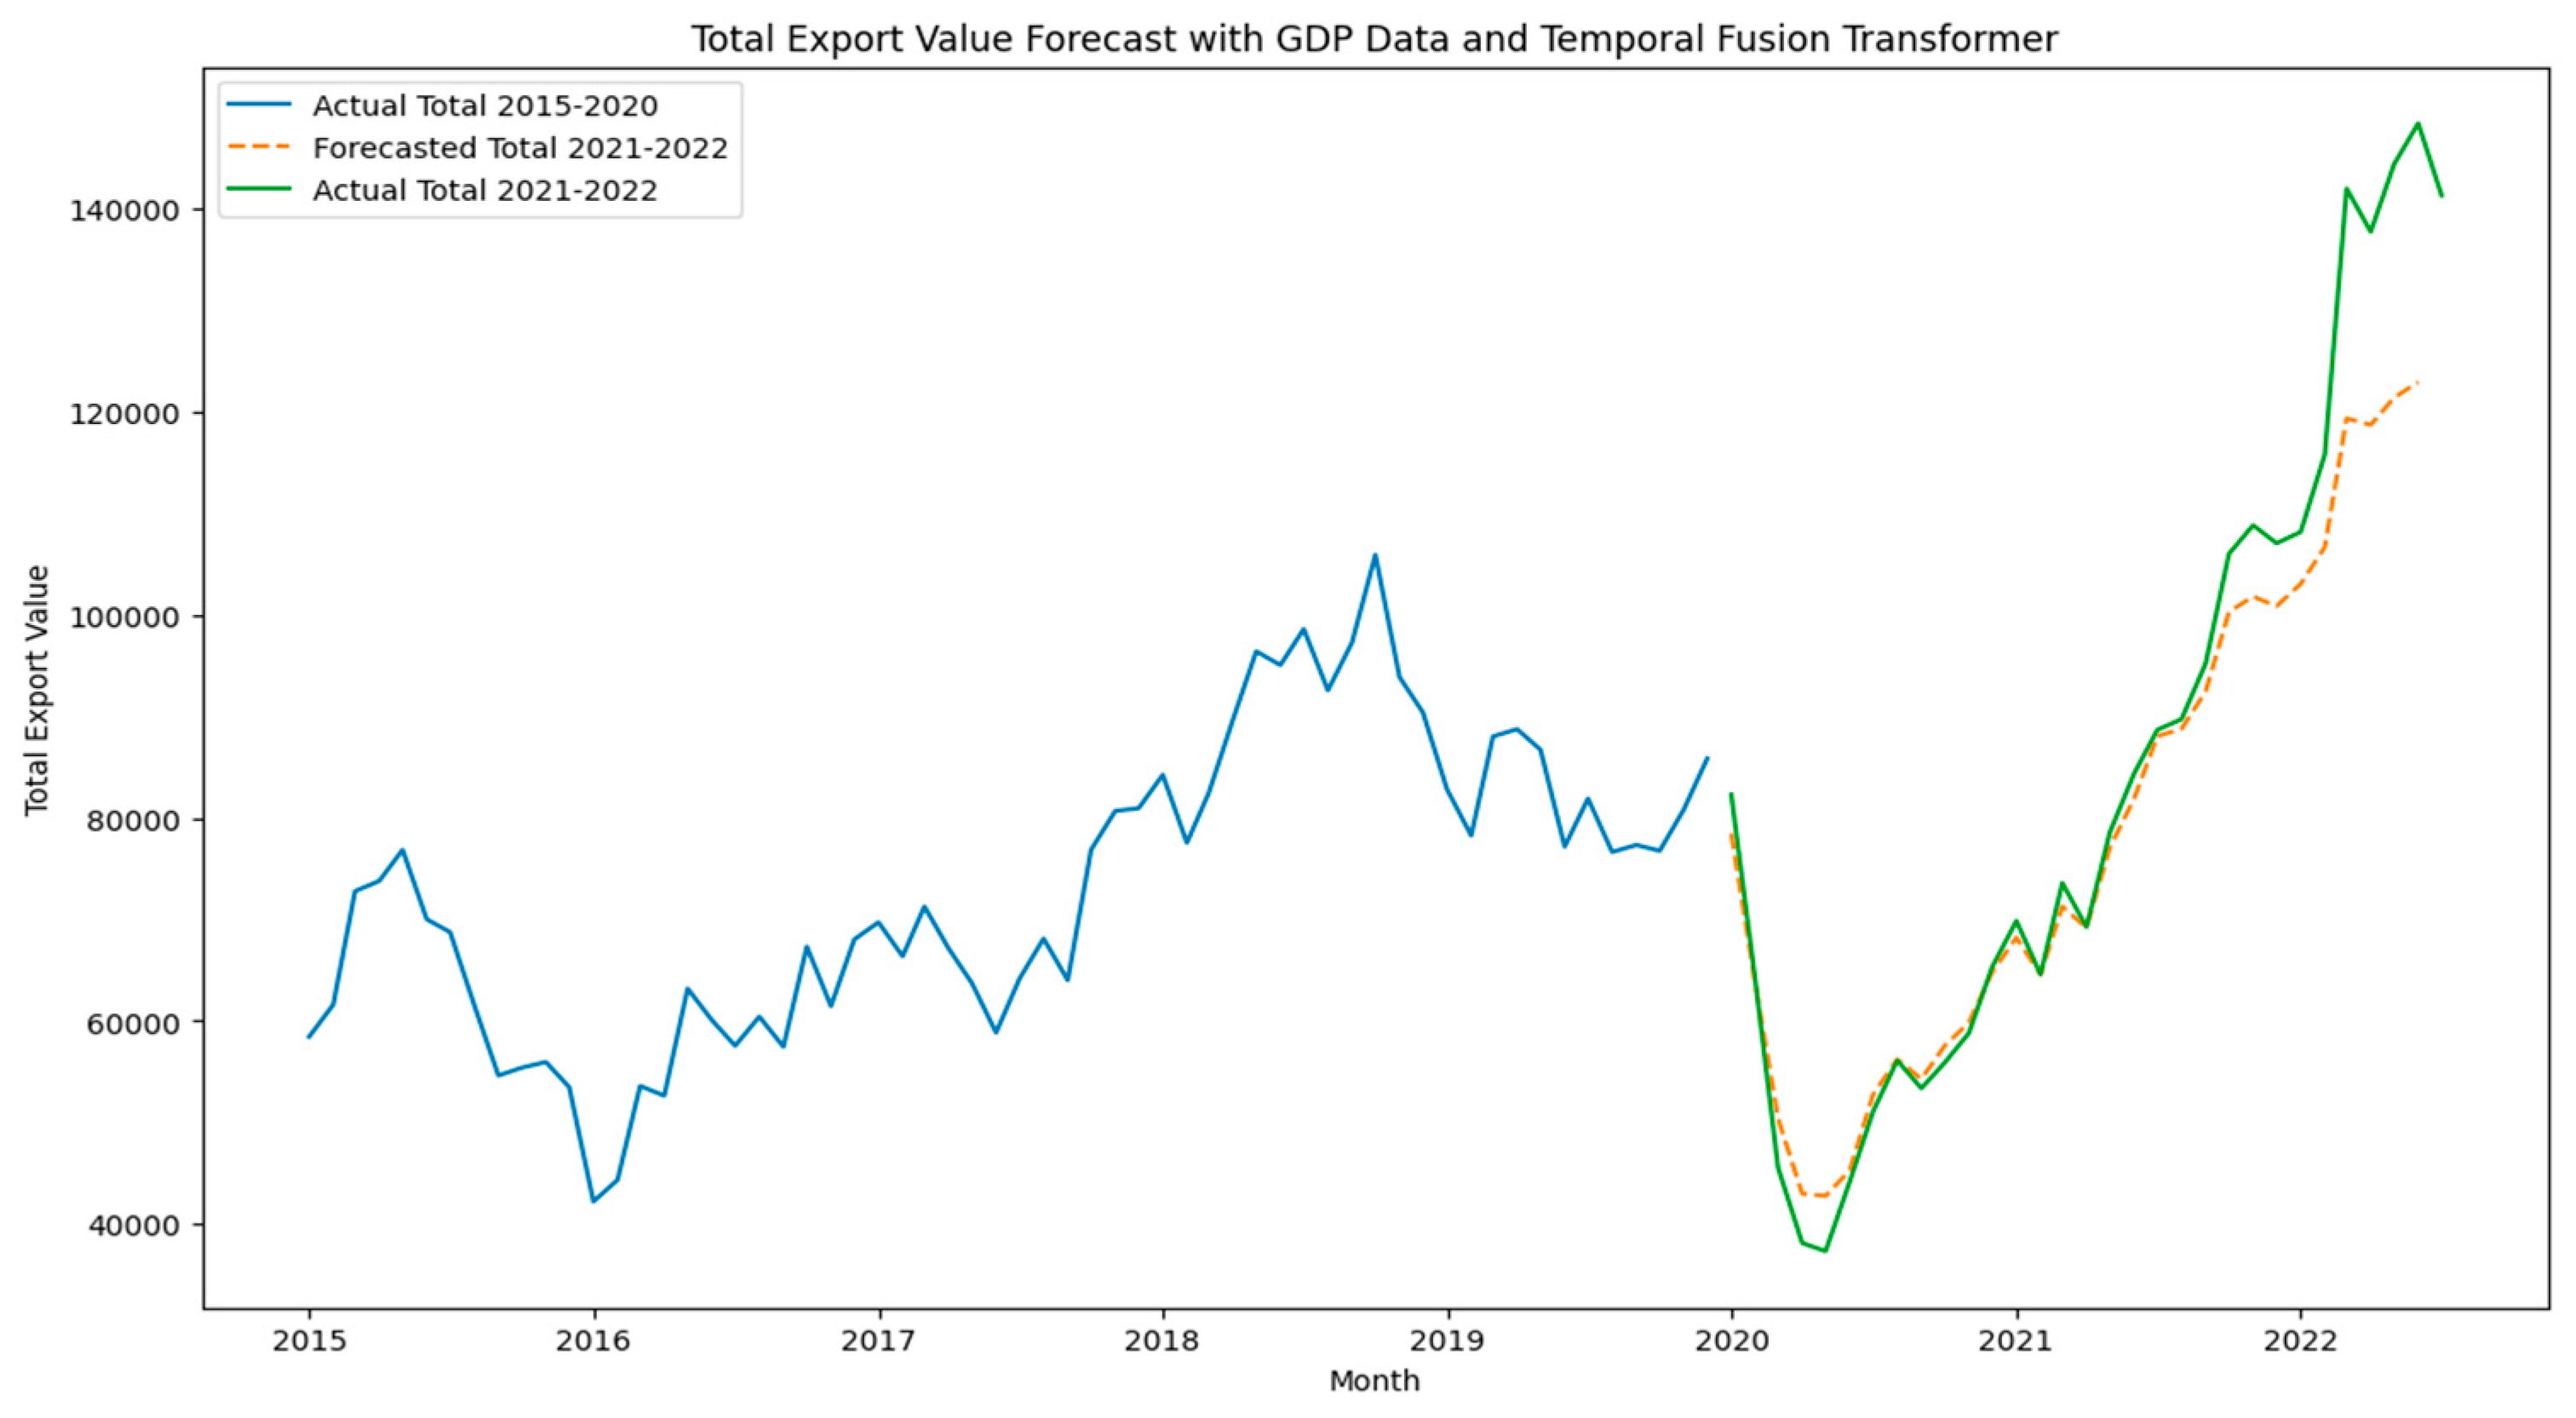
Figure 13.
Training and Validation Loss for TFT.
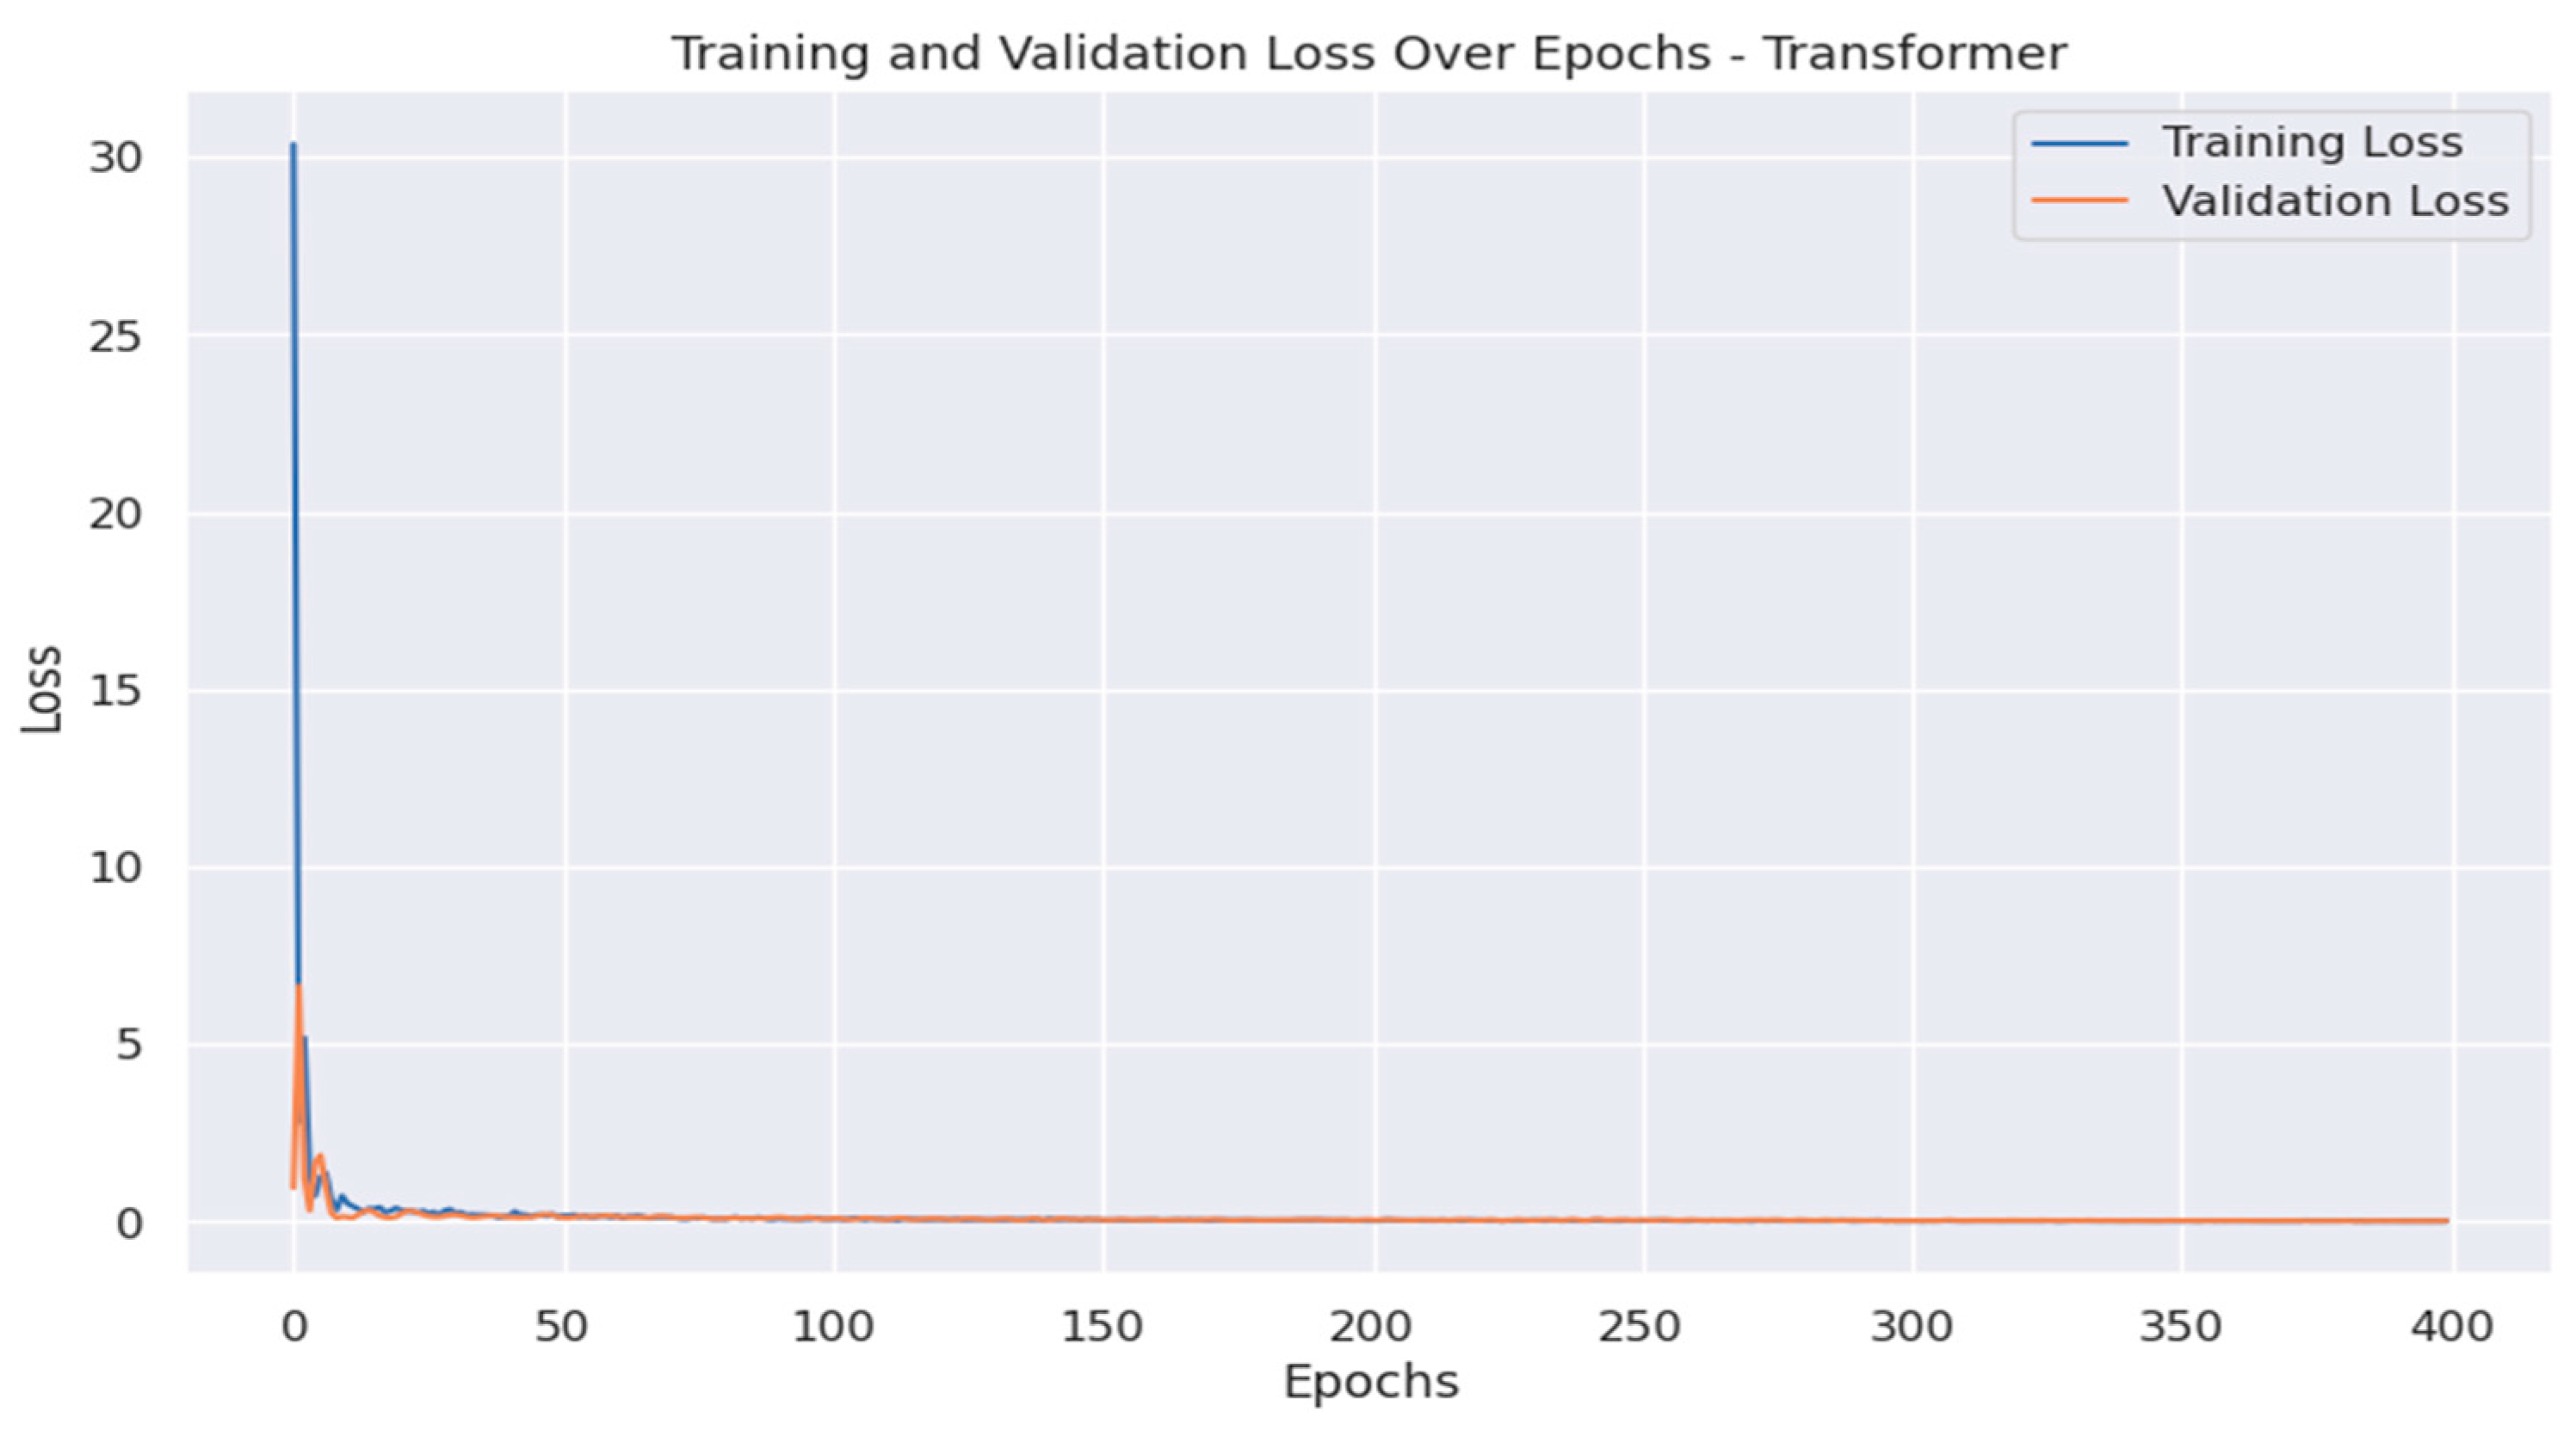
Figure 14.
Forecast vs. Actual Export Values for Stacking Model.
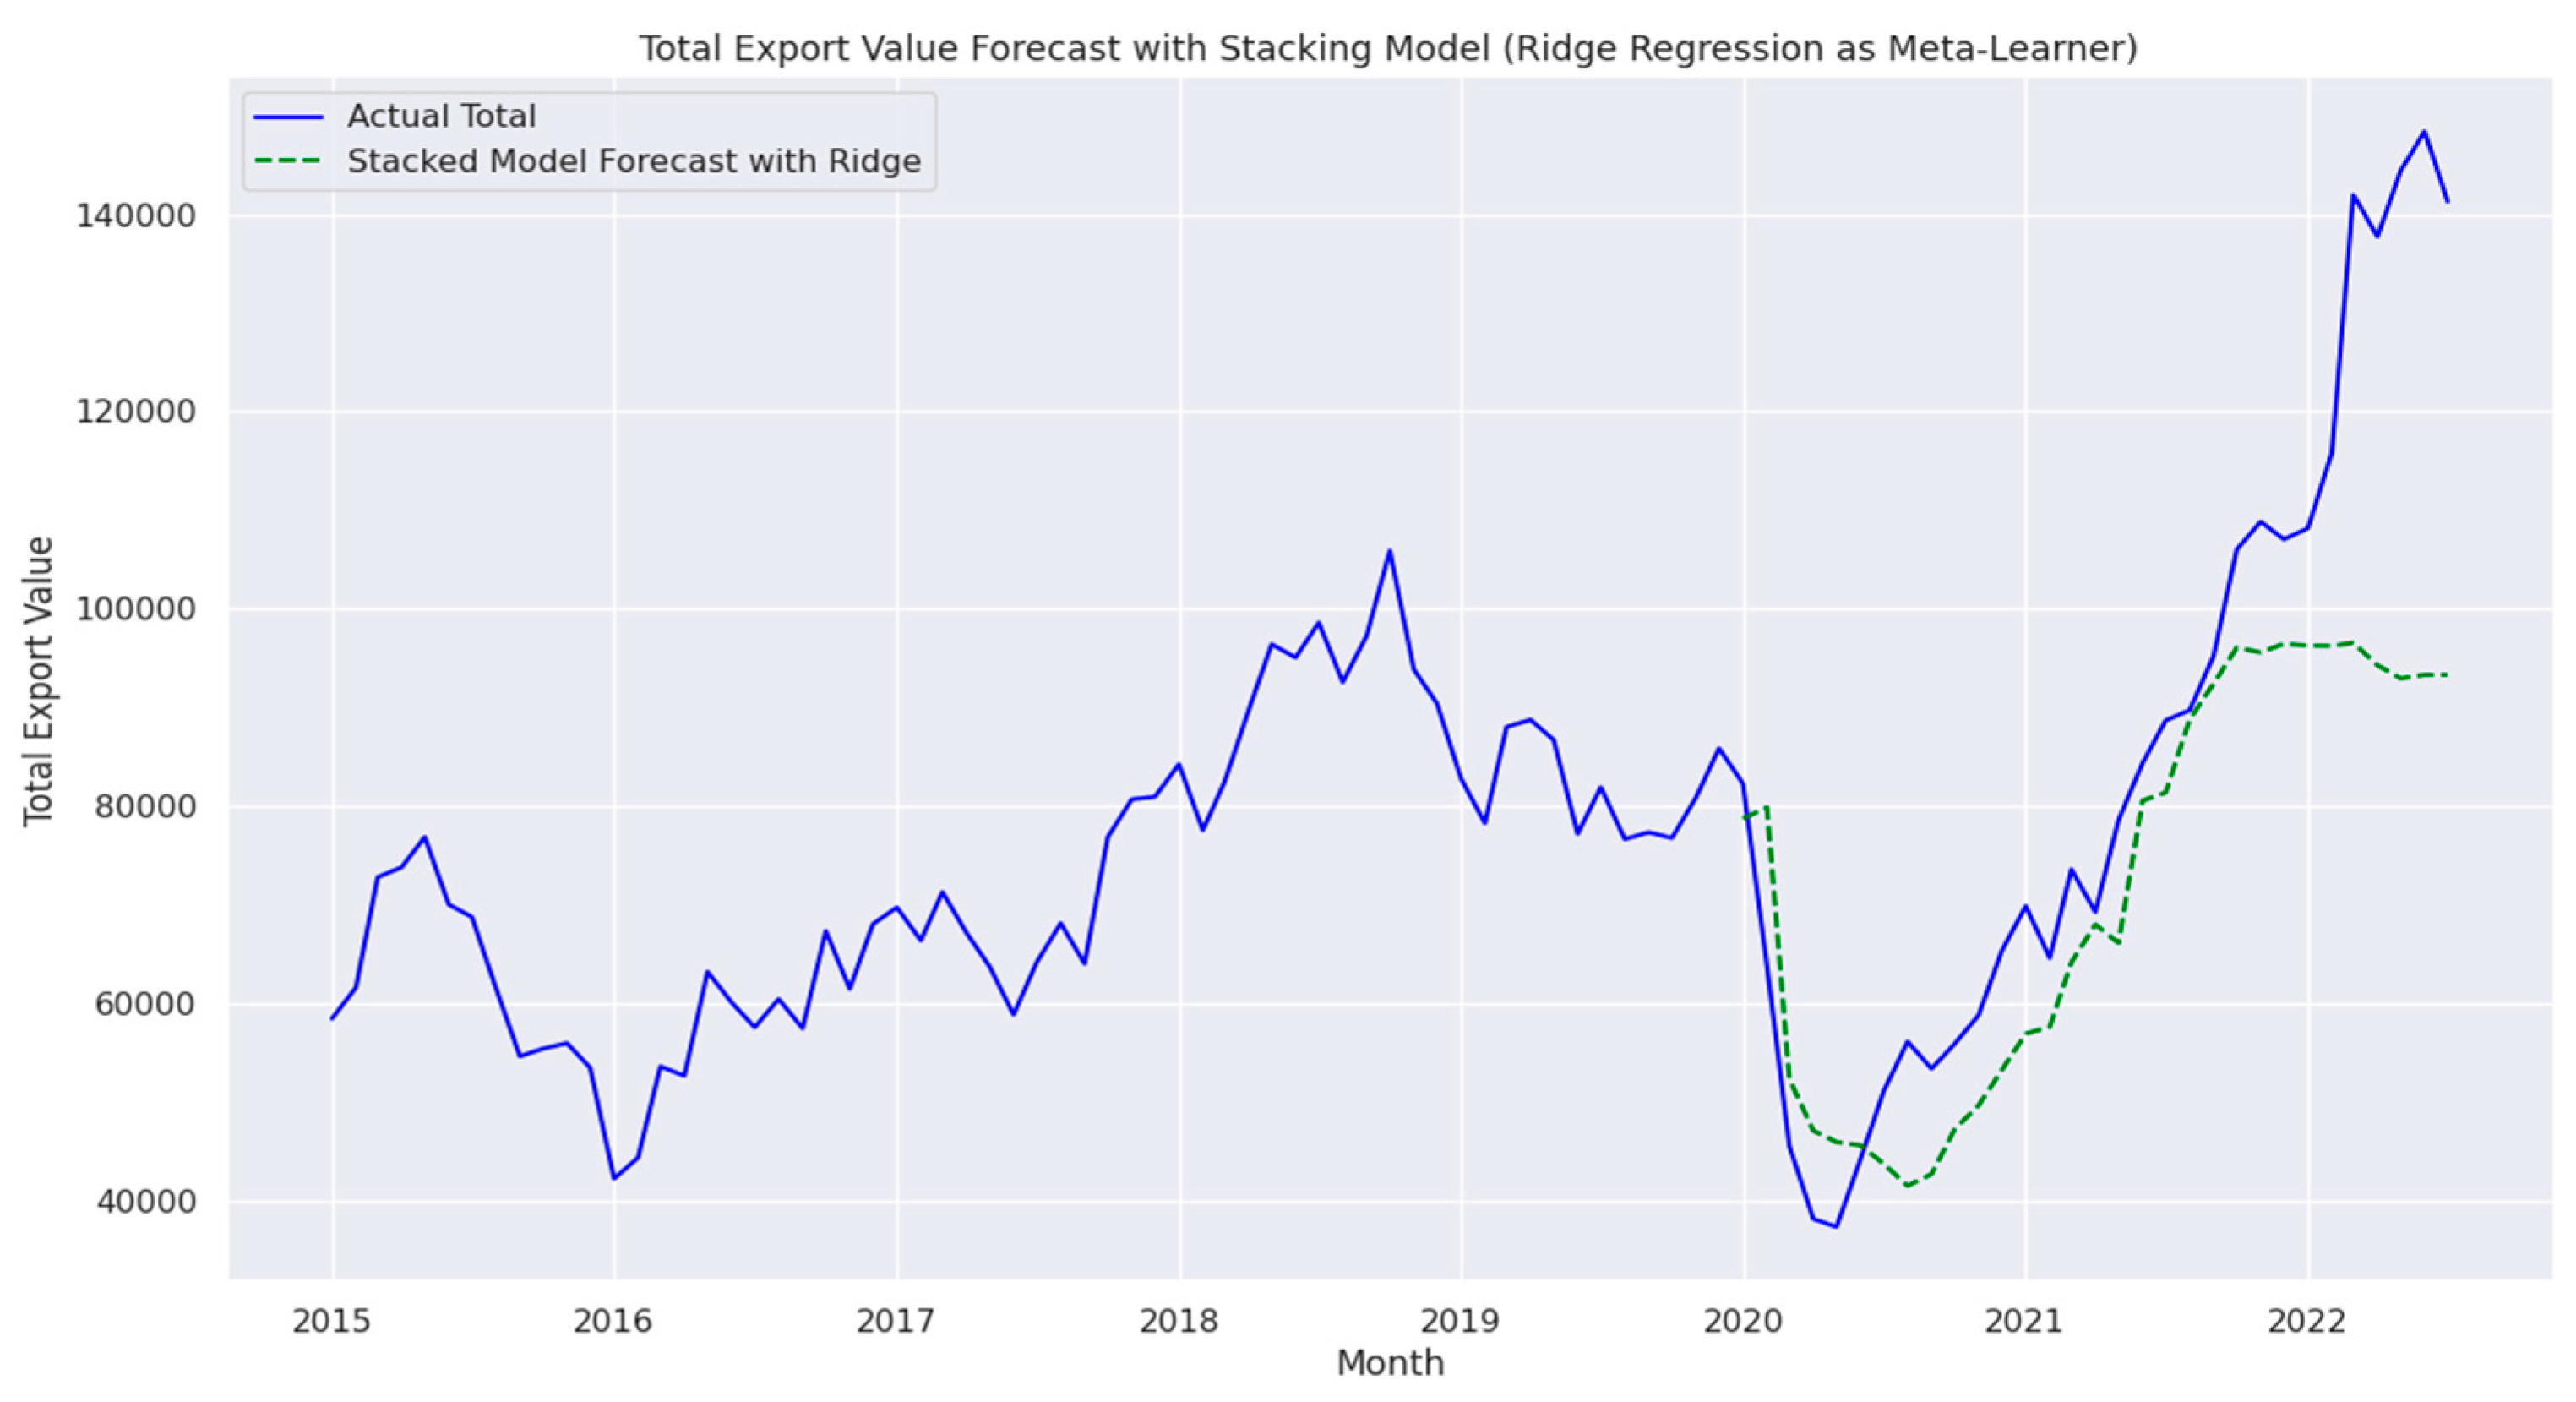
Figure 15.
Total Export Value Forecast with LSTM.
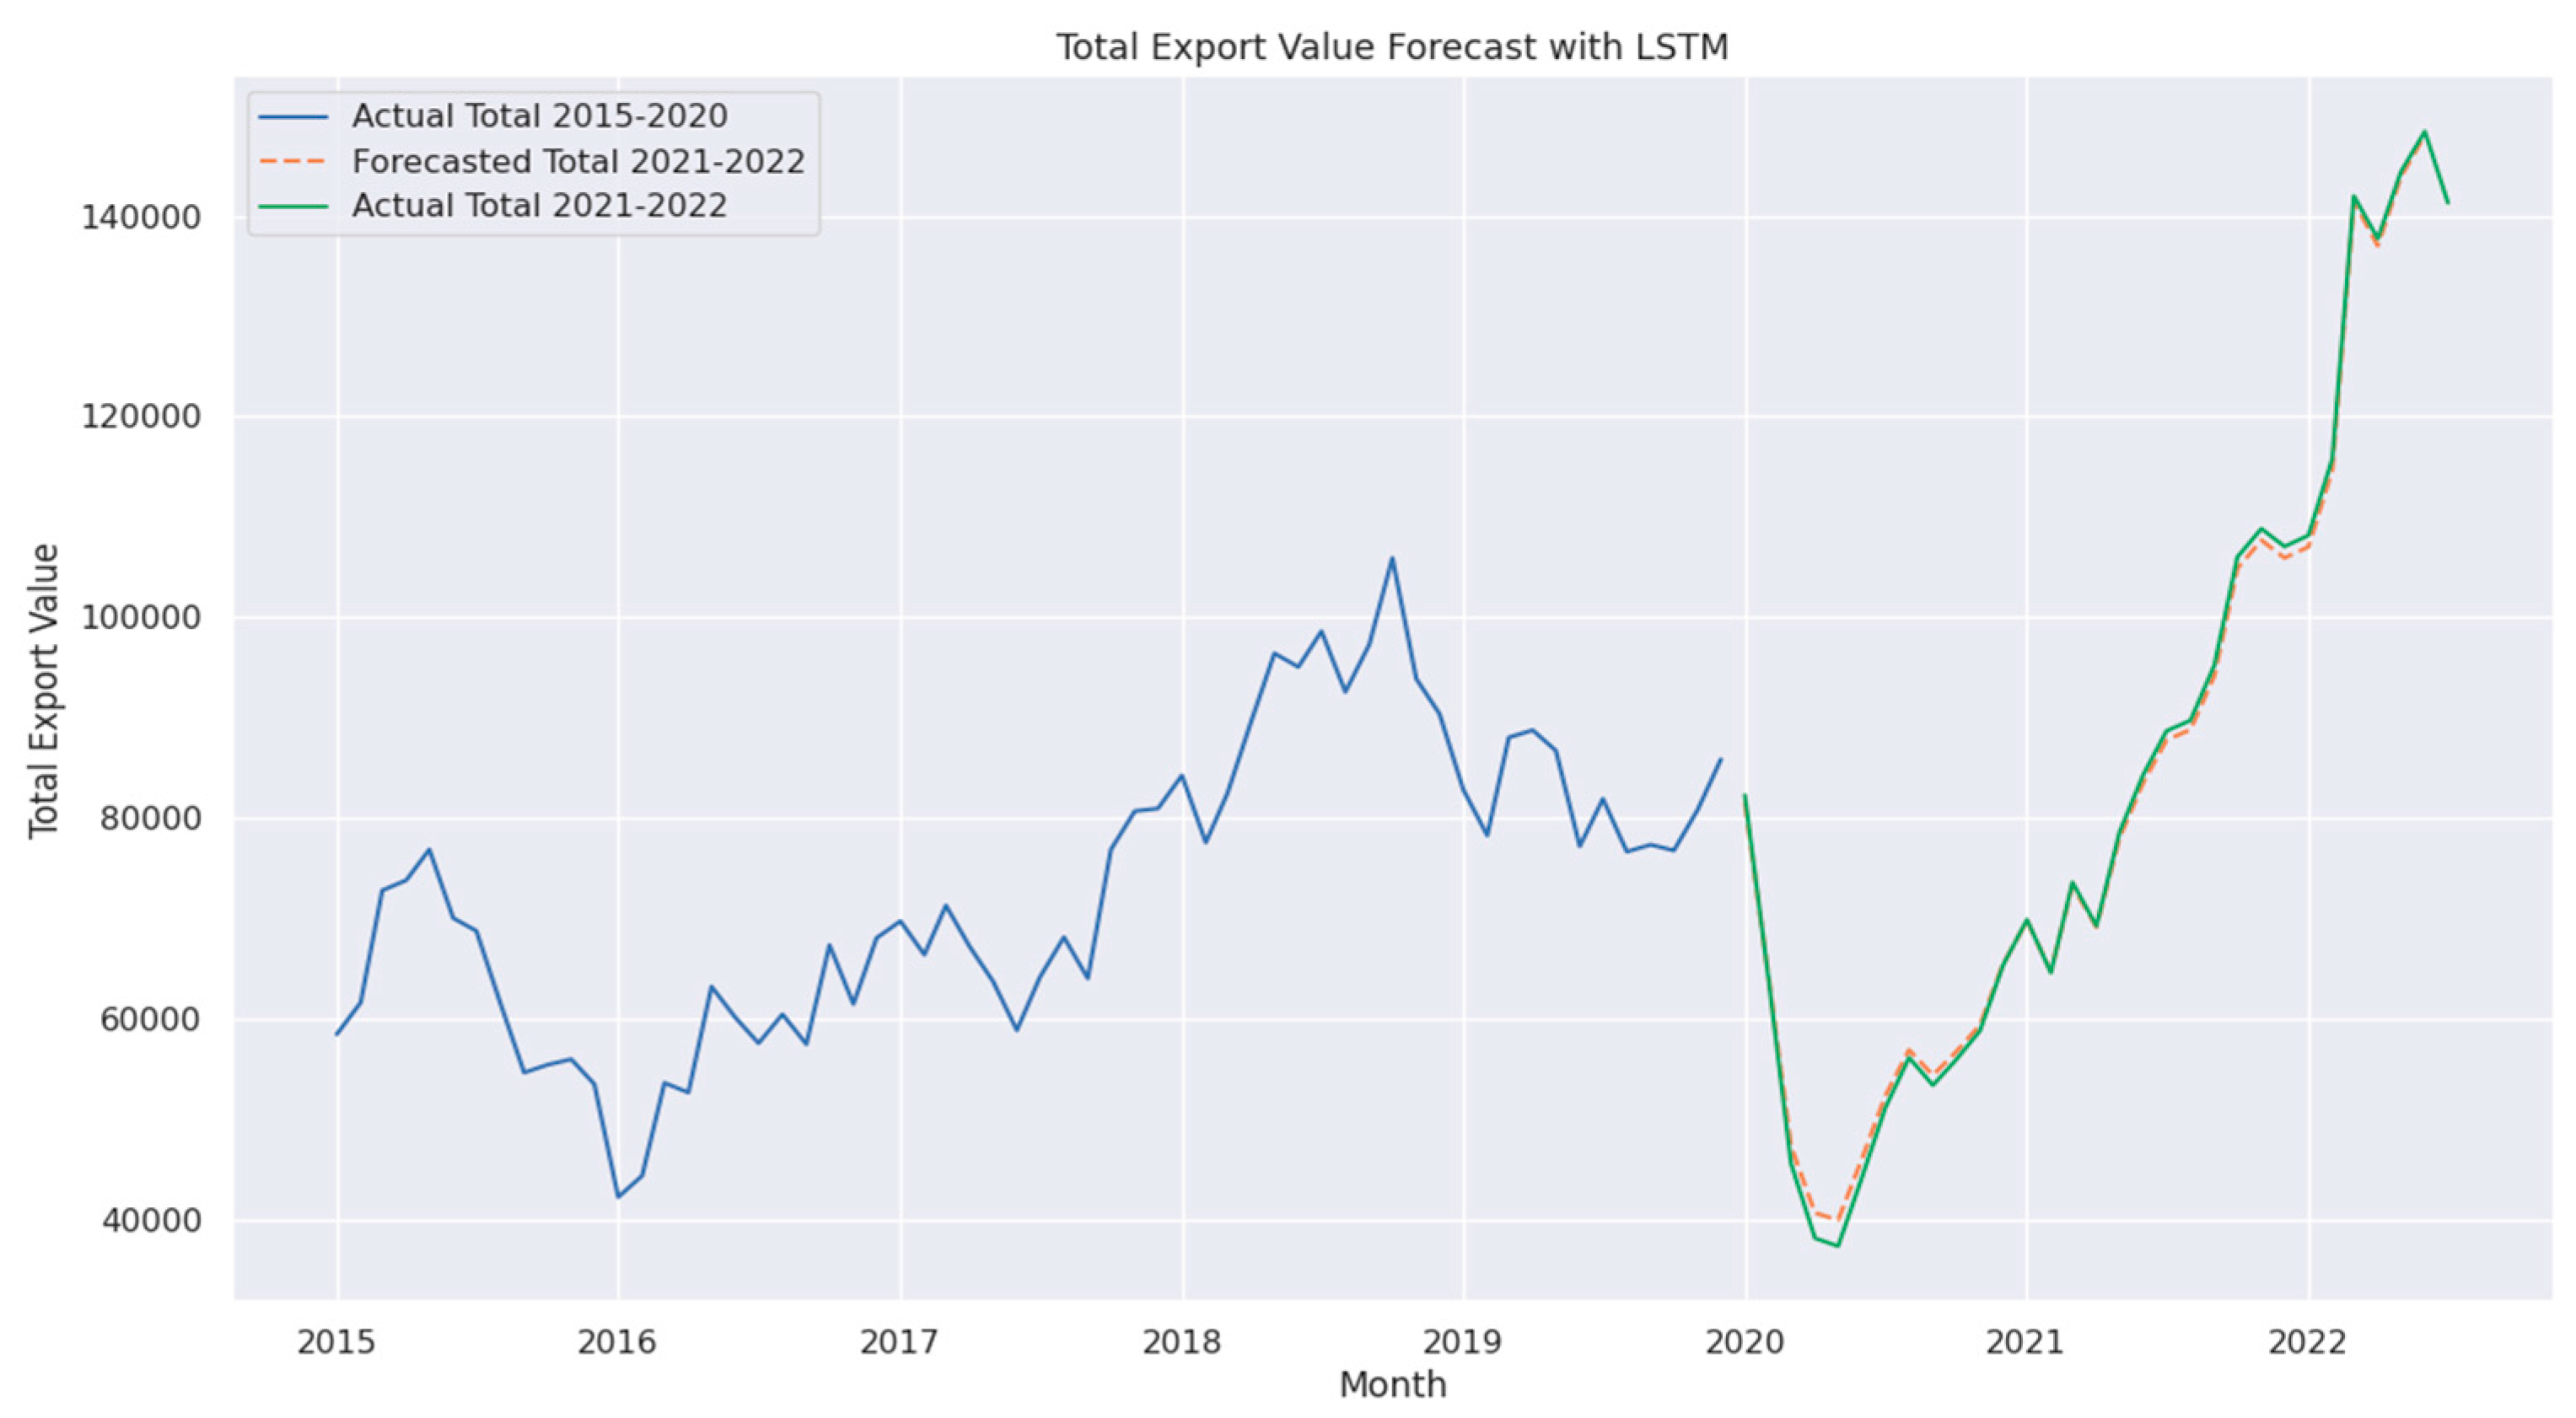
Figure 16.
Total Export Value Forecast with Deep LSTM.
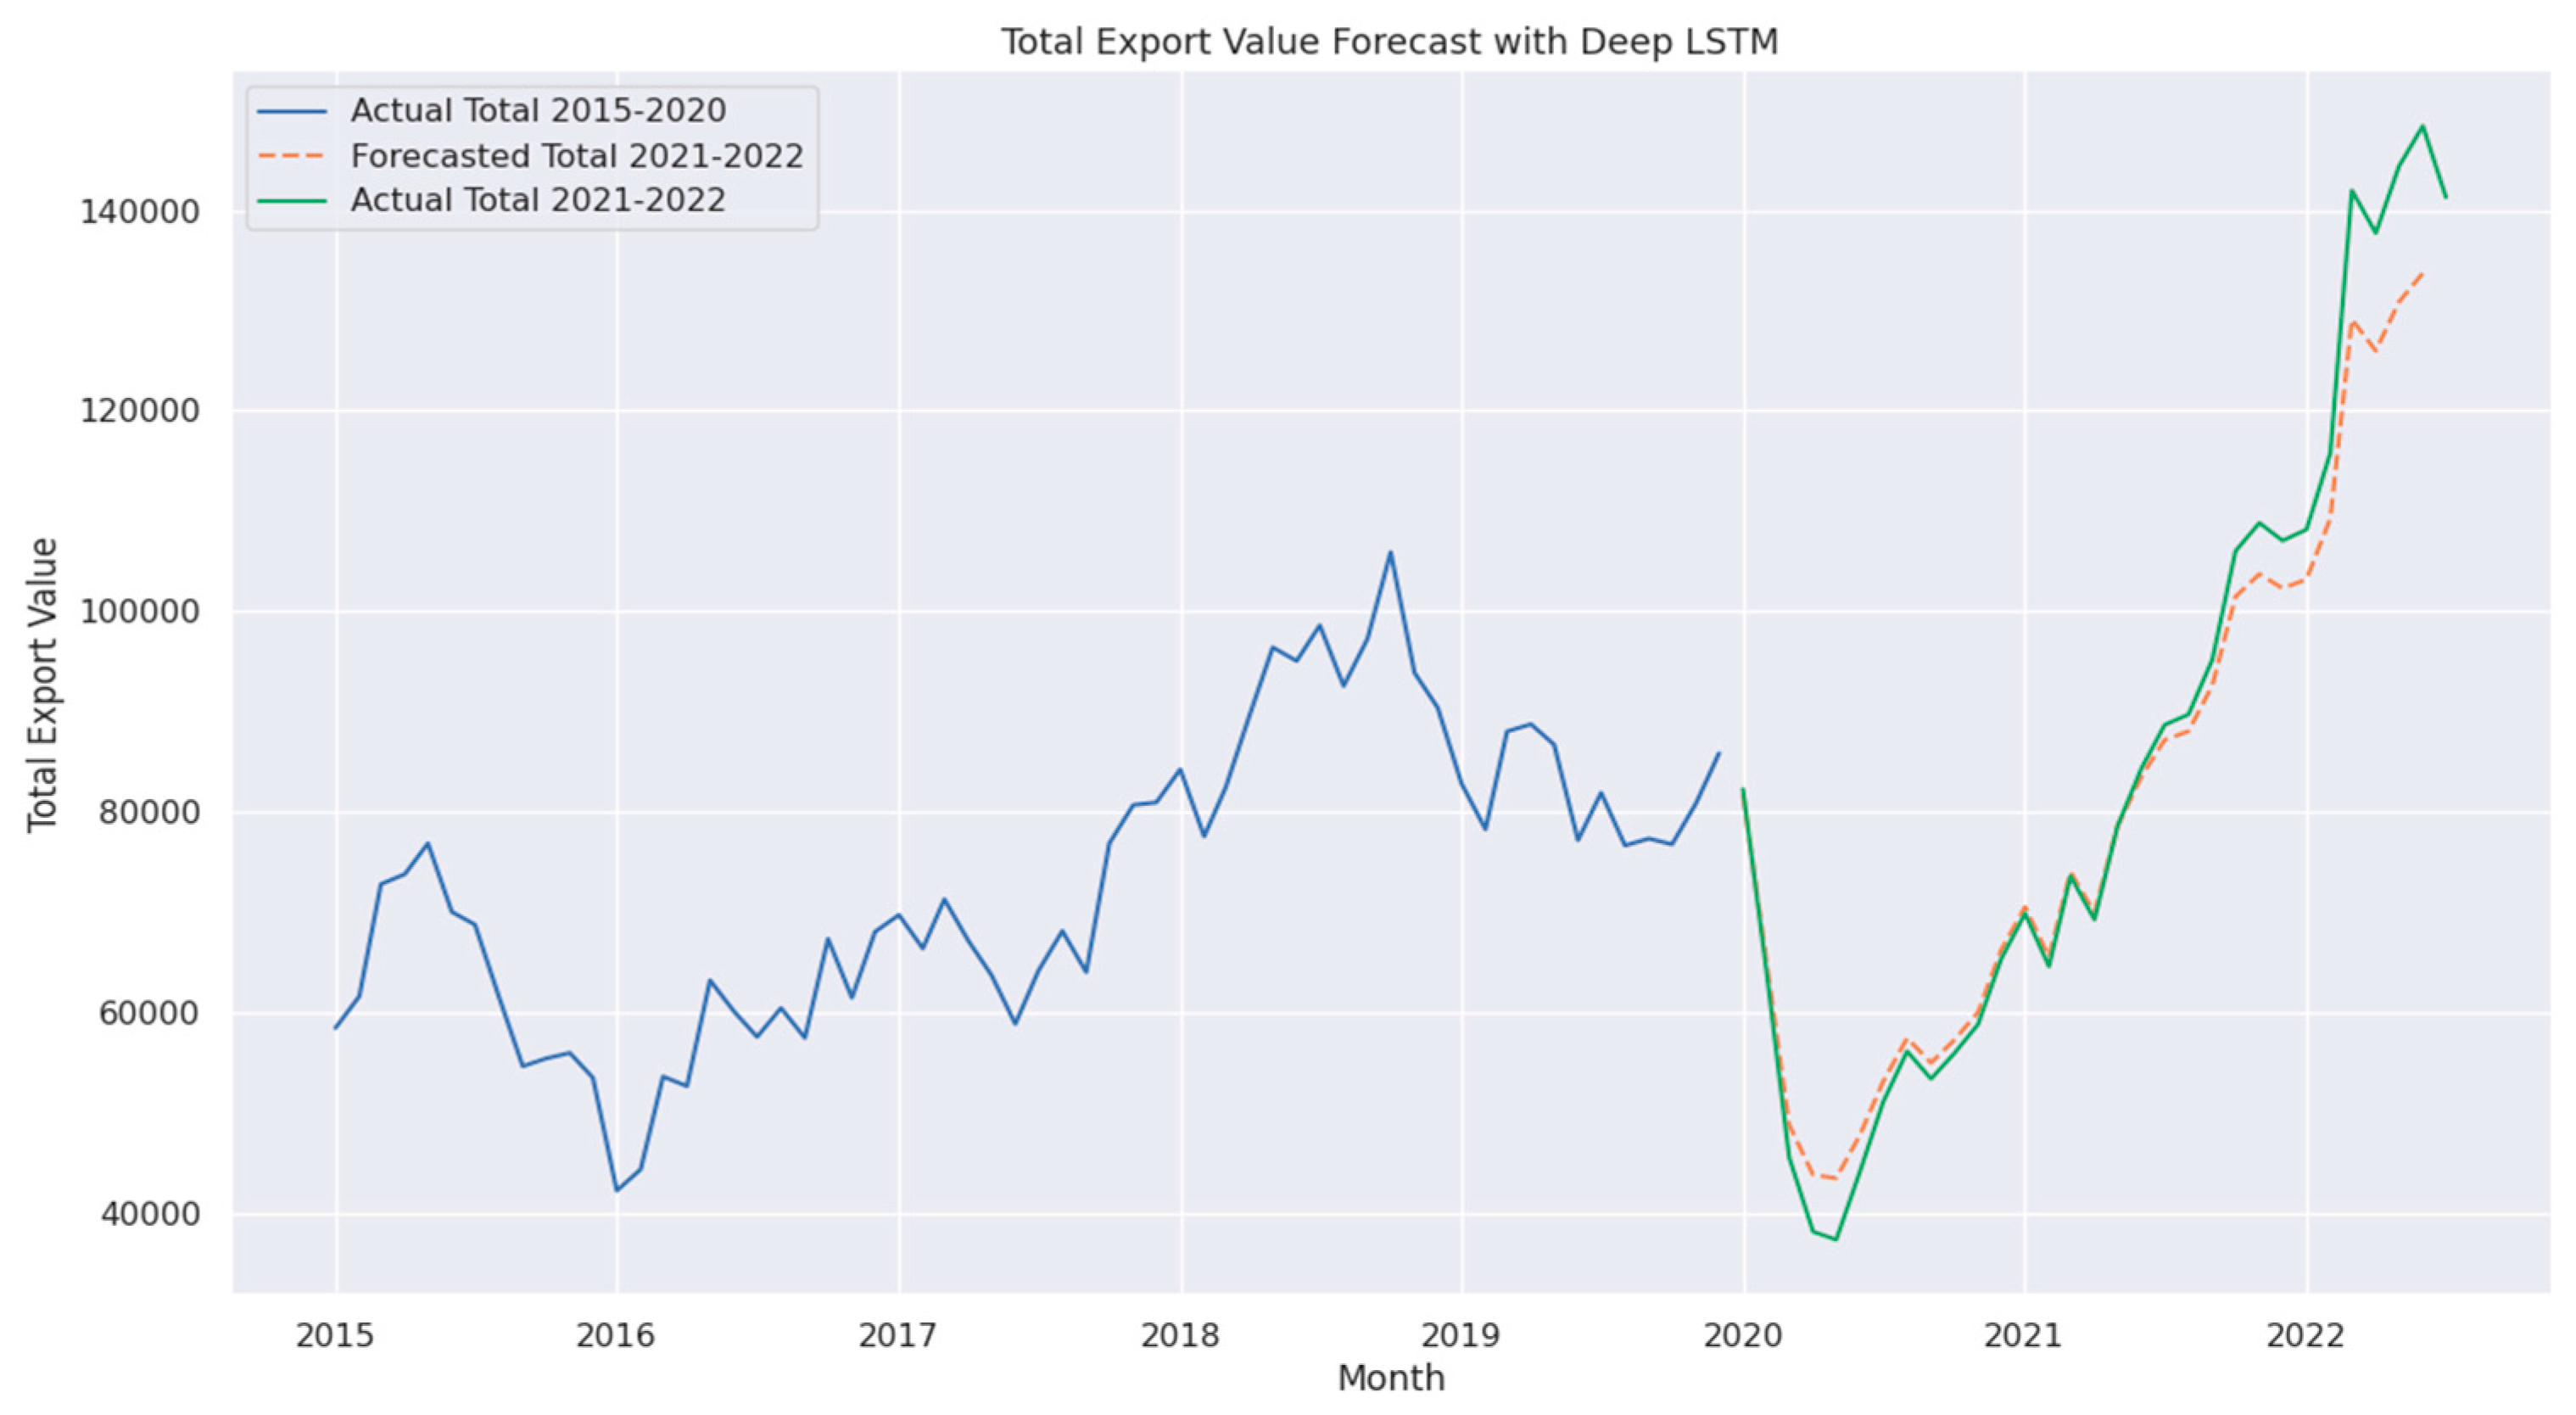
Figure 17.
Total Export Value Forecast with Random Forest.
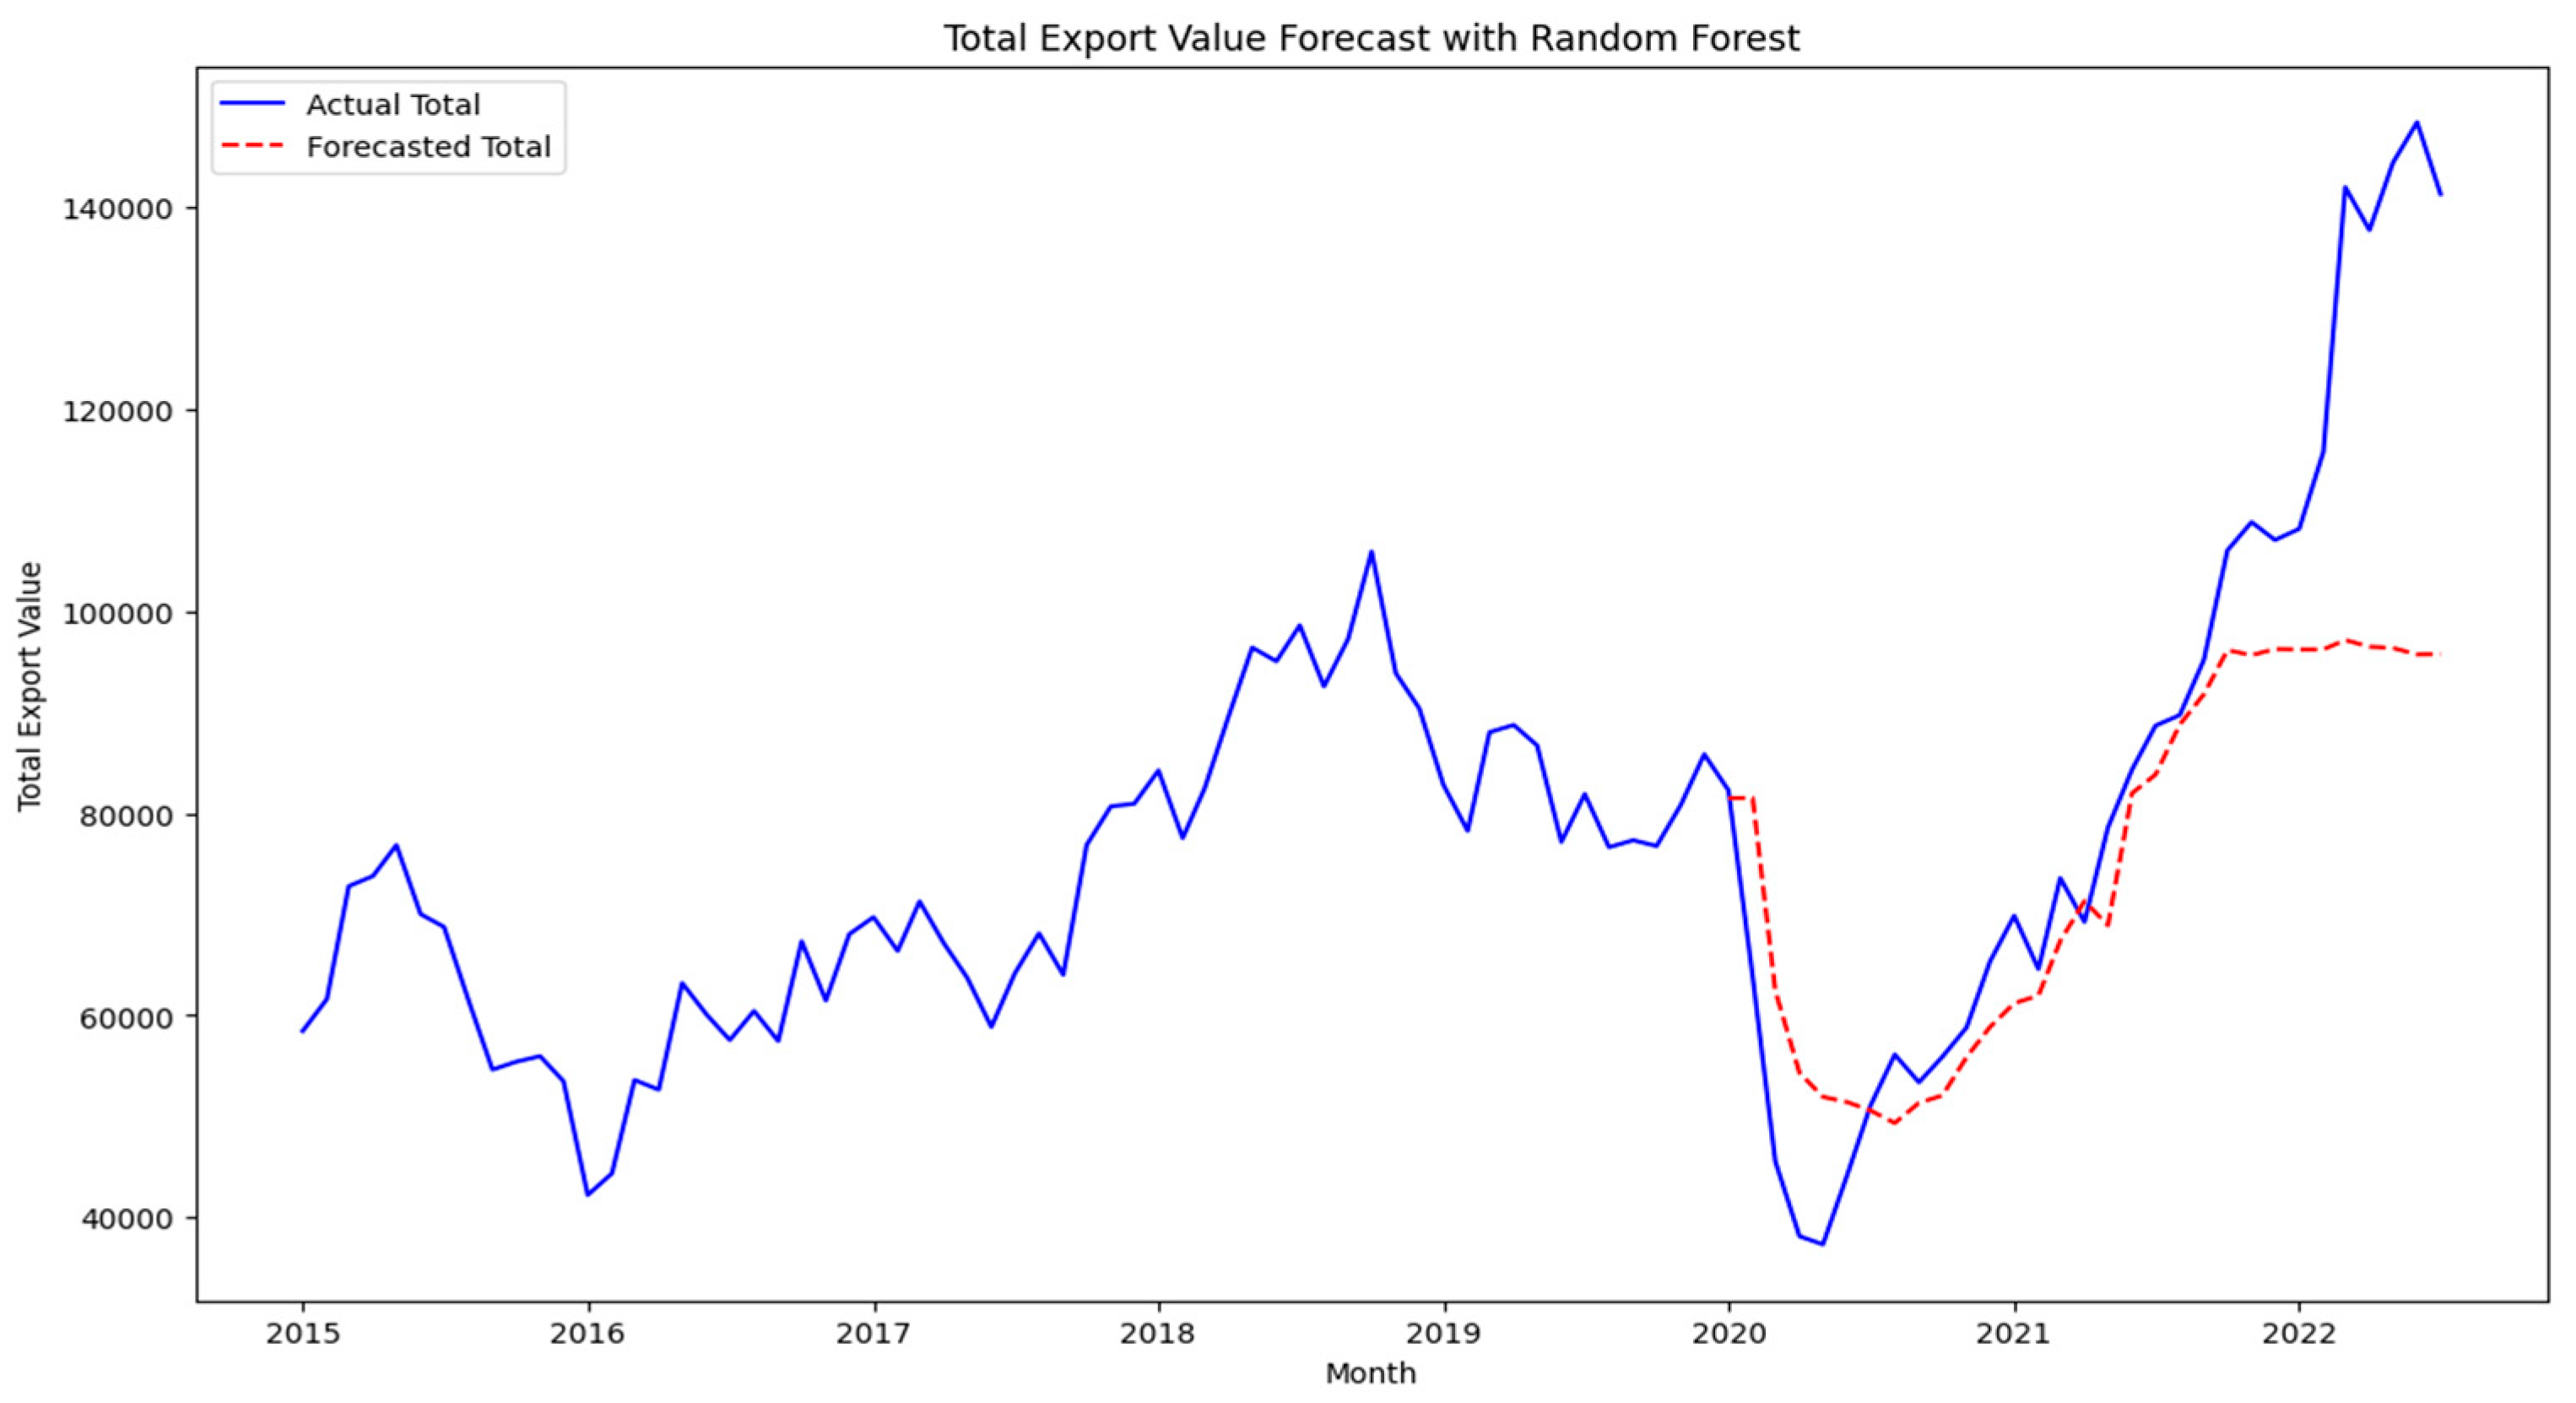
Figure 18.
Total Export Value Forecast with XGBoost.
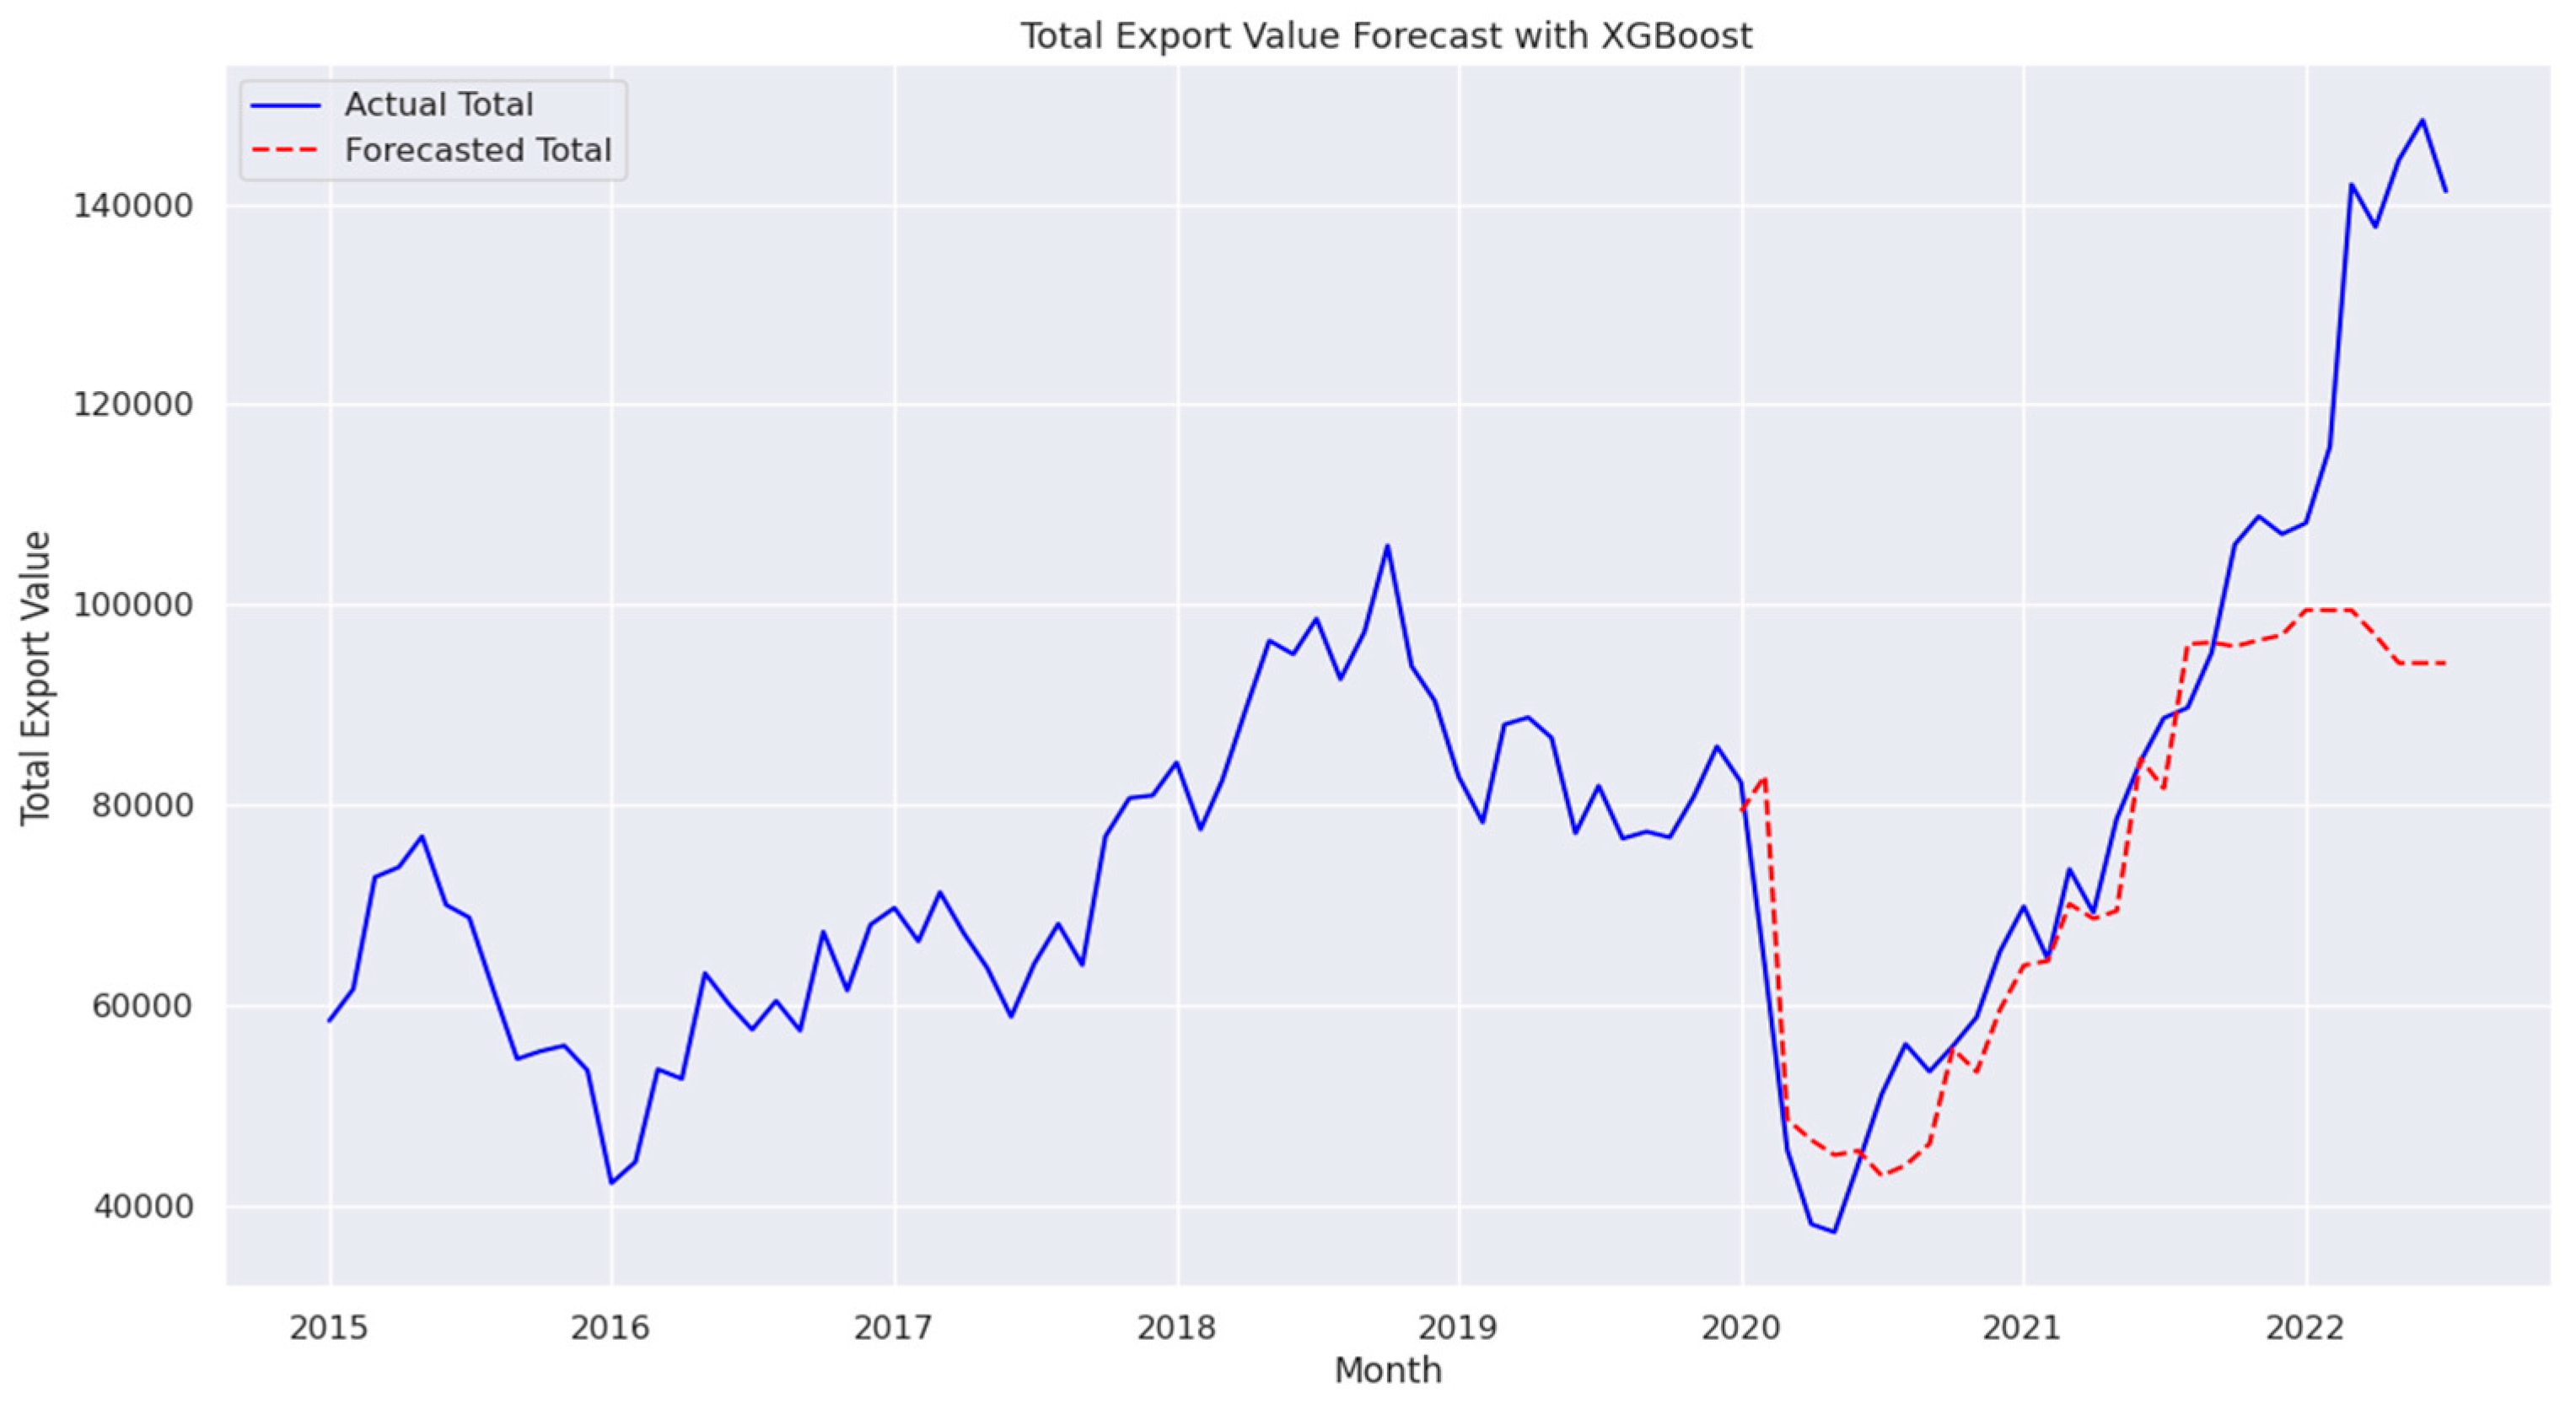
Figure 19.
Total Export Value Forecast with AdaBoost Regressor.
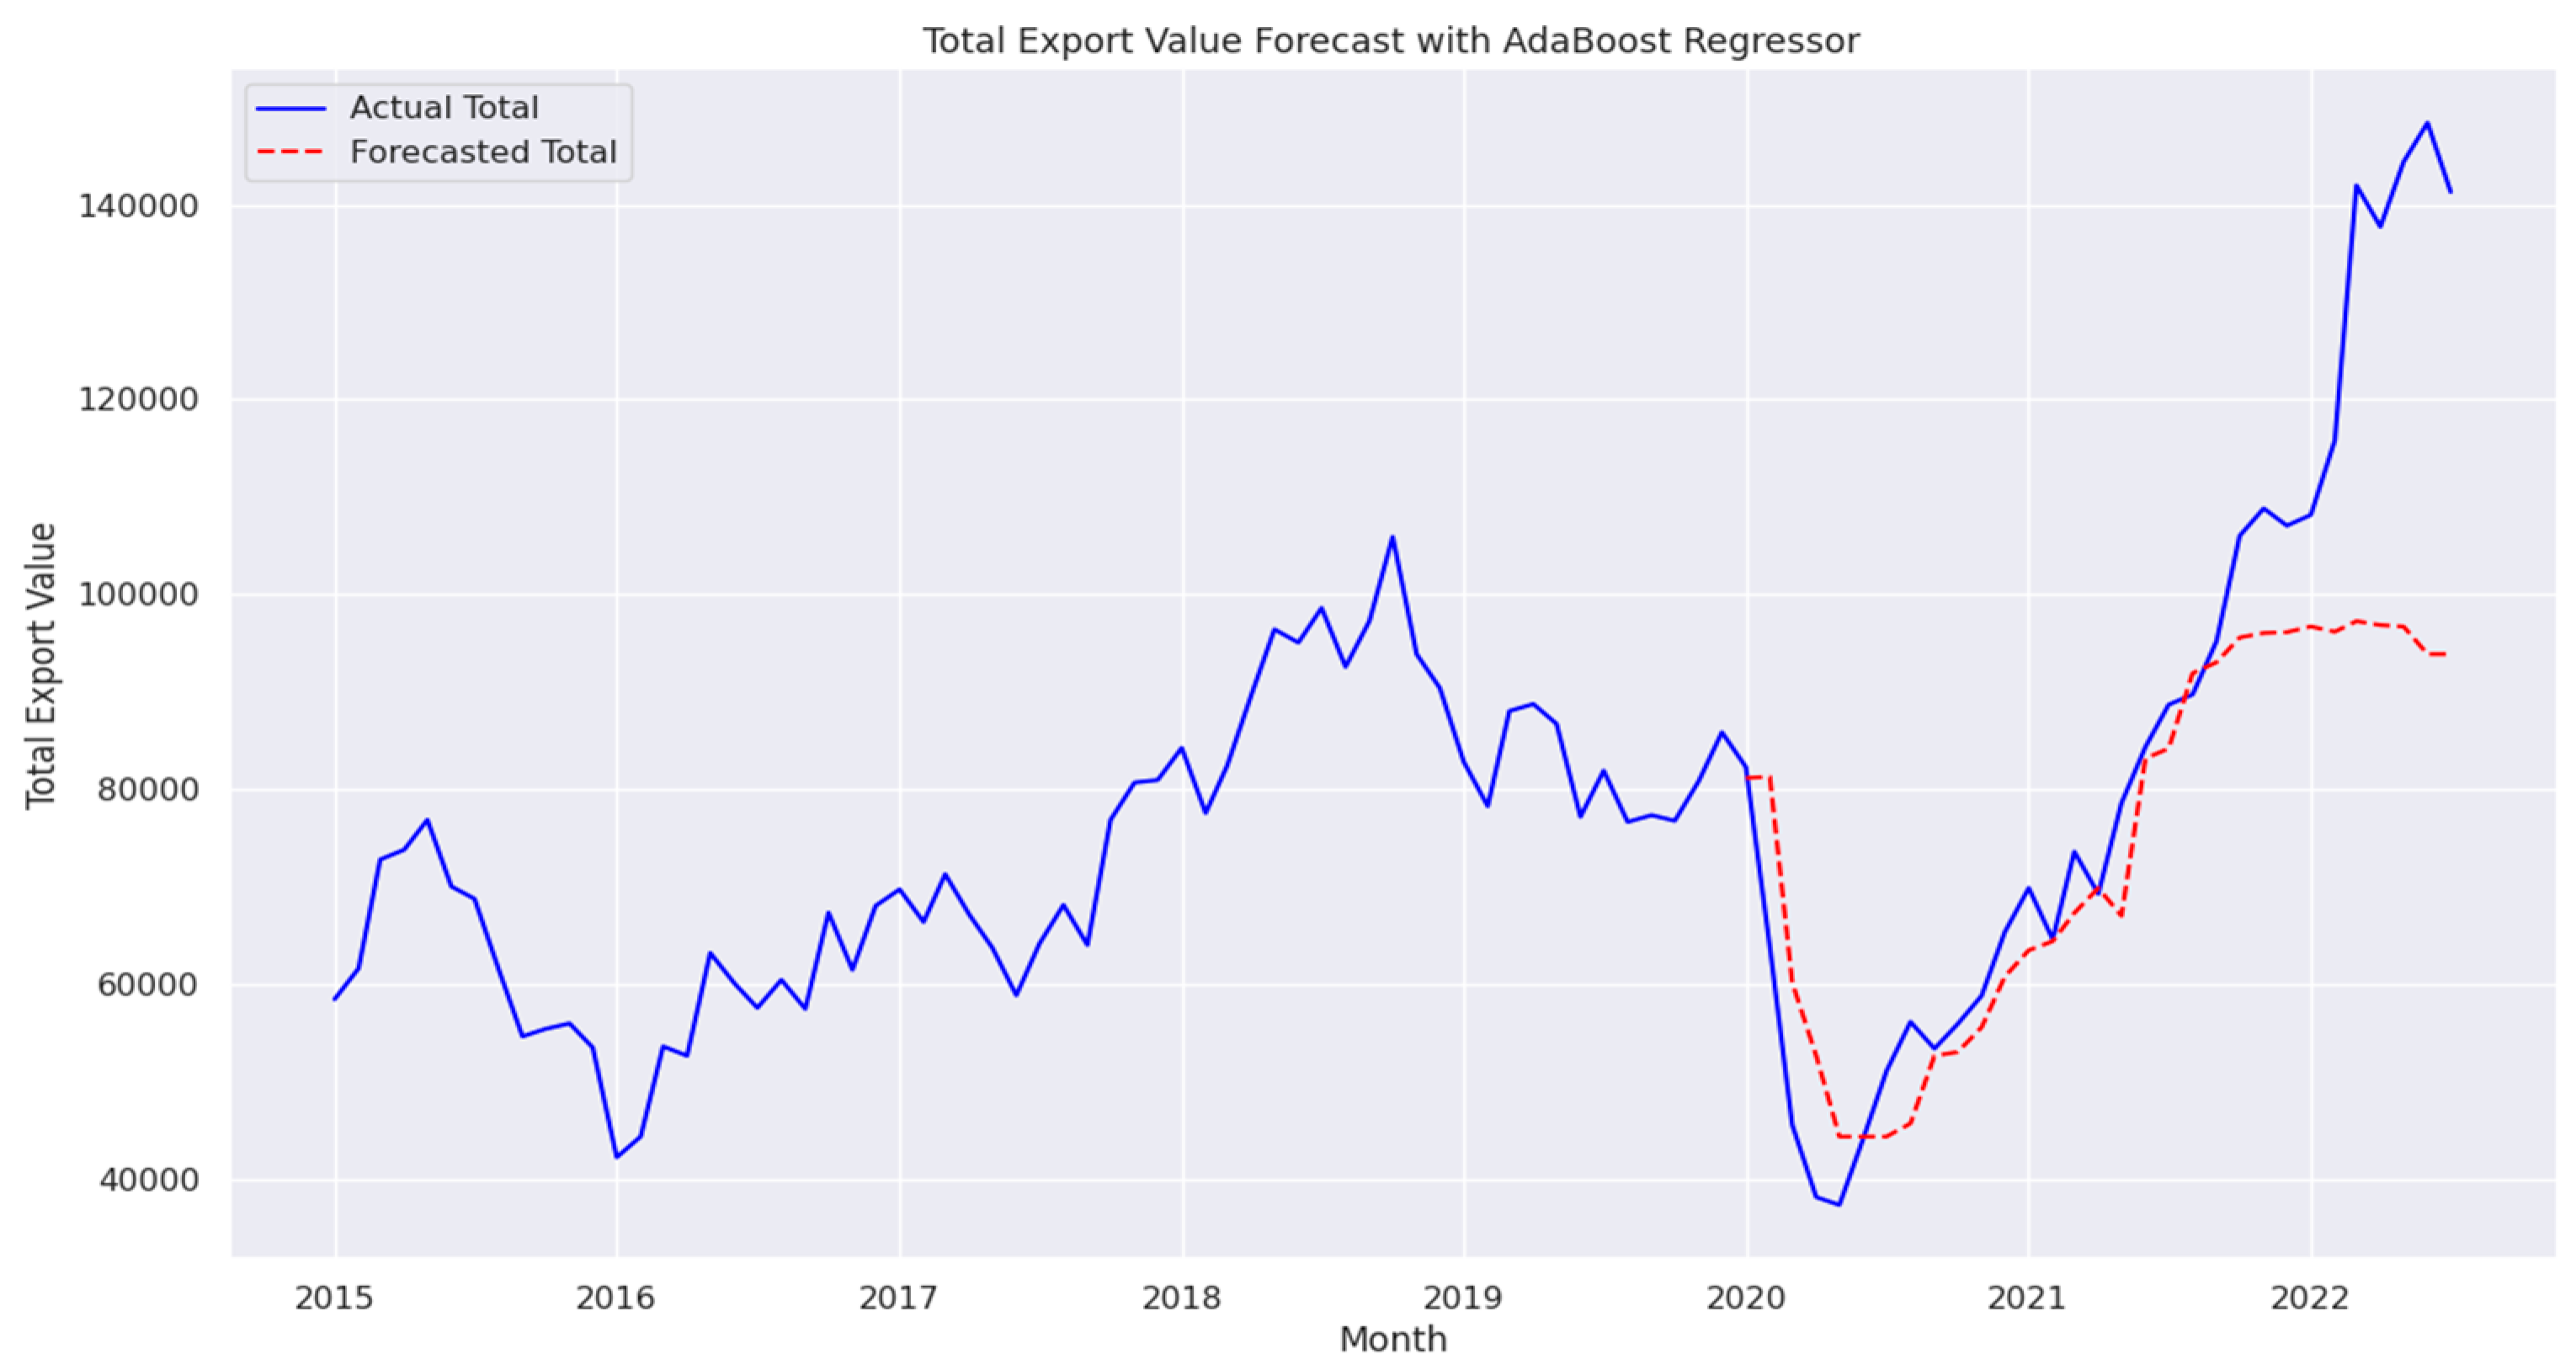
Figure 20.
Total Export Value Forecast with Transformer including GDP Data.
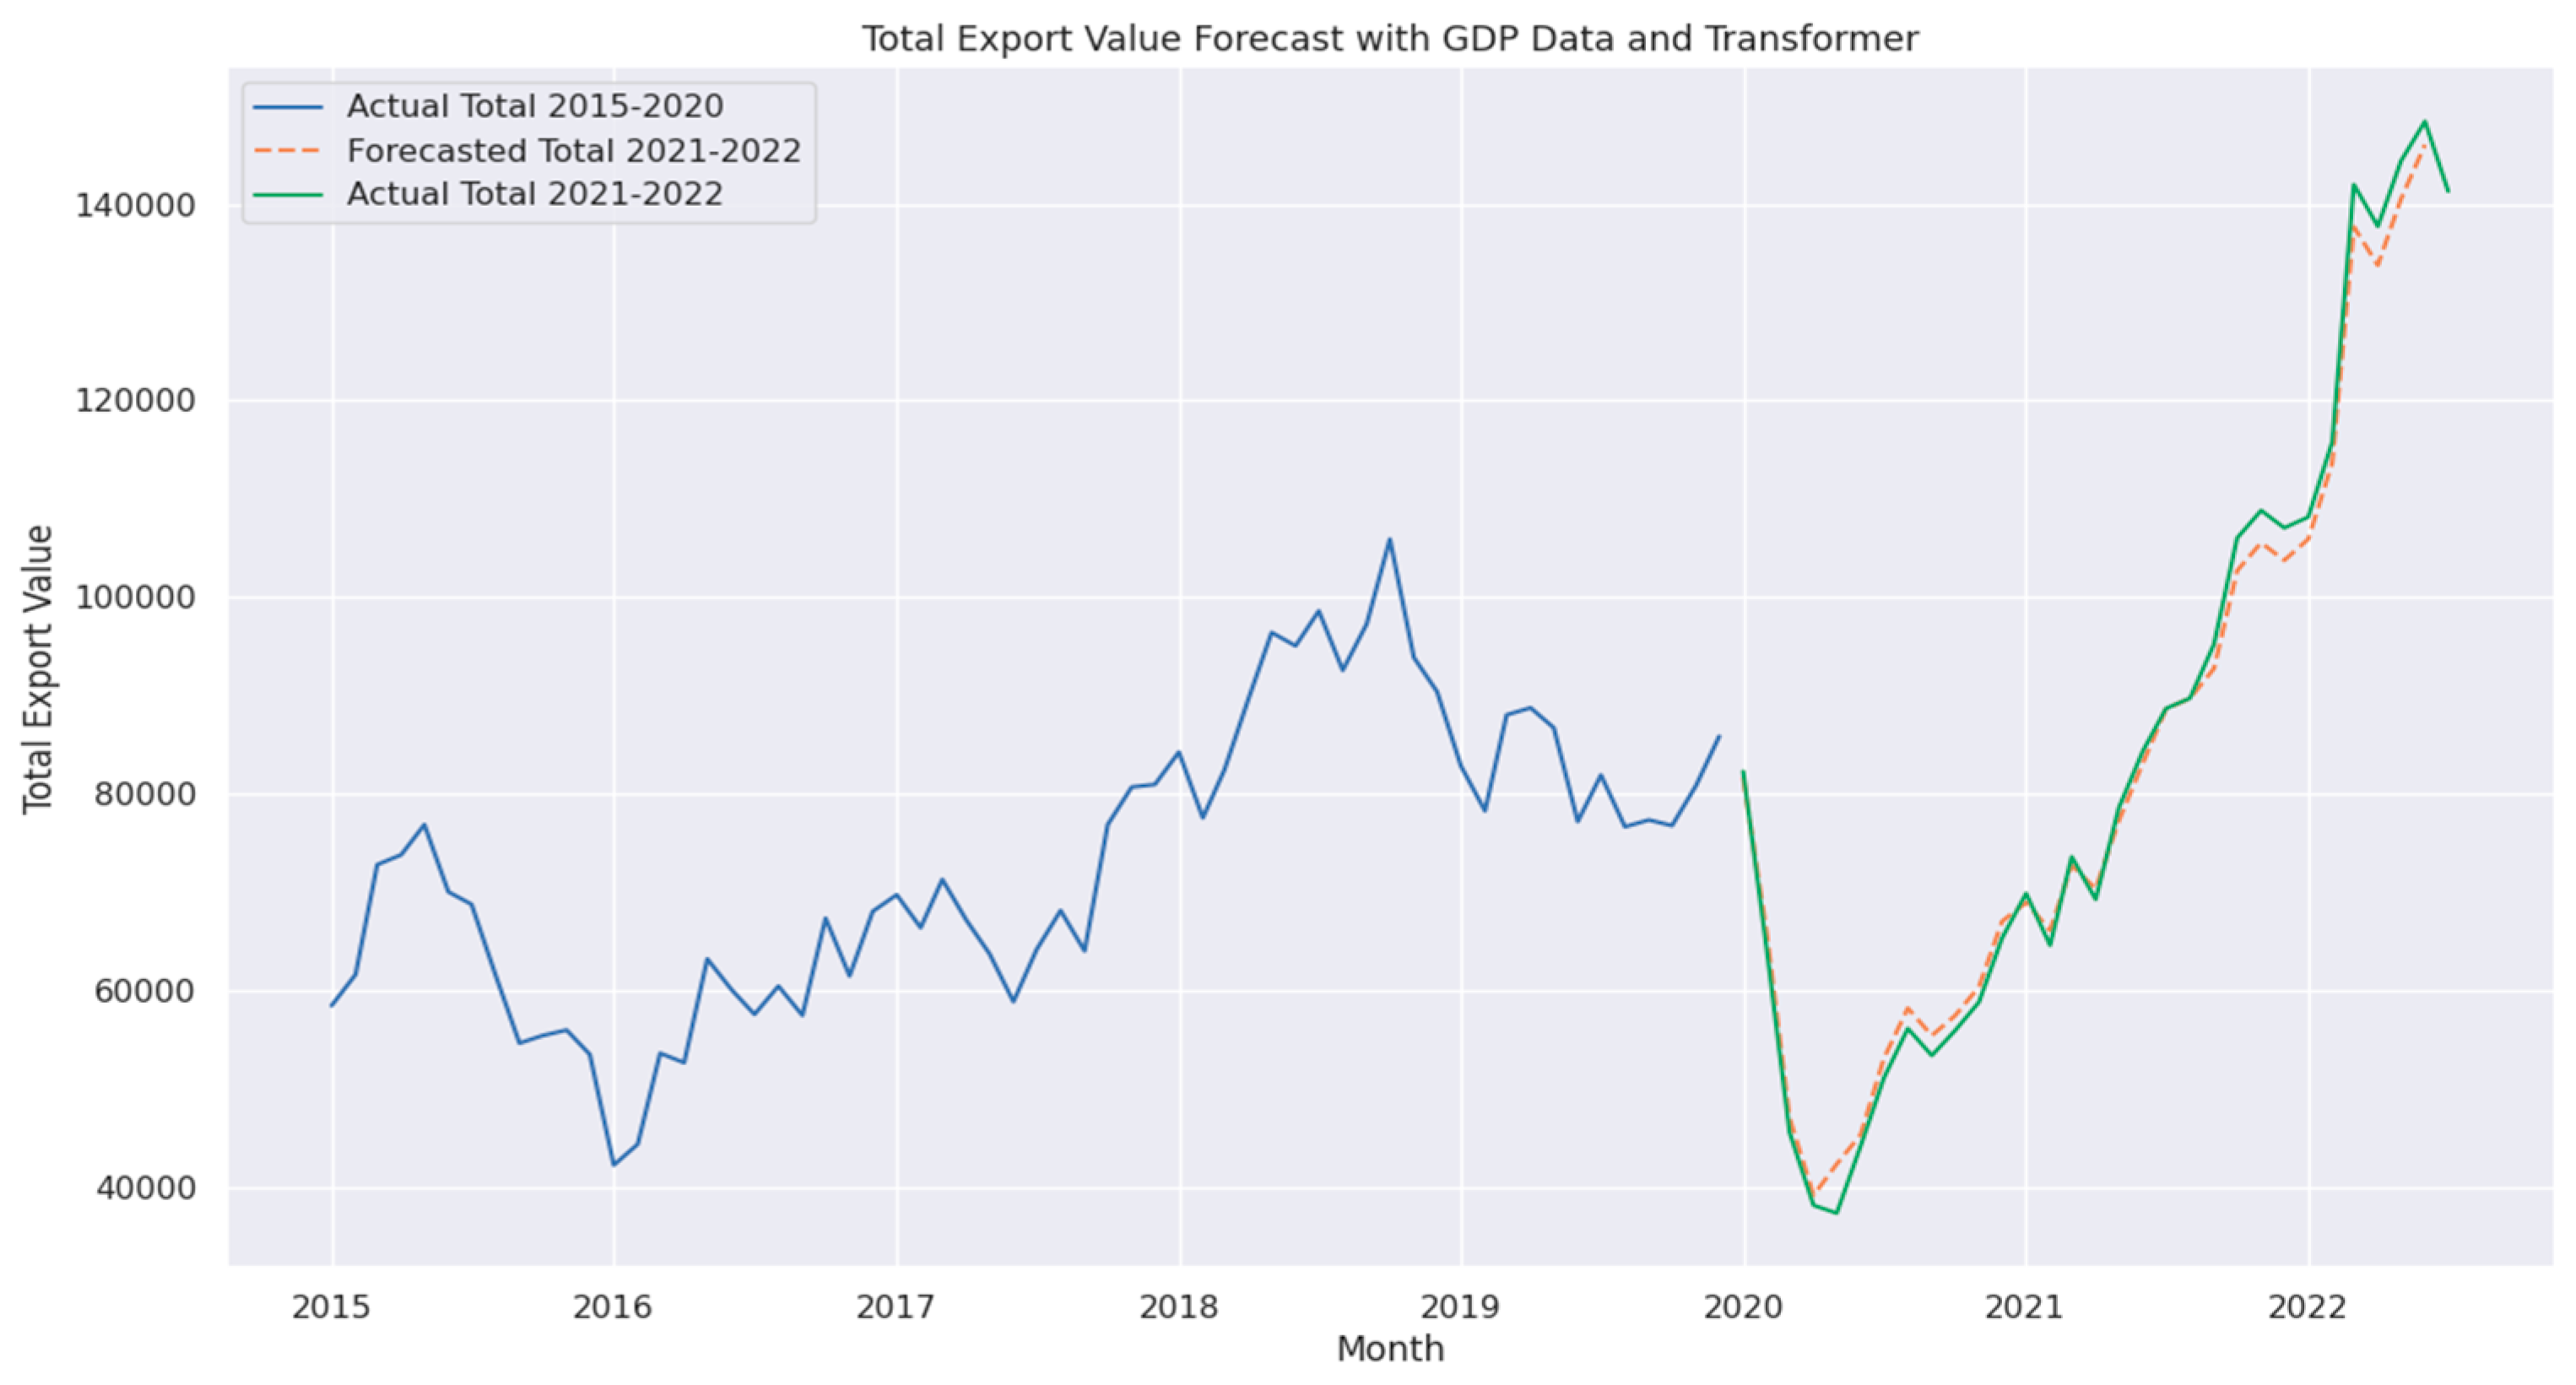

Table 1.
Performance metrics for different forecasting models.
| Model | MSE | RMSE | MAD | MAPE |
| Advanced Transformer | 246,510 | 496 | 452 | 0.73% |
| Transformer | 259,862 | 509 | 482 | 0.76% |
| Ensemble Blending | 1,698,952 | 2,130 | 931 | 1.23% |
| LSTM | 1,180,754 | 1,086 | 892 | 1.44% |
| Transformer with GDP | 5,474,217 | 2,339 | 2,000 | 2.67% |
| Deep LSTM | 31,972,707 | 5,654 | 3,884 | 4.519% |
| TFT with GDP | 80,225,739 | 8,956 | 5,395 | 5.48% |
| XGBRegressor | 416,618,498 | 20,411 | 13,155 | 13.36% |
| AdaBoostRegressor | 428,840,065 | 20,708 | 13,515 | 14.10% |
| Random Forest | 428,208,024 | 20,693 | 14,008 | 15.39% |
| Ensemble Stacking | 469,002,748 | 21,656 | 15,301 | 16.45% |
Disclaimer/Publisher’s Note: The statements, opinions and data contained in all publications are solely those of the individual author(s) and contributor(s) and not of MDPI and/or the editor(s). MDPI and/or the editor(s) disclaim responsibility for any injury to people or property resulting from any ideas, methods, instructions or products referred to in the content. |
© 2025 by the authors. Licensee MDPI, Basel, Switzerland. This article is an open access article distributed under the terms and conditions of the Creative Commons Attribution (CC BY) license (http://creativecommons.org/licenses/by/4.0/).
Copyright: This open access article is published under a Creative Commons CC BY 4.0 license, which permit the free download, distribution, and reuse, provided that the author and preprint are cited in any reuse.


