1. Introduction
High school (HS) computer science (CS) courses are a primary tool to provide necessary knowledge and skills to students. These courses serve to both encourage and prepare students to pursue future CS-related opportunities, both in college and beyond (Armoni & Gal-Ezer, 2022). Over the past decade in the U.S., major public investment and educational policy have worked to expand access to K-12 computer science education (CSE), and evidence suggests that progress has been made. For example, 60% of high schools in the US offered a foundational computer science course in the 2023-2024 school year, a stark increase from just 35% 6 years before (Code.org et al., 2024). Yet, long-term underrepresentation of females, Black and Hispanic students, and economically disadvantaged students across all stages of the CS pipeline continues to persist (Chan et al., 2022; Freeman et al., 2024; L. Jaccheri et al., 2020; National Academies of Sciences & Medicine, 2024). Recent national data reveals that despite representing half of the population, female students made up only 33% of HS CS course-takers in 2024; similarly, Hispanic students account for 29% of the national HS population, but only 20% of CS course-takers (Code.org et al., 2024). When considering AP CS participation, Black students accounted for only 4% of AP CS exams in 2019, Hispanic students 12%, and females 24% (Wyatt et al., 2020), all much lower than their share of the population . Further, in schools serving student populations historically underrepresented in CS, AP CS courses have a lower minimum standard for programming skills, potentially impacting students’ acquisition of transferable skills for future study and employment (Sax et al., 2022).
Taken together, this suggests that access to CSE in HS is a necessary, but not sufficient, step towards broader and more equitable participation of students from historically underrepresented groups (Bruno & Lewis, 2021; Margolis et al., 2012). Recently, research has highlighted the need to more systematically study the interactions among CS access, school context and composition, and subsequent CS participation, and, how taken together, these dynamically shape CS pathways (National Academies of Sciences & Medicine, 2024). Such research could uncover the mediators of CS participation for different types of learners, in different kinds of schools, with access to different kinds of courses. In turn, findings could inform changes to policy and practice to support the recruitment, engagement, and retention of underrepresented students into CSE pathways.
Unfortunately, data compatible with such robust analyses are not readily available. Current research relies heavily on publicly available educational data. Although data of this kind is suitable for capturing access to CSE (such as CS course availability), it is typically aggregated, both (a) within schools, inhibiting analyses of specific student groups or their intersections, and (b) across schools, clouding any insight into student CSE participation, since school-to-school variations cannot be disentangled without dis-aggregated, student-level data. For example, Code.org et al. (2024) show that Hispanic students make up 29% of the U.S. HS student body, but only 20% of CS course-takers. This provides evidence for a national skew in CS participation, but cannot make sense of CSE participation on smaller scales (such as individual schools, districts, or states).
Research often looks at the collection of all CS enrollments from year to year, comparing the demographic makeup of students enrolled in CS courses with overall populations. Although an informative approach, this is not a strong analytical match to the fluid and rapidly evolving CSE spaces that are studied, where curricular changes, teacher turnover, and evolving policies impact CSE regularly (Adrion et al., 2016; Ni et al., 2024; Pollock et al., 2017). Fluctuations in the year-to-year demographic composition of HS CS course-takers could be caused by actual change in student behavior, but this kind of analysis would become compromised over time by changes in course pre-requisites, grade-level eligibility, offering more or fewer sections of courses, changes in staffing, etc. Examining patterns in year-to-year HS CS enrollments offers an imprecise measure; for instance, detecting that 25% of HS students in a particular year achieving 100% is only possible if every HS student (in all grades 9-12) takes a CS course every year, but achieving 25% does not imply that every HS student takes any CS.
A shift in analysis perspective can offer more detail and relevant, actionable findings. Instead of comparing the entire HS student body each year, considering each year’s graduating cohort’s cumulative HS experience offers many benefits. A longitudinal methodology in this vein allows for more nuanced analyses of participation at a student level, can be more easily studied alongside its interplay with access, which enables researchers to identify impactful shifts in school CSE policy and capacity. This level of granularity would not be possible when considering the entire HS student population each year, as course and policy changes do not impact all students equally (say, by grade level). A cohort-based analysis, on the other hand, groups students that are more equally affected by policy shifts.
Despite a growing need to more carefully examine student participation in CS, and a methodology that could frame those analyses, there is a shortage of data and research that explores CS participation in this way and considers how it evolves, both generally and for different student populations (particularly by gender and race). This study aims to address this gap by collecting and analyzing longitudinal academic data and tracking CSE in three cohorts of HS students at six large suburban schools in the northeastern U.S. Each of the six participating schools regularly offers CS courses, which allows us to interpret participation more independently of access. Additionally, in each of the schools, the numbers, names, and types of courses offered each year varies, which offer school policy/capacity shifts that can be later matched and associated with changes in participation. Such fluctuations are commonplace in CSE; this approach, and its findings, will be applicable beyond the scope of the studied sample of schools.
2. Data and Methods
This study utilizes student-level administrative data from six public high schools in a northeastern state, collected in accordance with ongoing data-sharing agreements between the district and the University. The sample of students for the present study consists of three cohorts: students who completed high school in the spring of 2022, 2023, or 2024 for which we were able to obtain HS course enrollment data for 9th, 10th, 11th, and 12th grade (N=3,641 students). This selection criterion ensures that within each cohort, all students had the same opportunities to take a CS course(s) during their high school tenure (and students are not “undercounted” for missing years of data). Characteristics of each school and its student population are shown in
Table 1.
Enrollment data was aggregated by school and year to determine the number and type of courses offered to students during each academic year. First, all courses were classified as either “CS” or “not CS” using codes from the School Courses for the Exchange of Data (SCED) classification system (National Forum on Education Statistics, 2023), where a manually verified subset of courses with codes 10 (Information Technology) or 21 (Engineering and Technology) were classified as “CS.” Next, each CS course was classified as either “foundational” or “advanced.” Courses were considered foundational that were introductory and/or level 1 as determined by their course names, levels, and course descriptions (as available). For example, Introductory Programming, Computer Applications, CS Essentials, CS Discoveries, and App Development were considered foundational for this analysis. Courses such as Computer Programming II, AP CSP, AP CSA, Interactive Media and Game Design, Cybersecurity and Computer Networking II, and Programming with Java (with a prerequisite) were considered advanced. Importantly, an “advanced” classification does not necessarily imply that students must complete a foundational course as a prerequisite.
Variables were then created for each student, using enrollment data, to indicate whether the student took at least one CS course, foundational CS course, and advanced CS course at any point during their HS tenure. Then, grouped within their school cohorts (the Class of 2022, 2023, or 2024, hereafter referred to as Co22, Co23, and Co24), CS participation was calculated as the percentage of students within a group (meeting the data inclusion requirement) taking at least one relevant course. Drawing from demographic data, CS participation was also calculated for subgroups of each cohort, such as the percentage of females in the Co22 taking at least one CS course or the proportion of Hispanic students in the Co24 that took an advanced CS course.
All data cleaning, preprocessing, and analyses took place in R (R Core Team, 2024), and additional packages were used to present data and findings (Iannone et al., 2024; Pedersen, 2024; Wickham, 2016).
3. Results
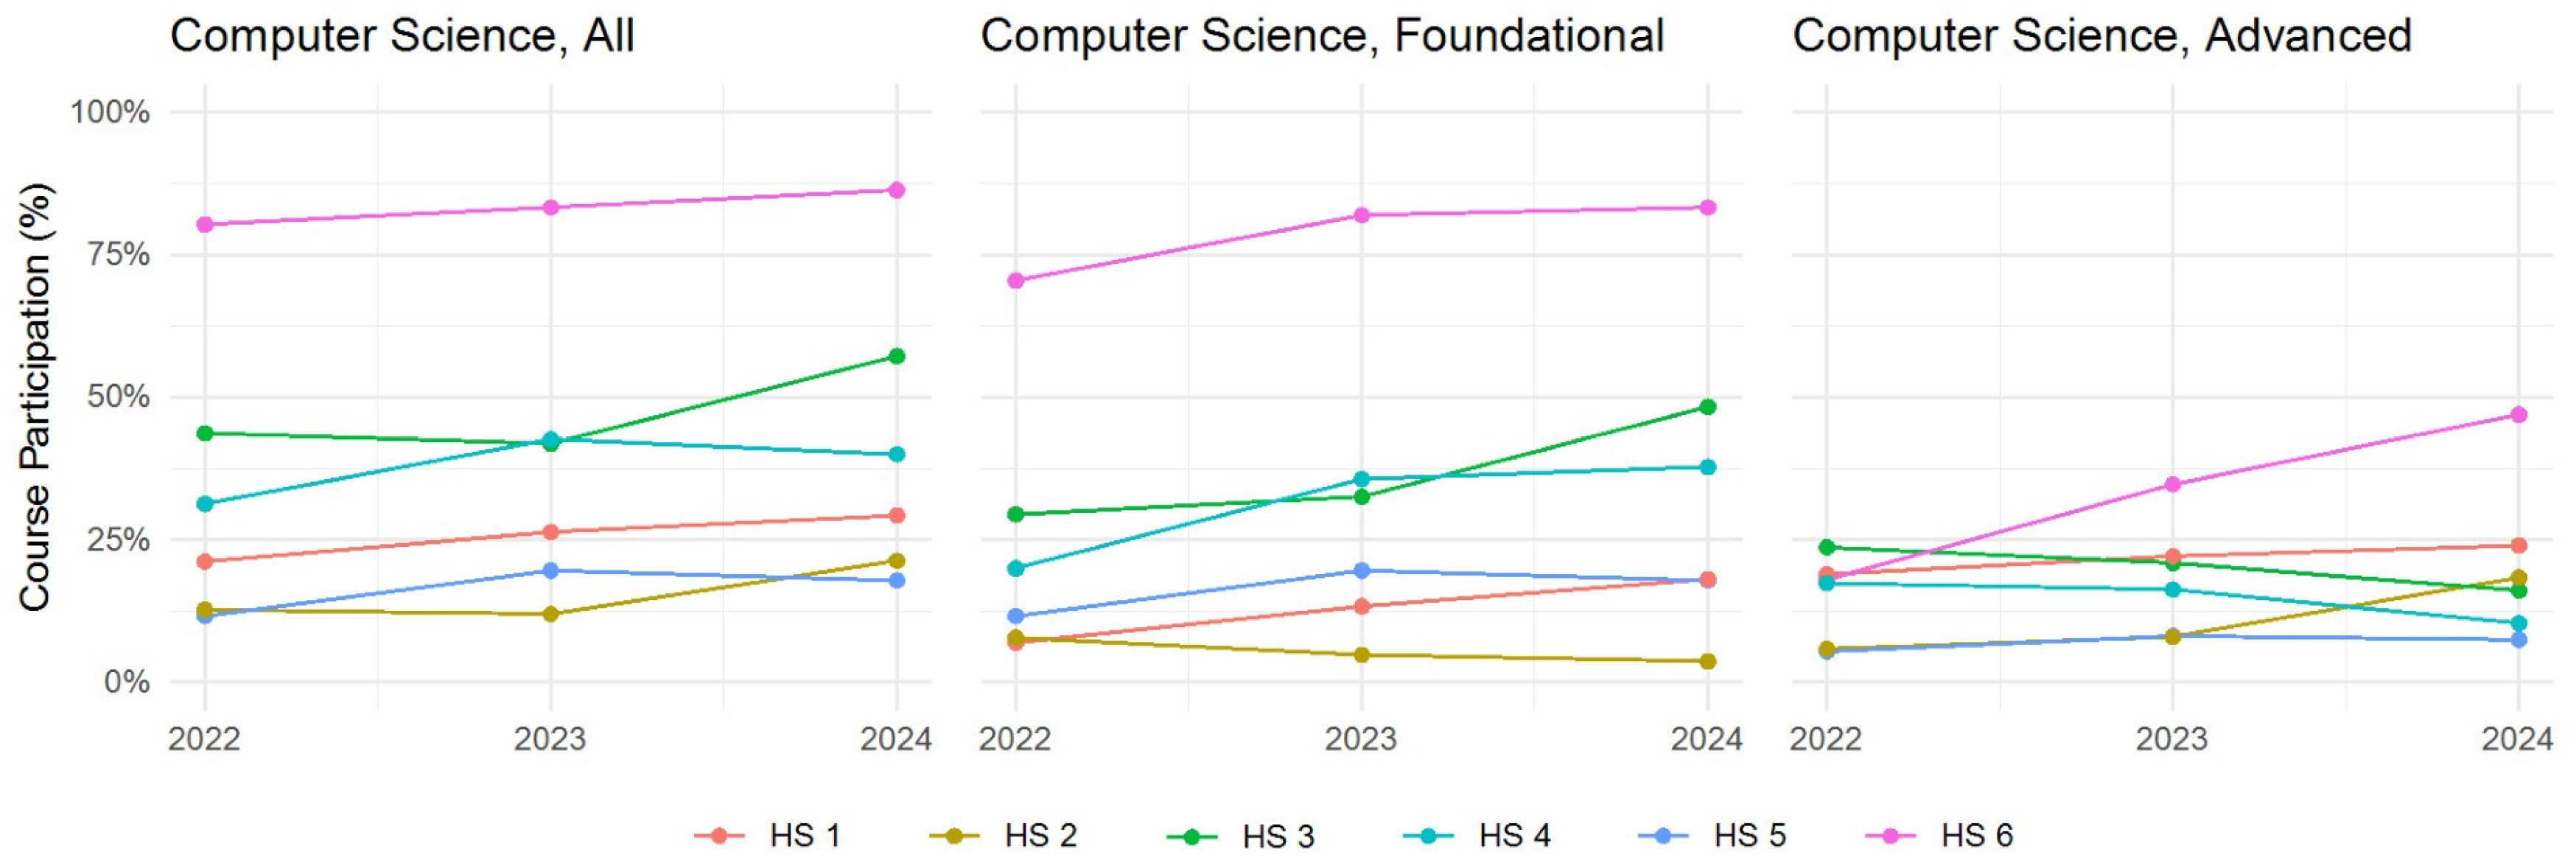
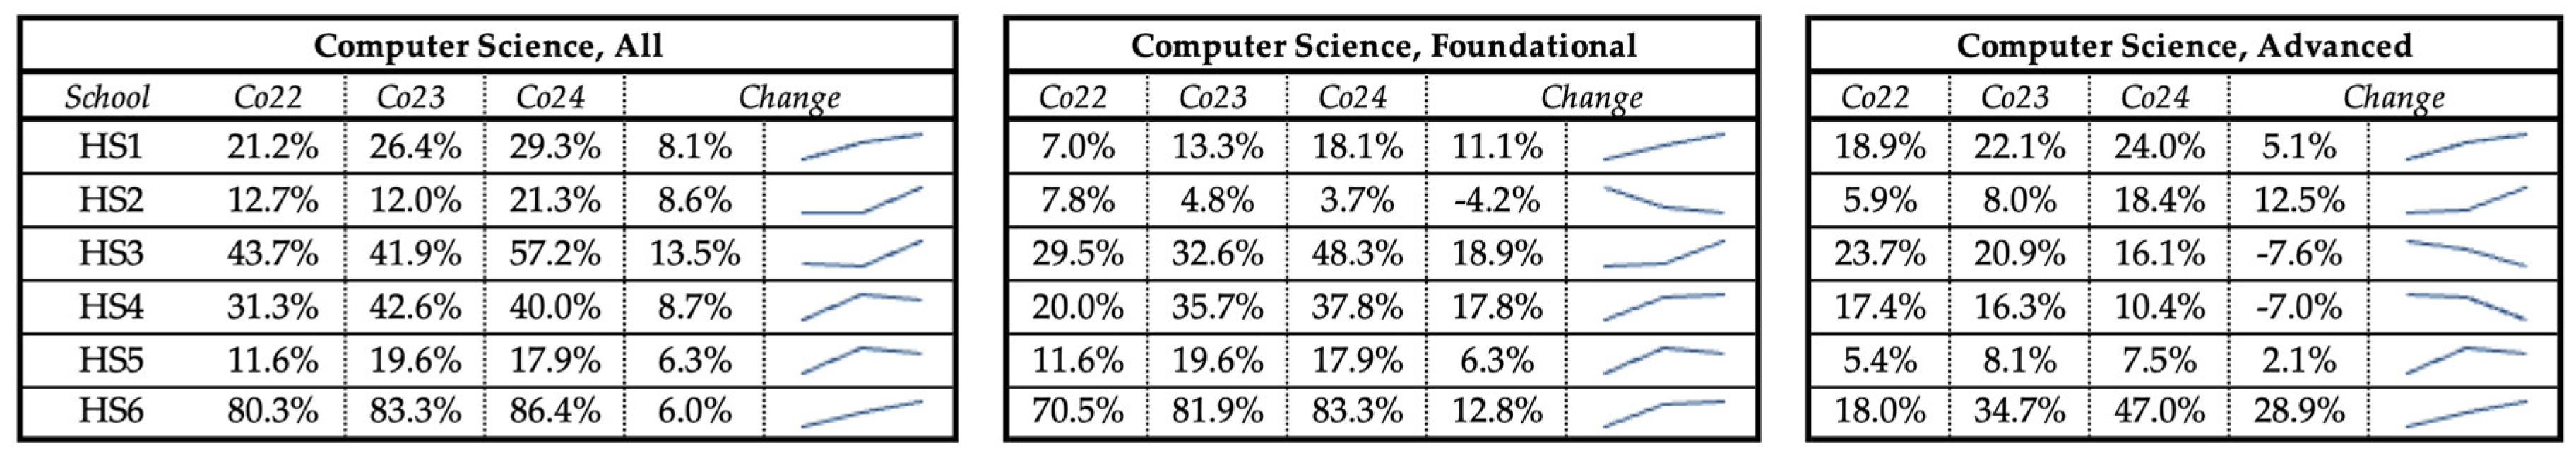
3.1. Overall Participation in CS Courses
Overall CS participation, the percentage of students within a graduating class who have taken at least one CS course in 9th – 12th grade, offers a comprehensive, but broad, measure of CS participation. As seen in
Figure 1, across the six schools studied, this figure generally remains below 50%, with two schools consistently showing participation rates under 25% for the three cohorts. Across all schools, for the Co22, the percentage of students taking at least one CS course ranged from 12% - 80%; for the Co23, the range expanded slightly to 12%-83%, and for the Co24, the spread increased to 18%-86%.
Although there are significant variations across schools, CS participation rates of successive cohorts within schools is much less volatile, and trends, however small, begin to emerge from the data. Compared to the Co22, the Co24 has a higher rate of CS participation in every school, with an average net change of +8.5% (though only two schools showed growth between both the 2022 to 2023 cohorts and 2023 to 2024 cohorts). Aside from HS 3, which had a +13.5% change over this period, all schools showed increases between 6% and 9%, pointing towards somewhat steady, moderate growth in CS participation.
Enrollment data offers additional insights into not only whether students took a CS course but also which specific courses they completed during their four years of high school. When CS participation was divided into foundational and advanced CS participation, as shown in
Figure 2, more nuanced, sometime sporadic, patterns emerge. For instance, by examining the enrollment patterns of HS 6, which demonstrated the highest overall CS participation rates, we see that most of their enrollment is in foundational courses, and for the Co22, HS 6’s advanced CS participation is more in line with other schools, but growing over time. Generally, advanced course participation is lower than foundational course participation across all schools. For the 2022 cohort, advanced course participation ranged from 5%-23%, compared to 8%-71% for foundational courses. Similarly, for the 2024 cohort, advanced course participation ranged from 8%-47%, compared to 4%-83%. However, the within-school participation rates of foundational and advanced CS courses from cohort to cohort do not share the same measured, stable change that overall CS participation rates displayed.
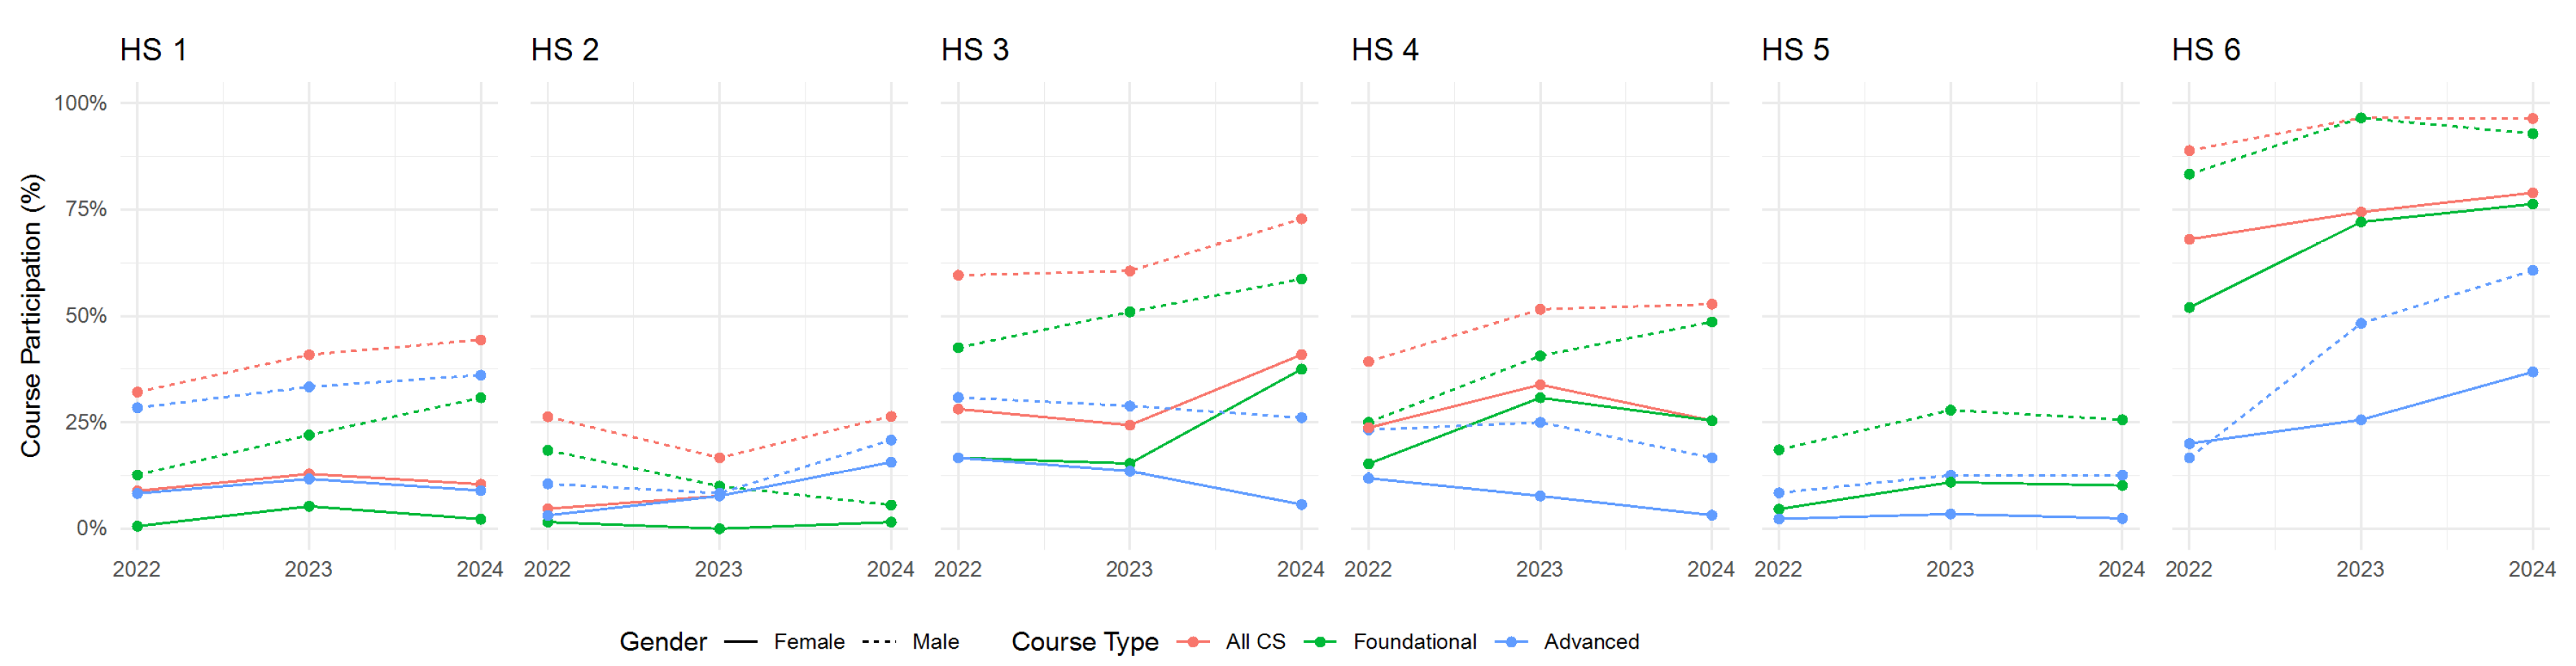
3.2. Participation in CS Courses by Gender
When examining CS participation through the lens of gender, disparities between male and female students emerge across schools and cohorts. Across all studied cohorts, overall CS participation was higher for male students compared to female students. Across all six schools, some of the highest gendered differences in participation were found in HS 3, where 73% of males in the Co24 took at least one CS course, compared to only 41% of females, a gap of 32%; in the same school, skews for previous cohorts were also pronounced, with a 36% gap for Co23 and 31% for Co22. On the other end, HS 2 consistently saw smaller gender gaps in CS participation, with the male CS participation percentage exceeding the female percentage by 22%, 9%, and 11% for the Co22, Co23, and Co24, respectively.
Additionally, we used a gender-based lens to examine participation in foundational and advanced courses separately. Mirroring the overall trends, for both course types, and across all schools, male participation exceeded female participation (except for HS6 Co24, which had a near overlap and very small group size (11 students) for advanced courses). Some of the largest instances of gendered participation gaps by course type are HS 3’s foundational courses, with 43% of males and 17% of females in the Co22 taking a foundational CS course (a gap of 26%), and gaps of 36% and 21% for the Co23 and Co24, respectively. Foundational courses at HS 6 also saw large gender skews, with gaps of 31%, 24%, and 17% across cohorts. Conversely, advanced courses at HS 5 and HS 2 were much closer to gender parity, with gaps for successive cohorts of 6%, 9%, and 10% for HS 5 and 7%, 6%, and 5% for HS 2. Advanced courses tended to have smaller participation gaps, but this is not always the case: like their advanced courses, HS 2’s foundational courses were also closer to parity, with male participation exceeding female participation by 17%, 10% and 4% across the three cohorts.
Looking over time, the range of female CS participation across schools in Co22 was 5%-68%, which increased and widened slightly to 10%-79% for Co24; during the same time, the range of male participation in CS courses moved from 19%-89% to 26%-96%. The data for all studied schools are displayed in
Figure 3, where the red lines denote overall CS participation, dashed for males and solid for females. Note that in HS 5, all advanced courses require a foundational course as a pre-requisite, so red lines are “hidden” underneath the green ones, as they are identical.
Once again, despite sizable variation in participation across schools, within-school variation appears more stable and indicative of gradual change over time. Because overall CS participation varies so much among schools, comparing the female and male CS participation across schools is not trivial. Female participation at HS 6 exceeds male participation at all other schools; this does not mean that females at HS 6 are participating in CS more equitably, as a gender gap exists at HS 6, rather, it’s a reflection of HS 6’s overall higher CS participation rates. However, examining how these percentages change over time allows us to begin to look at the school-to-school variation at a more comparable figure. As discussed in
Section 3.1, across the studied schools, there was an average increase of +8.5% in overall CS participation; when stratified by gender, the change for females alone is +7.2%, and +8.9% for males from Co22 to Co24.
Across cohorts, we are also able to gauge whether different types of courses, and at different schools, are moving towards gender parity over time by looking at how the gender participation gap changes from cohort to cohort. In most cases, the trajectories of male and female CS participation over time appear similar (that is, CS participation is, and stays, higher for males by a relatively constant amount). However, in some isolated cases, analyses reveal movement towards gender parity: foundational courses in HS 6 (which has generally higher levels of CS participation than other schools) saw 52% female and 83% male participation in the Co22, and 76% female and 93% male participation for the Co24, reducing the gender gap from 31% to under 17%. Similarly, HS 2 (which has generally lower levels of CS participation) also moved towards gender parity, reducing their overall gender participation gap from 22% to 11% from the Co22 to the Co24.
3.3. Participation in CS Courses by Race/Ethnicity
When examining CS participation through the lens of race/ethnicity, disparities among racial groups also emerge across schools and cohorts. Mirroring the overall trajectory in CS participation, CS participation is higher for the Co24 than the Co22 for many, but not all, racial/ethnic groups. The degree of participation varies among schools, cohorts, and course types. As was the case for gender-based analyses, analyses reveal differences in both the raw size of the participation gaps for various racial/ethnic groups as well as the direction these gaps appear to move with time. In some cases, data provide evidence for movement towards racial parity in CS participation, and in other cases, movement away from it. Unlike the gender-based analyses presented in
Section 3.2, schools’ demographic compositions are more at play for racial/ethnic analyses. As such, variance in group sizes within and across schools introduce additional volatility in the data, and more general findings are presented to avoid over-interpretation.
Across the three schools where Asian students comprise at least 5% of each cohort (HS1, HS2, and HS4), Asian students participated in all CS courses at higher rates than their peers. In HS3, Hispanic and White students are much closer to parity with 42 to 58% Hispanic and 50 to 58% White students participating in at least once CS course across the 3 cohorts. Finally, across the two schools where Black and Hispanic students comprise at least 5% of each cohort (HS4, HS5, and HS6), the difference in participation rates between the schools is large from a high of 21% Black in HS5 to a high of 100% in HS6, 13% Hispanic to 89%, and 13% White to 87%. Looking within schools reveals trends that appear more stable and gradual. For example, the 2023 cohort in HS6 had 78% Black, 85% Hispanic, and 81% White students taking at least one CS course within the four years of high school.
Finally, Asian students consistently have higher participation in advanced courses than their peers. For example, 42% of Asian students in the 2024 cohort have taken an advanced CS course versus 7% of Hispanic students and 26% of White students (with 15% of Asian students having had taken foundational CS, 16% Hispanic and 19% White).
Figure 4.
CS Participation Details & Trends: All Students by Race, Cohort, and School Red, italicized cells indicate that the group makes up less than 5% of the school student population. * Change is calculated as the net increase/decrease between the Co22 and the Co24.
Figure 4.
CS Participation Details & Trends: All Students by Race, Cohort, and School Red, italicized cells indicate that the group makes up less than 5% of the school student population. * Change is calculated as the net increase/decrease between the Co22 and the Co24.
4. Discussion
The results from this study underscore the value of a cohort-based, longitudinal methodology when examining CS participation at a school-specific level. In contrast to typical statewide or national studies that often rely on snapshots or aggregated figures, our approach provides a more fine-grained view of how participation evolves within the same group of students over their four-year high school experience. By following each graduating cohort, we were able to account for changes in school policies, resource allocations, and shifting course offerings over time - factors that we know happen frequently in CSE ecosystems. While larger-scale studies can treat these fluctuations as “noise” due to their sample size and study scope, more local explorations cannot. This design allows for a more nuanced understanding of what CS participation looks like at a school level and even allows further subdivisions by course type or specific student groups.
Importantly, within a cohort, students experience the same fluctuations to their CSE ecosystem at the same point in their HS career. Consider, as a fictitious example, that a school offered a new 10th grade CS course beginning in the 2020-2021 school year. By adopting a cohort-centric lens, this change, along with its potential impact, will become relevant with the Co23, who are in 10th grade when the course begins. Although the Co22, for instance, is in HS at this time, they are in 11th grade and would not be eligible for this course. Under more popular paradigms, where the total of HS CS enrollments are considered on a year-to-year basis, it’s less clear when the effects of this course can be observed, and what changes are attributable to it. Looking at the 2020-2021 year, roughly 25% of students (one grade level) are impacted by the change; in the following year, 50% of the HS student population will have this 10th grade course as part of their CSE experience, and so on. It is also possible the addition of this course outcompetes existing courses, and instead of increasing participation, it simply changes which CS course(s) students take. If this were the case, it would be very difficult to detect without a cohort-based perspective, as there would still be a short-term increase, mid-term fluctuations, and a long-run return to 2019-2020 levels. This would be readily detectable under the cohort analyses presented in this study (the CS participation % of the Co23 would remain steady). In short, the goal of HS CSE is to provide HS students with CS instruction (and less about the particulars of when that instruction might occur), and this is precisely what a cohort analysis measures.
Despite each of the six participating schools offering multiple CS courses throughout the study period, our analyses reveal that access alone does not beget participation. Overall, CS participation is generally under 50%. Females consistently enrolled in CS courses at lower rates than males, and Black and Hispanic students continued to participate at lower rates than their White and Asian peers. Importantly, these discrepancies were evident regardless of the schools’ overall participation level. CS participation generally may be higher or lower in certain schools (ranging between under 25% to over 75%), but certain groups were consistently underrepresented within their schools.
When looking across cohorts (over time), this study finds that trend lines of CS participation are quite consistent across diverse school contexts, even if the absolute numbers vary substantially. Where one school’s enrollment might climb from 20% to 26%, another moves from 70% to 76%, but in both scenarios, the overall pace of change in CS participation may be able to be understood and calculated across schools. This pattern suggests that local conditions like whether foundational CS courses require prerequisites, how teachers encourage students to enroll, whether the “introductory” CS course is an AP course, or the presence of initiatives to recruit underrepresented groups may have had a strong influence the baseline level of CS participation years ago or at their inception, while overall growth today appears to follow a common trajectory. Although overall CS participation generally increased for each successive cohort (typically by six to nine percentage points), schools that started with relatively low participation rates did not exhibit notably faster growth. If this trajectory continues, CSE is not on a path to become “equalized” across schools.
When considering the persistent underrepresentation of specific student groups in CSE, it is important to note that even when gains in CS participation over time are present (which is not the case for all racial/ethnic groups), they were neither large enough nor differential enough to close existing equity gaps in the years to come, suggesting that the present trajectory of CSE evolution may not be sufficient to reach racial or gender parity. Targeted supports and intentional outreach strategies may be needed to accelerate the growth of underrepresented students’ participation in CSE beyond passive gains. Achieving parity necessitates faster growth rates for historically underrepresented students and ensuring that all students are participating in CS regardless of where they live necessitates the same in schools with lower initial participation. Consequently, simply celebrating positive trends may mask the continued marginalization (or worse, growing underrepresentation) of certain subgroups in CS pathways. Future research should further investigate targeted strategies—like early exposure, guidance counseling, and culturally responsive curricula—that can accelerate participation gains for underrepresented students and do so in a way that studies whether such initiatives actually (a) grow CS participation beyond passive gains, and (b) put underrepresented groups on a trajectory to reach parity, rather than sustain their underrepresentation. Even when growth exists, underrepresentation can grow.
Study limitations must also be acknowledged. The present research draws on a relatively small sample of six suburban schools in one northeastern state, which may limit the generalizability of our results. However, a case can be made for generalizability when considering that despite the differences in school contexts, patterns across schools stabilize when examining change over time. Additionally, the methodology we present here, and the case we make for its use, is a strong alternative to comparing share of CS enrollments to share of overall population and can readily be applied to other schools. These methods provide insights and granularity for local samples that broader (more generalizable) studies cannot; limited generalizability is in some ways a feature, not a bug, of this approach. The true limitation is data availability. Student-level enrollment and demographic data is not feasible to obtain without data-sharing agreements, measures in place to protect students’ identities, and often, logistic processes that are not standard across schools. It takes time to build the relationships and trust with schools to get the requisite for these analyses. Even then, the requirement that each student have four years of available data is stringent, and excludes transfer students, drop-outs, is vulnerable to students skipping or repeating grades, and results in many students from a school not being included in analysis. However, the analysis presented in this study, which excluded data in this way, offers relatively consistent and stable findings, suggesting the analyses may not be extremely sensitive to excluded data.
The results presented here reach across multiple contexts and highlight the importance of analyzing CS participation at a fine-grained level. We provide not only a theoretical motivation for this type of analysis but also demonstrate that its application yields insights that can be found, interpreted, and acted upon, even with limited data. The outlying data points, unusually high or low participation rates, or rapid changes in CSE participation that are revealed by this approach can be paired with historical data on changes in course offerings, school policy, or staffing. This work, already underway, has the potential to discover complex relationships among school contexts, CSE ecosystems, how they change, and the resulting impacts student participation and behavior. Other future efforts, some already taking place, can (a) expand the number and diversity of schools studied; (b) rigorously investigate data inclusion requirements and the sensitivity of results to data exclusion; (c) devise methods to methodologically account for transfer or drop-out students; (d) augment the power and precision of analyses by incorporating compatible, robust statistical methods beyond descriptives; (e) leverage additional, potentially qualitative, data on student motivations and barriers to further situate and contextualize findings, and; (f) extend the longitudinal nature of the cohort analyses by both extending the reach of data for individual cohorts (with pre- and post-HS CSE participation) and increasing the number of cohorts studied.
With more and more schools offering CS courses, we must quickly move away from thinking of access as a binary. Within HS CSE, varying groups of students have varying degrees of access to varying types of courses. In the past, understanding the intersections between access (through this comprehensive lens) and the complexities of participation was a technical challenge. Now, it is an imperative.
Author Contributions
Conceptualization, CLB, DJA, and TGD; methodology, CLB, DJA, and TGD; software, CLB, DJA; validation, CLB, DJA, and TGD; formal analysis, CLB, DJA; investigation, CLB, DJA, and TGD; resources, CLB and TGD; data curation, CLB, DJA, and TGD; writing—original draft preparation, CLB, DJA; writing—review and editing, CLB, DJA, and TGD; visualization, CLB, DJA; supervision, CLB and TGD; project administration, CLB; funding acquisition, CLB and TGD. All authors have read and agreed to the published version of the manuscript.
Funding
This research was conducted with support from the United States Department of Education Office of Elementary & Secondary Instruction under Educational Innovation & Research (EIR) Award #S411C200084.
Institutional Review Board Statement
This study was conducted in accordance with the Declaration of Helsinki and approved by the Institutional Review Board of Rutgers University, New Brunswick (study 2020003169, approved 5/28/2021).
Informed Consent Statement
Not applicable.
Data Availability Statement
The datasets presented in this article are not readily available, as their access, governed by Family Educational Rights and Privacy Act, was provided by public educational agencies with researchers through board-approved, time-bound data sharing agreements. Requests to access the datasets should be directed to corresponding author CLB.
Conflicts of Interest
The authors declare no conflicts of interest. The funders had no role in the design of the study; in the collection, analyses, or interpretation of data; in the writing of the manuscript; or in the decision to publish the results.
Abbreviations
The following abbreviations are used in this manuscript:
| CS |
Computer science |
| CSE |
Computer science education |
| HS |
High school |
| Co2X |
Class of 202X |
References
- Adrion, R., Fall, R., Ericson, B., & Guzdial, M. (2016). Broadening access to computing education state by state. Commun. ACM, 59(2), 32–34. [CrossRef]
- Armoni, M., & Gal-Ezer, J. (2022). High-School Computer Science – Its Effect on the Choice of Higher Education. Informatics in Education, 22(2), 183–206. [CrossRef]
- Bruno, P., & Lewis, C. M. (2021). Equity in high school computer science: Beyond access. Policy Futures in Education, 14782103211063002. [CrossRef]
- Chan, H.-Y., Ma, T.-L., Saw, G. K., & Huang, Y.-M. (2022). High School Course-Completion Trajectories and College Pathways for All: A Transcript Analysis Study on Elective Computer Science Courses. Education Sciences, 12(11), 808. [CrossRef]
- Code.org, CSTA, & ECEP Alliance. (2024). 2024 State of Computer Science Education. https://advocacy.code.org/stateofcs.
- Freeman, J. A., Gottfried, M. A., & Odle, T. K. (2024). Explaining Course Enrollment Gaps in High School: Examination of Gender-Imbalance in the Applied Sciences. Educational Policy, 38(4), 897–936. [CrossRef]
- Iannone, R., Cheng, J., Schloerke, B., Hughes, E., Lauer, A., Seo, J., Brevoort, K., & Roy, O. (2024). gt: Easily Create Presentation-Ready Display Tables. https://CRAN.R-project.org/package=gt.
- L. Jaccheri, C. Pereira, & S. Fast. (2020). Gender Issues in Computer Science: Lessons Learnt and Reflections for the Future. 2020 22nd International Symposium on Symbolic and Numeric Algorithms for Scientific Computing (SYNASC), 9–16. [CrossRef]
- Margolis, J., Ryoo, J. J., Sandoval, C. D. M., Lee, C., Goode, J., & Chapman, G. (2012). Beyond access: Broadening participation in high school computer science. ACM Inroads, 3(4), 72–78. [CrossRef]
- National Academies of Sciences, Engineering & Medicine. (2024). Equity in K-12 STEM Education: Framing Decisions for the Future (E. R. Parsons, K. A. Dibner, & H. Schweingruber, Eds.). The National Academies Press. [CrossRef]
- National Forum on Education Statistics. (2023). Forum Guide to Understanding the School Courses for the Exchange of Data (SCED) Classification System. U.S. Department of Education; National Center for Education Statistics. https://nces.ed.gov/forum/pub_2023087.asp.
- Ni, L., Tian, Y., McKlin, T., & Baskin, J. (2024). Who is Teaching Computer Science? Understanding Professional Identity of American Computer Science Teachers through a National Survey. Computer Science Education, 34(2), 285–309. [CrossRef]
- Pedersen, T. L. (2024). patchwork: The Composer of Plots. https://CRAN.R-project.org/package=patchwork.
- Pollock, L., Mouza, C., Czik, A., Little, A., Coffey, D., & Buttram, J. (2017). From Professional Development to the Classroom: Findings from CS K-12 Teachers. Proceedings of the 2017 ACM SIGCSE Technical Symposium on Computer Science Education, 477–482. [CrossRef]
- Sax, L. J., Newhouse, K. N. S., Goode, J., Nakajima, T. M., Skorodinsky, M., & Sendowski, M. (2022). Can Computing Be Diversified on “Principles” Alone? Exploring the Role of AP Computer Science Courses in Students’ Major and Career Intentions. ACM Trans. Comput. Educ., 22(2). [CrossRef]
- Wickham, H. (2016). ggplot2: Elegant Graphics for Data Analysis. Springer-Verlag New York. https://ggplot2.tidyverse.org.
- Wyatt, J., Feng, J., & Ewing, M. (2020). AP Computer Science Principles and the STEM and Computer Science Pipelines. College Board. https://apcentral.collegeboard.org/media/pdf/ap-csp-and-stem-cs-pipelines.pdf.
|
Disclaimer/Publisher’s Note: The statements, opinions and data contained in all publications are solely those of the individual author(s) and contributor(s) and not of MDPI and/or the editor(s). MDPI and/or the editor(s) disclaim responsibility for any injury to people or property resulting from any ideas, methods, instructions or products referred to in the content. |
© 2025 by the authors. Licensee MDPI, Basel, Switzerland. This article is an open access article distributed under the terms and conditions of the Creative Commons Attribution (CC BY) license (http://creativecommons.org/licenses/by/4.0/).