Submitted:
27 April 2025
Posted:
28 April 2025
Read the latest preprint version here
Preprints on COVID-19 and SARS-CoV-2
Abstract
A control group is the usual method for maintaining the integrity of medicine: the first group that received the treatment and the control group that did not. This statistical methodology ensures the integrity of public health policy. The main scientific literature on the effectiveness of the COVID-19 vaccination does not use the unvaccinated part of the population as a control group. This methodological error causes huge negative effects on global public health policy.
Keywords:
statistics
; COVID-19 vaccination
; public health policy
1. Introduction
Imagine we are producing fertilizers. We want to prove that our last fertilizer works well. We take 200 plants of the same size and put them in the same soil. On 100 plants we apply fertilizer, and on the other 100, we do not. We see how fertilizer works on the plant’s growth. This is how science works. Applying fertilizer only on 100 plants and claiming that they grow better is scientific fraud.
During massive COVID-19 vaccinations in 2021 and 2022, the same situation. In scientific literature [1,2,3,4,5], we read that COVID-19 vaccination reduced the mortality rate of the vaccinated part of the population. None of these researches compared the mortality rate of the vaccinated population with the mortality rate of the unvaccinated population. That’s why their findings have no scientific integrity and are not objective. They do not give us a picture of the real situation of public health after massive COVID-19 vaccination. Their results are imaginary and fictitious, and they contradict statistical data.
2. Exact Statistical Evaluation of COVID-19 Vaccination Effectiveness
Imagine that all vaccinated people around the globe would be given a black handbasket and that the vaccination would not have any impact on the people’s health and consequently on their mortality. Imagine that the population is divided into five age groups: from 0 to 20, from 22 to 40, from 41 to 60, from 61 to 80, and above 80. This division is needed to avoid Simpson’s statistical paradox. Imagine that in all age groups, exactly 50% of people would be vaccinated during January 2021. In February 2021and in the following months, some vaccinated people in all age groups would die, and some people in unvaccinated groups also would die. Exactly 50% of dead persons would have a black bracelet considering that the vaccines have no impact on mortality. In statistics, this is the law of large numbers. This law is expressed by the Equation (1) below:
Equation (1) is valid for all five age groups. In statistics, we have for each month the numbers V, A, , and D. We calculate for each month the number :
is the proportionally calculated number based on monthly statistical data. is the number that shows the number of deaths if vaccines did not have an impact on mortality. We compare this calculated number with the real statistical number of dead vaccinated persons . The following is valid, see Equation (3) below:
Case A: Considering that 50% of the population in each age group would be vaccinated when 50% of people with black hand bracelets died in a given month, vaccines have no impact on mortality. The vaccinated part of the population has the same mortality rate as the unvaccinated part of the population.
Case B: When less than 50% of people with the hand bracelet die in a given month, vaccines save lives. The vaccinated part of the population has a smaller mortality rate than the unvaccinated part of the population.
Case C: When more than 50% of people with the hand bracelet die in a given month, then vaccines are taking lives. The vaccinated part of the population has a bigger mortality rate than the unvaccinated part of the population. We can calculate the impact of vaccination on mortality rate in percentages, See Equation (4) below:
In the case of A, the mortality rate of the vaccinated part of the population is 100%, and the mortality rate of the unvaccinated part of the population is 100%.
In the case of B, the mortality rate of the vaccinated part of the population is less than 100%, and the mortality rate of the unvaccinated part of the population is 100%. Vaccines are saving lives.
In the case of C, the mortality rate of the vaccinated part of the population is more than 100%, and the mortality rate of the unvaccinated part of the population is 100%. In the case of C, is bigger than . The mortality rate of the vaccinated part of the population in 2021 increased by 14.5% compared with the unvaccinated part of the population [6].
3. Medical Authorities Are Hiding Data on COVID-19 Vaccination Effectiveness
In most countries, the crucial statistical data is not public. Since 2021, a group of scientists and medical doctors have asked NIJZ (National Institute for Public Health) [7] in Slovenia to make these data public, and we never got a single answer. Public institutions that are responsible for public health are not releasing data that would show the effectiveness of COVID-19 vaccination. This is an unprecedented fiasco for public health authorities. The Cancer Registry of the Republic of Slovenia [8] does not release the number of new cancer cases for 2022, 2023, and 2024.

Table 1.
Number of cancer cases in Slovenia from Cancer Registry.
| Number of cancer | 2017 | 2018 | 2019 | 2020 | 2017-2020 | 2021 |
| 15653 | 16778 | 16873 | 15625 | 16232 (100%) |
17349 (116%) |
|
| +1117 (16%) |
The average number of cancer cases in 2017-2020 was 16232. In 2021, there were 1117 more cancer cases, which is 16% compared to the average for 2017-2020. The Cancer Registry of the Republic of Slovenia hides data on cancer cases in 2022, 2023, and 2024, which again is an unprecedented fiasco for public health authorities. Having this data available, the eventual causal correlation between COVID-19 vaccination and the number of cancer cases would be seen. NHS reported, that in England, the number of cancer cases in 2022 increased by 5% compared to 2021 [9]. The Statistical Office of the Republic of Slovenia publishes data on deaths and births for the previous year in March of the following year. So, they’re three months behind. The cancer data is three years behind, which makes it impossible to make a proper scientific evaluation. In Slovenia, around 60% of the population was vaccinated: “Vaccination against COVID-19 in Slovenia began on December 27, 2020, with about 60 percent of the Slovenian population vaccinated with at least one dose as of July 5, 2022” [10]. If the number of cancers in 2022, 2023, and 2024 increases, this does not necessarily mean that there is a causal relation between COVID-19 vaccination and the number of cancers. We need to have the total number of cancer cases for a given year and how many of these cases were vaccinated. If 60% of cancer cases were vaccinated this does not prove a causal correlation. If 70% of cancer cases were vaccinated this would indicate that causal correlation is plausible.
4. Hypothetical Evaluations of COVID-19 Vaccine Effectiveness Have No Scientific Validity and Cannot Be the Guide of Public Health Policy
Instead of using statistical data and appropriate statistical methods (see Chapter 3), to evaluate COVID-19 vaccination effectiveness, most of the research developed abstract fictitious models that do not correspond to the real situation of public health that occurred after the COVID-19 vaccination. The results of the references [1,2,3,4,5] have no scientific validity. They are hypothetical; they disagree with official world statistics [11]. They should not be the guide for the world policy of public health. WHO should take into account results that COVID-19 vaccination in 2021 increased the mortality rate of the vaccinated population by 14.5% and take appropriate measures.
A recent article suggests that comparing the mortality rate of the vaccinated part of the population with the unvaccinated part of the population is the only valuable method to evaluate the effectiveness of COVID-19 vaccination and ensure the right policy of public health: “The increase over time in all-cause death SMRs in vaccinated people compared to unvaccinated, and their excess from the reference values for certain age groups, should be carefully considered to understand the underlying factors. Furthermore, since the initial values of the SMRs are much lower than 1, we assume the presence of significant biases in the ONS dataset, leading to an underestimation of the risks for the vaccinated people, as it is implausible that COVID-19 vaccines protect against non-COVID-19 deaths. It would be desirable for other major countries to systematically collect all-cause mortality by vaccination status and, in the meantime, a pending indepth investigations, much greater caution should be exercised in promoting mass vaccination campaigns” [12].
The unvaccinated group enables differentiation between persistent COVID-19 symptoms and the vaccine’s adverse effects. The efficient method to evaluate the relationship between persistent COVID-19 symptoms and vaccine side effects is to compare vaccination levels in Australia and Papua New Guinea with the mortality rate from the COVID-19 virus. Here are the charts from the statistical base of Our World Data on the day 3.04.2025 [13].
Figure 1.
On the left is the daily number of doses administered per 100 people, on the right is the daily number of COVID-19 deaths per million people.
Figure 1.
On the left is the daily number of doses administered per 100 people, on the right is the daily number of COVID-19 deaths per million people.
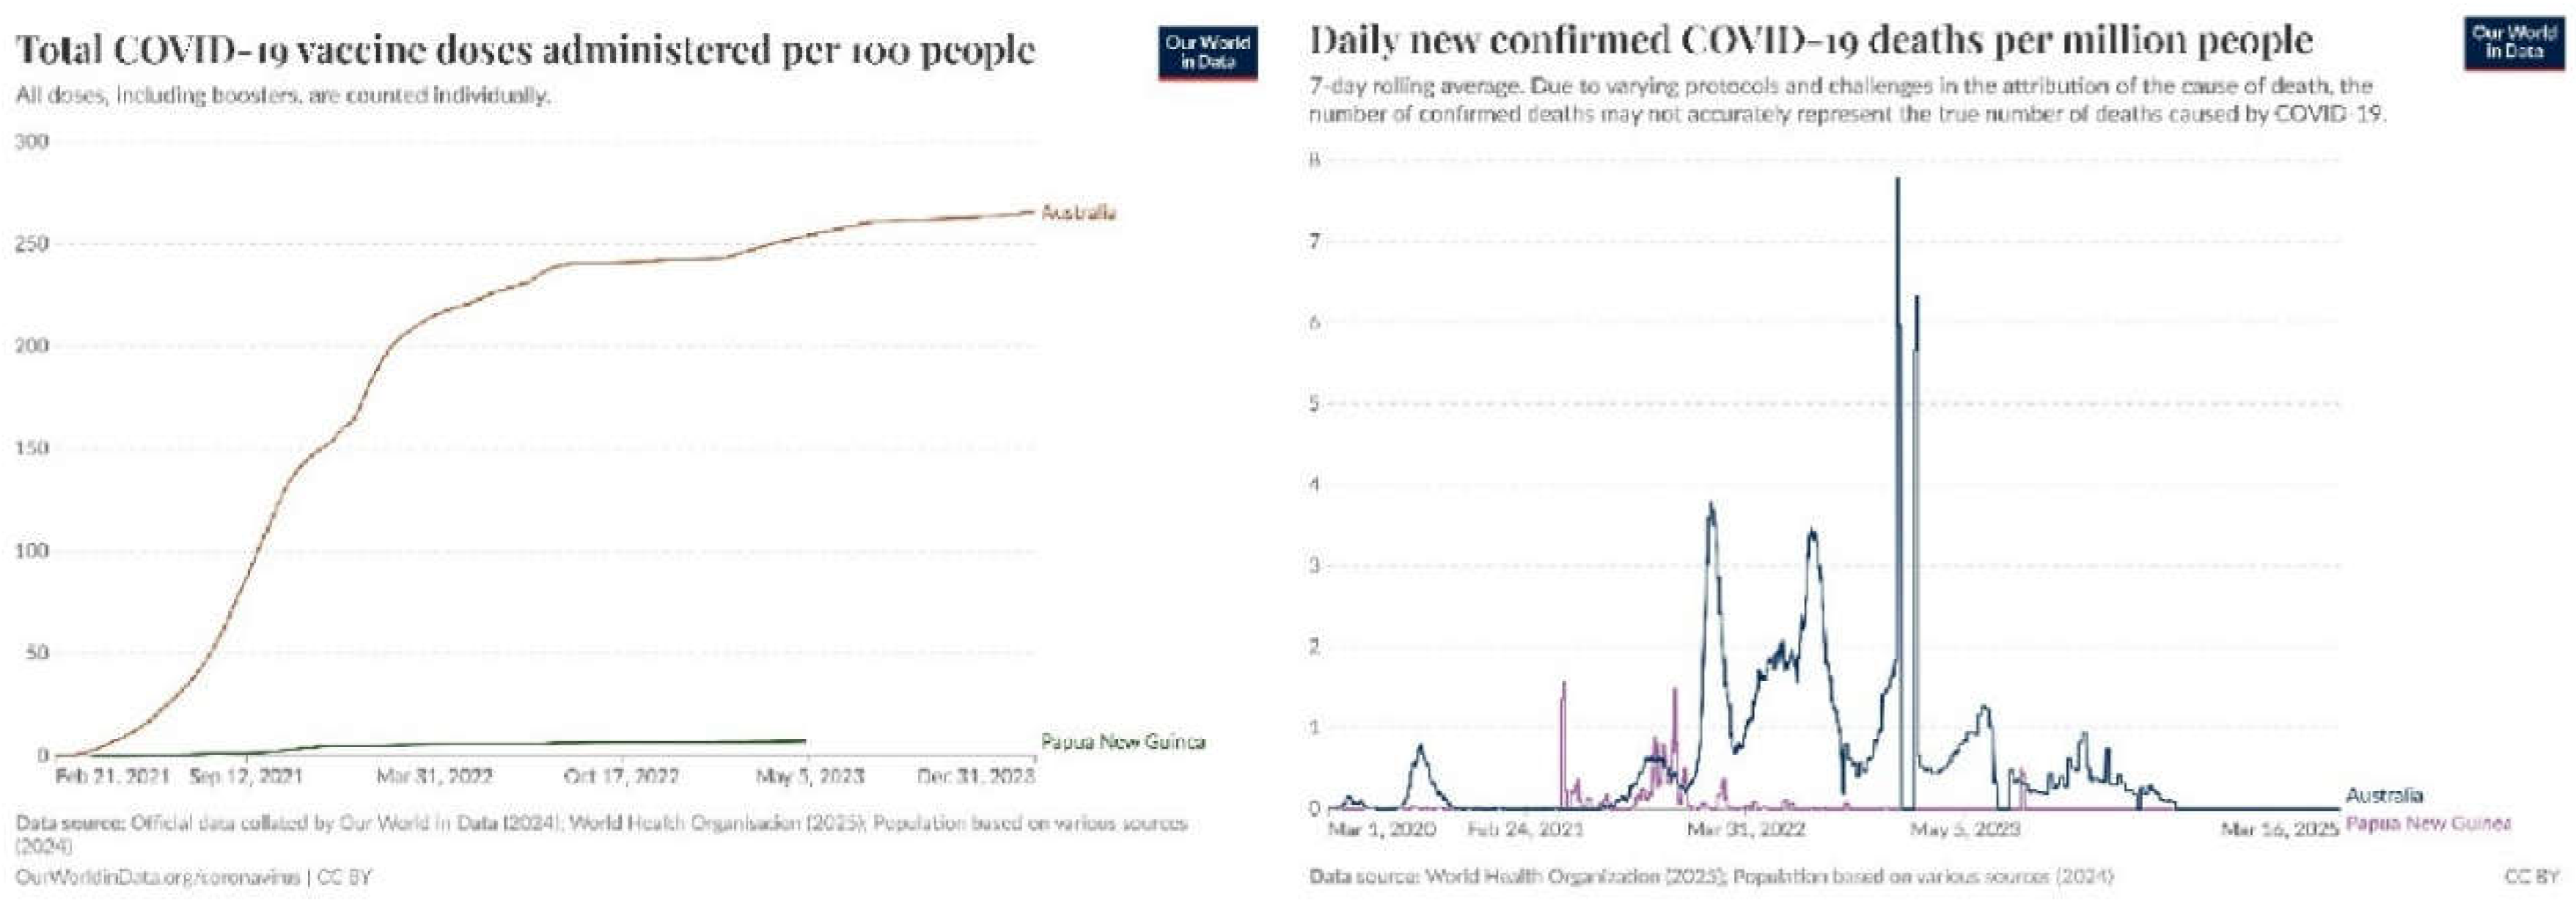
According to data from John Hopkins Corona Virus Resource Center, until 10 March 2023, when they stopped collecting the data, at least one dose of vaccine was received by 4,2 % of the Papua New Guinea population, whereas in Australia at least one dose was received by 87.3% of the population [14]. We see on the right chart that in Papua, after 27 November 2021 there was no boom in COVID-19 deaths. In Australia, the peak of COVID-19 deaths was between 28 December 2022 and 8 February 2023. This means that COVID-19 vaccination in Australia made the COVID-19 virus more deadly than if there were no vaccination. The analysis above confirms that the COVID-19 virus’s long-term symptoms in Papua caused fewer excess deaths per one million people than COVID-19 vaccination side effects in Australia per one million people.
5. COVID-19 Vaccination Changes the Human Genome and Causes Several Diseases, and Should Be Taken off the Market
It is clear that COVID-19 vaccinations change the human genome [15]. It is also known that these vaccines contain self-replicating nanotechnology [16]. Several articles confirm that these vaccines cause illnesses [17,18,19,20,21]. An article in the Lancet claims that they saved in 2021 with the COVID-19 vaccination 14 million lives on the globe [1]. The article does not compare the mortality rate of vaccinated and unvaccinated parts of the population; it is highly hypothetical and has no scientific validity. This article has been referenced 1162 times and serves as a framework for contemporary public health policy globally. It lacks support in statistics and is not founded on a robust mathematical model derived from actual statistical data. The publication should be retracted, and the COVID-19 vaccine should be taken off the market.
6. Conclusions
In the COVID crisis, medicine lost scientific integrity. Researchers refuse to use recognized and established statistical methods; they choose unreliable models that speculate about vaccination effectiveness without using dispositional statistical data. This shows the professional and ethical crisis of medicine, which has been forgotten: “Primum non nocere”. Public health experts, especially WHO experts on public health policy, should re-evaluate COVID-19 vaccination effectiveness using statistical data and appropriate statistical methods and reshape public health policy accordingly.
Acknowledgments
In memory of Slovenian mathematician Peter Žurej, who encouraged me to develop an exact statistical methodology for COVID-19 vaccination effectiveness.
References
- Watson OJ, Barnsley G, Toor J, Hogan AB, Winskill P, Ghani AC. Global impact of the first year of COVID-19 vaccination: A mathematical modelling study. Lancet Infect Dis. 2022;22(9):1293-1302 https://pubmed.ncbi.nlm.nih.gov/35753318/. [CrossRef]
- World Health Organization. 14.9 million excess deaths associated with the COVID-19 pandemic in 2020 and 2021. 2022. https://www.who.int/news/item/05-05-2022-14.9-million-excess-deaths-were-associated-with-the-covid-19-pandemic-in-2020-and-2021.
- Kislaya I, Machado A, Magalhães S, Rodrigues AP, Franco R, Leite PP, et al. COVID-19 mRNA vaccine effectiveness (second and first booster dose) against hospitalisation and death during Omicron BA.5 circulation: Cohort study based on electronic health records, Portugal, May to July 2022. Euro Surveill. 2022;27(37):2200697. https://pubmed.ncbi.nlm.nih.gov/36111555/.
- Wu N, Joyal-Desmarais K, Ribeiro PA, Vieira AM, Stojanovic Sanuade C, et al. Long-term effectiveness of COVID-19 vaccines against infections, hospitalisations, and mortality in adults: findings from a rapid living systematic evidence synthesis and meta-analysis up to December, 2022. Lancet Respir Med. 2023;11(5):439-452. https://pubmed.ncbi.nlm.nih.gov/36780914/.
- Savinkina A, Bilinski A, Fitzpatrick M, Paltiel AD, Rizvi Z, Salomon J, et al. Estimating deaths averted and cost per life saved by scaling up mRNA COVID-19 vaccination in low-income and lower-middle-income countries in the COVID-19 Omicron variant era: a modelling study. BMJ open. 2022;12(9):e061752. https://pubmed.ncbi.nlm.nih.gov/36100306/.
- Šorli AS, Makovec T, Krevel Z, Gorjup R (2023) Forgotten “Primum Non Nocere” and Increased Mortality after COVID-19Vaccination. Qual Prim Care. 31.06. https://www.primescholars.com/articles/forgotten-primum-non-nocere-and-increased-mortality-after--covid19-vaccination.pdf.
- NIJZ – National Institute of Public Health https://nijz.si/en/ (2025).
- Cancer Registry of Republic of Slovenia http://www.slora.si/groba-stopnja (2025).
- Oversight body for the National Health Service in England (NHS) https://www.england.nhs.uk/2024/10/nhs-diagnoses-thousands-more-cancers-as-cases-rise-by-5/ (2025).
- STATISTA https://www.statista.com/statistics/1242449/slovenia-vaccination-against-covid-19-by-date/ (2025).
- Sorli AS (2025). The Discrepancy Between the Number of Saved Lives with COVID-19 Vaccination and Statistics of Our World Data. J Clin Trials. S32:001. https://www.longdom.org/open-access/the-discrepancy-between-the-number-of-saved-lives-with-covid19-vaccination-and-statistics-of-our-world-data.pdf.
- Alessandria M, Malatesta G, Di Palmo G, Cosentino M, Donzelli A. All-cause mortality according to COVID-19 vaccination status: An analysis of the UK Office for National Statistics public data. F1000Res. 2025 Feb 20;13:886. PMID: 40028449; PMCID: PMC11868741. [CrossRef]
- Our World Data (2025) https://ourworldindata.org/coronavirus.
- Makovec T, Šorli AS, Gorjup R, Krevel Z, Piberl S. Analysis of COVID-19 vaccination effectiveness. J Vaccines Vaccin. 2020;14(5):530. https://www.walshmedicalmedia.com/open-access/analysis-of-covid19-vaccination-effectiveness.pdf.
- Zhang L, Richards A, Barrasa MI, Hughes SH, Young RA, Jaenisch R. Reverse-transcribed SARS-CoV-2 RNA can integrate into the genome of cultured human cells and can be expressed in patient-derived tissues. Proc Natl Acad Sci U S A. 2021 May 25;118(21):e2105968118. https://doi.org/10.1073/pnas.2105968118. PMID: 33958444; PMCID: PMC8166107. https://www.pnas.org/doi/10.1073/pnas.2105968118. [CrossRef]
- Young Mi Lee, Daniel Broudy, Real-Time Self-Assembly of Stereomicroscopically Visible Artificial Constructions in Incubated Specimens of mRNA Products Mainly from Pfizer and Moderna: A Comprehensive Longitudinal Study, Vol 3 Num 2 IJVTPR (2024) https://www.ijvtpr.com/index.php/IJVTPR/article/view/102/291.
- Mead MN, Seneff S, Wolfinger R, Rose J, Denhaerynck K, Kirsch S, McCullough PA. COVID-19 mRNA Vaccines: Lessons Learned from the Registrational Trials and Global Vaccination Campaign. Cureus. 2024 Jan 24;16(1):e52876. https://doi.org/10.7759/cureus.52876. Retraction in: Cureus. 2024 Feb 26;16(2):r137. https://doi.org/10.7759/cureus.r137. PMID: 38274635; PMCID: PMC10810638. https://pubmed.ncbi.nlm.nih.gov/38274635/. [CrossRef]
- M. Nathaniel Mead et.al. ,COVID-19 Modified mRNA “Vaccines”: Lessons Learned from Clinical Trials, Mass Vaccination, and the Bio-Pharmaceutical Complex, Part 1, IJVTPR (2024) https://ijvtpr.com/index.php/IJVTPR/article/view/101.
- M. Nathaniel Mead et.al. COVID-19 Modified mRNA “Vaccines”: Lessons Learned from Clinical Trials, Mass Vaccination, and the Bio-Pharmaceutical Complex, Part 2 (2024) https://ijvtpr.com/index.php/IJVTPR/article/view/104.
- Kim, H.J., Kim, MH., Choi, M.G. et al. Psychiatric adverse events following COVID-19 vaccination: a population-based cohort study in Seoul, South Korea. Mol Psychiatry 29, 3635–3643 (2024). [CrossRef]
- Hazan, Sabine MD1; Dave, Sonya PhD2; Barrows, Brad DO1; Borody, Thomas J. MD, PhD, DSc, FACG3. S2099 Persistent Damage to the Gut Microbiome Following Messenger RNA SARS-CoV-2 Vaccine. The American Journal of Gastroenterology 117(10S):p e1429-e1430, October 2022. |. https://doi.org/10.14309/01.ajg.0000865036.78992.16 https://journals.lww.com/ajg/Fulltext/2022/10002/S2099_Persistent_Damage_to_the_Gut_Microbiome.2099.aspx. [CrossRef]
Disclaimer/Publisher’s Note: The statements, opinions and data contained in all publications are solely those of the individual author(s) and contributor(s) and not of MDPI and/or the editor(s). MDPI and/or the editor(s) disclaim responsibility for any injury to people or property resulting from any ideas, methods, instructions or products referred to in the content. |
© 2025 by the authors. Licensee MDPI, Basel, Switzerland. This article is an open access article distributed under the terms and conditions of the Creative Commons Attribution (CC BY) license (http://creativecommons.org/licenses/by/4.0/).
Copyright: This open access article is published under a Creative Commons CC BY 4.0 license, which permit the free download, distribution, and reuse, provided that the author and preprint are cited in any reuse.


