Submitted:
11 March 2025
Posted:
11 March 2025
You are already at the latest version
Abstract
Evaluating the impact of pollutants on ecosystems and human health is crucial. To achieve this, a wide range of bioassays, using organisms representative of different trophic levels, are available. However, extrapolating the results of these bioassays to real environmental conditions remains a major challenge. Indeed, how can a toxicity value obtained under controlled laboratory conditions be transposed to an often very different environment? This study specifically addresses this challenge by aiming to develop an algorithm capable of predicting the effect of environmental conditions on the impact of a toxic compound, Pentachlorophenol (PCP). To achieve this, three abiotic factors were considered: pH, temperature, and conductivity. Firstly, the study highlighted the effect of these factors on the biological activity of Escherichia coli. In the absence of the toxicant, pH and temperature are the only factors that significantly influence the activity of this bioindicator. However, when exposed to PCP, the results showed that the sensitivity of the bacteria was affected by pH and conductivity, but not by temperature. From this data, a predictive model was established to assess the intensity of the toxic effect induced by PCP under conditions other than those used in the laboratory test. This model was validated using a dataset of 384 supplementary experiments and demonstrated a strong correlation between the experimental and predicted values (r²≈0.9). Thus, this approach enables the effective prediction of PCP's effects by accounting for environmental variations.
Keywords:
Bioassay
; Biomeasure
; Neural network
; Predictive approach
; toxicity assessment
1. Introduction
Biomeasures such as bioassays and biosensors have become indispensable tools in the field of environmental monitoring. Indeed, these biological strategies can provide valuable information on environmental quality, particularly by enabling the characterization of the overall state of an environment (level of toxicity induced by anthropogenic pressure, toxicity) [1,2,3,4]. To achieve this, these approaches rely on bioindicators such as enzymes, cells (prokaryotic or eukaryotic) or certain multicellular higher organisms.
Despite their potential, current bioassay methods face several limitations. One of the main issues lies in the lack of representativeness of the data provided. Indeed, to ensure a certain level of reproducibility, these tests are carried out under controlled laboratory experimental conditions (pH, temperature, conductivity, etc.) (See Fig. 1 and Tab. SD1), implying, at the same time, a possible adjustment (correction) of the samples before their analysis (examples: prior salinity adjustment, temperature correction of samples) [5,6,7,8]. This technical choice in favor of reproducibility is in contradiction with the reality of the field. Indeed, adjusting the samples to the conditions imposed by the biological test can have significant consequences on the collected information, due in particular to the induced denaturation of the samples [9,10,11]. The work of Vasseur et al. [9], carried out on the basis of the ISO 11348 test (Aliivibrio fischeri), highlights an increase in the toxic effects of cadmium (Cd2+) and zinc (Zn2+) following a 5°C increase in the temperature of the tests (authors' hypotheses: better adsorption of metals by cells and faster cellular metabolism). Conversely, the results show a decrease in the toxic effects induced by benzene under the same conditions (greater volatilization of the molecule under these conditions). In this context, the extrapolation of the results from these tests to an environmental reality can prove to be particularly complex, even hazardous, as the conditions are so different.
To attempt to address this issue, statistical models, such as Biotic Ligand Models (BLM), have been developed to consider the specific characteristics of target environments in order to extrapolate observed effects to other specific environments [12,13,14,15,16]. To do this, the models require a thorough knowledge of the characteristics inherent to the environment studied (temperature, some aquatic ions (Ca2+, Mg2+, Na+, K+, Cl− and SO42−), sulfide, pH, alkalinity and Dissolved Organic Carbon). In the current state of our knowledge, these models have been deployed exclusively to assess the effect of metals (no BLM for organic compounds) but do not allow for the complexity of ecological interactions that can influence the toxicity of substances to be accounted for. Furthermore, although interesting, this strategy remains relatively expensive due to the necessary prerequisites (analytical data), making it poorly suited for regular environmental monitoring.
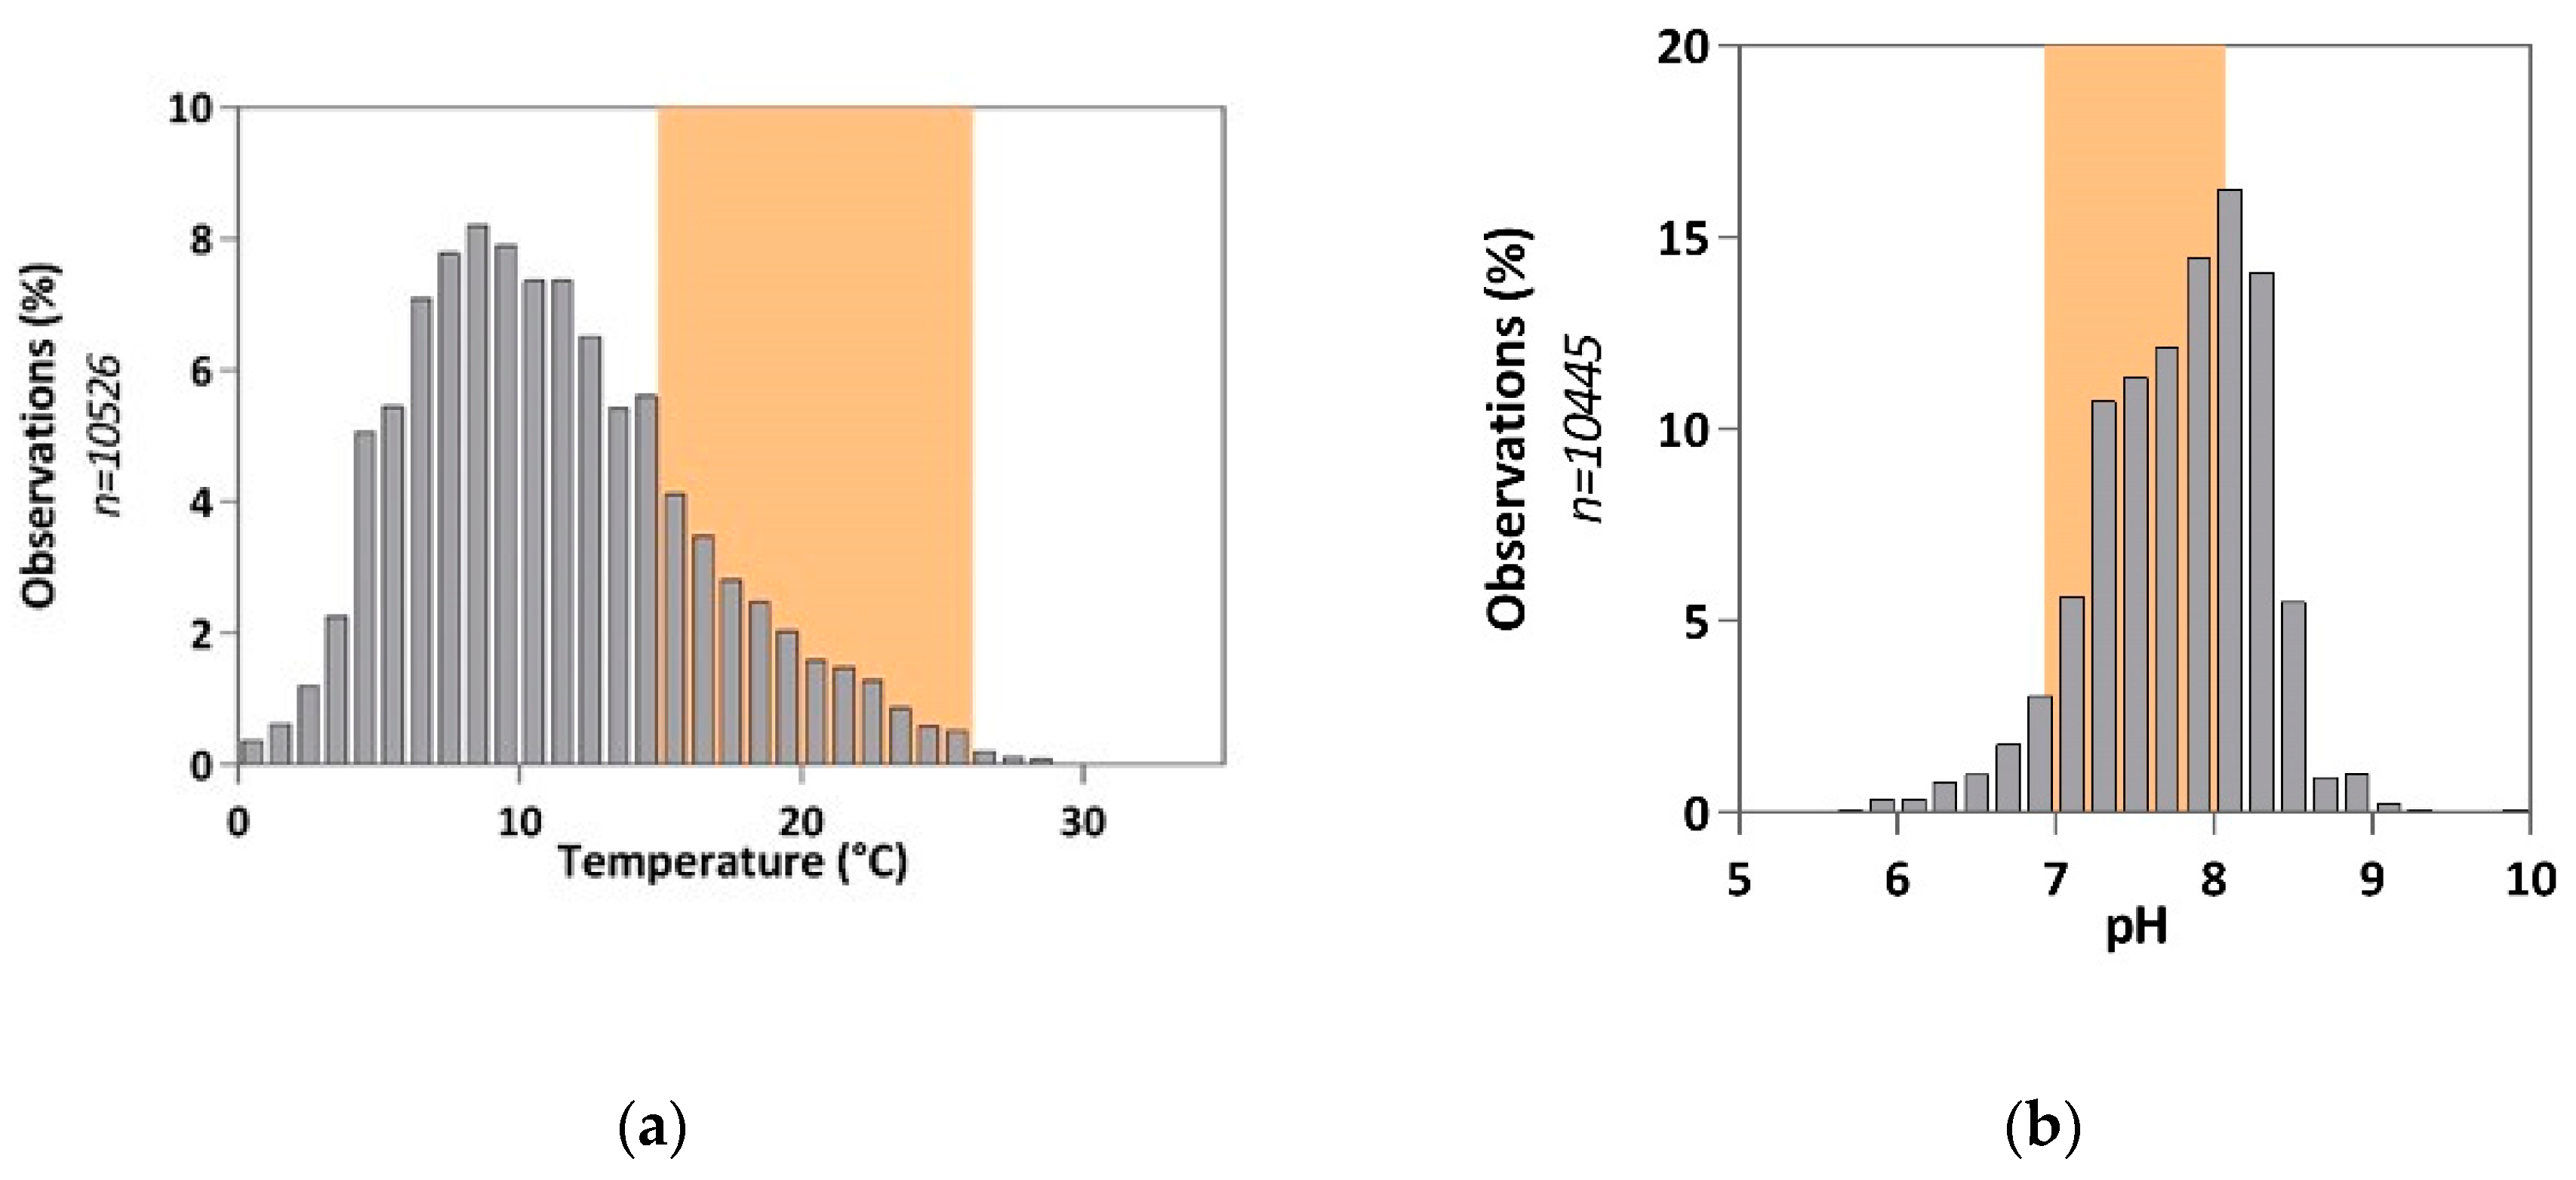
In the context of this study, we focused on the 'freshwater' matrix. This term is generally used in the literature to define an aqueous environment with a salinity of less than 35 g.L-1 (average salinity of seawater [17,18]). However, surface water analyses conducted by the French Office for Biodiversity [19] highlight significant physico-chemical disparities in these environments (Fig. 1), notably induced by geographical factors (soil type, etc.), anthropogenic factors (industrial and agricultural activities) and/or seasonal variations. For example, temperature, pH, and conductivity values, observed during the 2019 survey across the national territory, range from 0 to 32°C, 4.8 to 10.5, and 10 µS.cm-1 to 47 mS.cm-1 (conductivity close to seawater), respectively. The variability of these parameters must be taken into consideration to assess the effect of pollutant(s) in these environments. It is therefore necessary to propose solutions to transpose results obtained in the laboratory, under controlled conditions, to another environment subjected to physico-chemical conditions different from the test conditions.
The project proposed in this article aims precisely to provide answers to this problem by using a supervised learning tool designed to predict the effect of a toxicant in a different environment subjected to specific physico-chemical conditions. To achieve this, we focused on a model organic pollutant, namely pentachlorophenol (PCP) (details in SD), the challenge being to propose a model capable of predicting the toxic effect of this compound on the bacterial strain Escherichia coli based on 3 common abiotic factors, i.e., pH, temperature, and conductivity. Initially, the respiratory activity of the strain was characterized under varying pH, temperature, and conductivity conditions (3 modalities per factor). Respiratory activity was monitored, according to the method proposed by Tizzard et al. in 2006 [20,21], using a redox marker: resazurin. This soluble and non-toxic indicator is reduced by electron transfer reactions associated with cellular respiration into a fluorescent byproduct (resofurin - λexcitation = 571 nm, λemission = 585 nm) [22,23]. From the collected experimental data and using a "neural network" type approach (supervised learning approach), a predictive model was established.
2. Materials and Methods
2.1. Bacterial Strain
The study was conducted using the Escherichia coli K12 MG1655 strain (ATCC 700926). Cells are stored in cryotubes at -80°C in a sterile suspension of glycerol (Sigma Aldrich – G9012) at 50% (v/v) in distilled water.
2.2. Growth Conditions
The medium used for cell growth is prepared as follows: 1L of distilled water was supplemented with 5 g of NaCl (Carlo Erba, 479687), 5 g of yeast extract (Biokar Diagnotics – A1202HA), and 10 g of tryptone (Biokar Diagnotics – A1404HA). 15g.L-1 of Agar (Biokar Diagnotics – A1012HA) is added in the liquid medium to obtain a solid medium used in the Petri dishes. The pH was adjusted to 7 with a solution of HCl (0.2M - Sigma Aldrich – H1758) or NaOH (0.2M - Sigma Aldrich – S8045), and the medium was sterilized by autoclaving at 120 °C for 20 min.
Cells are grown on Petri dishes containing solid LB medium at 30°C for 12 hours to obtain isolated colonies. Solid cultures are stored at 4°C for a maximum period of 4 days.
Pre-cultures in liquid LB medium are prepared from isolated colonies on Petri dishes. After an overnight incubation (approximately 8 hours) at 30°C with shaking (250 rpm), a culture is performed in the same medium and under the same temperature and shaking conditions, but at an initial cell density of A620nm = 0.1. The density of the bacterial suspension is monitored until a density of A620nm = 0.45 is reached (absorbance value corresponding to the exponential growth phase of the bacterial strain).
2.3. Toxic Solutions
The pentachlorophenol (PCP) stock solution was prepared at a concentration of 10 g.L-1 from pentachlorophenol sodium salt (CAS number 131-52-2; Sigma Aldrich - 76480) in distilled water.
For the purposes of the study, different solutions (5 pH levels - 5 conductivity levels) were prepared to be used as a matrix for the preparation of toxicant stock solutions. The pH of these different solutions was adjusted using a Sørenson's phosphate buffer (67mM) [24] composed of 2 solutions: a solution A of KH2PO4 at 67 mM (9.08g.L-1; Sigma Aldrich - 795488) and a solution B of Na2HPO4 at 67mM (9.47g.L-1; Sigma Aldrich - 71640). These two solutions were prepared in distilled water. Table 1 summarizes the preparation conditions of the different matrices made for the study to achieve the target pH values.
The conductivity (at 25°C) of the matrices was adjusted with powdered NaCl (Carlo Erba, 479687) to achieve the targeted levels (8.13, 11.03, 15.67, 18.14 and 22.17 mS.cm-1). Each condition was rigorously checked using a pH meter (PHC10101, Hach®) and a conductivity meter (CDC40101, Hach®).
PCP test solutions were prepared immediately before use, from the stock solution, in these different matrices at the following concentrations: 0, 10, 20, 50, 100, 200, 500, and 1000 mg.L-1.
2.4. Bioassays
Once the desired cell density is reached (A620nm = 0.45), the suspension is centrifuged for 5 minutes at 6400 RPM and 4°C. The supernatant is removed, and the pellet is resuspended in sterile MgSO4 solution at 10-2M maintained at 4°C (2.46 g.L-1 of MgSO4∙7H2O - Sigma Aldrich - 63138). This washing step is performed twice. Finally, the washed pellet is resuspended in fresh liquid LB medium, and the cell density is adjusted to A620nm = 1.
Bioassays are performed in white 96-well microplates (White plates, 96-MicroWell™, FluoroNunc™). In each well, 180µL of test solution (PCP or control) are injected, to which 20µL of the washed and adjusted bacterial suspension are added. The microplate is then incubated at the desired temperature (10°C, 20°C, or 30°C) for 40 minutes. After this incubation step, 20µL of resazurin (PrestoBlue™, Invitrogen™ - A13261) are added to each well. Respiratory activity is monitored by fluorimetry using the SPARK® multimode microplate reader (TECAN) (λexcitation = 550nm, bandwidthexcitation = 20nm, λemission = 600nm, bandwidthemission = 20nm, gain = 65, number of flashes = 30, integration time = 40µS). Fluorescence measurements are performed every 10 minutes for 1 hour under the same temperature conditions as the incubation.
2.5. Data Acquisition
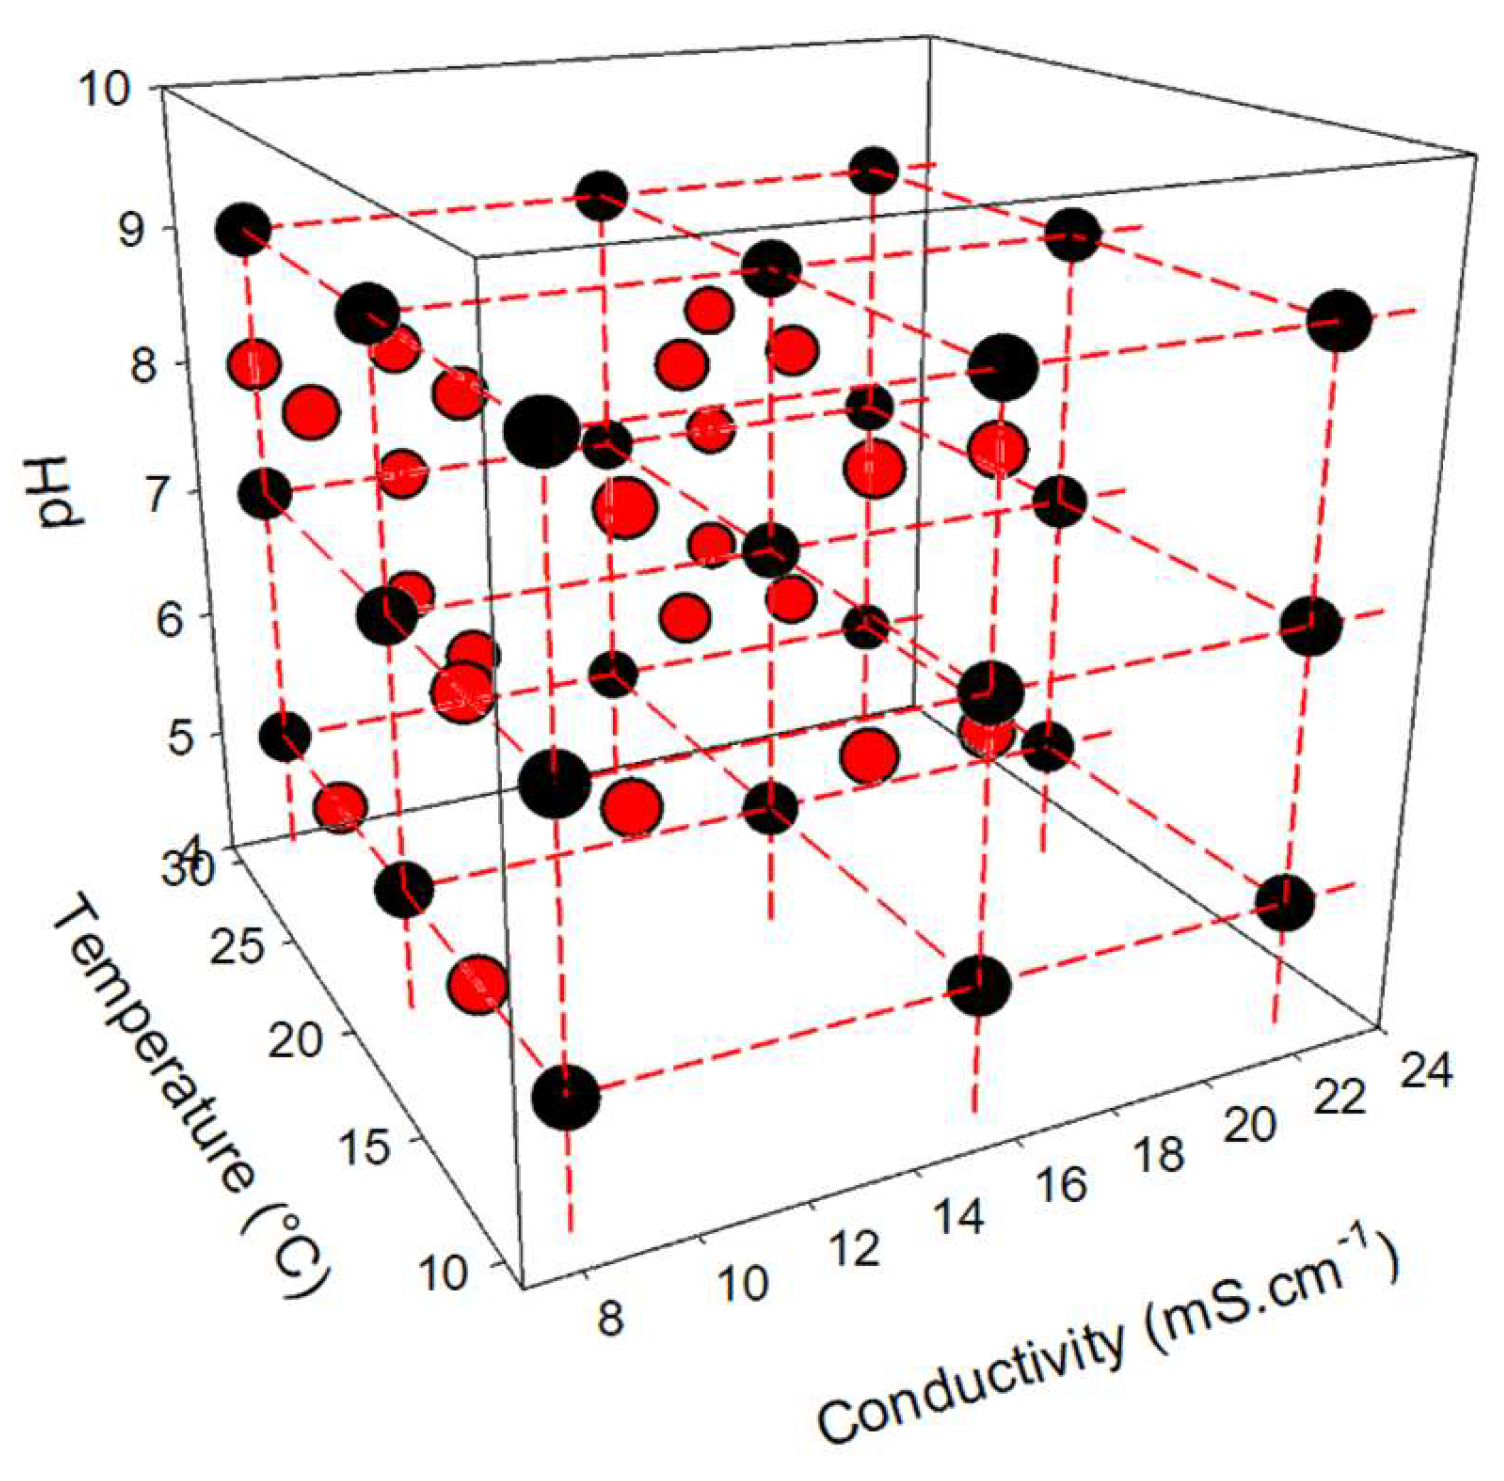
A first dataset was created specifically to train neural network models for data mining. This training dataset includes 216 experimental conditions, resulting from the combination of 3 factors (pH, conductivity, and temperature), representing 27 abiotic conditions (3 levels per abiotic parameter) (see Fig. 2), and 8 levels of toxicant concentration. For each experimental condition, the raw data collected represents the respiratory activity of bacteria (monitored by fluorimetry) over time. Each condition was tested in 3 replicates to account for experimental variability, increasing the training dataset to 648 values.
A second dataset was created to validate the neural network models. To evaluate the robustness of these predictive models, 24 new combinations of abiotic factors were introduced (see Fig. 2). Each condition was tested with the 8 PCP concentrations, in duplicate, resulting in a validation dataset of 384 values.
Figure 2.
Experimental plan of the different tested conditions in the study framework (Black circle: Conditions used for the training dataset; Red circle: Conditions used for the validation dataset).
Figure 2.
Experimental plan of the different tested conditions in the study framework (Black circle: Conditions used for the training dataset; Red circle: Conditions used for the validation dataset).
2.6. Data Processing
The entire process of data processing and model validation is schematically represented in figures SD1 and SD2 in supplementary data.
2.6.1. Raw Data Pre-Processing
From the raw fluorescence values, the intensity of the respiratory kinetics induced by the different conditions tested were determined by linear regression (least squares method – Microsoft Excel), i.e., 648 and 384 kinetics for the training and validation datasets, respectively.
The kinetics values were then used to determine, for each combination of factors, the intensity of the toxic effect induced (inhibition rate) by the tested PCP exposure concentration. The equation used is described in Equation 1 (1).
INH%PCP-T°C-pH -S: Inhibition rate calculated as a function of abiotic factor levels and PCP concentration.
PCP: Concentration of PCP
T°C: Temperature of assay (10, 20 or 30°C)
pH: pH of sample (5, 7 or 9)
CNaCl: Conductivity of sample (8.13, 15.67 or 22.17 mS.cm-1)
2.6.2. EC50 determination
For each combination of abiotic conditions, EC50 values (Half maximal effective concentration) were determined from the respiratory kinetics. Two non-linear regression models (Hill [25,26] and Weibull [27]) were used with the least squares method (MATLAB R2018b - MathWorks®). Only the EC50 values from the model with the best correlation coefficient were retained for each combination of conditions.
2.6.3. Development of Exploratory Neural Network Models
The development of neural network models was carried out using Neuro One 6.13.0.5 software (InModelia) based exclusively on the training data. These were developed according to different architectures involving 1 to 3 hidden neurons. For each architecture tested, 10 models were generated using 3 different activation functions (hyperbolic tangent, arctangent, and exponential) and each based on 100 iterative cycles.
To evaluate the effect of abiotic factors on bacterial respiratory activity, an initial set of models (90 models) was established based on the respiratory kinetics of the training dataset, but excluding all conditions with a non-zero toxicant concentration (i.e., 81 values) (figure SD1). The generated models were then compared based on their ability to best represent the experimental data. Thus, the choice of the model was based on the coefficient of determination (r²).
For the second part of the study aimed at establishing a link between abiotic conditions and the intensity of the toxic effect induced by PCP on E.coli, we performed a second modeling step based, this time, on the entirety of the training dataset (n=648). For this second phase, we used, as input data, the calculated inhibition rates (indicator of the intensity of the induced toxic effect). The most relevant effect model, among the 90 new models established, was selected based on the coefficient of determination calculated from the training data. To validate the selected effect model, we used the validation dataset (Cf. 2.5) based exclusively on novel abiotic combinations (384 inhibition rate values). For this, the conditions tested in the validation dataset were submitted, in parallel, to the predictive models, thus generating a modeled dataset. The data from the validation dataset were compared to those of the modeled dataset to calculate the coefficient of determination and deduce the predictive capabilities of the neural model (figure SD2).
2.6.4. Complementary Statistical Analyses
Complementary statistical analyses (Spearman's non-parametric correlation test and calculation of the coefficient of determination r²) were performed using Prism 6 software (GraphPad).
3. Results
3.1. Effect of Abiotic Parameters (Temperature, pH, Conductivity) on the Respiratory Activity of the E.coli Strain
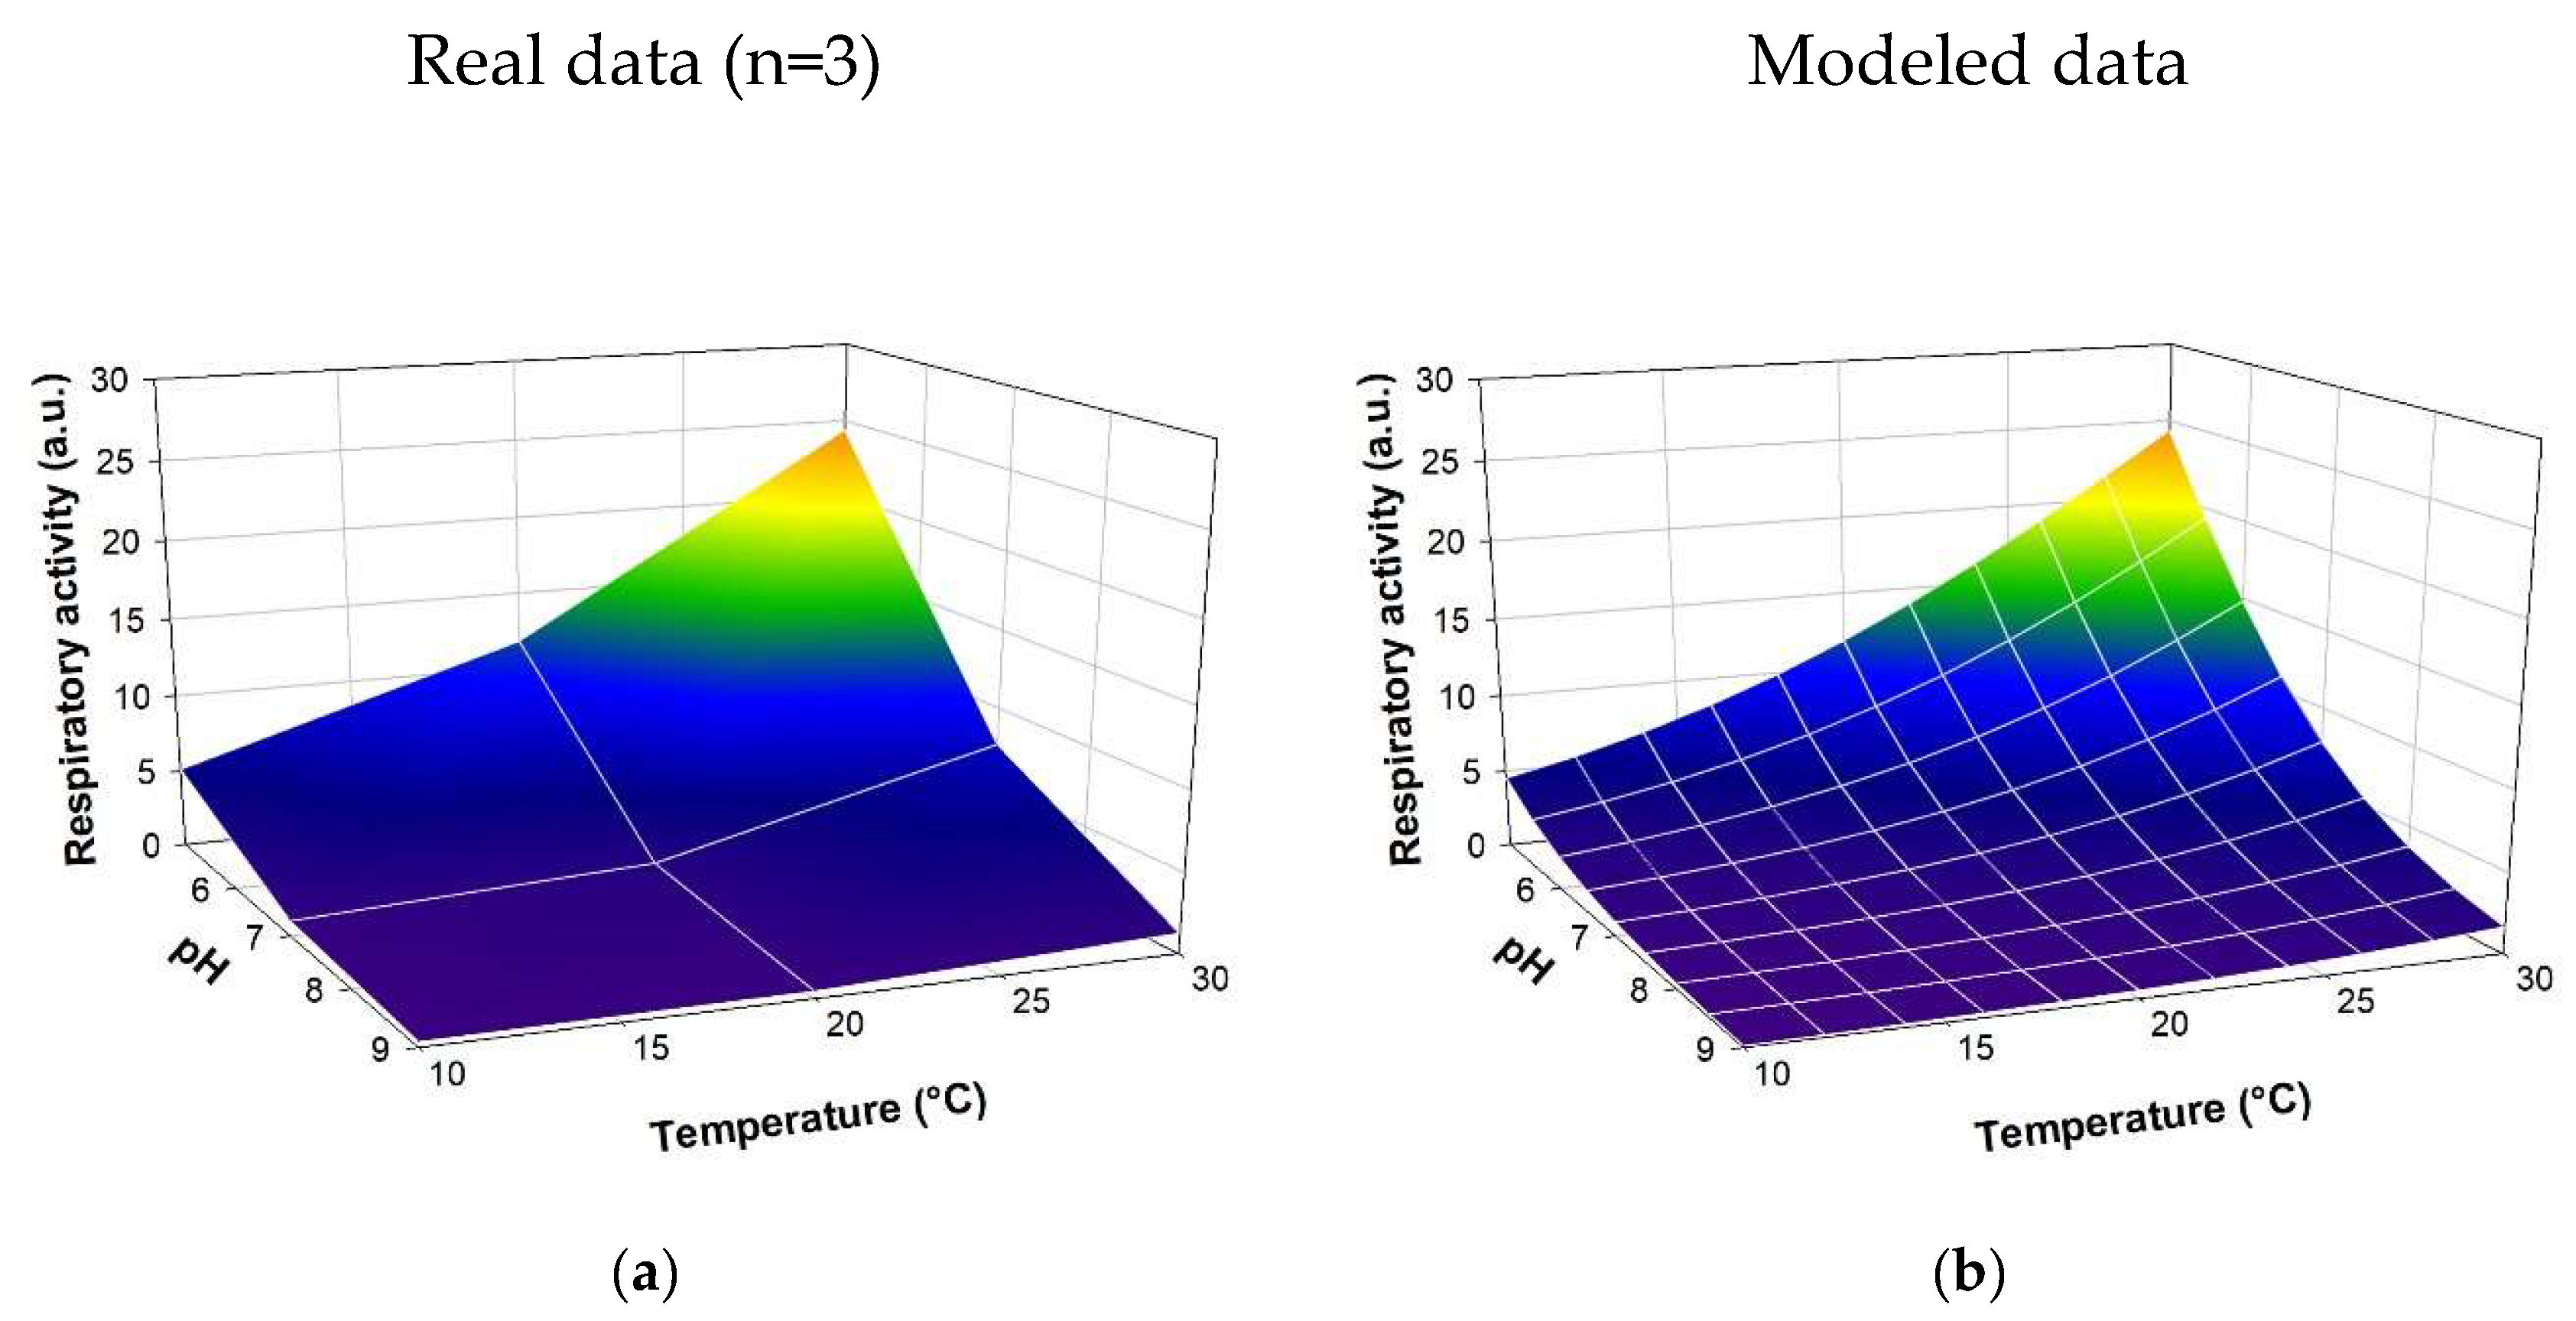
As expected, certain abiotic parameters play a major role in the biological response. Indeed, under 'favorable' conditions of temperature (30°C), pH (5), and conductivity (8 mS.cm-1) and in the absence of toxicant, microorganisms show maximum respiratory activity (see figure 3; Respiratory activity = 25.05 a.u.). Statistical analyses performed on the respiration kinetics show that 2 of the 3 abiotic factors tested have a significant effect on biological activity (α=0.05), namely, temperature (Spearman's r = 0.45, p-value < 0.0001) and pH (Spearman's r = -0.83, p-value < 0.0001). For example, an increase in pH from 5 to 9 can induce a decrease in the respiratory activity of the E.coli strain by a factor of 20.2 ± 4.5. Similarly, a decrease in the assay temperature from 30°C to 10°C divides the measured respiratory intensity by 6 ± 1.9 (Fig. 2). According to the data, conductivity does not significantly affect (Spearman's r = -0.13, p-value = 0.24) the respiratory activity of the E.coli strain in the tested range (8.13 mS.cm-1 to 22.17 mS.cm-1)
The intensity of E.coli respiratory activity as a function of significant abiotic parameters was modeled using a neural network approach via Neuro One 6.13.0.5 software (InModelia). Several architectures and neural activation modes were tested. The selected model relies on a hidden layer consisting of a single neuron, activated by a 'hyperbolic tangent' function (equation SD1). Figure 2 shows the raw data as well as the modeled data. The coefficient of determination r² between the experimental and modeled values is 0.944. According to these results, the neural model represents the action of abiotic parameters on biological activity with high fidelity. It is thus possible to predict the effect of abiotic modifications on the respiratory activity of an E.coli bacterial strain.
Figure 3.
Modelling of the respiratory activity of E.coli according to the abiotic factors (temperature and pH). The model expression is detailed in supplementary data (see equation SD1). (a) Experimental data; (b) modeled data.
Figure 3.
Modelling of the respiratory activity of E.coli according to the abiotic factors (temperature and pH). The model expression is detailed in supplementary data (see equation SD1). (a) Experimental data; (b) modeled data.
3.2. Modeling of Toxic Effects Induced by PCP as a Function of Abiotic Parameter Levels
3.2.1. Combined Effects of Abiotic Parameters (Temperature, pH, Conductivity) on the Inhibition of E.coli Respiratory Activity Induced by PCP.
Eight PCP concentrations were tested to evaluate the effect of abiotic conditions on the bacterial strain's sensitivity. As expected, the presence of the toxicant induces a significant inhibition of bacterial respiratory activity. The EC50 obtained for PCP at 30°C, pH = 5, and 8.13 mS.cm-1 was estimated at 7.3 mg.L-1 (± 0.01 mg.L-1). However, this indicator varies depending on the abiotic conditions. At pH = 7 and pH = 9, the EC50 value significantly increases to 42.01 mg.L-1 (± 1.9 mg.L-1) and 190.2 mg.L-1 (± 5.98 mg.L-1), respectively, which can be interpreted as a decrease in the sensitivity of the E.coli strain to PCP (membrane permeability, metabolic activity, etc.) and/or a decrease in the toxic effect induced by PCP (bioavailability, chemical form, etc.).
Spearman's correlation analysis shows a significant correlation (α = 0.05) between the calculated inhibition rates and the different abiotic factors tested. As expected, the 'concentration' factor is very strongly correlated with the inhibition rates (r(concentration) = 0.71, p-value < 0.0001). This strong correlation is explained by the expected dose-response effect. The 'pH' factor is inversely correlated with the biological response (r(pH) = -0.43, p-value < 0.0001). In other words, the higher the pH value (within the tested range), the lower the observed inhibition rate. This observation is consistent with the work of Rutgers et al. [28], which showed similar effects of pH on the action of PCP (growth monitoring of Sphingomonas sp.). PCP is a weak acid (pKaPCP-sodium salt = 5.3). In water, two forms coexist depending on the pH, PCP0 (the most toxic form, non-polar, and predominant when pH < 5.3) and PCP- (the dissociated form, highly soluble in water, phenolate ion, predominant when pH > 5.3). The difference in toxicity between the two forms of PCP (Tox_PCP0 > Tox_PCP-) and the form taken by PCP in water can explain the decrease in toxicity when the pH increases.
To a lesser extent, the 'conductivity' and 'temperature' factors also contribute to the biological response (r(conductivity) = 0.20, p-value =< 0.0001; r(temperature) = 0.16, p-value =< 0.0001). Conductivity (an indicator of salt concentration) plays a predominant role in maintaining the cell's osmotic balance. An increase in conductivity tends to modify the lipid structure [29] and increase the permeability [30] of bacterial membranes. This phenomenon can facilitate the diffusion of the toxicant into the intracellular environment and, consequently, increase the induced toxic effect, thus explaining the results obtained. In parallel, temperature increases the fluidity of cellular membranes [31,32], which can increase their permeability to toxicants. By facilitating the entry of toxicants into bacterial cells, the intensity of the induced effect can be modified [33].
3.2.2. Development and Validation of Predictive Models
The training dataset (n=648) was used for the development of predictive models (neural network models) aiming to correlate the inhibition rate of the E.coli strain as a function of PCP concentration and abiotic factors (pH, conductivity and temperature). Several neural architectures were tested based on a variable number of hidden neurons and with different neural activation modes.
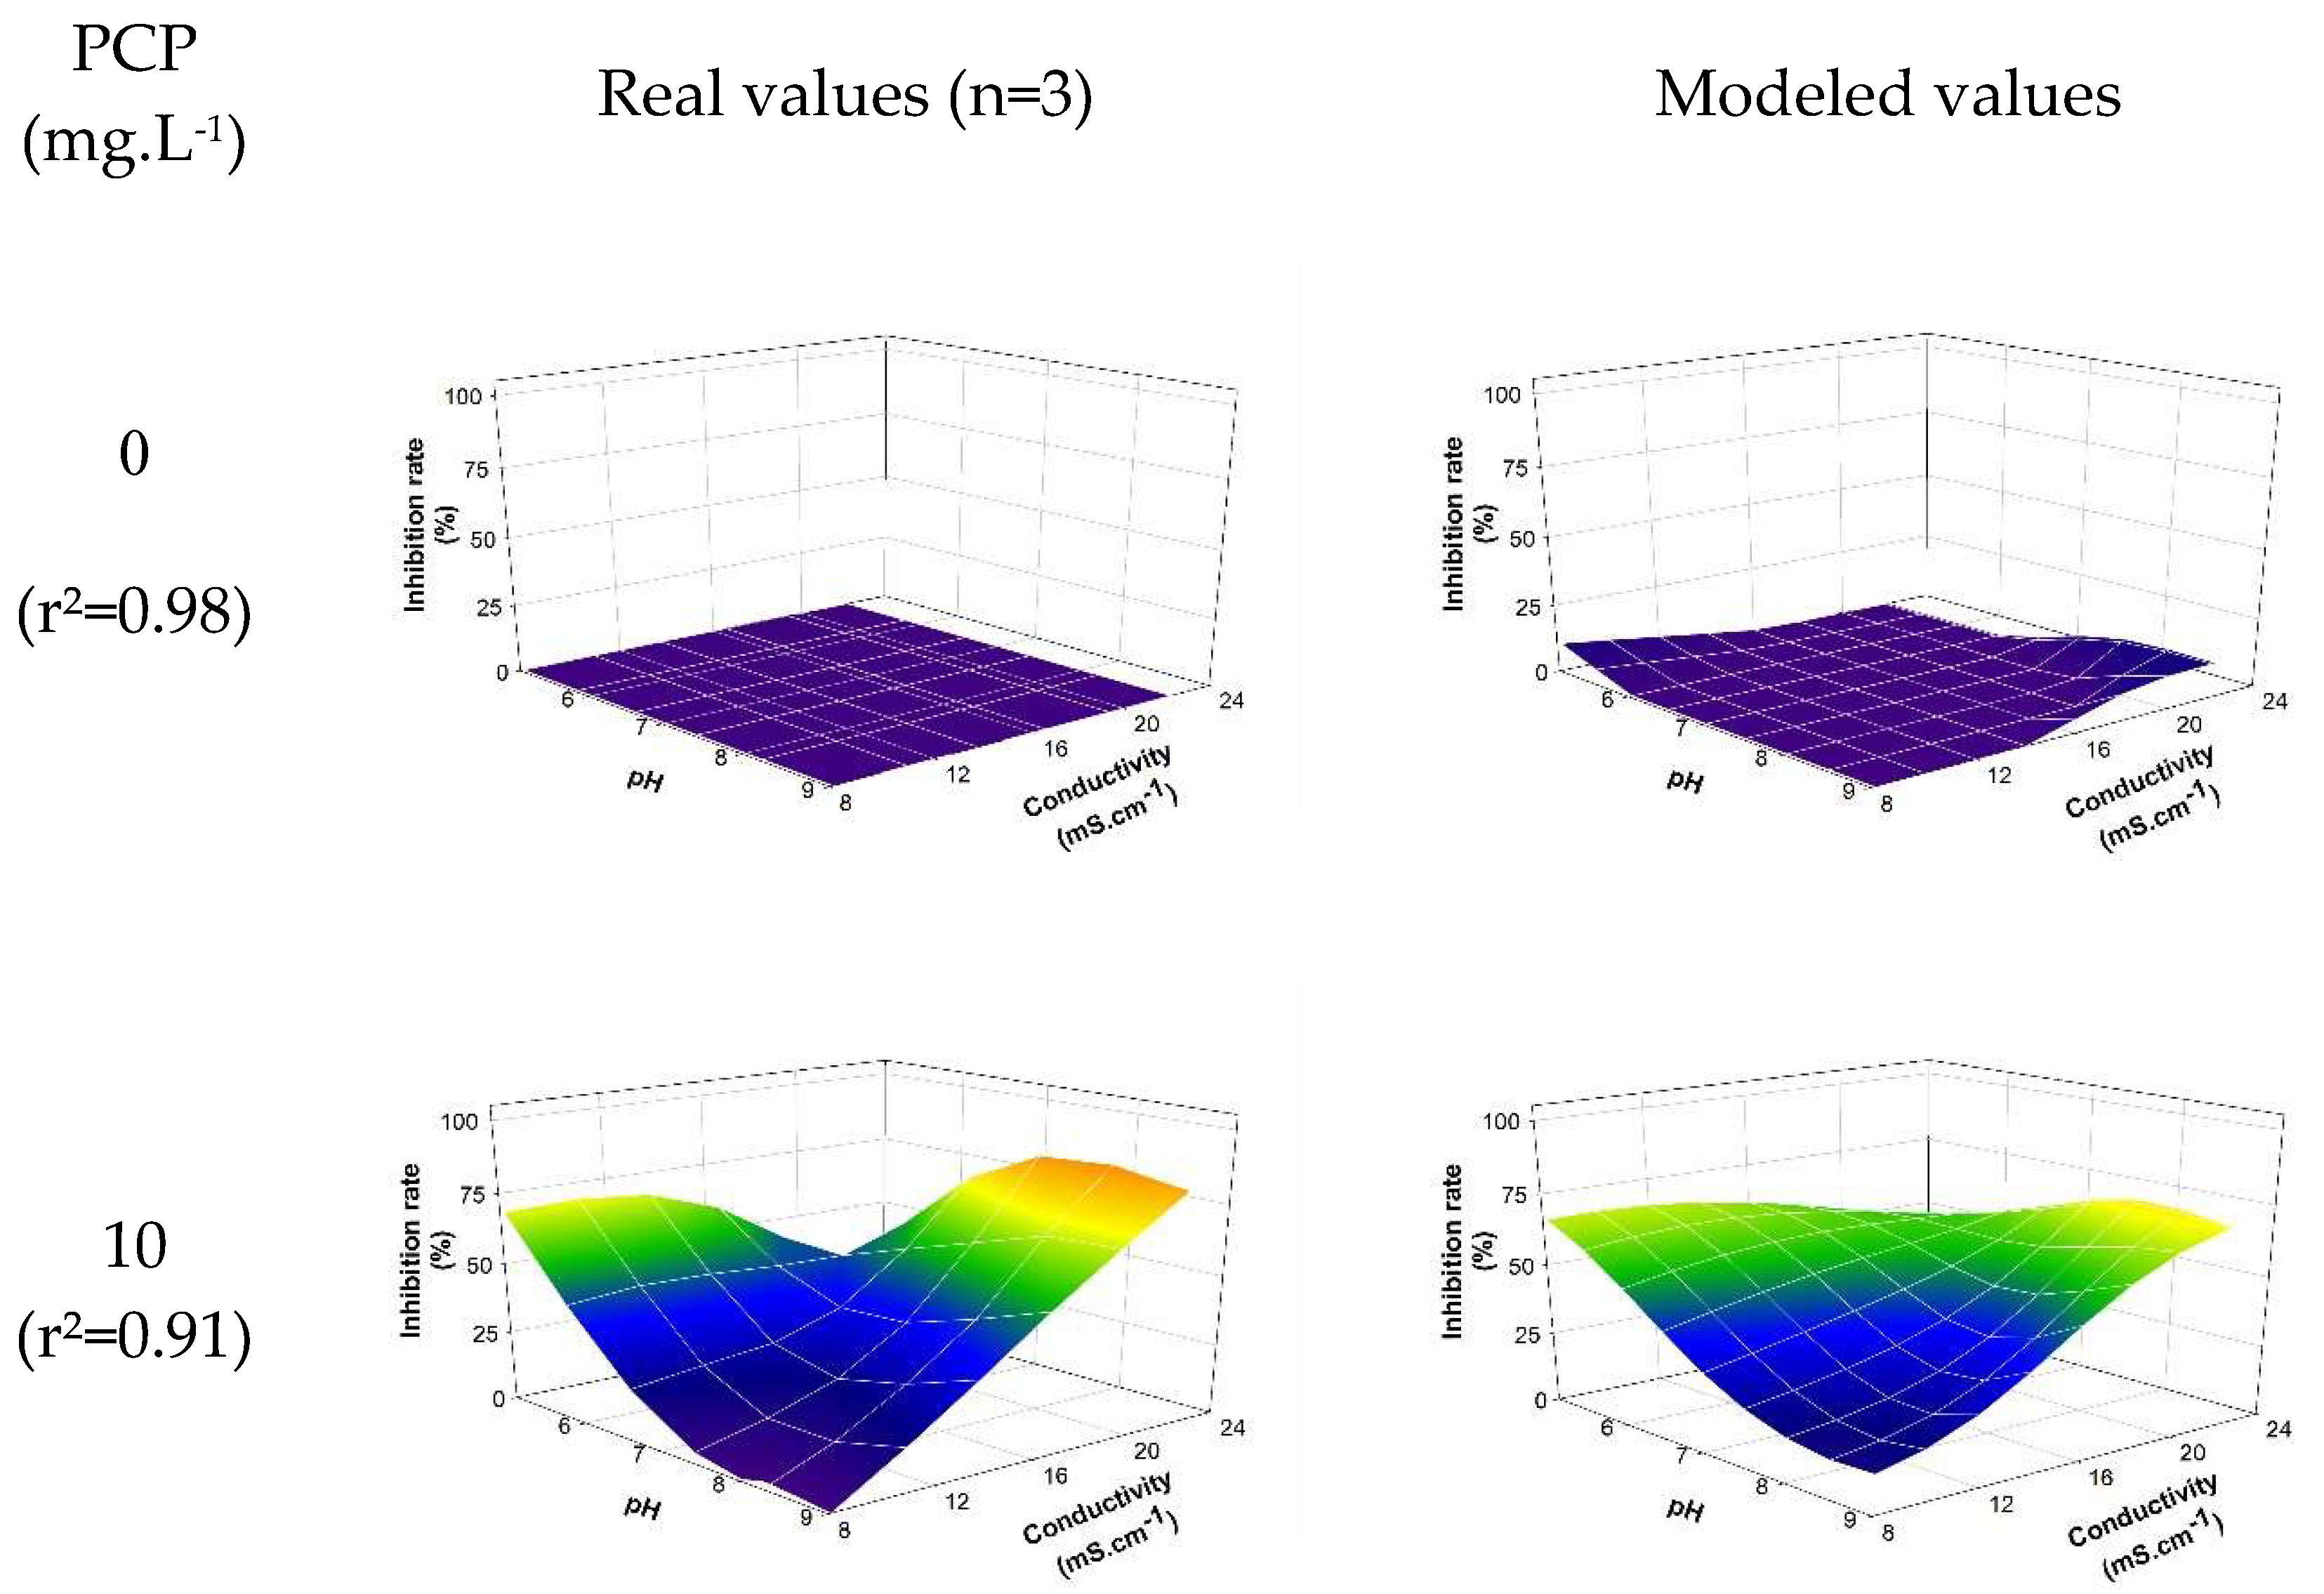
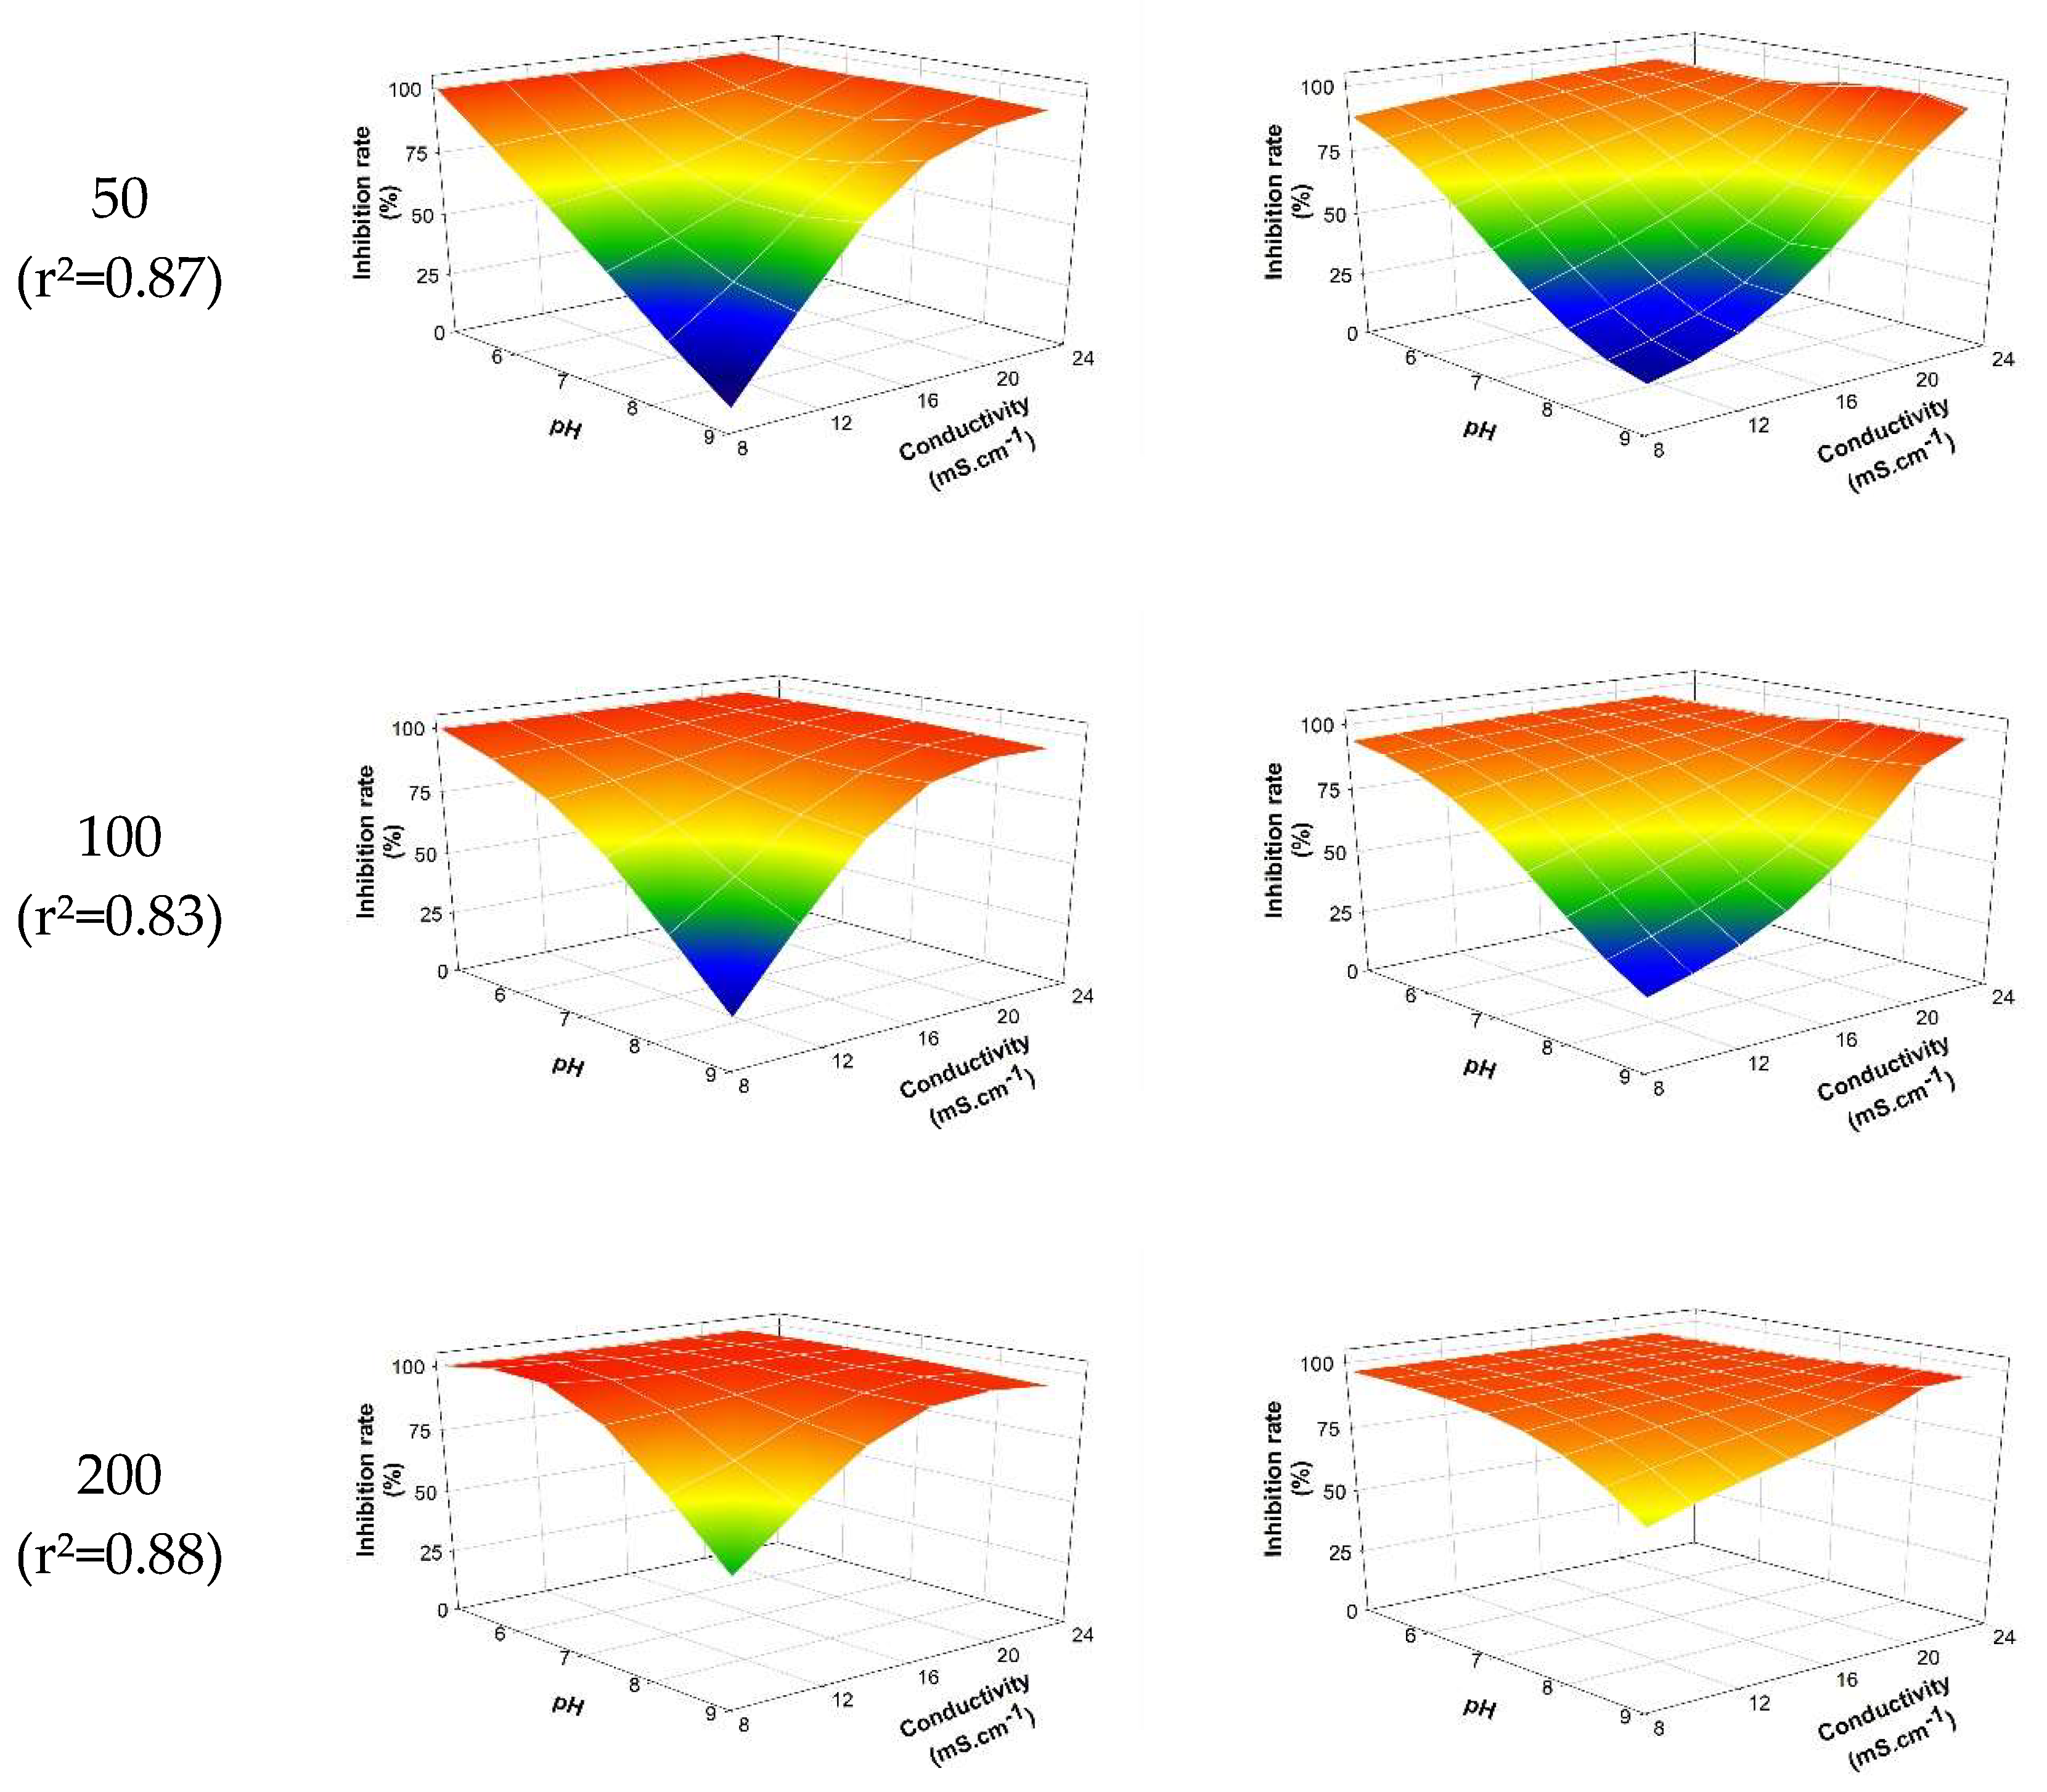
The neural model selected from the 90 generated models relies on 3 hidden neurons activated by 'hyperbolic tangent' functions (equation SD2). The intensity of toxic effects (inhibition rate) as a function of abiotic parameters is shown in figure 4. The coefficient of determination (r²) between the experimental data and the modeled data from the selected neural algorithm is estimated at 0.918. The selected modeling allows for the establishment, with a certain relevance, of the relationship between the biological response (intensity of the toxic effect) and the levels taken by the studied abiotic parameters (pH, conductivity, temperature). The results notably allow for the visualization of the effect of abiotic parameters as mentioned previously. As expected, pH plays a predominant role in the biological response (see 3.2.1): the higher the pH, the less significant the toxic intensity induced by PCP. However, the combined effect of a decrease in pH associated with an increase in conductivity reinforces the toxic effect generated by PCP. For a PCP concentration of 50 mg.L-1, the observed inhibition is approximately 9.44% ± 1.2% versus 99.56% ± 0.07% for pH = 9 and conductivity = 8.13 mS.cm-1 and pH = 5 and conductivity = 22.17 mS.cm-1, respectively. Temperature also impacts the induced toxic intensity but to a lesser extent (results not shown).
Figure 4.
Observed/modelled inhibition rate according to pH and conductivity at 30°C and the PCP concentration. The model expression is detailed in supplementary data (see equation SD2).
Figure 4.
Observed/modelled inhibition rate according to pH and conductivity at 30°C and the PCP concentration. The model expression is detailed in supplementary data (see equation SD2).
To validate the approach, the selected model was deployed on novel conditions included in the validation dataset (abiotic parameter levels different from those used in the training dataset). The results thus generated were compared to the collected experimental data (figure 5). With an r² of 0.8877, the predicted results appear faithful to reality. Indeed, the model is able to predict, with a certain robustness, the intensity of toxic effects likely to be observed experimentally.
Consequently, these results validate the idea of extrapolating results from a bioassay. Indeed, these results highlight the ability, through a predictive model, to predict the effect of a pollutant on a target organism, taking into account significant environmental variations. Therefore, it is feasible to transpose results obtained in the laboratory under controlled conditions to another environment by weighting the response according to the levels taken by the abiotic factors of the target environment.
Figure 5.
Validation of the predictive model performed using the validation dataset (n=384). Black line: Correlation line; Red dashed line: 95% Prediction band.
Figure 5.
Validation of the predictive model performed using the validation dataset (n=384). Black line: Correlation line; Red dashed line: 95% Prediction band.

This demonstration, however, remains limited in terms of deployment. Indeed, the chosen predictive model, being based on a supervised learning approach (iterative neural network approach), the scope of application remains confined to the tested pollutant, i.e., PCP, and the bacterial strain used (E.coli). Furthermore, abiotic effects play a combined role on cellular metabolism but also on the physico-chemistry of pollutants [34,35]. Also, in the current state of knowledge, extrapolation to other molecules remains very complex and requires a better understanding of the environmental chemistry of pollutants [36]. Finally, the resistance mechanisms likely to be deployed by exposed organisms are very diverse, inducing very different resistance capacities from one organism to another [37,38].
4. Discussion and Conclusions
Through this study, a model was established by supervised learning (neural network) allowing to predict the level of toxicity induced by an organic molecule (PCP) on an organism (E.coli) with relevance (r² ≈ 0.9). The major interest of this model lies in its ability to take into account environmental variations related to pH, temperature and/or conductivity. Although limited to a single model organic pollutant, this study constitutes a proof of concept demonstrating that it is possible to anticipate the effect of a toxicant, PCP, in different environments by weighting its action according to simple abiotic parameters.
The developed model possesses inherent limitations regarding its direct applicability to other molecules. This constraint stems from the intricate interplay between abiotic factors and the toxicant-target relationship. As highlighted earlier, environmental parameters such as pH, temperature, and conductivity exert a significant influence on both the biological sensitivity of the target organism (in this case, E.coli) and the chemical behavior of the toxicant itself. The interactions between abiotic factors, target organisms, and pollutants necessitate the use of data-driven methodologies. Supervised learning approaches, such as the neural network model employed in this study, offer a powerful means to capture these complex relationships by learning from empirical data. However, the model's reliance on training data specific to PCP and E.coli limits its immediate transferability to other molecules or organisms.
This study, while focused on a specific model pollutant and organism, opens a promising avenue for enhancing environmental pollutant management by suggesting new strategies likely to contribute significantly to the improvement of pollutant management in the environment. Currently, regulatory decisions regarding pollutant management often rely on standardized bioassays conducted under controlled laboratory conditions. However, these conditions may not accurately reflect the environmental complexity. Abiotic factors, such as pH, temperature, and conductivity, can significantly influence the toxicity of pollutants, rendering laboratory-derived toxicity values potentially misleading. The proposed predictive tools offer a solution by enabling the extrapolation of laboratory findings to specific environmental contexts. In the future, these tools could empower legislators and industrialists with a more comprehensive understanding of the environmental effects of organic molecules. By integrating environmental variability into toxicity predictions, these tools can facilitate more informed decision-making regarding pollutant regulation and industrial practices. For instance, the study demonstrates that PCP toxicity is significantly influenced by pH and conductivity. Using this knowledge, legislators could potentially restrict the application or discharge of PCP in environments where these factors exacerbate its toxicity, such as acidic and high-conductivity waters.
Author Contributions
For research articles with several authors, a short paragraph specifying their individual contributions must be provided. The following statements should be used “Conceptualization, S.J. and G.T.; methodology, S.J.; validation, S.J. and G.T.; writing—original draft preparation, S.J.; writing—review and editing, S.J.; supervision, S.J.; project administration, G.T.; funding acquisition, G.T. All authors have read and agreed to the published version of the manuscript.
Funding
This research received no external funding.
Informed Consent Statement
Not applicable
Acknowledgments
The authors warmly thank Tom Voisin and Léa Pernot (laboratory intern) for their contribution to the acquisition of data necessary for the project.
Conflicts of Interest
The authors declare no conflicts of interest.
Abbreviations
The following abbreviations are used in this manuscript:
| MDPI | Multidisciplinary Digital Publishing Institute |
| DOAJ | Directory of open access journals |
| TLA | Three letter acronym |
| LD | Linear dichroism |
References
- Kokkali, V.; van Delft, W. Overview of Commercially Available Bioassays for Assessing Chemical Toxicity in Aqueous Samples. TrAC Trends in Analytical Chemistry 2014, 61, 133–155. [CrossRef]
- Fang, D.; Gao, G.; Yang, Y.; Wang, Y.; Gao, L.; Zhi, J. Redox Mediator-Based Microbial Biosensors for Acute Water Toxicity Assessment: A Critical Review. ChemElectroChem 2020, n/a. [CrossRef]
- Gupta, N.; Renugopalakrishnan, V.; Liepmann, D.; Paulmurugan, R.; Malhotra, B.D. Cell-Based Biosensors: Recent Trends, Challenges and Future Perspectives. Biosensors and Bioelectronics 2019, 141, 111435. [CrossRef]
- Hassan, S.H.A.; Van Ginkel, S.W.; Hussein, M.A.M.; Abskharon, R.; Oh, S.-E. Toxicity Assessment Using Different Bioassays and Microbial Biosensors. Environment International 2016, 92–93, 106–118. [CrossRef]
- Jouanneau, S.; Durand-Thouand, M.-J.; Thouand, G. Design of a Toxicity Biosensor Based on Aliivibrio Fischeri Entrapped in a Disposable Card. Environ Sci Pollut Res 2016, 23, 4340–4345. [CrossRef]
- Zhou, T.; Han, H.; Liu, P.; Xiong, J.; Tian, F.; Li, X. Microbial Fuels Cell-Based Biosensor for Toxicity Detection: A Review. Sensors (Basel) 2017, 17. [CrossRef]
- Su, L.; Jia, W.; Hou, C.; Lei, Y. Microbial Biosensors: A Review. Biosensors and Bioelectronics 2011, 26, 1788–1799. [CrossRef]
- Amaro, F.; Turkewitz, A.P.; Martín-González, A.; Gutiérrez, J. Whole-cell Biosensors for Detection of Heavy Metal Ions in Environmental Samples Based on Metallothionein Promoters from Tetrahymena Thermophila. Microb Biotechnol 2011, 4, 513–522. [CrossRef]
- Vasseur, P.; Bois, F.; Ferard, J.F.; Rast, C. Influence of Physicochemical Parameters on the Microtox Test Response. Environ. Toxicol. Water Qual. 1986, 1, 283–300. [CrossRef]
- Nagata, S.; Zhou, X. Analyses of Factors to Affect the Bioassay System Using Luminescent Bacterium <I>Vibrio Fischeri</I>. Journal of Health Science 2006, 52, 9–16. [CrossRef]
- Deryabin, D.; Aleshina, E. Effect of Salts on Luminescence of Natural and Recombinant Luminescent Bacterial Biosensors. Applied Biochemistry and Microbiology 2008, 44, 292–296.
- Toro, D.M.D.; Allen, H.E.; Bergman, H.L.; Meyer, J.S.; Paquin, P.R.; Santore, R.C. Biotic Ligand Model of the Acute Toxicity of Metals. 1. Technical Basis. Environmental Toxicology and Chemistry 2001, 20, 2383–2396. [CrossRef]
- Niyogi, S.; Wood, C.M. Biotic Ligand Model, a Flexible Tool for Developing Site-Specific Water Quality Guidelines for Metals. Environ. Sci. Technol. 2004, 38, 6177–6192. [CrossRef]
- Santore, R.C.; Ryan, A.C.; Kroglund, F.; Rodriguez, P.H.; Stubblefield, W.A.; Cardwell, A.S.; Adams, W.J.; Nordheim, E. Development and Application of a Biotic Ligand Model for Predicting the Chronic Toxicity of Dissolved and Precipitated Aluminum to Aquatic Organisms. Environmental Toxicology and Chemistry 2018, 37, 70–79. [CrossRef]
- Kamo, M.; Nagai, T. An Application of the Biotic Ligand Model to Predict the Toxic Effects of Metal Mixtures. Environmental Toxicology and Chemistry 2008, 27, 1479–1487. [CrossRef]
- Smith, K.S.; Balistrieri, L.S.; Todd, A.S. Using Biotic Ligand Models to Predict Metal Toxicity in Mineralized Systems. Applied Geochemistry 2015, 57, 55–72. [CrossRef]
- Phull, B. 2.18 - Marine Corrosion. In Shreir’s Corrosion; Cottis, B., Graham, M., Lindsay, R., Lyon, S., Richardson, T., Scantlebury, D., Stott, H., Eds.; Elsevier: Oxford, 2010; pp. 1107–1148 ISBN 978-0-444-52787-5.
- Chapter 11 - Relevant Applications. In Membrane Science and Technology; Drioli, E., Criscuoli, A., Curcio, E., Eds.; Membrane Contactors: Fundamentals, Applications and Potentialities; Elsevier, 2006; Vol. 11, pp. 375–450.
- Office Francais de la Biodiversité Bienvenue Sur Naïades | Naïades Available online: http://www.naiades.eaufrance.fr/bienvenue-naiades (accessed on 24 July 2020).
- Tizzard, A.C.; Bergsma, J.H.; Lloyd-Jones, G. A Resazurin-Based Biosensor for Organic Pollutants. Biosensors and Bioelectronics 2006, 22, 759–763. [CrossRef]
- Fai, P.B.; Grant, A. A Rapid Resazurin Bioassay for Assessing the Toxicity of Fungicides. Chemosphere 2009, 74, 1165–1170. [CrossRef]
- O’Brien, J.; Wilson, I.; Orton, T.; Pognan, F. Investigation of the Alamar Blue (Resazurin) Fluorescent Dye for the Assessment of Mammalian Cell Cytotoxicity. European Journal of Biochemistry 2000, 267, 5421–5426. [CrossRef]
- Byth, H.-A.; Mchunu, B.I.; Dubery, I.A.; Bornman, L. Assessment of a Simple, Non-Toxic Alamar Blue Cell Survival Assay to Monitor Tomato Cell Viability. Phytochemical Analysis 2001, 12, 340–346. [CrossRef]
- Powell, K.J.; Brown, P.L.; Byrne, R.H.; Gajda, T.; Hefter, G.; Sjöberg, S.; Wanner, H. Chemical Speciation of Environmentally Significant Heavy Metals with Inorganic Ligands. Part 1: The Hg2+– Cl–, OH–, CO32–, SO42–, and PO43– Aqueous Systems (IUPAC Technical Report). Pure and Applied Chemistry 2005, 77, 739–800. [CrossRef]
- Vindimian, E.; Robaut, C.; Fillion, G. A Method for Cooperative or Noncooperative Binding Studies Using Nonlinear Regression Analysis on a Microcomputer. J. Appl. Biochem. 1983, 5, 261–268.
- Garric, J.; Migeon, B.; Vindimian, E. Lethal Effects of Draining on Brown Trout. A Predictive Model Based on Field and Laboratory Studies. Water Research 1990, 24, 59–65. [CrossRef]
- Carroll, K.J. On the Use and Utility of the Weibull Model in the Analysis of Survival Data. Controlled Clinical Trials 2003, 24, 682–701. [CrossRef]
- Rutgers, M.; Bommel, S. van; Breure, A.M.; Andel, J.G. van; Duetz, W.A. Effect of pH on the Toxicity and Biodegradation of Pentachlorophenol by Sphingomonas Sp Strain P5 in Nutristat Culture. Environmental Toxicology and Chemistry 1998, 17, 792–797. [CrossRef]
- Gandhi, A.; Shah, N.P. Effect of Salt Stress on Morphology and Membrane Composition of Lactobacillus Acidophilus, Lactobacillus Casei, and Bifidobacterium Bifidum, and Their Adhesion to Human Intestinal Epithelial-like Caco-2 Cells. Journal of Dairy Science 2016, 99, 2594–2605. [CrossRef]
- Kojima, S.; Nikaido, H. High Salt Concentrations Increase Permeability through OmpC Channels of Escherichia Coli. J Biol Chem 2014, 289, 26464–26473. [CrossRef]
- Murínová, S.; Dercová, K. Response Mechanisms of Bacterial Degraders to Environmental Contaminants on the Level of Cell Walls and Cytoplasmic Membrane. Int J Microbiol 2014, 2014, 873081. [CrossRef]
- Nedwell, D.B. Effect of Low Temperature on Microbial Growth: Lowered Affinity for Substrates Limits Growth at Low Temperature. FEMS Microbiology Ecology 1999, 30, 101–111. [CrossRef]
- Patra, R.W.; Chapman, J.C.; Lim, R.P.; Gehrke, P.C.; Sunderam, R.M. Interactions between Water Temperature and Contaminant Toxicity to Freshwater Fish. Environ Toxicol Chem 2015, 34, 1809–1817. [CrossRef]
- Ashworth, D.J.; Alloway, B.J. Influence of Dissolved Organic Matter on the Solubility of Heavy Metals in Sewage-Sludge-Amended Soils. Communications in Soil Science and Plant Analysis 2008, 39, 538–550. [CrossRef]
- Haritash, A.K.; Kaushik, C.P. Biodegradation Aspects of Polycyclic Aromatic Hydrocarbons (PAHs): A Review. Journal of Hazardous Materials 2009, 169, 1–15. [CrossRef]
- Turschwell, M.P.; Connolly, S.R.; Schäfer, R.B.; De Laender, F.; Campbell, M.D.; Mantyka-Pringle, C.; Jackson, M.C.; Kattwinkel, M.; Sievers, M.; Ashauer, R.; et al. Interactive Effects of Multiple Stressors Vary with Consumer Interactions, Stressor Dynamics and Magnitude. Ecology Letters 2022, 25, 1483. [CrossRef]
- Nin, C.J.; Rodgher, S. Effect of a Temperature Rise on Metal Toxicity for the Aquatic Biota: A Systematic Review. Revista Brasileira de Ciências Ambientais 2021, 56, 710–720. [CrossRef]
- Redman, A.D.; Parkerton, T.F.; Letinski, D.J.; Sutherland, C.A.; Butler, J.D.; Toro, D.M.D. Modeling Time-Dependent Aquatic Toxicity of Hydrocarbons: Role of Organism Weight, Temperature, and Substance Hydrophobicity. Environmental Toxicology and Chemistry 2022, 41, 3070. [CrossRef]

Table 1.
pH of matrices used to prepare dilute toxic solutions.
| pH = 5 | pH = 6 | pH = 7 | pH = 8 | pH = 9 | |
| Solution A | 98.8% | 86.8% | 38.5% | 6% | 0.3% |
| Solution B | 1.2% | 13.2% | 61.5% | 88% | 99.7% |
Disclaimer/Publisher’s Note: The statements, opinions and data contained in all publications are solely those of the individual author(s) and contributor(s) and not of MDPI and/or the editor(s). MDPI and/or the editor(s) disclaim responsibility for any injury to people or property resulting from any ideas, methods, instructions or products referred to in the content. |
© 2025 by the authors. Licensee MDPI, Basel, Switzerland. This article is an open access article distributed under the terms and conditions of the Creative Commons Attribution (CC BY) license (http://creativecommons.org/licenses/by/4.0/).
Copyright: This open access article is published under a Creative Commons CC BY 4.0 license, which permit the free download, distribution, and reuse, provided that the author and preprint are cited in any reuse.


