
Submitted:
05 September 2025
Posted:
09 September 2025
You are already at the latest version
Abstract
Cycling is recognized as a key strategy for the transition to sustainable urban mobility and for improving public health, yet it remains a marginal mode of transport in many cities. In an effort to promote cycling, some places offer financial incentives to encourage people to use bicycles as a mode of transportation. However, these policies raise social justice concerns regarding who benefits from such policies and who does not. This paper explores the operationalization of a policy designed to promote cycling through finan- cial incentives, specifically by compensating individuals for cycled kilometers with public transport credits. The study incorporates a social justice-oriented design and emphasizes the importance of diversifying cycling demographics, integrating cycling with public transport, and leveraging data to support fair urban mobility. Grounded in transport, mobility, and data justice literature, we introduce policy design guidelines for social-justice-informed ‘pay for cycling’ financial incentives, bridging social science and data science. These guidelines are illustrated through a pilot project for São Paulo’s “Bike SP” program, which includes app development, participant selection, and data collection. The pilot project reveals demographic and socioeconomic inequalities in cycling within São Paulo. It also provides a model for similar policies in other cities. The findings highlight the need for inclusive participant selection criteria and the potential of financial incentive policies to generate valuable cycling data, foster a cycling community, and integrate with broader mobility and public health policies. We argue that such policies should be part of a comprehensive strategy for creating an inclusive mobility environment.
Keywords:
Cycling Promotion
; Financial Incentives
; Mobility Data Justice
; Urban Computing
; Transport Policy
1. Introduction
Despite cycling being recognized as a healthy transport mode that benefits users, cities, and the environment [1], it remains underutilized in most cities worldwide, with only a small percentage of citizens engaging in this mode of transport. To change this reality, several cities are starting to experiment with programs to incentivize the use of bicycles for urban mobility. This paper focuses on operationalizing a policy that aims to promote cycling through financial incentives - `paying people for cycled kilometers with public transport credits via an app.
However, existing approaches to cycling promotion may face a critical gap in addressing the underlying social inequalities that shape mobility access, choices, and practices. Factors such as financial constraints, time limitations, geographical location, and access to opportunities significantly influence people’s mobility choices [2]. Neglecting these factors can lead to biased policies that favor already privileged individuals, rather than maximizing the potential impact of cycling incentives on reducing inequality. This creates a risk where policies intended to promote sustainable transport may inadvertently reinforce existing mobility inequalities rather than address them. A sustainable perspective on mobility requires not only an environmental dimension, but also a social one that aims to address existing disparities [3,4].
In light of this, a more comprehensive approach to this policy development is needed, that considers the complex interplay between sustainable mobility initiatives and social justice. The central research question guiding this article is: How can we incorporate a social justice perspective into the design of a “pay people to cycle” policy and its associated app, data collection, and analysis? To address this question, we take an interdisciplinary approach that integrates data science approaches with social science concepts on cycling cities and mobility (data) justice to propose social-justice-informed design principles that can be used for the operationalization of `pay for cycling’ financial incentive policies, with potential relevance for broader use cases too.
To demonstrate the capabilities of this strategy, we present a case study that applies these design principles to the planning of a pilot experiment for São Paulo’s “Bike SP” Program, including app, registration process, participant selection, and associated data collection and analysis. São Paulo, the largest city in the southern hemisphere, provides a compelling context where only approximately 1% of daily trips use cycling as a mode of transport [5], and where a 2016 law created the "Bike SP" program to remunerate cycling through public transport credits. Our pilot design aims to do more than merely incentivize existing cycling patterns, such as those undertaken by male, middle-class commuters in downtown areas using current infrastructure. Instead, the focus is on designing with social justice in mind. This involves diversifying cycling demographics to include those who could benefit most from the policy, and also creating synergies with public transport and other policies.
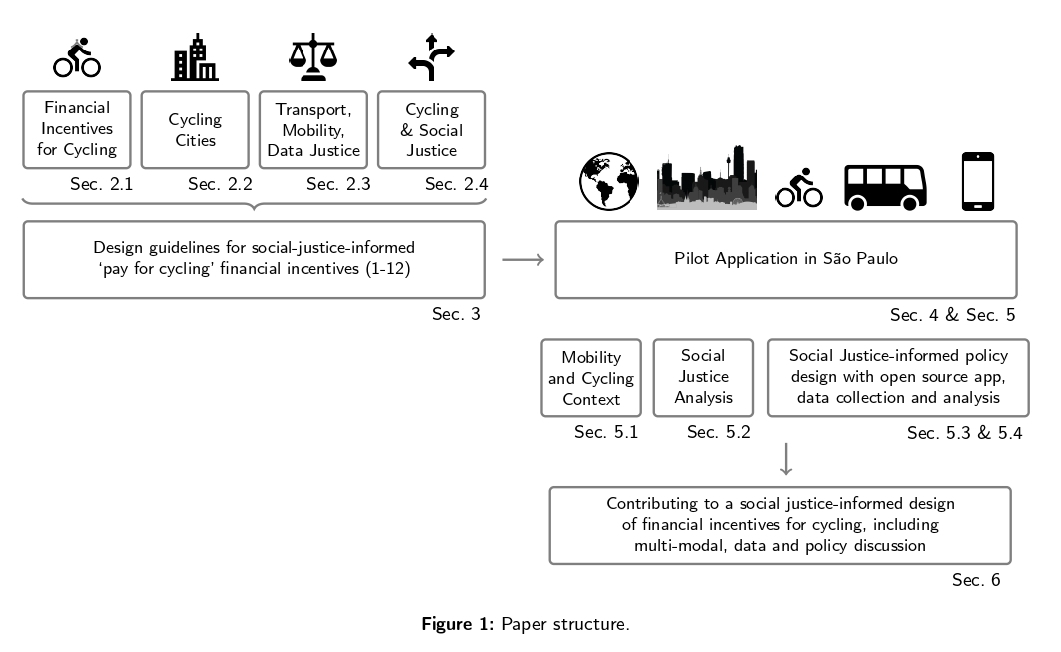
In terms of paper structure, Section 2 outlines the methodology, followed by Section 3 which provides relevant context on transport/mobility (data) justice, cycling and social justice, cycling cities, and financial incentives for cycling. Section 4 draws on these to develop design guidelines.This is followed by the details of the pilot application (Section 5), a critical discussion of results (Section 6), and the conclusion (Section 7).
2. Methodology
Our research methodology consists of three steps: (1) a literature review on mobility/data/social justice and on financial incentives for cycling as a means to build a solid ground for how a “pay people to cycle” policy could foster a more inclusive cycling environment; (2) the development of operationalization guidelines aimed at maximizing the policy potential benefits; (3) validation of the guidelines by applying them in the context of the Bike SP program in São Paulo.
Figure 1 shows a visual overview of the research methodology.
2.1. Literature Review
To base the development of the operationalization guidelines, we conducted a structured review on the four main topics relevant to our research:
Transport, Mobility and Data Justice: To ensure that cycling initiatives are designed in an equitable way, it is necessary to situate bike usage within a broader social justice framework [6]. For that, we conducted a narrative literature review on social justice, with a focus on cycling and elements closely related to financial incentives policies. A narrative literature review synthesizes findings on a particular topic, often incorporating a subjective examination and critique [7]. Three main concepts emerged as relevant in our review: Transport Justice, Mobility Justice and Data Justice. At the intersection of these two concepts lies the framework of Mobility Data Justice [8].
Cycling and Social Justice: We conducted a focused literature review examining equity dimensions in cycling, including gender disparities, age-related barriers, social class differences, and spatial distribution of infrastructure. This review highlighted how cycling policies must address existing inequalities to avoid excluding marginalized groups from cycling benefits.
Cycling Cities: We examined urban cycling promotion literature, particularly The Cycling Cities framework, which analyzes cycling through five factors: urban form, mobility alternatives, transport policy, social movements, and cultural status. This provides context for understanding how financial incentives operate within broader urban mobility systems.
Financial Incentives for Cycling: In this section, we offer a review of grey literature on such policies. Our selection criteria focused on initiatives that offer direct financial benefits to individuals, such as tax deductions, purchase subsidies or rebates, and payments per kilometer cycled. We excluded broader investments in cycling infrastructure that do not directly translate into a personal financial incentive for the cyclist. Furthermore, we focused on conventional bicycles rather than e-bikes, given the specific focus of our research. The goal is not to provide an exhaustive review of every single program globally, but rather to highlight diverse approaches and common trends in financial incentives for cycling across different places. Our findings are limited to sources available in English or Portuguese. This may partially explain the limited number of cases identified in Asia and Africa.
2.2. Operationalization Strategy
Drawing on the existing literature, we then propose 12 guidelines for operationalizing mobility data justice within financial incentives policies. These guidelines highlight key considerations for designing transportation policies with a strong focus on justice. We then outline four practical dimensions where these guidelines can be applied to improve equity, providing policymakers with concrete examples of what to consider during implementation.
2.3. Applying the Strategy to São Paulo
Following the establishment of operationalization guidelines, we examine the four factors outlined in the first pillar of the operationalization strategy to identify social justice threats related to cycling in the city. Then, we address the mitigation of these threats for (1) the data collection process of the Bike SP program and (2) the participant selection, aiming to align the promotion of mobility and data justice with the city’s needs. Finally, we employ experimental modeling and computer science techniques to devise an implementation strategy that is scientifically informed and addresses potential biases and exclusions during execution (see Section 5.2, Section 5.3, and Section 5.4).
Unless otherwise specified, all the contextual analyses are based on the publicly available “Origin and Destination Survey" and are our own work. The São Paulo Origin and Destination Survey (OD) is the largest urban mobility survey in Brazil, and investigates the travel patterns in the São Paulo Metropolitan Area (SPMA), which is now the home of 22 million people. The survey is conducted every 10 years since 1967 by the São Paulo Metropolitan Company (Metrô)1 and its last complete version was made in 2017 [9]. The survey collects data on the modes of transport, origins, and destinations of the trips, times of departure and arrival, as well as the socioeconomic and demographic characteristics of the travelers and the purpose of the trips.
The analyses presented in this paper used the OD data from 1977 to 2017. The 2017 edition involved more than 150 thousand people in the 39 municipalities that comprise the SPMA. The data collection consists of interviews carried out in households, highways, airports, and bus terminals. The sample was designed using statistical techniques to obtain a reliable estimate of all the trips made in the region [5]. To extrapolate the results to the entire population, the survey provides expansion factors for the trips and individuals interviewed. Table 1 shows the database columns and the expansion factor, provided by the OD study, considered for each variable examined in this study.
In addition, the OD survey delineates “Origin and Destination Zones" (OD zones). These zones are determined prior to the data collection and characterize areas with comparable urban conditions in terms of infrastructure, population, and environment [5]. Our spatial analysis in Section 5.2 uses these zones as a reference for dividing the city.
Figure 7 was generated using the OD 2017 database, which was used to estimate the share of each social class in the trips for each zone, considering all modes of transportation. The trip expansion factor was applied to the trips to obtain representative values. The sum of the percentages of classes A, B1, and B2 for each zone was then computed and plotted on the map.
Trips that had either their origin or destination in a particular zone were regarded as belonging to that zone. To avoid double counting trips that had different origins and destinations, trips that started and ended in the same zone were also duplicated, so that all trips had equal weight. Furthermore, six OD zones were excluded from the analysis, as they had less than five trips and thus were not reliable sources of information. These zones are marked in gray on the map. The number of trips in the remaining zones ranges from 38 to 2494 trips, with a mean of 631.8 trips.
The code used for the analysis in this research is available on GitHub at: https://github.com/anayflima/bikesp-analysis.
3. Context and Concepts
This paper takes a social justice perspective for the design of a “pay people to cycle” policy and its associated app, data collection, and analysis. This section provides theoretical context and conceptual building blocks for this, leading up to our design guidelines. Specifically, we engage with social science scholarship on Transport, Mobility and Data Justice (3.1), Cycling and Social Justice (3.2), and Cycling Cities (3.3). We then review existing financial incentives for cycling (3.4), highly relevant to this paper’s case.
3.1. Transport, Mobility and Data Justice
Sustainable mobility policies can inadvertently lead to social disparities. Measures such as imposing taxes or restrictions on polluting vehicles and providing subsidies for green transport modes may disproportionately burden lower-income groups while advantaging middle and upper classes, who can afford more expensive alternatives [10]. To achieve social sustainability in transport, it is not enough to promote environmentally friendly modes of transport, but also to challenge and transform the dominant paradigms of mobility in society [3].
Two perspectives that investigate the intersections of social justice and transportation are Transport Justice and Mobility Justice, which have become more connected in recent years [11]. After reviewing both, this section also considers Data Justice as well as Mobility Data Justice, all of which provide the conceptual grounding for the design guidelines proposed in this paper.
3.1.1. Transport Justice
In the literature, transport planning often adopts two distinct frames: transport equity and transport justice [12]. Transport equity focuses on quantitative analyses that show how the benefits and burdens of transport policies and projects are distributed, while transport justice goes beyond that and considers the underlying structures and processes that produce and reproduce inequalities in transport [12]. Moreover, transport justice recognizes its target populations not just as users categorized by their mode of transport, but as groups marked by their historical marginalization based on factors such as race or socioeconomic status [6]. In this perspective, justice is not only about allocating public resources across demographic groups in a non-discriminatory manner, but also about ensuring adequate levels of accessibility for all individuals under most circumstances [10]. Put simply, in Martens’ widely-used transport justice: “a transportation system is fair if, and only if, it provides a sufficient level of accessibility to all under most circumstances” [13].
Current transport policies, which are mainly conducted by state actors, tend to adopt a transport equity perspective, focusing on technical fixes and ways to achieve quantitative “equity” by incorporating new metrics and indicators that better capture equity or distributional issues [12]. This “reformist" approach, however, often results in minor changes, without addressing the power relations and well-being of disadvantaged populations [12]. In contrast, a transformational approach towards transport justice emphasizes a community-based approach and prioritizes the needs of historically marginalized groups [12]. In the context of cycling, this representation and empowerment are essential for an emancipatory bicycle justice movement [6].
To address these issues, some scholars have proposed a society-centric approach to transport planning, which emphasizes the engagement of the community in the decision-making process [12]. This approach can take various forms, such as participatory budgeting, where citizens have a say in how a portion of the public budget is allocated for transport projects, or community-led analysis, where community leaders collaborate with planners and academics in collecting and analyzing data and designing the outcomes. Additionally, the transport justice literature criticizes the use of cost-benefit analysis and performance-based planning, and suggests need-based modeling as a substitute [10,13].
Therefore, it is crucial for the community to take an active role in bicycle development, rather than merely being a participant in initiatives introduced by external entities [6]. However, since the state plays a significant role in transport planning and financing, the adoption of hybrid approaches that combine state and society-centric elements seems to be the most promising way forward [12].
3.1.2. Mobility Justice
The book “Mobility Justice: The Politics of Movement in an Age of Extremes" [14] argues for the adoption of a mobility justice perspective, which encompasses not only the transportation issues of people, but also the movement of goods, resources, and information across different spatial scales [11]. This concept implies that mobility is a complex and multifaceted phenomenon that requires a holistic approach to understand and address its challenges.
The broader approach of Mobility Justice has seen increased academic interest [4,11,15]. Sheller’s mobility justice perspective addresses “a series of crises related to how we move”, including “an urban crisis of pollution and congestion” and “a climate crisis of global warming and decarbonisation” – while also addressing “precarious access to mobility (and unsafe or risky mobilities)”, especially in the Global North [4]. While the design guidelines proposed in this paper are largely focused on the city scale, it is important to keep in mind that “regions are interconnected and the production of unjust mobilities is a transnational and planetary problem that demands concerted efforts for social change” [4]. Mobility justice also highlights the importance of “accounting for the differential voices, knowledges, experiences, abilities and rhythms of the actors that inhabit particular spaces and places” and “how these differences are enabled or constrained by policy frameworks” [11].
3.1.3. Data Justice
Since our paper is centrally concerned not only with mobility, but also with data, the concept of data justice is also relevant for informing our design guidelines. Data justice emerges at the intersection of datafication and societal equity, questioning how data generation, collection, and utilization affect different groups and individuals in society [16]. This critical perspective is motivated by the growing availability and influence of data in the decision-making process, and the potential risks of data-driven discrimination [17]. Taylor’s work on data justice is thus particularly pertinent for our design guideline development and pilot, in conjunction with a recent literature review on data justice [18]. Key concerns are:
- How to ensure fair representation of diverse groups in data? An essential aspect of data justice is the visibility and representation of different segments of the population in the data. Data-driven decisions may be influenced by the assumptions and norms embedded in the data collection and analysis processes, which may favor the dominant groups as the “normal" and penalize those who deviate from it [17]. Therefore, a data justice policy should not assume an average person, but rather consider how to address the needs and interests of marginalized and vulnerable groups [17], also identified as central in the `equity’ pillar of `Data Justice Research and Practice’ [18, p. 30-32].
- How to account for the collective dimensions of data? Data justice recognizes that data injustice not only occurs at an individual level but also increasingly at a collective level [17]. Socioeconomic status, gender, ethnicity, and place of origin are some of the variables that impact how the data is used by policymakers [17]. Furthermore, the intersectionality of these factors can amplify the issues of exclusion or discrimination for some parts of the population. The risk of facing exclusion multiplies with the number of relevant categories that one belongs to [17]. Thus, a data justice approach should look beyond the individual and consider structural discrimination [18, p. 73].
- How to adapt data justice to different contexts and cultures? Data justice is a context-dependent concept. Different regions and countries may have different definitions and expectations of what is just [17]. Therefore, a data justice definition should be adaptable to the different needs and expectations of various local contexts, avoiding imposing a universal or standardized framework. Decolonial and intercultural issues are of key importance [18].
- How to distinguish between voluntary and involuntary data collection? In contemporary datafication, there is no clear separation between when the individual is aware that his or her data is being collected or not [17]. In this context, a challenge is the conflict between the right of individuals to have privacy over their own data and the argument that the state, based on principles of the social contract, should have a claim over people’s data to use it for the benefit of the collective [17]. This also raises the question of who can be seen in these data collection processes [17]. While this tension between privacy and representation is about visibility, it is also important to interrogate the power “dynamics of inclusion and exclusion that explicitly shape the politics of personal visibility” [18, p. 25].
- How to ensure the continuous improvement of data-driven programs? Finally, when using large-scale models to inform policies, it becomes convenient to just continue using the same system that is already in use and working, without testing for its accuracy over time or recalibrating it [17]. Data justice requires that data-driven programs are constantly evaluated and updated based on feedback from stakeholders, to retain their principles of fairness and justice, resonating with participatory concerns in transport and mobility justice debates [4,12].
3.1.4. Mobility Data Justice
In addition to the transport/mobility-focused, and the data-focused perspectives already discussed, the mobility data justice framework [8] addresses their intersection, further strengthening this paper’s design guidelines and pilot development by highlighting distributive, procedural, and epistemic justice elements. This allows for the operationalization of these principles in the context of financial incentives for cycling.
The distributive element focuses on the distribution of benefits and burdens related to mobility and data. It questions who has access to mobility services and data resources, who benefits from them, and who bears the costs or risks. It also considers how these distributions reflect and reinforce social inequalities [8].
The procedural element concerns the processes and mechanisms of decision-making in mobility and data practices. It examines who has the power to make decisions, who is included or excluded from these processes, and how these decisions are made. It also assesses the transparency and fairness of these methods and the role of data and algorithms in them [8].
The epistemic element deals with the production of knowledge in mobility and data practices. It explores who has the right to produce knowledge, whose knowledge is recognized or dismissed, and how this knowledge is used. It also investigates the epistemic biases, assumptions, and exclusions in mobility and data practices [8].
Mobility data justice, therefore, requires a discerning and ethical approach to the datafication of cycling. Currently, cycling remains a largely unmonitored form of transport. There is a lack of systematic data gathering for privately owned bicycles and no means to trace individual trips as can be done with driving, public transit, or air travel [19]. However, smart cycling innovations can change this situation. Indeed, some cycling applications are already positioning data collection as a supplementary feature that can provide policymakers with information on cyclists and their journeys. While cyclists use the application for their primary function, such as locking their bike, data collection occurs subtly in the background [19].
Nevertheless, while these innovations may contribute to the advancement and promotion of cycling, they also present challenges regarding the way to balance the benefits of datafication with the potential risks of privacy invasion, surveillance, and discrimination. Although the concept of mobility data justice has only recently emerged in the literature, empirical studies have already examined its concerns. For example, the social justice implications of using Strava Metro cycling data2 in transport planning have recently been highlighted by [20] and [21].
3.2. Cycling and Social Justice
To demonstrate the relevance of the broader frameworks discussed above for cycling, this section highlights key contributions from the growing literature on cycling and social justice [22,23].
One of the mobility challenges is the individualization of the daily commute, which places the responsibility of mobility on the workers, regardless of their proximity to their jobs or their access to mobility options [2]. This individualistic discourse contrasts with the current reality of mobility, where the upper and middle classes tend to be highly mobile, while the lower classes often face the scarcity or high costs of transport, and have to endure longer travel times [2]. Furthermore, urban data collection often favors central areas over peripheral ones, thus biasing investments toward commuters who are already privileged [6], while non-commuter cycling tends to be less visible or supported [21]. A bicycle justice practice that is inclusive and socially fair should address the current unequal distribution of bicycle investments [6]. In developing bicycle policies, we need to reflect on the extent to which they expand or restrict the scope of individuals who benefit from prior investments, with regards to factors such as race, socioeconomic status, gender, nationality [6] and trip purpose [21].
3.2.1. Gender
Most urban cycling contexts have a notable gender disparity, with the percentage of women participating in cycling much lower, particularly in areas where cycling conditions are suboptimal [24]. The difference is less striking in cities with a more bicycle-friendly environment [25]. In fact, some have argued that gender equity in cycling can be a good indicator of the cyclability of a certain region [24,26].
3.2.2. Age
As with gender, the distribution of cyclists by age tends to be more balanced in bike-friendly environments, with a higher number of children and seniors cycling [25]. Therefore, one of our goals should involve identifying and addressing potential age-related disparities within the program.
3.2.3. Social Class
The intersection of social class and cycling can reveal distinct patterns of mobility in the city. In fact, our literature review indicates that lower social classes tend to have lower mobility compared to higher classes due to limited access to affordable transport options. Social class and cycling intersect differently depending on context; lower classes can be largely excluded from cycling [27], or be central to cycling, though often through need rather than choice [28].
3.2.4. Spatial Distribution
Access to infrastructure is an essential determinant of urban mobility. This way, ensuring a fair allocation of mobility infrastructure is crucial to preventing any group from being disproportionately favored, requiring insights regarding “distributive impacts of bicycle-related benefits in cities from both global north and south” [29].
3.3. Cycling Cities
At the same time, the promotion of urban bicycle use is often reduced to the construction of bicycle lanes without considering the broader cycling culture [30]. However, achieving a substantial increase in cycling mode share and reaching the “critical mass" requires more than just cycle path construction. It also requires complementary policies, such as the provision of bike parking facilities, the limitation of vehicle speed, and the involvement of various social groups [30,31]. Otherwise, bike lanes may remain underutilized due to the lack of a comprehensive understanding of the historical and current context of cycling [30]. Therefore, this paper also draws on the long-term perspective of The Cycling Cities research project 3, that provides a comprehensive analysis of the factors shaping cycling popularity, verified by several Dutch and international studies (e.g. [31,32]). Their analysis is structured around five key factors: (1) Urban form, specifically how that shapes cycling distances; (2) Mobility alternatives to cycling, such as walking, public transit, and cars; (3) Transport Policy, and its inclusion or exclusion of cycling; (4) Social movements, including the role of cycling advocacy; and (5) Cycling’s Cultural Status in terms of supporting or undermining cycling. While financial incentives for cycling can be regarded as part of the Transport Policy factor, the Cycling Cities perspective highlights the importance of considering this in conjunction with the other four factors, for example, the importance of social movements (4) for community engagement in transport decision making [12].
3.4. Financial Incentives for Cycling
This paper is specifically interested in how the social justice considerations discussed above can inform ’pay for cycling’ financial incentives. Financial incentives can be defined as monetary or non-monetary rewards that are conditioned on performing a specific behavior or achieving a certain outcome. They can influence behavior by increasing its perceived benefits or reducing its perceived costs. In the literature, personal economic incentives have been demonstrated to be successful in promoting several health-related behaviors, including smoking cessation, weight loss, physical activity, and vaccination [33,34,35].
Travel subsidies for commuting to work via private vehicles or public transport are a widely adopted policy. Recently, some countries have also started to offer financial incentives to encourage people to use bicycles as a mode of transport, in the form of tax deductions or subsidies for either the purchase of bicycles, and/or as payments per kilometer cycled (up to a limit). This section summarizes our review of these policies worldwide, organized by continent.
3.4.1. Europe
This continent features the most diverse and widespread financial incentives, commonly offering a combination of purchase subsidies for conventional and cargo bikes, comprehensive tax deductions or salary sacrifice schemes, and direct per-kilometer payments for cycling to work. While strong for conventional bikes, Europe also has numerous e-bike incentive schemes.
- Austria: Provides substantial subsidies, including €1000 for cargobikes and €900 for e-cargobikes (total budget €167.2 million) [36].
- Belgium: Offers a mandatory tax-free allowance of €0.27 per kilometer for employees [37].
- Cyprus: Implemented a program providing €200 for conventional bikes to individuals, with a total budget of €570,000 [36].
- Luxembourg: Offers a subsidy covering 50% of vehicle costs for all types of bicycles [36].
- Malta: Has ongoing programs, including €400 for all bikes (total budget €3.4 million) [36].
- Portugal: Offered €100 for conventional bikes with a budget of €50,000 in 2021 [36].
- Spain: Public bicycle systems will be included in subsidies from July 2025, where the government will cover 30% of a 50% pass reduction for users [40].
3.4.2. North America
In North America, direct financial incentives for conventional bikes are less common, with a greater emphasis on electric bikes. No specific financial incentives for conventional bikes were found for Canada or Mexico in the available research. However, for Canada, several e-bike incentive programs exist at the provincial or territorial level [43]
3.4.3. South America
Initiatives in South America integrate cycling with public transportation systems, offering free transit passes for regular cyclists or non-monetary incentives like paid time off for cycling commutes.
- Brazil (Itajaí): The city offers rewards in a local digital currency (approx. €0.02 per 100g of greenhouse gas emission avoided) for choosing low-carbon transport, including cycling [48]. Notably, the program uses a mobile application called “MovItajaí", which is based on a similar Portuguese mobile application named AYR [49]
3.4.4. Africa
We found only one example of financial bike incentives in Africa.
- South Africa: Between 2001 and 2002, the `Shova Kalula’ pilot program provided bicycle subsidies for learners [52].
3.4.5. Asia
Only a few examples of direct financial incentives for individuals using conventional bicycles were identified in Asia. However, it’s notable that large-scale e-bike incentive programs have been implemented in parts of Asia, such as China [53].
3.4.6. Oceania
We also found limited cases of direct financial incentives for individuals using conventional bikes in Oceania, primarily utilizing employer-led salary sacrifice schemes that leverage tax benefits to reduce the cost of bicycle purchases.
- New Zealand: The `workride’ scheme allows for a 32-63% cost offset on new bike purchases through a tax-exempt salary sacrifice model [55].
- Australia: We identified only one program in Sydney, which applies exclusively to e-bikes. It offers direct rebates or grants typically ranging from $200 to $500[56].
3.4.7. Summary
The review of the policies that offer financial incentives for cycling in different countries identified a diversity of schemes that provide financial rewards or benefits for cyclists. Specifically, schemes focused on the purchase of bicycles and rewards for cycling. However, we also encountered a lack of empirical evidence on the effects of these policies on cycling behavior and outcomes. Most of the information we obtained about these policies consisted of news articles that announced their implementation or anticipated their results, but there was a scarcity of reports that evaluated the actual results, especially for the policies that involve a cycling allowance per kilometer, the focus of this paper. A possible explanation for this gap is that most of the policies are decentralized and/or often implemented through private companies, while the government plays more of a facilitator role by defining the allowance and offering tax subsidies via companies. This focus on larger employers also has social justice implications by excluding those working for small companies or in the informal economy.
Therefore, while it is challenging to isolate the impact of the financial incentives from other factors that may influence cycling, such as infrastructure or cultural factors, a more systematic approach to data collection and analysis would support the scientific assessment of such programs.
Overall, there is an emerging era of research that considers social justice perspectives on cycling in conjunction with data concerns, but this is largely focused on infrastructural concerns, for example provision of cycle paths. There is a gap in exploring financial incentives in this context. Furthermore, the literature often provides critiques of existing practices, rather than working towards the design of new ones.
4. Policy Design Guidelines
This section proposes design guidelines for the development of social-justice aware `pay for cycling’ financial incentive policies, specifically around data collection and analysis, participant selection, and synergies/additional benefits. The guidelines aim to operationalize the social science concepts (see Section 3) with a more applied policy and data science perspective, highlighting the interdisciplinary nature of our work. As we tie remuneration to the distance traveled by bike, participants must record their cycling trips. Therefore, collection and analysis of data are central to our design guidelines.
The design guidelines aim not only to prevent the reinforcement of existing injustices but also to contribute to increased transport fairness. After the overview of the guidelines, we detail key elements that illustrate the social-justice approach in practical detail, and are of particular relevance to this paper’s case.
The guidelines inform the São Paulo pilot discussed in the following section. Additionally, they could inform the development of financial incentives for cycling in other cities and countries. This includes primarily `pay for cycling’ policies, but also other related initiatives, particularly in developing regions, the Global South, and areas with low cycling rates.
4.1. Guideline Overview
The following items provide an overview of the policy design guidelines proposed in this paper, which are schematized in the diagram depicted in Figure 2.
- Analyze the local context of cycling, including its historical development, the interplay of all transport modes, urban planning, transport policy, cycling’s cultural status, and the role of social movements and advocacy groups, to provide qualitative evidence for the design of the policy.
- Analyze existing data (including gaps), such as travel surveys with a focus on cycling and social justice. Consider who is included and excluded from cycling and from data sets, to provide quantitative evidence for designing policy details with social justice in mind.
- Consider strategies to increase both cycling rates and the diversity of cyclists and their cycling practices.
- Consider who is involved in decision-making around the design and implementation of the policy and associated data collection and analysis, and how this can be done in more inclusive, transparent, and fair ways.
- Consider whether and how participant selection should be part of the policy and how this can be used to further social justice, particularly around AGSSI+.
- Conduct data collection and analysis with social justice in mind, addressing concerns around privacy, diversity, data ownership and access, contribution to other data sets and their gaps, with critical approaches to data representativeness and bias.
- Explore how inter-modal elements can be included to further strengthen the social justice perspective.
- Evaluate the type and level of financial incentives in relation to social justice, considering potential barriers and enablers, such as the need to use a public transport app, the appeal of the incentive to different groups, and its potential to increase diversity.
- Across all activities, always consider age, gender, social class, spatial distribution, and other demographic variables - and their intersectionality (AGSSI+).
- Ensure that all elements and processes are iterative, allowing for continuous improvement towards social justice.
- Continuously assess at all stages who benefits from the policy and who does not.
- Identify potential synergies of the policy with other cycling, mobility, and cross-sector actions, including infrastructure development for riding and parking, transport planning, urban planning, community building, traffic safety, public health, etc.
These guidelines show how financial incentives for cycling are not merely a remuneration policy. Rather, they can also offer potential features that can enhance the effectiveness and fairness of other cycling initiatives and of mobility in general. The paper now exemplifies how these guidelines might play out in practice.
4.2. AGSSI+ Base Analysis
Here, we demonstrate how the analysis of the existing context and data informs the design of the policy, focusing on age, gender, social class, spatial distribution, along with their intersectionality (AGSSI+). The analysis includes:
- What is the AGSSI+ distribution in the cycling population, and how do these variables intersect?
- Are there specific groups with a lower likelihood of participation in the program?
- Which AGSSI+ segments are not adequately represented in cycling demographics?
- Which particular obstacles discourage the under-represented groups from engaging in cycling in this urban setting?
- How can cycling policies be customized to promote greater AGSSI+ inclusiveness?
- What is the distribution of mobility infrastructure across the city, and which groups are currently privileged by it?
- How can cycling help fill gaps within or across different modes of transport?
The collected data has the potential to yield valuable information about participants’ profiles. As discussed in Section 3.1.2, mobility justice is not only about distributing mobility resources equitably among the population, but also about making mobility accessible and inclusive for everyone. A policy that compensates individuals for cycling can contribute to the fairness of mobility by allowing them to access public transport networks through cycling and subsidizing their subsequent trips with the earnings from cycling. Moreover, analyzing challenges, needs, and preferences segmented by population groups enables targeted interventions. By understanding the diverse profiles of cyclists, authorities can tailor cycling programs to be more responsive and effective.
4.3. Participant Selection
Here, we illustrate how the design guidelines could be used around participant selection. If the policy cannot accommodate everyone interested, or aims to target specific groups, establishing clear and social-justice aware criteria for selection is central. Focusing solely on cost-benefit analysis may inadvertently favor groups that already benefit from existing cycling infrastructure. For instance, if a particular group cycles more, it might be due to their better access to cycling facilities. Consequently, if we use this measure to select future participants, financial incentives could unintentionally aggravate existing inequalities and biases.
To address this, several factors should be considered during participant selection. Examining the local context is crucial for identifying potential social justice concerns related to cycling policies. By analyzing how these factors influence travel behavior, especially bicycle use, we can develop strategies to mitigate negative effects through a financial incentives cycling policy.
By conducting the AGSSI+ Base Analysis, we can determine which segments of the population are currently disadvantaged by cycling investments. This information can help us prioritize these groups when selecting participants for the program.
A participant selection process based on these criteria would enable the prioritization of marginalized groups, thereby reducing the effects of the unequal distribution of cycling investments. This is not a substitute for the development of cycling infrastructure, but rather a supplementary measure to redress past inequalities and to broaden the scope of cycling benefits.
To implement this participant selection, collecting social demographic data becomes essential. Even if participant selection is not directly tied to this data, its collection remains valuable, since analyzing how different groups behave in contrast to existing policies can inform cycling investments. Therefore, contextual factors, such as gender balance, age distribution, and other relevant aspects, should be carefully considered when designing policies related to cycling incentives. The evaluation of the policy’s effectiveness should also include a segmented analysis for each group and area, taking into account how the uneven distribution of mobility and data impacts the results.
In summary, participant selection, informed by data and contextual analysis, can enhance the effectiveness of financial incentives for cycling. By prioritizing marginalized groups and promoting inclusion, we move closer to achieving mobility justice.
4.4. Additional Benefits/Synergies
Here, we highlight examples of additional benefits and synergies that can increase the potential of financial incentives policies for cycling in promoting fair mobility.
The policy and the associated generated data can serve multiple purposes beyond mere operationalization. As discussed in Section 3, cycling remains a largely unobserved mode of transport, and there is a lack of comprehensive data on cycling patterns in the majority of cities. In this context, a “pay people to cycle” policy can be a source of rich data that can support and improve other cycling initiatives.
Informing Infrastructure Investments. By capturing origin-destination data and route choices, we gain insights into cyclists’ preferences and behaviors, and how factors such as cycling infrastructure availability, safety perceptions, and topography influence route decisions. This data empowers public authorities to identify gaps and needs within the existing cycling network, contributing to the alignment of financial incentives with actual mobility patterns and contributing to a more effective cycling ecosystem. Additionally, the app could be used to provide safe access to cycle parking at public transport destinations, thereby enhancing overall safety.
Engaging and Building the Cycling Community. Beyond data collection, the policy creates an opportunity for community engagement. As discussed in Section 3.1.1, the state still has a dominant role in transport planning. Within a cycling remuneration policy, public authorities can leverage the financial incentives platform to communicate with cyclists and involve them in decision-making. Incorporating crowdsourcing elements allows cyclists to provide feedback and suggestions, enhancing policy effectiveness and fostering a society-centric approach to transport planning. This also contributes to the factors identified as central by cycling cities, such as social movements, cycling advocacy, and cycling’s cultural status. Furthermore, participants in close proximity could use the app to organize ‘bike trains’ [57] for all ages to improve safety and community.
Bike ownership and access. `Pay to cycle’ policies must address the implications of bicycle ownership and access. For example, by integrating with other policies that enable bike ownership (see review on Section 3.4), bicycle maintenance, or access to shared schemes, the policy can ensure broader accessibility.
Evaluating Impact and Continuous Improvement. The literature review in Section 3.1.3 on Data Justice highlights the importance of using the collected data to inform ongoing program evaluation and updates. Public authorities can assess the impact of cycling initiatives, identify areas for improvement, and refine policies based on real-world data. This iterative process ensures that financial incentives contribute not only to individual compensation but also to a more sustainable and equitable cycling ecosystem.
Partnerships with companies.Partnerships with companies can be a way of funding the program and providing the employers with an overview of the number of kilometers cycled by their employees. This allows companies to pursue their sustainability objectives, such as reducing their carbon footprint, improving their corporate social responsibility, and enhancing their brand image. The financial incentive program can be part of the package of benefits offered by the companies to their employees who cycle, since many companies already have a budget dedicated to commuter benefits and transit passes. The policy can be a way to extend these benefits to employees who cycle to work, and to encourage more employees to adopt cycling as a mode of transport. This public-private partnership is consistent with the adoption of similar policies in some countries that adopt this type of policy, as reviewed in Section 3.4. However, as with all synergies, particular attention must be paid to privacy and data access and ownership. It is also important to ensure access for those working for small companies and the informal economy.
Public Health. The health benefits of cycling are well-established, including improved cardiovascular health, enhanced mental well-being, and increased physical fitness. Linking cycling to ‘social prescriptions’ by doctors could activate these public health benefits and generate associated savings for public health systems, health insurance providers, and company health schemes. This could also link to the WHO’s HEAT tool 4.
4.5. Multimodality
Understanding the integration of cycling with other modes of transport is crucial for developing policies that promote cycling as a fundamental component of the transport network. This integration is particularly significant when combined with public transport, as it can contribute to reducing car use and ownership, addressing transport poverty, shortening long trips, and reducing mobility costs [58,59].
To effectively promote multimodality, it is essential to assess the prevalence of cycling in combination with other modes of transport and to identify the potential benefits of such integration for specific locations. This assessment can inform the development of targeted incentives aimed at fostering a multimodal and just transport ecosystem.
5. Data Collection Results
This section details the application of the design guidelines within the context of São Paulo, Brazil. The pilot of the policy involves the payment in public transport credits per kilometer cycled. The section is structured as follows: we begin with relevant context on mobility and cycling context in São Paulo, followed by the results of our AGSSI+ Base Analysis of Cycling in São Paulo. Subsequently, we detail the data collection and participant selection processes, designed to mitigate social justice threats identified in our analysis. The pilot’s multi-modal element is discussed throughout.
5.1. Mobility and Cycling in São Paulo
São Paulo is Brazil’s largest city with more than 12 million inhabitants and 24 million trips daily [60]. Figure 3 shows the mode share of trips within the city of São Paulo, based on data from the Metro company’s Origin and Destination (OD) survey for the years 2007 and 2017. Public buses, trains, and subways are grouped under the public transportation class, while private cars are in the car group. Bicycle and on foot trips each have their own segment. The remaining modes, such as taxis, motorcycles, chartered buses, school transport, etc., are classified under the `Other’ category.
The comparison between 2007 and 2017 shows minor changes in the modal distribution. It is interesting to notice that the categories of public transportation, car, and on foot have similar percentages, i.e., are quite balanced between each other. On the other hand, cycling accounted for only 0.9% of all trips in São Paulo in 2017. Although there was a 50% increase compared to 2007, when this number was 0.6%, this figure indicates the still low use of bikes as a mode of transportation in the city, and it is far below the potential demand for cycling estimated at 17% by a recent study [61].
Recently, the City Hall of São Paulo set the ambitious goal of raising the mode share of cycling to 3.2% by 2028 [62]. As an effort to promote cycling in São Paulo, the city approved a law creating the “Bike SP" Program in 2016 [63], an innovative legislation aimed at encouraging cycling by granting mobility credits to individuals who use bicycles as a means of transportation. The law specifies that these mobility credits will be given to the users registered in the Bilhete Único system5. Additionally, the law states that encouraging the use of cycling for commuting and promoting the integration of cycling with public transportation are some of the goals of the policy.
However, the implementation of the Bike SP Program has been delayed due to the lack of a regulatory decree that specifies practical aspects of the policy, such as the eligibility criteria, the value of the benefit, the method of measuring cyclists’ travel distances, etc. As we mentioned before, financial incentives have been used to encourage cycling in other cities, but mostly in European contexts and not on a large scale in a metropolis the size of São Paulo. Due to this lack of basis, the city’s Secretariat for Mobility and Transportation decided to request, from our research group, data-driven evidence for the public policy via the implementation of a pilot project.
In this scenario, given that the Bike SP program is a government initiative, it is even more critical that it refrain from amplifying the inequalities already in place. Thus, one of our concerns while designing the program is to prevent our data analysis from being biased and reinforcing social injustices.
5.2. Social Justice AGSSI+ Base Analysis of Cycling in São Paulo
In this section, we examine São Paulo’s context concerning gender, age, social class, and spatial distribution, focusing on potential social justice challenges associated with each of these factors:
Gender: Despite women representing around 51.2% of the total trips of the city of São Paulo, they account for just 9.8% of all bike trips, according to OD 2017. Additionally, a study conducted by the Ciclocidade NGO [65] revealed that this gender gap varies significantly across different regions of the city. Their study involved interviewing 1804 people who cycled in the city. The interviewers were instructed to prioritize approaching women, in order to obtain a representative profile of bicycle use in São Paulo. Nevertheless, women comprised only 14% of the responses. In central areas, which correspond to affluent neighborhoods and where cycling infrastructure tends to be better, women represented 23% of all bike trips. In contrast, in peripheral areas, this number decreased to 9%. It should be noted that this study adopted a purposive sampling strategy to obtain a larger proportion of female respondents, thus the mode share results are not representative of the general population and deviate from the percentages reported by the OD 2017 survey. Nevertheless, the observed disparities between central and peripheral areas underscore the importance of improving the conditions for cycling to enhance gender equality among cyclists.
Age: The age distribution of cyclists in São Paulo is shown in Figure 4. The majority of cyclists in São Paulo (52.8%) belong to the 20-40 age group. Moreover, São Paulo has only 6.1% of cyclists under 15 years old and 2.7% over 60 years old. This suggests that the age distribution of cyclists is affected by cultural and safety factors that discourage cycling among certain age groups.
Social class: The OD survey also includes the socioeconomic classification of the respondents. This variable is derived from the “Critério Brasil”6, which classifies the households into five socioeconomic strata, ranging from A (the highest class) to E (the lowest class).
Figure 5 depicts the mode share for each socioeconomic class. The chart indicates that the mode share distribution varies significantly by social class. Individual motorized vehicles represent more than half of the trips made by class A, and this mode share diminishes for the subsequent classes. In contrast, walking and public transportation modes are more prevalent among the lower classes. For the most disadvantaged class (D-E), these two modes represent 87.8% of all trips.
Bicycle trips constitute the lowest share of trips in all classes, but they exhibit a peculiar pattern across the income classes, with the largest percentages observed in the lowest (1.8%) and in the highest class (1.2%). This figure may reflect different factors influencing the choice of cycling for each class. For the upper classes, the availability of better cycling infrastructure in the central (and wealthier) areas may encourage them to use bikes as a mode of transportation. Moreover, the upper classes tend to travel shorter distances to their work or school destinations, which makes bike trips more convenient. On the other extreme, lower classes may opt for cycling due to the low cost associated with this mode of transportation, even where infrastructure is lacking.
Spatial distribution of cycling infrastructure, public transport, and trips: The spatial distribution of the cycling network in the city is displayed in the heatmap in Figure 6a. It reveals that the city’s cycling infrastructure is unevenly distributed, with a higher concentration in the central areas. The peripheral areas, in the north, south, and east, lack cycling infrastructure altogether. Moreover, the cycle paths are poorly connected, especially outside of the expanded center.
The cycling network can also be contrasted with the public transportation modes available in the city. As shown in Figure 6b, the bus lines cover most of São Paulo. However, some peripheral areas, especially in the south, have a scarcity of bus lines. On the other hand, the subway lines, as shown in Figure 6c, are mostly limited to the center of the city, while the train network (Figure 6d) extends further to some regions in the east and to the surrounding areas outside the city, but many areas of the city remain unconnected.
The comparison between the spatial distribution of cycling infrastructure and public transportation suggests that many people who do not own cars rely on buses to move around the city, and that the combination of trains or subways with buses is likely to be a common strategy to achieve faster and longer trips. In this context, cycling could be a viable alternative to replace a part of the trip, especially the one covered by buses. However, this requires an improvement in the connectivity and accessibility of cycling infrastructure in the city, especially in the peripheral areas.
In São Paulo, this unequal spatial distribution of mobility in the city is not simply a geographical phenomenon, but also a social issue. This is evidenced by Figure 7, which displays the total percentage of upper classes (A, B1, and B2) in the trips for each OD zone. Section 2.3 explains how this map was generated.
Figure 7.
Proportion of classes A, B1, and B2 (upper classes) in the trips originating or ending in each zone. Own work based on the OD 2017 database.
Figure 7.
Proportion of classes A, B1, and B2 (upper classes) in the trips originating or ending in each zone. Own work based on the OD 2017 database.
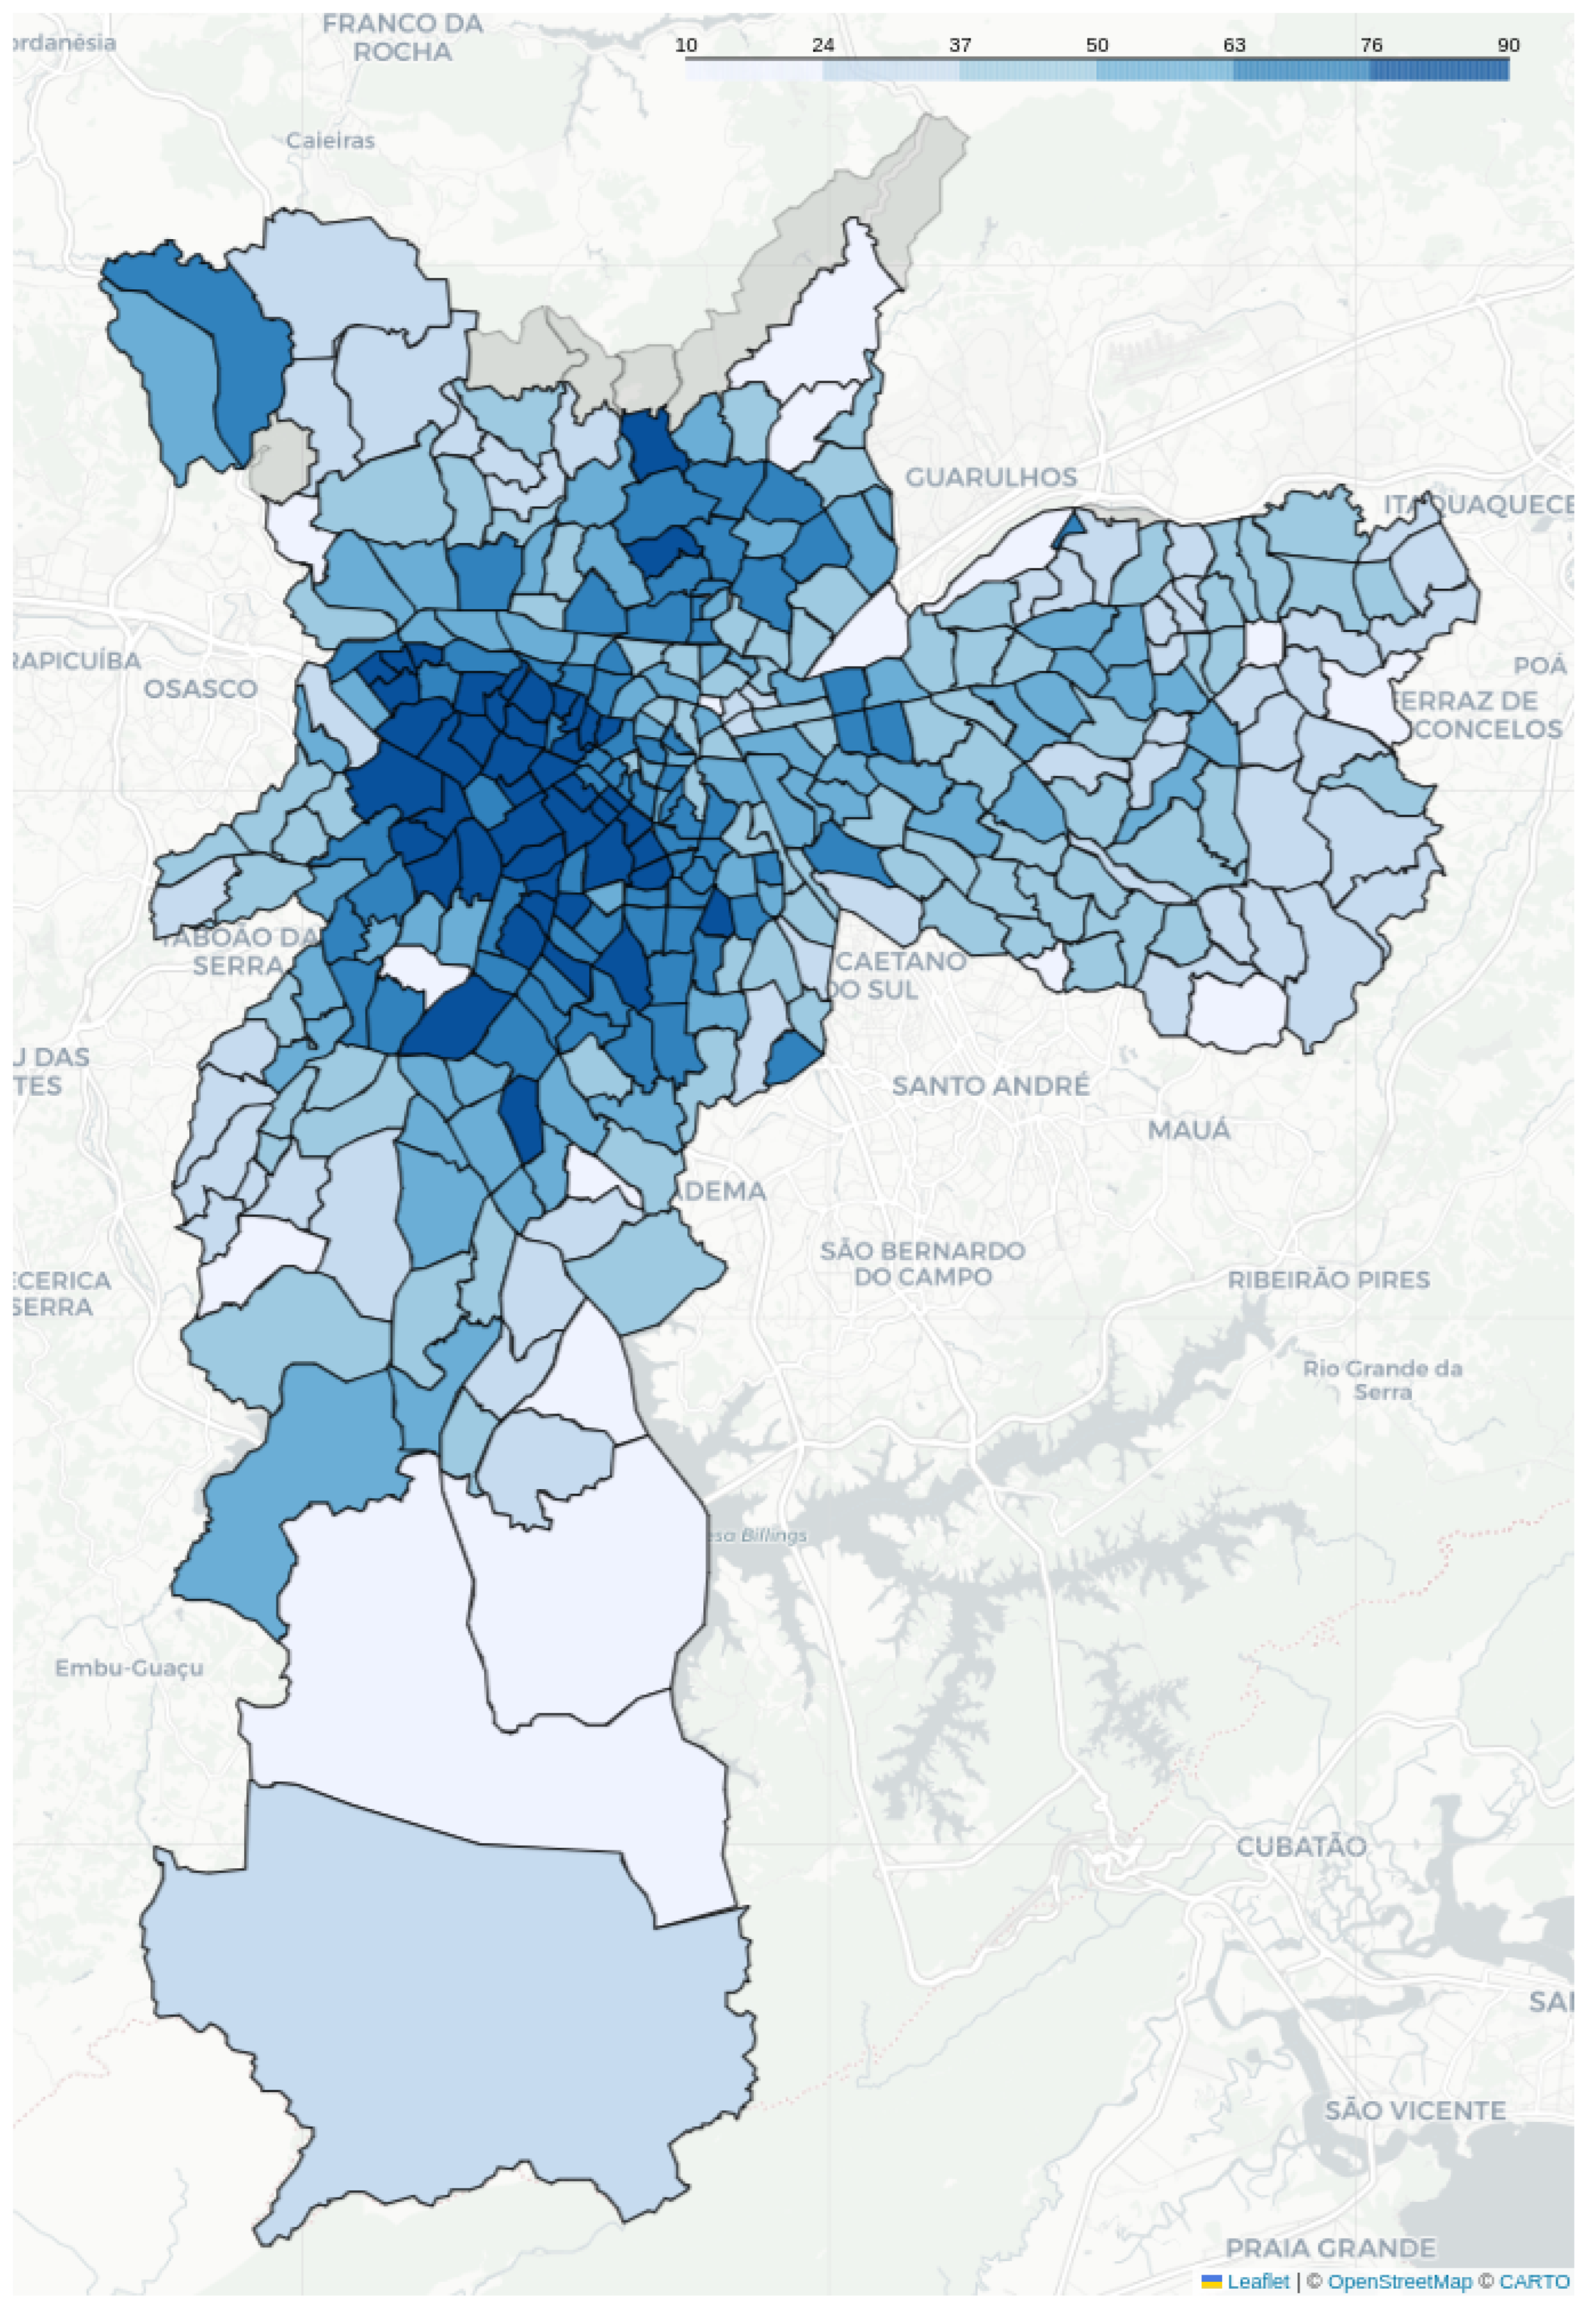
The map reveals a notable disparity in trip patterns between central and peripheral regions. The central areas have a high density of trips made by upper classes, and as we move to peripheral areas, the percentage of lower classes increases. The magnitude of this variation is very large, going from 10.3% to 89.7%. This pattern, when compared with the availability of public transportation and cycling infrastructure, indicates a concerning scenario: individuals from lower classes, who typically rely more on public transportation or more affordable modes of transportation like cycling, are disproportionately disadvantaged in the allocation of infrastructure investments.
Our analysis indicated that lower social classes tend to live in areas with less access to cycling infrastructure and public transportation, especially subways. These factors may discourage or prevent them from cycling in the city. Therefore, the pilot project should be careful not to bias its choice of participants to higher classes, as they may already have more favorable conditions and incentives to cycle. Instead, the pilot project should aim for a representative spatial distribution across the city, since there is a relationship between the location of trips (central or peripheral) and the socioeconomic status of the travelers.
5.3. Data Collection
Having identified the main social justice concerns related to implementing the cycling policy in São Paulo, we now detail the data collection methodology of the Bike SP program and how it aligns with our design guidelines.
Given the potential for integration with other policies and initiatives (synergies), when designing the policy, it is important to determine what should be collected as data in the first place, and how to balance the individual right to privacy with the collective benefits of data sharing to ensure data justice. This should be done with transparency and consent from the participants, who should be aware of what they are sharing in exchange for the financial benefits.
Key questions to address include: Who owns the data? Who has access to it? How is privacy maintained? Who can analyze the data? Is it the participants, the city council (and which part), public transport authorities, and/or cycling groups? How is the data managed? Privately, in aggregated form, or as open data?
To enable data collection in the Bike SP program, we will combine two strategies: (1) a registration form and (2) a mobile application.
Registration form: The pilot project will be widely publicized in the press and social media. To manifest interest in the program, citizens will have to complete an online questionnaire that will ask about their socioeconomic and demographic profile and their current travel patterns. This online registration form will be a key instrument for collecting data from interested people and selecting participants for the pilot project. The form’s design follows our guidelines, specifically ensuring comprehensiveness in capturing relevant participant information for the selection process.
Mobile application: We opted to use a smartphone App to collect data about the travel patterns of program participants and enable subsequent data analysis. Most people in São Paulo have a cellphone, making this a viable approach rather than a bottleneck, as phone ownership generally precedes bicycle ownership in the region. While not including everyone, according to a 2023 study, 91% of the population above 10 years in São Paulo uses a cellphone to access the internet [69]. Furthermore, a 2024 study revealed that Brazil has an average of 1.3 cellphones per inhabitant [70]. Our mobile application will be used to register and validate the bicycle trips of the participants, so that we can reward them and collect the data for the program’s evaluation. Thus, in preparation for the implementation of the policy, we developed this mobile application. The project code is open-source and can be accessed at https://gitlab.com/interscity/bikesp/bikespapp. Figure 8 displays the user interface of the mobile application developed, while Table 2 presents its main functionalities. The app’s design was informed by our guidelines, particularly focusing on user-friendliness and ensuring the secure and private collection of necessary data for subsequent analysis. The initial version of the app was validated with a group of 20 beta-testers for a period of two months in late 2023; their feedback was then used to guide the development of a new version of the app, which was again validated with 8 new beta testers in early 2025. The final version, to be used in the actual pilot, was then produced after this second round of tests and user feedback.
5.4. Participants Selection
During the policy implementation phase, participants will be selected from a pool of registered candidates based on specific criteria derived from the AGSSI+ analysis, with the aim to further social justice. Throughout the program’s execution, we will gather data on the participants and assess whether the initial findings align with the assumptions of the econometric model, which considered the average number of trips per individual to budget for the pilot. This data collection will also enable us to compare the travel behaviors of different demographic groups and analyze the spatial distribution of trips across the city. These insights will later be used to refine the broader implementation of the policy in the city, allowing us to adjust variables related to participant selection and remuneration. Consequently, the pilot project will focus on specific groups, profiles, and areas identified as priorities for increasing mobility justice.
Given the context of São Paulo, the selection for the program will be based on the following criteria (the data for all these factors is obtained from the registration questionnaire):
Gender: Women represent only around 10% of cyclists in São Paulo, according to the analysis presented in Section 5.2. To ensure a more representative sample, they will be prioritized during the selection process. This approach will facilitate an investigation of the gender differences in the factors influencing the choice and utilization of bicycles. Moreover, it will be beneficial for the program to collect qualitative data to understand women’s unique preferences and challenges regarding cycling. This can later be used to shape the policy to promote female cycling.
Age: Our analysis revealed that there is a significant gap in the cycling participation of younger age groups in São Paulo, compared to bike-friendly places. A strategy to attract younger age groups will be to include students and their commutes to educational institutions in the selection, and not only commuters who travel to work.
Social Class: The social class of the participants will be diversified to some degree to enable the examination of behavioral variation across different classes. However, lower classes will be given priority, as they are more likely to benefit from the financial incentives. This criteria has the purpose of increasing the impact of Bike SP on the equity of mobility, and it was based on the analysis of the travel pattern differences between social classes in São Paulo provided in Section 5.2.
Spatial distribution: To ensure a balanced distribution of the pilot program across the city, the residences of participants and the destinations of their daily commutes will be considered. This criterion allows for an exploration of how bicycle usage and mobility perceptions differ between residents of the city’s peripheral and central areas.
6. Critical Discussion of Results
Our AGSSI+ analysis revealed significant social justice disparities that critically informed the pilot’s design. The pronounced gender gap, with women comprising only 9.8% of cyclists, particularly in peripheral areas, indicates that infrastructure alone is insufficient; specific social and safety concerns must be addressed. Similarly, the age distribution of cyclists, heavily skewed towards the 20-40 age group, suggests barriers for younger and older demographics. The complex relationship between social class and cycling, where both the lowest (1.8%) and highest (1.2%) classes show slightly higher cycling rates for different reasons, necessitates a nuanced policy approach. Critically, the spatial analysis revealed that cycling infrastructure is concentrated in wealthier, central areas, leaving lower-income peripheral residents, who rely more on affordable transport, underserved. This unequal distribution of mobility investments necessitates a proactive approach to participant selection.
In light of these findings, the pilot’s participant selection process is a crucial element of its social justice commitment. Selection criteria for such policies must account for the current unequal distribution of cycling investments in the area of implementation, ensuring a representative sample of the entire population, not only of those more likely to adopt cycling and for whom cycling is more convenient. Both the implementation and analysis of the pilot project should consider the fact that different groups of the population will have different responses and varying degrees of benefit from the policy. The policy should also be used as a mechanism to prioritize people who are currently disadvantaged in terms of mobility and cycling investments. Even in scenarios where participant selection is not required, the strategies discussed for selection in this paper can strengthen the social justice side of financial rewards for cycling, promoting greater diversity in cycling.
Beyond participant selection, the data collection methodology, employing both a registration form and a mobile application, aims for comprehensiveness and data justice. While the high smartphone penetration in São Paulo makes the app a viable tool, potential exclusion of individuals with limited digital access or older devices remains a consideration. Financial incentive policies for cycling have implications beyond merely rewarding individuals and encouraging them to cycle. Such policies can generate valuable cycling data and have the potential to foster a cycling community, which can inform and integrate with other mobility policies in the city, including multi-modal opportunities, and across domains, for example public health. These potential synergies of the policy could also further extend the social justice benefits.
Considering the insights from the AGSSI+ analysis and the strategic choices in data collection and participant selection, the Bike SP pilot project is well-positioned to make a significant impact on São Paulo’s urban mobility. Its design to address existing inequalities offers a powerful model for how financial incentives can foster not just increased cycling, but also broader social justice and synergistic benefits across the city’s transport infrastructure.
7. Conclusions
This interdisciplinary paper integrates social science and data science approaches to advance policy development for cycling that not just aims to increase cycling rates, but also to increase diversity in cycling and promote social justice alongside sustainability agendas.
This paper developed design guidelines for social-justice-informed `pay for cycling’ financial incentive policies, including associated data collection and analysis. These guidelines are grounded in scholarship on transport, mobility and data justice, as well as literature on cycling, and a review of existing financial incentive policies for cycling. Our guidelines were brought to life through several illustrations of how the design guidelines can help further social justice agendas in specific contexts. Beyond the pilot application discussed in this paper, the design guidelines have the potential to inform similar policies in other cities and to guide social-justice-informed analyses and redesigns of existing ‘pay to cycle’ financial incentive policies.
This paper also details the implementation of these social-justice-informed design guidelines in a pilot project that is part of the operationalization strategy for planning the “Bike SP" program in São Paulo, Brazil. This included a contextual data analysis of cycling in São Paulo, revealing demographic and socioeconomic inequalities around cycling in the city. This analysis serves as the basis for the Bike SP pilot project and could also inform other cycling policies in São Paulo. Additionally, we provide detailed information on the data collection and app development. The application section highlights the development and testing of an open-source mobile application designed to record participants’ cycling trips, which can serve as a model for similar policies worldwide.
This research makes several novel contributions to the field. The paper is the first to develop social justice informed design principles for developing data and policy processes around `pay for cycling’ financial incentives. It operationalizes mobility (data) justice theories for designing and testing an actual pilot and app with associated data and policy processes. The paper also addresses the current lack of data regarding `pay for cycling’ financial incentives and policies, which poses a barrier to analysis, by providing an open-source app with the associated processes and design guidelines that can be reused by other cities and countries. Through our focus on a non-European context of implementing financial incentives and apps, we extend current debates to the Global South. Bike SP is also one of the first `financial incentives for cycling’ policies and app to integrate directly with public transport, thus providing an inter-modal approach in the context of the entire mobility system.
Besides theoretical contributions, this work advances practical transport planning by illustrating how to design a cycling policy that provides valuable insights and evidence for public policy decisions while aligning with social justice principles. In the field of data science, the paper’s contribution lies in its approach to data collection, analysis, and the integration of these processes into policy design through an open source cycling app that can be used as a basis for other projects involving cycling tracking and analysis. The paper also contributes to critical discussions of cycling data, complementing the existing focus on transport planning and infrastructure development with a focus on ’financial incentives for cycling’. In future research, this approach could be generalized and applied to other policy domains.
The paper should be of more broad interest to researchers concerned with the transition towards sustainable mobility and cities, as well as those concerned with the social justice implications of mobility, data and urban environments. Also, it is particularly relevant to scholars focused on active mobility, non-motorized transport, micromobility, and cycling. Additionally, it holds significance for researchers studying transitions, mobility, and cities in the Global South, including those adopting critical and postcolonial perspectives.
Beyond academia, this paper is also of interest to practitioners, including policymakers, application designers, and data scientists involved in the design and implementation of mobility and cycling policies, as well as the associated app development, data collection, analysis, and evaluation processes. The insights and guidelines presented here can guide the creation of more equitable and effective cycling policies and programs.
This study has some limitations that should be acknowledged and addressed in future research.
One limitation is related to the fairness of the pilot design. During the design process, we aimed to account for and address elements of social justice. Nevertheless, some potential beneficiaries of the policy may still be excluded from cycling due to safety reasons, for example, which disproportionately affect the most vulnerable segments of the population. Therefore, we argue that financial incentives policies should not be seen as a way to transfer responsibility to the individual for their cycling choice, but rather as a component of a broader set of measures to enhance the safety and quality of cycling in the city, in order to achieve a truly fair cycling environment.
Another limitation is associated with the scope and duration of the pilot design suggested for the case study in São Paulo, which will involve a small sample of the population and last for a few months. Thus, it will not be enough to capture the long-term and large-scale effects of the policy, such as improvements in health and well-being or reductions in greenhouse gas emissions. Therefore, the pilot intervention should be complemented by other methods and data sources to assess the impact of the policy in a more comprehensive and robust way. The pilot is the initial step to enable the policy’s implementation and should be followed by progressively larger and longer implementations of the policy, which should also incorporate the strategies suggested in Section 4.4.
Finally, this paper does not include the implementation and evaluation of the pilot project using the guidelines, which is left for future work.
Funding
This research was funded by FAPESP and CNPq. This research was funded by anonymized funding.
Acknowledgments
We thank the valuable feedback provided by our research collaborators, including anonymized collaborators. We also thank the anonymous reviewers for the valuable feedback in earlier versions of this paper.
References
- Kon, F.; Ferreira, E.C.; de Souza, H.A.; Duarte, F.; Santi, P.; Ratti, C. Abstracting mobility flows from bike-sharing systems. Public Transport 2022, 14, 545–581. [CrossRef]
- Bek, P. No Bicycle, No Bus, No Job; Amsterdam University Press, 2022.
- Jeekel, H. Social Sustainability and Smart Mobility : Exploring the relationship. Transportation Research Procedia 2017, 25, 4296–4310. [CrossRef]
- Sheller, M. Theorising mobility justice. Tempo Social 2018, 30, 17–34. Publisher: Departamento de Sociologia da Faculdade de Filosofia, Letras e Ciências Humanas da Universidade de São Paulo. [CrossRef]
- Metrô São Paulo. Relatório Síntese OD 2017. https://transparencia.metrosp.com.br/sites/default/files/S%C3%8DNTESE_OD2017_ago19.pdf, 2019.
- Golub, A.; Hoffmann, M.L.; Lugo, A.E.; Sandoval, G.F. Introduction: Creating an inclusionary bicycle justice movement. In Bicycle Justice and Urban Transformation; Routledge, 2016. Num Pages: 19.
- Sukhera, J. Narrative Reviews: Flexible, Rigorous, and Practical. Journal of Graduate Medical Education 2022. [CrossRef]
- Behrendt, F.; Sheller, M. Mobility Data Justice. Mobilities 2024, 19, 151–169. [CrossRef]
- Metrô São Paulo. Pesquisa Origem e Destino 2023. https://www.metro.sp.gov.br/pesquisa-od/, 2023.
- Vanoutrive, T.; Cooper, E. How just is transportation justice theory? The issues of paternalism and production: A rejoinder. Transportation Research Part A: Policy and Practice 2020, 133, 387–390.
- Verlinghieri, E.; Schwanen, T. Transport and mobility justice: Evolving discussions. Journal of Transport Geography 2020, 87, 102798. [CrossRef]
- Karner, A.; London, J.; Rowangould, D.; Manaugh, K. From Transportation Equity to Transportation Justice: Within, Through, and Beyond the State. Journal of Planning Literature 2020, 35, 088541222092769. [CrossRef]
- Martens, K. Basing Transport Planning on Principles of Social Justice. Berkeley Planning Journal 2006, 19, 1–17. [CrossRef]
- Sheller, M. Mobility Justice: The Politics of Movement in An Age of Extremes; Verso Books, 2018. Google-Books-ID: O3DnDwAAQBAJ.
- Cook, N.; Butz, D. Mobilities, Mobility Justice and Social Justice; Routledge, 2019.
- Dencik, L.; Sanchez-Monedero, J. Data justice. Internet Policy Review 2022, 11.
- Taylor, L. What is data justice? The case for connecting digital rights and freedoms globally, 2017.
- Leslie, D.; Katell, M.; Aitken, M.; Singh, J.; Briggs, M.; Powell, R.; Rincón, C.; Chengeta, T.; Birhane, A.; Perini, A.; et al. Advancing Data Justice Research and Practice: An Integrated Literature Review, 2022. [CrossRef]
- Nikolaeva, A.; te Brömmelstroet, M.; Raven, R.; Ranson, J. Smart cycling futures: Charting a new terrain and moving towards a research agenda. Journal of Transport Geography 2019, 79. [CrossRef]
- Williams, S. Datafication of Cycling: tensions between cycling policy and mobility justice. Phd thesis, Brighton University, United Kingdom, 2023.
- Williams, S.; Behrendt, F. Data visibility of cyclists: social justice implications of Strava Metro data in transport planning. Mobilities 2025. [CrossRef]
- Martens, K.; Golub, A.; Hamre, A. Cycling for Sustainable Cities; The MIT Press, 2021. [CrossRef]
- Aldred, R.; Woodcock, J.; Goodman, A. Does More Cycling Mean More Diversity in Cycling? Transport Reviews 2016, 36, 28–44. [CrossRef]
- Garrard, J. Women and Cycling: Addressing the Gender Gap. In Cycling for Sustainable Cities; MIT Press, 2021; pp. 197–218. [CrossRef]
- Pucher, J.; Buehler, R. City Cycling; The MIT Press, 2012.
- Baker, L. How to Get More Bicyclists on the Road: To Boost Urban Cycling, Figure Out What Women Want. Scientific American 301 (4): 28–29 2009.
- Steinbach, R.; Green, J.; Datta, J.; Edwards, P. Cycling and the city: A case study of how gendered, ethnic and class identities can shape healthy transport choices.Social Science & Medicine 2011, 72, 1123–1130. [CrossRef]
- Bandeira, A.d.S.; da Silva, K.S.; Del Duca, G.F.; Zilch, G.R.; de Oliveira, E.S.A.; de Barros, M.V.G.; Nahas, M.V. Factors associated with bicycle use for commuting and for leisure among Brazilian workers. Sport Sciences for Health 2017, 13, 63–68. [CrossRef]
- Cunha, I.; Silva, C. Equity impacts of cycling: examining the spatial-social distribution of bicycle-related benefits. International Journal of Sustainable Transportation 2023, 17, 573–591. [CrossRef]
- Oldenziel, R.; Albert de la Bruheze, A. Oldenziel, Ruth, and Adri A. de la Bruhèze. "Contested Spaces: Bicycle Lanes in Urban Europe, 1900-1995." Transfers 1, no. 2 (2011): 31-49. Transfers 2011, 1, 31–49. [CrossRef]
- Berkers, E.; Oldenziel, R. Cycling Cities: The Arnhem and Nijmegen Experience; Foundation for the History of Technology, 2017.
- Morgan, N. Cycling Cities: The Johannesburg Experience; Foundation for the History of Technology, 2019.
- Kane, R.L.; Johnson, P.E.; Town, R.J.; Butler, M. A structured review of the effect of economic incentives on consumers’ preventive behavior. American Journal of Preventive Medicine 2004.
- Mantzari, E.; Vogt, F.; Shemilt, I.; Wei, Y.; Higgins, J.P.; Marteau, T.M. Personal financial incentives for changing habitual health-related behaviors: A systematic review and meta-analysis. Prev Med 2015.
- Vlaev, I.; King, D.; Darzi, A.; Dolan, P. Changing health behaviors using financial incentives: a review from behavioral economics. BMC Public Health 2019.
- Federation, E.C. Tracker Money for bikes. https://www.ecf.com/en/resources/tracker-money-for-bikes/, 2025.
- Mag, M. Is it time governments start paying people to bike to work? https://momentummag.com/is-it-time-governments-start-paying-people-to-bike-to-work/, 2025.
- Service-Public.fr. Aid for the purchase of a bicycle abolished as of 15 February 2025. https://www.service-public.fr/particuliers/actualites/A17058?lang=en, 2025.
- Bicycles, T. 2022-23 North America & EU E-Bike Subsidies. https://www.ternbicycles.com/en/explore/more-from-tern/2022-2023-e-bike-incentive-programs-north-america-and-europe#:~:text=Netherlands,use%20it%20outside%20working%20hours., 2023.
- of Spain, G. Public transport discounts. https://www.lamoncloa.gob.es/lang/en/gobierno/news/paginas/2025/public-transport-discounts.aspx, 2025.
- Cycles, C. Cycle to Work. https://www.condorcycles.com/pages/cycle-to-work, 2025.
- Sports, S. Cycle to Work Scheme. https://www.sigmasports.com/cycle-to-work-scheme, 2025.
- Bicycles, T. 2024-2025 E-Bike Incentive Programs in North America. https://www.ternbicycles.com/en/explore/more-from-tern/2024-2025-e-bike-incentive-programs-north-america, 2025.
- IRS. Employer Update. https://www.irs.gov/newsroom/employer-update, 2025.
- Congress, U. H.R. 3473 - Bicycle Commuter Act of 2023. https://www.congress.gov/bill/118th-congress/house-bill/3473, 2023.
- Forum, W.E. This is how Buenos Aires plans to achieve 1 million bike rides a day. https://www.weforum.org/stories/2021/01/buenos-aires-argentina-cycle-lanes-pollution/, 2021.
- Intertraffic. Argentina is Leading The Way in Cycling and Sustainable Transit. https://www.intertraffic.com/news/argentina-is-leading-the-way-in–cycling-and-sustainable-transit, 2024.
- Hall, I.C. Itajaí lança programa que incentiva mobilidade sustentável com recompensas financeiras. https://itajai.sc.gov.br/noticia/27303/itajai-lanca-programa-que-incentiva-mobilidade-sustentavel-com-recompensas-financeiras, 2021.
- Transport Decarbonisation Alliance. AYR, a platform that rewards carbon neutral mobility behavior. https://tda-mobility.org/ayr-a-platform-that-rewards-carbon-neutral-mobility-behavior/, n.d.
- Law, B. Colombia’s Visionary Bicycle Legislation. https://www.bikelaw.com/2017/09/colombias-visionary-bicycle-legislation/, 2017.
- Link, L.C. International Cycling Law: Bogota, Colombia. https://www.londoncyclelink.ca/news/2022/4/12/international-cycling-law-columbia, 2022.
- of Pretoria, U. The Potential of Bicycles as a Means of Transport for Learners in Rural South Africa. https://repository.up.ac.za/bitstreams/c0328388-7c2c-40cb-8113-30591253cf91/download, 2003.
- in Asia, T. China sees surge in e-bike sales under trade-in program. https://techinasia.com/news/china-sees-surge-ebike-sales-tradein-program, 2025.
- Dive, S.C. Seoul Gives Bike Subsidies to Commuters. https://www.smartcitiesdive.com/ex/sustainablecitiescollective/seoul-gives-bike-subsidies-commuters/23494/, 2025.
- Zealand, W.N. For Employees | Save on Your Ride Today. https://www.workride.co.nz/employees, 2025.
- E-Ozzie. Government Subsidies and Incentives for Electric Bike Buyers in Sydney. https://eozzie.com.au/blogs/news/sydney-electric-bike-subsidies?srsltid=AfmBOopDhAd3BogvNvUtLafBdbOJWJYwL1SMW4kdvVRNzux2qlC4T94-, 2025.
- Agyeman, S.; Alimo, P.K.; Donkoh, V.; Cheng, L. Toward cleaner production of walking school buses and bicycle trains: A systematic review. Journal of Cleaner Production 2023, 426, 139031. [CrossRef]
- Siqueira, M.F.; Lopes, A.S.; Costa, T.B.; Loureiro, C.F.G. Challenges in promoting bike-bus integration in developing countries: Case study of Fortaleza, Brazil. Latin American Transport Studies 2023, 1. [CrossRef]
- de Oliveira, S.P.; Luche, J.R.D.; Marins, F.A.S.; da Silva, A.F.; Costa, A.F.B. Design of a Bike–Bus Network for a City of Half a Million Citizens. Journal of Urban Planning and Development 2021, 147, 04021029. [CrossRef]
- Metrô São Paulo. Pesquisa Origem e Destino 2017. 2017.
- Freire, P.G.; Kon, F.; Lemos, L.L.; de Souza, H.A. The Design and Implementation of a Robust Cycling Potential Index. 2023.
- São Paulo’s City Hall. Climate Action Plan São Paulo. http://www.cetsp.com.br/consultas/bicicleta/mapa-de-infraestrutura-cicloviaria.aspx, 2022.
- Municipal legislation. Lei Nº 16.547 - Institui o Programa Bike SP no âmbito do Município de São Paulo. 2016.
- SPTrans - Secretaria Municipal de Transporte e Mobilidade Urbana. Bilhete Único. https://www.sptrans.com.br/, 2023.
- Ciclocidade. Pesquisa Perfil de quem usa bicicleta na cidade de São Paulo – Relatório completo. https://www.ciclocidade.org.br/noticias/pesquisa-perfil-de-quem-usa-bicicleta-na-cidade-de-sao-paulo-relatorio-completo/, 2016.
- CET, C.d.E.d.T. Mapa de Infraestrutura Cicloviária. http://www.cetsp.com.br/consultas/bicicleta/mapa-de-infraestrutura-cicloviaria.aspx, 2023.
- CEM, C.d.E.d.M. Banco de dados de linhas de ônibus do Município de São Paulo. 2015. [CrossRef]
- CET, C.d.E.d.T. Sistema de Consulta do Mapa Digital da Cidade de São Paulo. https://geosampa.prefeitura.sp.gov.br/PaginasPublicas/_SBC.aspx, 2023.
- Jornal da USP. Nove em cada 10 indivíduos utilizam o celular para acessar a internet em São Paulo. https://jornal.usp.br/radio-usp/nove-em-cada-10-individuos-utilizam-o-celular-para-acessar-a-internet-em-sao-paulo/, 2023.
- FGV. Brasil tem mais dispositivos digitais em uso do que habitantes, revela pesquisa da FGV. https://portal.fgv.br/noticias/brasil-tem-mais-dispositivos-digitais-em-uso-do-que-habitantes-revela-pesquisa-da-fgv, 2024.
| 1 | |
| 2 | |
| 3 | |
| 4 | |
| 5 | The Bilhete Único is a card system that is used for payment on public transportation in São Paulo. It is managed by SPTrans, the city’s bus transportation authority, and can be used on buses, subway, and metropolitan region trains [64]. |
| 6 |
Figure 1.
Research methodology and paper structure.
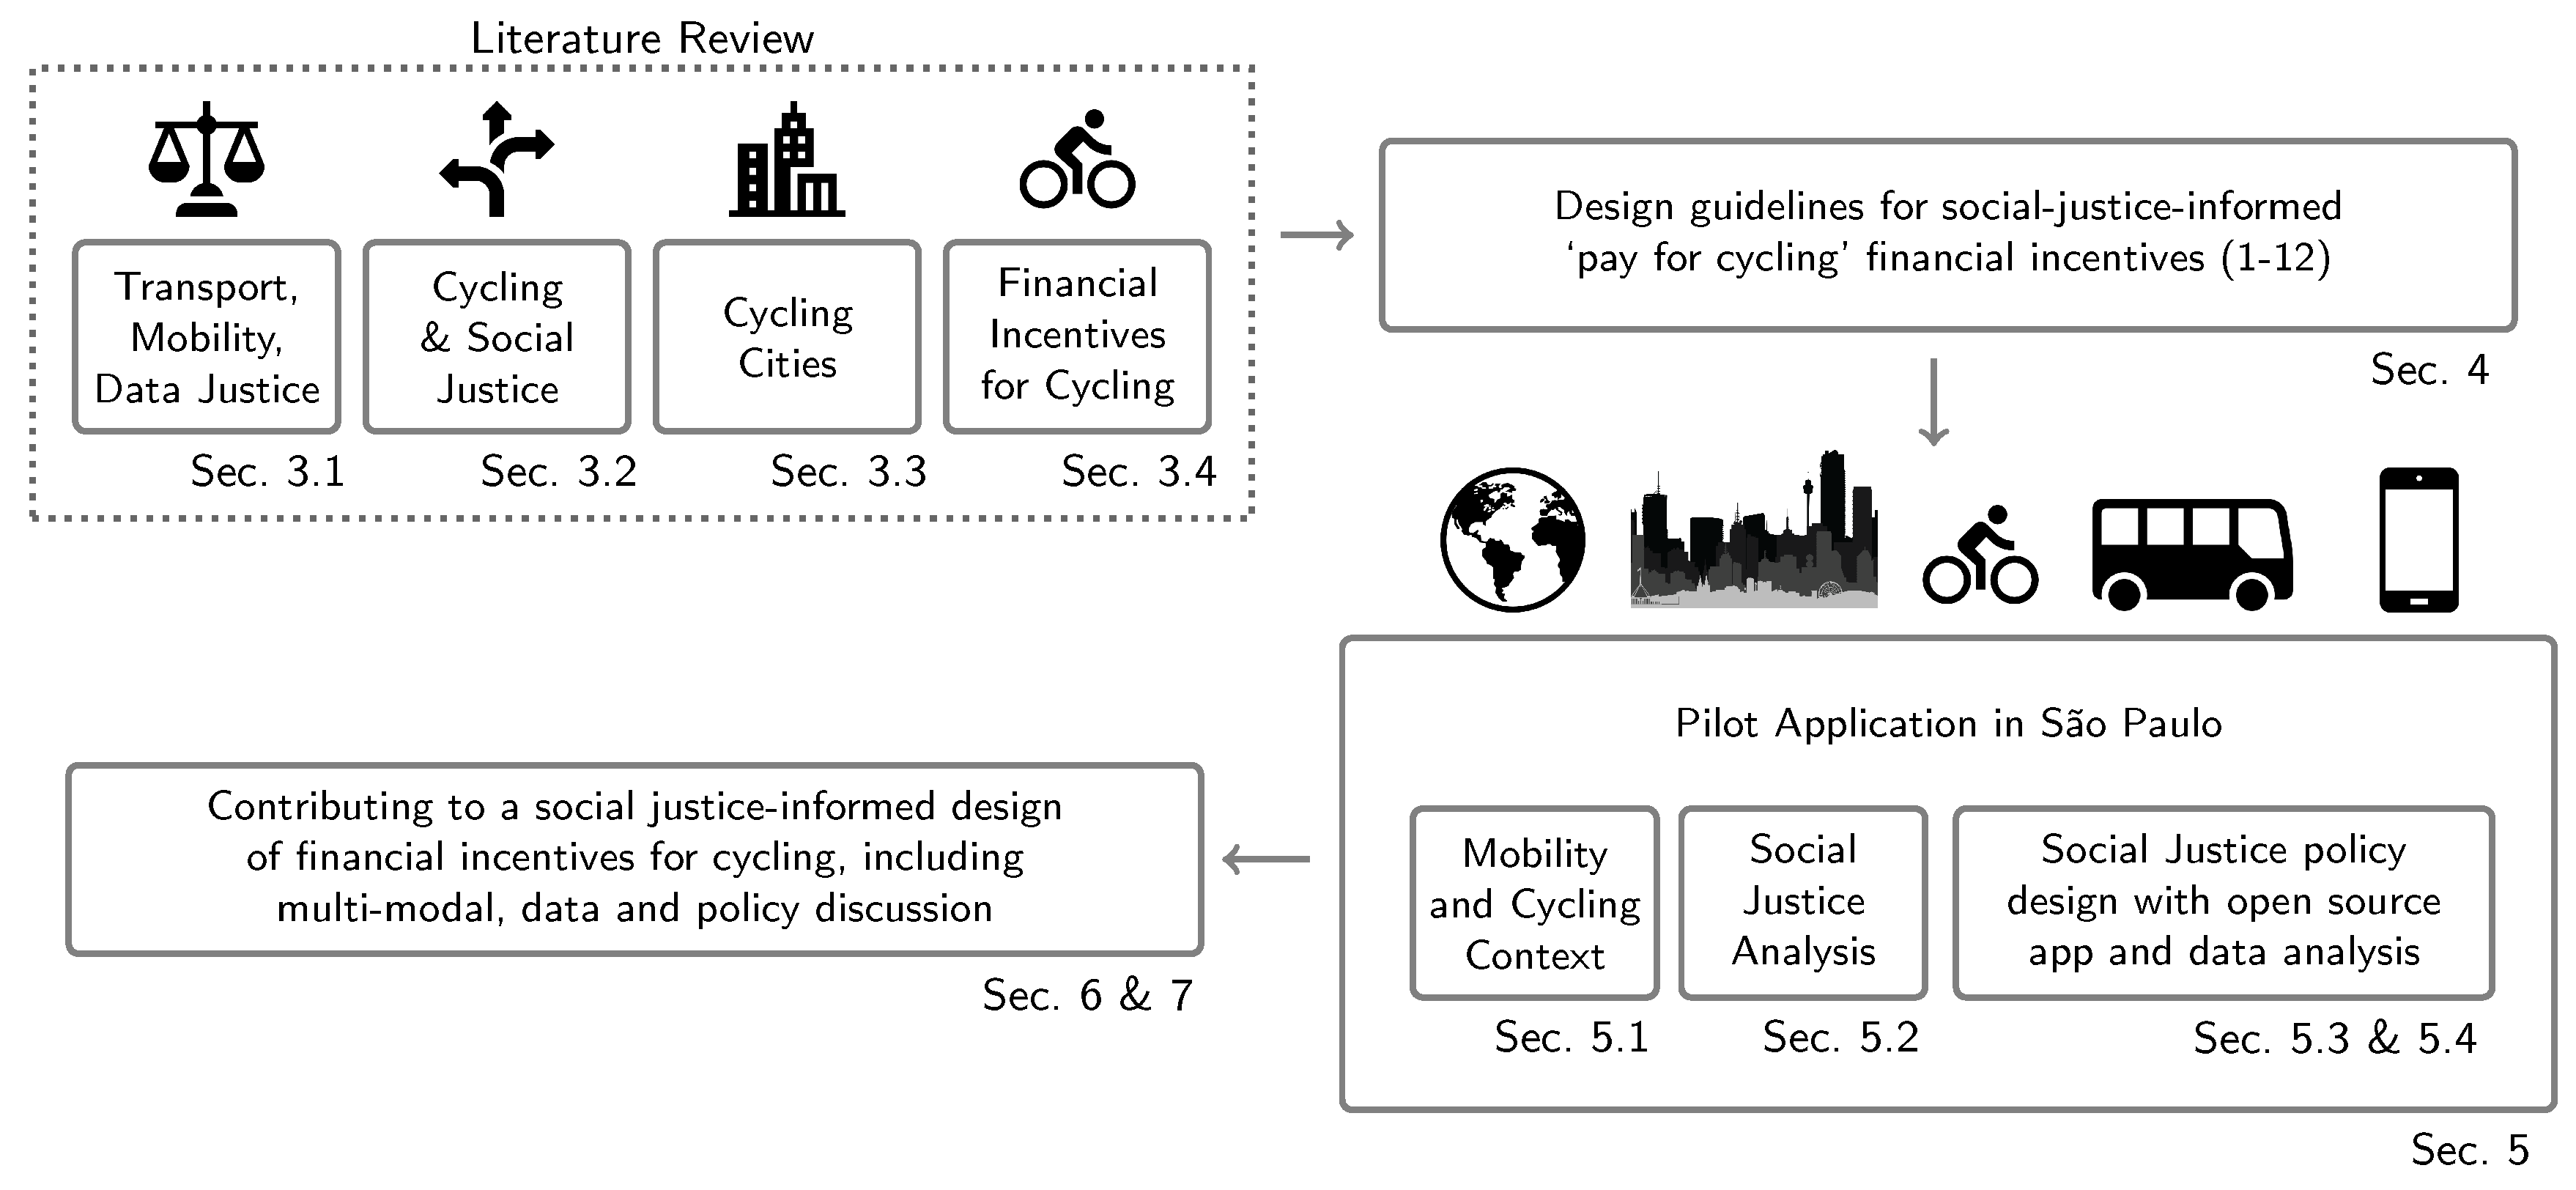
Figure 2.
Policy Design Guidelines
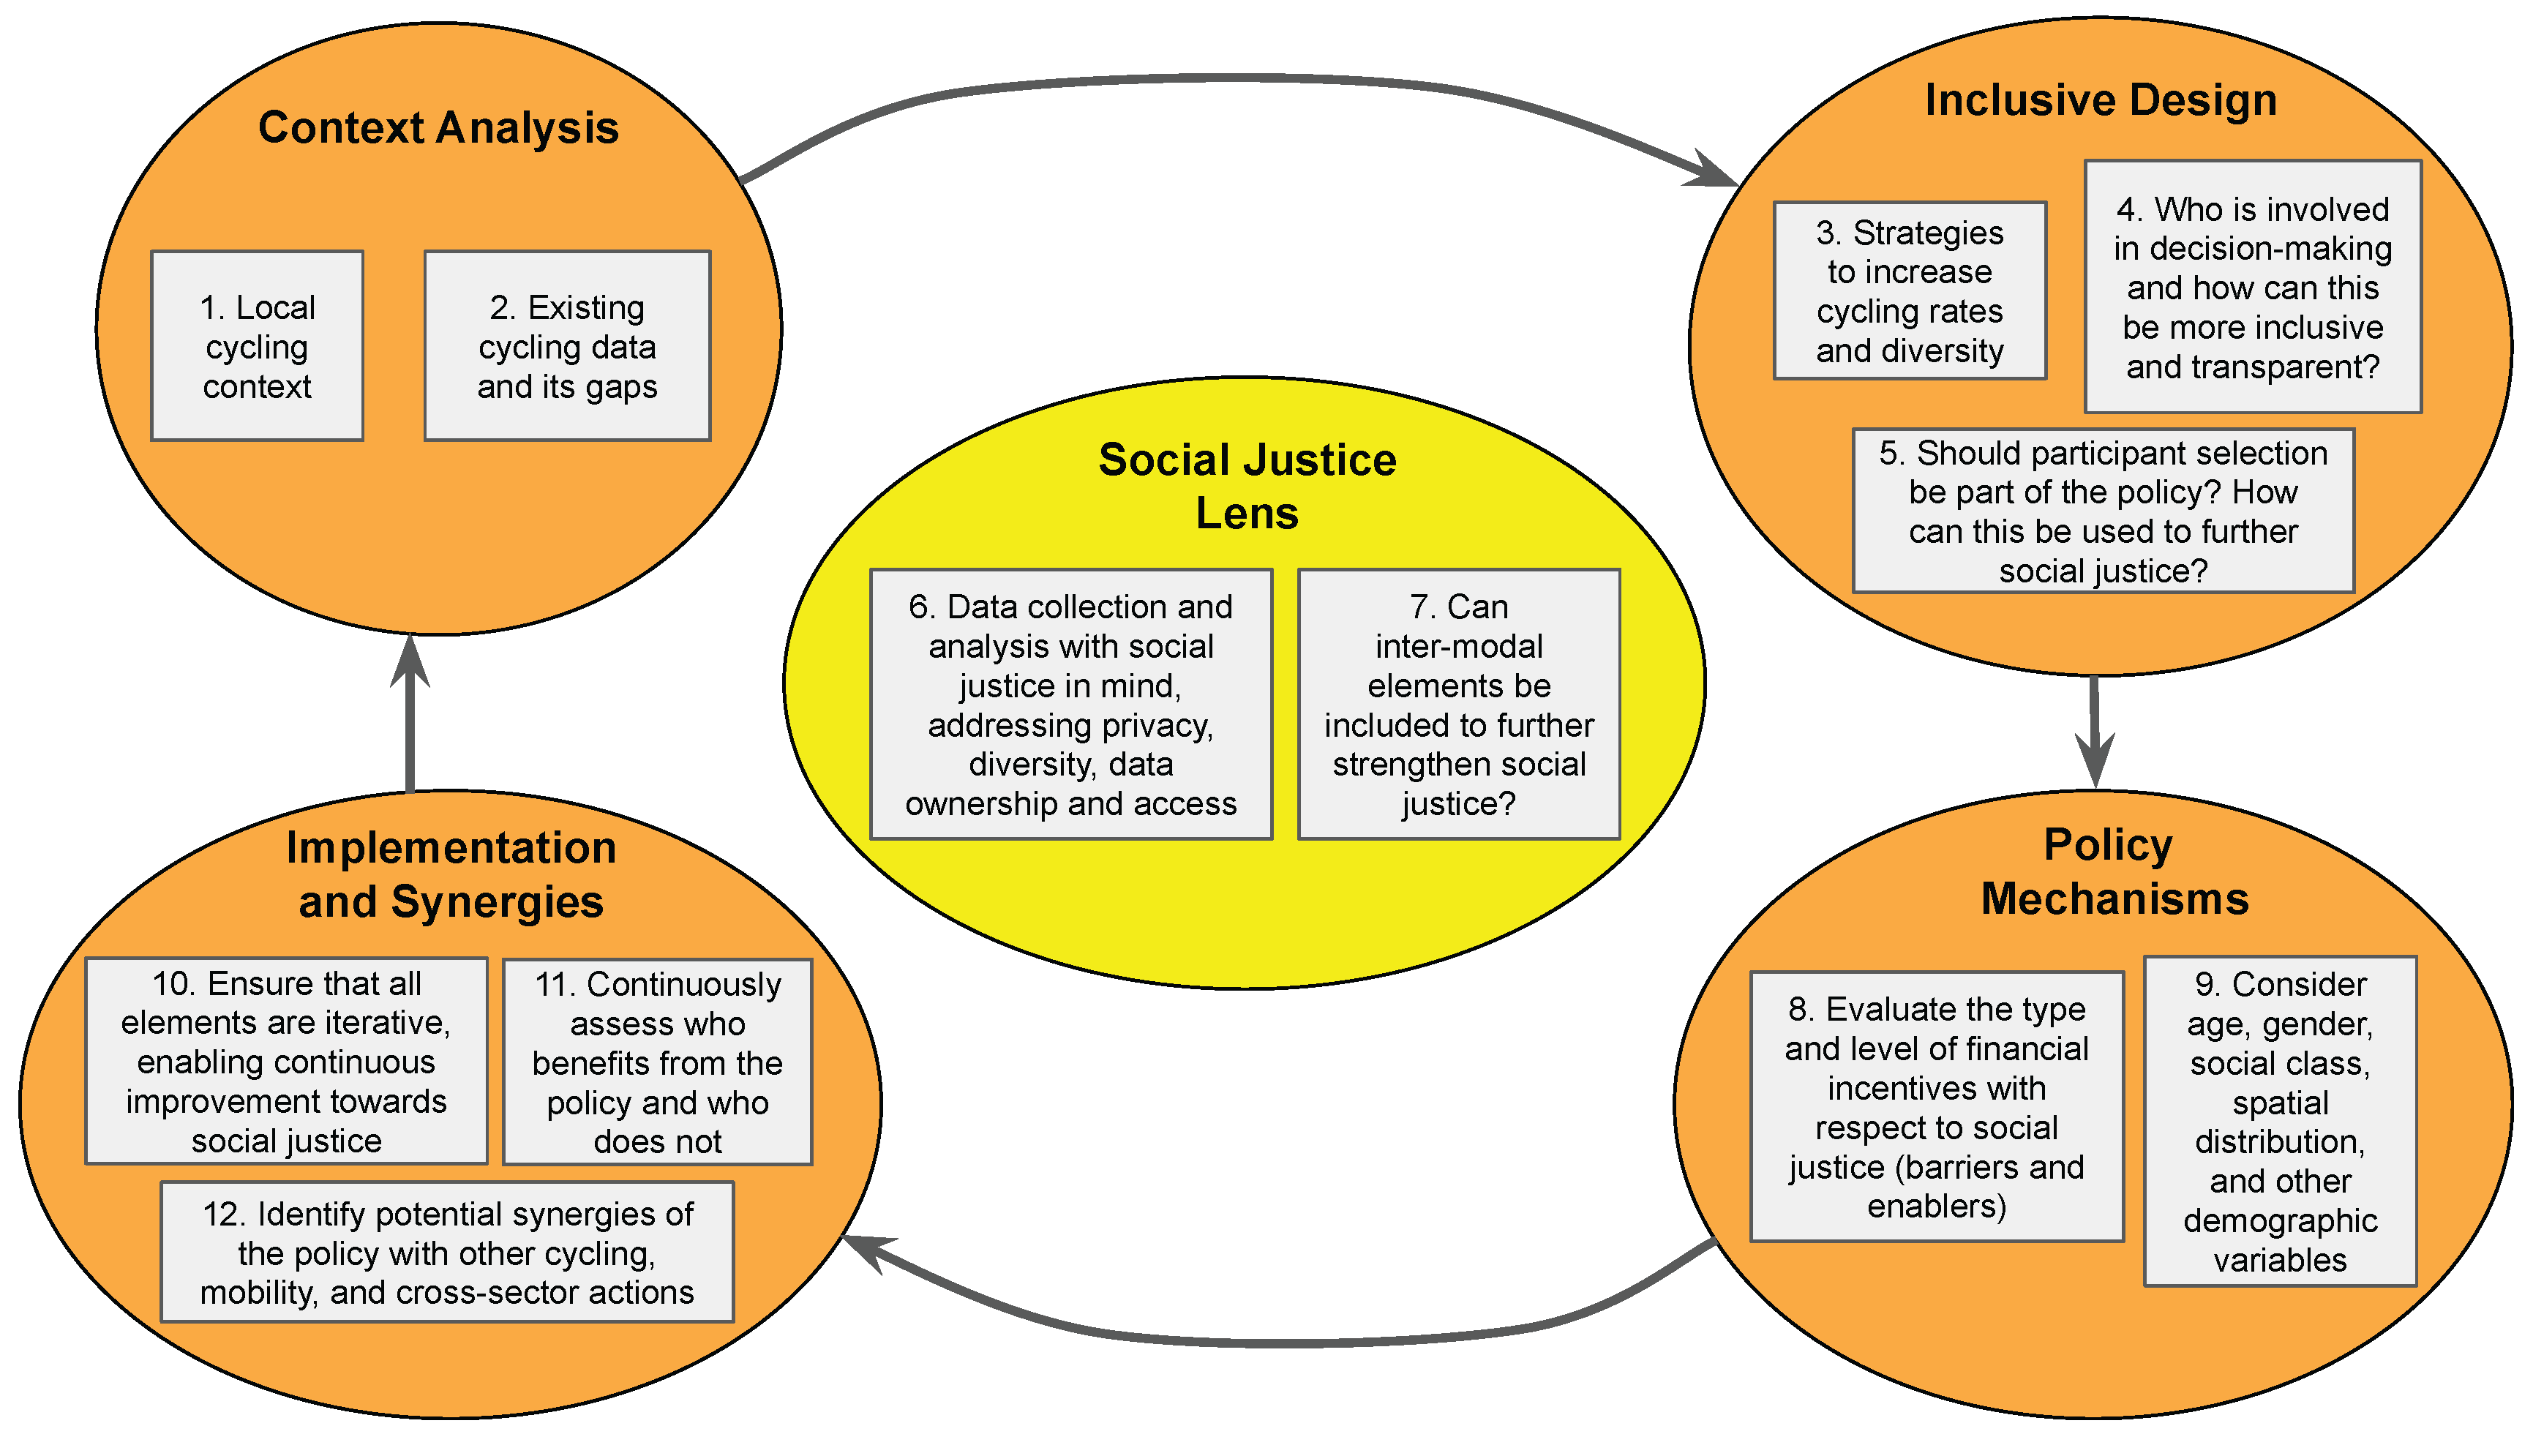
Figure 3.
Modal distribution of the trips made in the city of São Paulo in 2007 and 2017, based on data from the Origin and Destination Survey.
Figure 3.
Modal distribution of the trips made in the city of São Paulo in 2007 and 2017, based on data from the Origin and Destination Survey.
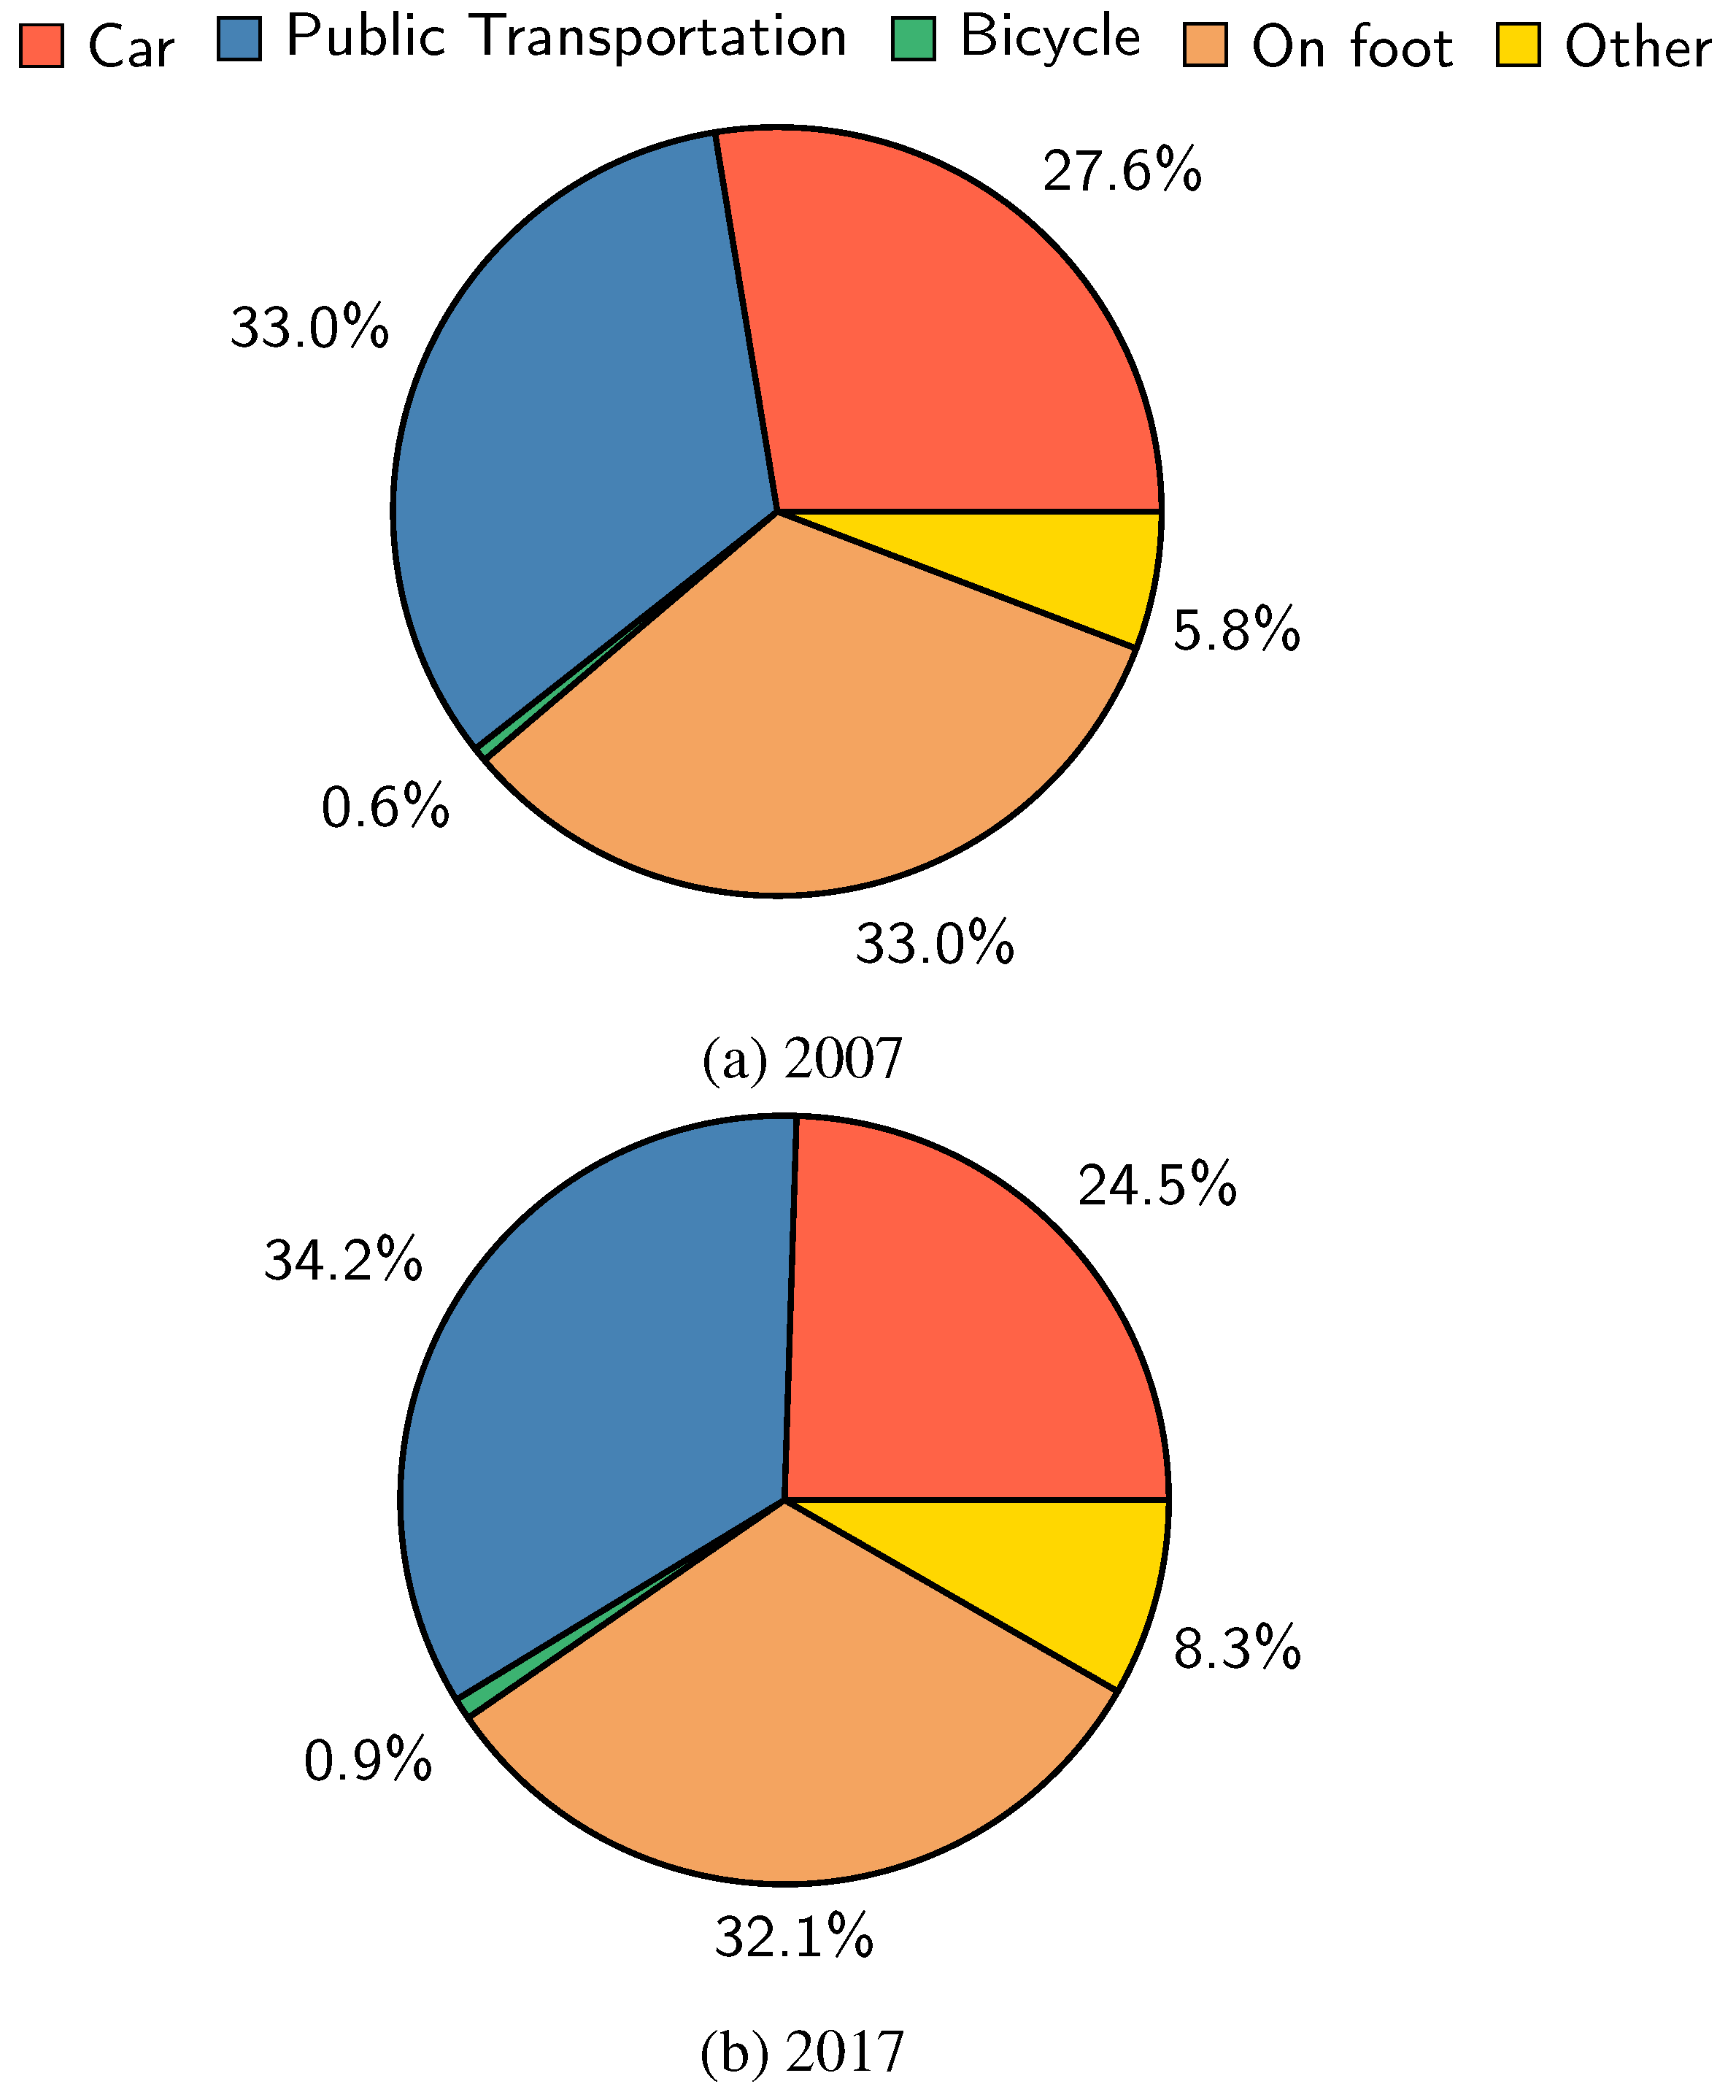
Figure 4.
Distribution of age groups (in intervals of 5 years) among bicycle users in the city of São Paulo. Own work based on the OD 2017 database.
Figure 4.
Distribution of age groups (in intervals of 5 years) among bicycle users in the city of São Paulo. Own work based on the OD 2017 database.
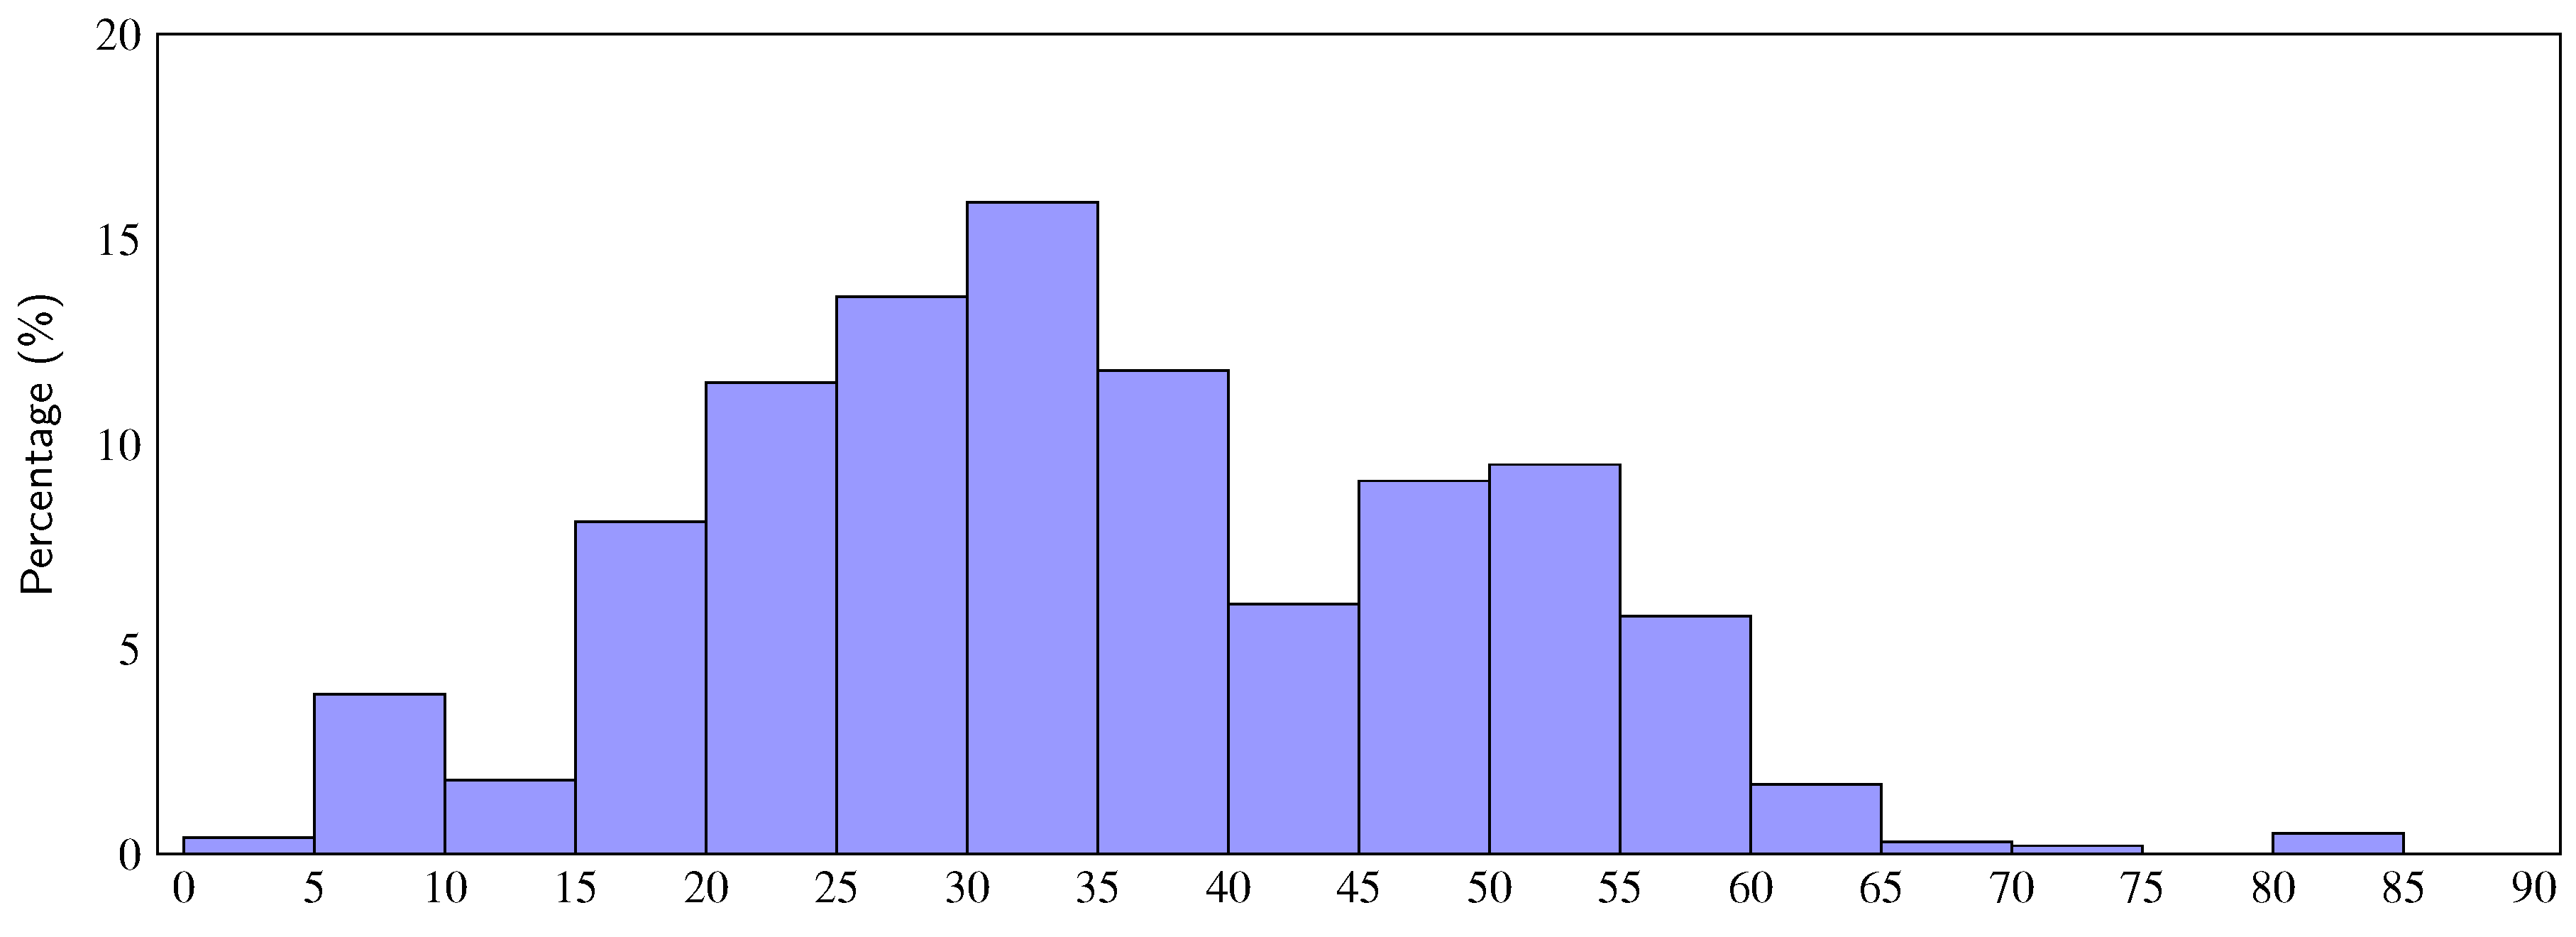
Figure 5.
Mode share separated by social class in the city of São Paulo in 2017. Own work based on the OD 2017 database.
Figure 5.
Mode share separated by social class in the city of São Paulo in 2017. Own work based on the OD 2017 database.
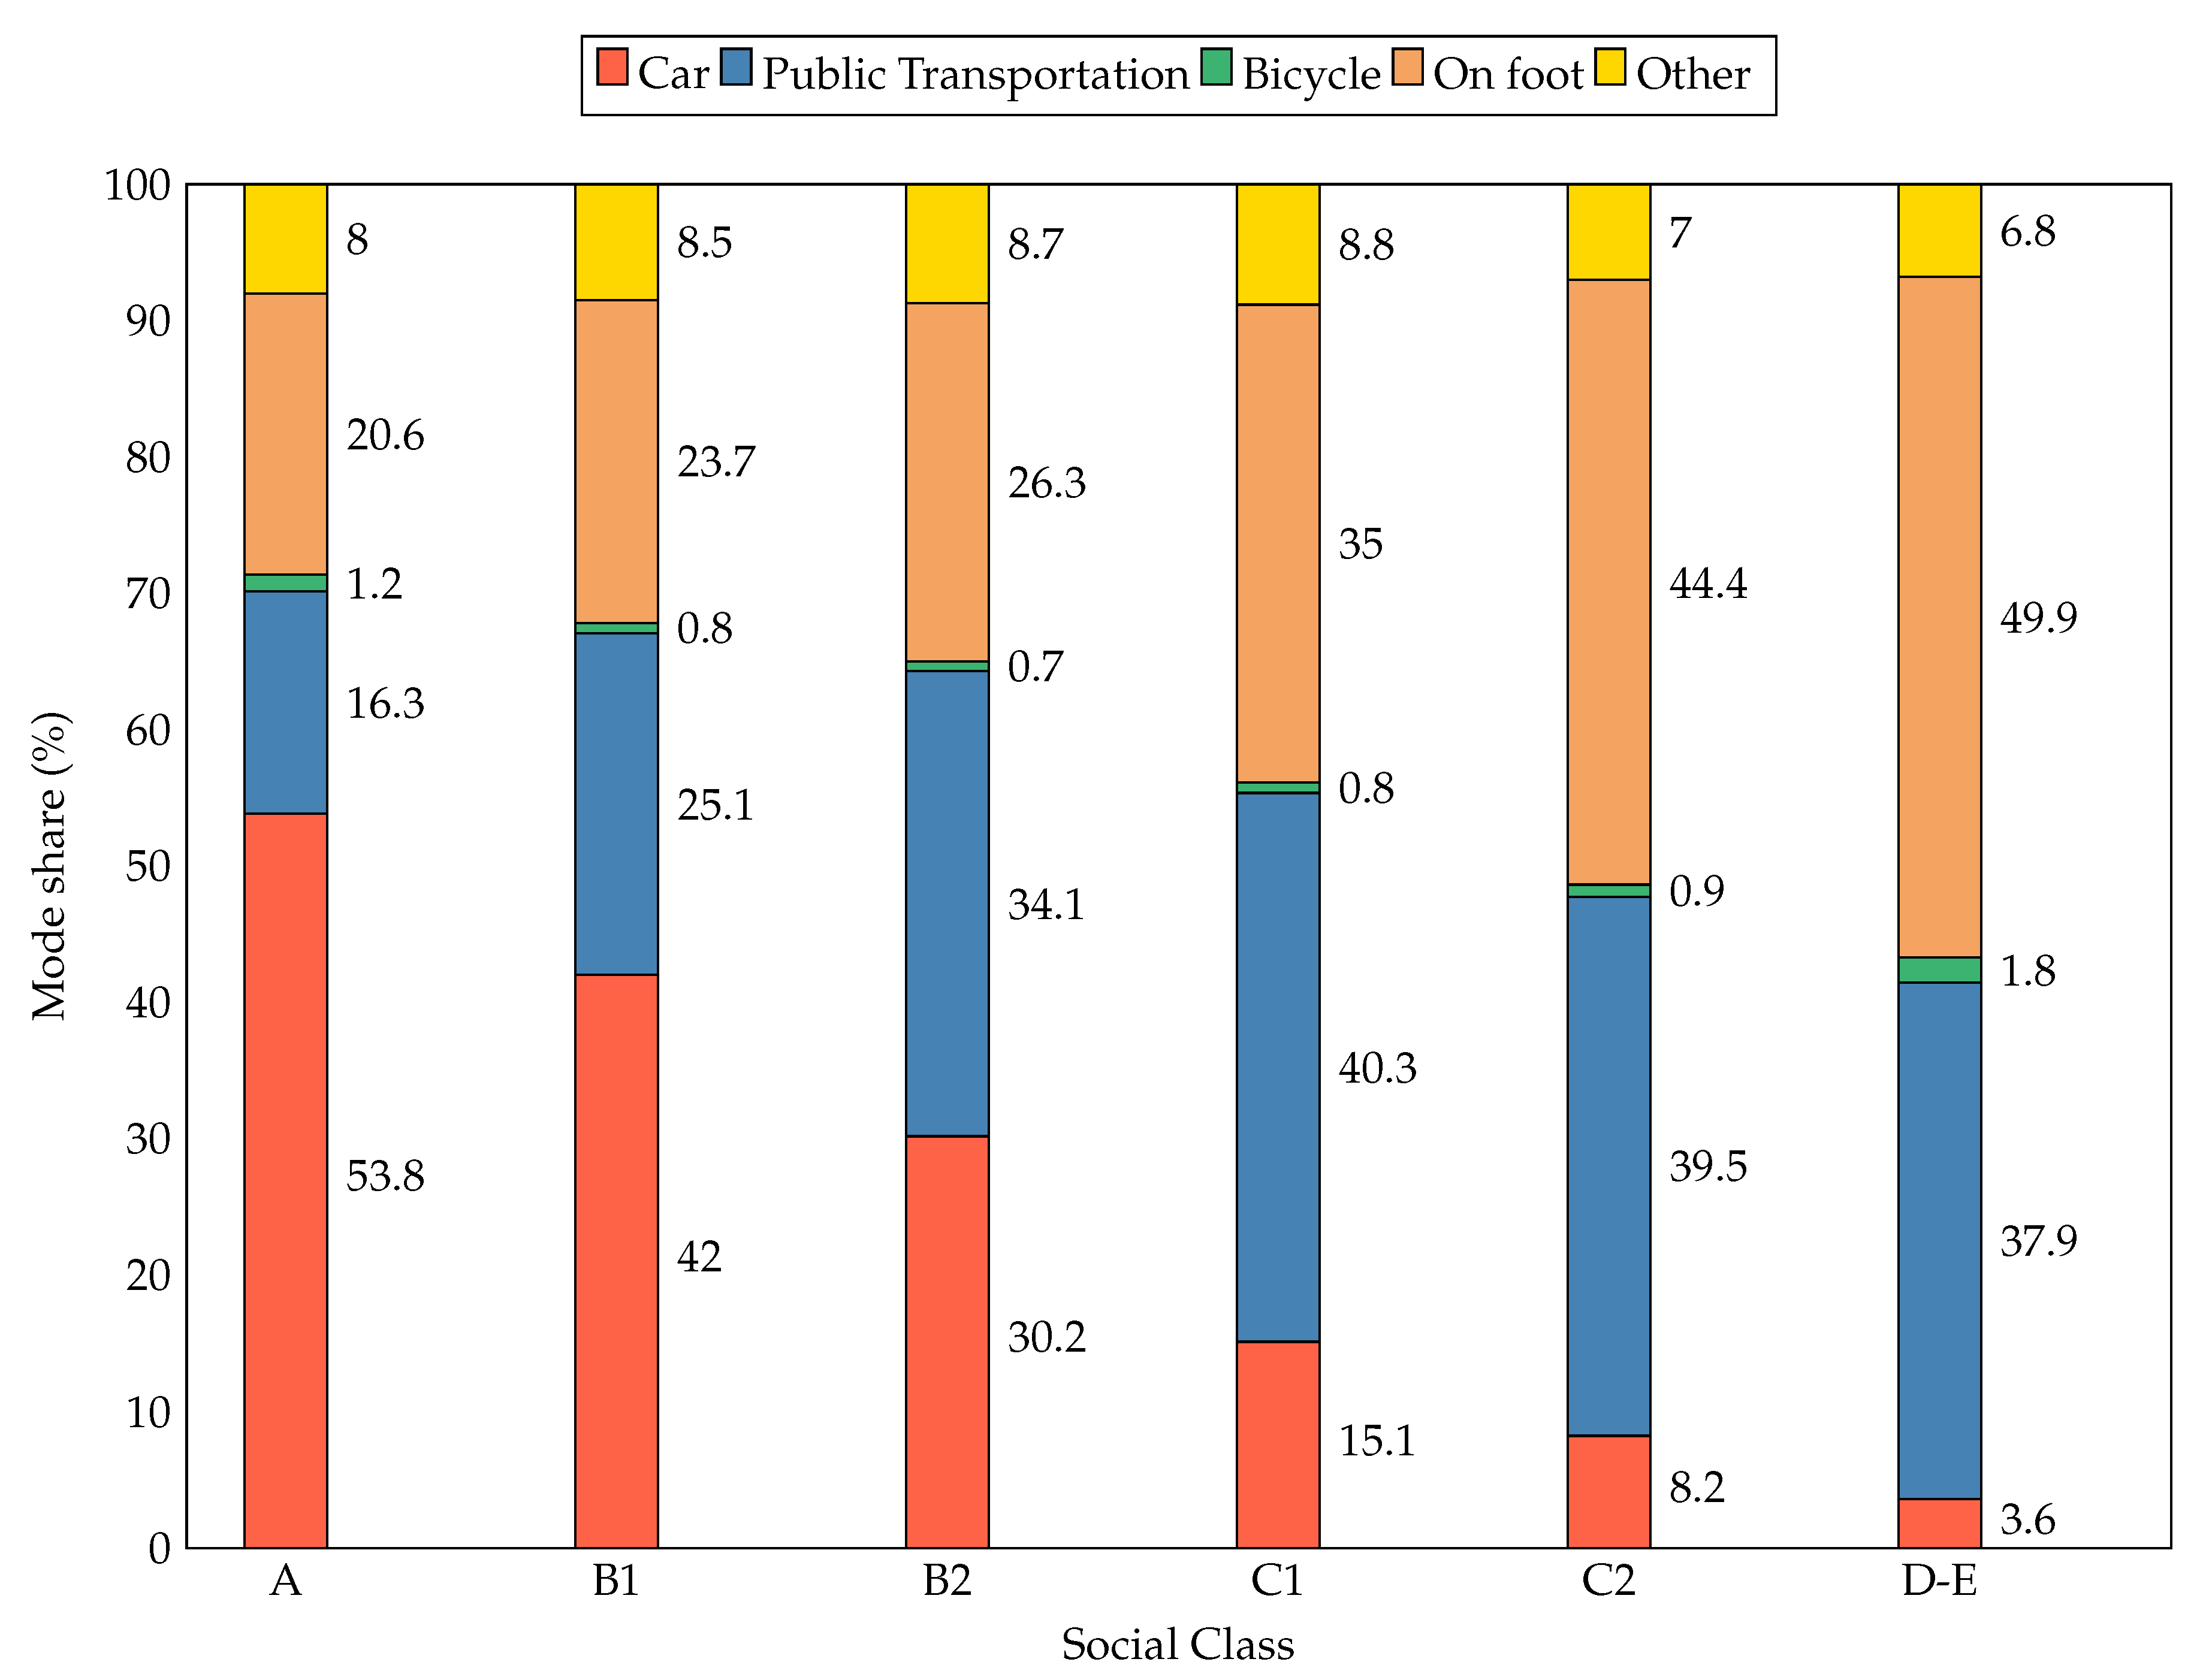
Figure 6.
Heatmaps showing the distribution of the mobility infrastructure across the city. Warmer colors represent higher concentration of infrastructure.The map of São Paulo is divided into the OD zones. The data sources were as follows: CET [66] provided the data for cycling, CEM [67] for bus, and CET [68] for subway and train. Own work.
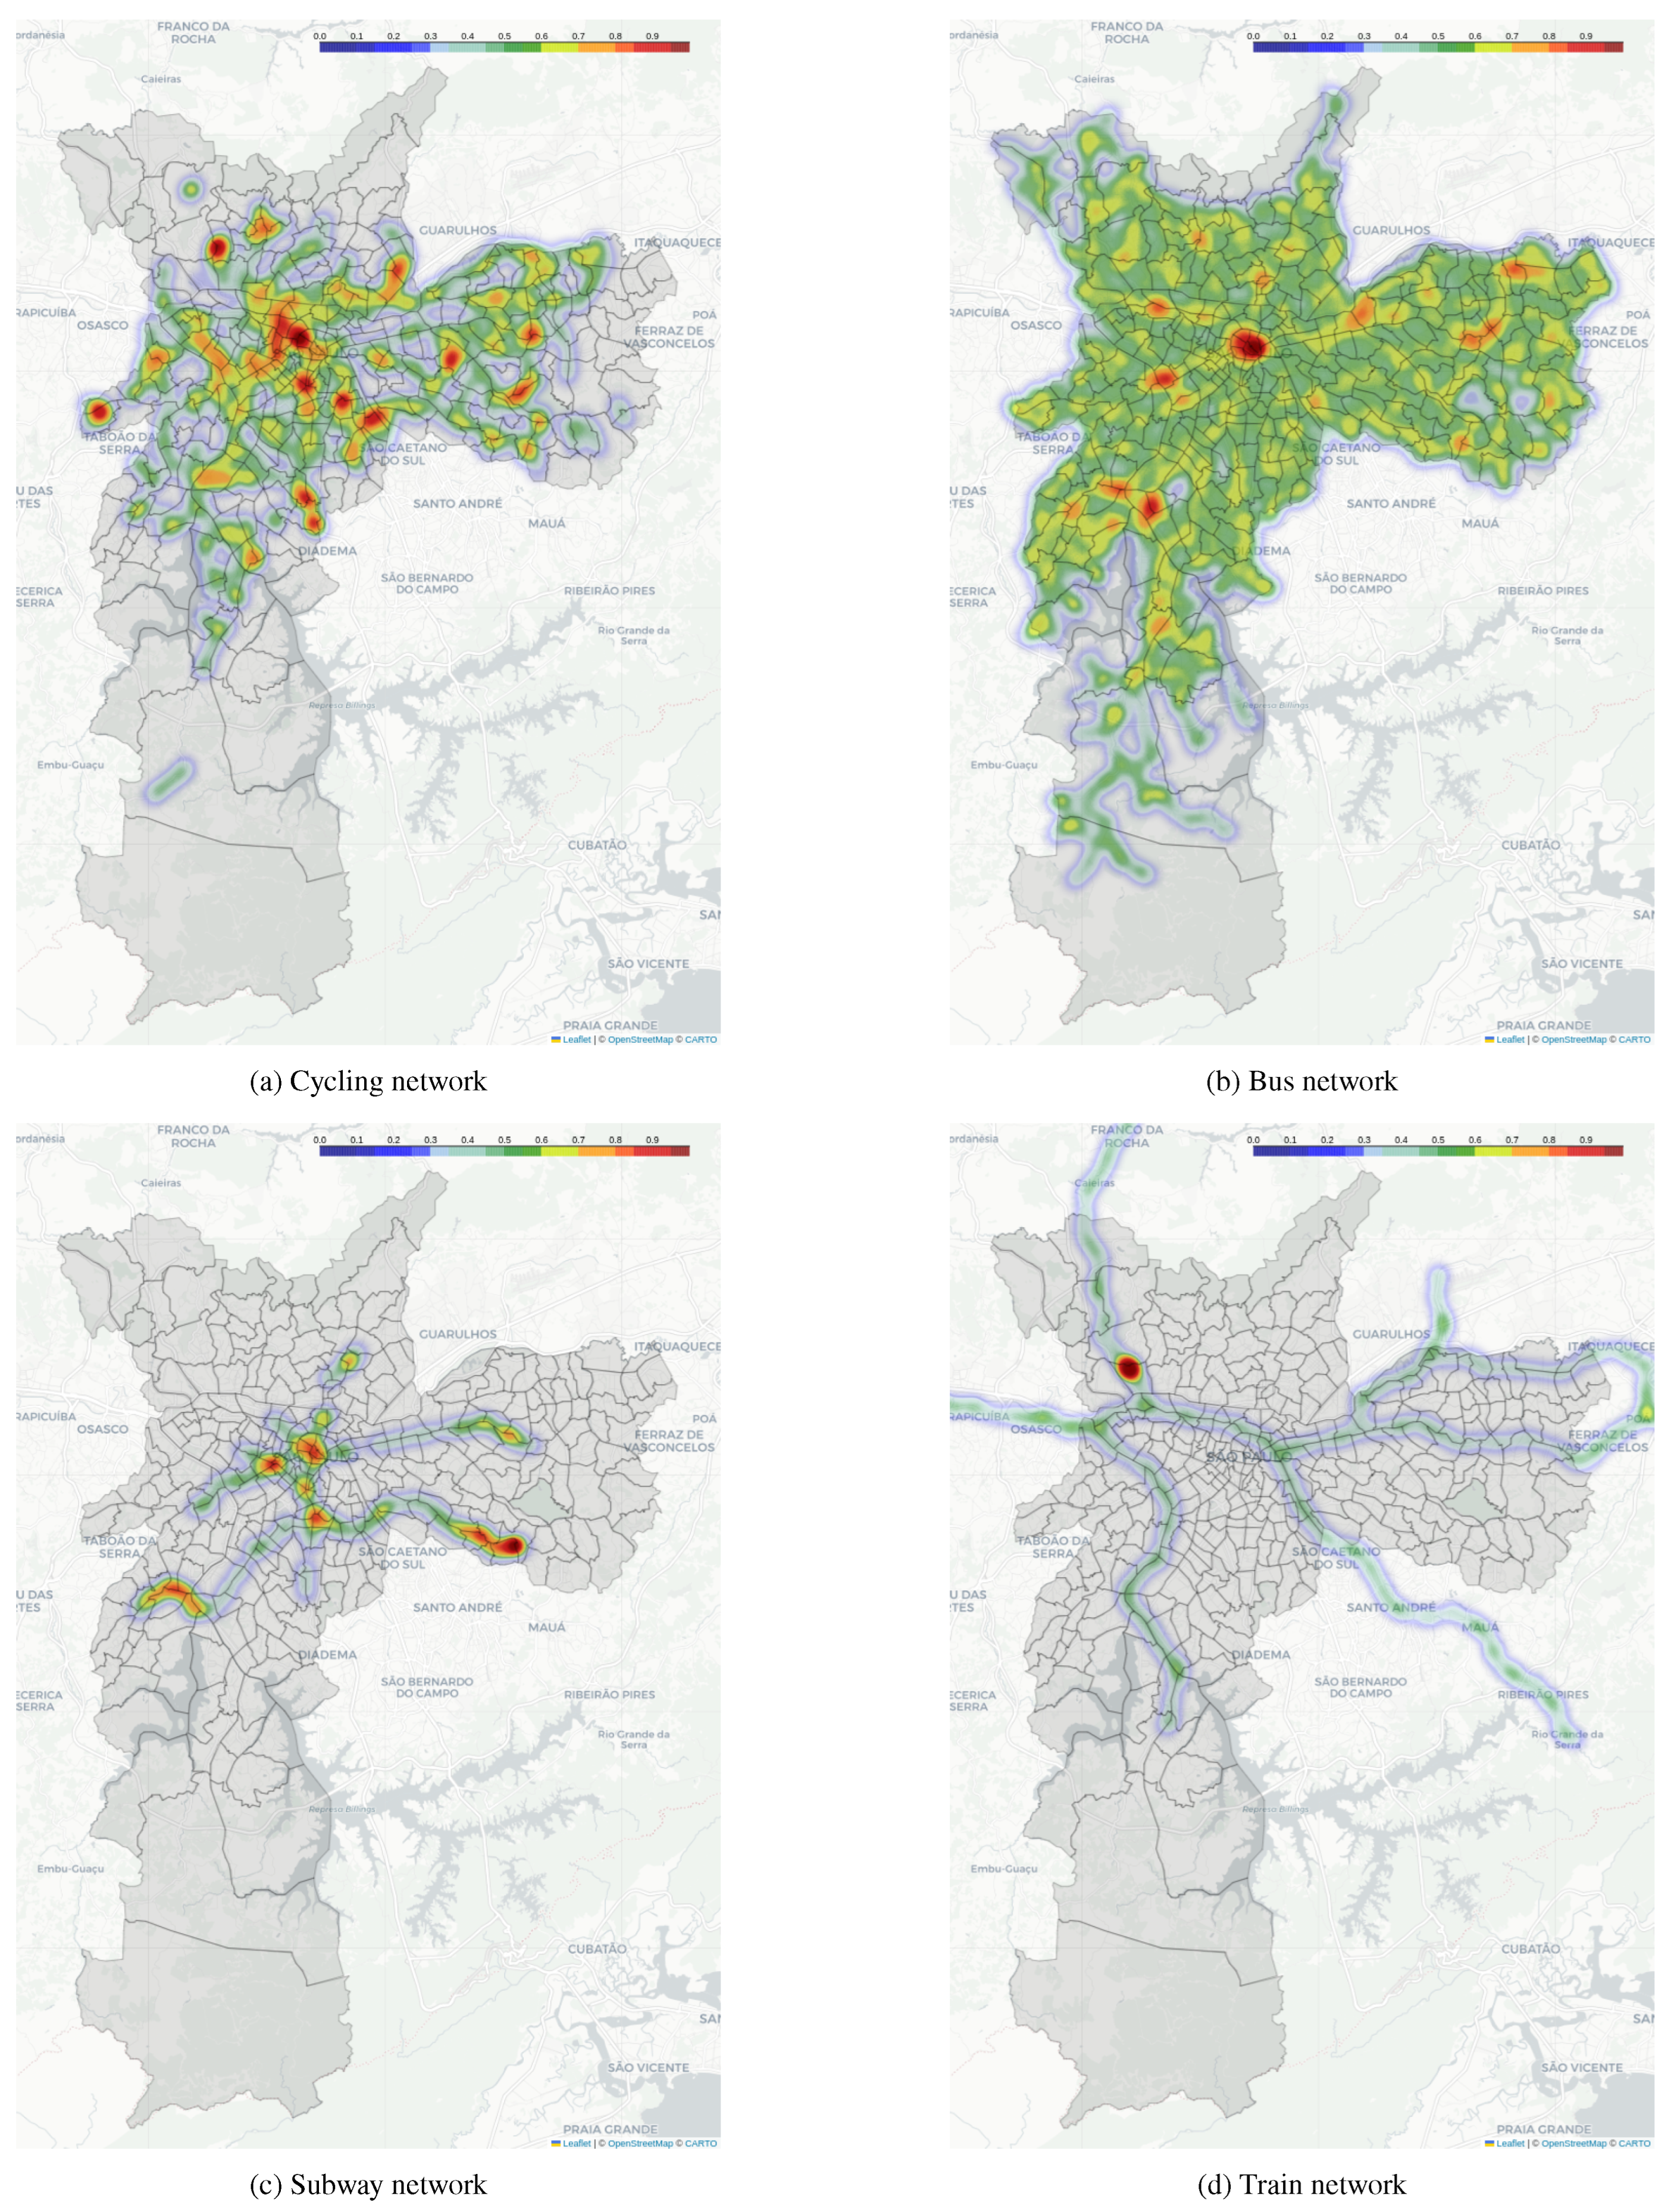
Figure 8.
Screenshots of the user interface of the mobile application for the Bike SP pilot project. The arrows indicate some of the possible navigation paths within the application, but are not exhaustive.
Figure 8.
Screenshots of the user interface of the mobile application for the Bike SP pilot project. The arrows indicate some of the possible navigation paths within the application, but are not exhaustive.
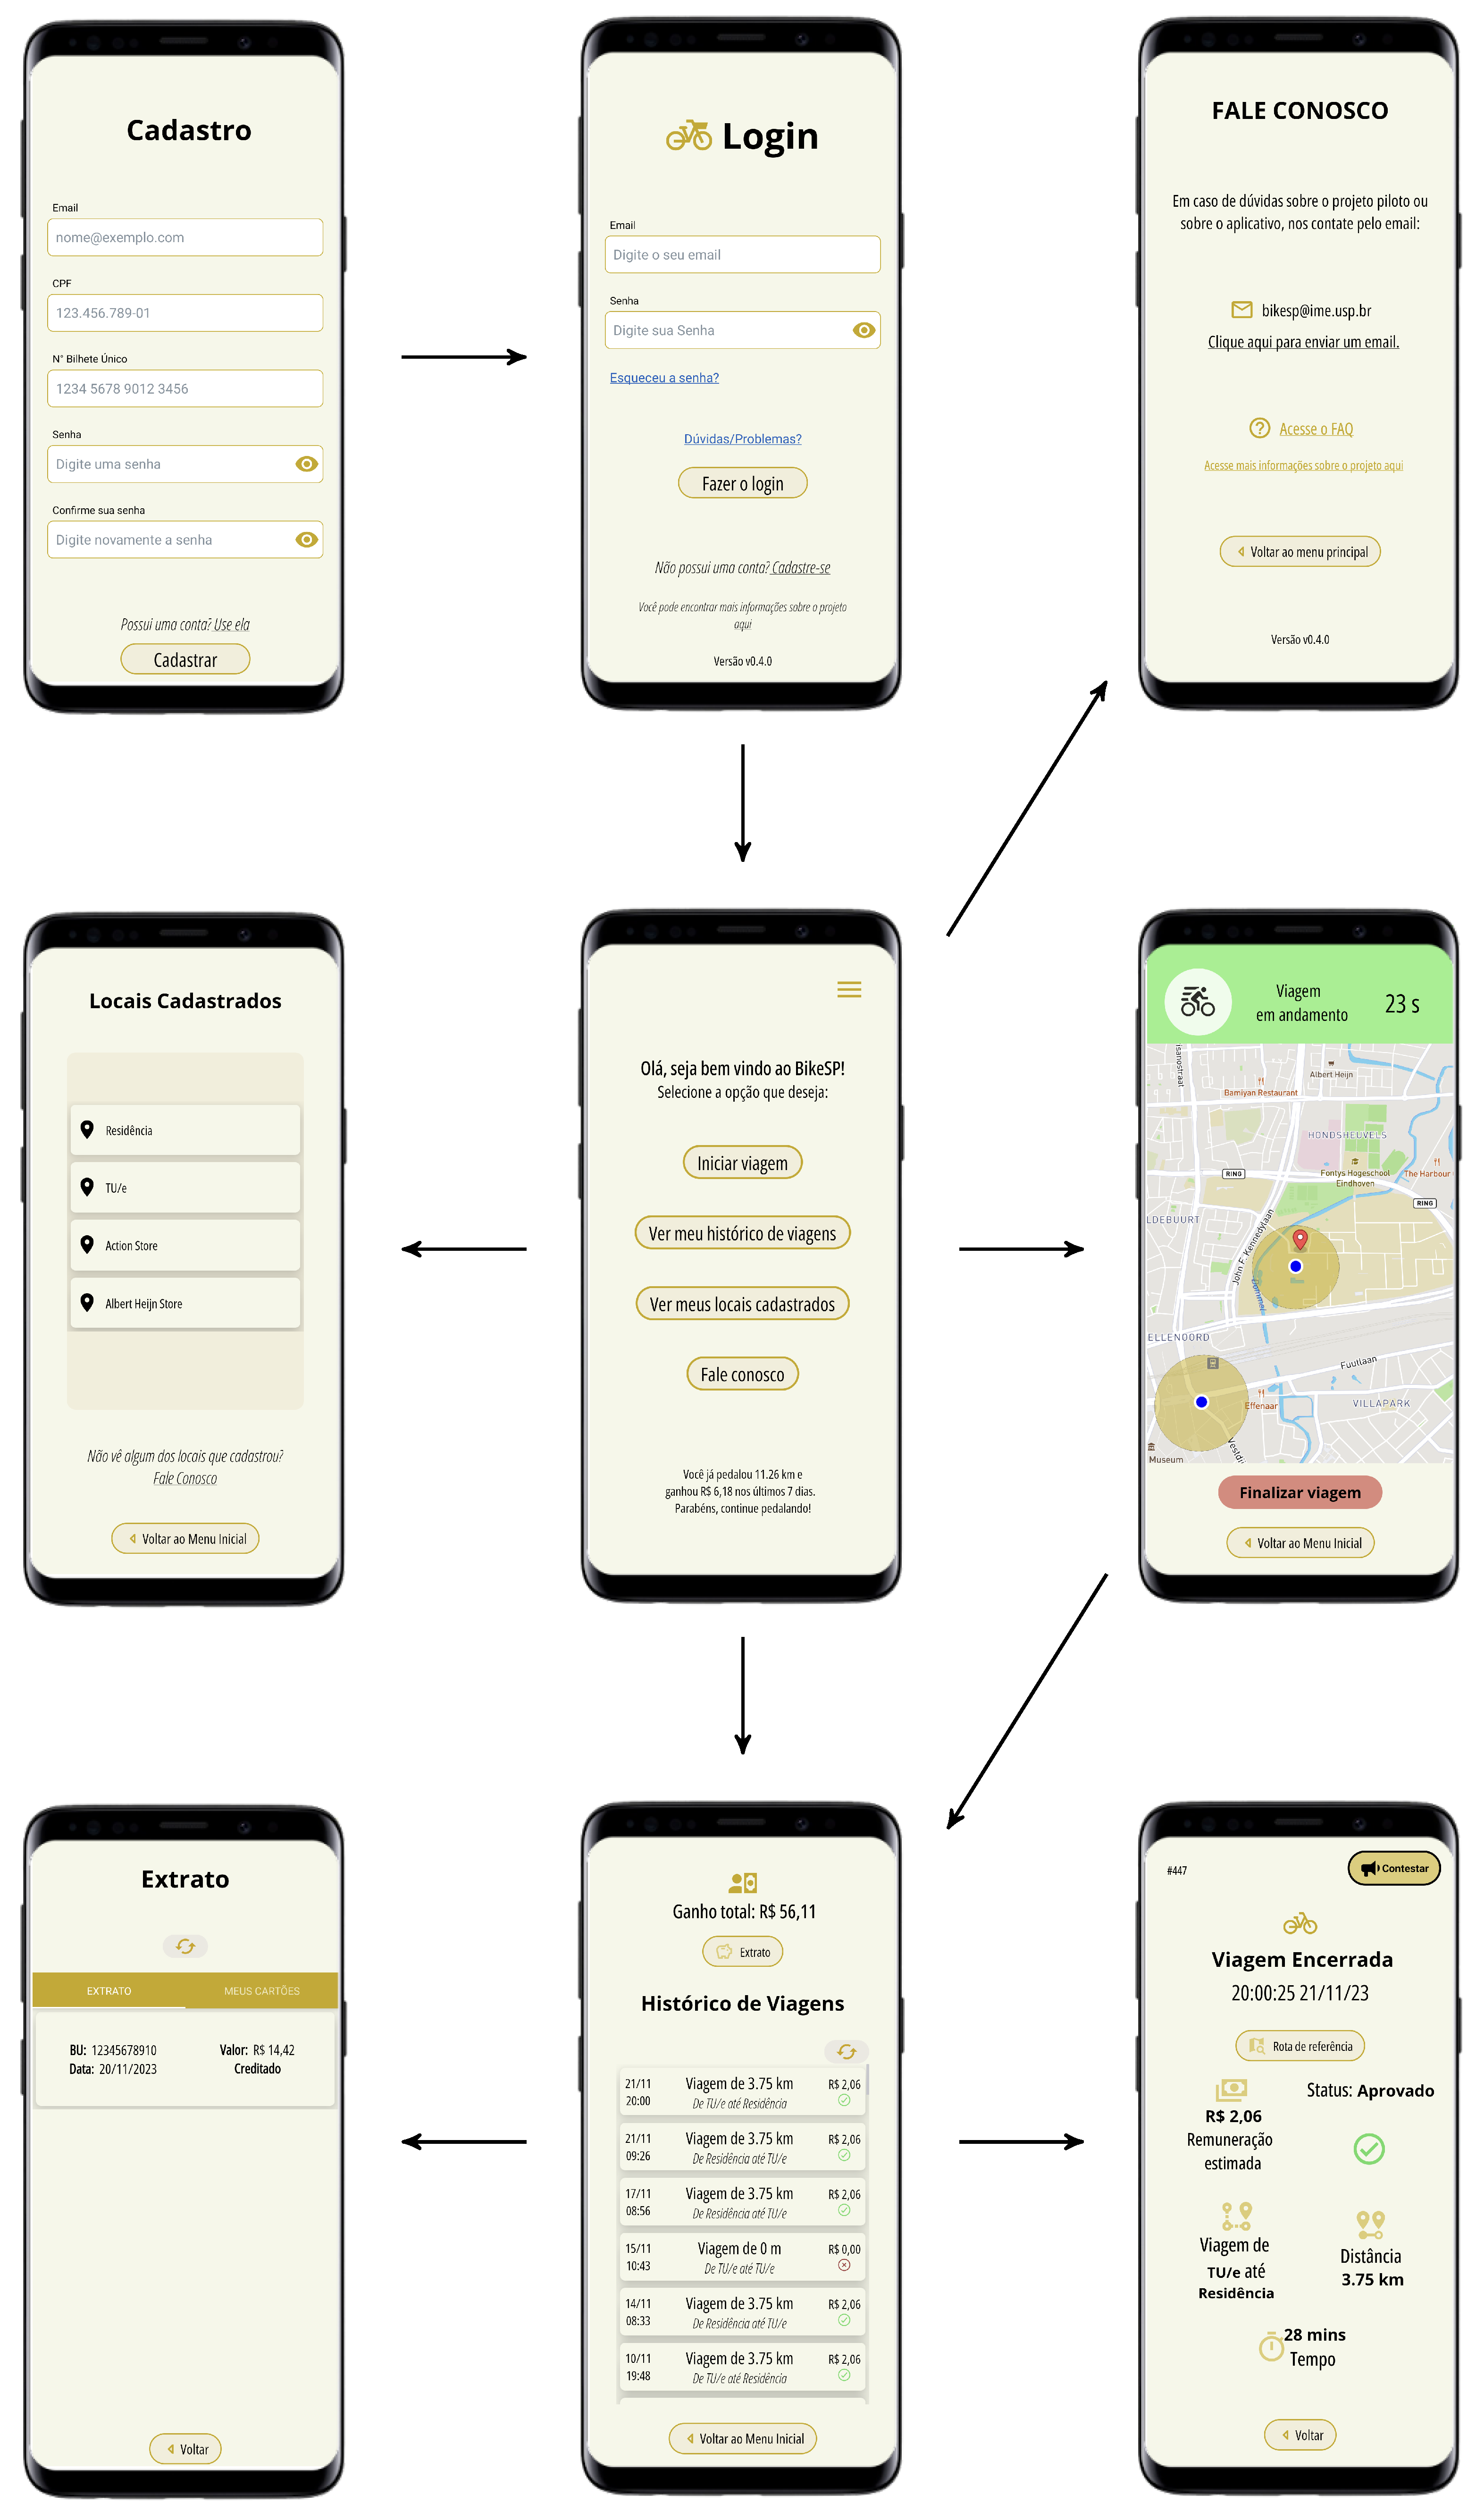

Table 1.
Database columns and corresponding expansion factors utilized in this study for each variable in the analysis of the OD 2017.
Table 1.
Database columns and corresponding expansion factors utilized in this study for each variable in the analysis of the OD 2017.
| Variable | Column considered | Expansion factor |
|---|---|---|
| Mode share | TIPVG | Trip |
| Age | IDADE | Person |
| Social Class | CRITERIOBR | Person |
| Bike ownership | QT_BICICLE | Person |
Table 2.
Main functionalities of the mobile application for the Bike SP’s pilot project, together with their descriptions.
Table 2.
Main functionalities of the mobile application for the Bike SP’s pilot project, together with their descriptions.
| Functionality | Description |
|---|---|
| Registration and login control | The app restricts access to users who have completed the registration process and were selected. |
| Storage of routes | The app stores the sequence of geographic coordinates that correspond to the user’s trajectory and the timestamp associated with each coordinate. |
| Validation of bike trips | The app verifies whether a trip recorded by a user was actually performed using a bicycle as the mode of transportation. |
| Validation of origin and destination | The app checks whether the user’s trip started and ended at the locations of origin and destination predefined by the user during the registration process. |
| Remuneration control | The app calculates and stores the amount of credits earned by the user for a specific trip based on the experimental group he belongs to. |
| Contestation interface | The app provides an interface for users to contest rejected trips after the validation step. Besides, it enables developers to review contested trips and decide whether to approve them or not. |
| Travel history | The app displays the user’s current balance and the log of all trips registered in the app. |
| Travel monitoring | The app shows the user the progress of their trips in the app. |
| Qualitative surveys | The app displays the progress of the qualitative surveys completed by the user during the pilot. |
Disclaimer/Publisher’s Note: The statements, opinions and data contained in all publications are solely those of the individual author(s) and contributor(s) and not of MDPI and/or the editor(s). MDPI and/or the editor(s) disclaim responsibility for any injury to people or property resulting from any ideas, methods, instructions or products referred to in the content. |
© 2025 by the authors. Licensee MDPI, Basel, Switzerland. This article is an open access article distributed under the terms and conditions of the Creative Commons Attribution (CC BY) license (http://creativecommons.org/licenses/by/4.0/).
Copyright: This open access article is published under a Creative Commons CC BY 4.0 license, which permit the free download, distribution, and reuse, provided that the author and preprint are cited in any reuse.


