Submitted:
08 March 2025
Posted:
10 March 2025
You are already at the latest version
Abstract
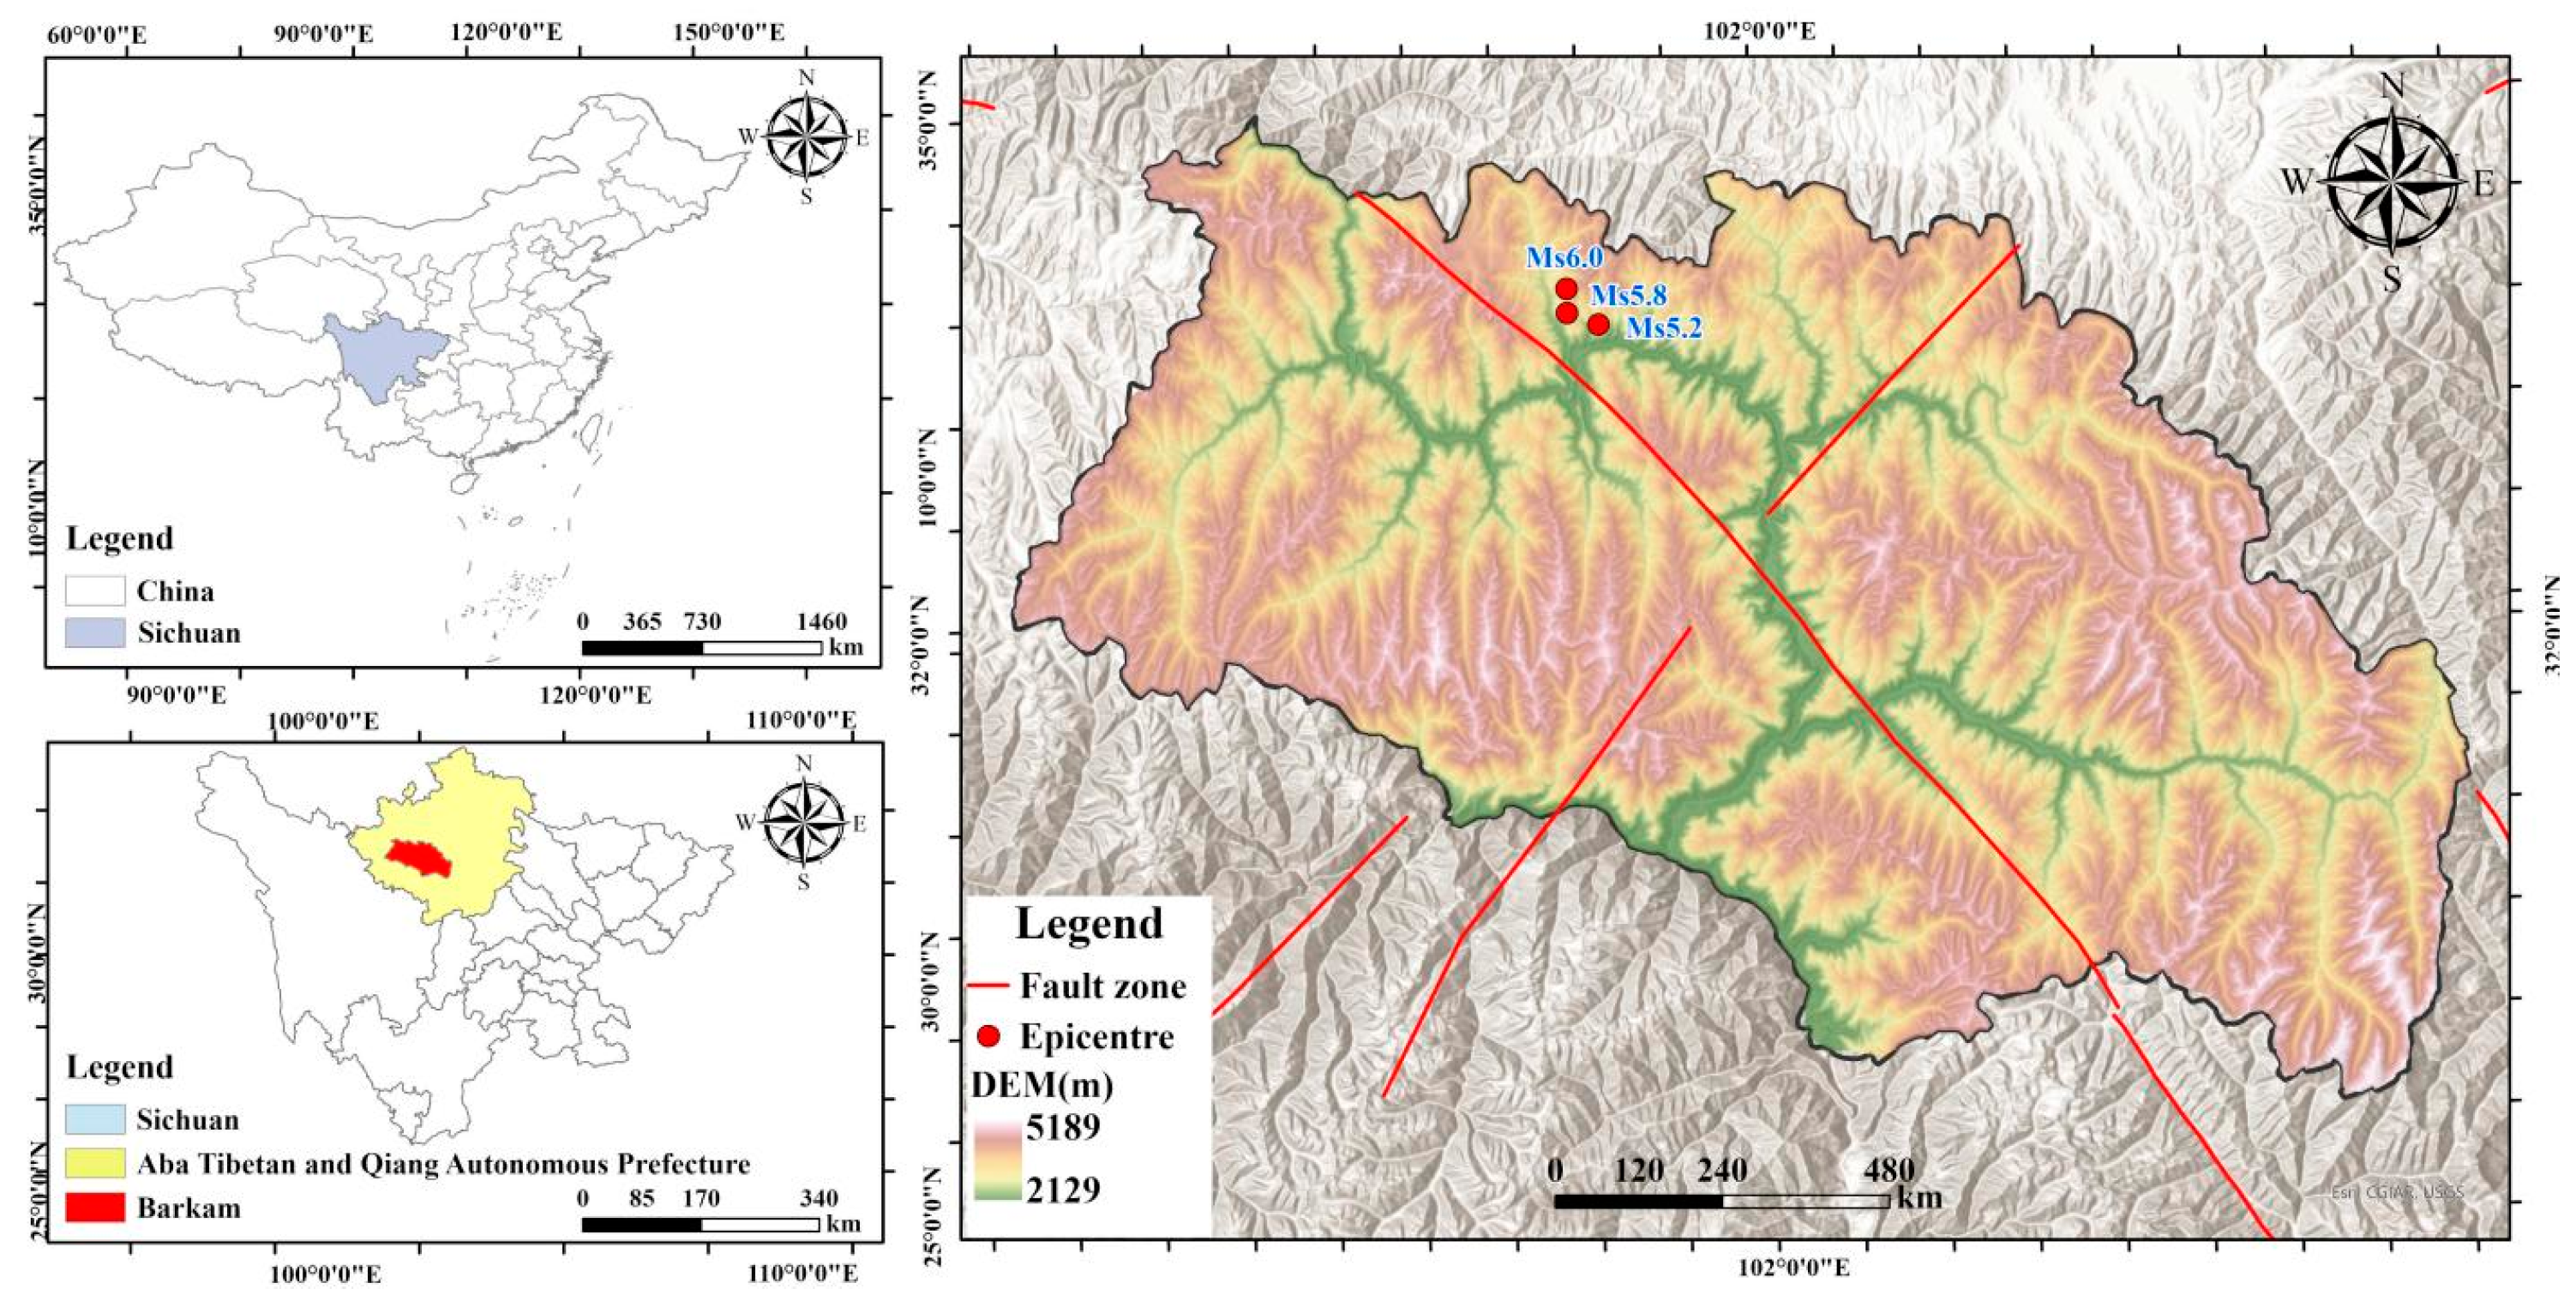
This study focuses on the landslide susceptibility assessment in Maerkang City, Sichuan Province. Twelve evaluation factors, including terrain relief and slope, were selected for analysis. The study employs the Information Value-Analytic Hierarchy Process (IV-AHP), Random Forest (RF), Extreme Gradient Boosting (XGBoost), as well as hybrid models IV-RF and IV-XGBoost to evaluate landslide susceptibility and explore the differences between traditional methods, machine learning models, and hybrid models. The findings indicate that traditional statistical analysis models exhibit relatively low prediction accuracy. While machine learning models (RF and XGBoost) improve accuracy, they suffer from overfitting and poor interpretability. To address these issues, this study adopts hybrid models that integrate the strengths of both traditional statistical methods and machine learning approaches, demonstrating superior accuracy in landslide susceptibility assessment. Based on field survey data and multiple model predictions, it was observed that in high-altitude areas of western Sichuan Province, landslides tend to exhibit a certain degree of concealment, making them difficult to detect during data collection. This leads to discrepancies between sample data and actual conditions, thereby affecting the accuracy of prediction results. The findings provide a reliable scientific basis for landslide disaster prevention and management, while also highlighting future research directions, including the application of hybrid models, the enrichment of sample data, and the analysis of the applicability of different assessment methods.
Keywords:
0. Introductory
1. Overview of the Study Area
2. Data and Methods
2.1. Data
2.2. Research Methods
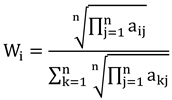
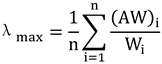
2.2.1. Information Value-Analytic Hierarchy Process (IV-AHP)
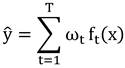
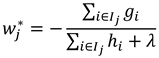
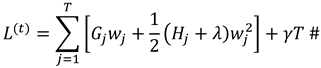
2.2.2. Extreme Gradient Boosting (XGBoost)
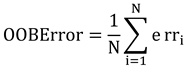
2.2.3. Random Forest (RF)
2.2.4. IV-XGBoost and IV-RF Coupling Models
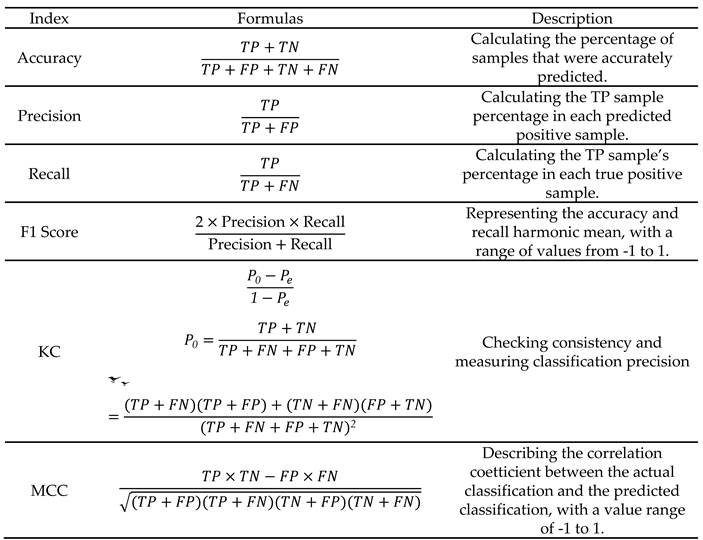
2.2.5. Model Accuracy Evaluation
2.2.6. Comprehensive Comparative Analysis
3. Results and Analysis
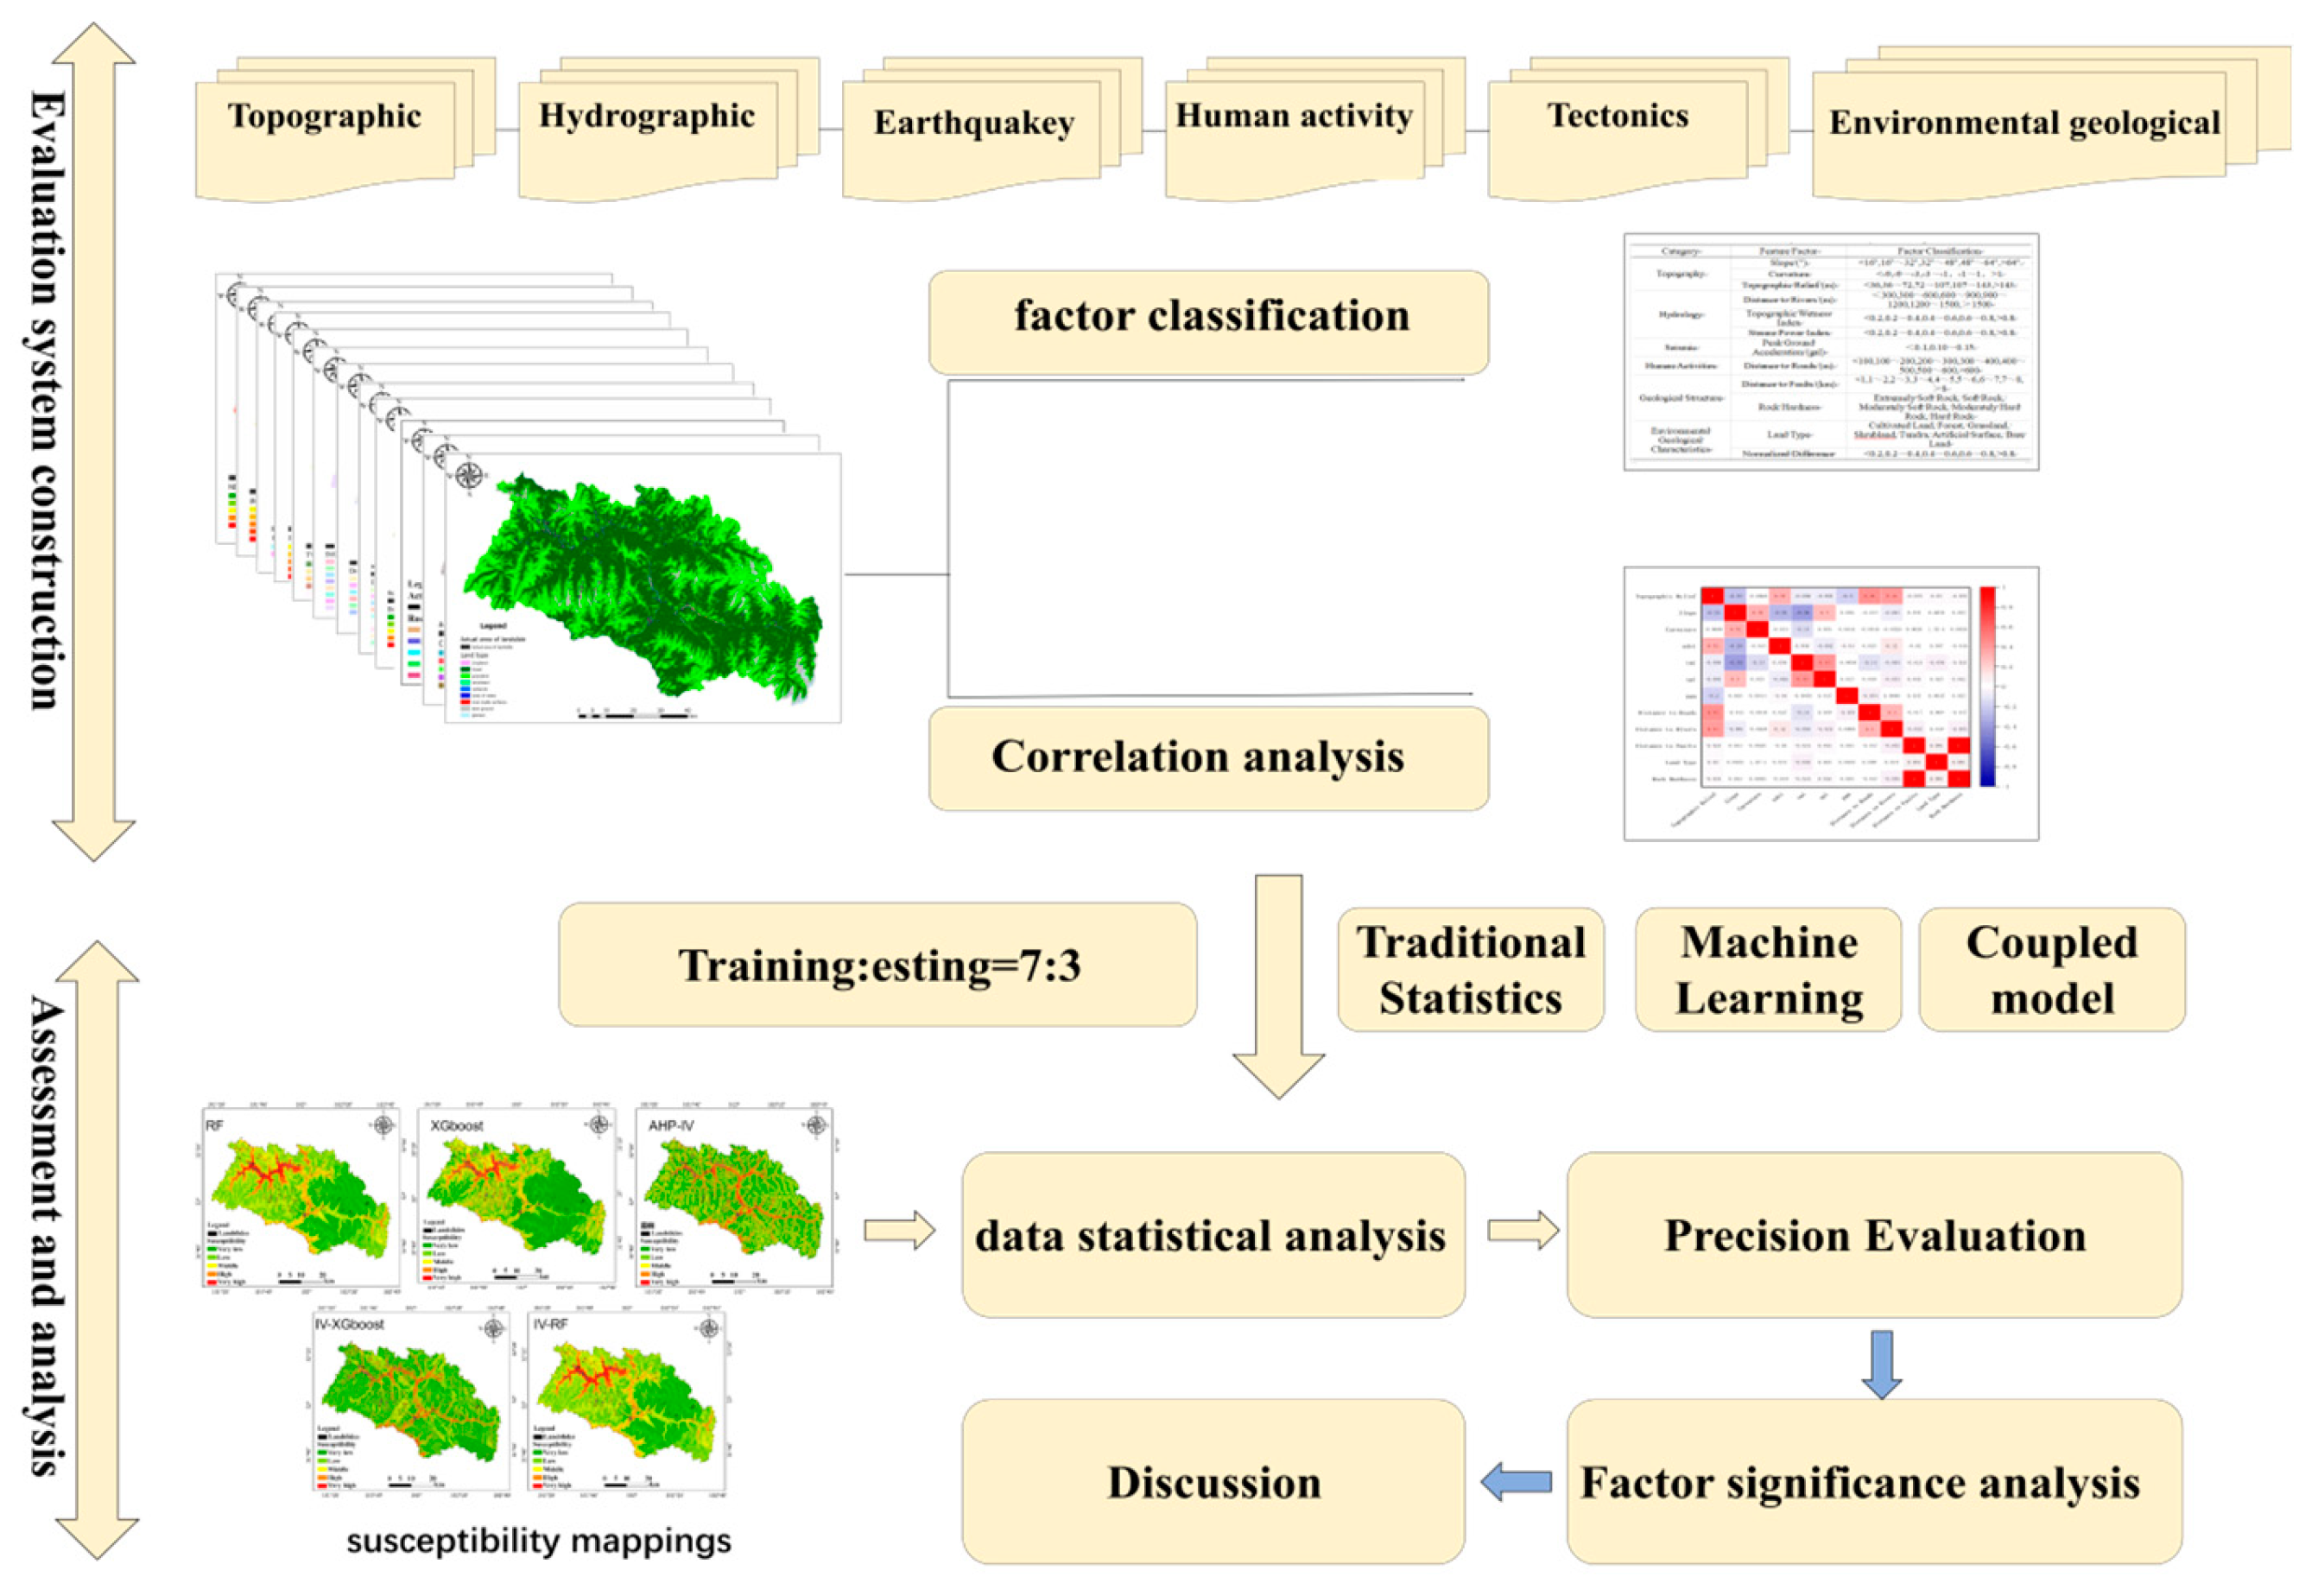
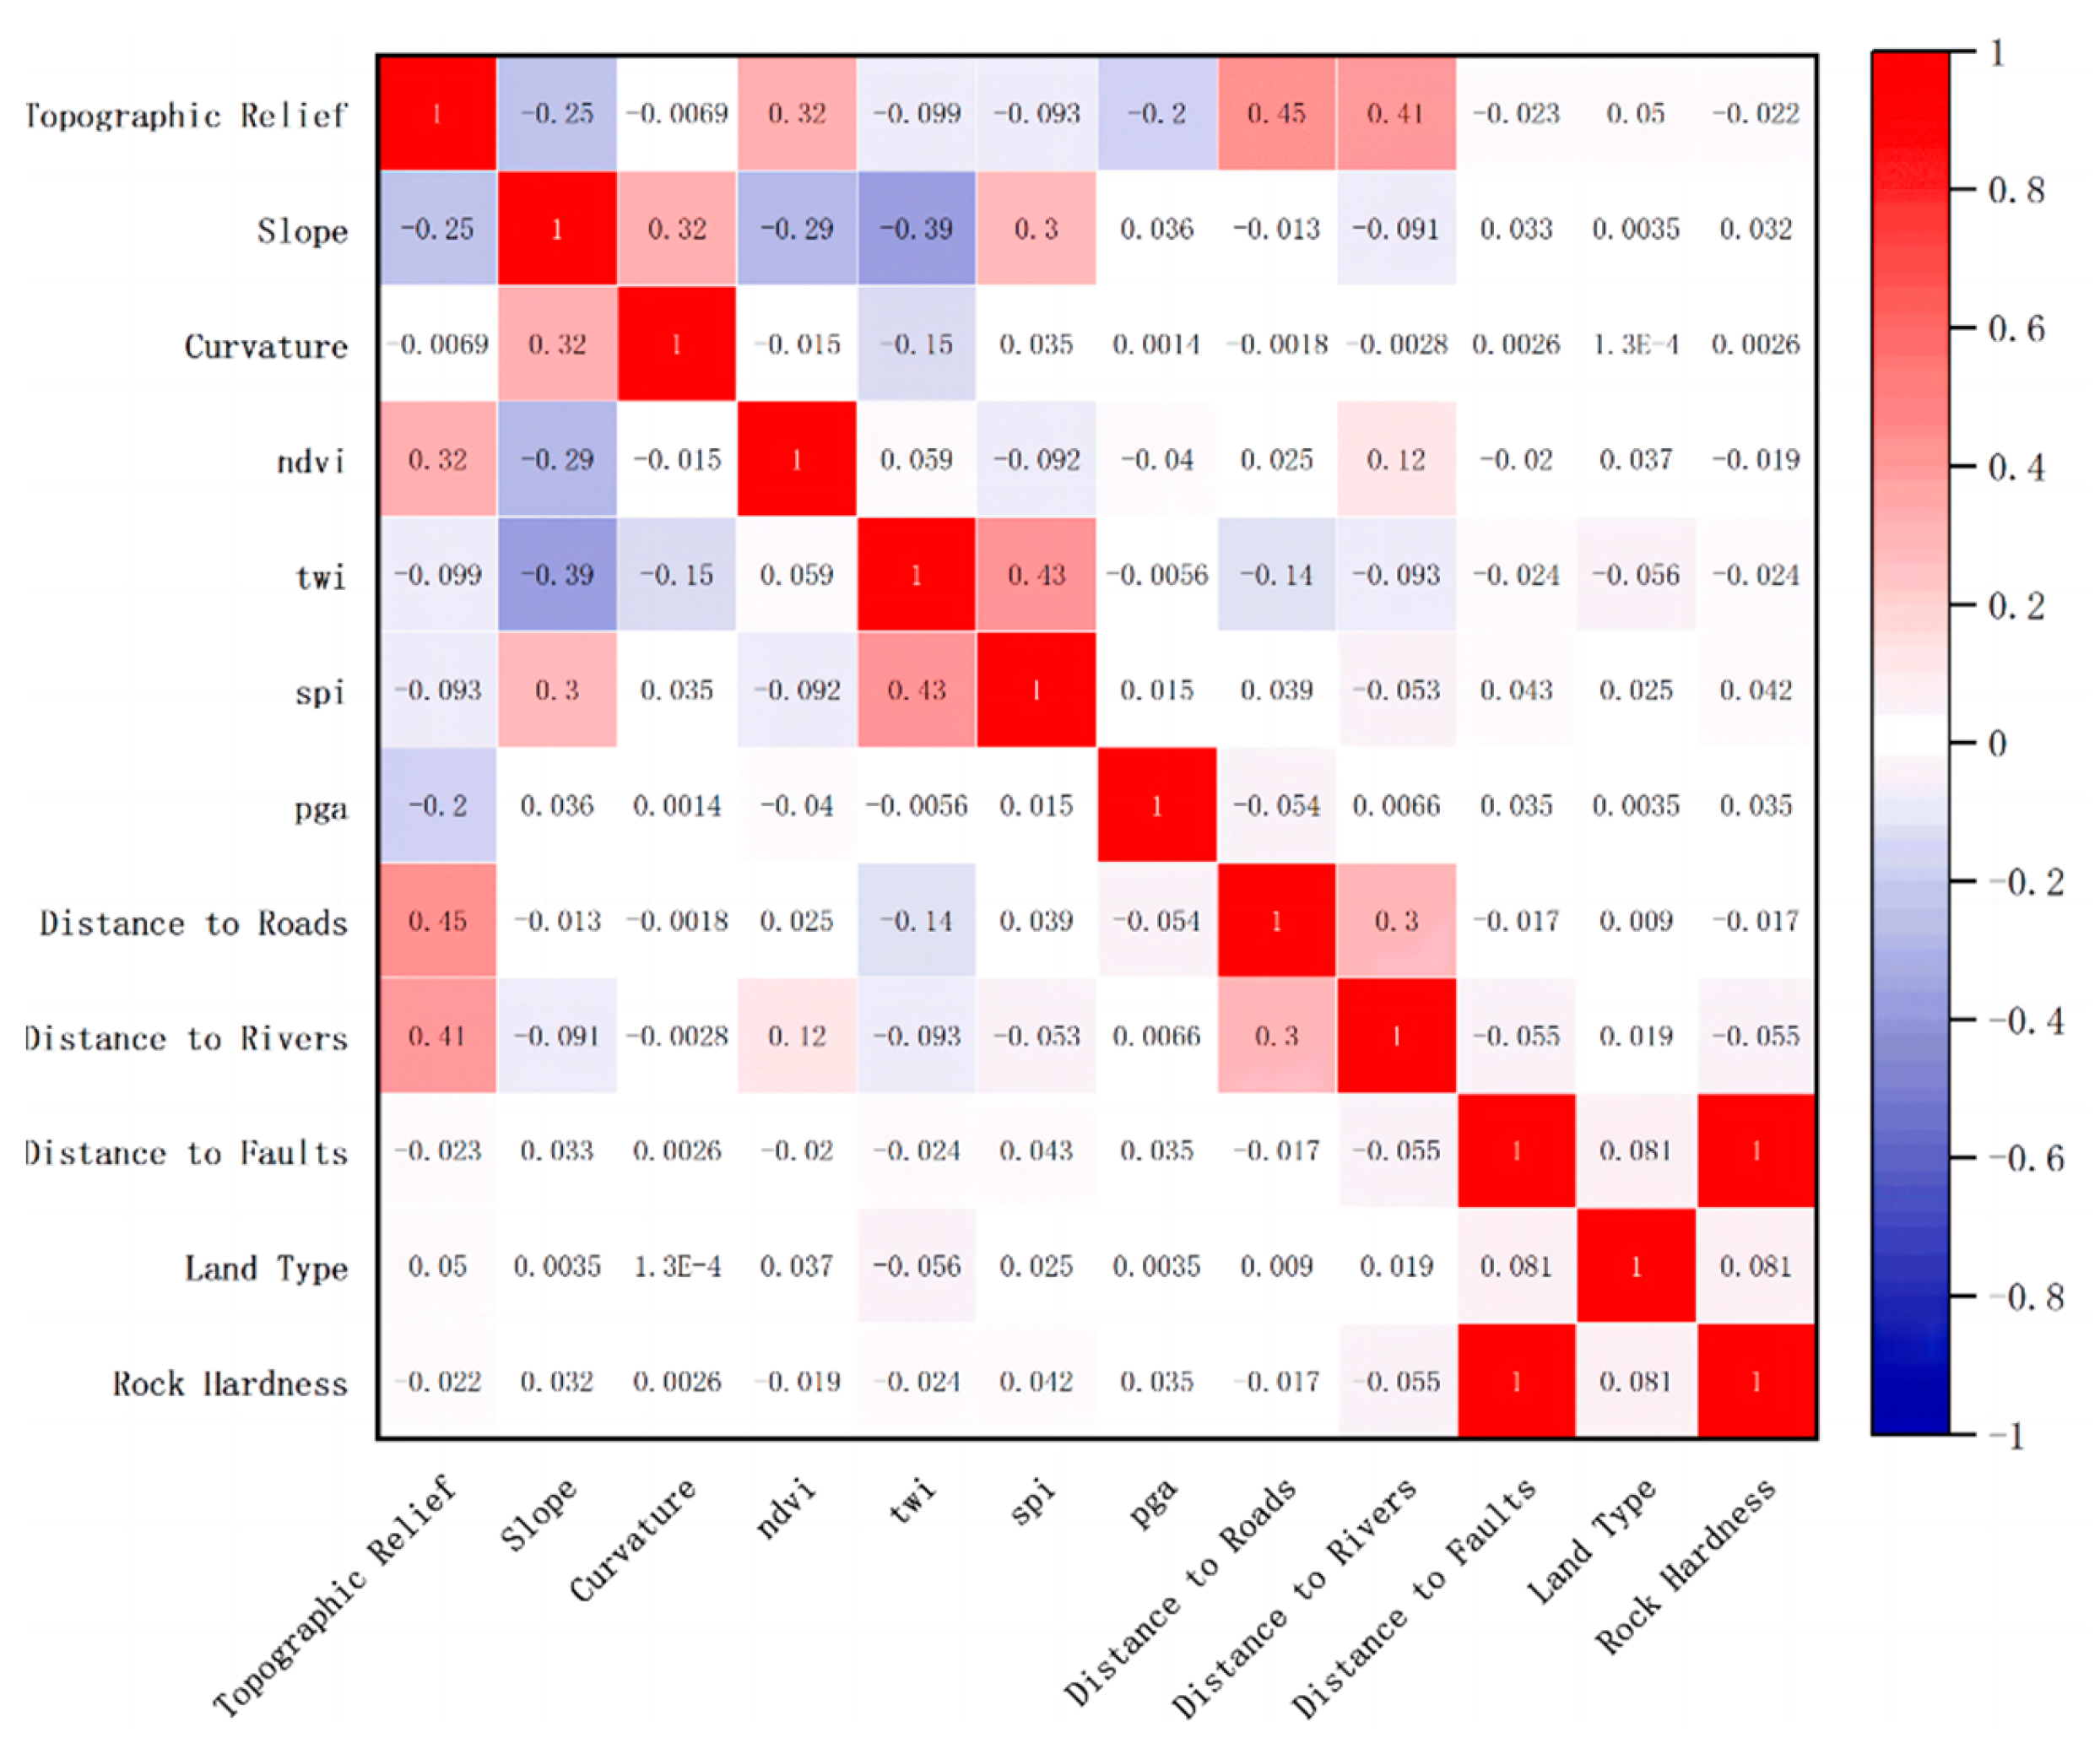
3.1. Selection and Construction of the Indicator System
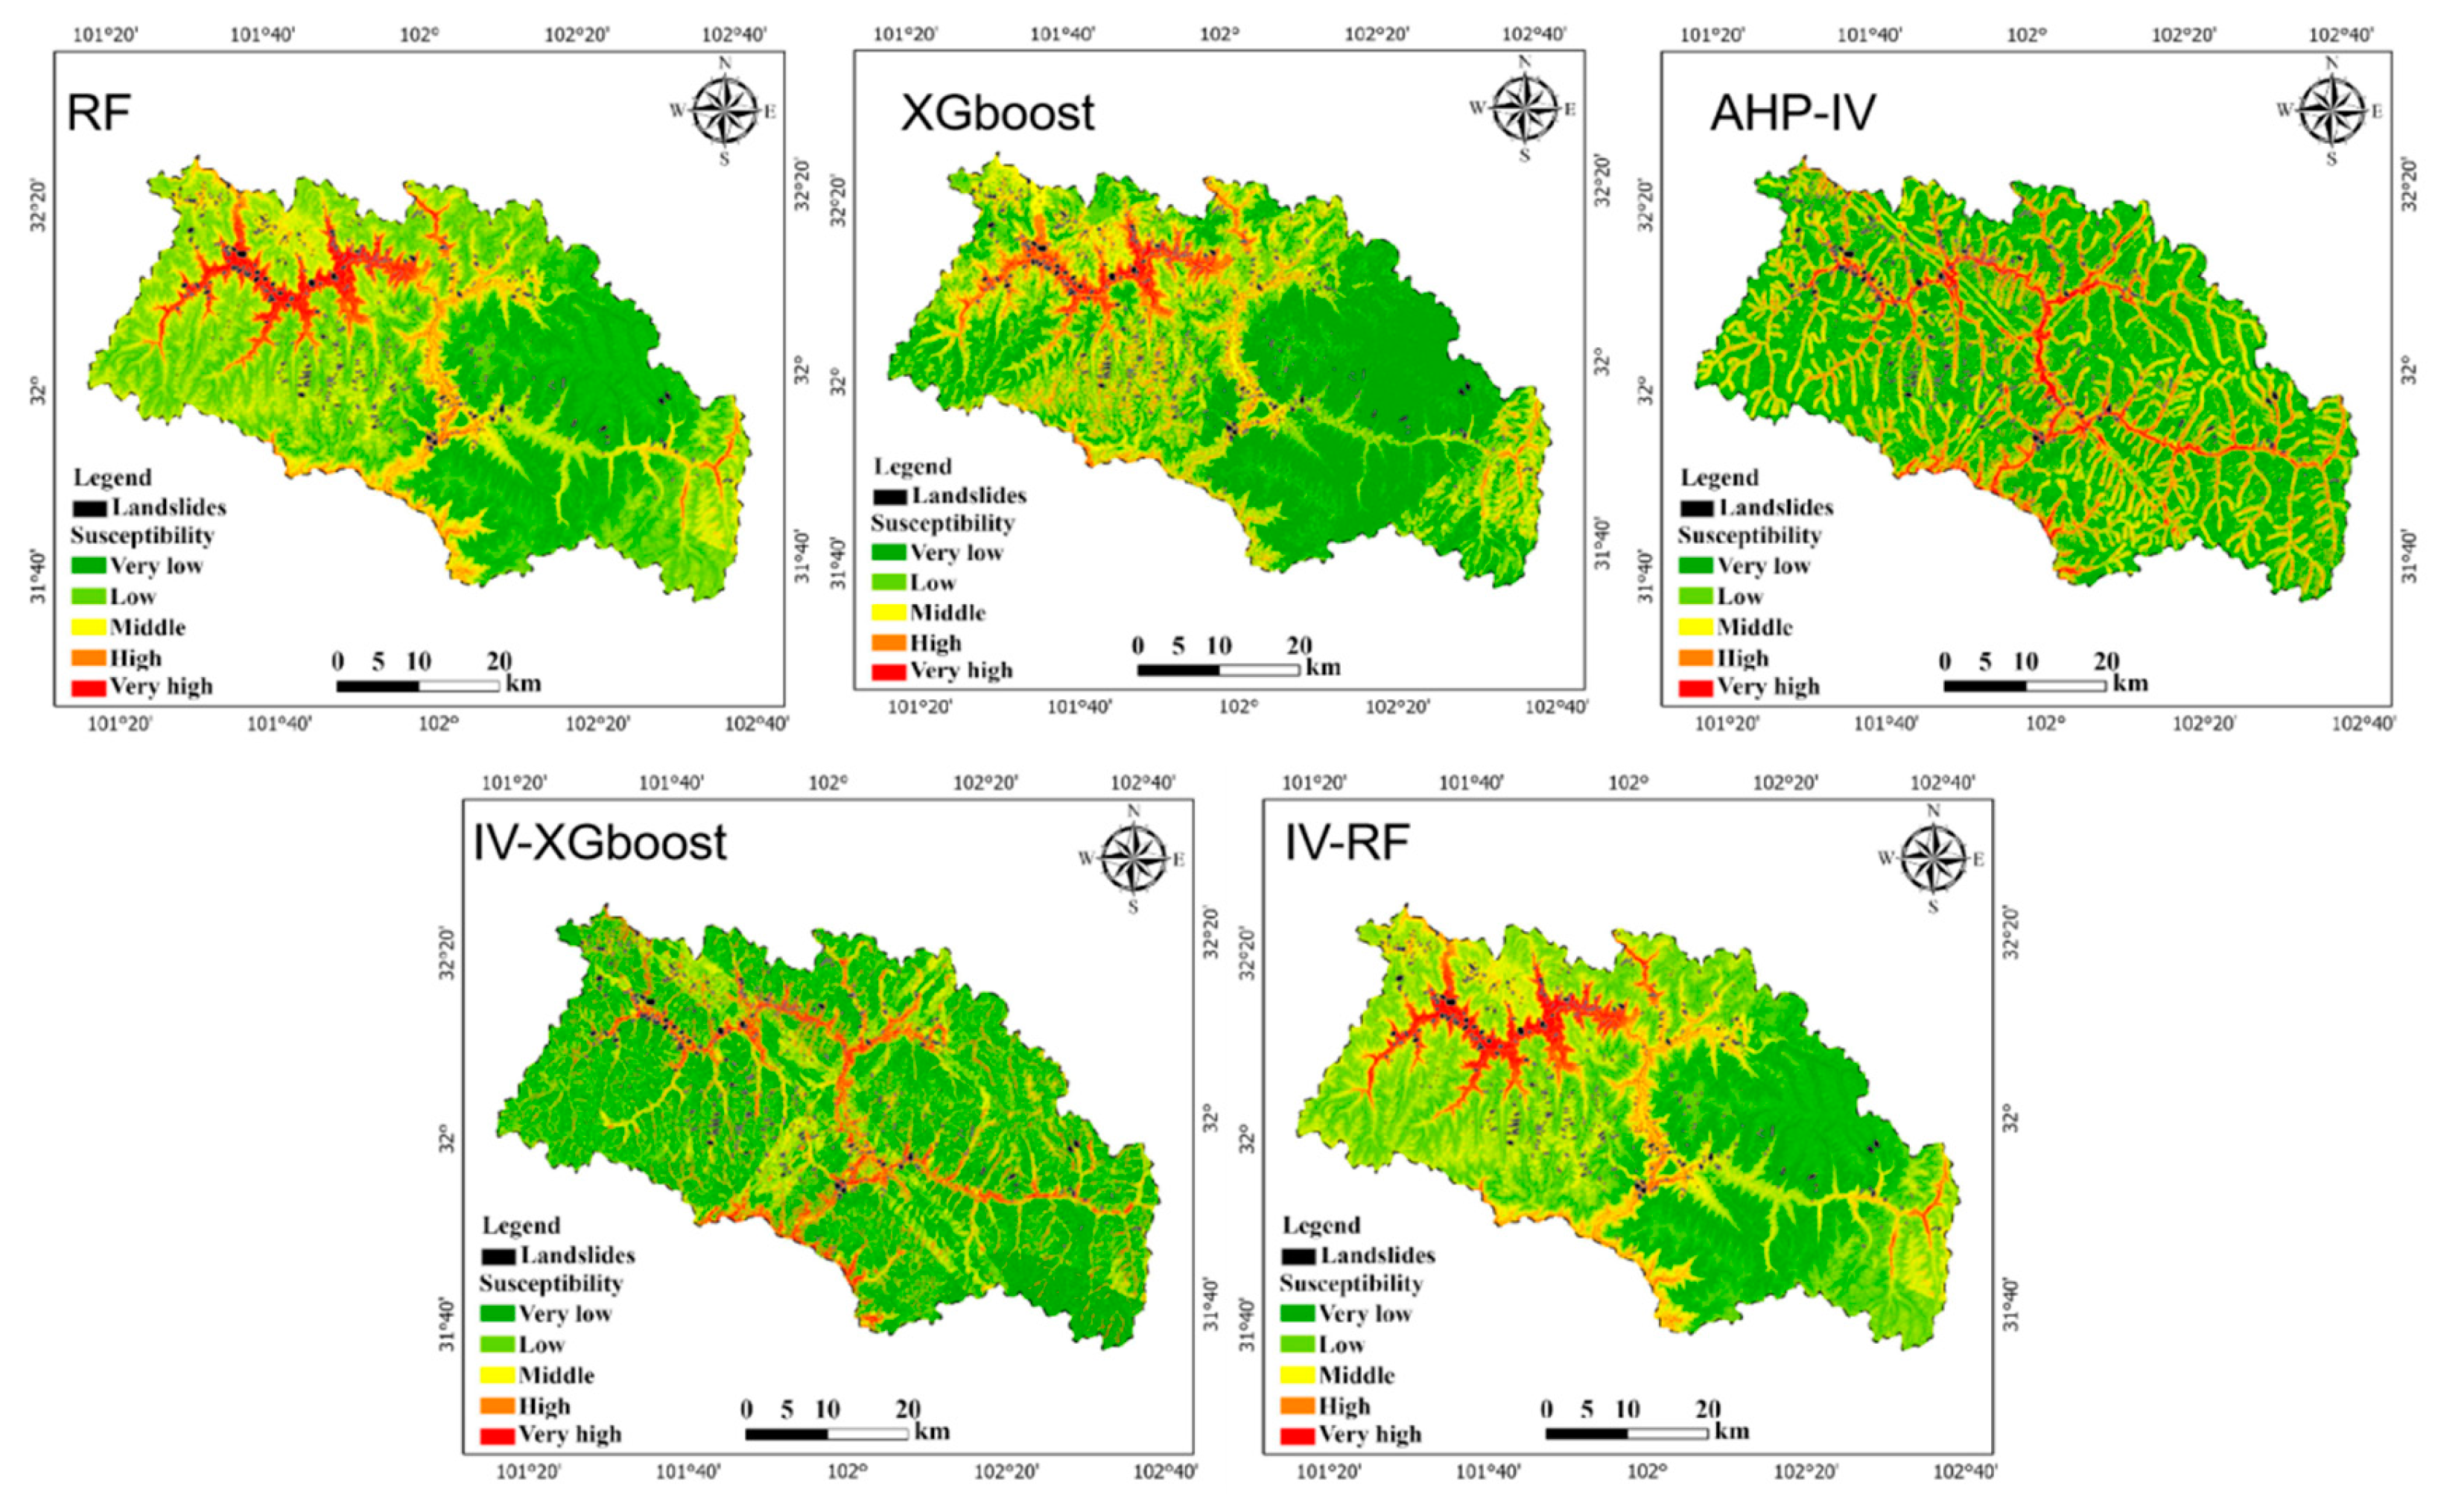
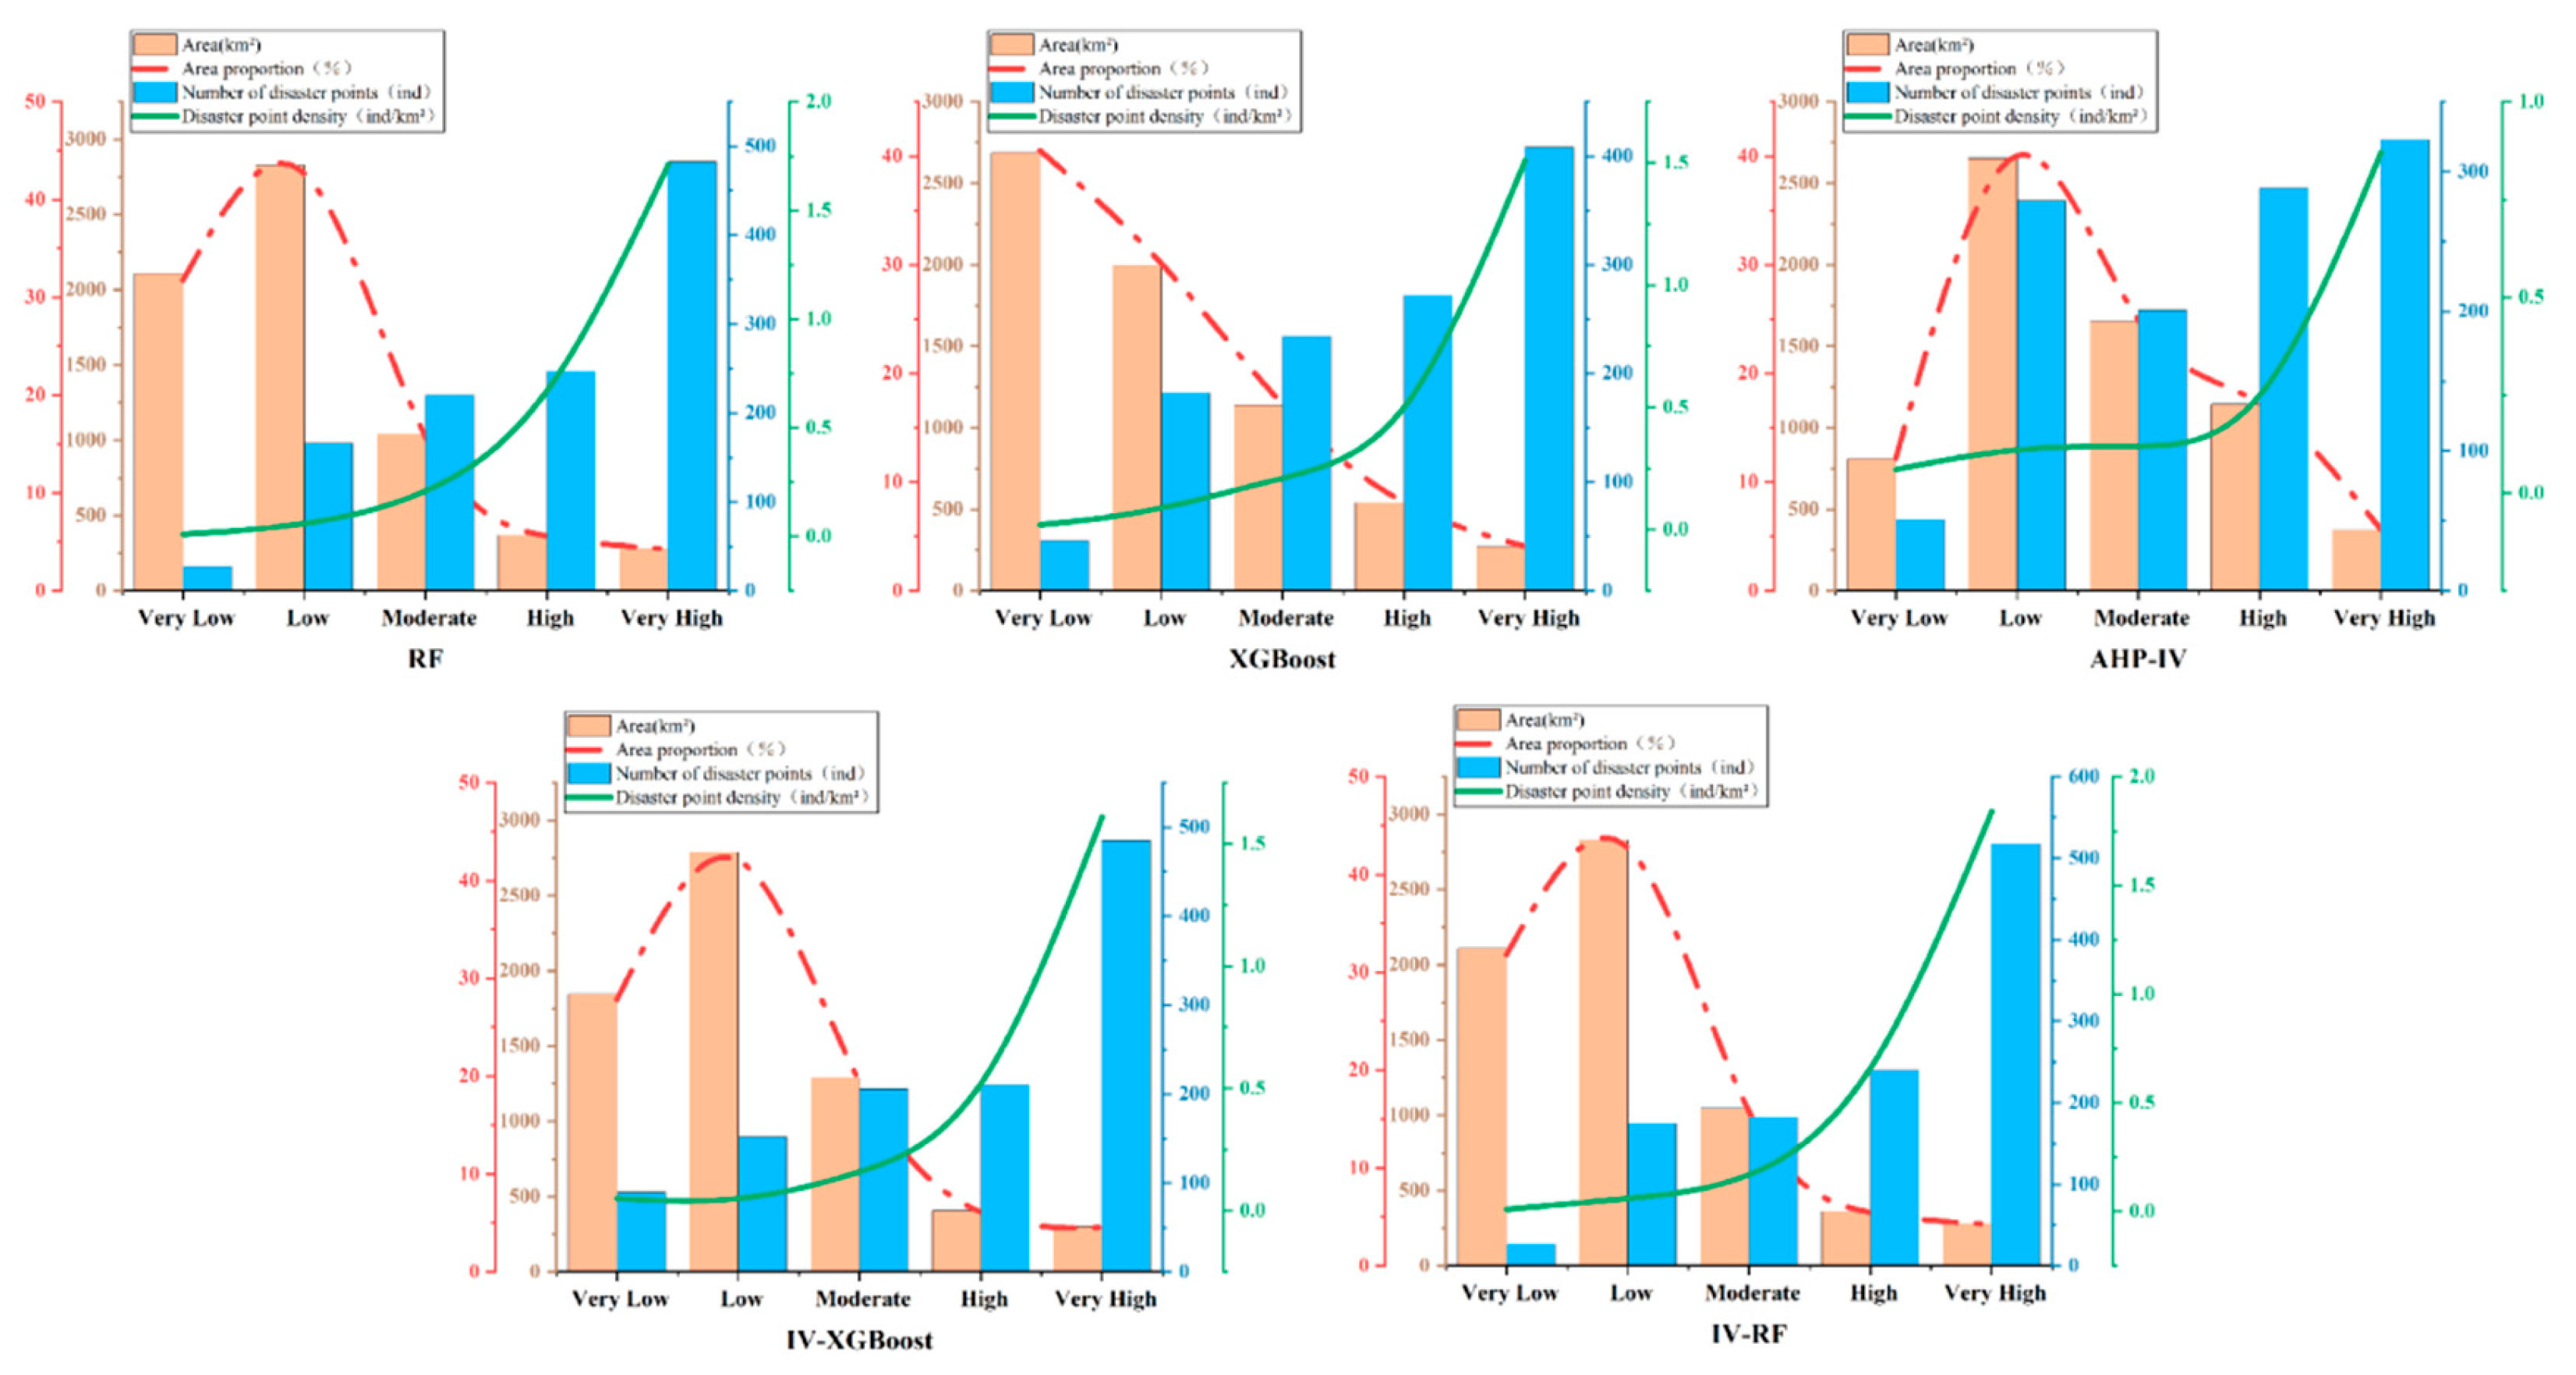
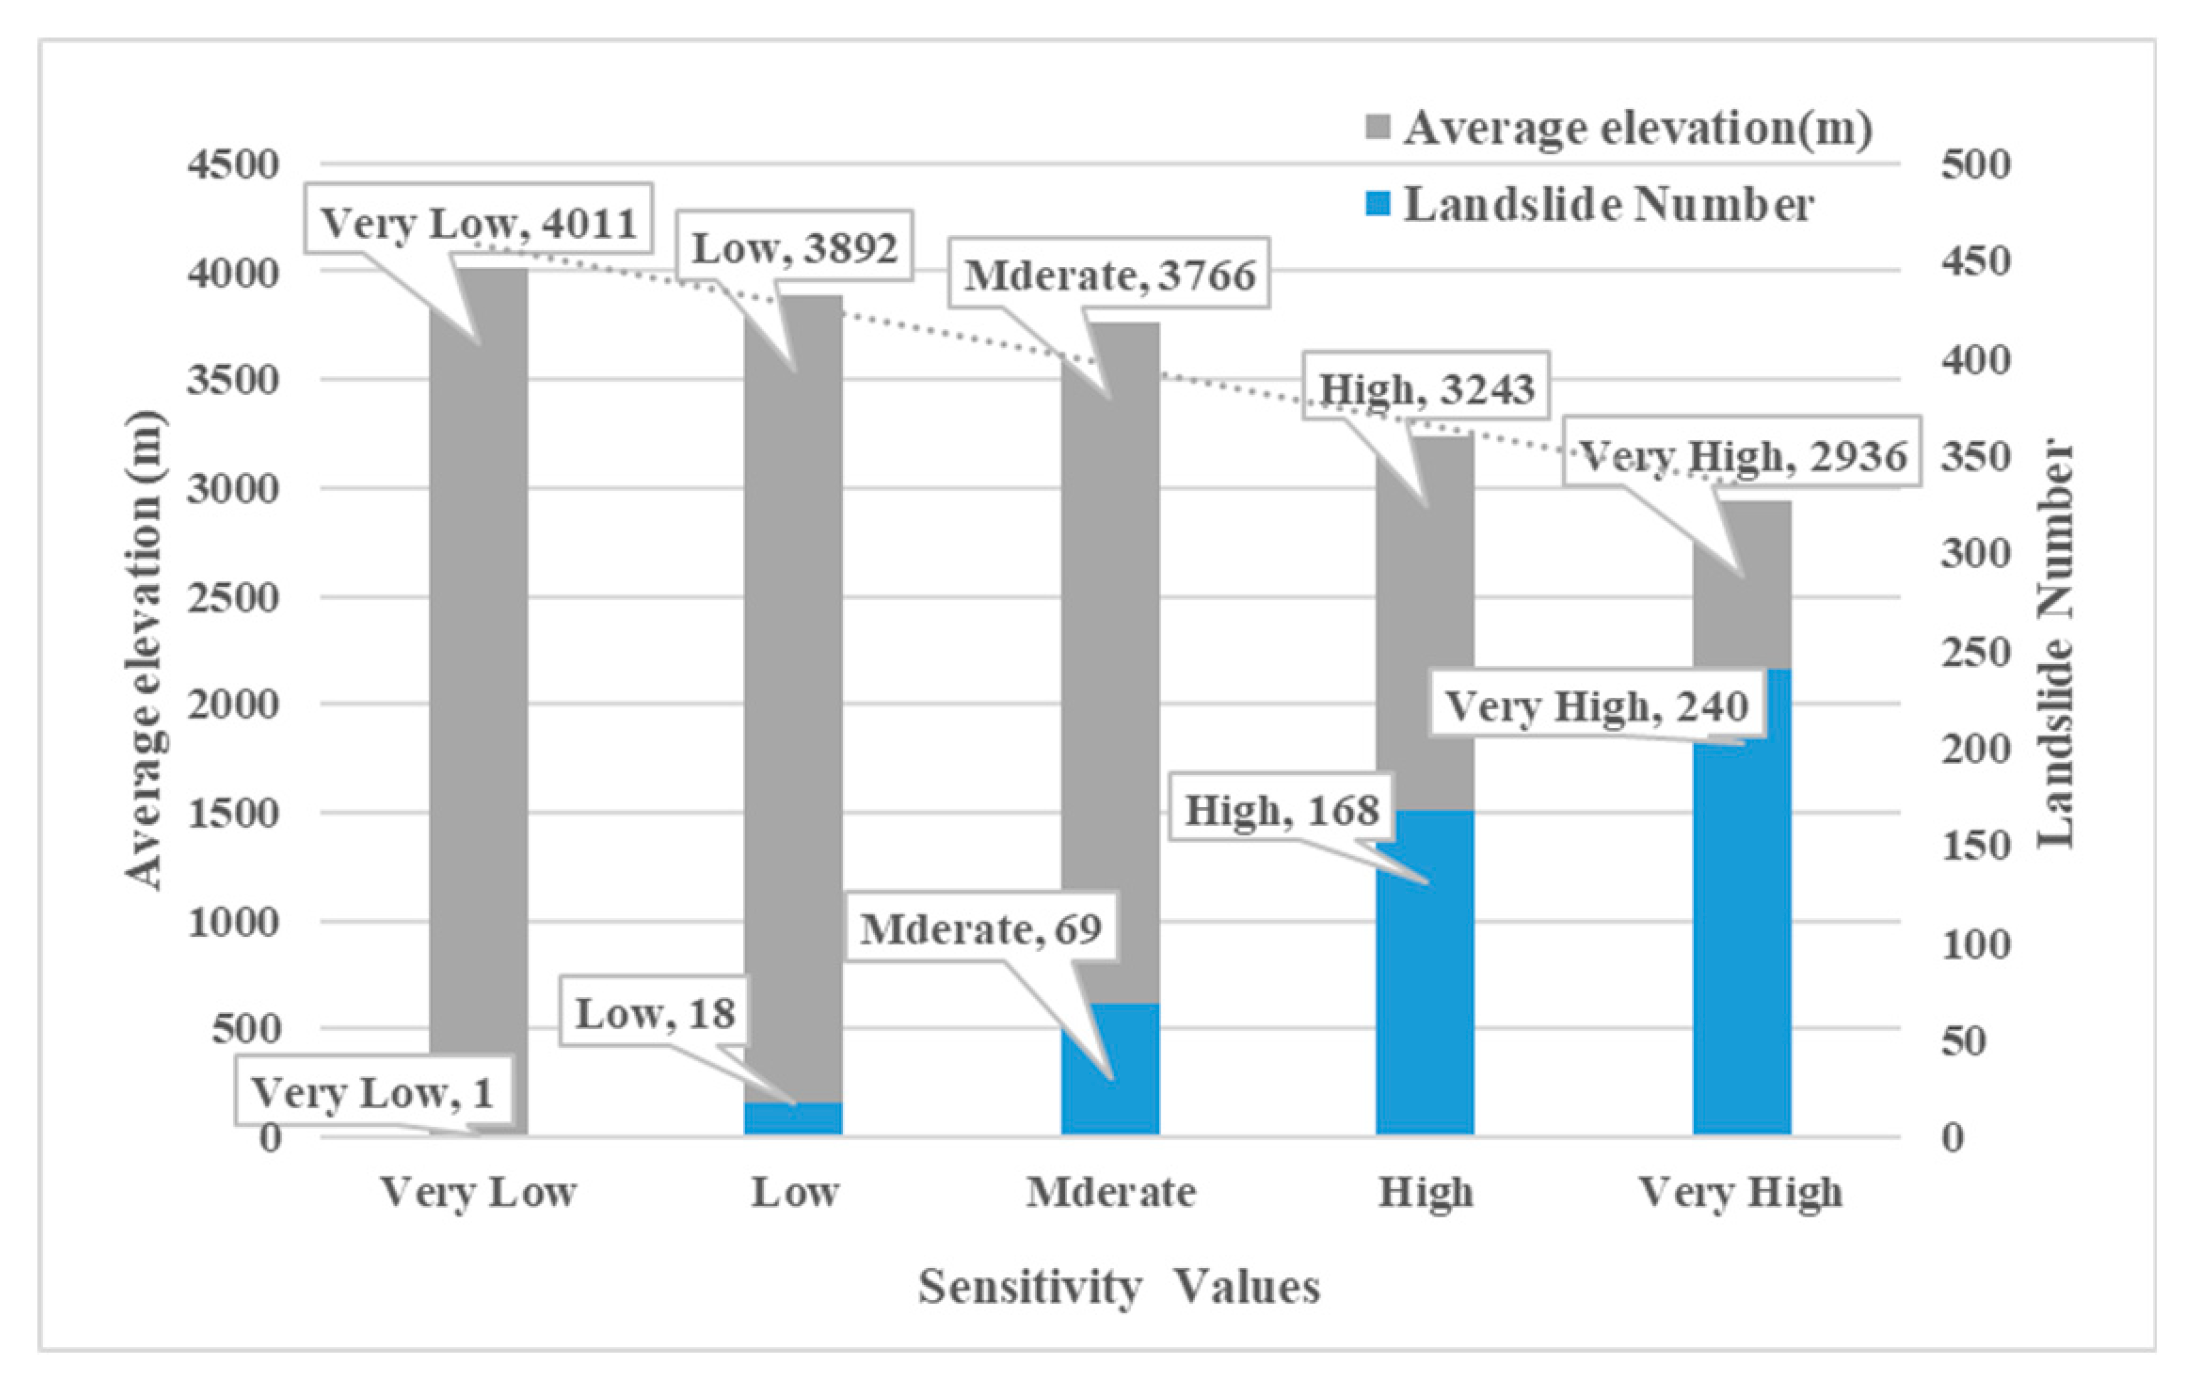
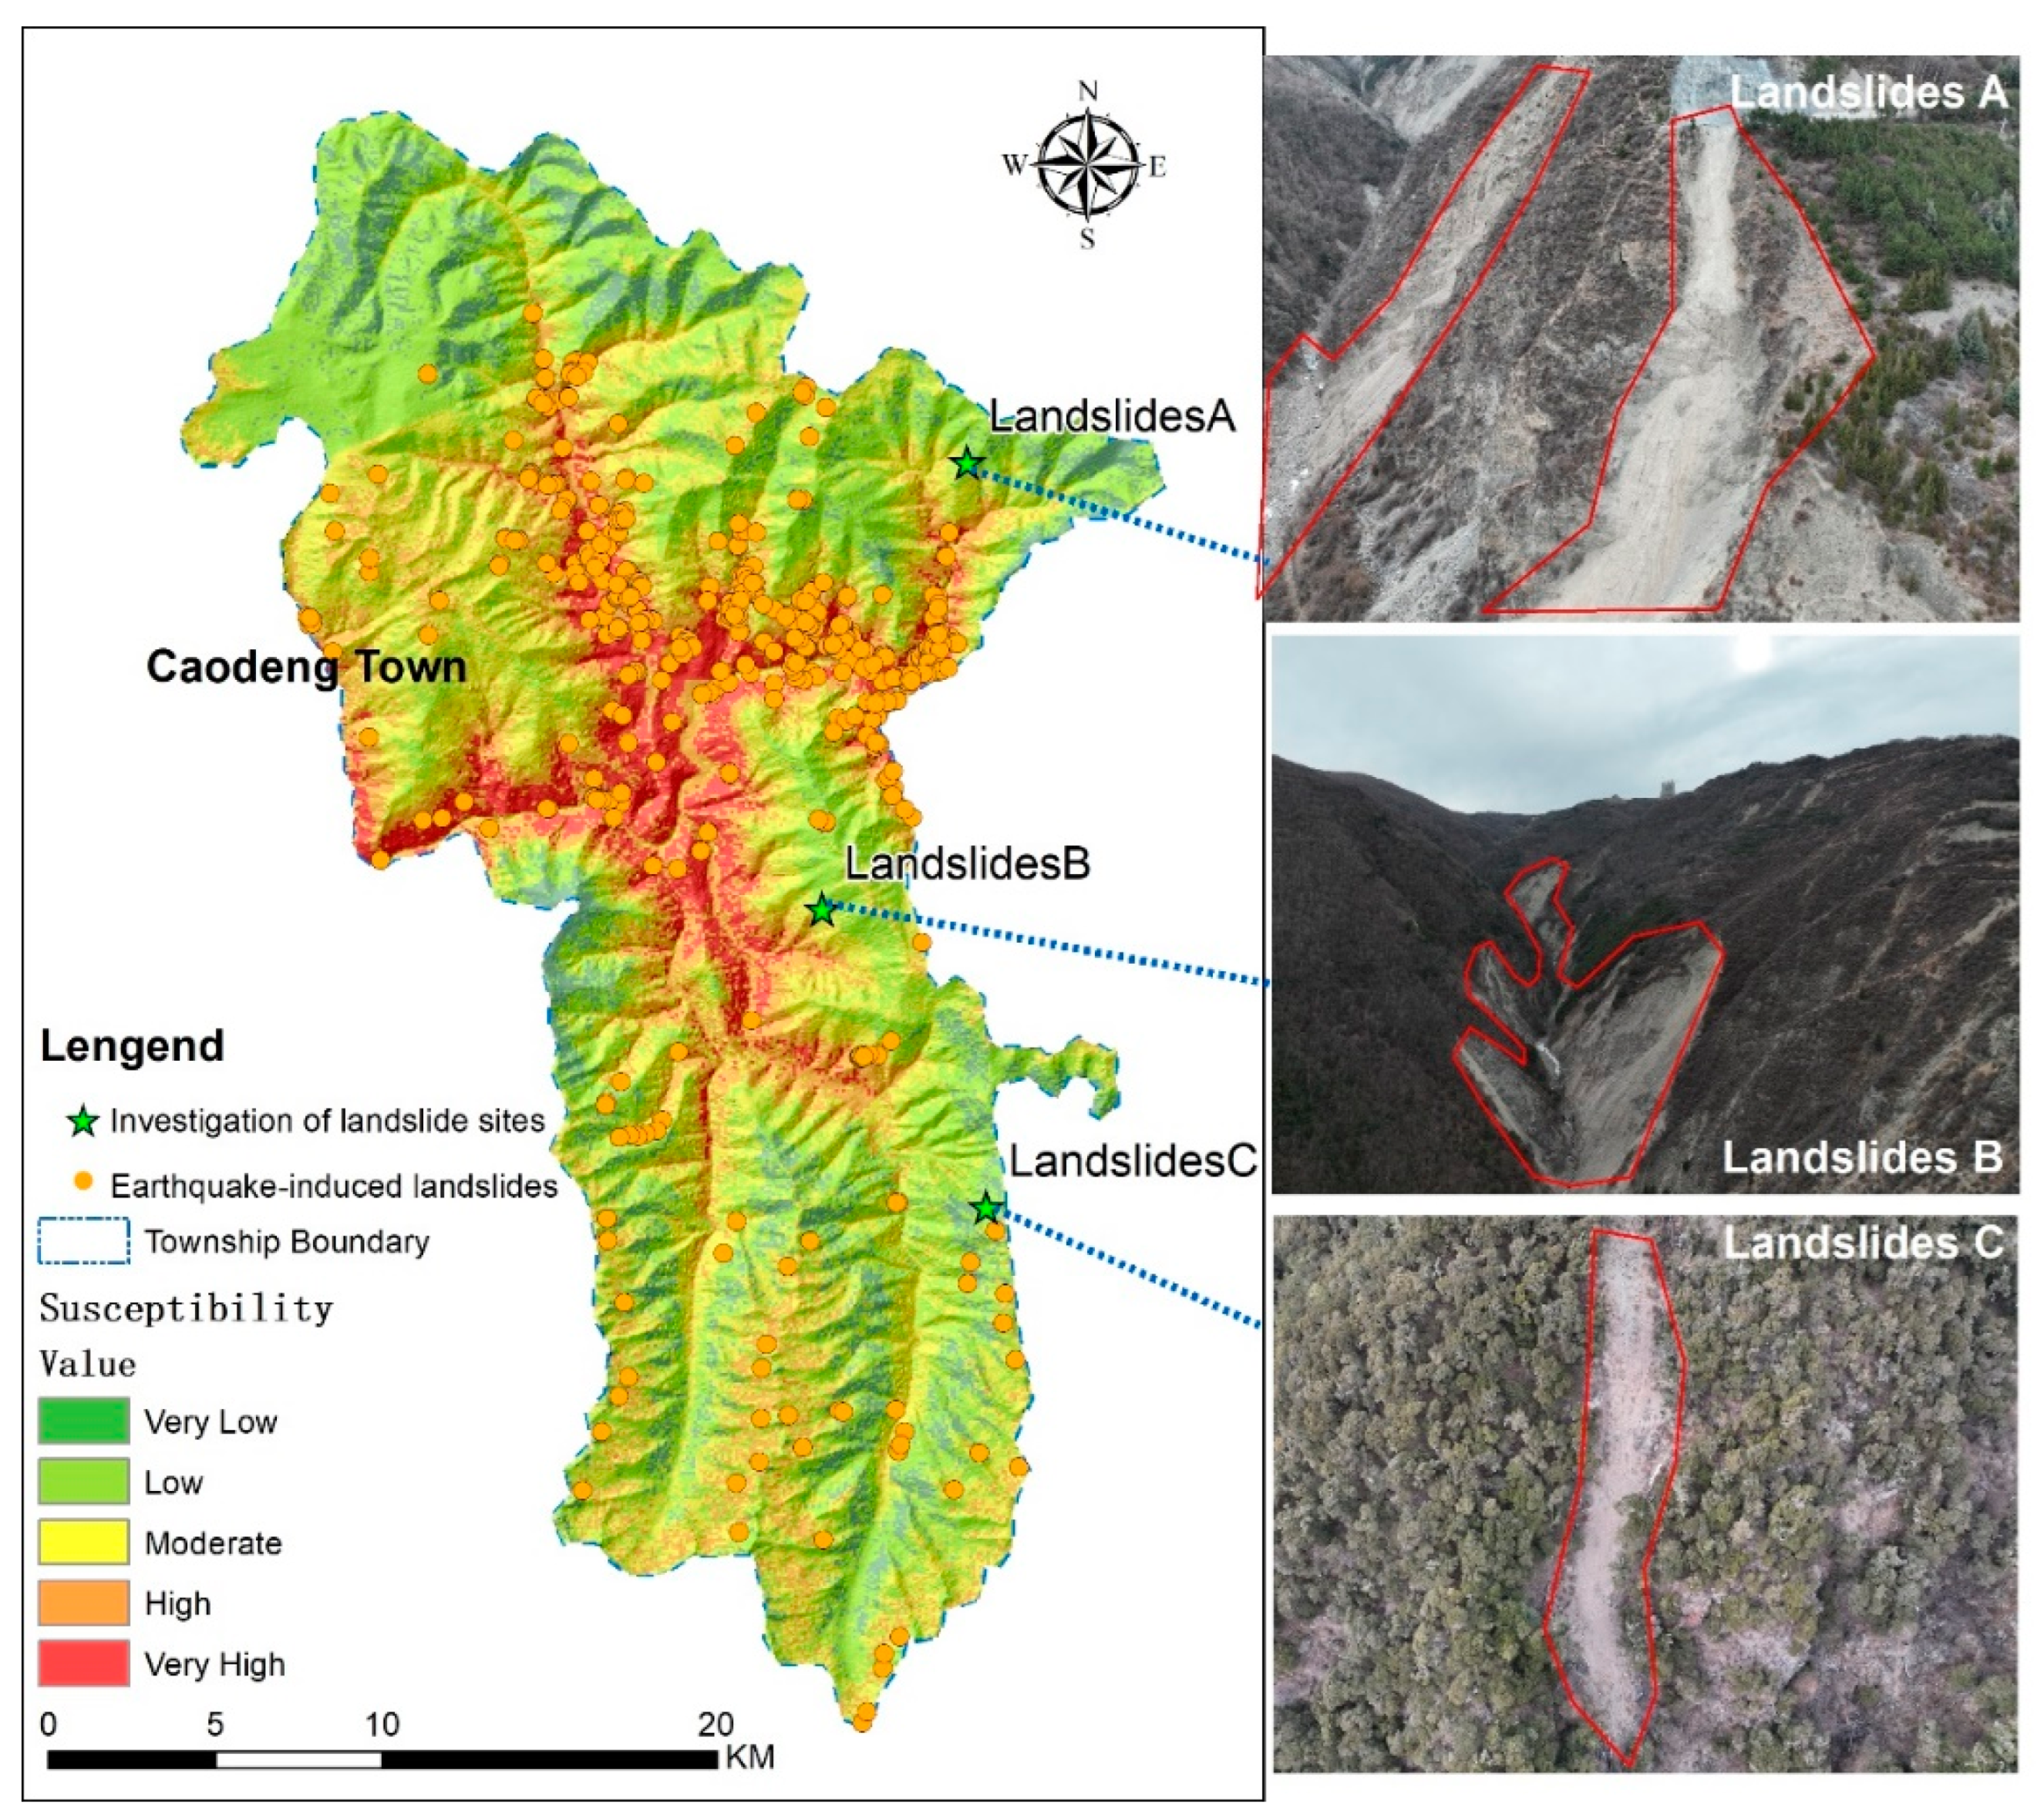
3.2. Analysis of Susceptibility Results
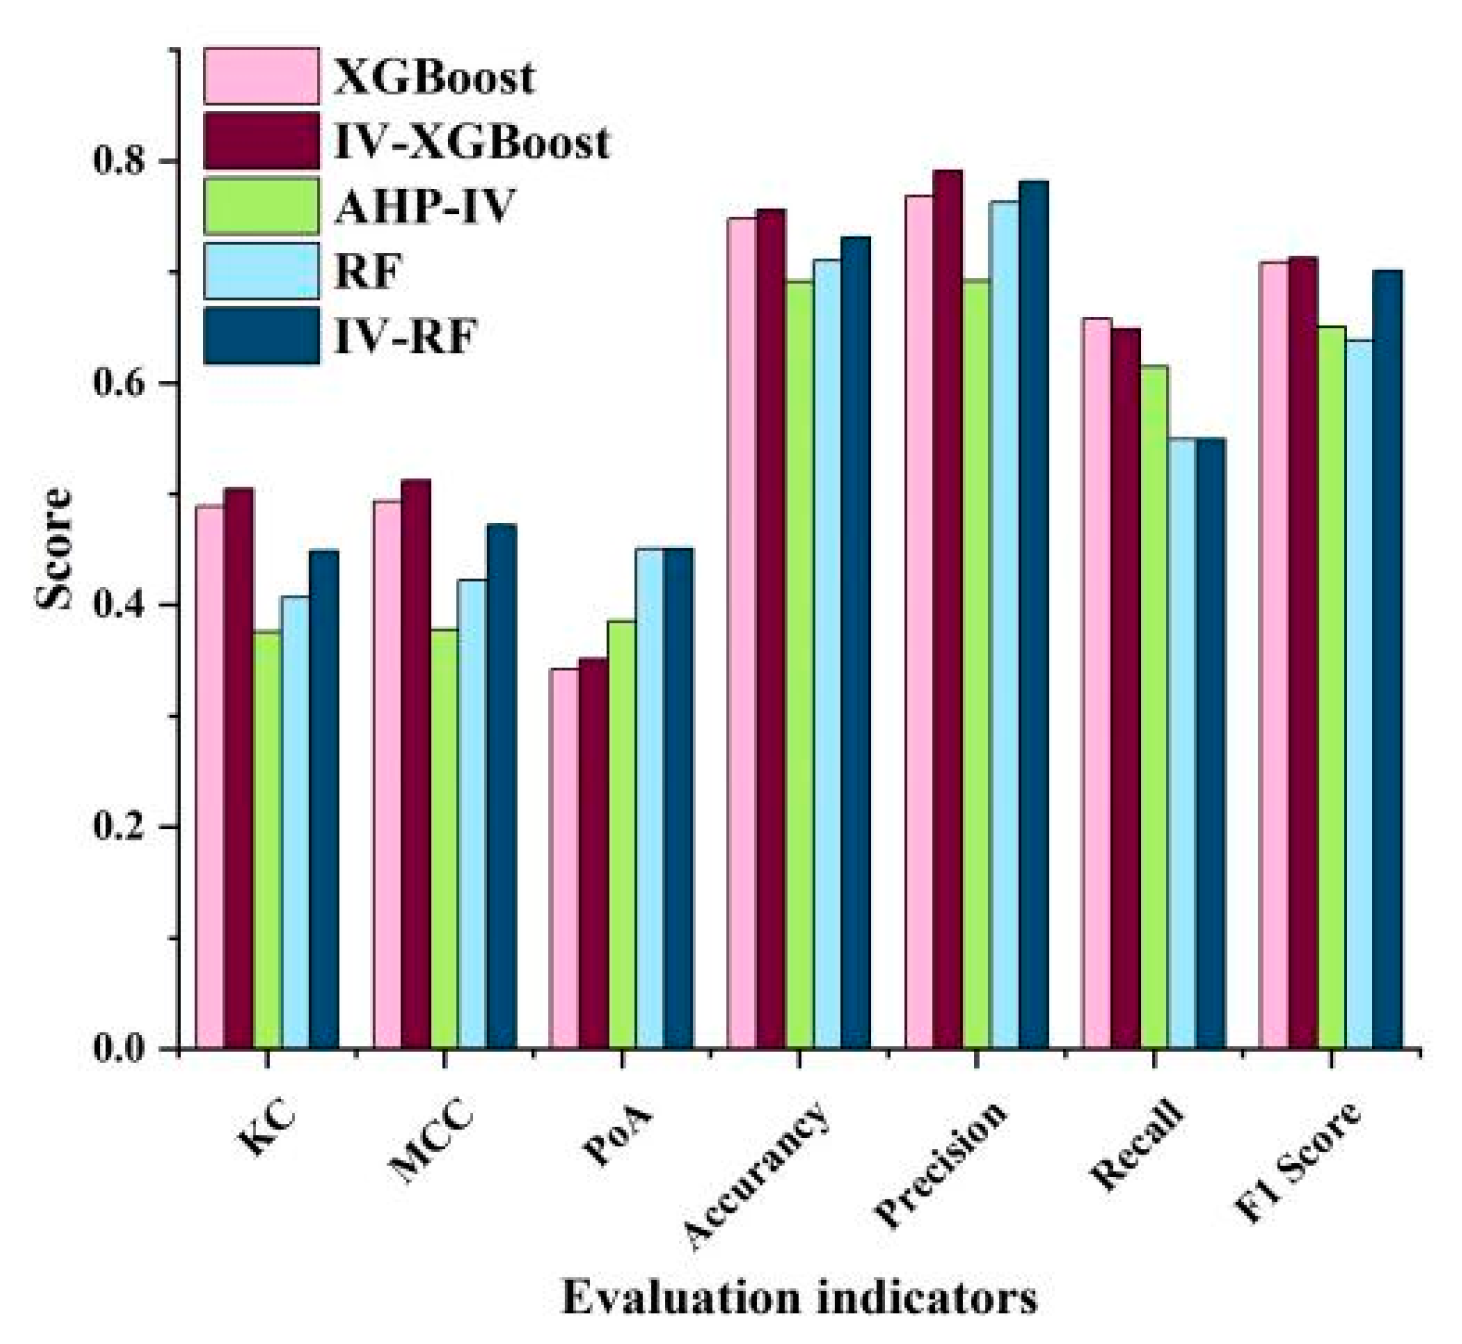
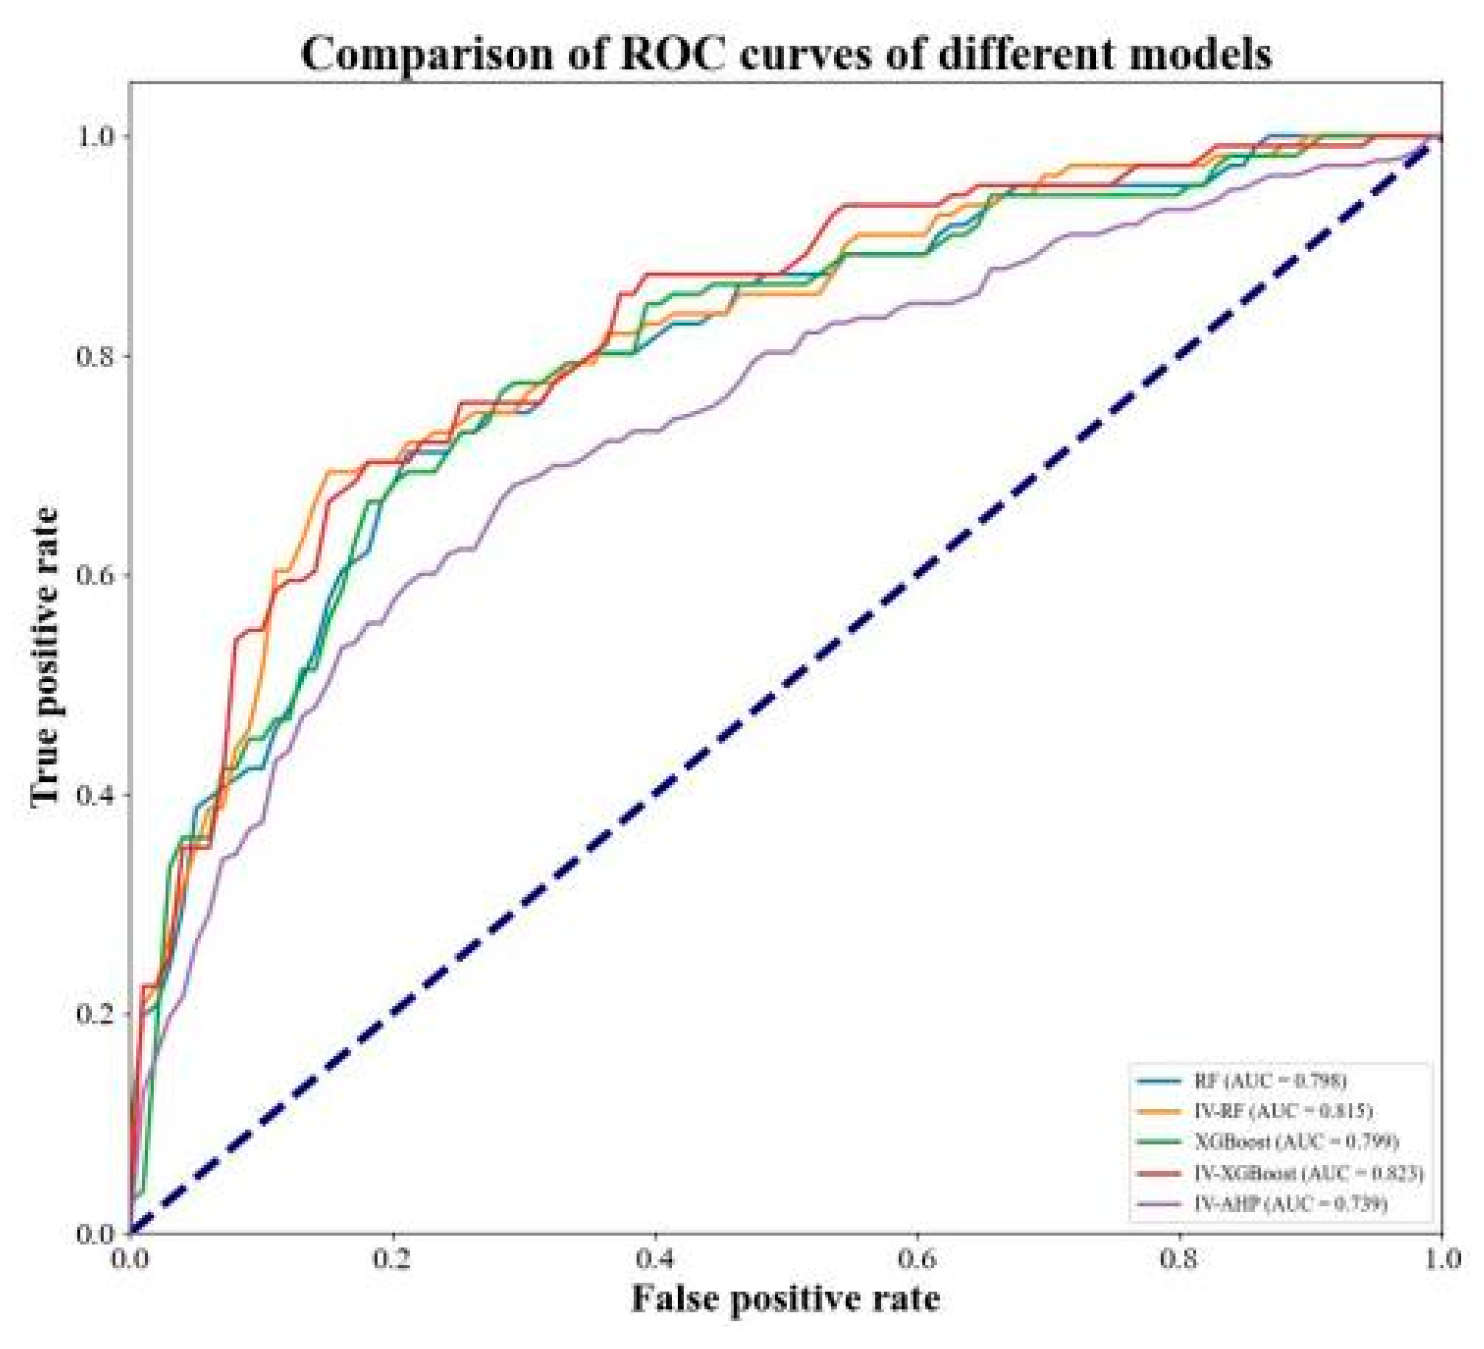
3.3. Model Accuracy Validation
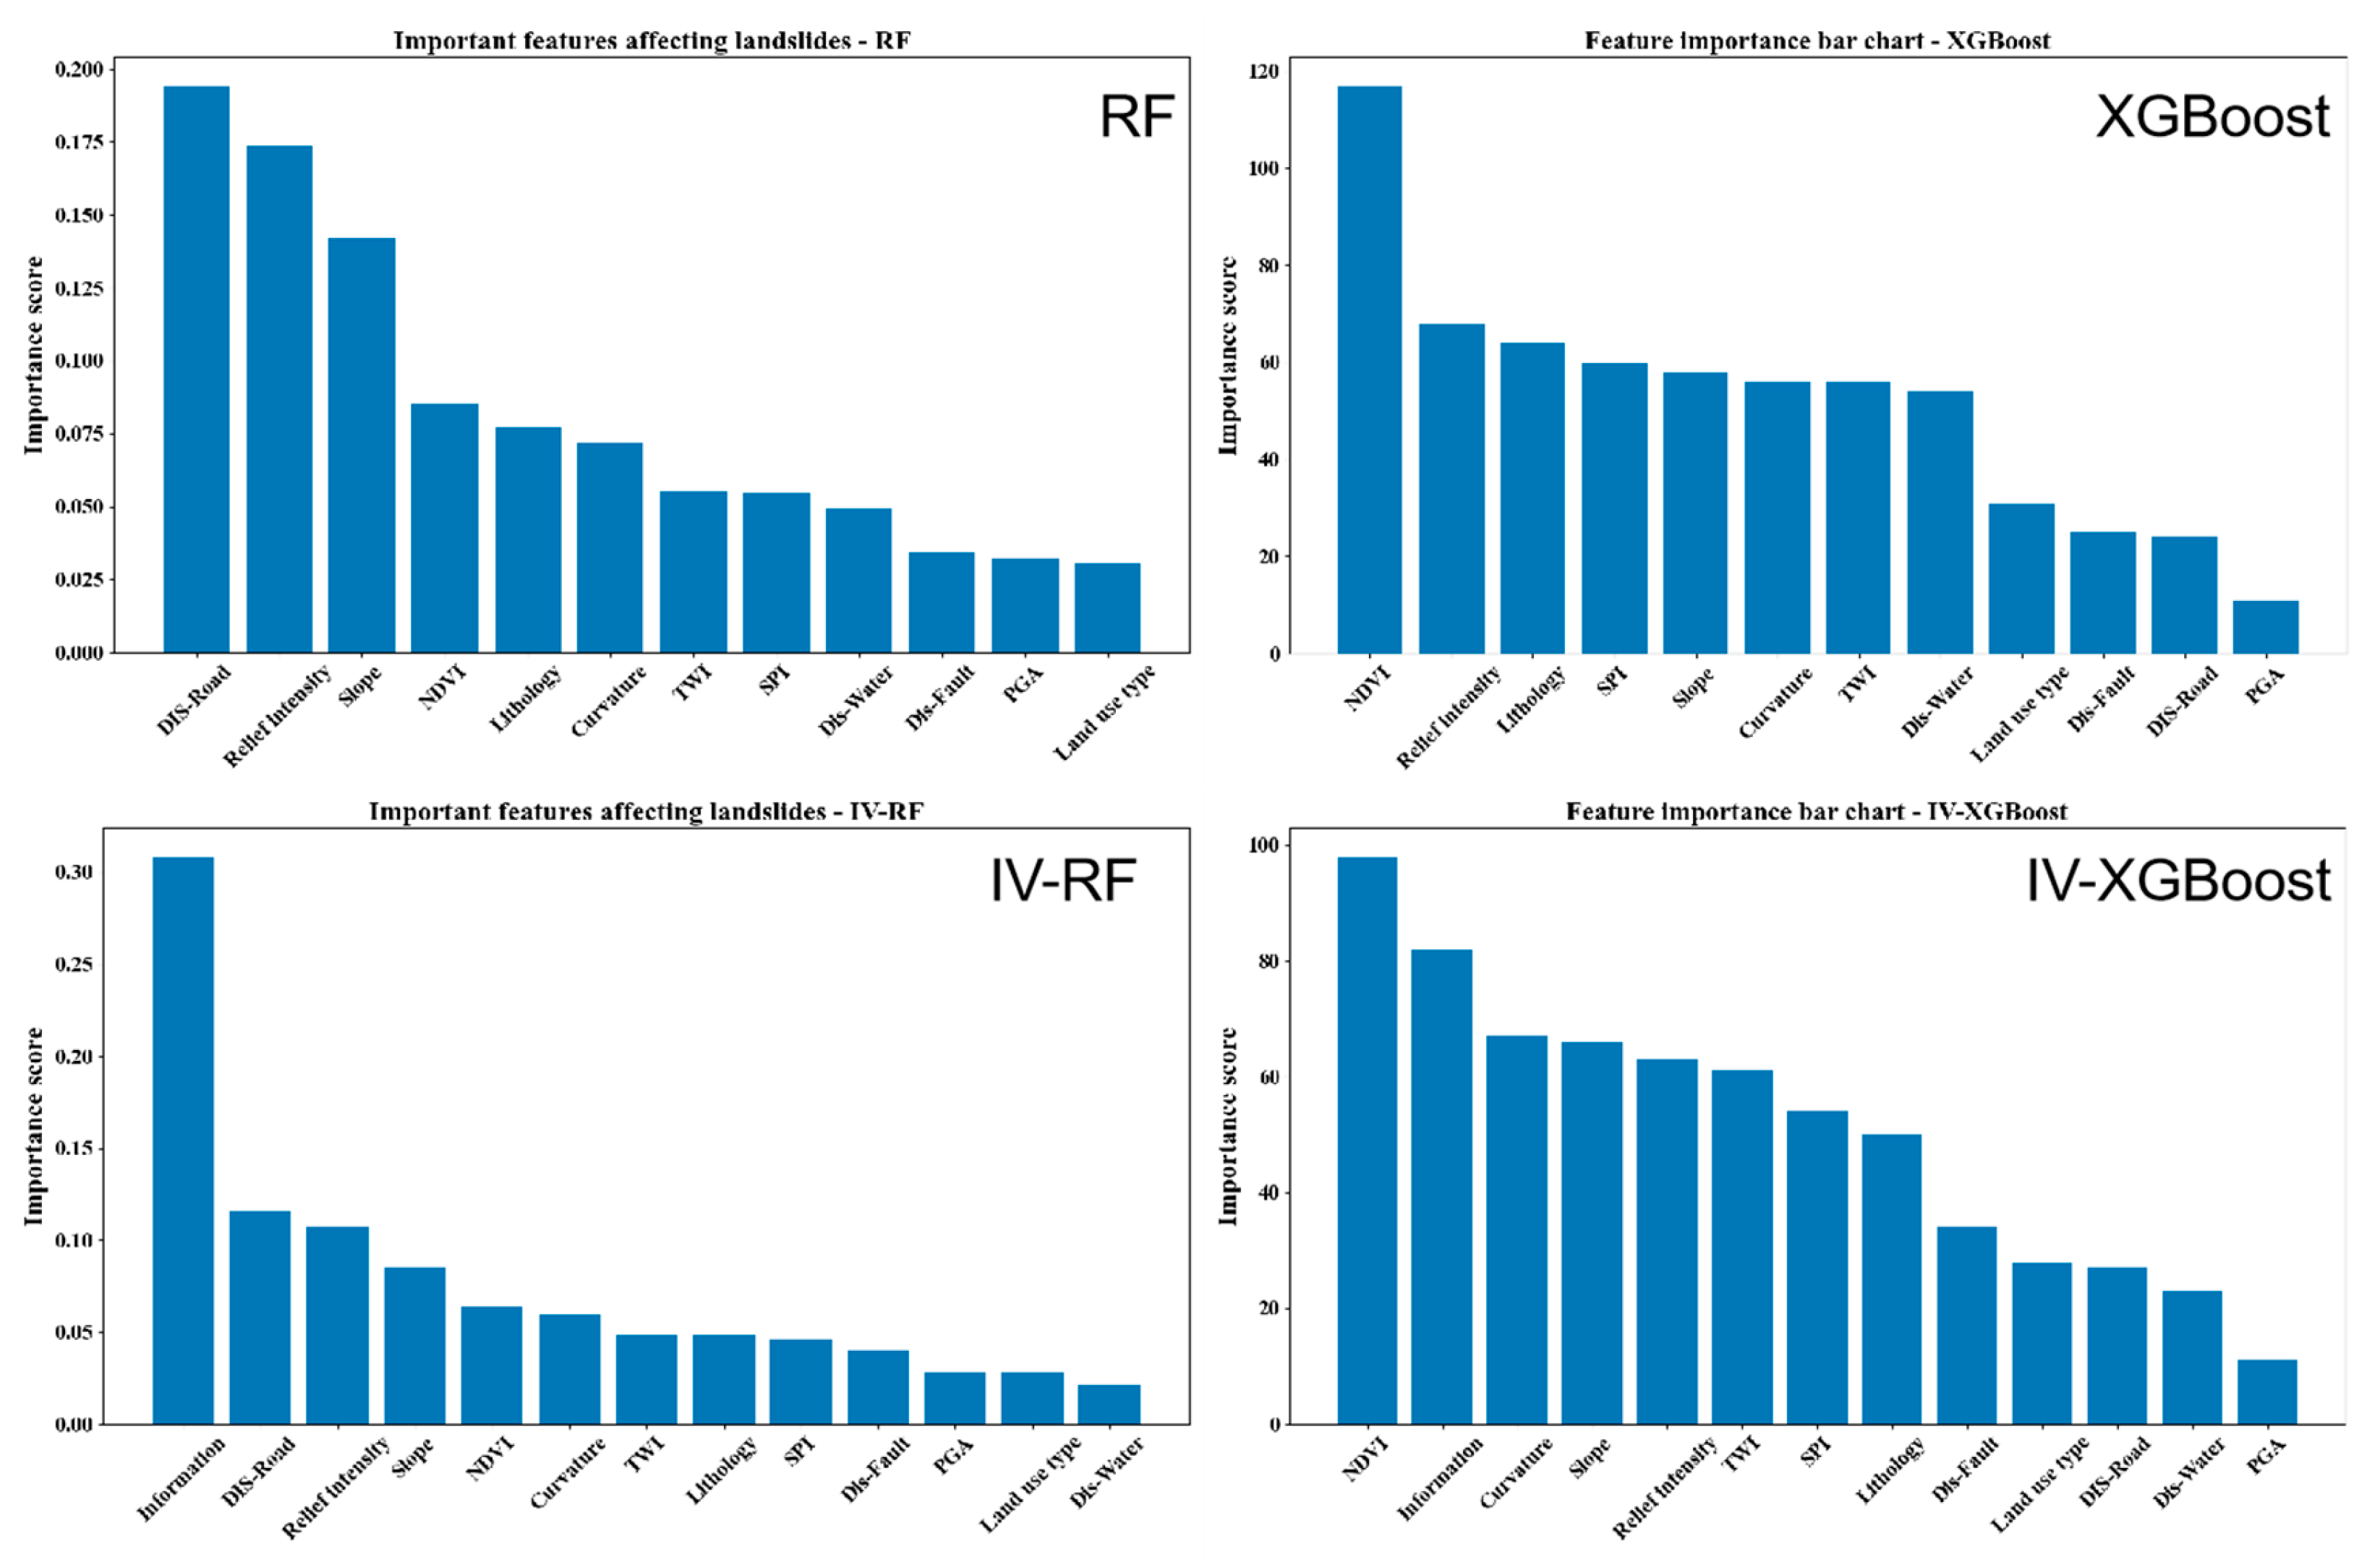
3.4. Factor Significance Analysis
4. Discussions
5. Conclusions
Author Contributions
Funding
References
- Liang, Y.L.; et al. Analysis of Seismic Intensity Distribution and Building Damage Characteristics of the M_S 6.0 Earthquake Swarm in Barkam. Seismological and Geomagnetic Observation and Research 2023, 44, 28–35. [Google Scholar]
- Fan, X.M.; et al. Study on the Characteristics and Spatial Distribution Rules of Geological Disasters Induced by the M_S 6.8 Luding Earthquake in 2022. Journal of Engineering Geology 2022, 30, 1504–1516. [Google Scholar]
- Huang, F.; et al. Comparisons of heuristic, general statistical and machine learning models for landslide susceptibility prediction and mapping. Catena 2020, 191, 104580. [Google Scholar] [CrossRef]
- Yan, J.S.; Tan, J.M. Landslide Susceptibility Evaluation Based on Different Factor Classification Methods: A Case Study of Yuan’an County, Hubei Province. The Chinese Journal of Geological Hazard and Control 2019, 52–60. [Google Scholar]
- Huang, F.M.; Cao, Z.S.; Yao, C.; et al. Landslide Hazard Early Warning Based on Decision Tree and Effective Rainfall Intensity. Journal of Zhejiang University (Engineering Science) 2021, 55, 472–482. [Google Scholar]
- He, Q.; et al. Landslide and Wildfire Susceptibility Assessment in Southeast Asia Using Ensemble Machine Learning Methods. Remote Sensing 2021, 13, 1572. [Google Scholar] [CrossRef]
- Wang, Z.; Liu, Q.; Liu, Y. Mapping Landslide Susceptibility Using Machine Learning Algorithms and GIS: A Case Study in Shexian County, Anhui Province, China. Symmetry 2020. [Google Scholar] [CrossRef]
- Jia, Y.F.; Wei, W.H.; Chen, W.; et al. Landslide Susceptibility Evaluation Based on the SOM-I-SVM Coupling Model. Hydrogeology & Engineering Geology 2023, 50, 125–137. [Google Scholar]
- Li, G.Y.; Liu, P.; Zhang, K.; et al. Influence Analysis of Dimensionality Unification in Landslide Susceptibility Evaluation. Hydrogeology & Engineering Geology 2024, 51, 118–129. [Google Scholar]
- Peng, S.Q.; et al. Regional Landslide Hazard Evaluation and Zoning Using the Coupling Model of Information Value Method and Random Forest and the Critical Monthly Average Rainfall Threshold: A Case Study of Fuling District, Chongqing City. The Chinese Journal of Geological Hazard and Control 2025, 36, 131–145. [Google Scholar]
- Zhang, J.Y.; et al. Preliminary Analysis of Emergency Products and Focal Parameters of the M6.0 Earthquake in Barkam, Sichuan on June 10, 2022. Earthquake Research in China 2022, 38, 370–382. [Google Scholar]
- .Xu, X.W.; et al. Discovery of the Longriba Fault Zone in the Eastern Bayan Har Block and Its Tectonic Significance. Science in China Series D Earth Sciences 2008, 529–542. [Google Scholar]
- Xiao, B.F.; et al. Quantitative Assessment of Earthquake Damages with Visualization of Typical Scenarios Based on Oblique Photogrammetry Technology: A Case Study of the Earthquake Swarm in Barkam, Sichuan. Seismology and Geology 2023, 45, 847–863. [Google Scholar]
- Sun, D.; et al. Activity and Effect of Main Faults in Near Field of Bala Hydropower Station in Barkam. Journal of Engineering Geology 2010, 18, 940–949. [Google Scholar]
- Xu, C.; et al. Study on the Occurrence Probability of Coseismic Landslides: A New Generation of Seismic Landslide Hazard Model. Journal of Engineering Geology 2019, 27, 1122–1130. [Google Scholar]
- Wang, T.H.; et al. Monthly Prevention and Control Perspective on Geological Hazard Risk Assessment in Towns Along the Lower Hanjiang River. People’s Yangtze River 2024, 55, 98–107. [Google Scholar]
- Wu, X.G.; et al. Landslide Susceptibility Evaluation in Towns of the Hengduan Mountainous Area in Yunnan Province. Journal of Geological Hazards and Environmental Protection 2023, 34, 13–19. [Google Scholar]
- Chen, Z.H. Hazard Risk Assessment of Mountain Disasters Based on the AHP-Information Value Model. Science and Technology & Innovation 2024, 6, 118–120. [Google Scholar]
- Wu, M.T.; Sun, Y.; Zhou, Z.T. Landslide Susceptibility Evaluation Based on the Analytic Hierarchy Process-Information Quantity Method: A Case Study of Fuliang County, Jiangxi Province. Journal of East China University of Technology Natural Science Edition 2023, 46, 157–166. [Google Scholar]
- Chen, T.; Guestrin, C. XGBoost: A Scalable Tree Boosting System. ACM, 2016.
- Catani, F.; et al. Landslide susceptibility estimation by random forests technique: Sensitivity and scaling issues. Natural Hazards and Earth System Sciences 2013, 13, 2815–2831. [Google Scholar] [CrossRef]
- Breiman, Random forests. Mach Learn 2001, 45, 5–32.
- Pradhan, B. Manifestation of an advanced fuzzy logic model coupled with Geo-information techniques to landslide susceptibility mapping and their comparison with logistic regression modelling. Environmental and Ecological Statistics 2011, 18, 471–493. [Google Scholar] [CrossRef]
- Information, V.F.A.; et al. Landslide spatial prediction based on cascade forest and stacking ensemble learning algorithm.
- Fawcett, T. An introduction to ROC analysis. Pattern Recognition Letters 2005, 27, 861–874. [Google Scholar] [CrossRef]
- Pourghasemi, H.R.; Pradhan, B.; Gokceoglu, C. Application of fuzzy logic and analytical hierarchy process (AHP) to landslide susceptibility mapping at Haraz watershed, Iran. Natural Hazards 2012, 63, 965–996. [Google Scholar] [CrossRef]
- Liu, Y.T. Landslide Susceptibility Evaluation Based on Multi-Source Data Factor Extraction and Optimization. China University of Geosciences (Beijing), 2023.
- Information, V.F.A.; et al. Landslide spatial prediction based on cascade forest and stacking ensemble learning algorithm.

| Category | Feature Factor | Indicator Meaning | Data Source |
|---|---|---|---|
| Topography | Slope/(°) | Indicates the degree of slope and surface inclination | DEM (12.5m resolution), Geospatial Data Cloud |
| Curvature | Indicates the local variation in surface undulation | ||
| Topographic Relief/(m) | Indicates the variation in elevation difference | ||
| Hydrology | Distance to Rivers/(m) | Distance to rivers |
Based on 1:250,000 basic geographic information data |
| Topographic Wetness Index | Indicates soil moisture content and humidity conditions | DEM (12.5m resolution), Geospatial Data Cloud | |
| Stream Power Index | Indicates the erosion effect of water flow on slopes | ||
| Seismic | Peak Ground Acceleration/(gal) | Indicates the impact of the maximum amplitude of seismic acceleration time history on slopes | Based on data released by the China Earthquake Networks Center |
| Human Activities | Distance to Roads/(m) | Distance to roads | Based on 1:250,000 basic geographic information data |
| Geological Structure | Distance to Faults/(km) | Distance to faults | Based on data released by the China Geological Survey Data Service Platform |
| Rock Hardness | Indicates the hardness of different rock types | Based on geological maps and rock hardness level qualitative classification tables downloaded from the China Geological Survey Data Service Platform | |
| Environmental Geological Characteristics | Land Type | Indicates different land types affecting slope development | Based on Landsat8 remote sensing image data, Geospatial Data Cloud |
| Normalized Difference Vegetation Index (NDVI) | Indicates vegetation growth and coverage within a range |
 |
| Category | Feature Factor | Factor Classification |
| Topography | Slope/ (°) | <16°,16°~32°,32°~48°,48°~64°,>64° |
| Curvature | <-9,-9~-3,-3~-1,-1~1,>1 | |
| Topographic Relief/(m) | <36,36~72,72~107,107~143,>143 | |
| Hydrology | Distance to Rivers/(m) | <300,300~600,600~900,900~1200,1200~1500,>1500 |
| Topographic Wetness Index | <0.2,0.2~0.4,0.4~0.6,0.6~0.8,>0.8 | |
| Stream Power Index | <0.2,0.2~0.4,0.4~0.6,0.6~0.8,>0.8 | |
| Seismic | Peak Ground Acceleration/(gal) | <0.1,0.10~0.15 |
| Human Activities | Distance to Roads/(m) | <100,100~200,200~300,300~400,400~500,500~600,>600 |
| Geological Structure | Distance to Faults/(km) | <1,1~2,2~3,3~4,4~5,5~6,6~7,7~8,>8 |
| Rock Hardness | Extremely Soft Rock, Soft Rock, Moderately Soft Rock, Moderately Hard Rock, Hard Rock | |
| Environmental Geological Characteristics | Land Type | Cultivated Land, Forest, Grassland, Shrubland, Tundra, Artificial Surface, Bare Land |
| Normalized Difference Vegetation Index (NDVI) | <0.2,0.2~0.4,0.4~0.6,0.6~0.8,>0.8 |
| A | B | C | D | E | F | G | H | I | J | K | L | weights | |
| A | 1 | 3 | 2 | 3 | 3 | 2 | 3 | 3 | 2 | 2 | 3 | 2 | 0.1653 |
| B | 1 | 3 | 2 | 2 | 2 | 1/2 | 1/2 | 1/2 | 2 | 4 | 3 | 0.0949 | |
| C | 1 | 3 | 2 | 2 | 1/3 | 1/4 | 1/2 | 2 | 1/2 | 1/2 | 0.0578 | ||
| D | 1 | 3 | 1/2 | 1/2 | 1/2 | 1/3 | 1/2 | 1/2 | 1/2 | 0.0408 | |||
| E | 1 | 1/2 | 1/4 | 1/2 | 1/3 | 1/3 | 1/2 | 1/3 | 0.0334 | ||||
| F | 1 | 1/3 | 1/2 | 1/3 | 2 | 1/2 | 1/2 | 0.0509 | |||||
| G | 1 | 1 | 1/2 | 3 | 3 | 3 | 0.1169 | ||||||
| H | 1 | 1/2 | 3 | 3 | 3 | 0.1108 | |||||||
| I | 1 | 3 | 3 | 2 | 0.1308 | ||||||||
| J | 1 | 1/2 | 1/3 | 0.0444 | |||||||||
| K | 1 | 1/2 | 0.0557 | ||||||||||
| L | 1 | 0.0715 |
| Model | Classification | Area /km2 | Area proportion /% | Number of landslides | Proportion of landslide /% | landslide density /(ind/km2) |
|---|---|---|---|---|---|---|
| XGBoost | Very low | 2685.72 | 40.50 | 46 | 4.03 | 0.02 |
| Low | 1996.84 | 30.11 | 182 | 15.94 | 0.09 | |
| Moderate | 1137.61 | 17.16 | 234 | 20.49 | 0.21 | |
| High | 540.51 | 8.15 | 272 | 23.82 | 0.50 | |
| Very high | 270.44 | 4.08 | 408 | 35.73 | 1.51 | |
| RF | Very low | 2107.25 | 31.78 | 27 | 2.36 | 0.01 |
| Low | 2828.27 | 42.65 | 166 | 14.54 | 0.06 | |
| Moderate | 1043.52 | 15.74 | 220 | 19.26 | 0.21 | |
| High | 371.12 | 5.60 | 247 | 21.63 | 0.67 | |
| Very high | 281.72 | 4.25 | 482 | 42.21 | 1.71 | |
| IV-AHP | Very low | 809.66 | 12.21 | 51 | 4.47 | 0.06 |
| Low | 2652.86 | 40.01 | 279 | 24.43 | 0.11 | |
| Moderate | 1653.05 | 24.93 | 201 | 17.60 | 0.12 | |
| High | 1142.98 | 17.24 | 288 | 25.22 | 0.25 | |
| Very high | 372.56 | 5.62 | 323 | 28.28 | 0.87 | |
| IV-XGBoost | Very low | 1846.53 | 27.85 | 89 | 7.79 | 0.05 |
| Low | 2788.65 | 42.05 | 152 | 13.31 | 0.05 | |
| Moderate | 1289.09 | 19.44 | 206 | 18.04 | 0.16 | |
| High | 405.25 | 6.11 | 210 | 18.39 | 0.52 | |
| Very high | 301.60 | 4.55 | 485 | 42.47 | 1.61 | |
| IV-RF | Very low | 2109.99 | 31.82% | 27 | 2.36% | 0.01 |
| Low | 2831.62 | 42.70% | 175 | 15.32% | 0.06 | |
| Moderate | 1044.82 | 15.76% | 182 | 15.94% | 0.17 | |
| High | 362.60 | 5.47% | 240 | 21.02% | 0.66 | |
| Very high | 282.10 | 4.25% | 518 | 45.36% | 1.84 |
| Modle | XGBoost | IV-XGBoost | AHP-IV | RF | IV-RF |
| KC | 0.4889 | 0.5048 | 0.3757 | 0.4071 | 0.4485 |
| MCC | 0.4935 | 0.5123 | 0.3779 | 0.4224 | 0.4718 |
| PoA | 0.3423 | 0.3514 | 0.3857 | 0.4505 | 0.4505 |
| Accurancy | 0.7479 | 0.7563 | 0.6912 | 0.7101 | 0.7311 |
| Precision | 0.7684 | 0.7912 | 0.6919 | 0.7625 | 0.7813 |
| Recall | 0.6577 | 0.6486 | 0.6143 | 0.5495 | 0.5495 |
Disclaimer/Publisher’s Note: The statements, opinions and data contained in all publications are solely those of the individual author(s) and contributor(s) and not of MDPI and/or the editor(s). MDPI and/or the editor(s) disclaim responsibility for any injury to people or property resulting from any ideas, methods, instructions or products referred to in the content. |
© 2025 by the authors. Licensee MDPI, Basel, Switzerland. This article is an open access article distributed under the terms and conditions of the Creative Commons Attribution (CC BY) license (http://creativecommons.org/licenses/by/4.0/).


