
Submitted:
07 March 2025
Posted:
10 March 2025
You are already at the latest version
Abstract
Objectives: As an indicator of an individual's energy metabolism at rest,the basal metabolic rate (BMR) has been demonstrated to be linked to the onset and progression of various diseases. However, the relationship between BMR and pregnancy complications remains unkown. The present study aimed to explore the causal relationship between BMR and pregnancy complications through the application of Mendelian randomization(MR) analysis. Methods: We identified a range of complications that can arise throughout pregnancy as our objects and obtain the instrumental variables of BMR and pregnancy complications in genome-wide association studies (GWAS). The causal association between BMR and these complications was assessed using a two-sample MR analysis. Additionally, sensitivity analyses were conducted to ascertain the robustness and reliability of results. And multivariate Mendelian randomization(MVMR) analysis was employed to mitigate the impact of potential confounders. Results: A higher BMR is significantly associated with an elevated risk of gestational hypertension, preeclampsia or eclampsia, and postterm pregnancy. Conversely, a lower BMR was found to be significantly associated with an increased risk of preterm birth, Hyperemesis Gravidarum, and dystocia due to pelvic narrowing .In reverse MR analysis,we did not identify any significant causal impact of pregnancy complications on BMR. Furthermore, MVMR analysis confirmed that the associations between BMR and gestational hypertension, preterm birth, and dystocia due to pelvic stenosis were independent of potential confounding factors.Conclusions: This investigation is the first to highlight the correlation between BMR and pregnancy complications. The maintenance of BMR balance may contribute to the improvement of pregnancy outcomes, offering a novel theoretical foundation and practical guidance for health management during pregnancy.
Keywords:
basal metabolic rate
; regnancy complications
; Mendelian randomization
1. Introduction
Basic metabolic rate (BMR) refers to the minimum energy expenditure required to sustain essential life activities in a resting state, which is mainly used to support physiological processes such as respiration, blood circulation, and cellular metabolism. As the primary component of total energy expenditure, BMR serves as a critical parameter for evaluating individual daily energy demand[1]. Studies have demonstrated that BMR is influenced by many factors, including age, fat-free mass (FFM), body fat content, and thyroid function[2,3]. Recent evidence has established BMR as an independent risk factor for all-cause mortality, and is related to the pathogenesis and progression of various diseases[4,5]. A cohort study showed that the increase of BMR was significantly negatively correlated with all-cause mortality in elderly men[6]. Increased BMR may also be linked to a higher risk of atrial flutter and atrial fibrillation[7], so BMR has important clinical significance in disease etiology and health management.
The BMR of pregnant women undergoes significant elevation due to physiological changes, including increased body weight, heightened cardiac load, and altered thyroid function. Studies indicate that women in the second and third trimesters need an additional energy intake of 100–150 kcal/d to meet their elevated energy demands[8,9,10]. Pregnancy-related complications may significantly alter BMR. Compared to healthy pregnant women, patients with hyperemesis gravidarum (HG) had markedly reduced resting oxygen consumption and BMR[11]. Martin et al. reported that although patients with preeclampsia (PE) share similar body composition with healthy pregnant women, their BMR and thermic effect of food (TEF) demonstrate a declining trend[12]. Nevertheless, the relationship between BMR and the incidence of pregnancy complications remains unclear, and the relevant research is relatively limited. Adane et al. suggest that low pre-pregnancy BMR may contribute to excessive weight gain during pregnancy, thereby increasing the risk of gestational diabetes mellitus (GDM)[13].
Mendelian randomization (MR) is a statistical approach based on the principle of random genetic variation distribution during gamete formation, utilized to assess causal relationships between exposure factors and outcome variables[14]. Given that the measurement of BMR requires strict experimental conditions[15], MR has emerged as a pivotal tool for investigating BMR and its associated health effects. We focused on a series of pregnancy complications as research objectives, including spontaneous abortion and hyperemesis gravidarum in the first trimester, hypertensive disorders of pregnancy (HDP), pre-eclampsia or eclampsia, and preterm birth in the second and third trimesters, as well as post-term pregnancy and dystocia during delivery.To examine the causal relationship between BMR and these pregnancy complications, we performed MR analysis based on the publicly collected statistical data of several large-scale genome-wide association studies (GWAS).
2. Materials and Methods
2.1. Study Design and Data Sources
Based on the basic principles of MR, this study established the following three assumptions: (1) there was a strong correlation between instrumental variables (IVs) and exposure; (2) IVs are independent of any confounding factors related to exposures or outcomes; (3) IVs only influence outcomes through the exposure factors, with no alternative effect pathways. In this study, BMR was used as an exposure factor, single nucleotide polymorphisms (SNPs) associated with BMR as instrumental variables, and pregnancy complications as outcomes.We employed two-sample MR to investigate the causal relationship between BMR and pregnancy complications, while utilizing multivariable Mendelian randomization (MVMR) to adjust for potential confounding factors. Given that the data were derived from GWAS datasets, there is no need for additional ethical review. The study design is shown in Figure 1.
The GWAS data for BMR in this study are from the UK Biobank, comprising 454,874 participants.GWAS datasets for pregnancy complications such as spontaneous abortion (23,167 cases and 199,279 controls) and hypertensive disorders of pregnancy (20,405 cases and 261,659 controls), were obtained from the FinnGen R12 database (https://r12.finngen.fi). Additionally, dystocia in FinnGen database is further divided into two categories : dystocia due to malposition of the fetus and dystocia due to pelvic narrowing. All datasets are from European populations. Detailed information on the relevant GWAS datasets is provided in Table 1.
2.2. Selection of Instrumental Variables
We screened SNPs associated with BMR according to the genome-wide significance threshold (P<5E-8) and selected independent SNPs by removing linkage disequilibrium effects (R2=0.001, window size=10000 KB). To evaluate the strength of IVs, we calculated the F-statistic between IVs and BMR using the formula:F=R2 (N−2)/(1−R2),where R2 represents the degree of exposure explained by IVs (determination coefficient of regression equation), and N denotes the sample size of the GWAS data. An F-statistic less than 10 suggests potential weak instrumental bias[16]. After preliminary analysis, we searched in Ensembl database( https://www.ensembl.org)to identify SNPs associated with confounding factors and repeated the MR analysis after excluding these SNPs. The confounding factors considered included body mass index (BMI), body fat percentage, triglyceride levels, height, and type 2 diabetes. In the reverse MR analysis, in order to increase the statistical efficacy, we applied a more lenient significance threshold (P<5E-6) to screen IVs related to pregnancy complications.Eventually,,ambiguous and palindromic SNPs were removed to ensure the reliability of the analysis results.
2.3. Mendelian Randomization and Sensitivity Analysis
When evaluating the causal relationship between BMR and pregnancy complications, our study employed the inverse variance weighting (IVW) method with a fixed-effect model as the main analytical approach. If significant heterogeneity was detected (P<0.05), the IVW with a random-effect model was utilized as an alternative. The IVW integrates the Wald estimates of each SNP through meta-analysis to obtain the overall causal effect of BMR on pregnancy complications. In the absence of pleiotropy,IVW represents the most efficient method for estimating causal effects[17,18]. To assess the robustness of the causal relationship,we also applied supplementary methods, including the weighted median, MR-Egger regression, simple mode, and weighted mode. MR-Egger regression can introduce an intercept term to detect and correct for pleiotropy, providing more robust causal effect estimates[19].The weighted median weights each IV based on its statistical significance (usually determined by P-values), so that it can still provide a robust and consistent causal effect estimation when nearly 50% of IVS are invalid variables[20].
Cochran's Q statistic was employed to assess the heterogeneity of IVs. Q-p value less than 0.05 indicates significant heterogeneity in the results. We use the MR pleiotropy residual sum and outlier (MR-PRESSO) method to identify outlier SNPs and calculated the corrected p-values based on this. Horizontal pleiotropy was evaluated by the intercept term of Mr Egger regression. If the p-value of the intercept term was greater than 0.05, it suggested there was no significant horizontal pleiotropy, that is, IVS had a direct impact on the outcome only through exposure factors.We conducted leave-one-out sensitivity analysis to evaluate the robustness of the MR results. This method eliminated each SNP in turn and re-estimated the causal effect to determine whether the results were significantly influenced by any single SNP.
2.4. Multivariable Mendelian Randomization
Multivariable Mendelian randomization (MVMR) is a statistical approach designed to estimate causal relationships between multiple exposures and multiple outcomes[21]. In order to verify that the causal relationship between BMR and pregnancy outcomes is independent of potential confounding factors, IVs for the following confounders were extracted from different GWAS datasets: BMI, body fat percentage, triglyceride levels, type 2 diabetes, and female height[22,23,24,25]. MVMR-IVW is the main method for evaluating causal effects, while MVMR-Egger regression was employed as a supplementary approach.
2.5. Statistical Analysis
All statistical analyses of this study was achieved by R software (version 4.2.3). The "TwoSampleMR" and "MR-PRESSO" packages were utilized for MR analysis. The results of the MR analysis were reported as odds ratios (ORs) with their corresponding 95% confidence intervals (CIs). One exposure factor (BMR) and 10 outcome variables (pregnancy complications) were analyzed using MR. To control the risk of false positives due to multiple comparisons, the Bonferroni correction method was applied to adjust the significance level. The corrected significance threshold was set to P<0.005 (0.05/10).If the P-value is lower than this threshold, the result is considered to be statistically significant. For results with P-values between 0.005 and 0.05, it is considered that they may indicate potential statistical correlation, and need to be carefully explained.
3. Results
3.1. Selected Instrumental Variables
After multiple rounds of screening, a total of 546 SNPs significantly associated with BMR were identified from GWAS dataset. The F-statistics of these SNPs exceeded 10, with an average value of 80.13 (Table S1). Subsequently, ambiguous and palindromic SNPs were eliminated, resulting in 523 SNPs retained for MR (Table S2). In the reverse MR analysis, 15 SNPs associated with spontaneous abortion, 14 SNPs associated with HG, and 8 SNPs associated with preeclampsia or eclampsia were identified from the corresponding GWAS datasets. The F-statistics of all selected SNPs were greater than 10, indicating that IVs don’t have weak instrumental variable bias (Table S5).
3.2. Causal Effect of BMR on Pregnancy Complications
The results of MR examining the effect of BMR on pregnancy complications are presented in Figure 2 and Table S3. The IVW revealed that genetically predicted higher BMR was significantly associated with an increased risk of HDP (OR = 1.263, 95% CI 1.096–1.456, P=0.001), preeclampsia and eclampsia (OR = 1.234, 95% CI 1.027–1.482, P=0.025), and post-term pregnancy (OR = 1.449, 95% CI 1.125–1.866, P=0.004). On the contrary, higher BMR was negatively correlated with HG (OR = 0.667, 95% CI 0.484–0.918,P=0.013), preterm birth (OR = 0.782, 95% CI 0.668–0.914,P=0.002), and dystocia due to pelvic stenosis (OR = 0.392, 95% CI 0.315–0.448,P=4.93E − 17). However, no significant evidence was found to support associations between higher BMR and spontaneous abortion (OR = 0.991, 95% CI 0.880–1.116, P=0.877), gestational diabetes mellitus (GDM) (OR = 1.063, 95% CI 0.892–1.266,P=0.495), premature rupture of membranes (OR = 1.085, 95% CI 0.881–1.336,P=0.443), or dystocia due to abnormal fetal position (OR = 0.873, 95% CI 0.720–1.056, P=0.169). The results of other supplementary methods (such as weighted median method, Mr egger regression method, etc.) were consistent with the IVW, validating the robustness and accuracy of the MR findings. Figure 3 shows scatter plots for significant results, while Figure S1 presents scatter plots for non-significant results.
In the MR-Egger intercept test, we did not observe significant horizontal pleiotropy in the MR results (Figure 2). However, Cochran’s Q test indicated heterogeneity in some MR results, for which we employed the IVW with a random-effects model, so the heterogeneity was within the acceptable range. The MR-Egger funnel plot (Figure S2) shows a symmetrical distribution, supporting the robustness of the results. We further applied MR-PRESSO to identify outlier SNPs and obtain corrected p-values (Table S4). In addition, leave-one-out sensitivity analysis revealed that the elimination of any SNP did not significantly affect the estimation of the causal effect of BMR on pregnancy complications, suggesting that the research results were not overly driven by a single SNP (Supplementary Material).
3.3. Causal Effect of Pregnancy Complications on BMR
In the reverse MR analysis, the IVW with a random-effects model was employed as the primary analytical approach. As illustrated in Figure 4 and Table S6, the results indicate no significant association between genetically predicted pregnancy complications and BMR. HG(OR = 1.002, 95% CI 0.998–1.007, P=0.329), preeclampsia and eclampsia (OR = 0.993, 95% CI 0.983–1.002, P=0.130), HDP (OR = 0.999, 95% CI 0.978–1.021, P=0.952), dystocia due to pelvic narrowing (OR = 0.994, 95% CI 0.987–1.002, P=0.123), and post-term pregnancy (OR = 0.997, 95% CI 0.991–1.003,P=0.370) showed no significant relationship with BMR. Although the association between preterm birth and BMR was statistically significant (OR = 0.985, 95% CI 0.973–0.997, P=0.017), the OR of 0.98 suggests that the actual effect was very weak, which may lack clinical or practical significance. The results of other supplementary methods supporting this conclusion. Even when some MR results achieved statistical significance, their practical significance may be limited due to OR values close to 1. Although heterogeneity was observed in some reverse MR results, the degree is acceptable. The MR-Egger intercept test did not detect significant pleiotropy(Table S7).
3.4. Confounding Factors
To control the influence of potential confounding factors, we searched for and identified IVs related to confounding factors in the Ensembl database. The detailed information of excluded SNPs is shown in Table S8. After removing these SNPs, we further conducted MR analysis (Table S9). The results demonstrated that after adjusting for any confounding factors, BMR still maintained a significant causal relationship with HG, HDP, and dystocia due to pelvic stenosis. However, after adjusting for BMI, the association between BMR and preeclampsia (OR = 1.161, 95% CI 0.942 – 1.31, P = 0.162) and preterm birth (OR = 0.871, 95% CI 0.731 – 1.038, P = 0.122) was no longer significant. After adjusting for body fat percentage, the correlation between BMR and preeclampsia was no longer significant (OR = 1.180, 95% CI 0.976 – 1.426, P = 0.088). Additionally, after adjusting for type 2 diabetes, the correlation between BMR and preeclampsia was not significant (OR = 1.171, 95% CI 0.966 – 1.419, P = 0.109). After adjusting for height, BMR was no longer significantly associated with premature birth (OR = 0.839, 95% CI 0.692 – 1.018, P = 0.075) and postterm pregnancy (OR = 1.352, 95% CI 0.993 – 1.841, P = 0.055). The sensitivity analysis results are detailed in Table S10. It should be noted that the results may be biased due to the exclusion of more SNPs in the analysis process.
3.5. Multivariable Mendelian Randomization
To validate the direct causal relationship between BMR and pregnancy complications,MVMR was conducted by adjusting for five potential confounding factors (BMI, body fat rate, triglyceride level, type 2 diabetes mellitus, and female height). The MVMR - IVW results indicated (Table S11) that after adjusting for any confounding factors, there were still significant causal associations between BMR and HDP, preterm birth, and dystocia due to pelvic stenosis. Nevertheless, after adjusting for BMI, BMR was not correlated with HG (OR = 0.87, 95% CI 0.57 – 1.33, P = 0.532) and preeclampsia or eclampsia (OR = 1.22, 95% CI 0.96 – 1.56, P = 0.103). After adjusting for triglyceride levels, the causal effects of BMR on HG (OR = 0.74, 95% CI 0.50 – 0.98, P = 0.087) and preeclampsia or eclampsia (OR = 1.20, 95% CI 0.97 – 1.48, P = 0.087) were no longer significant. Moreover,after adjusting for type 2 diabetes, BMR was not significantly associated with preeclampsia or eclampsia (OR = 1.15, 95% CI 0.95 – 1.40, P = 0.149). After adjusting for female height, the correlation between BMR and HG (OR = 0.69, 95% CI 0.43 – 1.10, P = 0.116) and post-term pregnancy (OR = 1.33, 95% CI 0.93 – 1.92, P = 0.122) was no longer significant. The MVMR - Egger regression results were consistent with the MVMR - IVW results, further confirming that the causal effect between BMR and HDP, preterm birth, and dystocia caused by pelvic stenosis was independent of the aforementioned confounding factors.
4. Discussion
In this two-sample MR analysis, we uncovered a significant causal effect between BMR and pregnancy complications. The findings indicated that A higher BMR was positively associated with HDP, preeclampsia and eclampsia, and post-term pregnancy. On the contrary, lower BMR was significantly correlated with preterm birth, HG and dystocia due to pelvic stenosis. Through MVMR analysis, we confirmed that the association between BMR and HDP, preterm birth, and dystocia due to pelvic stenosis was independent of potential confounding factors. In the reverse MR analysis, no significant causal effect of pregnancy complications on BMR was detected. This study initially proposed that BMR might play a crucial role in the occurrence and progression of pregnancy complications, and demonstrated the clinical significance of BMR in the domain of pregnancy health.
BMR might increase the risk of HDP, preeclampsia, and eclampsia. This finding is consistent with previous studies. A cross-sectional study in Bangladesh demonstrated that BMR was positively correlated with hypertension in non-pregnant adults, and a higher BMR was associated with both systolic and diastolic blood pressure[26]. A study published by King et al. in 2006 pointed out that maternal obesity can result in an increase in metabolic rate, thereby affecting the growth and development of the placenta and fetus, and even causing a series of pregnancy complications[27].But the specific mechanism of high BMR promoting hypertensive disorder complicating pregnancy has not been fully elucidated. One possible explanation is that the increase in BMR might be related to the inflammatory state and immune activation[5]. Luke et al. have suggested that a high BMR might lead to an increase in blood pressure by promoting sympathetic nerve excitation[28]. Additionally, Peng et al. identified five key genes related to energy metabolism in patients with preeclampsia, including corticotropin-releasing hormone (CRH), leptin (LEP), pyruvate dehydrogenase kinase isozyme 4 (PDK4), secretory phosphoprotein 1 (SPP1), and somatostatin (SST)[29]. LEP has been confirmed to be related to BMR in other studies[30]. Another evidence supporting the association between BMR and blood pressure is oxidative stress[31]. Reactive oxygen species (ROS) can stimulate the inflammatory response and endothelial dysfunction, which is part of the pathogeneses of preeclampsia[32].
Many studies have demonstrated that a potential association between BMR and diabetes. Maciak et al. reported that mice with a low BMR were more prone to insulin resistance and diabetes, and the BMR of diabetic mice was significantly higher than that of normal mice[33]. In pregnant women, a low BMR may result in excessive weight gain during pregnancy, which constitutes an independent risk factor for GDM[17]. Taousani et al. proposed that there might be common risk factors between BMR and GDM, indicating a potential connection between the two[35]. However, no significant causal correlation was identified between BMR and GDM, and the impact of GDM on BMR was not significant in our study. This outcome may be related to the control of sample size or confounding factors. Therefore, it is still necessary to investigate the relationship between BMR and GDM through a large-scale cohort study to clarify its potential clinical significance.
A higher BMR was significantly negatively associated with the risk of preterm birth and HG, while it was significantly positively associated with the risk of post-term pregnancy. Although no direct study has reported on the association between BMR and these pregnancy complications, studies have indicated that a low BMI is a risk factor for preterm birth[38], and a high BMI is associated with prolonged pregnancy[37]. Both underweight and obese women are more prone to develop HG than women with a normal weight[36]. To exclude the potential influence of BMI on the study results, we removed SNPs related to BMI and re-performed the MR. The results demonstrated that BMR was still significantly correlated with HG and prolonged pregnancy.Since the proportion of eliminated SNPs is more than 10%, we cannot completely eliminate the possibility of bias; thus, we employed MVMR. After adjusting for confounding factors, the correlation between BMR and preterm birth and prolonged pregnancy remained significant. Height is one of the crucial determinants of the female pelvic size[39]. After excluding height-related confounding SNPs and other confounding factors, a lower BMR was confirmed to be an independent risk factor for dystocia due to pelvic stenosis.These findings provide novel evidence for the potential role of BMR in pregnancy complications and emphasize the significance of controlling confounding factors in causal inference.
BMR plays a crucial role in maintaining energy balance. Bioenergy imbalance may have a broad range of impacts on the body's multiple system functions[5]. Moreover, BMR can offer scientific guidance for the daily energy intake of normal people. BMR is influenced by many factors and can be modulated through human intervention, such as increasing physical activity or muscle mass. For pregnant women, maintaining the balance of BMR may contribute to enhancing the pregnancy outcome. Ribeiro's review indicated that moderate exercise can significantly improve pregnancy outcomes[40]. For non-pregnant adults, there are specific and feasible formulas for the calculation of BMR, like the Harris Benedict formula, and its normal range is typically defined as within ± 15% of the calculated value[41]. However, it is unclear whether these formulas and ranges are applicable to pregnant women. Calculating the energy demand during pregnancy is challenging. Durnin et al. demonstrated that BMR increased significantly during pregnancy, and no additional energy intake was necessary in the first trimester, while only 100 - 150 kcal/d was required in the second and third trimesters[9]. But Fosum et al. pointed out that insufficient energy intake during pregnancy is prevalent[42]. It is not clear whether BMR can effectively guide the daily energy intake of pregnant women. Therefore, the assessment of maternal BMR and its influence on pregnancy outcomes still requires further investigation.
This study has the following limitations: Firstly, the research objectives are primarily derived from the European population and have not been validated in other ethnicities or populations. Thus, the potential impact of population heterogeneity on the results cannot be excluded. Secondly, although we have controlled the confounding factors as much as possible through MVMR, the possible bias of residual confounding on the results cannot be entirely eliminated due to many factors affecting BMR. Finally, this study is mainly based on the statistical analysis of genetic data. Although MR has advantages in causal inference, it still requires further verification through large-scale randomized controlled trials (RCTs).
5. Conclusions
This study offers significant evidence for the causal association between BMR and pregnancy complications. A higher BMR was positively associated with the risks of gestational hypertension, preeclampsia, and eclampsia, as well as postterm pregnancy; A lower BMR was significantly correlated with hyperemesis gravidarum, preterm birth, and dystocia due to pelvic stenosis. These findings imply that maintaining the balance of BMR might help to improve pregnancy outcomes and provide a new basis for health management during pregnancy.
Supplementary Materials
The following supporting information can be downloaded at the website of this paper posted on Preprints.org. Figure S1:Scatter plots for the non-significant causal association between BMR and pregnancy complications.; Figure S2: Figure S2.Funnel plot for for the significant causal association between BMR and pregnancy complications.Table S1: Information on genetic instrumental variables related to basal metabolic rate; Table S2:Instrumental variables used for the association between BMR and pregnancy complications in MR analysis; Table S3:MR estimates for the associations of the traits related to basal metabolic rate with pregnancy complications; Table S4:Sensitivity analysis for the MR analysis of BMR with Pregnancy complications; Table S5:Instrumental variables used for the association between pregnancy complications and BMR in reverse MR analysis; Table S6:Reverse MR estimates for the associations of the traits related to pregnancy complications with BMR; Table S7:Sensitivity analysis for the reverse MR analysis of Pregnancy complications with BMR; Table S8:SNPs related to confounding factors found in ensemble database; Table S9:The MR results of BMR with Pregnancy complications after removing SNPs related to confounding factors; Table S10:Sensitivity analysis for the MR analysis of BMR with Pregnancy complications after removing SNPs related to confounding factors; Table S11:The MVMR results of BMR with Pregnancy complications after adjusted for confounding factors; Supplementary Material 1:Forest plots for sensitivity analysis with leave-one-out method.
Author Contributions
Conceptualization, S.L. and D.X.; methodology, S.L.; software, S.L.; validation, S.L.; formal analysis, S.L.; investigation, D.X.; resources, DX.; data curation, D.X.; writing—original draft preparation, S.L.; writing—review and editing, X.Q.; visualization, X.Q.; supervision, X.Q.; project administration, H.W.; funding acquisition, H.W. All authors have read and agreed to the published version of the manuscript.
Funding
This research was funded by Application Foundation Project of Changzhou Science and Technology Bureau, grant number CJ20220117.
Data Availability Statement
The original contributions presented in the study are included in the article/Supplementary Material, further inquiries can be directed to the corresponding author.
Acknowledgments
The investigators thank Huiyan Wang, Prof. for her assistance in the preparation and review of themanuscript.
Conflicts of Interest
The authors declare no conflicts of interest.
Abbreviations
The following abbreviations are used in this manuscript:
| BMR | Basal Metabolic Rate |
| MR | Mendelian Randomization |
| GWAS | Genome-Wide Association Atudies |
| MVMR | Multivariate Mendelian randomization |
| HG | Hyperemesis Gravidarum |
| PE | Preeclampsia |
| TEF | Thermic Effect of Food |
| GDM | Gestational Diabetes Mellitus |
| HDP | Hypertensive Disorders of Pregnancy |
| SNP | Single Nucleotide Polymorphisms |
| IV | Instrumental Variable |
| BMI | Body Mass Index |
| IVW | Inverse Variance Weighting |
| MR-PRESSO | MR Pleiotropy Residual Sum and Outlier |
| OR | Odds Ratio |
| CI | Confidence Interval |
References
- Shetty, P. Energy requirements of adults. Public Health Nutr. 2005;8(7A):994-1009. [CrossRef]
- Johnstone AM, Murison SD, Duncan JS, Rance KA, Speakman JR. Factors influencing variation in basal metabolic rate include fat-free mass, fat mass, age, and circulating thyroxine but not sex, circulating leptin, or triiodothyronine. Am J Clin Nutr. 2005;82(5):941-948. [CrossRef]
- Kim, B. Thyroid hormone as a determinant of energy expenditure and the basal metabolic rate. Thyroid. 2008;18(2):141-144. [CrossRef]
- Ng JCM, Schooling CM. Effect of basal metabolic rate on lifespan: a sex-specific Mendelian randomization study. Sci Rep. 2023;13(1):7761. Published 2023 May 12. [CrossRef]
- Zhao P, Han F, Liang X, et al. Causal Effects of Basal Metabolic Rate on Cardiovascular Disease: A Bidirectional Mendelian Randomization Study. J Am Heart Assoc. 2024;13(1):e031447. [CrossRef]
- Han F, Hu F, Wang T, et al. Association Between Basal Metabolic Rate and All-Cause Mortality in a Prospective Cohort of Southern Chinese Adults. Front Physiol. 2022;12:790347. Published 2022 Jan 4. [CrossRef]
- Wang Q, Richardson TG, Sanderson E, et al. A phenome-wide bidirectional Mendelian randomization analysis of atrial fibrillation. Int J Epidemiol. 2022;51(4):1153-1166. [CrossRef]
- Most J, Dervis S, Haman F, Adamo KB, Redman LM. Energy Intake Requirements in Pregnancy. Nutrients. 2019;11(8):1812. Published 2019 Aug 6. [CrossRef]
- Durnin, JV. Energy requirements of pregnancy. Diabetes. 1991;40 Suppl 2:152-156. [CrossRef]
- Dinu M, Napoletano A, Giangrandi I, et al. Exploring basal metabolic rate and dietary adequacy in twin pregnancies: the VENERE study. Nutr Metab (Lond). 2024;21(1):99. Published 2024 Dec 2. [CrossRef]
- Chihara H, Otsubo Y, Yoneyama Y, et al. Basal metabolic rate in hyperemesis gravidarum: comparison to normal pregnancy and response to treatment. Am J Obstet Gynecol. 2003;188(2):434-438. [CrossRef]
- Martin A, O'Sullivan AJ, Brown MA. Body composition and energy metabolism in normotensive and hypertensive pregnancy. BJOG. 2001;108(12):1263-1271. [CrossRef]
- Adane AA, Tooth LR, Mishra GD. Pre-pregnancy weight change and incidence of gestational diabetes mellitus: A finding from a prospective cohort study. Diabetes Res Clin Pract. 2017;124:72-80. [CrossRef]
- Richmond RC, Davey Smith G. Mendelian Randomization: Concepts and Scope. Cold Spring Harb Perspect Med. 2022;12(1):a040501. Published 2022 Jan 4. [CrossRef]
- Henry, CJ. Basal metabolic rate studies in humans: measurement and development of new equations. Public Health Nutr. 2005;8(7A):1133-1152. [CrossRef]
- Burgess S, Thompson SG. Bias in causal estimates from Mendelian randomization studies with weak instruments. Stat Med. 2011;30(11):1312-1323. [CrossRef]
- Bowden J, Del Greco M F, Minelli C, Davey Smith G, Sheehan N, Thompson J. A framework for the investigation of pleiotropy in two-sample summary data Mendelian randomization. Stat Med. 2017;36(11):1783-1802. [CrossRef]
- Burgess S, Dudbridge F, Thompson SG. Combining information on multiple instrumental variables in Mendelian randomization: comparison of allele score and summarized data methods. Stat Med. 2016;35(11):1880-1906. [CrossRef]
- Bowden J, Davey Smith G, Burgess S. Mendelian randomization with invalid instruments: effect estimation and bias detection through Egger regression. Int J Epidemiol. 2015;44(2):512-525. [CrossRef]
- Bowden J, Davey Smith G, Haycock PC, Burgess S. Consistent Estimation in Mendelian Randomization with Some Invalid Instruments Using a Weighted Median Estimator. Genet Epidemiol. 2016;40(4):304-314. [CrossRef]
- Burgess S, Thompson SG. Multivariable Mendelian randomization: the use of pleiotropic genetic variants to estimate causal effects. Am J Epidemiol. 2015;181(4):251-260. [CrossRef]
- Randall JC, Winkler TW, Kutalik Z, et al. Sex-stratified genome-wide association studies including 270,000 individuals show sexual dimorphism in genetic loci for anthropometric traits. PLoS Genet. 2013;9(6):e1003500. [CrossRef]
- Richardson TG, Sanderson E, Palmer TM, et al. Evaluating the relationship between circulating lipoprotein lipids and apolipoproteins with risk of coronary heart disease: A multivariable Mendelian randomisation analysis. PLoS Med. 2020;17(3):e1003062. Published 2020 Mar 23. [CrossRef]
- McCartney DL, Min JL, Richmond RC, et al. Genome-wide association studies identify 137 genetic loci for DNA methylation biomarkers of aging. Genome Biol. 2021;22(1):194. Published 2021 Jun 29. [CrossRef]
- Randall JC, Winkler TW, Kutalik Z, et al. Sex-stratified genome-wide association studies including 270,000 individuals show sexual dimorphism in genetic loci for anthropometric traits. PLoS Genet. 2013;9(6):e1003500. [CrossRef]
- Ali N, Mahmood S, Manirujjaman M, et al. Hypertension prevalence and influence of basal metabolic rate on blood pressure among adult students in Bangladesh [published correction appears in BMC Public Health. 2017 Sep 22;17(1):736. 10.1186/s12889-017-4709-6.]. BMC Public Health. 2017;18(1):58. Published 2017 Jul 25. [CrossRef]
- King, JC. Maternal obesity, metabolism, and pregnancy outcomes. Annu Rev Nutr. 2006;26:271-291. [CrossRef]
- Luke A, Adeyemo A, Kramer H, Forrester T, Cooper RS. Association between blood pressure and resting energy expenditure independent of body size. Hypertension. 2004;43(3):555-560. [CrossRef]
- Li R, Zhou C, Ye K, Chen H, Peng M. Identification of genes involved in energy metabolism in preeclampsia and discovery of early biomarkers. Front Immunol. 2025;16:1496046. Published 2025 Feb 4. [CrossRef]
- Polito A, Fabbri A, Ferro-Luzzi A, et al. Basal metabolic rate in anorexia nervosa: relation to body composition and leptin concentrations. Am J Clin Nutr. 2000;71(6):1495-1502. [CrossRef]
- Snodgrass JJ, Leonard WR, Sorensen MV, Tarskaia LA, Mosher MJ. The influence of basal metabolic rate on blood pressure among indigenous Siberians. Am J Phys Anthropol. 2008;137(2):145-155. [CrossRef]
- Jena MK, Sharma NR, Petitt M, Maulik D, Nayak NR. Pathogenesis of Preeclampsia and Therapeutic Approaches Targeting the Placenta. Biomolecules. 2020;10(6):953. Published 2020 Jun 24. [CrossRef]
- Maciak S, Sawicka D, Sadowska A, et al. Low basal metabolic rate as a risk factor for development of insulin resistance and type 2 diabetes. BMJ Open Diabetes Res Care. 2020;8(1):e001381. [CrossRef]
- Owu DU, Antai AB, Udofia KH, Obembe AO, Obasi KO, Eteng MU. Vitamin C improves basal metabolic rate and lipid profile in alloxan-induced diabetes mellitus in rats. J Biosci. 2006;31(5):575-579. [CrossRef]
- Taousani E, Savvaki D, Tsirou E, et al. Regulation of basal metabolic rate in uncomplicated pregnancy and in gestational diabetes mellitus. Hormones (Athens). 2017;16(3):235-250. [CrossRef]
- Vikanes A, Grjibovski AM, Vangen S, Gunnes N, Samuelsen SO, Magnus P. Maternal body composition, smoking, and hyperemesis gravidarum. Ann Epidemiol. 2010;20(8):592-598. [CrossRef]
- Fang Y, Liu J, Mao Y, et al. Pre-pregnancy body mass index and time to pregnancy among couples pregnant within a year: A China cohort study. PLoS One. 2020;15(4):e0231751. Published 2020 Apr 23. [CrossRef]
- Shachar BZ, Mayo JA, Lee HC, et al. Effects of race/ethnicity and BMI on the association between height and risk for spontaneous preterm birth. Am J Obstet Gynecol. 2015;213(5):700.e1-700.e7009. [CrossRef]
- Awonuga AO, Merhi Z, Awonuga MT, Samuels TA, Waller J, Pring D. Anthropometric measurements in the diagnosis of pelvic size: an analysis of maternal height and shoe size and computed tomography pelvimetric data. Arch Gynecol Obstet. 2007;276(5):523-528. [CrossRef]
- Ribeiro MM, Andrade A, Nunes I. Physical exercise in pregnancy: benefits, risks and prescription. J Perinat Med. 2021;50(1):4-17. Published 2021 Sep 6. [CrossRef]
- Mifflin MD, St Jeor ST, Hill LA, Scott BJ, Daugherty SA, Koh YO. A new predictive equation for resting energy expenditure in healthy individuals. Am J Clin Nutr. 1990;51(2):241-247. [CrossRef]
- Forsum E, Löf M. Energy metabolism during human pregnancy. Annu Rev Nutr. 2007;27:277-292. [CrossRef]
Figure 1.
Study design. IVs:Instrumental variables; SNPs:Single nucleotide polymorphisms.
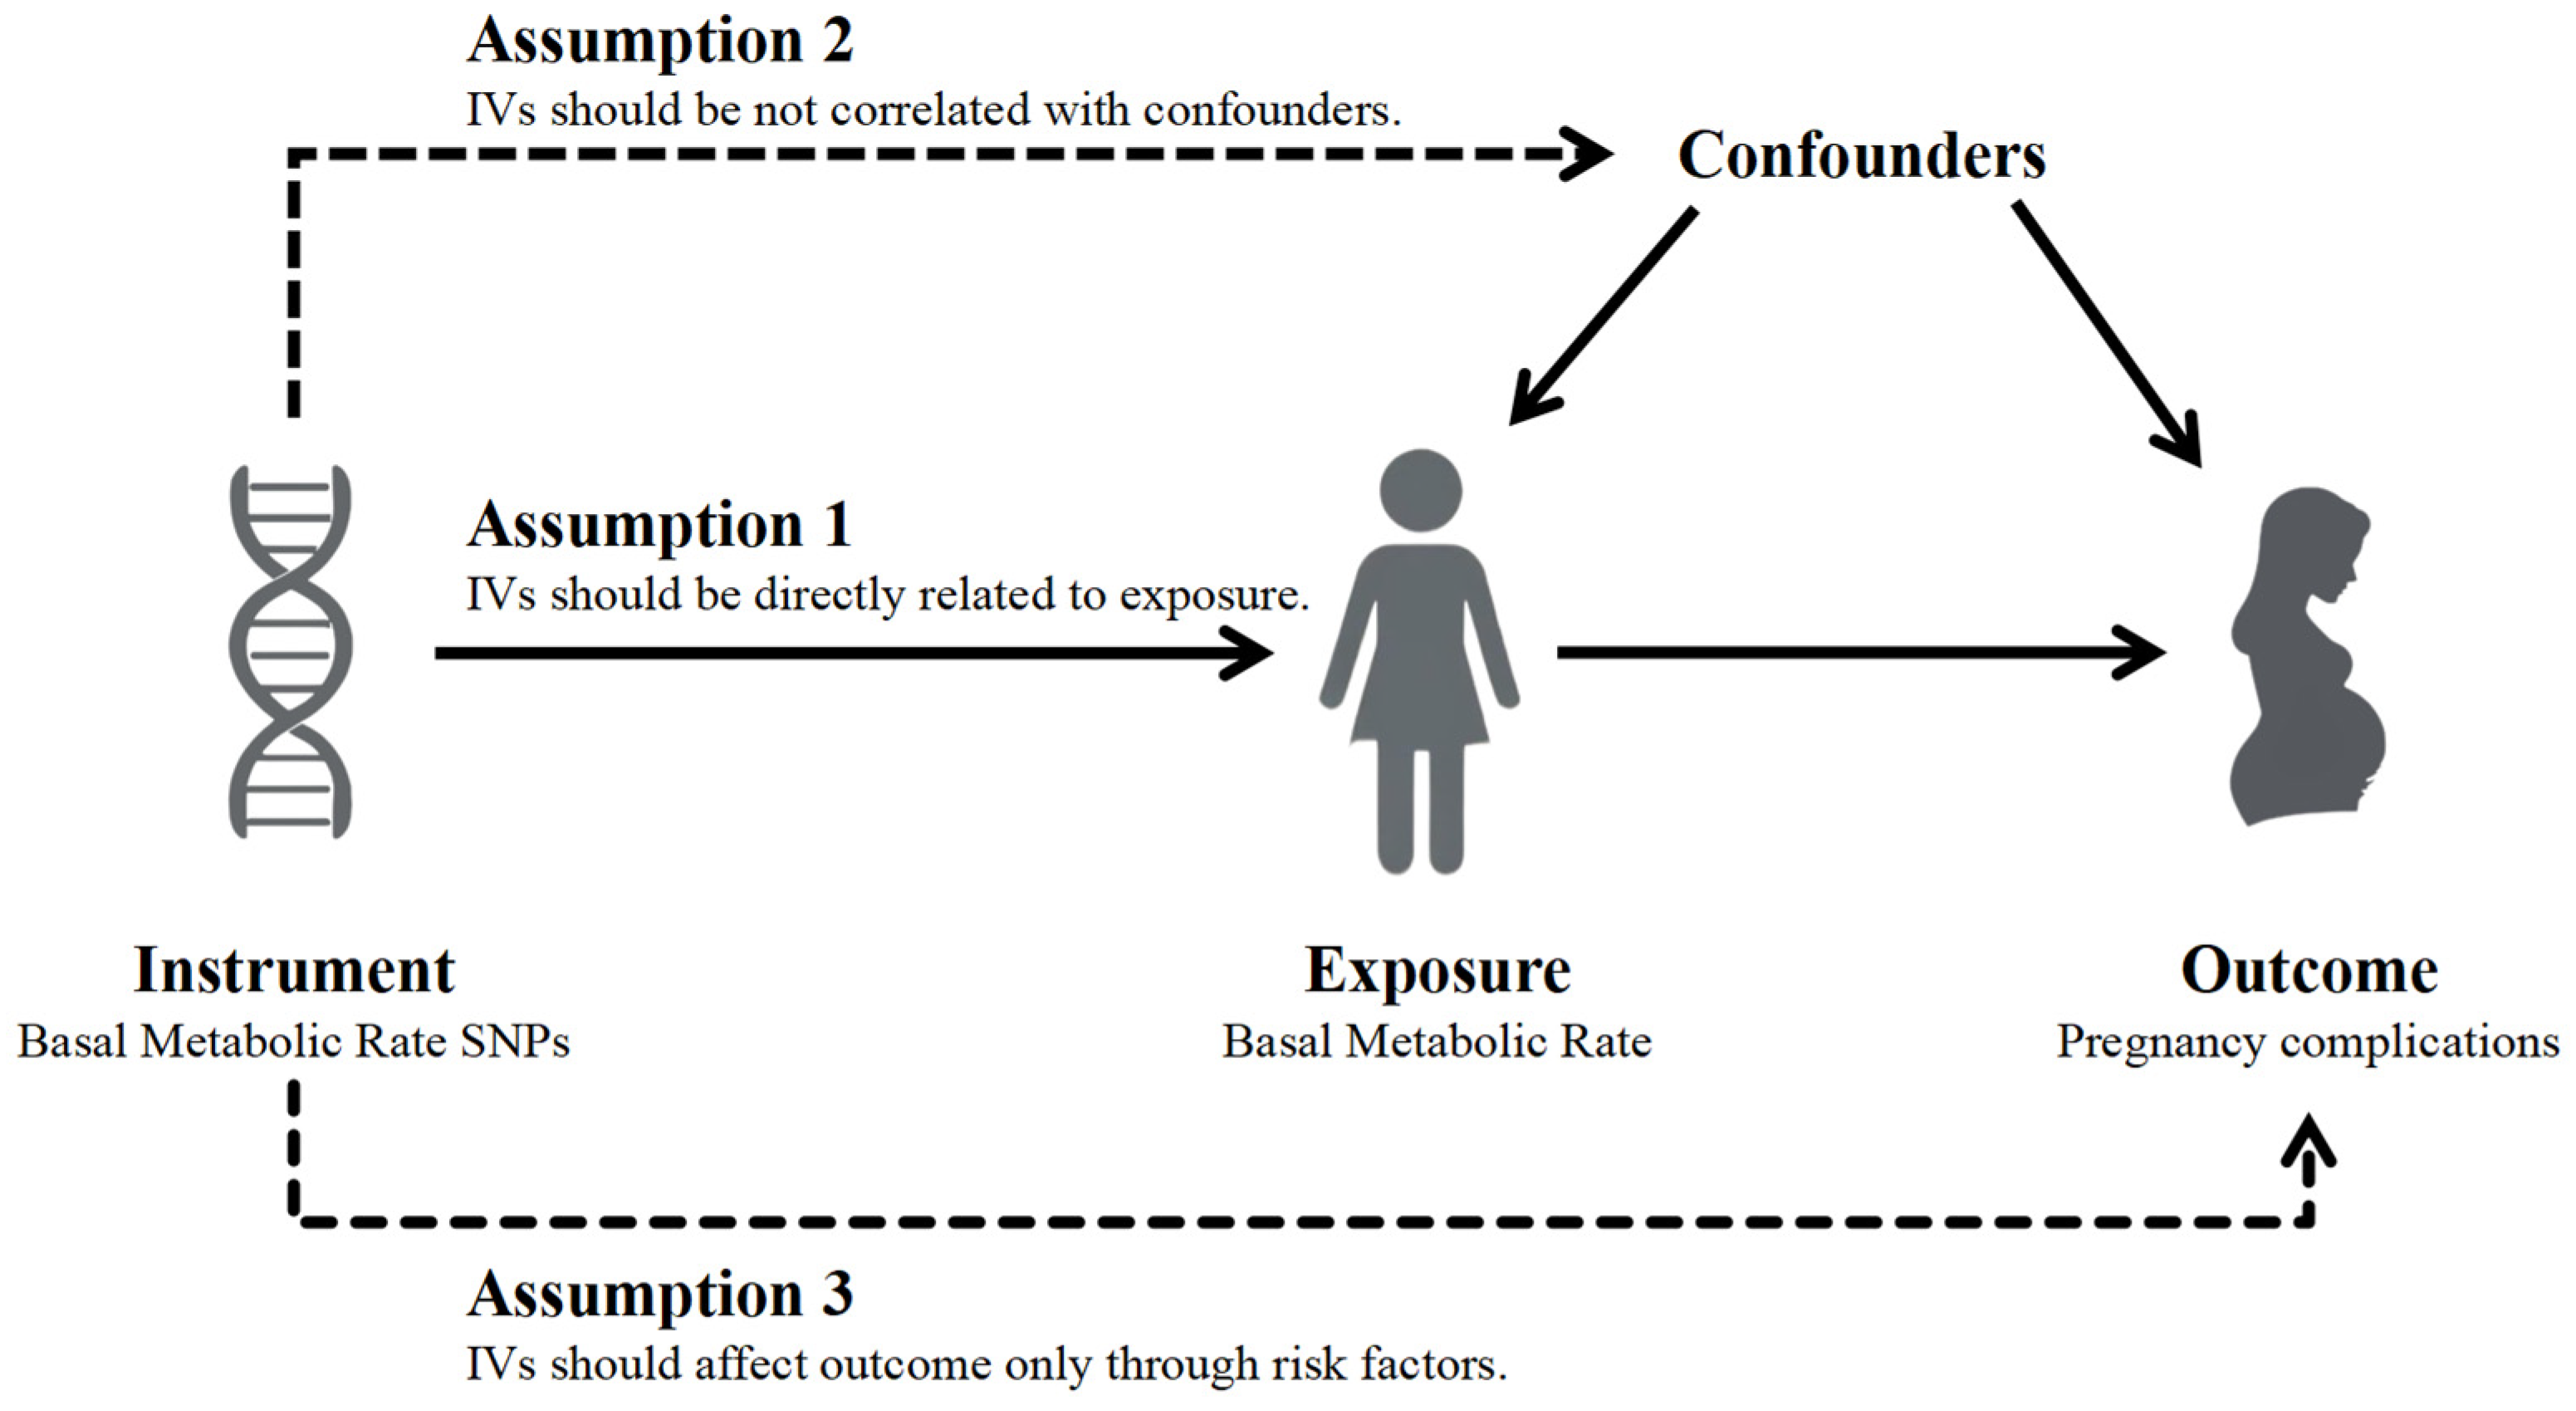
Figure 2.
Forest plot of MR analysis of BMR on pregnancy complications. MR: Mendelian randomization; BMR:basal metabolic rate; OR: Odds ratio; SNP: single-nucleotide polymorphism; CI: Confidence interval.
Figure 2.
Forest plot of MR analysis of BMR on pregnancy complications. MR: Mendelian randomization; BMR:basal metabolic rate; OR: Odds ratio; SNP: single-nucleotide polymorphism; CI: Confidence interval.
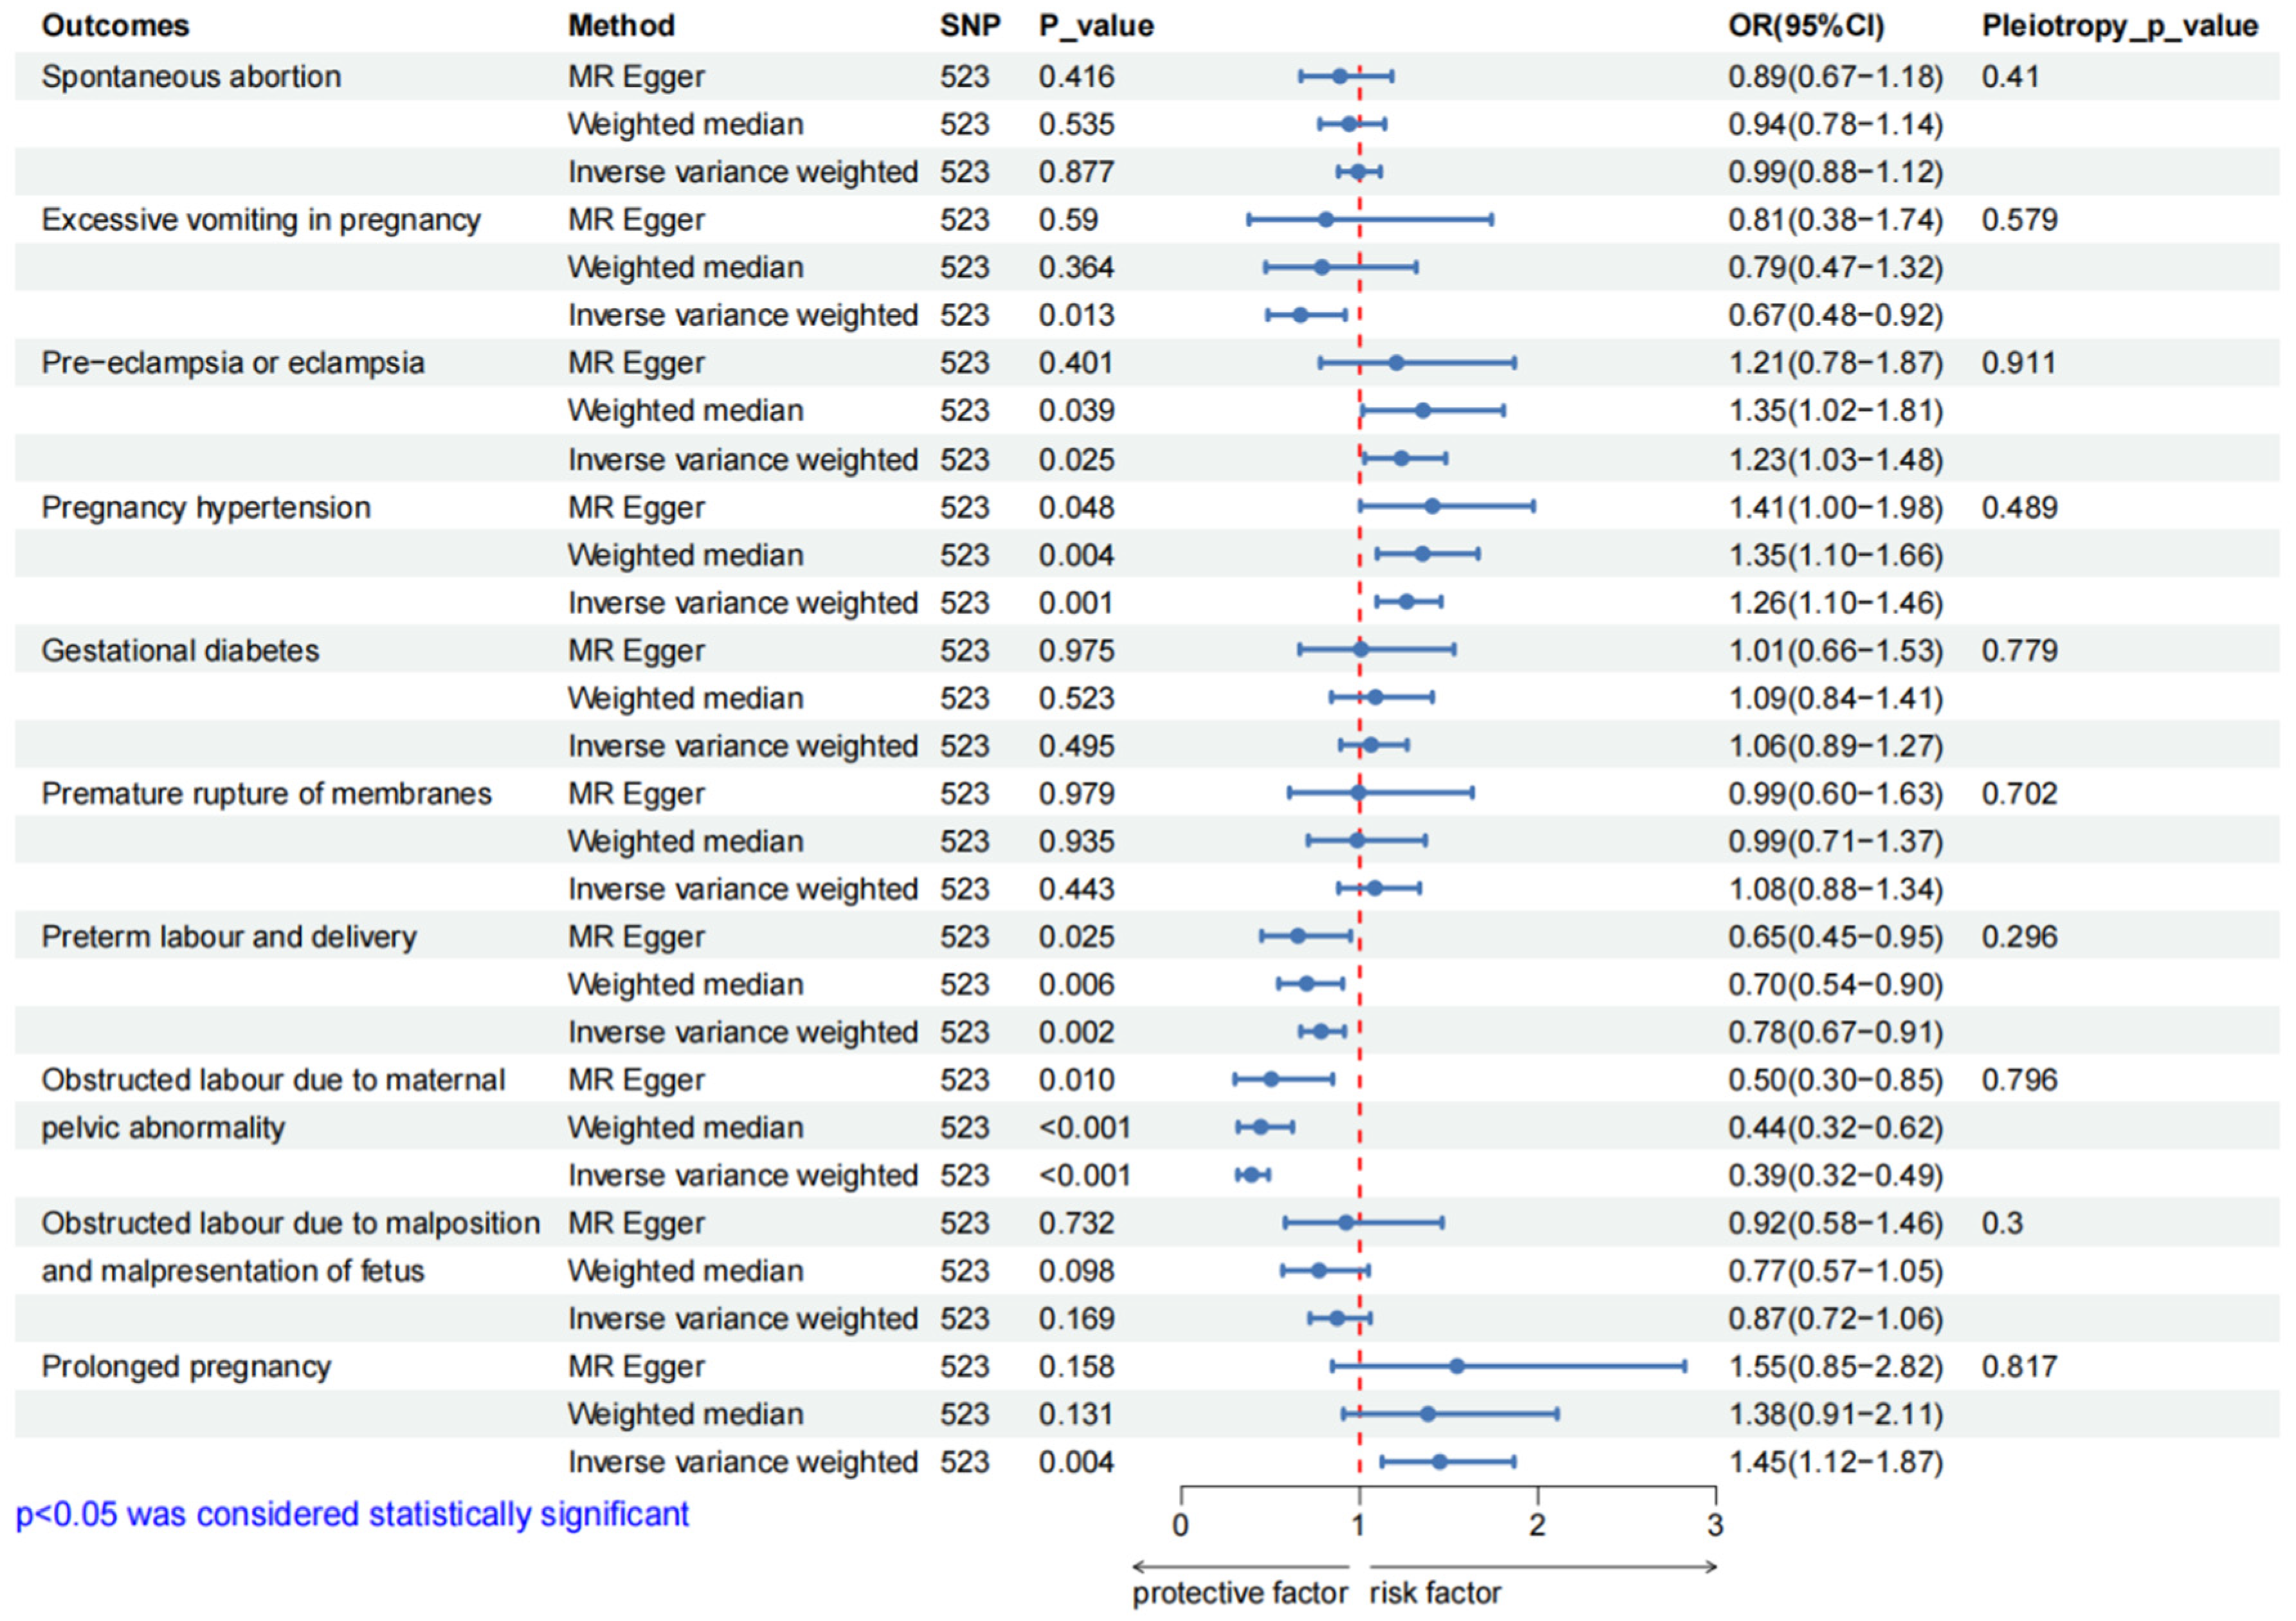
Figure 3.
Scatter plots for the significant causal association between BMR and pregnancy complications.BMR: basal metabolic rate; SNP: single-nucleotide polymorphism.
Figure 3.
Scatter plots for the significant causal association between BMR and pregnancy complications.BMR: basal metabolic rate; SNP: single-nucleotide polymorphism.
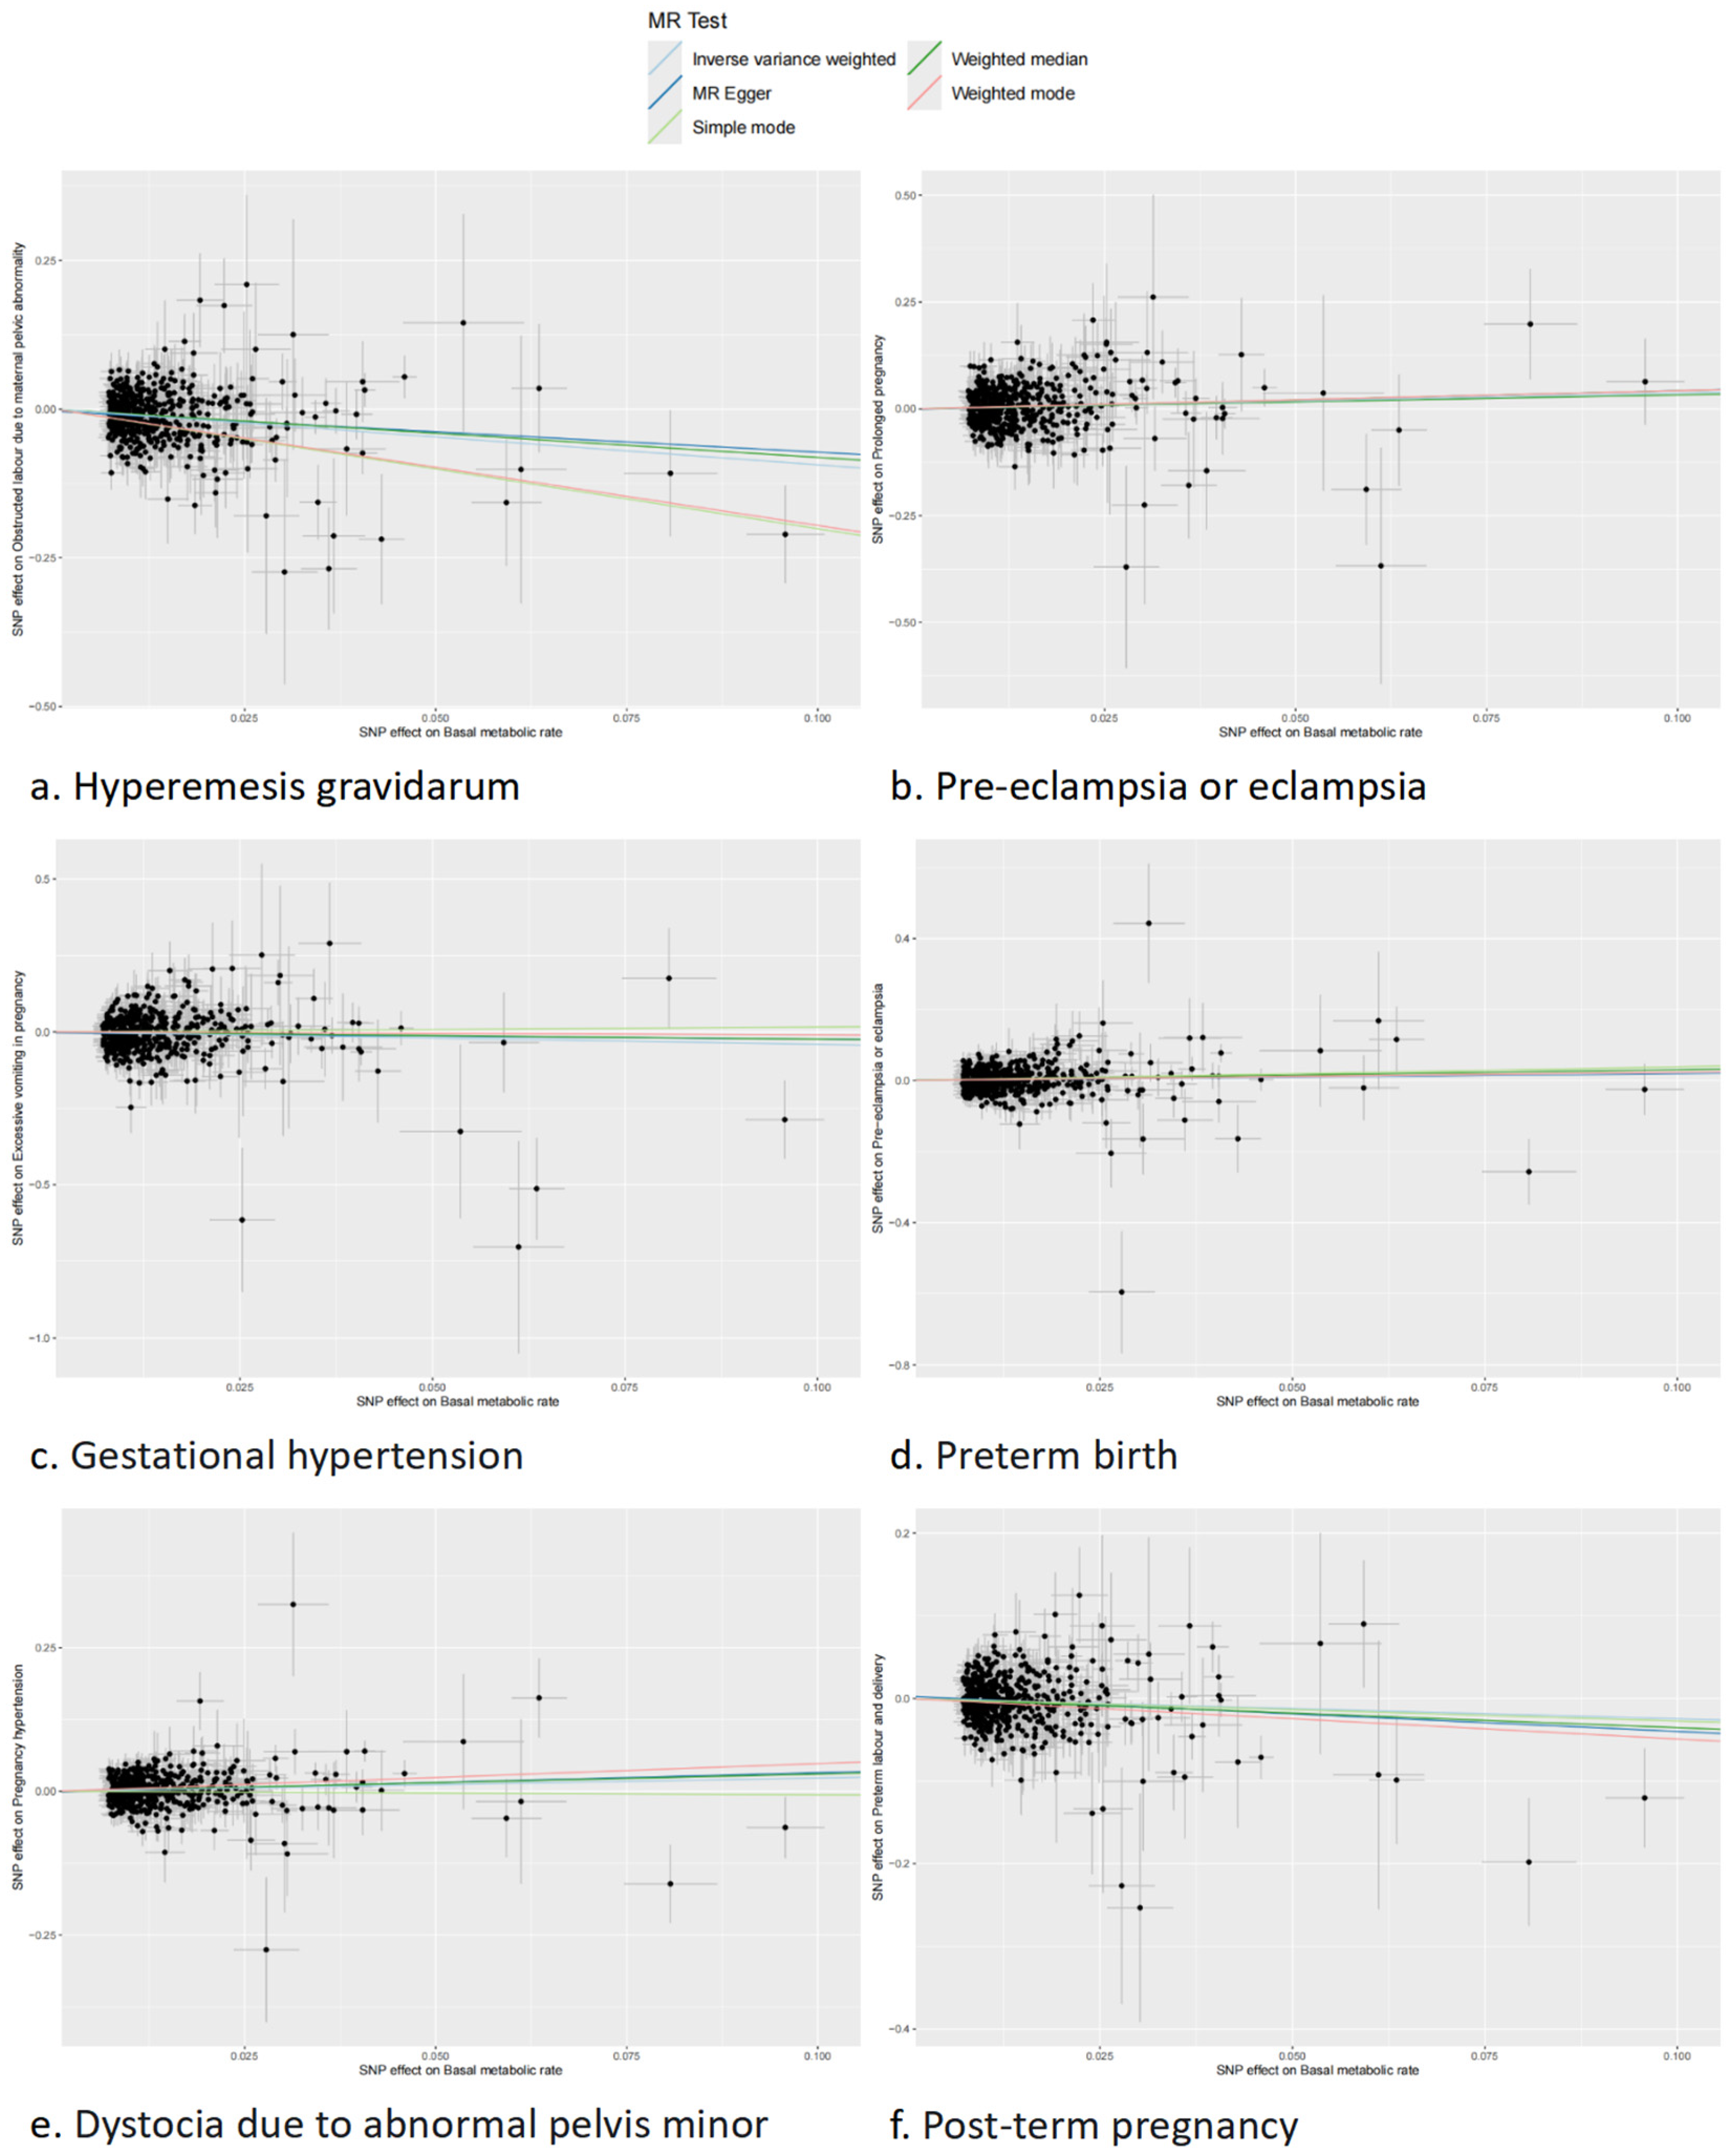
Figure 4.
Forest plot of reverse MR analysis of pregnancy complications on BMR. MR: Mendelian randomization; BMR:basal metabolic rate; OR: Odds ratio; SNP: single-nucleotide polymorphism; CI: Confidence interval.
Figure 4.
Forest plot of reverse MR analysis of pregnancy complications on BMR. MR: Mendelian randomization; BMR:basal metabolic rate; OR: Odds ratio; SNP: single-nucleotide polymorphism; CI: Confidence interval.
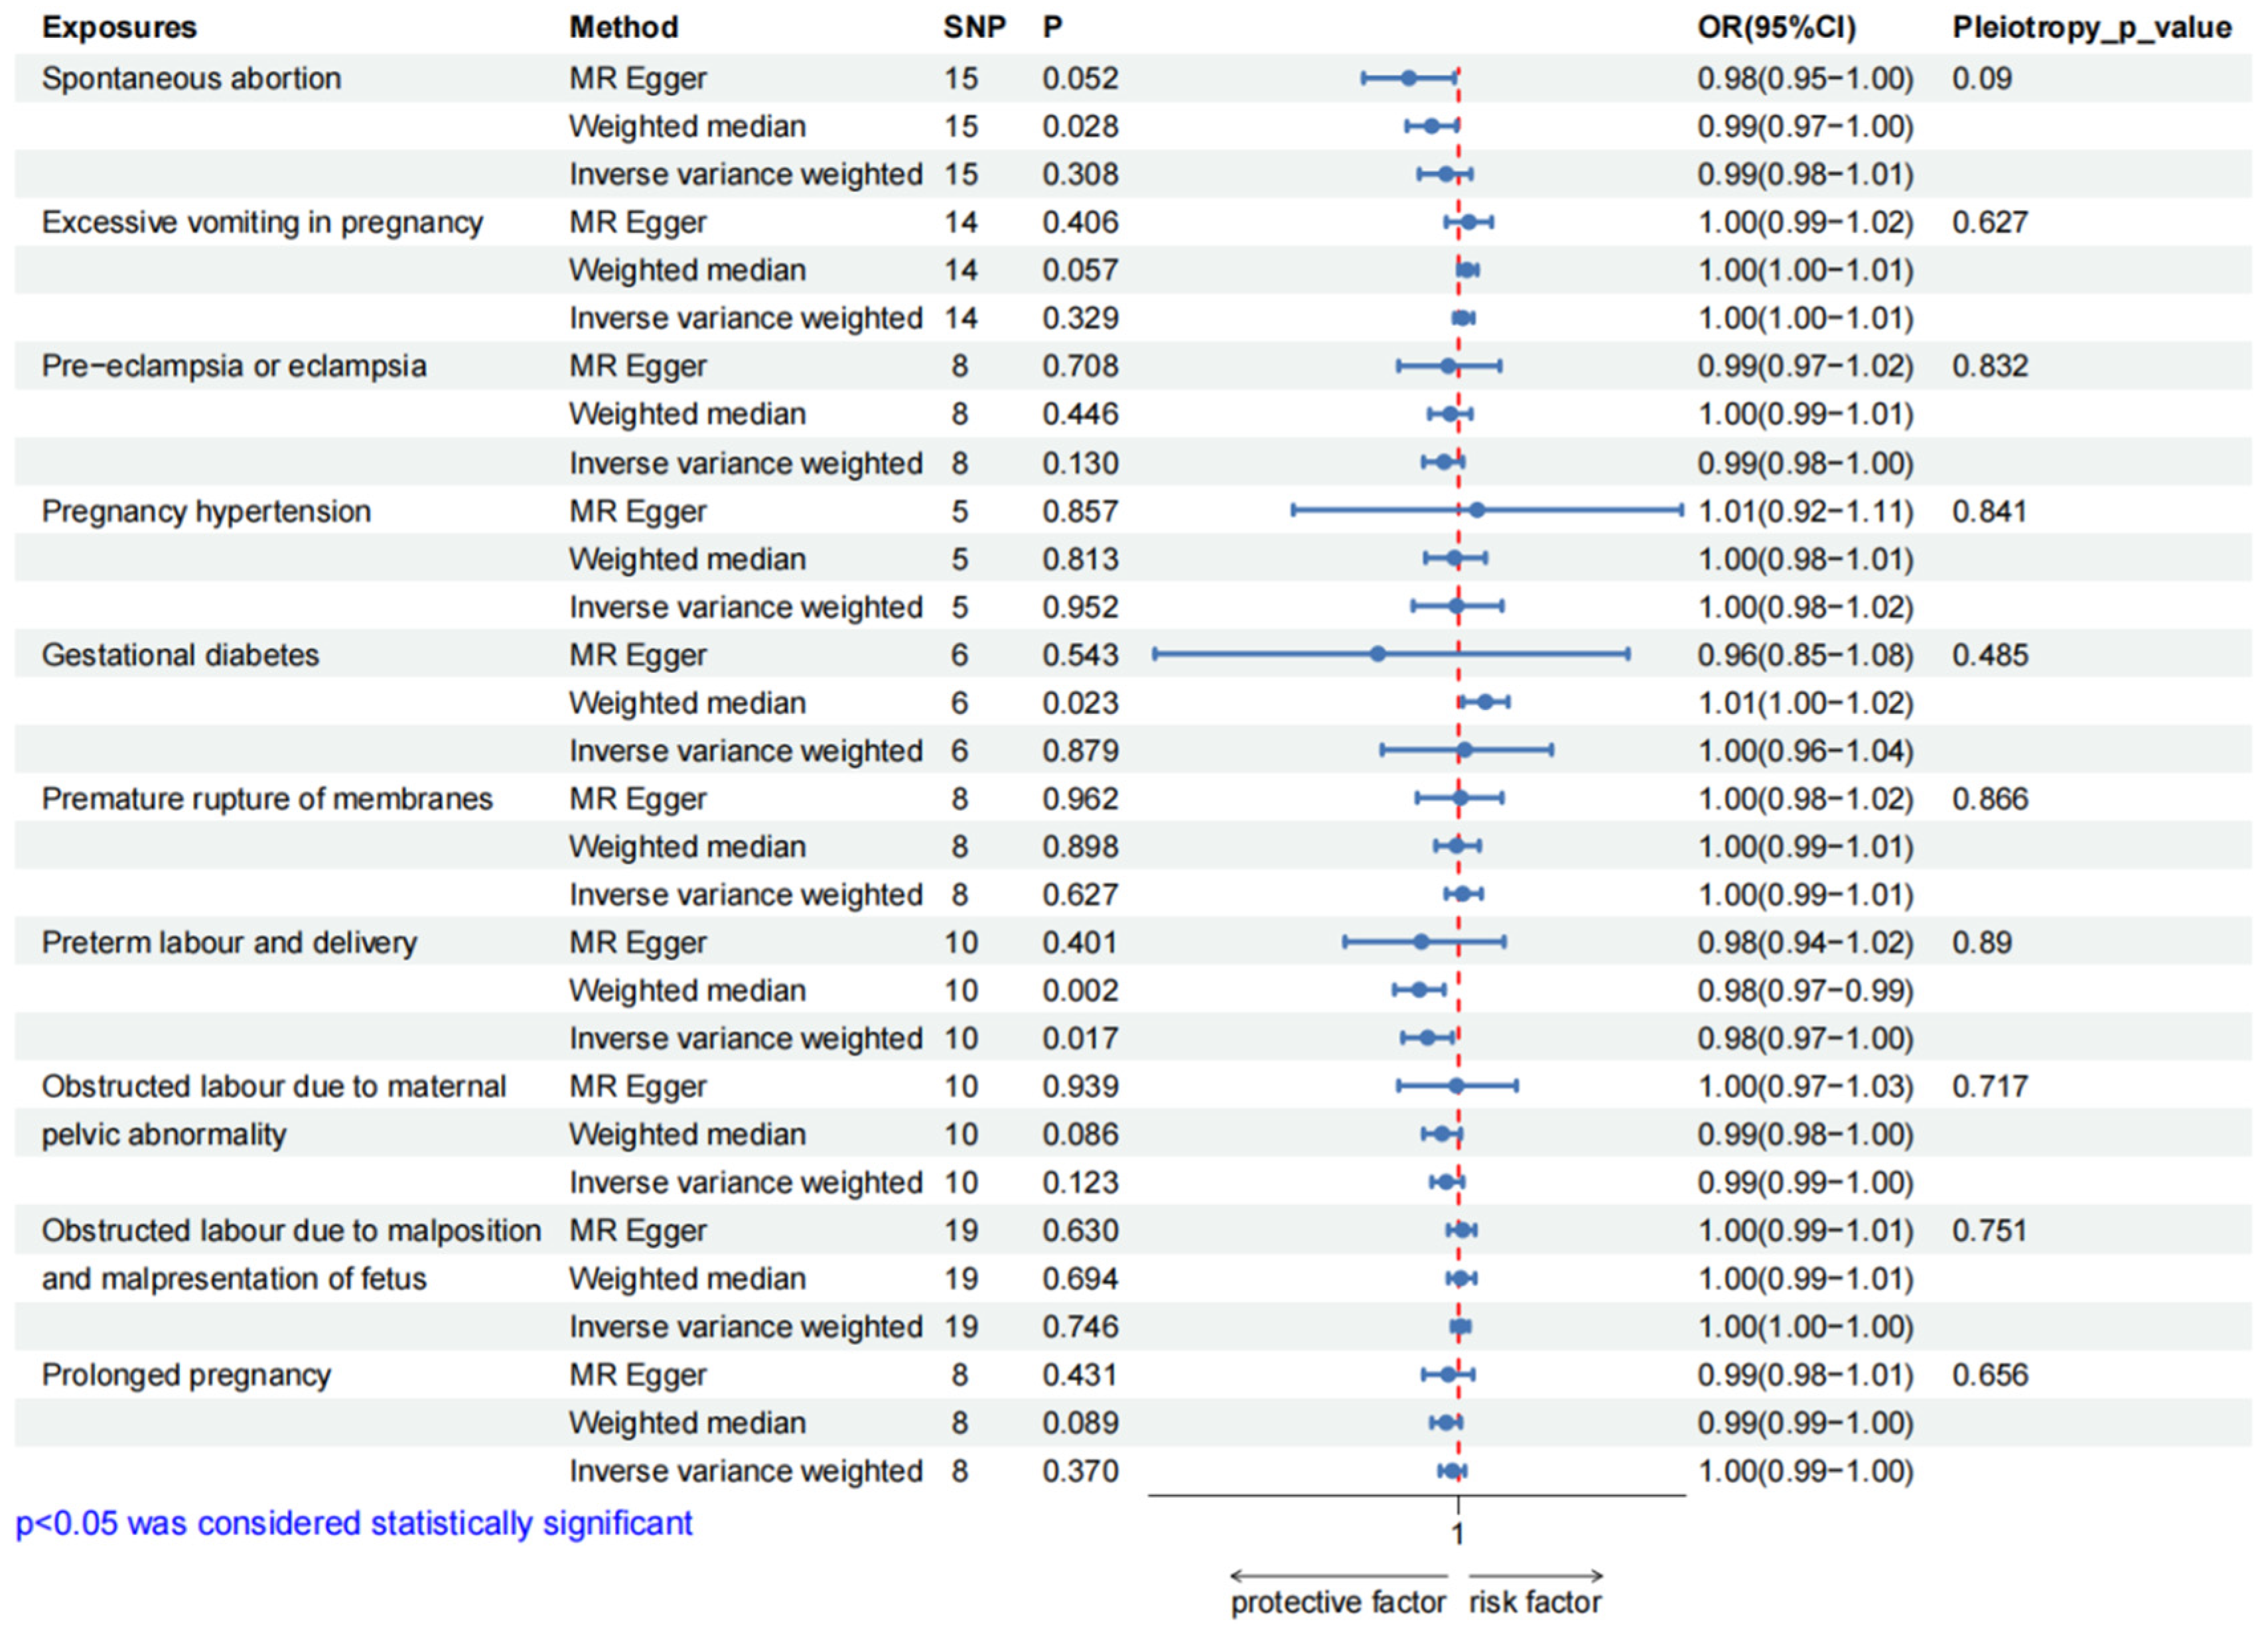

Table 1.
The GWAS dataset information used in present study. .
| Phenotype | GWAS * ID | PMID */ Consortium |
SNPs * | Simple size | Case | Control | |
| Spontaneous abortion | Finngen_R12_O15_ABORT_SPONTAN | FinnGen | 16379138 | 222446 | 23167 | 199279 | |
| Excessive vomiting in pregnancy | Finngen_R12_O15_EXCESS_VOMIT_PREG | FinnGen | 16379549 | 241235 | 3329 | 237906 | |
| Pregnancy complications | Pre-eclampsia or eclampsia | Finngen_R12_O15_PRE_OR_ECLAMPSIA | FinnGen | 16379723 | 268898 | 9717 | 259181 |
| Pregnancy hypertension | Finngen_R12_O15_HYPTENSPREG | FinnGen | 16379784 | 282064 | 20405 | 261659 | |
| Gestational diabetes | Finngen_R12_GEST_DIABETES | FinnGen | 16379784 | 282064 | 18581 | 263483 | |
| Premature rupture of membranes | Finngen_R12_O15_MEMBR_PREMAT_RUPT | FinnGen | 16379429 | 231594 | 10408 | 221186 | |
| Preterm labour and delivery | Finngen_R12_O15_PRETERM | FinnGen | 16379340 | 226330 | 11405 | 214925 | |
| Obstructed labour due to maternal pelvic abnormality | Finngen_R12_O15_LABOUR_PELVIC_ABNORM | FinnGen | 16379297 | 221238 | 6313 | 214925 | |
| Obstructed labour due to malposition and malpresentation of fetus | Finngen_R12_O15_LABOUR_MALPOS | FinnGen | 16379249 | 225409 | 10484 | 214925 | |
| Prolonged pregnancy | Finngen_R12_O15_PREG_PROLONGED | FinnGen | 16379383 | 228235 | 7049 | 221186 | |
| Exposure factor | Basal metabolic rate | ukb-b-16446 | UKB * | 9851867 | 454874 | — | — |
| Confounding factors | Body mass index | ieu-a-94 | GIANT * | 2736876 | 60586 | — | — |
| Body fat percentage | ukb-e-23099_MID | UKB * | 11904531 | 1535 | — | — | |
| Triglycerides | ieu-b-111 | 32203549 | 12321875 | 441016 | — | — | |
| Type 2 diabetes | ebi-a-GCST90018926 | 34187551 | 24167560 | 490089 | 38841 | 451248 | |
| Female height | ieu-a-97 | GIANT * | 2748546 | 73137 | — | — |
* GWAS: genome wide association studies; PMID:PubMed Unique Identifier; GIANT: genetic Investigation of ANthropometric Traits; UKB: UK biobank; SNP: single nucleotide polymorphism.
Disclaimer/Publisher’s Note: The statements, opinions and data contained in all publications are solely those of the individual author(s) and contributor(s) and not of MDPI and/or the editor(s). MDPI and/or the editor(s) disclaim responsibility for any injury to people or property resulting from any ideas, methods, instructions or products referred to in the content. |
© 2025 by the authors. Licensee MDPI, Basel, Switzerland. This article is an open access article distributed under the terms and conditions of the Creative Commons Attribution (CC BY) license (http://creativecommons.org/licenses/by/4.0/).
Copyright: This open access article is published under a Creative Commons CC BY 4.0 license, which permit the free download, distribution, and reuse, provided that the author and preprint are cited in any reuse.


