1. Introduction
In oil and gas production practices, the mixing of various types of crude oil and oil products during storage, preparation and transportation processes is a widespread phenomenon. Oil blending occurs during collection and transportation through manifold and flow lines, pipelines, and tanks. Recent scientific research and experimental studies indicate that, for some oil blends, parameters of practical importance such as density, viscosity, freezing point and volume often exhibit anomalous and sharp changes. Proper management of transportation parameters and energy characteristics is crucial for enhancing the efficiency and reliability of pipeline transportation of crude oil and oil products [
1,
2,
3,
4,
5,
6].
At all stages of collection, preparation, transportation, and storage, one of the most significant factors influencing the quality indicators and changes in the physical-chemical and rheological properties of oil is their blending. The mixing of different types of crude oil samples and oil products also occurs during sequential transportation through pipelines. Specifically, in the contact zones between two sequentially transported products, a certain volume of a mixed blend typically forms.
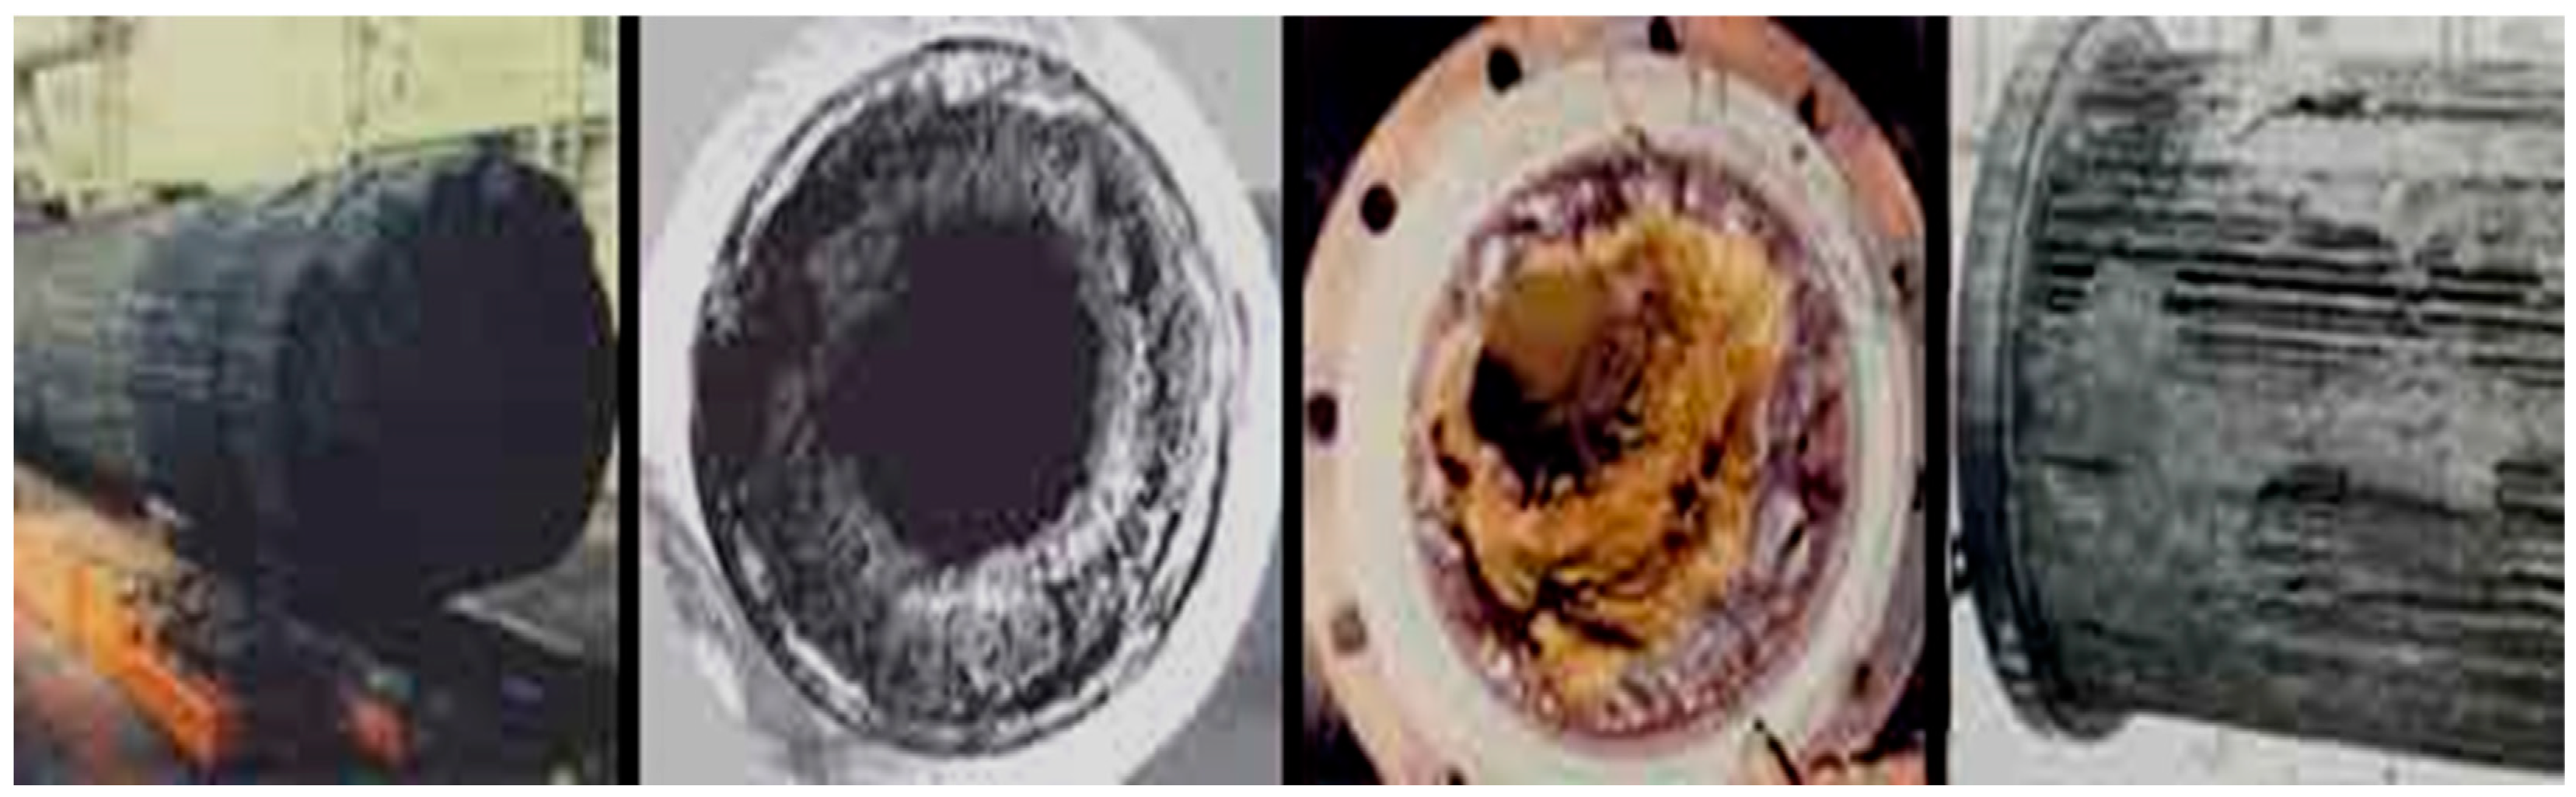
In many cases, the "incompatibility" of mixed crude oil can lead to technological issues, such as the formation of blockages and sediments in collection and transportation pipelines. Furthermore, significant and often anomalous changes in parameters such as density, viscosity, freezing point, and volume are observed. Even the mixing of two "good" stable oil samples may result in the formation of a problematic blend, characterized by the precipitation of heavy particles (
Figure 1). Since such oil samples can be considered an "undesirable" pair, it is critical to account for the factor of incompatibility during their blending [
7,
8,
9,
10].
Analysis indicates that during the collection, preparation and transportation of well products with varying rheophysical properties, including water-cut crude oil via pipeline systems, whether through mixing or deliberate blending, the changes in the quality indicators of oil mixtures are often overlooked and in most cases are not even a subject of study. It is well known that the quality indicators of commodity crude oil are primarily determined by their density and the sulfur content (mass fraction). An increase in these indicators not only degrades the quality of the oil but also lowers its market price. It can be assumed that the price of one ton of crude oil is inversely proportional to its density and sulfur content. Heavy oil samples with high density are not supplied to terminals and general-purpose pipelines. Such oil samples are pre-mixed with higher-quality, lighter crude oil and gas condensate to dilute them and improve their quality before being delivered. In general, crude oil with a sulfur content exceeding 2% must be pre-treated or blended with higher-quality crude. Consequently, when crude oil of different qualities is transported, mixing occurs at terminals and within pipelines. As a result, since the blended crude and the individual crude oil involved in the mixture have different quality characteristics, price differences inevitably arise between them. Regardless of how crude oil is delivered to terminals, whether via pipelines, rail or sea, the key requirement is to determine the actual quality indicators and the price per ton for both incoming and outgoing crude blends through laboratory analysis. In practice, due to mixing, the price per ton of crude oil at a terminal’s entry and exit points can differ by 10 or even hundreds of US dollars. Such price differences can typically be balanced using a "crude oil quality bank" system.
Furthermore, unlike commodity crude oil, the list of quality indicators for raw crude oil is much broader, including parameters such as density, mechanical impurities, chloride salts, paraffin content, resin and asphaltene levels, pour point, etc. Field experience shows that although blending different grades of raw crude is often "undesirable," it inevitably occurs in storage tanks and transportation systems (pipelines). When different types of crude oil are mixed in the same storage tank at production sites, their quality parameters and the accuracy of accounting are significantly affected. It is no coincidence that in such cases, substantial discrepancies arise between measured values in crude oil accounting at reception and delivery points.
2. Materials and Methods
Obtaining information on the quality indicators of oil during blending is crucial not only for accounting purposes but also for forecasting the operational regimes of blending stations, storage tanks, and processing facilities. Global practice shows that the impact of the blending process on the physical-chemical and rheological properties of oil can differ significantly from the models and calculation schemes applied to ideal solutions (mixtures) [
11].
For instance, crude oil samples extracted from the "Bulla-BN" and "Siyazan-SN" (Azerbaijan) fields were used as the research objects. The results of initial laboratory analyses reflecting the physical-chemical and rheological properties of these oil samples, as well as the methods used for testing (GOST standards), are presented in
Table 1. As seen in
Table 1, the selected oil samples differ in composition and properties.
3. Results
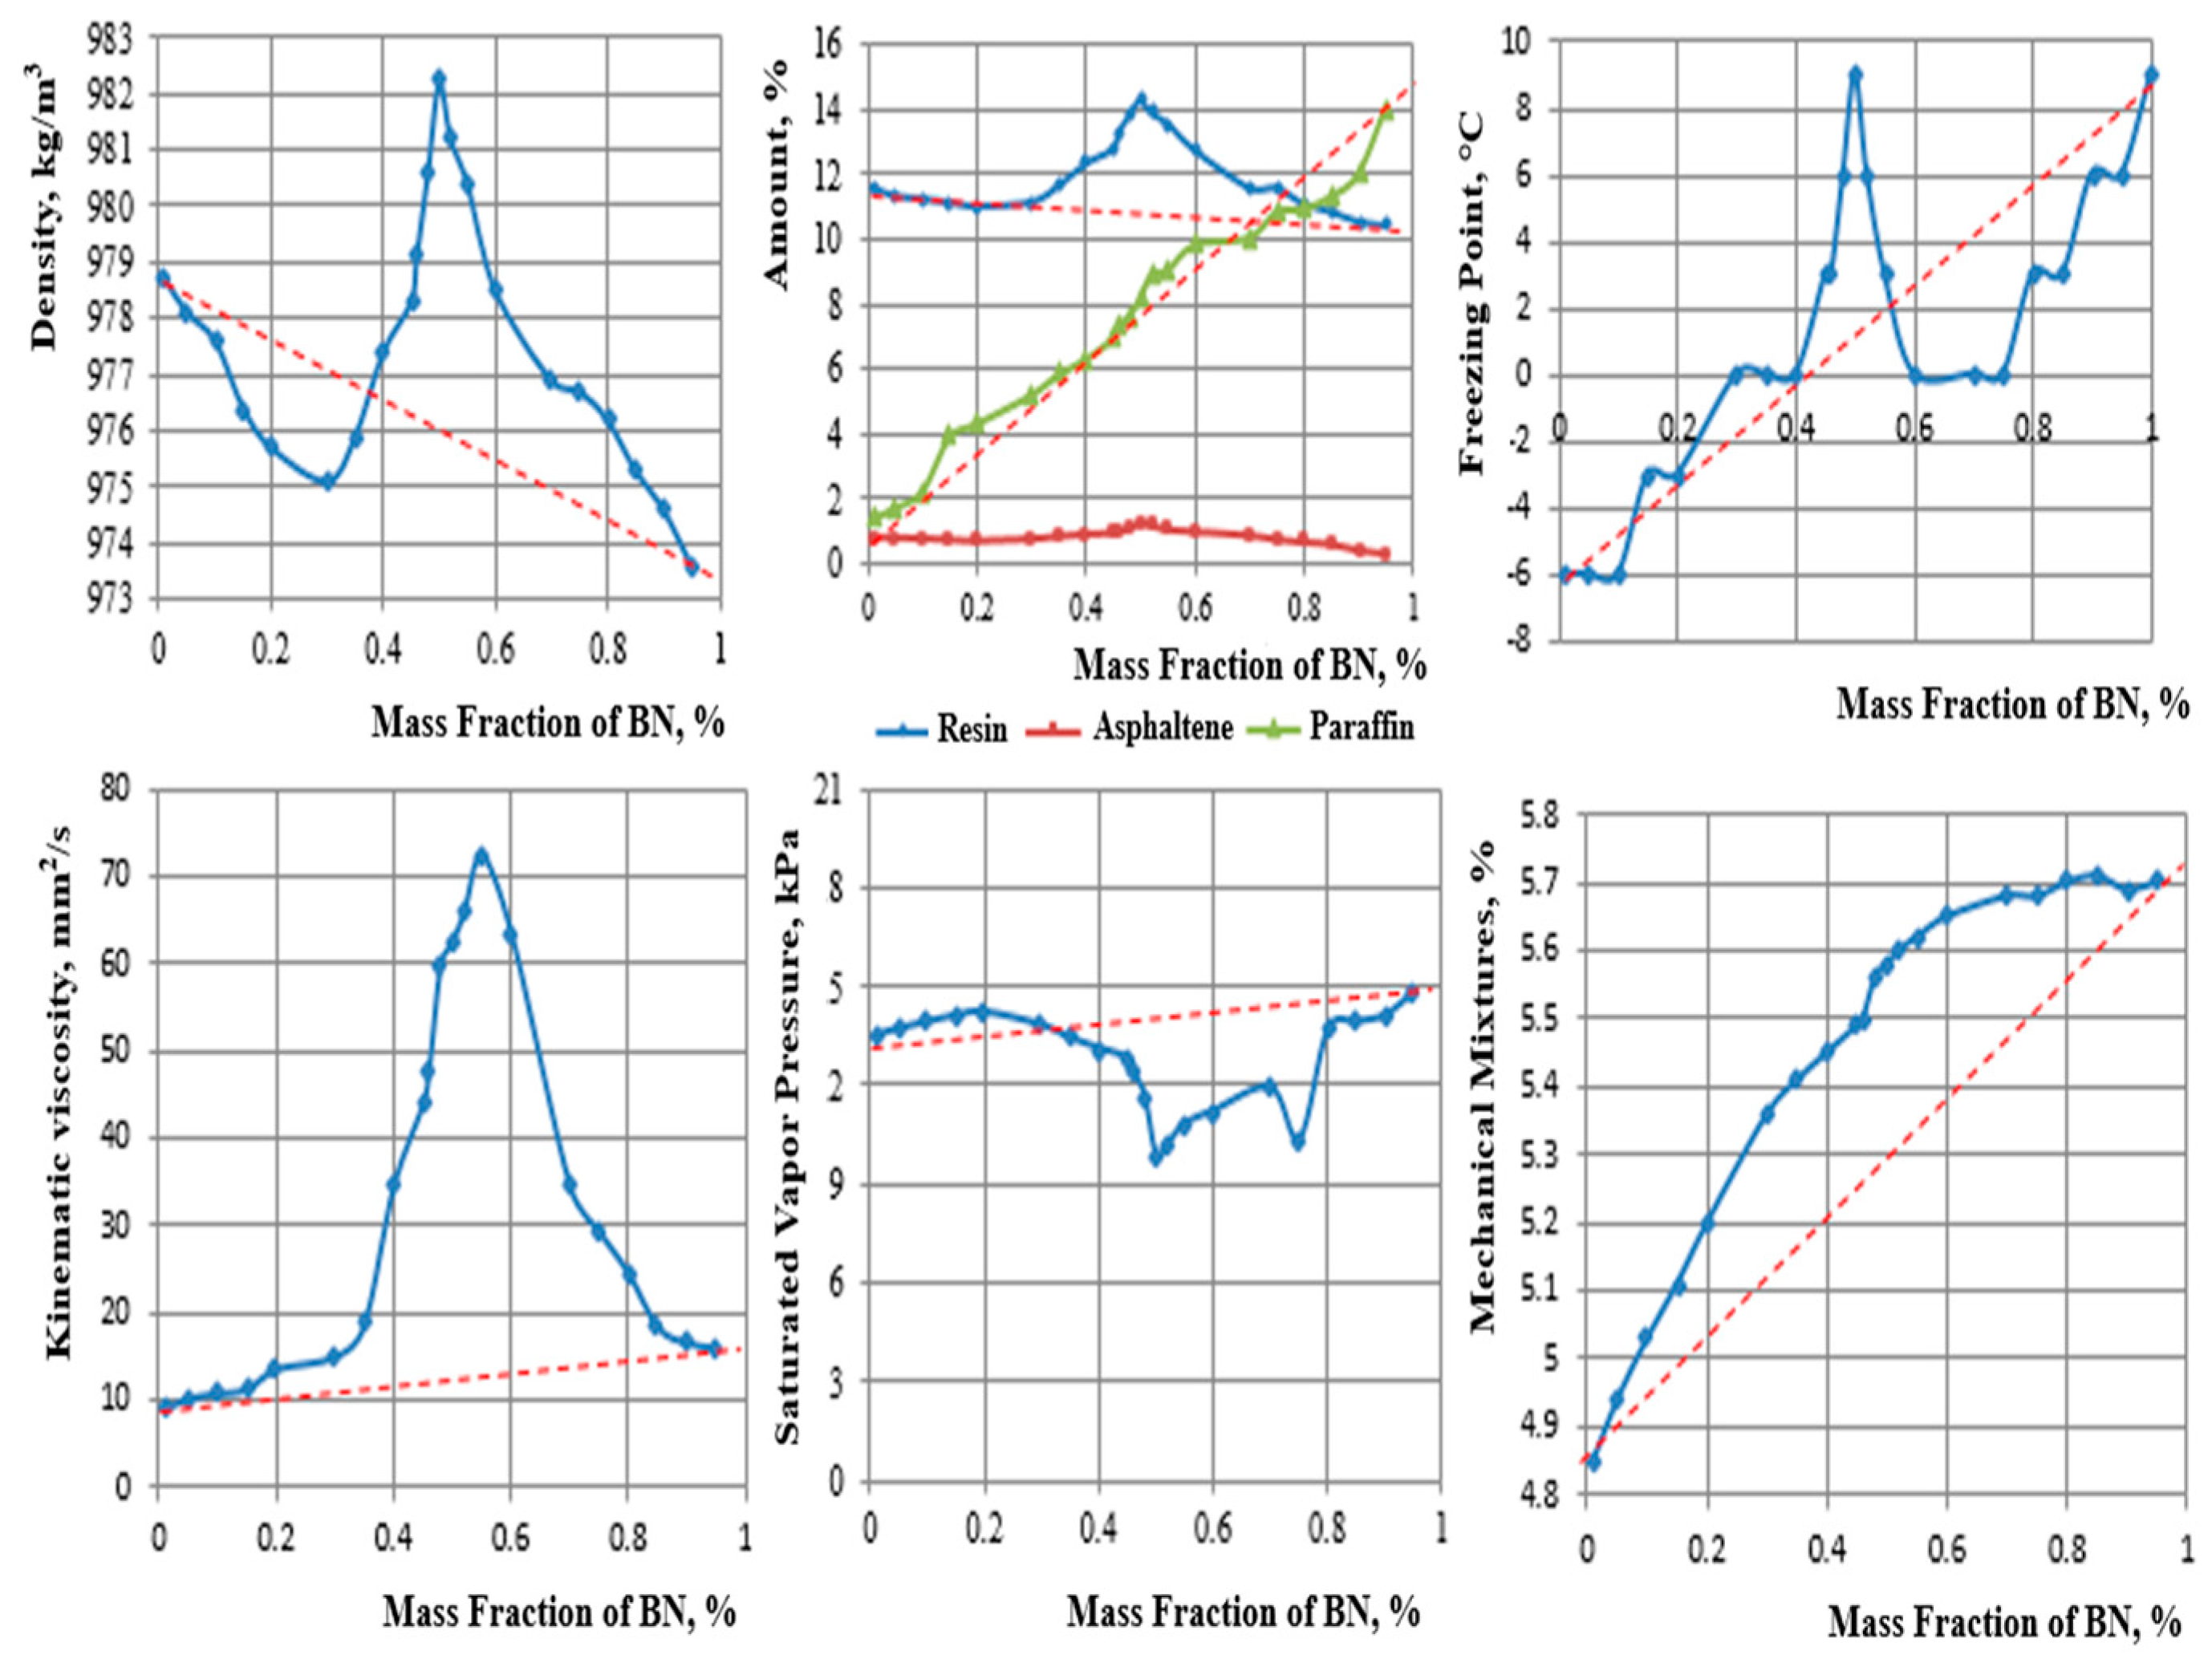
For the research, BN crude oil was blended with SN crude oil in various proportions under laboratory conditions, and key indicators for the resulting mixtures were determined in accordance with GOST standards. The changes in these indicators depending on the blending ratio of SN oil with BN oil are shown in
Figure 2.
As shown in
Figure 2, during the blending of BN and SN oil samples, the changes in quality indicators depending on the mass fraction of BN oil do not follow the additivity rule. Specifically, density, viscosity, resin content, and freezing point increase sharply, while the saturated vapor pressure undergoes significant changes. This primarily occurs when the BN oil concentration reaches 50%.
The non-monotonicity of the dependencies of quality indicators indicates that the resulting blends cannot be considered additive. In some cases, the blending of oil leads to anomalous changes in quality indicators, while in others, their blending is deemed entirely "undesirable."
In addition to these findings, laboratory studies were conducted to investigate the impact of blending crude oil emulsions with different water contents and condensate on their quality indicators and the efficiency of the emulsion dehydration process.
Two oil samples (oil-1 and oil-2) with water contents of 34% and 75%, respectively, and a water-free condensate sample were selected as research objects. These samples, differing in their physical-chemical and rheological properties, were studied in the laboratory in accordance with relevant GOST standards and normative documents. Their physical-chemical properties (quality indicators, such as density, viscosity, freezing point, and the amount of ballast components) were determined (
Table 2).
The necessity of studying the blending of rheologically complex oil samples, including oil emulsions, with condensate arises from practical considerations. For instance, during the collection and transportation of condensate produced from Azerbaijan's offshore gas-condensate fields, there was a need to transport it by blending it with crude oil, a practice that was implemented for some time.
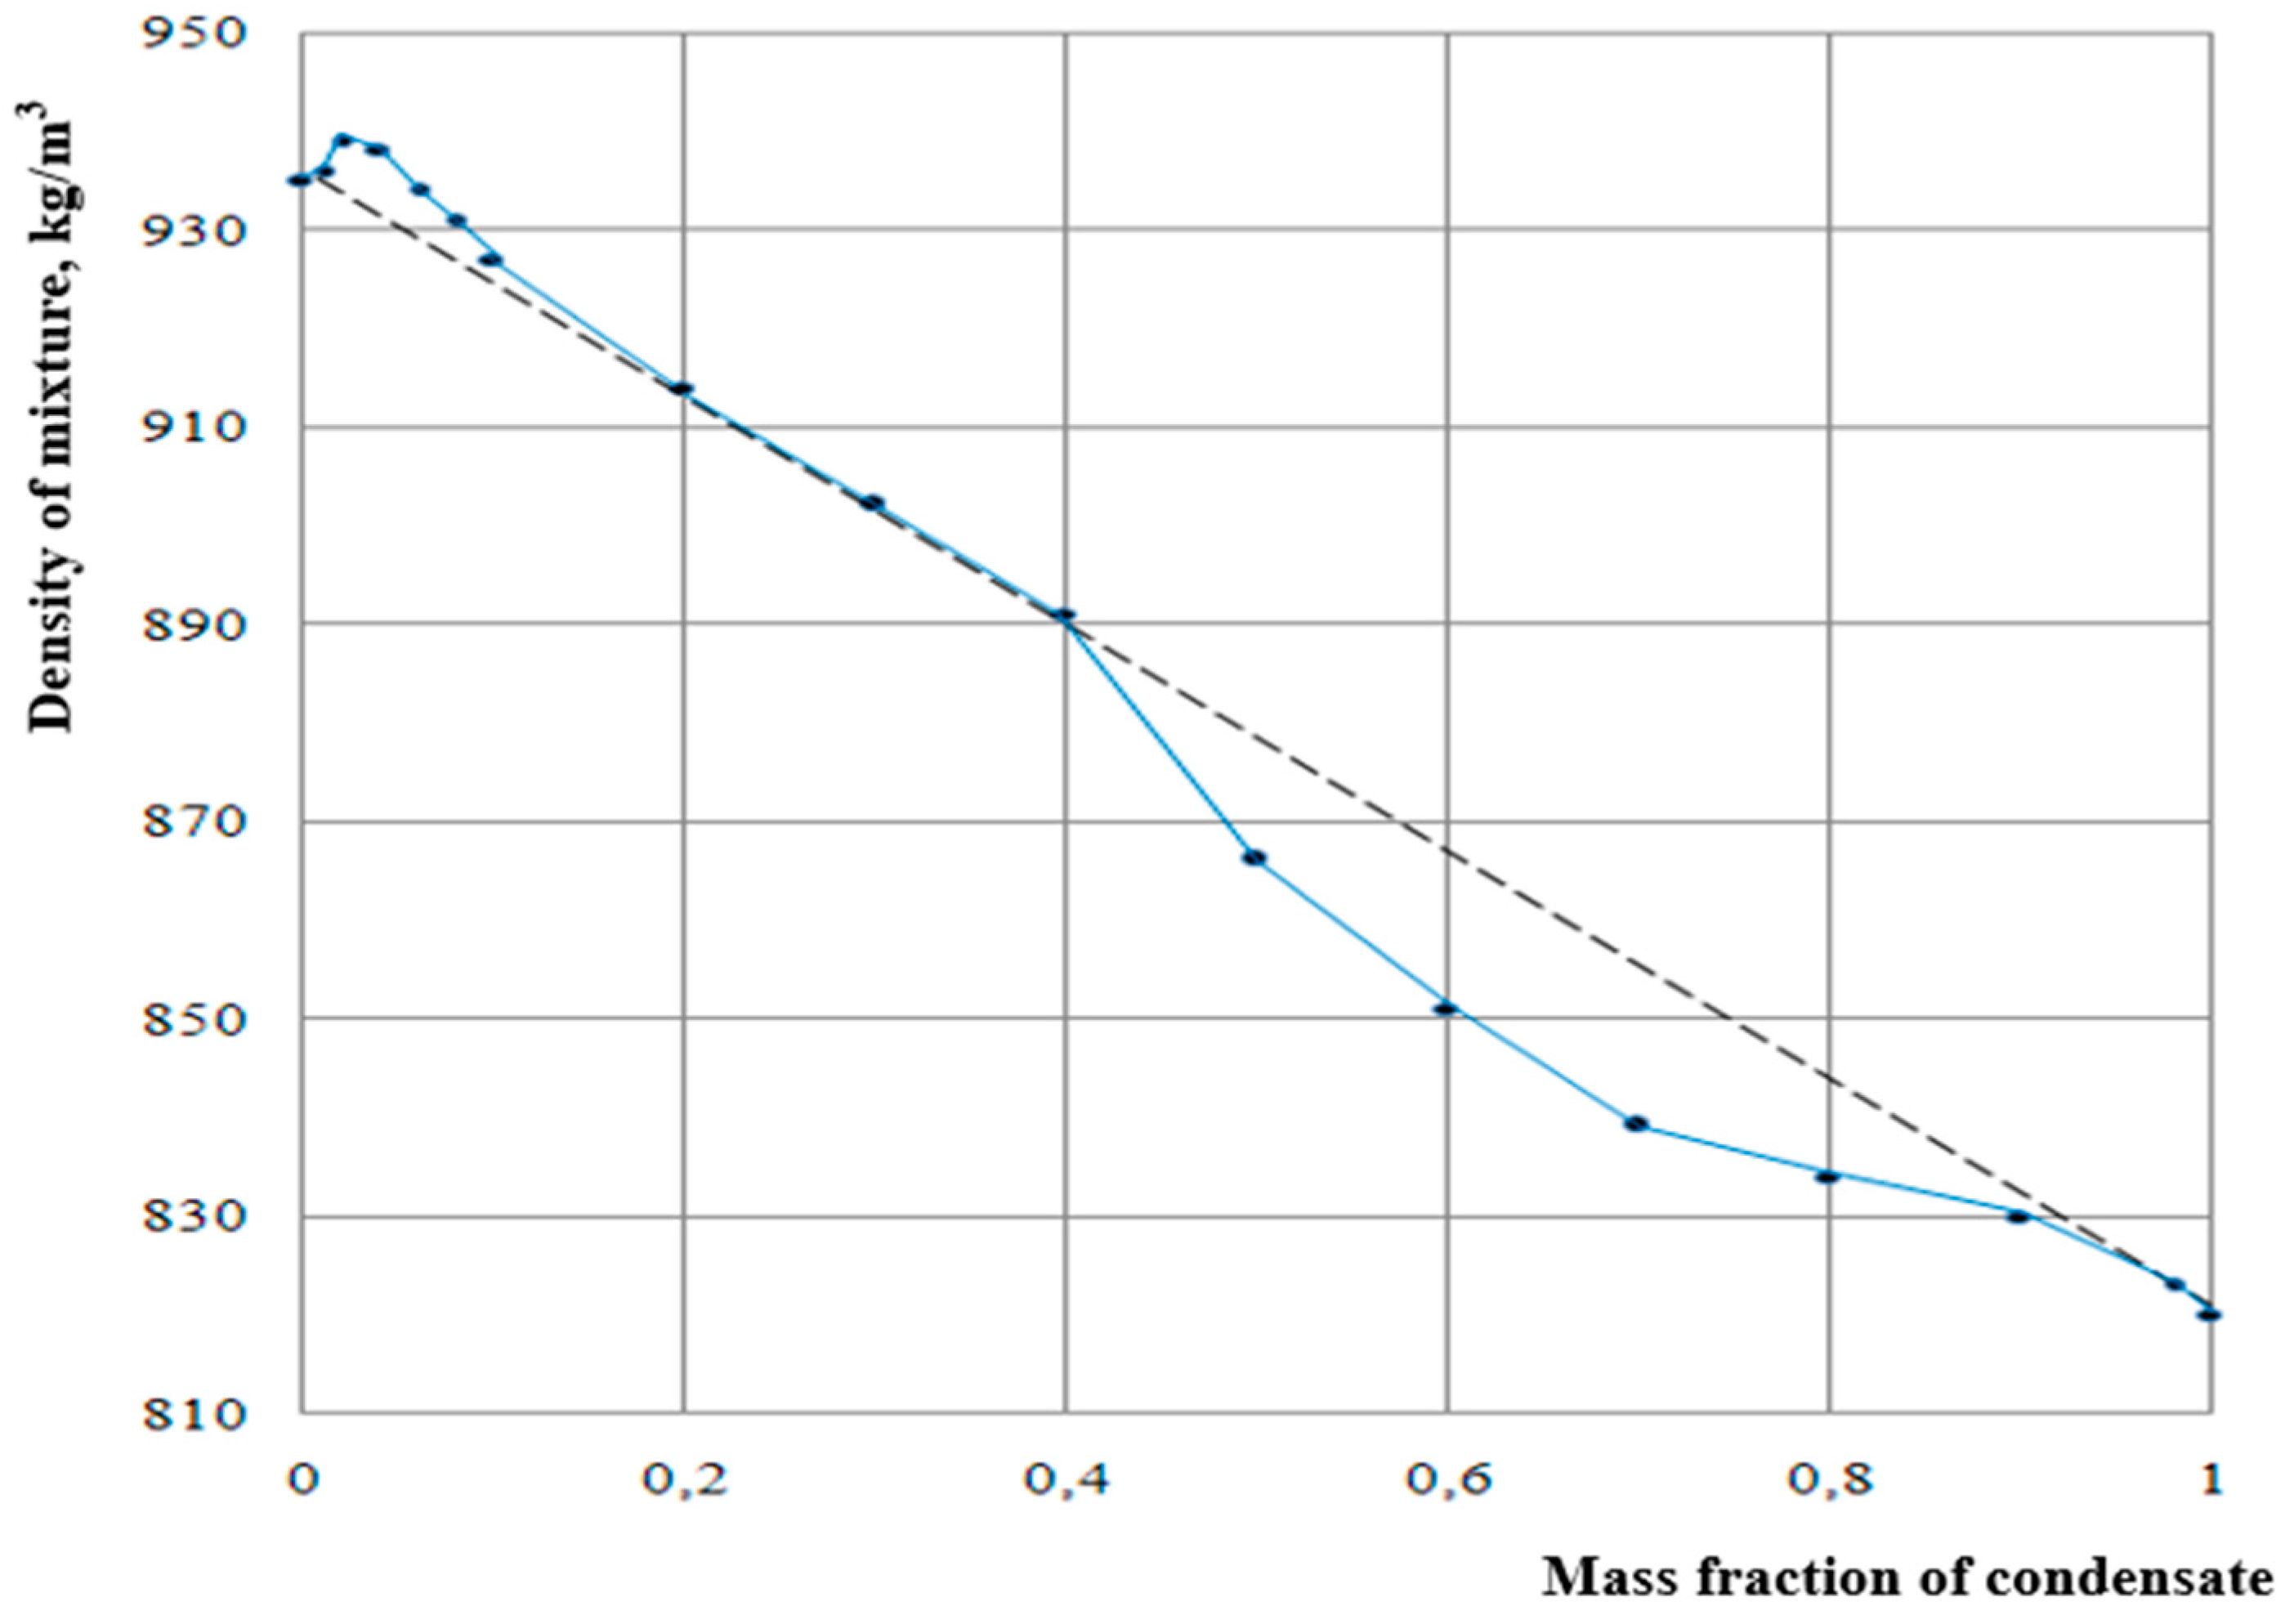
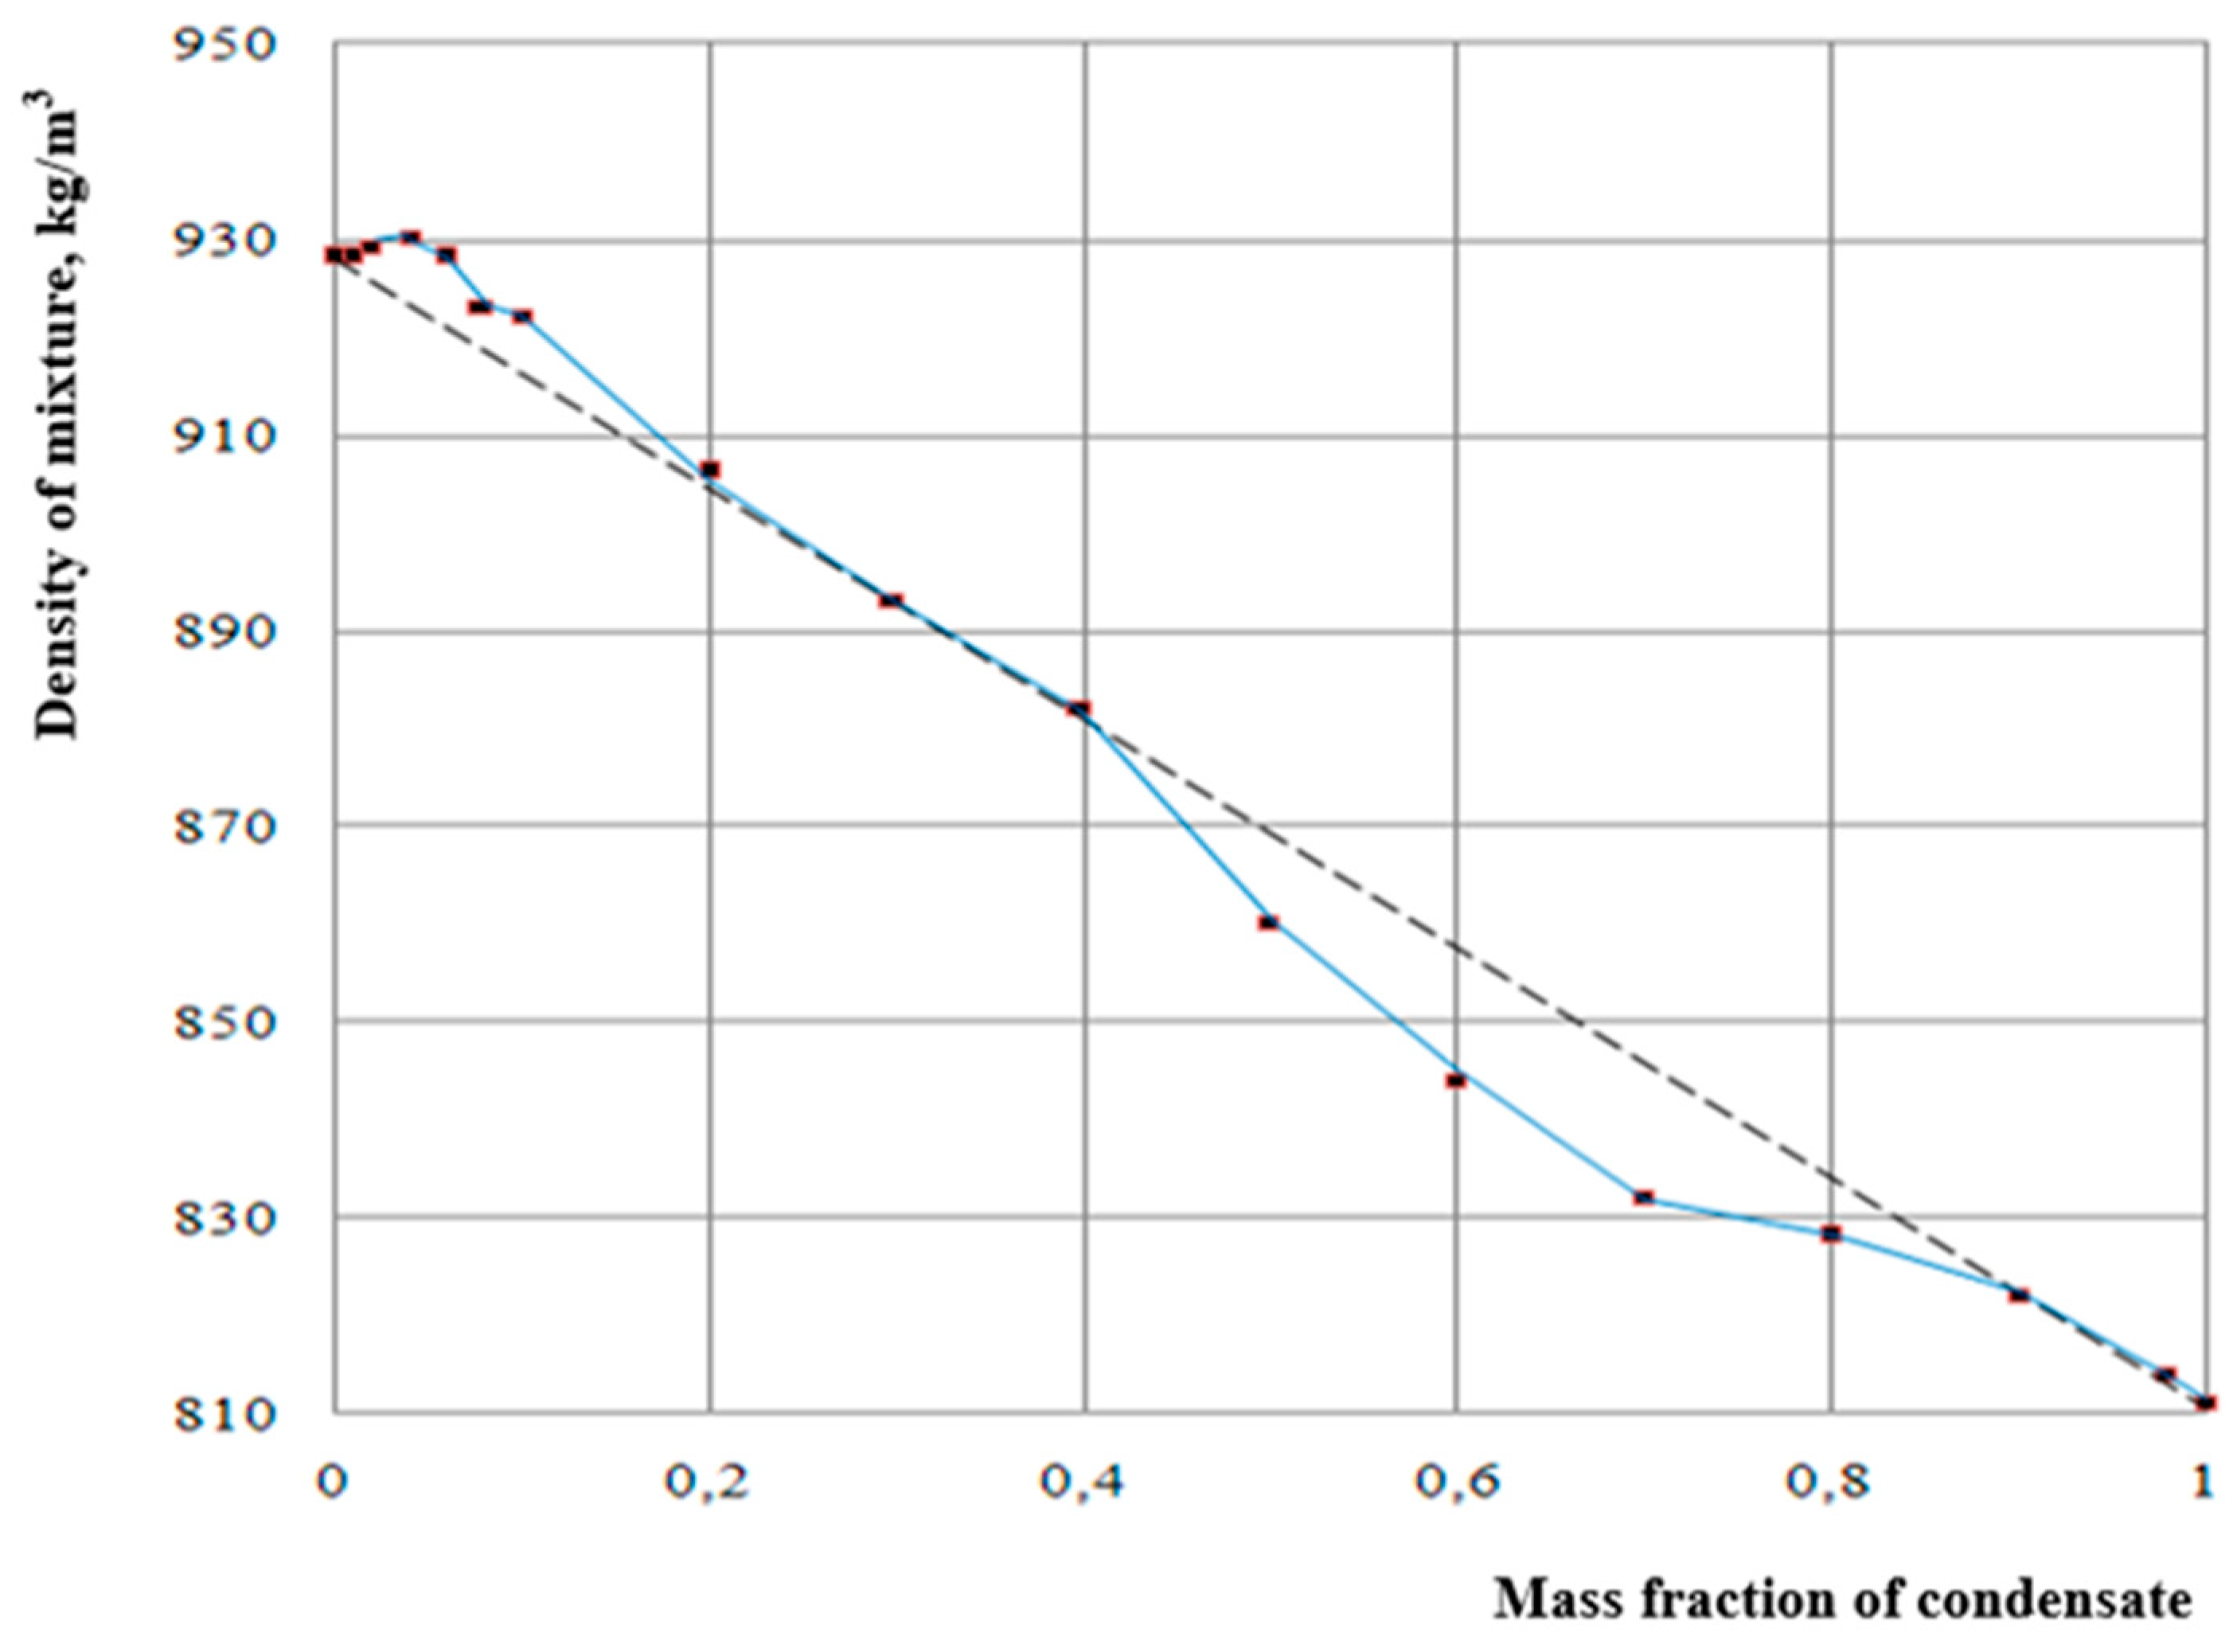
It is well known from practical experience that adding condensate to rheologically complex heavy oil improves their transportability and reduces transportation costs. The results of our laboratory experiments confirmed that the viscosity and other quality indicators of heavy oil change significantly depending on the mass fraction of condensate. It was found that certain indicators of oil-condensate mixtures (e.g., density and freezing point) can produce markedly different results when determined based on the additivity rule. The changes in the indicators of various blends of the first oil emulsion (oil-1) with 75% water content and condensate, depending on the mass fraction of condensate at t=20°C, are presented in
Table 3. For example, the changes in the density of the oil-1-condensate mixture at t=5°C and 20°C, depending on the mass fraction of condensate, are shown in
Figure 3 and
Figure 4, respectively. As observed in
Figure 3 and
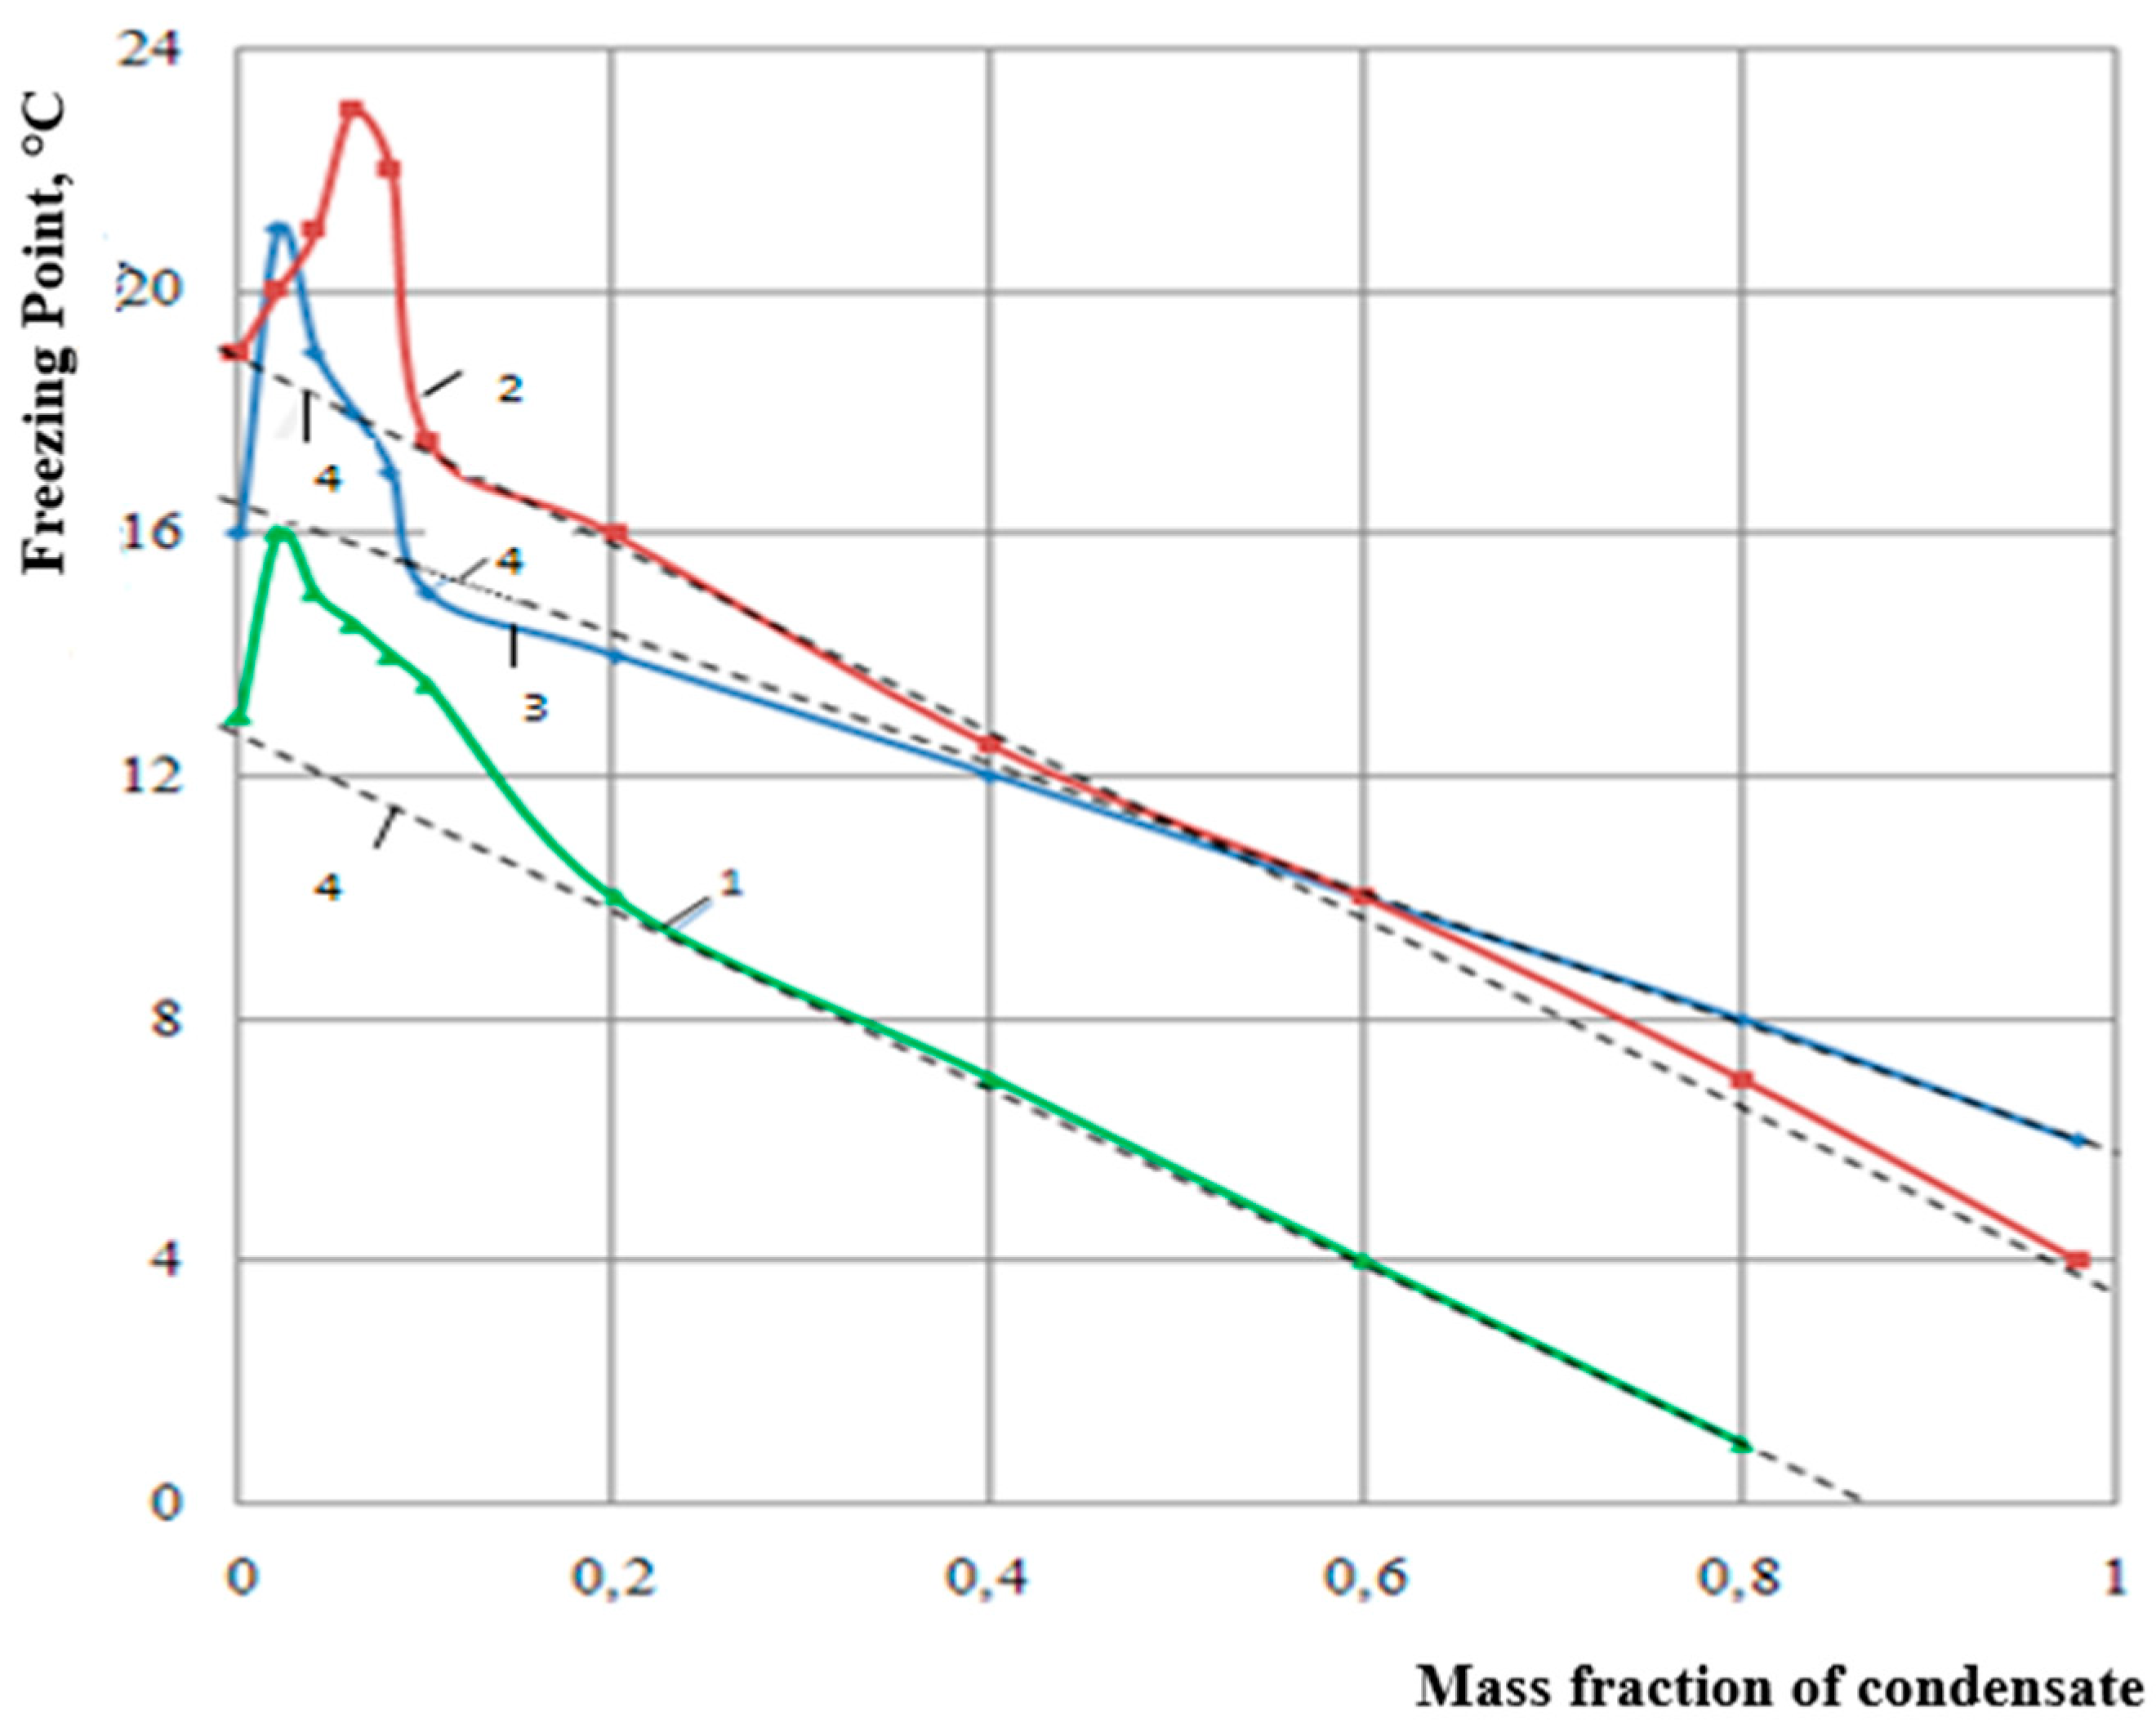
Figure 4, additive mixtures are not formed at condensate concentrations up to 20% and within the range of 40–90%. At the first concentration range, the mixture's density increases compared to the additive mixture, whereas at the second range, the density decreases. It was also determined that transporting the oil-1-condensate mixture through pipelines is undesirable at low condensate concentrations (10–15%) because the freezing point of the oil significantly increases, which complicates pipeline operations and raises the likelihood of halting the transportation process (
Figure 5).
As shown in
Figure 5, for all investigated mixtures, oil-1 + condensate, oil-2 + condensate and oil-1 (50%) + oil-2 (50%) + condensate, the additivity rule is violated at approximately the same condensate concentration. At higher condensate concentrations (above 20%), the resulting mixtures become additive.
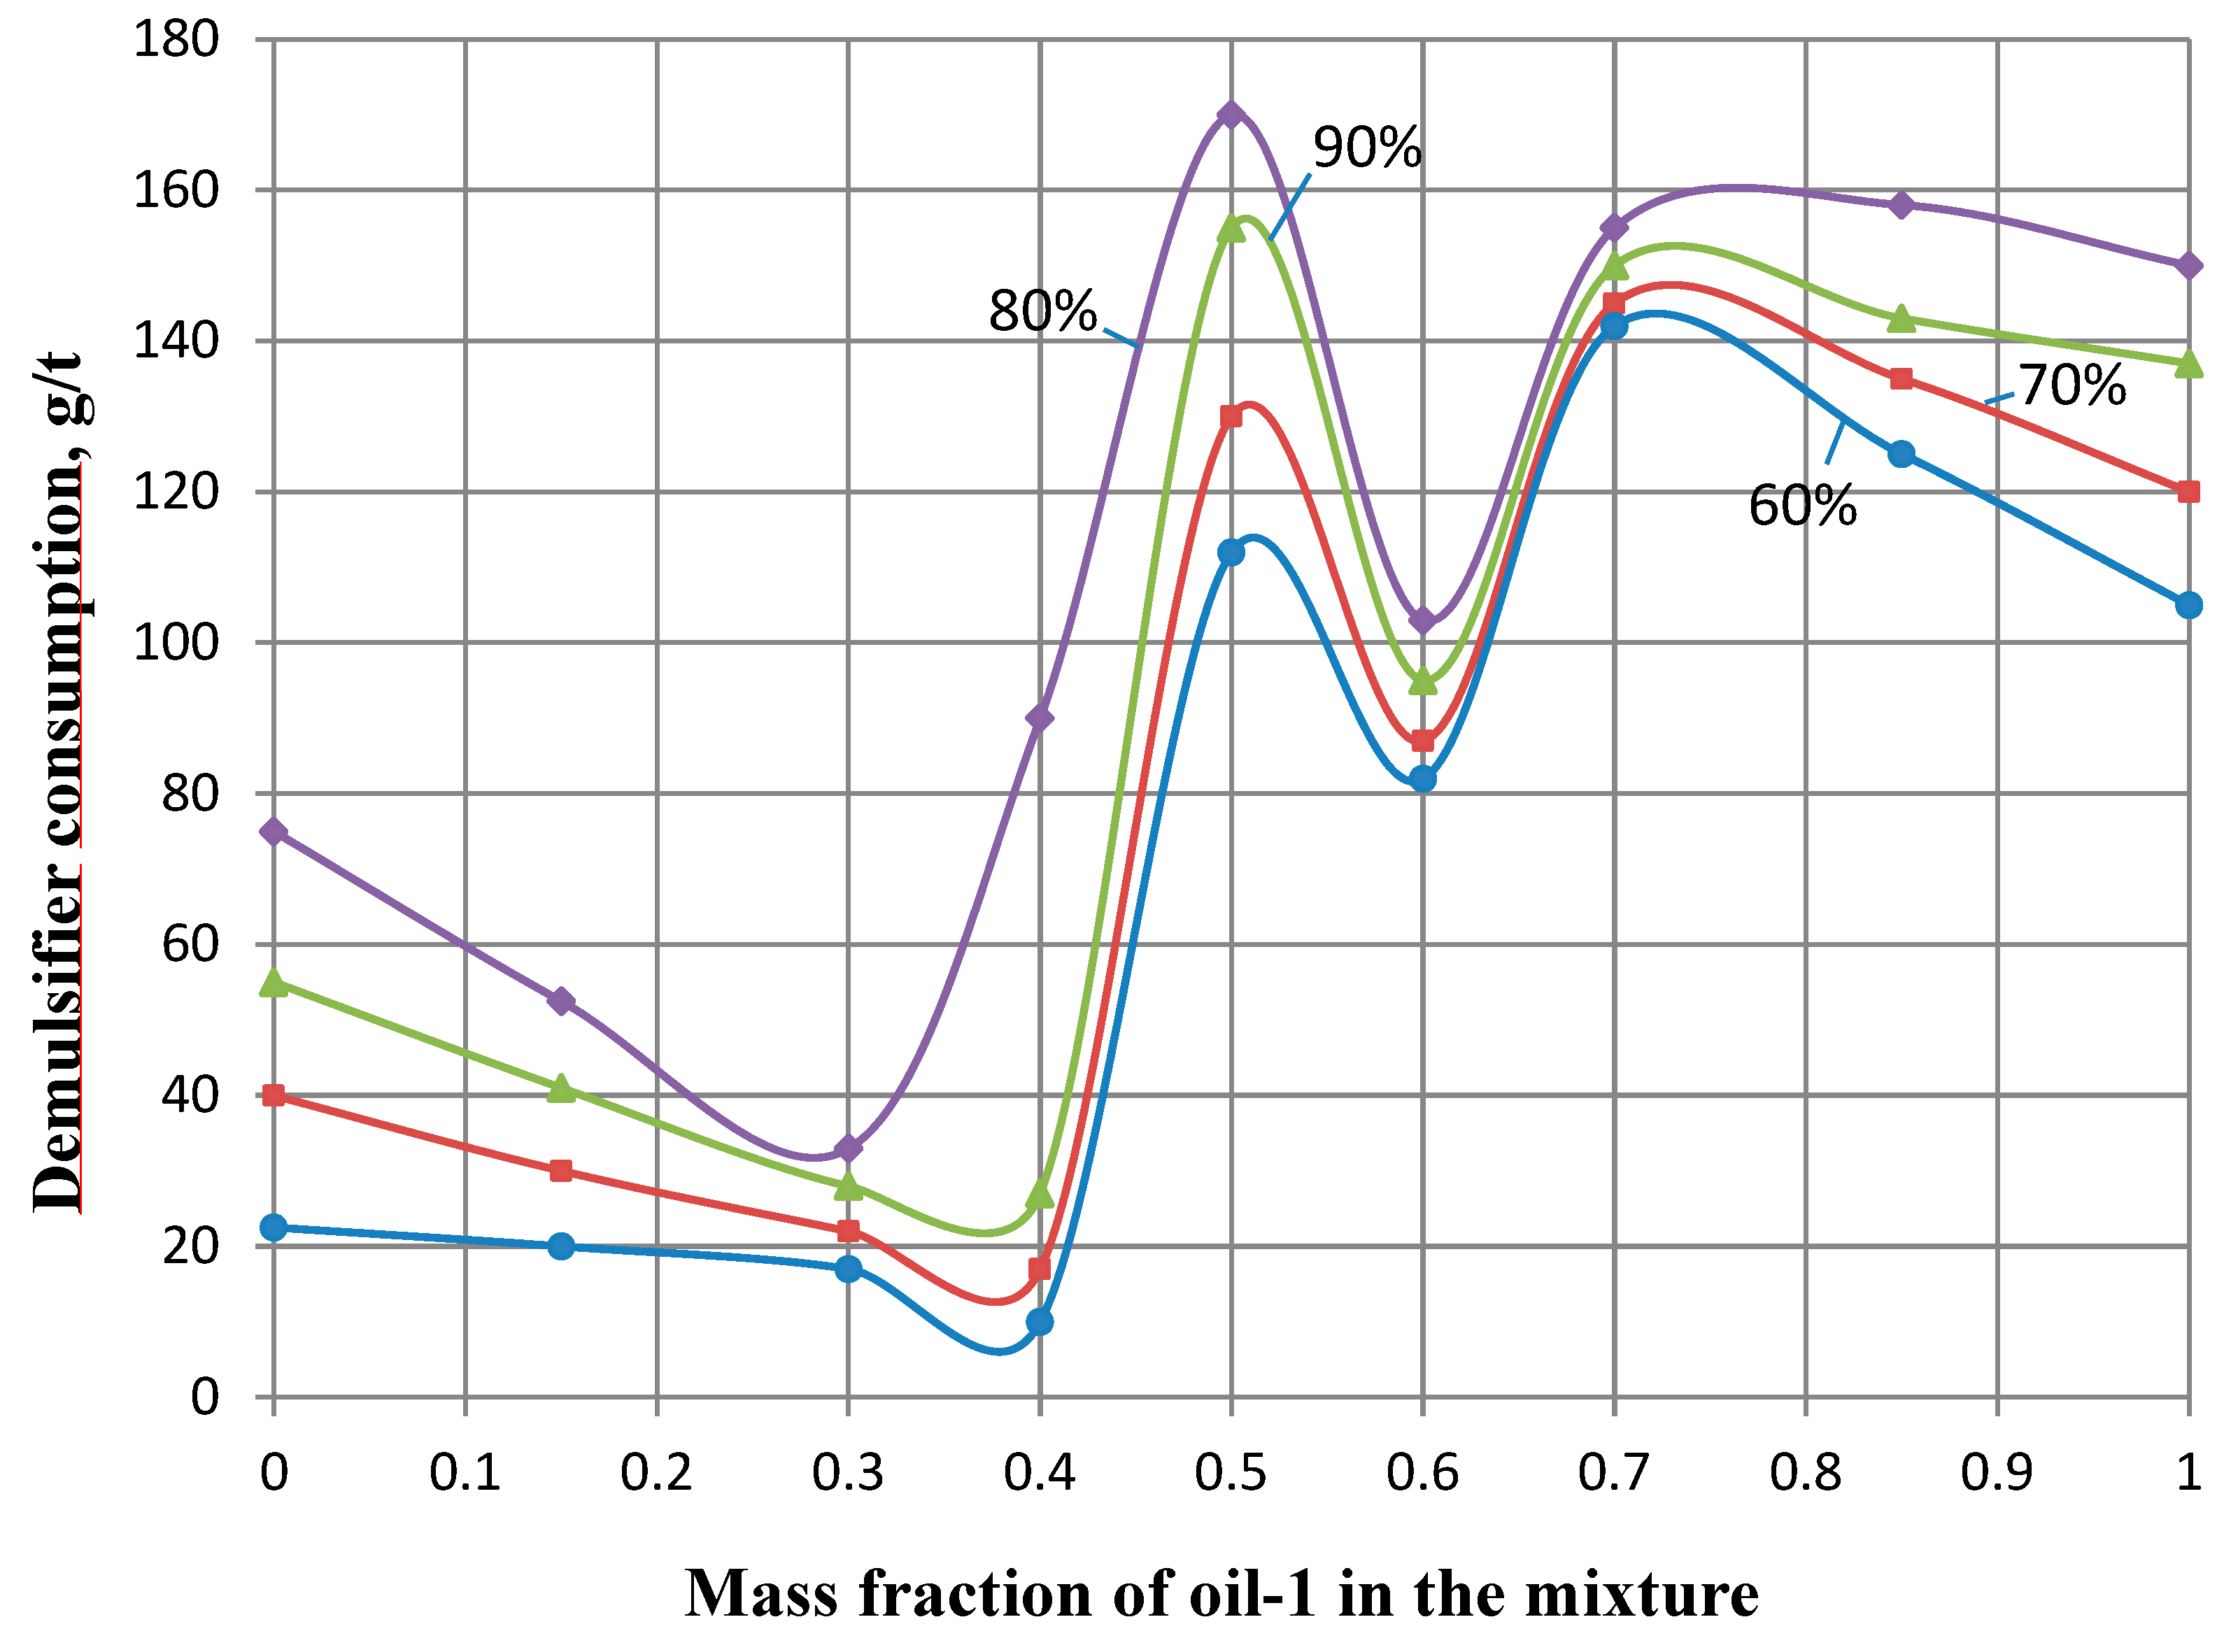
Interesting results were obtained during the demulsification of various "oil-1-oil-2" emulsion mixtures using the "Alkan-202" reagent. The mixtures were prepared with mass ratios of the two oil as follows: (0:1), (0.15:0.85), (0.3:0.7), (0.4:0.6), (0.5:0.5), (0.6:0.4), (0.7:0.3), (0.85:0.15), and (1:0). These mixtures were studied to determine how the reagent consumption varied at different degrees of dehydration (60%, 70%, 80%, and 90%). The corresponding dependencies are shown in
Figure 6.
From
Figure 6, it is evident that the dependencies for dehydration degrees of 60%, 70%, 80%, and 90% exhibit almost identical characteristics. The reagent consumption required for the demulsification of oil-1 and oil-2 samples alone was 22.5 and 105 g/t, 40 and 120 g/t, 55 and 137 g/t, and 75 and 152 g/t, respectively, for these dehydration levels. For mixtures with 30:70% and 40:60% ratios, the required amount of demulsifier was significantly lower compared to oil-2 alone. For example, for a 60% dehydration degree, the reagent consumption for these mixtures was 17 and 10 g/t, respectively. For other compositions of the blended oil, changes in reagent consumption were observed, characterized by both increases and decreases. For instance, at a 50:50% ratio, the demulsification of the mixture showed positive synergy, while at a 60:40% ratio, negative synergy was observed. Thus, when the proportion of oil-1 in the mixture does not exceed 40%, the demulsifier consumption is significantly lower compared to other scenarios, making it more efficient and economically advantageous to demulsify such mixtures.
The factor of non-additivity during oil mixing has also been identified by researchers [
1] in studies involving the mixing of "light" oil with a density of 818.3 kg/m³ and "heavy" oil with a density of 893.2 kg/m³ in various proportions. Measurements revealed that the changes in density and viscosity as a function of the mass fraction of "light" oil followed non-monotonic dependencies.
Additionally, several studies [
3,
12,
13,
14] have demonstrated the presence of antagonistic and synergistic tendencies in individual elements and polymer compositions.
4. Conclusions
In the study, the impact of crude oil blending on various physicochemical properties and processing parameters was analyzed. The findings highlight the complex interactions that arise when blending different types of crude oil and the implications for transportation, processing and economic evaluation. The following key conclusions have been drawn from the research:
It has been established that Azerbaijan crude oil samples containing high-molecular-weight compounds (resins, paraffins, asphaltenes) exhibit a nano-scale nature. As a result, when these oil samples are blended, their quality indicators change anomalously and do not adhere to the principle of additivity.
It has been discovered that blending rheologically complex heavy crude oil with condensate is not advisable when the condensate content is less than 20%. Otherwise, an increase in the crude oil's pour point can significantly complicate the transportation process and may even lead to its complete cessation.
To enhance the efficiency of the dehydration process for two oil emulsions, it is important to take into account the proportions in which they are mixed. This also allows for the proper selection of demulsifier consumption. It has been established that the consumption of demulsifiers during demulsification can increase or decrease depending on the mixing of oil.
The importance of considering the impact of crude oil blending on quality indicators, market price and accounting accuracy has been emphasized.
It has been revealed that, depending on the type of crude oil and blending ratio, the consumption of demulsifier during the demulsification of crude oil emulsions varies within a wide range. Additionally, the possibility of determining the optimal demulsifier consumption by accounting for the resulting synergy effect has been demonstrated.
Author Contributions
Project administration, outline, structure, guidance, X.W.; supervision, expertise, data curation, visualization and writing—original draft preparation, X.W., G.I., E.I., E.A and F.I.; experiment, X.W., G.I., E.I., E.A and F.I. All authors have read and agreed to the published version of the manuscript.
Funding
This research received no external funding.
Data Availability Statement
The original contributions presented in the study are included in the article, further inquiries can be directed to the corresponding author.
Conflicts of Interest
The authors declare no conflicts of interest.
References
- Evdokimov I.N., Losev A.P., Fesan A.A. Lack of Additivity in Oil Mixtures. Proceedings of the International Scientific-Practical Conference "New Technologies in Oil and Gas Production." Baku, 2011, pp. 130–132.
- Ismayilov Q.Q., Nurmammadova R.Q., Zeynalov R.L. "On Synergism and Antagonism Tendencies During the Accumulation and Transportation Preparation of Oil Mixtures." Azerbaijan Oil Industry Journal, 2014, No. 4, pp. 31–34.
- Bowman R.W., Burton W.D., Pyor J.A., Shell Oil Co. "Statistically Designed Oil Dehydration Test." SPE Paper 6529, (1977).
- Ismayilov, G.G., Iskanderov, E.Kh., Fataliyev, V.M., Gurbanov, A.G., Ismayilova, F.B. Some Aspects for Improving the Efficiency of Gas Condensate Resource Development in Marine Conditions. SOCAR Proceedings, 2023, (4), pp. 99–105. [CrossRef]
- Ismayilov, G., Iskandarov, E., Farzalizade, Z., Abishova, R. Some Aspects of Operational Risk Management in Oil and Gas Field Pipelines. Reliability: Theory and Applications, 2023, 18(Special Issue 5), pp. 565–568. [CrossRef]
- Iskandarov, E.Kh., Ismayilova, F.B., Shukurlu, M.F., Ismayilova, P.Sh. Changes in Energy Characteristics of Pipeline Systems Considering Hydrodynamic Loads. SOCAR Proceedings, 2024, (2), pp. 105–108. [CrossRef]
- Michael K. Poindexter, Shaokun Chuai, Robert A. Marble, Samuel C. Marsh. Classifying Crude Oil Emulsions Using Chemical Demulsifiers and Statistical Analyses. SPE Paper 84610, 2013.
- Ismayilov, G., Ismayilova, H., Babirov, H., Jabrayilov, R. Assessment of Environmental Oil Spills and Economic-Environmental Risks. Reliability: Theory and Applications, 2022, 17, pp. 212–217.
- Gurbanov, H.R., Gasimzade, A.V. Research on Physicochemical Impacts on the Rheological Parameters of High-Paraffin Oil. ChemChemTech, 2023, 66(5), pp. 80–86. [CrossRef]
- Wang, X., Gurbanov, H., Adygezalova, M., Alizade, E. Investigation of Removing Asphaltene-Resin-Paraffin Deposits by Chemical Method for Azerbaijan High-Paraffin Oil Production Process. Energies, 2024, 17(15), 3622. [CrossRef]
- Vali Nurullayev, Gafar Ismailov, Beybala Usubaliyev. Increasing the Efficiency of Oil and Petroleum Products Using Nano-Chemical and Cavitation Technologies. Scholars Press, 2018, 124p.
- Mixtures of polymers - http://www.ximik.ru/enciklopedia /2/4110.html.
- Polymer compositions - http://www.polimeru.ru/letter.php?n_id=2998.
- Antagonism and synergism of elements - http://us-in.net/m_elements_7.php.
|
Disclaimer/Publisher’s Note: The statements, opinions and data contained in all publications are solely those of the individual author(s) and contributor(s) and not of MDPI and/or the editor(s). MDPI and/or the editor(s) disclaim responsibility for any injury to people or property resulting from any ideas, methods, instructions or products referred to in the content. |
© 2025 by the authors. Licensee MDPI, Basel, Switzerland. This article is an open access article distributed under the terms and conditions of the Creative Commons Attribution (CC BY) license (http://creativecommons.org/licenses/by/4.0/).