
Submitted:
05 March 2025
Posted:
06 March 2025
You are already at the latest version
Abstract
The emergence of anti-amyloid therapies, such as Lecanemab and Donanemab, has brought new lights to treat Alzheimer’s disease (AD). Advanced tau pathology may degrade the treatment efficacy. Tau-PET imaging, while effective for staging tau burden, is limited by costs and availability. This study investigates machine learning models using cognitive tests, MRI and amyloid-PET features to predict tau staging in amyloid-positive patients, offering a cost-effective surrogate for tau staging. Utilizing data from ADNI-3 (n=380) and OASIS-3 (n=120), we processed the brain structural MRI with FreeSurfer and applied feature selection to identify key brain regions, showing significant differences in those regions’ volume between tau-positive and tau-negative groups (p<0.001). Logistic regression, SVM, and random forest models were trained, with the SVM model achieving the highest performance: AUCs of 0.89 (ADNI for training and cross-validation) and 0.90 (OASIS as external validation), sensitivities of 75.7% and 80.0%, and specificities of 87.9% and 95.3%, respectively. Our model demonstrated competitive performance in classifying the tau status and may serve as a screening tool or surrogate tau staging biomarker. By focusing exclusively on amyloid-positive patients, the proposed machine learning model may assist the pre-treatment evaluation and planning for personalized AD therapies.
Keywords:
Alzheimer’s disease
; MRI
; amyloid-PET
; Tau-PET
; neurodegeneration
; Centiloid
; Braak staging
; machine learning
; predictive modeling
; clinical decision making
; anti-amyloid therapy
; drug efficacy
; personalized medicine
Introduction
Alzheimer's disease (AD) is a neurodegenerative disorder characterized by two primary neuropathological hallmarks: the aggregation of amyloid-beta (Aβ) plaques and hyperphosphorylated tau in neurofibrillary tangles. AD is known to be affected by multiple pathologies. Among various theories of the causes of AD, the amyloid-tau cascade is regarded as the most potent pathological pathway and potentially the most promising therapeutic target [1]. The amyloid cascade hypothesis suggests that the AD pathology begins with intracellular Aβ accumulation, which subsequently triggers abnormal tau deposition and spread in the brain. As tau spreads in the brain, it triggers neurodegeneration, over-stimulated neuroinflammation with neural toxicity, structural brain atrophy, neuronal loss, and ultimately cognitive decline that leads to dementia [2]. Unsurprisingly, pharmaceutical agents targeting amyloid and tau are regarded as the promising approaches for novel therapeutic development. The U.S. Food and Drug Administration (FDA) has currently fully approved two anti-amyloid drugs Lecanemab (Leqembi) and Donanemab (Kisunla) [3,4], and promising anti-tau and combination therapies are on the pipeline with some currently under clinical trials [5]. As drug development advances, assessing these pathological changes becomes increasingly critical for both diagnostic and therapeutic strategies in clinical practice. Although amyloid appears earlier in the brain, tau deposition is increasingly recognized as a key indicator and the main driving force of neurodegeneration and cognitive decline [6,7,8]. Unlike the simultaneously diffusive deposition of amyloid, tau pathology follows a well-defined Braak staging pattern and the specific stage of tau spread marks the individual’s advancement of tau pathology that is highly correlated to the subsequent cognitive loss [9,10].
In the current appropriate usage criteria of both Lecanemab and Donanemab, neither drug takes the tau staging information into consideration for determining the eligibility, which is mainly based on the cognitive symptoms, amyloid burden and other risk factors such as the risk of developing vascular side effects. This is perhaps attributed to two reasons. First, Phase III data of Donanemab submitted to FDA showed that, even though the efficacy in the high-tau patients is not as impressive as in the low-tau subjects, there was still a significant slowing of cognitive decline compared to the placebo group [11]. Second, at this moment, there is not yet a drug or treatment option for high-tau patients that is nearing FDA approval or advancing far enough in their Phase III trials. As a result, both anti-amyloid drugs currently are being considered regardless of the tau status for an individual patient. This may be a sub-optimal therapeutic path because it is often hypothesized that, once there is advanced tau pathology in the brain, removal of amyloid has limited impact on the tau deposition and spread as well as its impact on neurodegeneration. Considering that anti-amyloid therapies are commonly associated with adverse effects, such as amyloid-related imaging abnormalities (ARIA), including brain edema and microhemorrhages which occurred in over 20% of patients in clinical trials [12], patients with more advanced tau pathology may not effectively benefit from such therapies if the efficacy for cognitive preservation is not sufficiently high compared to the risks of vascular side effects. In addition to safety concerns, the financial burden of such therapies is substantial with approximately total costs of $35000 to $50000 to complete the therapy [13,14,15]. Treatment regimens are also demanding, requiring biweekly or monthly infusions for extended periods—Lecanemab is designed for long-term use, while Donanemab recommends an 18-month course. As a result, there is an increasing advocacy for a more specific evaluation of the tau pathology in patients being considered for disease-modifying therapies of AD where tailored treatment regimens may maximize the treatment benefits while avoiding unnecessary risks.
Currently, there are two categories of in vivo staging tools for the tau pathology: PET-based and fluid-based biomarkers. Tau tracers have been FDA-approved for PET imaging to allow non-invasive measurements of the tau burdens and their spatial distribution. However, tau PET is not currently reimbursed and therefore is limited in the clinical accessibility. Fluid biomarkers, on the other hand, suffer from the incapability to directly measure and delineate the spatial distribution of tau in the brain. Emerging research explored blood-based biomarkers as a cost-effective and minimally invasive option, but these biomarkers are still in development and cannot replace cerebrospinal fluid (CSF) biomarkers or tau PET imaging [16]. To address those challenges, it is desirable to develop classification models that provide tau staging by taking advantage of information and data that are routinely acquired during the evaluation process of anti-amyloid therapies to establish a surrogate biomarker for tau pathology.
There are previous attempts to establish surrogate biomarkers for tau staging without directly using tau PET or CSF biomarkers. Among them, the models built upon MR-based features are potentially the most competitive and appealing approach. First, almost all patients being considered for AD disease-modifying therapies will undergo an MRI scan prior to the treatment, mainly to rule out possibility of existing major or micro hemorrhages and major brain lesions such as trauma or tumors. If we may be able to predict or classify the tau staging with MR-derived features, the prediction/classification does not require additional exams and may directly utilize the individual’s existing MRI data to obtain the surrogate tau biomarkers. Second, several studies have identified significant correlations between structural MR-detected brain atrophy and tau deposition, particularly in amyloid-positive individuals [17,18,19,20]. Regions commonly associated with tau accumulation include the parietal, temporal, and medial temporal lobe (MTL), where cortical thinning and hippocampal atrophy are frequently observed. For example, Das et al. observed strong local correlations between MTL 18F-Flortaucipir uptake and longitudinal atrophy specifically in amyloid-positive individuals [18]. Wang et al. reported a strong inverse association between hippocampal tau PET signal and MR-measured volume in amyloid-positive subjects, and found that tau uptake across AD cortical signature regions was linked to cortical thinning mirroring neurofibrillary tangle spread seen at autopsy, suggesting spatially ordered tau-related neurodegeneration [19]. Timmers et al. showed that higher tau binding in Braak stages III/IV and V/VI was associated with reduced gray matter density in both local and broader distant cortical area [20]. The relationship between tau deposition and brain structural changes extends beyond cortical regions, with subtle alterations also observed in hippocampal subfields and adjacent subregions. Das et al. identified significant correlations between MTL tau uptake and reduced volumes in the cornu ammonis 1 (CA1) and subiculum hippocampal subfields [21]. Similarly, Berron et al. demonstrated that increased tau load is associated with local atrophy in the entorhinal cortex, Brodmann area 35, and the anterior hippocampus [22]. These findings collectively suggest that tau pathology is either concurrent with atrophy in early brain regions or closely followed by structural brain changes, and the presence of amyloid pathology appears to strengthen this association. Moreover, studies have linked higher Aβ levels with more extensive and accelerated tau accumulation [23,24], supporting the notion that amyloid may amplify tau-driven structural degeneration in AD.
Given these associations, structural MRI metrics and amyloid burden emerge as strong candidate predictors for tau staging. While numerous studies have employed machine learning techniques to leverage multimodal data to predict amyloid status [25,26,27], fewer have focused on predicting tau status. Kim et al. used a small cohort (n=64) to develop machine learning algorithms incorporating clinical data, neuropsychological tests, cortical thickness, and hippocampal volume to predict abnormal tau accumulation in Braak III/IV region in prodromal Alzheimer's disease, achieving an AUC of 0.86 [28]. With a larger cohort (n=557), Lew et al. employed a deep learning approach directly using T1-weighted MRI, neuropsychological tests, and hippocampal volume to predict tau PET positivity in the meta temporal region, reporting an AUC of 0.73 with high sensitivity (96%) but lower specificity (31%) [29]. The imbalanced performance may stem from the dataset’s skewed distribution (15% tau-positive) due to a high proportion of cognitively normal individuals without strict inclusion criteria for amyloid status or cognitive diagnosis. Karlsson et al. developed a machine learning model to predict tau positivity in Braak I-IV regions using MRI-derived features, achieving AUCs around 0.87-0.89 [30]. Two potential challenges exist with the current models. First, these models were trained with patients that could be either amyloid-positive or negative. In the current amyloid-targeting therapies’ workflow, the tau status is more relevant for the patients who are amyloid-positive as the patients with both amyloid- and tau-positivity may benefit less from the amyloid-targeting therapies. A model specifically trained with amyloid-positive subjects’ data may be more useful for clinical applications. Second, considering the patients being considered for anti-amyloid therapies usually would have amyloid PET data, including the amyloid PET information for the amyloid burden in the models may further improve the model performances, as the amyloid burden is known to be associated with tau staging [23,31]. These findings showed opportunities to further improve classification models as current models require improved predictive power and/or evaluation over the amyloid-positive cohort. More clinically relevant, diverse cohorts and rigorous validation strategies are essential to enhance model robustness and clinical applicability.
In this study, we investigate whether surrogate biomarkers based on MR, amyloid PET, cognitive tests and patient demographic information can be developed with machine learning methods for classification of the tau status in amyloid-positive subjects. Data from ADNI and OASIS were used for model training and validation. Model performances under different data availability scenarios were tested to evaluate what prediction performances can be expected under these scenarios.
Materials and Methods
Datasets
This study utilized two publicly available datasets. The Alzheimer's Disease Neuroimaging Initiative (ADNI-3, adni.loni.usc.edu) data were used for model training and cross-validation [32], and the Open Access Series of Imaging Studies (OASIS-3) dataset served as an external validation dataset [33]. The inclusion criteria included: (1) All subjects must have standard T1-weighted MRI and PET imaging data, including amyloid (18F-Florbetaben, 18F-Florbetapir) and tau (18F-Flortaucipir) scans, collected within 6 months of the T1-weighted MRI. (2) All subjects must be amyloid-positive based on the amyloid PET results. Amyloid positivity was determined using a threshold of 20 Centiloid (CL) [34]. Centiloid levels were made available by the UC Berkeley Study group for ADNI. OASIS-3 database also provided the analyzed and processed Centiloid values on their website. (3) Hippocampal-sparing subjects were excluded from this study as their tau spread pattens significantly deviate from the typical tau pathology. We applied Risacher et al.’s method to identify hippocampal-sparing subtypes in our cohort [35]. Specifically, bilateral cortical total volume (CTV) was calculated by summing gray matter volumes from the lateral frontal, superior temporal, and lateral parietal cortices in both hemispheres, similarly for hippocampal volume (HV). Both CTV and HV were preadjusted for intracranial volume (ICV), scanner strength, age, and sex using regression-derived β coefficients from amyloid-negative, cognitively stable controls in ADNI. The residual values were then used to compute the HV:CTV ratio. Finally, hippocampal-sparing atrophy was defined as HV:CTV ratio greater than its 75th percentile in the amyloid-negative, cognitively stable controls, with HV residual > 0 and CTV residual < 0. The cohort exclusion process was illustrated in the Figure 1. (4) Other than imaging studies, all subjects must have demographic information of age, gender, years of education, and APOE4 genotypes. (5) All subjects must have cognitive tests of Clinical Dementia Rating (CDR) and Mini-Mental State Examination (MMSE) within one year of the T1-weighted MRI study. Diagnosis of the cognitive state was made by ADNI but not in OASIS, so we did not take the diagnosis as part of the inclusion criteria. Included subjects could be cognitively normal, with mild cognitive impairment or with clinical dementia.
Features Used in the Machine Learning Model
Four categories of features were used in the development and validation of our machine learning models: (1) features extracted from standard T1-weighted structural MR, (2) amyloid PET Centiloid values, (3) cognitive tests and (4) subject demographic information.
To extract the structural features from T1-weighted MRI, MRIs were processed using FreeSurfer version 7.3.2 for brain parcellations using the Desikan–Killiany atlas with FreeSurfer’s ‘recon-all’ function, resulting in a feature set that included cortical volumes and thickness for 34 predefined cortical regions, 16 subcortical and 6 ventricular regions [36]. Hippocampal subfield segmentation was performed with the standard T1-weighted MR using FreeSurfer’s ‘segmentHA_T1.sh’ function that generates 24 hippocampal subfield volumes. All volumetric features were normalized by individual total intracranial volume (ICV). PET Centiloid values were taken from ADNI and OASIS as provided on their websites. The cognitive tests included neuropsychological assessments of the CDR-Sum of Boxes (CDR-SOB) and the MMSE that both are available from ADNI and OASIS. Patient demographic information included age, gender, years of education, and APOE ε4 genotype.
Determination of the Tau Status
The reference tau staging based on tau PET was performed under the standardized uptake value ratio (SUVR) computed with the reported pipeline in ADNI [32]. Tau SUVR in ADNI was computed and made available by the UC Berkeley group and we used the provided values [37]. We then replicated the ADNI processing pipeline to process the OASIS-3 tau PET scans. Brain parcellation and cerebellar segmentation was performed using FreeSurfer and the SUIT (Spatially Unbiased Atlas Template of the cerebellum and brainstem) MATLAB toolbox [38] to be applied to the tau PET images coregistered to MR. Partial volume correction was performed using the geometric transfer matrix approach provided by the PETPVC toolbox [39]. After extracting the partial volume-corrected SUVs, the SUVR of the FreeSurfer-segmented regions were calculated using the inferior cerebellar gray matter as the reference region.
Our study defined the high tau burden based on tau-PET SUVRs measured in Braak III/IV composite regions, calculated as volume-weighted averages across predefined regions, including the parahippocampal, fusiform, lingual, amygdala, middle temporal, insula, caudal anterior cingulate, rostral anterior cingulate, posterior cingulate, isthmus cingulate, inferior temporal, and temporal pole. The cutoff (1.516) was chosen as the mean SUVR (1.185) plus two standard deviations (0.165) from cognitively normal participants from ADNI-3 dataset as the reference group [40,41].
Feature Selection
Feature selection was performed to identify the most informative brain regions from four sets of MRI-derived features (number of features in each set): cortical volume (34), cortical thickness (34), hippocampal subfield volume (24), and subcortical/ventricle volume (22). Only data from ADNI were included in the feature selection process. For each feature group, models were first trained for predicting tau positivity using combinations of five regions within the respective group. All possible combinations of five regions within one group under the three classifiers including logistic regression, support vector machine (SVM), and random forest were tested. Machine learning was done with scikit-learn machine learning package in Python [42]. All the resultant models were then ranked based on the area under the receiver operating characteristic (ROC) curve (AUC). Within each feature group, the top 30 models with the highest AUCs were selected. The frequency of each region’s occurrence in these top 30 models was then calculated, resulting in a ranked list of regions’ importance amongst the group. This process was repeated for each feature group—cortical volume, cortical thickness, hippocampal subfield volume, and subcortical/ventricle volume. The final output of this feature selection process was four ranked lists of regions, which will be used for selecting the most useful regions in the subsequent training that incorporates additional clinical and demographic variables.
Model Training
We trained our prediction model using the ADNI dataset, employing machine learning models including logistic regression, support vector machine (SVM), and random forest. To identify the most suitable feature combination for this specific task, we employed a data-driven exploratory approach. We perform model training iterations with all combinations of clinical features (age, gender, APOE4), cognitive tests (CDR-SOB, CDR-O, and MMSE), Centiloid and MRI features (cortical, subcortical/ventricle volume, cortical thickness, and hippocampal subfield volume).
Model Evaluation through cross-validation and external validation
Internal cross-validation was performed with the ADNI data using leave-one-out cross-validation. Model performance metrics within ADNI was calculated, including AUC, accuracy, sensitivity, specificity, and F1-score under the cross-validation. We examined the best performing model (or more precisely, the best feature combination) under the following data availability scenarios: (1) full availability of all features, (2) All features but the CDR-SOB is available, and (3) All features but the Centiloid level is available. In each scenario, the model with the best AUC was chosen. If there are more than one models with the identically leading AUC, the model with the highest F1 was chosen. For the chosen feature combination with best AUC/F1, a model was trained with all the ADNI subjects without the leave-one-out holding. This model was then applied to the OASIS dataset to predict the tau positive/negative status as an external validation. Again, model performance metrics were generated for AUC, accuracy, sensitivity, specificity, and F1-score. OASIS-3 dataset was completely unseen during the feature selection and model training phase to ensure there is no data leakage. We reported the best performing model within each data availability scenario.
Model Performance Across Centiloid Ranges
We also examined the models’ performances in the sub-cohorts of medium and high amyloid burdens in order to evaluate whether a higher amyloid burden is related to the classification difficulties of the machine learning models to classify the tau staging status. Literature shows that a higher amyloid burden is associated with a higher likelihood of tau pathology [23,31] , However, whether tau prediction based on MR features is easier or more difficult in the two groups of medium versus high amyloid groups remains unclear. We used the same approach in model training and validation described previously to separately evaluate the model performances in those two sub-cohorts. Centiloid of 20-70 is regarded as the medium amyloid burden group while Centiloid greater than 70 forms the high amyloid burden group [31,43].
Statistical Analysis
For the comparison of demographic and clinical data, a two-sample t-test was used for continuous variables, and a chi-square test (χ2) was used for categorical variables including sex and APOE genotypes.
Results
Demographics and Clinical Characteristics of Participants
The demographic information of the study cohort is summarized in Table 1. In ADNI, the tau-positive group showed a higher number of years of education (p = 0.003) and a higher frequency of APOE4 carriers (p < 0.001) than the tau-negative. In OASIS, the tau-positive group are older compared to the tau-negative group (p < 0.001), but there were no differences in education and frequency of APOE4 carriers between groups. Across datasets, tau-positive group had significantly worse scores in all the cognitive assessments (MMSE, CDR-SOB and CDR-O) and higher Centiloid.
Feature Selection on FreeSurfer MRI Variables
We have identified the key brain regions from four MRI-derived feature groups of hippocampal subfield volume, cortical thickness, cortical volume, and subcortical/ventricle volume through the feature selection procedure. The top three regions within each group, based on their frequency in the highest-performing models, were:
- o Hippocampal Subfield Volume: Fissure, body, and tail
- o Cortical Thickness: Entorhinal, inferior parietal, and postcentral cortex
- o Cortical Volume: Middle temporal, inferior temporal, and medial orbitofrontal cortex
- o Subcortical/Ventricle Volume: Inferior lateral ventricle, hippocampus, and amygdala
T-tests comparing tau-positive and tau-negative groups were summarized in Table 2 and showed statistically significant differences (p < 0.001) in almost all these top-ranked regions, supporting their relevance for tau staging prediction. The exceptions without significant difference include the left- and right-fissure and the right-medial orbitofrontal cortex.
Model Performance in Predicting Tau Braak III/IV Status
To address different real-world clinical scenarios requiring tau staging estimation, we developed multiple predictive models tailored for distinct clinical applications. We found that the best classification performance was achieved when all data were available with MR, amyloid Centiloid, and CDR-SOB. Model 1, which includes all available variables, demonstrated the best overall performance with an AUC of 0.89 and 84.2% accuracy in the ADNI dataset and an AUC of 0.90 with 90.8% accuracy in the external validation dataset with OASIS. Model 2, which excludes CDR-SOB but keeps the Centiloid, achieved comparable AUC values (0.89 in ADNI and 0.90 in OASIS) but had slightly lower accuracy (81.8% in ADNI and 83.3% in OASIS). Model 3, which excludes Centiloid but keeps CDR-SOB, showed a further decline in sensitivity (71.3% in ADNI and 74.3% in OASIS) and a slightly lower AUC (0.88 in ADNI and 0.87 in OASIS). Overall, Model 1 exhibited the highest specificity (87.9% in ADNI, 95.3% in OASIS) and the best F1 score (74.4% in ADNI, 83.6% in OASIS), making it the most reliable choice when all input features are available. The high F1 score indicates that Model 1 achieves a good balance between sensitivity and precision for an effective detection of positive cases with a lower false positive rate. The drop in performance in Model 3 highlights the importance of Centiloid in tau staging estimation, suggesting that amyloid burden remains a crucial predictive factor.

Table 3.
Model Performance for Tau Staging Prediction in Internal (ADNI) and External (OASIS) Datasets.
Table 3.
Model Performance for Tau Staging Prediction in Internal (ADNI) and External (OASIS) Datasets.
| ADNI (n=380, 115 pos / 265 neg) | OASIS (n=120, 35 pos / 85 neg) | |||||||||||
| SENS | SPEC | PREC | F1 | ACC | AUC | SENS | SPEC | PREC | F1 | ACC | AUC | |
| Model 1 | 75.7 | 87.9 | 73.1 | 0.744 | 84.2 | 0.89 | 80.0 | 95.3 | 87.5 | 0.836 | 90.8 | 0.90 |
| Model 2 | 78.3 | 83.4 | 67.2 | 0.723 | 81.8 | 0.89 | 80.0 | 84.7 | 68.3 | 0.737 | 83.3 | 0.90 |
| Model 3 | 71.3 | 83.4 | 65.1 | 0.681 | 79.7 | 0.88 | 74.3 | 87.1 | 70.3 | 0.722 | 83.3 | 0.87 |
| Model Type & Input Feature |
Model 1 (SVM): Our best model with highest AUC/F1 score Age, CDR-O, Centiloid, Top4 subcortical/ventricular volume, Top3 hippocampal subfield volume, Top2 cortical thickness, Top1 cortical volume Model 2 (logistic regression): Best model without CDR-SOB Age, sex, Centiloid, Top3 hippocampal subfield volume, Top2 cortical thickness, Top1 cortical volume Model 3 (SVM): Best model without Centiloid Age, sex, MMSE, Top3 hippocampal subfield volume, Top2 cortical thickness, Top1 cortical volume |
|||||||||||
| *SENS, sensitivity (%); SPEC, specificity (%); PREC, precision (%); ACC, accuracy (%); AUC, Area under the receiver operating characteristic curve. | ||||||||||||
Comparison of Model Performance Across Centiloid Ranges
To further assess the impact of Centiloid on tau staging prediction, we compared the performance of Model 1 (with the full set of features including Centiloid) and Model 3 (without Centiloid) between medium and high amyloid cohorts in both ADNI and OASIS cohorts. In the medium Centiloid group (20–70 Centiloid), Model 1 exhibited imbalanced performance that highly favors the specificity with reduced sensitivity in both datasets. In ADNI (23pos/166neg), it achieved 95.8% specificity but only 47.8% sensitivity, while in OASIS (8pos/61neg), specificity reached 100%, but sensitivity dropped further to 37.5%. This suggests that Model 1 tends to classify cases with lower Centiloid as tau-negative, possibly over-relying on Centiloid values in decision-making. In contrast, Model 3, which does not include Centiloid, demonstrated better sensitivity (65.2% in ADNI and 50% in OASIS), suggesting that it may depend more on MRI-derived structural features and cognitive measures, leading to a more balanced sensitivity-specificity trade-off in this group. Balanced accuracy was slightly higher for Model 3 (76.9% in ADNI and 70.1% in OASIS) compared to Model 1 (71.8% in ADNI and 68.8% in OASIS) in both datasets, reinforcing its ability to better detect tau pathology in this range.
In the high Centiloid group (≥ 70 Centiloid), Model 1 consistently outperformed Model 3 in both datasets. In ADNI (92pos/99neg) where Model 1 achieved 82.6% sensitivity and an F1 score of 78.8%, compared to Model 3’s 72.8% in both sensitivity and F1 score. The pattern was even more pronounced in OASIS (27pos/24neg) where Model 1 reached 92.6% sensitivity, and 83.3% specificity compared to 81.5% and 79.1% in Model 3. This indicates that when Centiloid levels are high, Model 1 takes advantage of Centiloids and strengthens its predictive power, allowing it to better identify tau-positive cases with high sensitivity while maintaining competitive specificity and overall classification performance.
Overall, these findings suggest a trade-off between the two models depending on Centiloid levels. Model 3's greater dependence on MRI variables allows it to better capture nuanced structural changes associated with tau pathology, leading to higher sensitivity without over-relying on Centiloid in the medium CL range. In contrast, Model 1 outperforms Model 3 in the high Centiloid range, achieving the highest sensitivity and F1 scores. This suggests that Centiloid is not only a binary marker for amyloid positivity but also carrying additional and valuable information for predicting tau pathology through its quantitative levels of amyloid burdens.
Table 4.
Comparison of Model 1 and Model 3 Performance Across Centiloid Ranges in ADNI and OASIS Cohorts.
Table 4.
Comparison of Model 1 and Model 3 Performance Across Centiloid Ranges in ADNI and OASIS Cohorts.
| ADNI | OASIS | ||||||||||
| SENS | SPEC | F1 | ACC | AUC | SENS | SPEC | F1 | ACC | AUC | ||
| Medium CL |
Model 1 | 47.8 | 95.8 | 0.536 | 90 | 0.82 | 37.5 | 100 | 0.546 | 92.8 | 0.71 |
| Model 3 | 65.2 | 88.6 | 0.526 | 85.7 | 0.88 | 50 | 90.2 | 0.444 | 85.5 | 0.73 | |
| High CL |
Model 1 | 82.6 | 74.8 | 0.788 | 78.5 | 0.85 | 92.6 | 83.3 | 0.893 | 88.2 | 0.90 |
| Model 3 | 72.8 | 74.8 | 0.728 | 73.8 | 0.84 | 81.5 | 79.2 | 0.815 | 80.4 | 0.88 | |
| *CL, Centiloid; SENS, sensitivity (%); SPEC, specificity (%); PREC, precision (%); ACC, accuracy (%); AUC, Area under the receiver operating characteristic curve. | |||||||||||
Discussion
The emergence of amyloid-targeting therapies, such as Lecanemab and Donanemab, has reshaped the therapeutic landscape for AD. However, their efficacy may vary due to the disease progression, especially the advancement of tau pathology. An accurate stratification of patients for their tau status may be helpful and desirable in clinical pre-treatment evaluation of AD patients. Notably, results from the TRAILBLAZER-ALZ 2 clinical trial demonstrated that Donanemab provided greater clinical benefit when administered to patients with lower tau burden, as determined by tau-PET imaging [11]. Given the high cost and limited availability of tau-PET, MRI-based biomarkers could serve as a cost-effective stratification tool to identify patients most likely to benefit from anti-amyloid therapy. In addition, there are several promising candidates of anti-tau therapies in phase III clinical trials such as E2814 and LMTM [44,45]. Combinational therapies that target both amyloid and tau are also being explored to address the multifaceted nature of AD. For example, the Alzheimer’s Tau Platform (ATP) is evaluating the combined effects of amyloid- and tau-targeting interventions, with preliminary findings suggesting a multi-modal approach may enhance disease modification compared to monotherapies [46]. Although tau-PET remains the gold standard for identifying patients most suitable for these therapies, its limited accessibility and high costs pose a significant barrier for being widely used as a routine exam. A surrogate tau marker could serve as a valuable pre-screening tool, facilitate better clinical trial design and direct these therapies towards the right patient populations, ultimately paving the way for a more personalized treatment paradigm for AD.
Our study aimed to investigate the effectiveness of machine learning models based on amyloid-PET and MRI-derived imaging features—both routinely available during the pre-treatment evaluation of anti-amyloid therapies—to predict tau-PET staging status in amyloid-positive patients as a surrogate marker for tau pathology without requiring tau-PET imaging or lumbar puncture for CSF tau tests. This focus aligns with the current anti-amyloid pre-treatment evaluation procedures and is specifically designed to target the amyloid-positive patients that are potentially eligible for anti-amyloid therapies. We leveraged two independent datasets, ADNI (n=380) and OASIS (n=120) that provided a sufficiently large sample size for model training and validation. Our best-performing model, a SVM classifier utilizing features of age, CDR-SOB, Centiloid, and selected subcortical and cortical measurements, achieved a strong performance with 75.7% sensitivity, 87.9% specificity, and AUC of 0.89 in ADNI cross-validation, and 80% sensitivity, 95.3% specificity, and AUC of 0.90 in external validation with OASIS, as detailed in Table 1. If CDR-SOB is unavailable, our best performing model still reached nearly the same AUC with a slight drop in accuracy of roughly 4% from Model 1. However, if amyloid Centiloid is unavailable, a more significant performance drop was observed with a drop in AUC by 0.01 to 0.03 and accuracy drop of approximately 7%. Overall, our results suggest that it is feasible to achieve a satisfactory classification performance to predict the tau status with structural MRI, amyloid PET and optionally available cognitive test of CDR. No additional information or scans are required in our models. It is also noteworthy that our method only requires the standard T1-weighted structural images without needing the high-resolution T2 images for hippocampal subfield segmentation. Although the current model performance may yet be clinically ready to stage the tau spread, such models may serve as screening tools for personalized treatment planning. For example, patients that are classified as high tau likelihood may be considered for tau PET scans as a verification of the tau pathology, while patients predicted to be most likely with low or moderate tau pathology may proceed with the anti-amyloid treatment. The proposed model and feature sets may also serve as a good backbone for future model development of similar classification tasks.
Compared to prior studies by Lew et al. [29] and Karlsson et al. [30], the main difference of our work is in the study design, where we specifically targeted only the amyloid positive subjects. The key rationale for our study design is to mimic the scenarios encountered in the pre-treatment evaluations of anti-amyloid therapies. Only 15% of Lew et al.’s cohort were tau-positive, limiting the model's ability to generalize to more relevant clinical contexts in the amyloid-positive dementia patients where tau positivity rates can be higher. Kim et al. targeted amyloid-positive patients but relied on a small sample (n=64) [28]. In contrast, our model specifically targets amyloid-positive patients with a 30% tau-positive rate, resembling the patient distribution in the donanemab TRAILBLAZER-ALZ 2 Phase 3 study (where 30.3% are tau positive). Methodologically, while Lew et al. employed resource-intensive deep learning approaches, we utilized lightweight machine learning with feature selection to enhance model efficiency and to reduce the overfitting risk, making our model potentially easier for clinical applications. Another advantage of our model is that we generated the MR features with T1-weighted images and FreeSurfer, one of the most popular and commonly used research open-source tool for processing brain MRI, so that future deployment of the developed model can be easier and more efficient in other institutions. Performance-wise, our model outperforms Kim et al.’s (AUC 0.86) and Lew et al.’s (AUC 0.73, specificity 31%), demonstrating higher AUCs and a more balanced sensitivity-specificity profile across datasets. A recent work of Karlsson et al. demonstrated that MR-based tau classification is feasible with a large sample size (n>1300) [30]. Similar model performances were found between their work and ours as the best-performing model reaches 0.89 AUC. However, similar to Lew et al.’s work, this study did not specifically target the amyloid-positive cohort. In terms of the included features for machine learning, Karlsson et al.’s work utilized FreeSurfer volumes, surface areas and thicknesses of cortical regions, volumes of subcortical brain regions, total white matter hyperintensities, whereas we have additionally included the amyloid burden and hippocampal subfields. It will be desirable to further expand our datasets for model training and validation by including more sources of data, so that a more comprehensive training and testing for the proposed models may be achieved in the future.
Our predictive modeling analysis revealed important trade-offs between models with and without amyloid burden quantification made through the Centiloid. In the complete cohort, Model 1 (with Centiloid) outperformed other models in overall accuracy, specificity, and F1 score, making it the most reliable choice when all input features are available. However, in the medium Centiloid sub-cohort (20–70 Centiloid), Model 1 exhibited lower sensitivity, likely due to an over-reliance on Centiloid values, which may lead to the misclassification of tau-positive cases as false negatives. In contrast, Model 3 (without Centiloid) demonstrated better sensitivity and balanced accuracy in this sub-cohort, suggesting that relying more on MRI-derived structural features and cognitive measures better detected high tau patient in lower Centiloid range. In contrast, for the high Centiloid sub-cohort (≥70 Centiloid), Model 1 showed a superior performance, achieving the highest overall accuracy across datasets. This suggests that Centiloid level is particularly valuable in distinguishing tau positivity when amyloid burden is high. Inclusion of Centiloid significantly impacted model performance, indicating that an adaptive approach that adjusts Centiloid weighting based on tau burden may further improve classification accuracy. It also suggests that high-amyloid and medium-amyloid subjects may own different trajectories for developing the tau pathology. Future work should explore integrating dynamic weighting mechanisms for Centiloid and MRI-derived features to optimize sensitivity and specificity across different tau burdens.
There are two limitations of this study. First, there is not a standardized definition or consensus for determining the tau status with tau-PET. We defined tau burden levels using tau-PET SUVR in Braak III/IV regions, as Braak I/II is primarily age-related and not specific to AD, while Braak V/VI may represent a stage too advanced for effective anti-amyloid intervention [47,48]. However, there is no established consensus on defining tau-PET SUVR cutoffs across different Braak stages. We applied a cutoff set at the mean SUVR plus two standard deviations, a commonly used criteria in the literature [40,41], using cognitively normal participants from the ADNI-3 dataset as the reference group. The observed tau positivity rate (~30%) in our study is similar with findings from previous Donanemab trials. The other limitation lies in the sample size of the study. Although we were able to achieve a moderate sample size of 500 cases for about 2:1 training/validation data ratio, a larger sample size will indeed benefit the model generalizability and reliability. Future expansion of the datasets shall be beneficial for the proposed model, especially if cohorts with greater ethnic and racial diversities may be included.
Conclusion
Our study demonstrates the effectiveness of amyloid-PET and MRI-derived imaging features in predicting tau-PET staging status among amyloid-positive patients, offering a cost-effective, clinically accessible surrogate marker for tau pathology without requiring tau-PET imaging. Clinically, this approach holds a good potential for personalized treatment planning for current and future disease-modifying therapies of AD.
Acknowledgements
The ADNI data collection and sharing was funded by the Alzheimer's Disease Neuroimaging Initiative (ADNI) (National Institutes of Health Grant U01 AG024904) and DOD ADNI (Department of Defense award number W81XWH-12-2-0012). ADNI is funded by the National Institute on Aging, the National Institute of Biomedical Imaging and Bioengineering, and through generous contributions from the following: AbbVie, Alzheimer’s Association; Alzheimer’s Drug Discovery Foundation; Araclon Biotech; BioClinica, Inc.; Biogen; Bristol-Myers Squibb Company; CereSpir, Inc.; Cogstate; Eisai Inc.; Elan Pharmaceuticals, Inc.; Eli Lilly and Company; EuroImmun; F. Hoffmann-La Roche Ltd and its affiliated company Genentech, Inc.; Fujirebio; GE Healthcare; IXICO Ltd.; Janssen Alzheimer Immunotherapy Research & Development, LLC.; Johnson & Johnson Pharmaceutical Research & Development LLC.; Lumosity; Lundbeck; Merck & Co., Inc.; MesoScale Diagnostics, LLC.; NeuroRx Research; Neurotrack Technologies; Novartis Pharmaceuticals Corporation; Pfizer Inc.; Piramal Imaging; Servier; Takeda Pharmaceutical Company; and Transition Therapeutics. The Canadian Institutes of Health Research is providing funds to support ADNI clinical sites in Canada. Private sector contributions are facilitated by the Foundation for the National Institutes of Health (www.fnih.org). The grantee organization is the Northern California Institute for Research and Education, and the study is coordinated by the Alzheimer’s Therapeutic Research Institute at the University of Southern California. ADNI data are disseminated by the Laboratory for Neuro Imaging at the University of Southern California. The OASIS data was provided by the ADRC at Washington University acquired under: OASIS-3: Longitudinal Multimodal Neuroimaging: Principal Investigators: T. Benzinger, D. Marcus, J. Morris; NIH P30 AG066444, P50 AG00561, P30 NS09857781, P01 AG026276, P01 AG003991, R01 AG043434, UL1 TR000448, R01 EB009352. AV-45 doses were provided by Avid Radiopharmaceuticals, a wholly owned subsidiary of Eli Lilly. OASIS-3_AV1451: Principal Investigators: T. Benzinger, J. Morris; NIH P30 AG066444, AW00006993. AV-1451 doses were provided by Avid Radiopharmaceuticals, a wholly owned subsidiary of Eli Lilly.
Conflicts of Interest
The authors declare no conflicts of interest.
References
- Zhang, Y., Chen. Amyloid beta-based therapy for Alzheimer's disease: challenges, successes and future. Signal Transduct Target Ther 2023, 8, 248. [Google Scholar] [CrossRef] [PubMed]
- Hardy, J. A.; Higgins, G. A. Alzheimer's disease: the amyloid cascade hypothesis. Science 1992, 256, 184–185. [Google Scholar] [CrossRef]
- Administration, U. S. F. a. D. FDA Converts Novel Alzheimer’s Disease Treatment to Traditional Approval. (2023).
- Administration, U. S. F. a. D. FDA Approves Treatment for Adults with Alzheimer’s Disease. (2024).
- Congdon, E. E.; Ji, C.; Tetlow, A. M.; Jiang, Y.; Sigurdsson, E. M. Tau-targeting therapies for Alzheimer disease: current status and future directions. Nat Rev Neurol 2023, 19, 715–736. [Google Scholar] [CrossRef]
- Malpetti, M., Joie. Tau Beats Amyloid in Predicting Brain Atrophy in Alzheimer Disease: Implications for Prognosis and Clinical Trials. J Nucl Med 2022, 63, 830–832. [Google Scholar] [CrossRef]
- Ossenkoppele, R.; et al. Tau PET patterns mirror clinical and neuroanatomical variability in Alzheimer's disease. Brain 2016, 139, 1551–1567. [Google Scholar] [CrossRef]
- Whitwell, J. L.; et al. Imaging correlations of tau, amyloid, metabolism, and atrophy in typical and atypical Alzheimer's disease. Alzheimers Dement 2018, 14, 1005–1014. [Google Scholar] [CrossRef] [PubMed]
- Cho, H.; et al. In vivo cortical spreading pattern of tau and amyloid in the Alzheimer disease spectrum. Ann Neurol 2016, 80, 247–258. [Google Scholar] [CrossRef] [PubMed]
- Braak, H.; Braak, E. Neuropathological stageing of Alzheimer-related changes. Acta Neuropathol 1991, 82, 239–259. [Google Scholar] [CrossRef]
- Sims, J. R.; et al. Donanemab in Early Symptomatic Alzheimer Disease: The TRAILBLAZER-ALZ 2 Randomized Clinical Trial. JAMA 2023, 330, 512–527. [Google Scholar] [CrossRef]
- Cogswell, P. M.; et al. Amyloid-Related Imaging Abnormalities with Emerging Alzheimer Disease Therapeutics: Detection and Reporting Recommendations for Clinical Practice. AJNR Am J Neuroradiol 2022, 43, E19–E35. [Google Scholar] [CrossRef]
- Inc., E. EISAI'S APPROACH TO U.S. PRICING FOR LEQEMBI™ (LECANEMAB), A TREATMENT FOR EARLY ALZHEIMER'S DISEASE, SETS FORTH OUR CONCEPT OF "SOCIETAL VALUE OF MEDICINE" IN RELATION TO "PRICE OF MEDICINE".
- Association, A. s. Donanemab Approved for Treatment of Early Alzheimer’s, https://www.alz.org/alzheimers-dementia/treatments/donanemab (2024).
- Arbanas, J. C.; et al. Estimated Annual Spending on Lecanemab and Its Ancillary Costs in the US Medicare Program. JAMA Intern Med 2023, 183, 885–889. [Google Scholar] [CrossRef] [PubMed]
- Jack, C. R., Jr.; et al. Revised criteria for diagnosis and staging of Alzheimer's disease: Alzheimer's Association Workgroup. Alzheimers Dement 2024, 20, 5143–5169. [Google Scholar] [CrossRef] [PubMed]
- Iaccarino, L.; et al. Local and distant relationships between amyloid, tau and neurodegeneration in Alzheimer's Disease. Neuroimage Clin 2018, 17, 452–464. [Google Scholar] [CrossRef]
- Das, S. R.; et al. Longitudinal and cross-sectional structural magnetic resonance imaging correlates of AV-1451 uptake. Neurobiol Aging 2018, 66, 49–58. [Google Scholar] [CrossRef]
- Wang, L.; et al. Evaluation of Tau Imaging in Staging Alzheimer Disease and Revealing Interactions Between beta-Amyloid and Tauopathy. JAMA Neurol 2016, 73, 1070–1077. [Google Scholar] [CrossRef]
- Timmers, T.; et al. Associations between quantitative [(18)F]flortaucipir tau PET and atrophy across the Alzheimer's disease spectrum. Alzheimers Res Ther 2019, 11, 60. [Google Scholar] [CrossRef] [PubMed]
- Das, S. R.; et al. In vivo measures of tau burden are associated with atrophy in early Braak stage medial temporal lobe regions in amyloid-negative individuals. Alzheimers Dement 2019, 15, 1286–1295. [Google Scholar] [CrossRef]
- Berron, D.; et al. Early stages of tau pathology and its associations with functional connectivity, atrophy and memory. Brain 2021, 144, 2771–2783. [Google Scholar] [CrossRef]
- Lauber, M. V.; et al. Global amyloid burden enhances network efficiency of tau propagation in the brain. J Alzheimers Dis 2024, 13872877241294084. [Google Scholar] [CrossRef]
- Jack, C. R.; et al. The bivariate distribution of amyloid-beta and tau: relationship with established neurocognitive clinical syndromes. Brain 2019, 142, 3230–3242. [Google Scholar] [CrossRef]
- Tosun, D.; et al. Detection of beta-amyloid positivity in Alzheimer's Disease Neuroimaging Initiative participants with demographics, cognition, MRI and plasma biomarkers. Brain Commun 2021, 3, fcab008. [Google Scholar] [CrossRef] [PubMed]
- Ten Kate, M.; et al. MRI predictors of amyloid pathology: results from the EMIF-AD Multimodal Biomarker Discovery study. Alzheimers Res Ther 2018, 10, 100. [Google Scholar] [CrossRef] [PubMed]
- Ansart, M.; et al. Reduction of recruitment costs in preclinical AD trials: validation of automatic pre-screening algorithm for brain amyloidosis. Stat Methods Med Res 2020, 29, 151–164. [Google Scholar] [CrossRef]
- Kim, J.; et al. Prediction of tau accumulation in prodromal Alzheimer's disease using an ensemble machine learning approach. Sci Rep 2021, 11, 5706. [Google Scholar] [CrossRef] [PubMed]
- Lew, C. O.; et al. MRI-based Deep Learning Assessment of Amyloid, Tau, and Neurodegeneration Biomarker Status across the Alzheimer Disease Spectrum. Radiology 2023, 309, e222441. [Google Scholar] [CrossRef]
- Karlsson, L.; et al. Machine learning prediction of tau-PET in Alzheimer's disease using plasma, MRI, and clinical data. Alzheimers Dement 2025, 21, e14600. [Google Scholar] [CrossRef]
- Dore, V.; et al. Relationship between amyloid and tau levels and its impact on tau spreading. Eur J Nucl Med Mol Imaging 2021, 48, 2225–2232. [Google Scholar] [CrossRef]
- Weiner, M. W.; et al. The Alzheimer's Disease Neuroimaging Initiative 3: Continued innovation for clinical trial improvement. Alzheimers Dement 2017, 13, 561–571. [Google Scholar] [CrossRef]
- LaMontagne, P. J., Benzinger, T.L., Morris, J.C., Keefe, S., Hornbeck, R., Xiong, C., Grant, E., Hassenstab, J., Moulder, K., Vlassenko, A.G. and Raichle, M.E. OASIS-3: Longitudinal Neuroimaging, Clinical, and Cognitive Dataset for Normal Aging and Alzheimer Disease. 2019-12. (2019).
- Salvado, G.; et al. Centiloid cut-off values for optimal agreement between PET and CSF core AD biomarkers. Alzheimers Res Ther 2019, 11, 27. [Google Scholar] [CrossRef]
- Risacher, S. L.; et al. Alzheimer disease brain atrophy subtypes are associated with cognition and rate of decline. Neurology 2017, 89, 2176–2186. [Google Scholar] [CrossRef]
- Fischl, B. FreeSurfer. Neuroimage 2012, 62, 774–781. [Google Scholar] [CrossRef]
- Maass, A.; et al. Comparison of multiple tau-PET measures as biomarkers in aging and Alzheimer's disease. Neuroimage 2017, 157, 448–463. [Google Scholar] [CrossRef]
- Diedrichsen, J. & Zotow, E. Surface-Based Display of Volume-Averaged Cerebellar Imaging Data. PLoS One 2015, 10, e0133402. [Google Scholar] [CrossRef]
- Thomas, B. A.; et al. PETPVC: a toolbox for performing partial volume correction techniques in positron emission tomography. Phys Med Biol 2016, 61, 7975–7993. [Google Scholar] [CrossRef] [PubMed]
- Ossenkoppele, R.; et al. Discriminative Accuracy of [18F]flortaucipir Positron Emission Tomography for Alzheimer Disease vs Other Neurodegenerative Disorders. JAMA 2018, 320, 1151–1162. [Google Scholar] [CrossRef] [PubMed]
- Ossenkoppele, R.; et al. The impact of demographic, clinical, genetic, and imaging variables on tau PET status. Eur J Nucl Med Mol Imaging 2021, 48, 2245–2258. [Google Scholar] [CrossRef]
- Pedregosa F, V. G., Gramfort A, Michel V, Thirion B, Grisel O, Blondel M, Prettenhofer P, Weiss R, Dubourg V, Vanderplas J. Scikit-learn: Machine learning in Python. the Journal of machine Learning research 2011, 12, 2825–2830.
- Knopman, D. S.; et al. Association of Initial beta-Amyloid Levels With Subsequent Flortaucipir Positron Emission Tomography Changes in Persons Without Cognitive Impairment. JAMA Neurol 2021, 78, 217–228. [Google Scholar] [CrossRef]
- ALZFORUM. E2814, https://www.alzforum.org/therapeutics/e2814 (2025).
- Wood, H. Trial watch: Phase III trial of anti-tau drug generates mixed messages. Nat Rev Neurol 2016, 12, 493. [Google Scholar] [CrossRef]
- Health, N. I. o. The Alzheimer's Disease Tau Platform Clinical Trial, https://reporter.nih.gov/search/4xoIOBmJRk-qve8cJ_qPFg/project-details/10655872 (.
- Crary, J. F.; et al. Primary age-related tauopathy (PART): a common pathology associated with human aging. Acta Neuropathol 2014, 128, 755–766. [Google Scholar] [CrossRef]
- Scholl, M.; et al. PET Imaging of Tau Deposition in the Aging Human Brain. Neuron 2016, 89, 971–982. [Google Scholar] [CrossRef] [PubMed]
Figure 1.
Data Inclusion Process for ADNI and OASIS.
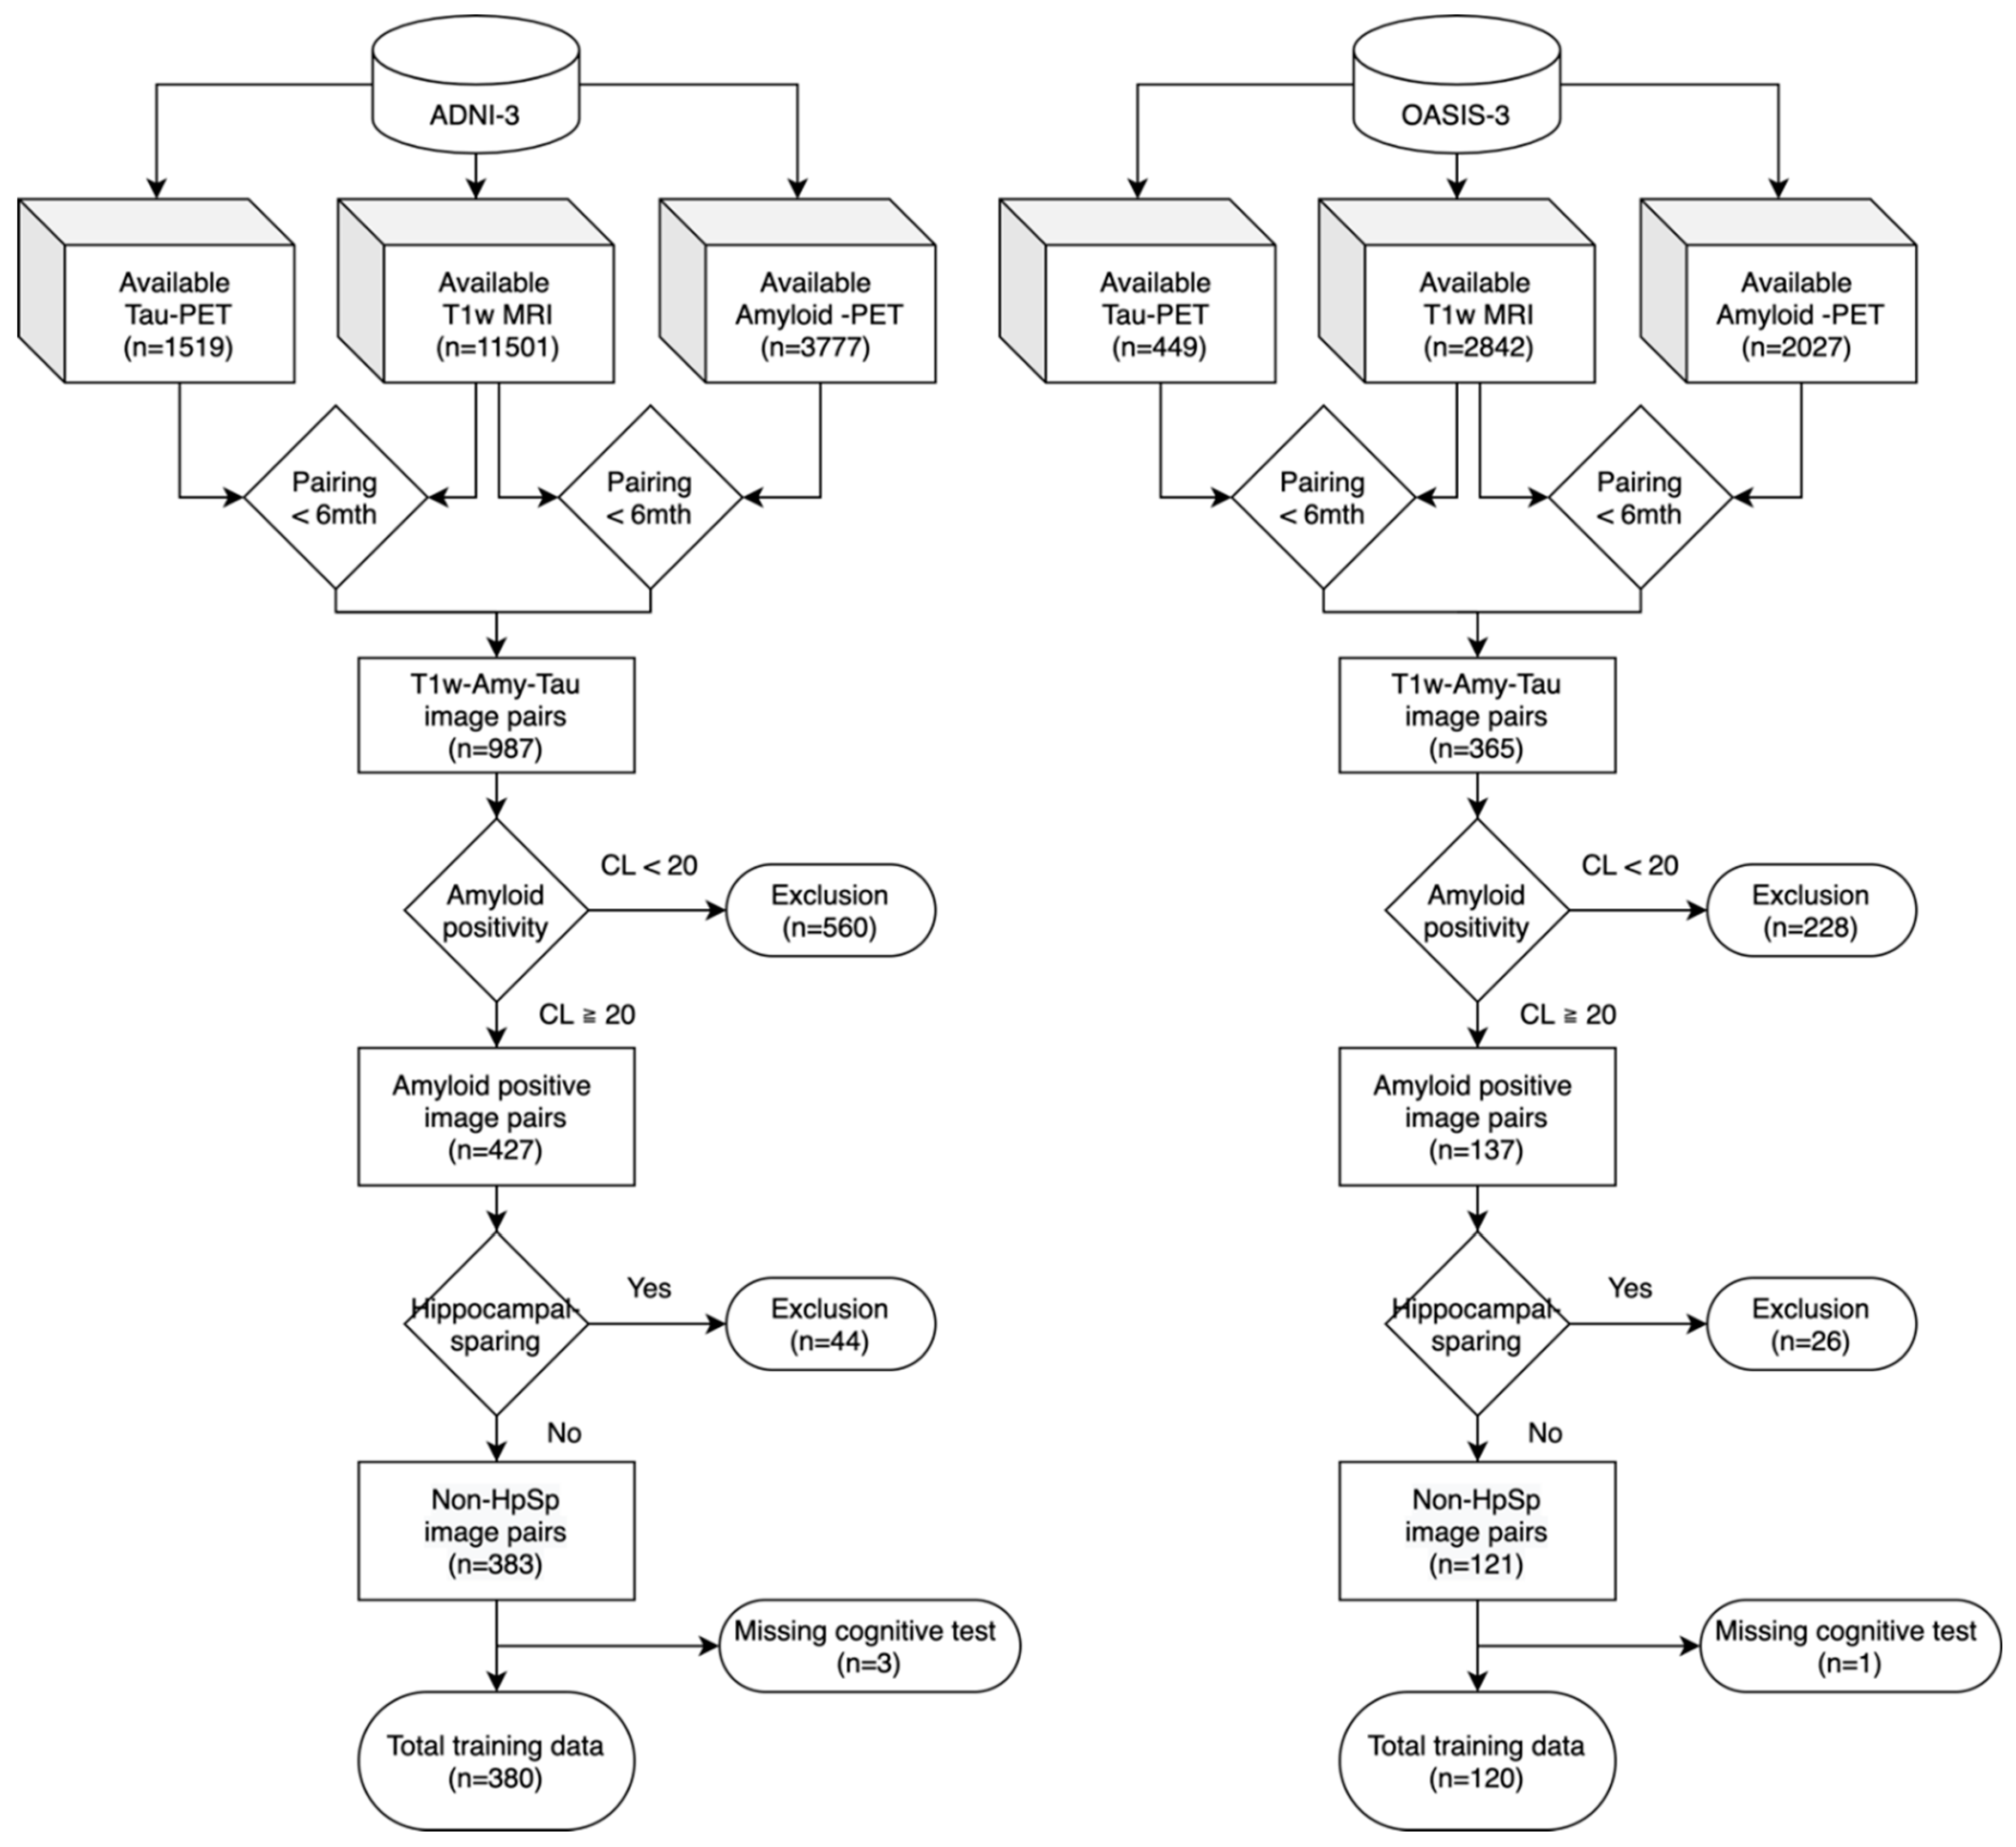
Table 1.
Demographics and biomarkers of tau-positive and tau-negative participants in ADNI and OASIS datasets.
Table 1.
Demographics and biomarkers of tau-positive and tau-negative participants in ADNI and OASIS datasets.
| ADNI | OASIS | |||||
| Tau-negative | Tau-Positive | p-value | Tau-negative | Tau-Positive | p-value | |
| total | 265 | 115 | - | 85 | 35 | - |
| sex - female | 143 | 61 | - | 60 | 19 | - |
| male | 122 | 54 | 0.96 | 25 | 16 | 0.0944 |
| Age (year) | 75.72 ± 7.18 | 74.18 ± 7.94 | 0.06 | 70.73 ± 6.87 | 75.29 ± 6.49 | 5.95E-4 *** |
| Education (year) | 16.59 ± 2.38 | 15.79 ± 2.39 | 0.00275 ** | 16.44 ± 2.48 | 15.51 ± 2.59 | 0.0904 |
| MMSE | 28.02 ± 2.73 | 24.53 ± 4.21 | < 1E-6 *** | 29.09 ± 1.44 | 25.80 ± 4.21 | < 1E-6 *** |
| CDR-SOB | 0.91 ± 1.58 | 3.51 ± 3.17 | < 1E-6 *** | 0.26 ± 0.72 | 2.34 ± 2.18 | < 1E-6 *** |
| CDR-O | 0.15 ± 0.33 | 0.63 ± 0.66 | < 1E-6 *** | 0.04 ± 0.13 | 0.43 ± 0.42 | < 1E-6 *** |
| APOE4 + | 148 (56%) | 86 (75%) | - | 44 (52%) | 24 (69%) | - |
| APOE4 - | 117 (44%) | 29 (25%) | 7.49E-4 *** | 41 (48%) | 11 (31%) | 0.19 |
| DX - CN | 152 (57%) | 13 (11%) | - | - | - | - |
| MCI | 88 (33%) | 52 (45%) | - | - | - | - |
| AD | 25 (10%) | 50 (43%) | < 1E-6 *** | - | - | - |
| Centiloid | 63.22 ± 33.36 | 97.34 ± 34.04 | < 1E-6 *** | 53.65 ± 29.96 | 95.55 ± 36.84 | < 1E-6 *** |
| *MMSE, Mini-Mental State Examination; CDR-SOB, Clinical Dementia Rating-Sum of Box; CDR-O, Clinical Dementia Rating-Orientation; APOE4, Apolipoprotein E4 genotype; CN, cognitive normal; MCI, mild cognitive decline. p-value <0.05* <0.01** <0.001*** | ||||||
Table 2.
Top brain regions selected for tau staging status prediction and statistical comparison between tau-positive and tau-negative ADNI cohorts.
Table 2.
Top brain regions selected for tau staging status prediction and statistical comparison between tau-positive and tau-negative ADNI cohorts.
| Feature Group | Brain Region | Tau-negative (n=265) | Tau-positive (n=115) | p-value |
| Mean (std) | Mean (std) | |||
| Hippocampal Subfield Volume | Left-fissure | 0.00010 (2.0E-5) | 0.00010 (1.7E-5) | 2.9E-1 |
| Right-fissure | 0.00011 (2.2E-5) | 0.00011 (1.7E-5) | 1.3E-1 | |
| Left-tail | 0.00032 (5.7E-5) | 0.00028 (4.9E-5) | < 1E-6 *** | |
| Right-tail | 0.00034 (5.5E-5) | 0.00029 (5.0E-5) | < 1E-6 *** | |
| Left-body | 0.00069 (1.0E-4) | 0.00059 (9.2E-5) | < 1E-6 *** | |
| Right-body | 0.00070 (1.0E-4) | 0.00061 (9.6E-5) | < 1E-6 *** | |
| Cortical Thickness | Left-entorhinal | 3.03 (0.33) | 2.73 (0.44) | < 1E-6 *** |
| Right-entorhinal | 3.10 (0.36) | 2.80 (0.42) | < 1E-6 *** | |
| Left-inferiorparietal | 2.30 (0.11) | 2.19 (0.15) | < 1E-6 *** | |
| Right-inferiorparietal | 2.34 (0.12) | 2.23 (0.17) | < 1E-6 *** | |
| Left-postcentral | 2.05 (0.12) | 2.01 (0.13) | 1.6E-3 ** | |
| Right-postcentral | 2.05 (0.13) | 1.99 (0.14) | 1.1E-4 *** | |
| Cortical Volume | Left-middletemporal | 0.0065 (8.8E-4) | 0.0057 (8.1E-4) | < 1E-6 *** |
| Right-middletemporal | 0.0072 (9.2E-4) | 0.0064 (8.0E-4) | < 1E-6 *** | |
| Left-inferiortemporal | 0.0067 (9.6E-4) | 0.0058 (9.4E-4) | < 1E-6 *** | |
| Right-inferiortemporal | 0.0065 (9.0E-4) | 0.0059 (9.1E-4) | < 1E-6 *** | |
| Left-medialorbitofrontal | 0.0033 (3.9E-4) | 0.0032 (3.7E-4) | 6.4E-3 ** | |
| Right-medialorbitofrontal | 0.0036 (3.9E-4) | 0.0035 (3.8E-4) | 3.7E-1 | |
| Subcortical/ Ventricle Volume |
Left-Inf-Lat-Vent | 0.0005 (3.9E-4) | 0.0009 (6.6E-4) | < 1E-6 *** |
| Right-Inf-Lat-Vent | 0.0005 (4.0E-4) | 0.0009 (5.7E-4) | < 1E-6 *** | |
| Left-Hippocampus | 0.0024 (3.4E-4) | 0.0021 (3.0E-4) | < 1E-6 *** | |
| Right-Hippocampus | 0.0025 (3.6E-4) | 0.0021 (3.2E-4) | < 1E-6 *** | |
| Left-Amygdala | 0.0009 (1.7E-4) | 0.0008 (1.6E-4) | < 1E-6 *** | |
| Right-Amygdala | 0.0005 (3.9E-4) | 0.0009 (6.6E-4) | < 1E-6 *** | |
| p-value <0.05* <0.01** <0.001*** | ||||
Disclaimer/Publisher’s Note: The statements, opinions and data contained in all publications are solely those of the individual author(s) and contributor(s) and not of MDPI and/or the editor(s). MDPI and/or the editor(s) disclaim responsibility for any injury to people or property resulting from any ideas, methods, instructions or products referred to in the content. |
© 2025 by the authors. Licensee MDPI, Basel, Switzerland. This article is an open access article distributed under the terms and conditions of the Creative Commons Attribution (CC BY) license (http://creativecommons.org/licenses/by/4.0/).
Copyright: This open access article is published under a Creative Commons CC BY 4.0 license, which permit the free download, distribution, and reuse, provided that the author and preprint are cited in any reuse.


