Preprint
Article

This version is not peer-reviewed.

Balancing Tourism Seasonality: The Role of Tourism Destination Image (TDI) and Spatial Levels (SL)

Jie Wang  *
,
Xi Chen  *
A peer-reviewed article of this preprint also exists.

Submitted:

06 March 2025

Posted:

06 March 2025

You are already at the latest version

Abstract

Balancing tourism seasonality remains a significant challenge in the management of tourist attractions. Despite existing research on the impact of seasonality from the perspectives of tourist intention cognition and spatial theory, gaps still exist in the relevant literature. This study examines 16 5A-level scenic spots in China with peak-season, flat-season, and off-season, utilizing 8,385 tourist reviews from Ctrip.com as data. The LDA topic model is employed to analyze Tourism destination image (TDI) under seasonality of destination, and the spatial levels (SL) model is combined to analyze the spatial hierarchy of these images. The findings reveal an association between TDI and the SL under seasonality of destination. For instance, peak-season TDI themes (e.g., 'viewing the scenery') exhibit a support level of 0.789, while off-season themes (e.g., 'relaxed itinerary') reach 0.682, reflecting tourists’ prioritization of functional versus psychological dimensions across seasons. The proposed TDI-SL correlation theory bridges supply-side spatial resource allocation with tourists’ perceptual dynamics, offering a novel framework to rebalance seasonal demand-supply gaps through strategic spatial planning and image recalibration. Practically, this framework guides destination managers to design season-specific strategies, such as optimizing crowd management in peak seasons or promoting immersive experiences in off-seasons.

Keywords: 
;  ;  ;  

1. Introduction

Seasonality is a critical challenge faced by tourist attractions globally, leading to imbalanced resource allocation and fluctuating visitor satisfaction[1]. Recent studies emphasize that over 70% of destinations worldwide report significant seasonal demand disparities, underscoring the urgency of addressing this issue[2]. Tourism seasonality has a significant impact on tourists’ needs and behaviors[3], which poses great challenges to the management of tourist destinations[4]. During the peak tourist season, the number of visitors to tourist destinations will "surge" and become crowded. The rush in the number of visitors leads to an increase in prices, supply shortages, and a decline in service quality at tourist destinations. The tourist destination shows a phenomenon of supply and demand imbalance, which poses a great challenge to the management of the tourist destination. Seasonality of destination affects tourists’ actual perception and experience of the destination, which in turn affects tourists’ travel motives and decisions. The different landscape characteristics presented by the tourist destination under seasonal differences and the different travel experiences brought to tourists form the behavioral intentions of tourists.
Therefore, the tourism destination image (TDI) is an intuitive reflection of tourists’ choice and experience of the tourist destination[5,6]. In different seasons, there is a significant relationship between the service quality of the tourist destination and the behavioral intention of tourists. For example, the peak season in Hainan Island, China, is mainly concentrated in winter, especially during Christmas and the Spring Festival, when the number of visitors and tourism revenue both reach their zenith. Statistics show that in 2019, the winter tourism revenue of Hainan Island accounted for nearly 70% of the annual tourism revenue. During the peak season, visitors mainly come from cold regions, and they hope to enjoy the warm climate and beaches by going to Hainan Island. In summer, due to the hot weather, the number of visitors is relatively small, but the price of tourism products will also be relatively low at this time, and some visitors will choose to go to Hainan Island in summer to enjoy a more cost-effective travel experience. Seasonality challenges are not unique to Hainan Island but are a global phenomenon. For instance, European ski resorts such as St. Moritz in Switzerland face extreme seasonality, with visitor numbers peaking in winter but plummeting in summer despite promoting hiking and cultural activities[7]. Similarly, Japan’s cherry blossom tourism creates a short-lived surge in spring, overwhelming infrastructure in cities like Kyoto, while Caribbean beach tourism dominates winter months but faces economic instability during hurricane seasons[8].
However, is there a correlation between tourism destination image (TDI) and geographical space? The spatial distribution of tourism resources and seasonal demand have a certain degree of compatibility to some extent. Current demand-side strategies, such as price discounts or seasonal marketing campaigns, often fail to address structural mismatches. For example, off-season discounts in Hainan may boost short-term visitation but risk devaluing destination brands, while infrastructure expansions for peak crowds lead to underutilization and financial strain. These approaches treat symptoms rather than root causes, necessitating a supply-side framework integrating spatial resource dynamics.Tourism resources in different geographical spaces have different seasonal characteristics, and tourists’ behavioral intentions will be affected by these characteristics. The landscape characteristics of the tourist destination are based on spatial levels (SL) [9]. Therefore, SL brings colorful, diverse, and vibrant tourism landscapes to tourists. The changes in the natural environment and the growing tourism demand show differentiated characteristics under different seasons[10,11], which leads to the dynamic replacement of internal resource elements in SL. While prior studies have explored seasonality through tourist intention cognition (Choe et al., 2019) and spatial theory (Ahas et al., 2007), recent reviews highlight a critical gap in integrating supply-side spatial resource allocation with tourists’ perceptual dynamics (TDI). For instance, Martin et al. (2019) emphasized that existing strategies predominantly address demand-side adjustments (e.g., pricing)[12], yet fail to resolve structural mismatches between spatial resource distribution and seasonal demand. Similarly, Liu et al. (2021) noted the absence of empirical frameworks linking TDI to spatial hierarchies (SL) under seasonal variations, underscoring the need for dynamic models that bridge cognitive-emotional perceptions with physical space planning[13]. Recent research highlights the need for integrated frameworks to bridge TDI and spatial hierarchy (SL) in seasonality management. This study aims to:
(1) Investigate the dynamic relationship between TDI and SL under seasonal variations;
(2) Identify actionable strategies for optimizing spatial resource allocation across peak, flat, and off-seasons;
(3) Analyzing how spatial resource distribution and TDI collectively shape seasonal imbalances for destination managers to mitigate seasonality effects.

2. Literature Review

Seasonality of destination refers to the temporary changes in tourism phenomena influenced by seasonal variations[14], environmental changes, vacation periods, and changes in demand[15]. These changes are primarily reflected in fluctuations in the number of visitors, visitor spending, traffic volumes, employment, and services [16]. As a characteristic of the tourism industry, seasonality leads to imbalances and fluctuations in supply and demand, posing significant challenges to the sustainable development of tourist destinations[17]. It has become an issue that is "easy to understand but difficult to resolve" for managers and has always been a focus of academic research[18].
To mitigate the impact of seasonality on tourist destinations, scholars have proposed measures such as adjusting holiday systems[19], promoting off-season travel[20], improving transportation accessibility[21], adjusting flight prices, and optimizing hotel booking mechanisms. In terms of research methods, time series models and other approaches have been suggested to enhance the accuracy of predictions[22], providing a quantitative basis for policymaking and balancing the negative effects of seasonality[23]. Additionally, tourist destinations can develop festive activities and business tourism based on their strengths and adopt differentiated marketing strategies tailored to seasonal characteristics[24].
From a theoretical perspective, seasonal changes create perceptual differences in the environment and emotions for tourists[25]. For instance, the physiological state of outdoor tourists and the destination environment during winter differ significantly from other periods, leading to unique, contradictory, novel, and unconventional scenic experiences. During the peak season, tourists have a strong will to travel, but the costs are higher[26], and they are more concerned about the congestion and service quality at the destination[27]. In contrast, during the off-season, the number of tourists decreases, and so does the spending, but tourists place more emphasis on the unique experiences and cost-effectiveness of the destination[28].
Tourist destination image (TDI) is the perception of an area by tourists, a stream of consciousness formed by external influences on the human brain[3,29]. However, since some cognitive elements of a destination are observable and measurable[30], while others are abstract and non-concrete, scholars have proposed the "cognitive-emotional" TDI concept framework[31]. This framework posits that TDI towards a destination are significant factors influencing destination choice[32]. It suggests viewing the seasonality of a destination to explore the interrelationships between variables such as tourists’ behaviors and phenomena during peak and off-seasons[33]. By analyzing the relationship between the perceived image of a destination and tourists’ satisfaction[34], loyalty[35], and motivation, effective management of the destination can be achieved[36]. Recent research has highlighted the significance of cognitive - affective perception in the formation of Tourist Destination Image (TDI). For example, Kim et al. (2018) pointed out that seasonal variations in environmental stimuli, such as winter landscapes, can trigger different emotional reactions, which in turn change tourists’ spatial engagement[37]. This is consistent with the spatial hierarchy theory, which suggests that sensory and symbolic spaces interact dynamically to influence seasonal behaviors.
For the abstract and non-specific cognitive elements in tourist destinations, some scholars have proposed the spatial theory of tourist destination image, dividing the seasonality of tourist destinations into five major spatial levels (SL): physical, sensory, perceptual, cognitive, and symbolic[38,39]. The TDI is seen composed of functional features (tangible landscapes, accommodations, etc.) and psychological features (intangible atmosphere, feelings, etc.), representing a three-dimensional continuum of "feature-whole, functional-psychological, general-unique"[40]. The SL theory argues that the TDI is not unique, fixed, and universal, but varies in different destination perceptions[41,42]. Relevant scholars have conducted research on different scale types of tourist destinations, such as scenic spots, cities, and countries[43], using methods like web text analysis[44], cognitive mapping, and questionnaire interviews[45]. The updated research content has provided recommendations for various types of tourist destinations in terms of adjusting strengths and weaknesses, market analysis, marketing and promotion, and enhancing competitiveness[46].
Despite the gradual refinement and deepening of the current research branches on TDI, there are still the following shortcomings: First, the flatness of TDI research content. Whether it is Coucellis’ geospatial hierarchy model, which divides geospatial space into five spatial levels: physical, sensory, perceptual, cognitive, and symbolic[47], or Buhalis’ 6A system containing attractions, accessibility, amenities, available packages, activities, and ancillary services[5,48], both are centered around the "cognitive-emotional" elements to present the tourism intention in the form of diagrams, tables, and texts. There is a lack of spatialized research on the cognitive theory of TDI. Secondly, the group perspective on TDI is rigid. Current research often treats all visitors to a tourist destination as a single group and analyzes the formed image, ignoring the fact that the objective spatiotemporal changes in tourist destinations can bring different perceptual differences and satisfaction levels to visitor groups at different times[16,20,22], thereby affecting the formation of TDI. Third, the application of the findings of image research on a single type of tourist destination is limited. There are many studies on the image of a single type or region of tourist destination[8,30,32], and most of them are focused on a particular attraction, city, or country, which limits the conclusions and recommendations generated to a single study area, making it difficult to interactively apply and refer to the elements of a perceptual image, and limiting the scope of practical application[19,25]. Therefore, whether it is possible to associate cognitive theory with SL theory to expand the research content is worth exploring. Post-2020 research underscores the growing relevance of digital data (e.g., social media) in analyzing TDI dynamics,while spatial hierarchy models have been applied to urban tourism resilience during climatic disruptions.
Existing research on demand-side strategies, such as seasonal pricing (Merkert & Webber, 2018) and infrastructure adjustments (Boto-Garcia & Perez, 2023), has provided partial solutions to seasonality. However, these approaches neglect the interplay between spatial resource allocation (SL) and tourists’ cognitive-affective perceptions (TDI). Connell et al. (2015) argued that static spatial models (e.g., Couclelis’ hierarchy) inadequately capture seasonal behavioral shifts[49], while Buhalis’ 6A framework (Buhalis, 2000) overlooks psychological dimensions. Recent studies (Shang & Luo, 2023; Lee & Park, 2023) further emphasize the need for dynamic frameworks that map TDI themes to spatial hierarchies across seasons—a gap this study addresses by combining LDA-based TDI analysis with SL theory[50,51]. To reveal whether there is a correlation between TDI and SL, this study uses the Latent Dirichlet allocation (LDA) topic extraction model[52], selects 165A-level tourist attractions in China with typical seasonal characteristics as research samples, divides these scenic spots into peak, flat, and off-seasons, extracts TDI under seasonal differences, explores the correlation between TDI and SL under seasonal differences, and provides relevant suggestions for the targeted management and marketing promotion of seasonality of destination. The LDA model’s hyperparameters (α=0.1, β=0.01) were optimized via perplexity tests and topic coherence validation.The elbow method determined K=10 topics, ensuring semantic distinctness (e.g., ’scenery viewing’ vs. ’price sensitivity’).Potential biases arise from Ctrip.com’s user demographics, predominantly domestic Chinese tourists. While this aligns with the study’s focus on 5A-level attractions, future research should incorporate international platforms (e.g., TripAdvisor) to enhance generalizability.The SL framework was operationalized by mapping LDA themes to spatial hierarchies: physical (tangible resources), cognitive (emotional perceptions), and symbolic (abstract associations). For example, ’crowded queues’ in peak seasons were classified under physical space, while ’relaxed atmosphere’ in off-seasons reflected cognitive space.

3. Data Sources and Research Methods

3.1. Selection of the Study Population

Quantifying and analyzing TDI of smaller tourism destinations (e.g., tourist attractions) can better meet the needs and desires of the target market and provide valuable insights for fine-grained destination management [23].The seasonal intensity index threshold (≥3.5) was determined through pilot analyses of 318 attractions, ensuring selected cases exhibited statistically significant seasonality (p<0.05). This threshold aligns with Mattos & Carlos’ (2018) classification of ‘high seasonality’ destinations[53]. The final selection of 16 attractions balances representativeness and analytical feasibility, as smaller samples allow deeper thematic analysis without sacrificing generalizability[54]. Therefore, we used data from the official website of the Chinese Ministry of Culture and Tourism to compile a list of 318 5A-level tourist destinations as of July 2022. Referring to the data acquisition format of existing studies [55,56], attention index queries were performed on the Baidu Index using the name of each scenic spot as the keyword to serve as the base data for seasonal intensity evaluation. We used continuous smooth data of 2017, 2018, and 2019 as the data source after taking the effect of the COVID-19 pandemic on the network attention index into consideration. The seasonal intensity of 318 tourist attractions was measured separately according to the seasonal intensity index with a high usage rate, and finally 16 5A-level tourist attractions with seasonal intensity indexes greater than 3.5 for three consecutive years were selected as representative study areas (Table 1).

3.2. Data Sources and Processing

We crawled all the review data available under 16 tourist attractions from Ctrip’s official website by writing code in Python. A total of 8385 valid reviews were obtained after removing incomplete, invalid content, and duplicate reviews. On the basis of counting the number of reviews per month for each scenic spot, months with traffic greater than the annual average monthly traffic for each scenic spot were classified as peak season, months with traffic of 80–100% of the annual average monthly traffic were classified as flat-season, and months with traffic less than 80% of the annual average monthly traffic were classified as off-season season. The three types of seasonal reviews for each of the 16 tourist attractions were integrated. There were 5666 peak season reviews, 646 flat-season reviews, and 2073 off-season reviews.
The LDA model’s hyperparameters (α=0.1, β=0.01) were optimized through perplexity tests, aligning with methodological recommendations by Tan and Xiong (2021) for semantic distinctness in tourism text analysis[57]. Additionally, the selection of Ctrip.com data was informed by Zhang et al. (2020), who validated the platform’s utility in capturing domestic tourists’ perceptions through user-generated content[58].The elbow method determined K=10 topics, ensuring semantic distinctness (e.g., ’scenery viewing’ vs. ’price sensitivity’).Prior to the LDA model analysis, we referred to previous research methods to clean comment text[59]. It should be noted that since the names of the tourist attractions were repeated several times in the text and had an impact on the probability distribution of other words, they were added to the deactivation word list, and synonyms were substituted for the same types of words. Potential biases arise from Ctrip.com’s user demographics, predominantly domestic Chinese tourists. While this aligns with the study’s focus on 5A-level attractions, future research should incorporate international platforms (e.g., TripAdvisor) to enhance generalizability.The SL framework was operationalized by mapping LDA themes to spatial hierarchies: physical (tangible resources), cognitive (emotional perceptions), and symbolic (abstract associations). For example, ’crowded queues’ in peak seasons were classified under physical space, while ’relaxed atmosphere’ in off-seasons reflected cognitive space.

3.3. Research Methodology

Latent Dirichlet allocation (LDA) is a Bayesian-based topic model that mines potential topics in documents in an unsupervised manner by using co-occurrence features of lexical items in the text to obtain a text-to-topic distribution. The core idea of the LDA model is to measure the probability distribution of a document composed of several representative themes, each representing a probability distribution composed of several words [45]. Compared to other topics, the LDA model is more concerned with the semantic connotation and potential relationships within the text, which is beneficial to the overall understanding of the main content of the text. Therefore, in this study, the LDA model is used to extract the TDI from the text of 16 tourist attraction reviews, in which the number of themes K and their support are determined based on the elbow rule and manual adjustment [37]. The following is the procedure for examining the text themes using the LDA model’s joint distribution formula:
P ω , z , θ , φ α , β = n = 1 N p θ α p z θ p φ β p ω θ
where the review text of any tourism destination corresponds to one obeying the Dirichlet distribution θ and any topic corresponds to one obeying the Dirichlet distribution φ; α and β are the distribution hyperparameters of the topic distribution θ and the topic word distribution φ, respectively. Z, ω are the final generated TDI topic and topic word after the LDA run, respectively. Firstly, for the specific running process, the corresponding topic distribution θ is sampled from the Dirichlet distribution α; secondly, the topic distribution is used for topical assignment to obtain the corresponding topic z. Subsequently, the word distribution φ of the topic is randomly sampled according to the word frequency distribution β corresponding to the topic; finally, the corresponding word ω is sampled to generate the corresponding word.
The next step is to explore the actual strength of support for each theme in relation to the destination image. The strength index (SI) is a quantitative indicator of the strength of a theme and can be used to indicate the level of interest in each theme by its ‘hotness’[38]. The SI is calculated as follows:
S I t = S u m ( i ) S u m ( t )
where SIt indicates the support of topic I in time window t, Sum (i) indicates the number of comments in which the topic appears in time window t, and Sum (t) indicates the number of all comments in time window t. The larger the value of SIt, the larger the proportion of comment texts related to the topic, the higher the support of the topic for TDI, and the stronger the topic hotness.

4. Research Findings

4.1. TDI in Tourist Attractions

According to the LDA model, TDI for off-season season, flat-season, and peak season were extracted, and a total of 41 theme words and their respective counterparts were obtained (Table 2). Upon categorizing the theme words, it becomes evident that TDI exhibit pronounced seasonal differences.
During the peak season, the intention themes of "viewing the scenery" and "landscape comparison" have the highest support levels among tourists. The support level for the theme of "viewing the scenery" is as high as 0.789, occupying an absolute dominant position. This indicates that in the peak season, most tourists visit the scenic spots mainly to appreciate the beautiful natural scenery. The characteristic words such as "queuing" and "crowded" show that there are many tourists in the scenic spots during the peak season, and popular attractions are often full of people. Tourists need to queue to enter the attractions or take photos[60], which also indirectly reflects the great attractiveness of the scenic spots’ scenery in the peak season. Even in the face of crowding, tourists still flock to it. Although the themes of "landscape comparison," "local specialties," "landscape colors," and "historical legends" have relatively lower support levels, they also reflect the diversified needs of tourists for the scenic spots’ landscape to a certain extent. For example, "landscape comparison" may reflect tourists’ attention to the differences between different landscapes and their desire to experience unique visual impacts during their travels. "Local specialties" reflect tourists’ interest in local characteristic items of the scenic spots.
During the flat season, the intention themes of "price discounts" and "travel routes" have the highest support levels among tourists. The support level for the theme of "price discounts" is 0.373, which is the most concerned factor for tourists. Characteristic words such as "tickets" and "discounts" indicate that in the flat season, tourists tend to choose relatively cheaper travel products. Compared with the peak season, the number of tourists in the scenic spots decreases in the flat season. To attract tourists, the scenic spots often launch various ticket discount activities or discount packages, which are very attractive to price-sensitive tourists. The support level for the theme of "travel routes" is 0.347, indicating that tourists also pay more attention to the rationality and convenience of travel routes in the flat season. They hope to choose a route that can cover the main attractions and is convenient and fast to improve travel efficiency. In addition, themes such as "cost-performance ratio" and "travel methods" also reflect tourists’ comprehensive consideration of travel quality and experience in the flat season. They hope to enjoy satisfactory travel services while enjoying price discounts.
During the off-season, the intention themes of "relaxed itinerary" and "spatial experience" have the highest support levels among tourists. The support level for the theme of "relaxed itinerary" reaches 0.682, becoming the primary intention of tourists. From the characteristic words "relaxed" and "few people," tourists pay more attention to the comfort of travel in the off-season, hoping to avoid crowded crowds and enjoy a relaxed and leisurely travel time. There are few tourists in the scenic spots during the off-season, and tourists can arrange their itineraries more freely without worrying about queuing. The support level for the theme of "spatial perception" is 0.104, reflecting tourists’ pursuit of spacious space in the scenic spots during the off-season. With few people, tourists can better feel the spatial layout of the scenic spots and experience a relaxed and leisurely atmosphere. Themes such as "water landscape" and "natural landscape" also indicate that even in the off- season, the appreciation of natural landscapes is still an important part of the trip.

4.2. TDI in "Cognitive-Affective" Space

The functional-psychological continuum of TDI supports a three-dimensional spatial representation: physical (functional dominance in peak seasons), cognitive (psychological emphasis in off-seasons), and symbolic (abstractions bridging both). By combing the relationship between TDI and "cognitive-affective" space in Figure 1, three major characteristics can be found. First, the intention themes are relatively concentrated in the functional and unique dimensions. This indicates that the formation of TDI pays more attention to tangible and characteristic elements. Among them, the peak season pays more attention to landscape colors, landscape records, village ethnic groups, historical legends, etc., the flat season pays more attention to travel experience, travel routes, characteristic houses, wonders, etc., and the off-season pays more attention to natural landscapes, entertainment projects, cultural relics, etc. Second, there is little difference in the theme distribution between the feature-whole dimensions. In the process of forming the image of the scenic spot, due to the unfamiliar environment, tourists will not only pay attention to the current characteristic elements involved, such as water landscape, characteristic food, but also control the overall situation of the scenic spot, such as safety atmosphere, spatial perception, travel routes, etc., so as to build the overall image of the scenic spot. Third, there is a reverse effect between the image themes in the functional-psychological dimension. It is manifested that the theme distribution in the functional dimension shows peak season > flat season > off-season, and the theme distribution in the psychological dimension shows peak season < flat season < off-season.

4.3. The Association Between TDI and SL

Within the five spatial hierarchies of geographical space—physical, sensory-motor, perceptual, cognitive, and symbolic—physical space is regarded as the material spatial combination of the real world, encompassing spaces of all scales; sensory-motor space pertains to the micro-perception of the human body; perceptual space is the specific perceptual image space formed after the interaction of prominent stimuli between humans and the environment; cognitive space is the cognitive image space formed on the basis of perceptual image space combined with human "knowledge, memory, and beliefs"; symbolic space is the space that abstractly expresses the above spaces through the use of tangible and intangible symbols. Based on the five-level hierarchical model of geographical space and the 6A system of tourist destination space, this paper expresses and divides the planarized TDI under seasonal influence in the form of SL, obtaining the physical space, cognitive space, and symbolic space of the tourist destination image spatial system.
Consistent with Naoi et al. (2011), who found that functional elements dominate peak-season behaviors, our analysis reveals an inverse correlation between functional (physical space) and psychological (cognitive space) dimensions. This extends Suwandana’s (2011) observations on off-season relaxation-seeking by demonstrating how spatial hierarchy mediates these dynamics. Notably, Guerra-Medina and Rodríguez (2021) highlighted similar spatial-perceptual trade-offs in coastal destinations, yet their framework lacked seasonal granularity-a limitation addressed by our TDI-SL integration[61]. Contrastingly, off-season behaviors align with Suwandana’s (2011) findings on ’relaxation-seeking’ but extend it to spatial perception dynamics[62]. Physical space refers to the basic space of the tourist destination image formation, which provides tangible tourist attractions (tourist landscapes, etc.), supporting facilities and services (transportation, restaurants, banks, etc.), and tourist services (visitor centers, tour guides, etc.) for TDI. Cognitive space refers to the intangible feelings, emotions, and thoughts about the tourist destination formed in the psychological level of tourists after a series of tourist activities in the physical space and the retrieval of knowledge and memory under environmental stimulation, which is in the middle level. Symbolic space is the high-level space formed by the symbolic expression of the physical and cognitive characteristic elements of the tourist destination.
According to the above three types of spaces, TDI in the peak season, flat season, and off-season are respectively divided into physical space level and cognitive space level, obtaining two complementary forms in SL. First, in the physical space, TDI in the off-season (7) < flat season (10) < peak season (12). This indicates that in the physical space, the perception of basic elements by tourists in the peak season is relatively strong, resulting in the most theme types, mainly involving transportation issues, tourist activities, and local cuisine; the flat season is relatively lower, mainly involving objective elements such as photo spots and landscape colors; and the off-season tourism generates slightly fewer image theme types than the flat season tourists, mainly involving travel time, activity arrangements, etc. Second, in the cognitive space, the proportion of TDI shows the opposite phenomenon of the physical space, that is, off-season (8) > flat season (5) > peak season (4). This indicates that in the cognitive space, off-season tourists form corresponding cognitive space themes by extracting and transforming the elements in the physical space, with a larger proportion of cognitive space, such as after tourists form the image themes of water landscapes and cultural relics in the tourist destination, they further appear in the cognitive space with overall feelings, local atmosphere, life insights, and self-physical and mental state exposure; compared with the off-season, the cognitive space themes in the flat season mainly involve spatial cognition, consumption cost-effectiveness, and safety atmosphere; the peak season has the least number of cognitive space themes, mainly including negative evaluations and perceptions of local atmosphere.
Figure 2. Association between TDI and SL in tourist attractions.
Preprints 151469 g002

5. Conclusions and Recommendations

5.1. Conclusions

Unlike static TDI models (Echtner, 2003), this study captures seasonal dynamism by aligning with recent calls for adaptive frameworks (Szubert et al., 2022)[63]. The SL theory advances traditional spatial analyses (Gale, 1986) by integrating perceptual hierarchies—a step toward resolving the structural gaps identified by Duro and Turrion-Prats (2019) in global seasonality management[64]. This paper, based on the LDA model, analyzes the differences and structural associations of seasonality in scenic spots during peak, flat, and off-seasons from the perspectives of image themes and spatial hierarchy, and draws the following three conclusions:
(1)
Seasonality has a significant impact on tourists’ behavioral intentions. Through the analysis of 16 5A-level scenic spots with typical seasonal characteristics, this study clarifies that seasonality has a significant impact on tourists’ behavioral intentions. During the peak season, the support levels of themes such as "viewing the scenery" and "landscape comparison" are the highest, indicating that the main purpose of tourists in the peak season is to appreciate the natural scenery, while also paying attention to the uniqueness and visual impact of the landscape. In the flat season, "price discounts" and "travel routes" become the most concerned factors for tourists, who tend to choose relatively cheaper travel products and pay attention to the rationality and convenience of travel routes to improve travel efficiency. In the off-season, the support levels of "relaxed itinerary" and "spatial experience" are the highest, with tourists focusing more on the comfort of travel, hoping to avoid crowds and enjoy a relaxed and leisurely travel time, and experiencing the spacious spatial layout of the scenic spots.
(2)
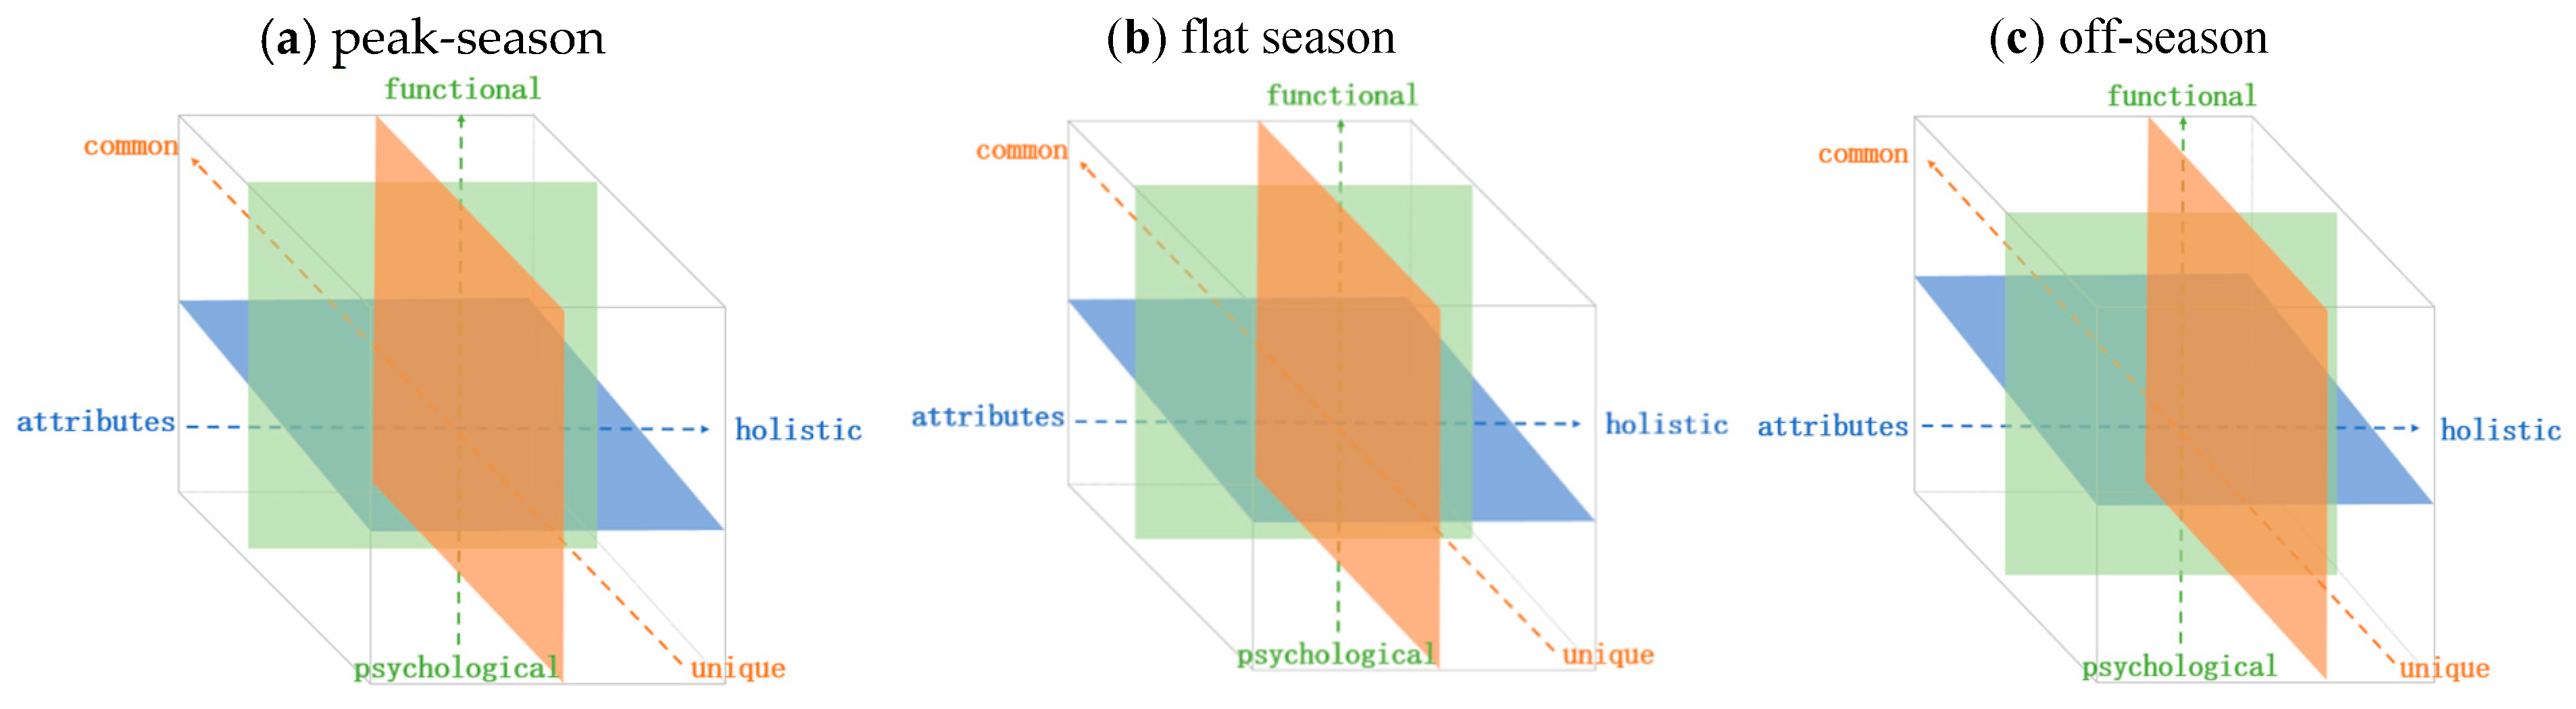
The correlation between TDI and "cognitive-affective" space. Under the "cognitive-affective" image framework, tourists’ behavioral intentions have three major characteristics. First, the intention themes are relatively concentrated in the functional and unique dimensions. In the peak season, attention is paid to landscape colors, historical legends, etc.; in the flat season, attention is paid to travel experience, characteristic houses, etc.; in the off-season, attention is paid to natural landscapes, cultural relics, etc., indicating that the formation of tourists’ travel images pays more attention to tangible and characteristic elements. Second, there is little difference in the theme distribution between the feature-whole dimensions. In the process of forming TDI, tourists not only pay attention to the current characteristic elements involved but also control the overall situation of the scenic spot, thereby building the overall image of the scenic spot. There is an inverse effect between the image themes in the functional and psychological dimensions. The distribution of themes in the functional dimension shows peak season > flat season > off-season, while the distribution of themes in the psychological dimension shows peak season < flat season < off-season. This is due to the tight resources and crowding during the peak season, which focuses tourists’ attention on tangible elements.
(3)
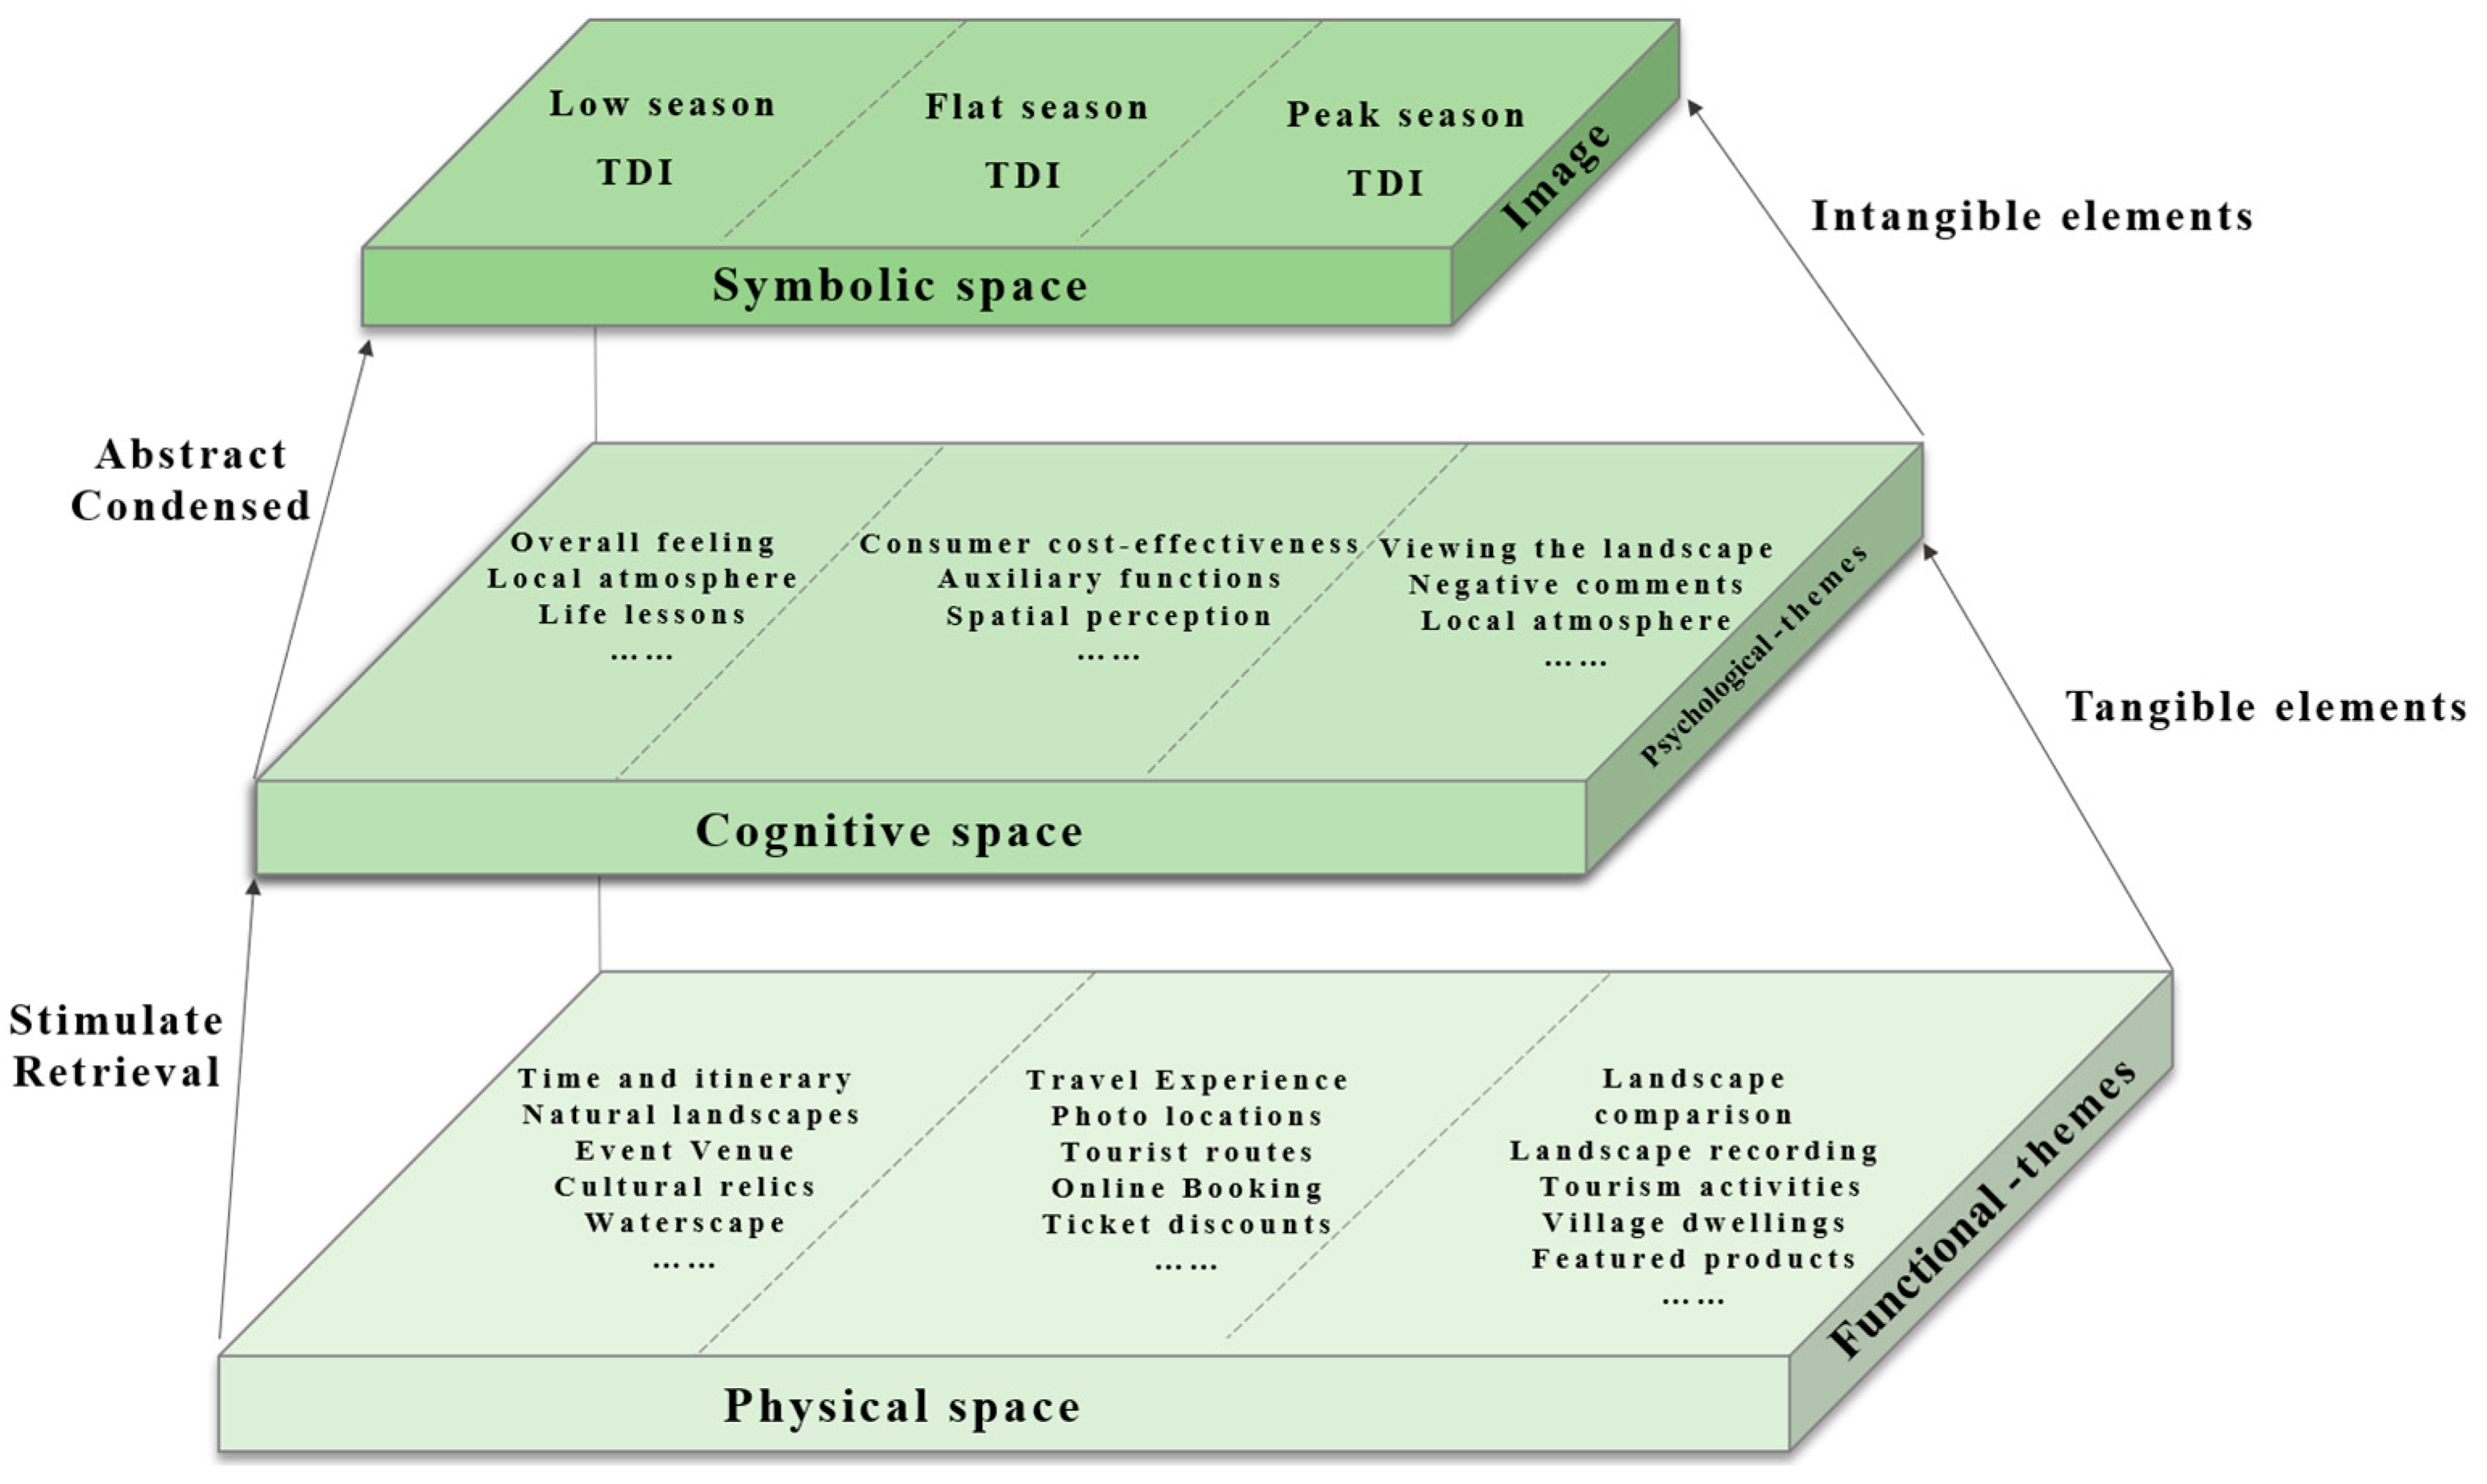
The correlation between TDI and SL. The spatial system of scenic spot images can be divided into physical space, cognitive space, and symbolic space, among which the "functional-psychological" dimension in the three-dimensional continuum corresponds to the image themes in the physical and cognitive spaces in the spatial hierarchy. By stimulating and abstracting the elements in the tangible physical-functional level and the intangible cognitive-spatial level, TDI in the symbolic space can be constituted, thereby achieving the three-dimensional expression of the scenic spot image. From the perspective of SL, tourists’ behavioral intentions have different performances in physical and cognitive spaces. In physical space, the proportion of TDI is the highest in the peak season and the lowest in the off-season. In the cognitive space, the proportion of TDI is the highest in the off-season and the lowest in the peak season.

5.2. Insights

Based on the research conclusions of this paper, the following development suggestions are put forward for the differentiated response and management of the seasonality of tourist attractions:
(1)
The elements of management and promotion for peak, flat, and off-season travelers can be subdivided and strengthened. During the peak season, due to the pressure of destination reception, emphasis can be placed on strengthening the thematic content of the following three aspects: tourism landscape, local characteristics, and special performance. During the off-season, as the main theme of tourists’ perception is consumption value for money, the promotion and management content of the tourism landscape, spatiotemporal activities, local characteristics, and tourism services can be added based on focusing on promoting tourism booking and preferential consumption. The off-season is a period of restoration, and it is still vital to pay attention to how the tourism landscape shapes the perception of tourist destinations and to consider management strategies that will support thematic content, including spatiotemporal activities.
(2)
Tourism attractions can focus on tangible and unique thematic elements for promotion and marketing. In the peak season, tourists are more concerned about landscape colors and scenic records when they visit; these can take the form of photo-taking and internet attractions as elements by which to further expand the tail wave effect based on other additional attractions. In the flat season, tourists are more concerned about travel experiences and travel routes, etc.; thus, tourist attractions can promote special routes and travel activities in the form of booking. off-season travelers are more concerned with thematic images, such as natural landscapes and humanistic monuments, and tourist attractions can give full play to their off-season advantages by reinforcing local ambience such as relaxation, self-healing, and cultural inculcation based on the natural environment and local ordinary life, with the goal being to satisfy visitors’ demands for attention.
(3)
Destination managers could implement dynamic pricing tiers (e.g., higher peak-season fees to curb overcrowding) and develop off-season wellness programs (e.g., meditation retreats in Nalati Scenic Area) to balance demand. Peak Season: Improve visitor flow and enhance service quality through digital queue management and crowd monitoring.For example, adopt Japan’s digital queue systems (e.g., Kyoto’s temple reservation app) to manage crowds.Flat Season: Bundle tickets with local experiences, akin to Hainan’s summer ’cultural immersion’ packages.Off-Season: Promote alternative tourism products (e.g., wellness retreats, educational tourism, or digital nomad-friendly facilities.Promote ’digital nomad’ initiatives, as seen in Bali’s co-working retreats during low seasons.
The reliance on Ctrip.com data limits insights into international tourists, and the focus on 5A-level attractions may not generalize to smaller destinations.Future studies could apply the TDI-SL framework to cross-cultural contexts (e.g., European heritage sites) or assess longitudinal trends post-COVID-19.

Author Contributions

Conceptualization, J.W. and X.C.; methodology, X.C.; software, X.C.; validation, X.C.; formal analysis, X.C.; data curation, J.W; writing—original draft preparation, X.C.; writing—review and editing, J.W.; visualization, X.C., J.W. All authors have read and agreed to the published version of the manuscript.

Funding

This research was funded by the Major Project on Philosophy and Social Science of Yunnan Province, grant number ZD202405.

Institutional Review Board Statement

Not applicable.

Informed Consent Statement

Not applicable.

Data Availability Statement

Data comes from Baidu Index(https://index.baidu.com/v2/index.html) and Ctrip’s official website(www.ctrip.com

Conflicts of Interest

The authors declare no conflicts of interest.

References

  1. Vergori A S .Patterns of seasonality and tourism demand forecasting. Tourism Economics, 2017, 23(1):135481661665641.
  2. Steiger R , Posch E , Tappeiner G ,et al. Seasonality matters: simulating the impacts of climate change on winter tourism demand. Current Issues in Tourism, 2022, 26:2777 - 2793.
  3. Choe Y , Kim H , Joun H J . Differences in Tourist Behaviors across the Seasons: The Case of Northern Indiana[J]. Sustainability, 2019, 11.
  4. Boto-Garcia, D.; Perez, L. The effect of high-speed rail connectivity and accessibility on tourism seasonality. J. Transp. Geogr. 2023, 107, 103546. [CrossRef]
  5. Bruwer, J.; Joy, A. Tourism destination image (TDI) perception of a Canadian regional winescape: A free-text macro approach. Tour. Recreat. Res. 2017, 42, 367–379. [CrossRef]
  6. Gallarza, M.; Saura, I. Destination Image: Towards a Conceptual Framework. Ann. Tour. Res. 2002, 29, 56–78.
  7. Descroix L , Mathys N .Processes, spatio-temporal factors and measurements of current erosion in the French Southern Alps: A review.Earth Surface Processes and Landforms, 2003, 28(9):993-1011.
  8. Portz, L.C.; Pérez Torres, Y.S.; Manzolli, R.P. Coast Change: Understanding Sensitivity to Beach Loss for Coastal Tourism in the Colombian Caribbean. Sustainability 2023, 15, 13903. [CrossRef]
  9. Ahas, R.; Aasa, A.; Mark, U.; Pae, T.; Kull, A. Seasonal tourism spaces in Estonia: Case study with mobile positioning data. Tour. Manag. 2007, 28, 898–910. [CrossRef]
  10. Buhalis, D. Marketing the competitive destination of the future. Tour. Manag. 2000, 21, 97–116. [CrossRef]
  11. Goulding, Philip, J, et al. Seasonal Trading and Lifestyle Motivation: Experiences of Small Tourism Businesses in Scotland.[J]. Journal of Quality Assurance in Hospitality & Tourism, 2004.
  12. Martin, J.M.M., Fernandez, J.A.S., & Martin, J.A.R. Comprehensive evaluation of the tourism seasonality using a synthetic DP2 indicator. Tourism Geographics, 2019,21, 284–305. [CrossRef]
  13. Liu, H., Liu, Y., Li, G., & Wen, L. Tourism demand nowcasting using a LASSO-MIDAS model. International Journal of Contemporary Hospitality Management,2021,33, 1922–1949.
  14. Duro, J.A.; Turrion-Prats, J. Tourism seasonality worldwide. Tour. Manag. Perspect. 2019, 31, 38–53. [CrossRef]
  15. Sastre, M.A.G.; Hormaeche, M.A.; Villar, M.T. Are regional political decisions the key element in reducing seasonal variation in tourism? The case of the Balearic Islands. Tour. Econ. 2015, 21, 1207–1219. [CrossRef]
  16. Turrion-Prats, J.; Duro, J.A. Tourist seasonality in Catalonia: The relevance of demand factors. Tour. Econ. 2017, 23, 846–853.
  17. Vergori, A.S. Forecasting tourism demand: The role of seasonality. Tour. Econ. 2012, 18, 915–930. [CrossRef]
  18. Coshall, J.; Charlesworth, R.; Page, S.J. Seasonality of Overseas Tourism Demand in Scotland: A Regional Analysis. Reg. Stud. 2015, 49, 1603–1620. [CrossRef]
  19. Chi, C.G.Q.; Qu, H.L. Examining the structural relationships of destination image, tourist satisfaction and destination loyalty: An integrated approach. Tour. Manag. 2008, 29, 624–636. [CrossRef]
  20. Cuccia, T.; Rizzo, I. Tourism seasonality in cultural destinations: Empirical evidence from Sicily. Tour. Manag. 2011, 32, 589–595. [CrossRef]
  21. Prayag, G.; Ryan, C. Antecedents of Tourists’ Loyalty to Mauritius: The Role and Influence of Destination Image, Place Attachment, Personal Involvement and Satisfaction. J. Travel Res. 2012, 51, 342–356.
  22. Koenig-Lewis, N.; Bischoff, E.E. Developing Effective Strategies for Tackling Seasonality in the Tourism Industry. Tour. Hosp. Plan. Dev. 2010, 7, 395–413. [CrossRef]
  23. Egger, R.; Yu, J. Identifying hidden semantic structures in Instagram data: A topic modelling comparison. Tour. Rev. 2022, 77, 1234–1246. [CrossRef]
  24. Merkert, R.; Webber, T. How to manage seasonality in service industries—The case of price and seat factor management in airlines. J. Air Transp. Manag. 2018, 72, 39–46. [CrossRef]
  25. Hunt, J.D. Image As a Factor in Tourism Development. Tour. Recreat. Res. 1982, 7, 1–6. [CrossRef]
  26. Gatti, E.T.J.; Brownlee, M.T.J.; Bricker, K.S. Winter recreationists’ perspectives on seasonal differences in the outdoor recreation setting. J. Outdoor Recreat. Tour.-Res. Plan. Manag. 2022, 37, 100366. [CrossRef]
  27. Lu, S.; Lu, L.; Wang, L.; Wang, Y.; Liang, D.; Dong; Yang, Z. Temporal Characteristics of Tourist Flows to Ancient Villages—A Case Study of Two World Cultural Heritages Xidi Village and Hongcun Village. Geogr. Sci. 2004, 24, 250–256.
  28. Huang, S.; Hsu, C.H.C. Effects of Travel Motivation, Past Experience, Perceived Constraint and Attitude on Revisit Intention. J. Travel Res. 2009, 48, 29–44.
  29. Baloglu, S.; Mccleary, K.W. A model of destination image formation. Ann. Tour. Res. 1999, 26, 868–897. [CrossRef]
  30. Huang, S.; Hsu, C.H.C. Effects of Travel Motivation, Past Experience, Perceived Constraint and Attitude on Revisit Intention. J. Travel Res. 2009, 48, 29–44.
  31. Li, Y.; Z. Y. He, Li, Y.P.; Huang, T.; Liu, Z.Y. Keep it real: Assessing destination image congruence and its impact on tourist experience evaluations. Tour. Manag. 2023, 97, 104736. [CrossRef]
  32. Pratt, M.A.; Sparks, B. Predicting Wine Tourism Intention: Destination Image and Self-congruity. J. Travel Tour. Mark. 2014, 31, 443–460. [CrossRef]
  33. Li, K.; Lu, W.; Liang, C.; Wang, B. Intelligence in Tourism Management: A Hybrid FOA-BP Method on Daily Tourism Demand Forecasting with Web Search Data. Mathematics 2019, 7, 531. [CrossRef]
  34. Huang, S.; Hsu, C.H.C. Effects of Travel Motivation, Past Experience, Perceived Constraint and Attitude on Revisit Intention. J. Travel Res. 2009, 48, 29–44.
  35. Saito, H.; Romao, J. Seasonality and regional productivity in the Spanish accommodation sector. Tour. Manag. 2018, 69, 180–188. [CrossRef]
  36. Shang, Z.Y.; Luo, J.M. Topic modelling for wildlife tourism online reviews: Analysis of quality factors. Curr. Issues Tour. 2022. [CrossRef]
  37. Kim, Y. R., & Scott, N. Network dynamics of tourism development in South Korea. Current Issues in Tourism, 2018,21(8), 1239-1259.
  38. Gale, C.N. Space and Spaces. Geogr. Ann. 1986, 68, 1–12.
  39. Guerra-Medina, D.; Rodríguez, G. Spatiotemporal Variability of Extreme Wave Storms in a Beach Tourism Destination Area. Geosciences 2021, 11, 237. [CrossRef]
  40. Echtner, C.M. The meaning and measurement of destination image. journal of tourism studies. J. Tour. Stud. 2003, 14, 37–48.
  41. Connell, J.; Page, S.J.; Meyer, D. Visitor attractions and events: Responding to seasonality. Tour. Manag. 2015, 46, 283–298. [CrossRef]
  42. Silva, E.S.; Hassani, H.; Heravi, S.; Huang, X. Forecasting tourism demand with denoised neural networks. Ann. Tour. Res. 2019, 74, 134–154. [CrossRef]
  43. Guo, W.; Zhu, H. On the Representation and Non-representation Dimensions of the Production of Social and Cultural Geographical Knowledge. Sci. Geogr. Sin. 2020, 40, 1039–1049.
  44. Szubert, M.; Warcholik, W.; Zemla, M. Destination Familiarity and Perceived Attractiveness of Four Polish Tourism Cities. Sustainability 2022, 14, 128. [CrossRef]
  45. Lee, J.S.; Park, S. A cross-cultural anatomy of destination image: An application of mixed-methods of UGC and survey. Tour. Manag. 2023, 98, 104746. [CrossRef]
  46. Liu, H.; Liu, Y.; Li, G.; Wen, L. Tourism demand nowcasting using a LASSO-MIDAS model. Int. J. Contemp. Hosp. Manag. 2021, 33, 1922–1949. [CrossRef]
  47. Ma, L.J.; Long, Y. Spatiotemporal Characteristics of Residents Tourism Demand for Typical Scenic Spots in Hunan Province Based on Network Attention. Econ. Geogr. 2017, 37, 201–208.
  48. Martin, J.M.M.; Fernandez, J.A.S.; Martin, J.A.R. Comprehensive evaluation of the tourism seasonality using a synthetic DP2 indicator. Tour. Geogr. 2019, 21, 284–305. [CrossRef]
  49. Connell, J., Page, S.J., & Meyer, D. Visitor attractions and events: Responding to seasonality. Tourism Management, 2015,46, 283–298. [CrossRef]
  50. Shang Z , Luo J .Topic modelling for wildlife tourism online reviews: analysis of quality factors.Current Issues in Tourism, 2023, 26:2317 - 2331.
  51. Lee, J.S., & Park, S. A cross-cultural anatomy of destination image: An application of mixed-methods of UGC and survey. Tourism Management, 2023,98, 104746. [CrossRef]
  52. Tan, C.; Xiong, Y. Contrastive Analysis at Home and Abroad on the Evolution of Hot Topics in the Field of Data Mining Based on LDA Model. Inf. Sci. 2021, 39, 174–185.
  53. Mattos J B , Moreira Cruz M J , Carlos F D P F ,et al.Natural and anthropic processes controlling groundwater hydrogeochemistry in a tourist destination in northeastern Brazil.Environmental Monitoring and Assessment, 2018, 190(7):395.
  54. Bezugly, V., KostaschukІ., Kisil, R., Yavorska, V., & Buyanovska, L. World Heritage: features, composition, and tourist significance. Journal of Geology, Geography and Geoecology, 2024,33, 440-452.
  55. Taecharungroj, V.; Mathayomchan, B. Analysing TripAdvisor reviews of tourist attractions in Phuket, Thailand. Tour. Manag. 2019, 75, 550–568. [CrossRef]
  56. Wang, J.; Li, Y.P.; Wu, B.H.; Wang, Y. Tourism destination image based on tourism user generated content on internet. Tour. Rev. 2021, 76, 125–137. [CrossRef]
  57. Tan, C., & Xiong, Y. Contrastive Analysis at Home and Abroad on the Evolution of Hot Topics in the Field of Data Mining Based on LDA Model. Information Science,2021, 39, 174–185.
  58. Zhang, K., Chen, Y., & Lin, Z.B. Mapping destination images and behavioral patterns from user-generated photos: A computer vision approach. Asia Pacific Journal of Tourism Research, 2020,25, 1199–1214. [CrossRef]
  59. Zhang, K.; Chen, Y.; Lin, Z.B. Mapping destination images and behavioral patterns from user-generated photos: A computer vision approach. Asia Pac. J. Tour. Res. 2020, 25, 1199–1214.
  60. Zhang, X.H.; Zhang, C.; Li, Y.A.; Xu, Z.Y.; Huang, Z.F. Hierarchical Fusion Process of Destination Image Formation: Targeting on Urban Tourism Destination. Sustainability 2021, 13, 11805. [CrossRef]
  61. Guerra-Medina, D., & Rodríguez, G. Spatiotemporal Variability of Extreme Wave Storms in a Beach Tourism Destination Area. Geosciences, 2021,11, 237. [CrossRef]
  62. Suwandana.Escherichia Coli and Biophysicochemical Relationships of Seawater and Water Pollution Index in the Jakarta Bay.American Journal of Environmental Sciences, 2011, 7(3):183-194.
  63. Szubert, M., Warcholik, W., & Zemla, M. Destination Familiarity and Perceived Attractiveness of Four Polish Tourism Cities. Sustainability, 2022,14, 128. [CrossRef]
  64. Duro, J.A., & Turrion-Prats, J. Tourism seasonality worldwide. Tourism Management Perspectives, 2019,31, 38–53.
Figure 1. The correlation between TDI and "cognitive-affective" space.
Preprints 151469 g001
Table 1. Seasonal intensity index of tourist attractions, 2017–2019.
Scenic Areas 2017 2018 2019 Scenic Areas 2017 2018 2019
Chengde Summer Palace Scenic Area 6.39 5.74 6.8 Yannanfei Tea Field Scenic Area 3.66 4.35 4.36
Jinshi Beach Scenic Area 5.19 6.05 4.88 Nanshan Daxiaodongtian Tourism Area 4.79 5.14 9.01
Jiangwan Scenic Area, Wuyuan 4.07 12.27 5.5 Jiuzhaigou Tourist Attractions 8.17 7.15 8.18
Dajue Mountain Scenic Area 4.14 5.11 3.9 Golden Silk Gorge Scenic Area 3.95 6.11 6.54
Liu Gong Island Scenic Area 4.08 4.56 10.89 Qinghai Lake Scenic Area 6.64 6.26 5.22
Yellow River Mouth Ecotourism Area 4.41 6.01 13.77 Kanas Scenic Area 4.23 5.21 8.64
Longtan Grand Canyon Scenic Area 3.97 4.12 4.05 Nalati Scenic Area 4.46 4.98 4.22
Enshi Grand Canyon Scenic Area 3.62 5.38 6.5 Bayinbruck Scenic Area 4.92 3.67 10.76
Table 2. TDI during Peak, flat, and off- Seasons.
Peak season flat season off-season Season
Key Words Degree of Support Example of a Feature Word Key Words Degree of Support Example of a Feature Word Key Words Degree of Support Example of a Feature Word
Viewing the landscape 0.789 Line
crowded
Price discount 0.373 Ticket journey easy 0.682 Few people
Photo, Convenient Relaxed
Landscape comparison 0.056 Check-in Tourist route 0.347 Spatial perception 0.104
Preferential Downhill
Featured products 0.039 Snowdrop Tourist routes 0.124 Doorway Spatial perception 0.067 Located
Yurt Direct access Northeast
Landscape colors 0.035 Blue Travel methods 0.028 Self-drive Waterscape 0.055 Kanas Lake
Cyan Walks Waterfalls
Historical legends 0.016 The water monster Travel experience 0.023 Rafting Natural landscapes 0.026 Grassland
Qianlong Fun Snowy mountains
Tourism activities 0.015 Crabbing Wonders and scenes 0.019 Wonders stonescape Event venue 0.017 Ranch
by boat Riding
Cautions 0.008 ID card Seasonal perception 0.017 Winter Local atmosphere 0.01 Cozy
Sun protection Cold Unpretentious
Featured pavilion 0.008 Wax museum Characteristic building 0.012 Build Evaluation recommendations 0.007 Fun
Art gallery Anhui style Pick up tickets
Local atmosphere 0.007 Aesthetic Photo locations 0.011 Photography Cultural relics 0.006 Ancient villages
Atmosphere Tianshan Mountains Cultural heritage
Village dwellings 0.006 Log cabin Security guarantee 0.011 Askari Weather and climate 0.005 Sunny
Yurt protection Winter day
Landscape recording 0.005 Photo Auxiliary functions 0.008 For the benefit of the nation and the people Physical and mental state 0.005 Pleasant
Sunset Science High altitude reaction
Transport issues 0.005 Sicken Spatial perception 0.008 Northwest Environmental perception 0.005 Mist
Contested roads World Savor carefully
Specialty diet 0.004 Lamb Specialty diet 0.008 Sample tea Entertainment 0.004 Bonfire
Barley Beef and lamb Rollercoaster
Negative comments 0.003 Unbearable disproportionate Online booking 0.008 Ctrip Overall feeling 0.002 The sky is high and the sea is wide
Booking The whole piece
Physical and mental state 0.003 High-altitude reaction Landscape colors 0.005 Blue water Life lessons 0.002 No worries
Fatigue Golden color Perception
Disclaimer/Publisher’s Note: The statements, opinions and data contained in all publications are solely those of the individual author(s) and contributor(s) and not of MDPI and/or the editor(s). MDPI and/or the editor(s) disclaim responsibility for any injury to people or property resulting from any ideas, methods, instructions or products referred to in the content.
Copyright: This open access article is published under a Creative Commons CC BY 4.0 license, which permit the free download, distribution, and reuse, provided that the author and preprint are cited in any reuse.
Prerpints.org logo

Preprints.org is a free preprint server supported by MDPI in Basel, Switzerland.

Subscribe

Disclaimer

Terms of Use

Privacy Policy

Privacy Settings

© 2025 MDPI (Basel, Switzerland) unless otherwise stated