
Submitted:
28 September 2025
Posted:
29 September 2025
You are already at the latest version
Abstract
In this study, a range of machine learning models, including Artificial Neural Networks, Decision Trees, Support Vector Machines, Random Forests, Logistic Regression, and advanced gradient boosting methods (XGBoost, LightGBM, and CatBoost), were examined for their efficacy in predicting customer churn within the telecommunications industry. The research utilized a publicly accessible dataset for this purpose. The effectiveness of these models was measured using established evaluation metrics such as Precision, Recall, F1-score, and the Receiver Operating Characteristic Area Under Curve (ROC AUC). The research findings emphasize the efficiency of boosting algorithms in managing the complex aspects of predicting customer churn. In particular, LightGBM was remarkable, securing an outstanding F1-score of 92% and an ROC AUC of 91%. These figures greatly exceed the performance of conventional models such as Decision Trees and Logistic Regression. This highlights the superiority of sophisticated machine learning methods in dealing with challenges posed by imbalanced datasets and complex interrelations among features.
Keywords:
customer churn prediction
; machine learning
; classification techniques
; artificial neural networks
I. Introduction
Customer Relationship Management (CRM) is a strategic approach that enhances business and customer relationships. It is a vital tool for gaining deeper insights into consumer behaviors and needs, aiming to foster more robust and meaningful relationships, thereby establishing long-term and loyal customer bases. This concept is particularly significant in various industries, including banking, insurance, and telecommunications. The telecommunications sector, a major player in global revenue generation and socioeconomic advancement, faces intense competition. Companies in this sector strive to expand their customer base while focusing on retaining existing customers, considering the high costs associated with acquiring new ones. Customer retention in telecommunications is thus crucial for increasing revenue and reducing marketing costs.
The industry is currently grappling with customer attrition or churn, prompting a shift from acquiring new customers to retaining existing ones. CRM databases have become essential in systematically documenting every customer-specific interaction. These databases are invaluable for predicting and addressing customer needs, leveraging a mix of business processes and machine learning (ML) methodologies. The primary goal of ML models in this context is to categorize customers into churn or non-churn groups, representing a binary classification problem. Various ML methods have been proposed for churn prediction, including Decision Trees, Artificial Neural Networks, Random Forests, Logistic Regression, Support Vector Machines, and advanced gradient boosting techniques like XGBoost, CatBoost, and LightGBM. Ensemble techniques, specifically boosting and bagging algorithms, have gained prominence due to their effectiveness in addressing classification problems, particularly in churn prediction [1,2,3,4].
II. Purpose of the Study
This research aims to address the problem of customer attrition, commonly known as churn, in the telecommunications sector. Churn has become a significant issue, prompting service providers to focus more on retaining existing customers due to the high costs associated with acquiring new ones. Implementing Customer Relationship Management (CRM) systems plays a key role in managing customer relationships, serving as a valuable resource for predicting and addressing customer needs. This is achieved by systematically documenting every customer-specific interaction and leveraging a combination of business processes and machine learning (ML) methodologies to analyze and understand customer behavior.
The study aims to develop practical tools for businesses to categorize customers into two groups: churn or non-churn, representing a binary classification problem. The research investigates a range of machine learning algorithms for constructing a churn prediction model. This includes Decision Trees, Artificial Neural Networks, Random Forests, Logistic Regression, Support Vector Machines, and advanced gradient boosting techniques like XGBoost, CatBoost, and LightGBM. Ensemble techniques, particularly boosting and bagging algorithms, have been identified as effective for addressing classification problems in churn prediction due to their high effectiveness.
This study distinguishes itself by examining how various machine learning techniques, when applied to imbalanced data, can affect predictive accuracy. The focus is on understanding the intersection of these machine learning techniques with the challenges of imbalanced data in the context of churn prediction.
III. Related Work
Churn prediction has been extensively studied, with numerous methods proposed for constructing effective churn models. Techniques like Decision Trees, Artificial Neural Networks, Random Forests, Logistic Regression, Support Vector Machines, and a Rough Set Approach have been explored in various studies. Recent advancements in ensemble techniques, particularly boosting and bagging algorithms, have further enhanced the effectiveness of churn prediction models. Our research contributes to this field by examining how machine learning techniques, imbalanced data, and predictive accuracy intersect, thus distinguishing it from previous studies.
We present an overview of various machine learning methods used in churn prediction below:
Artificial Neural Networks (ANNs): ANNs, inspired by the human brain, consist of interconnected units and can adapt to different learning algorithms. They are particularly effective in complex tasks like churn prediction. The Multi-Layer Perceptron, a standard ANN model, is trained using the Back-Propagation Network algorithm. ANNs have shown superior performance over Decision Trees and Logistic Regression in churn prediction scenarios [5,6].
Support Vector Machine (SVM): SVMs, classified as supervised learning techniques, are adept at uncovering latent patterns within data. Kernel functions, such as the Gaussian Radial Basis and Polynomial kernel, enhance SVMs' performance. In some cases, SVMs outperform ANNs and Decision Trees in churn prediction, depending on data characteristics [7,8].
Logistic Regression (LR): LR, a probabilistic statistical classification method, predicts churn based on multiple predictor variables. With appropriate data pre-processing, LR's accuracy can rival Decision Trees [12].
Bagging: Involves training models on different subsets of the training data and combining their outputs through majority or average voting, as shown in Figure 1. Random Forests, an advancement of Decision Trees, use the bagging technique to yield better performance than individual DTs [13,14,15,16,17,18], as shown in Figure 2.
Boosting: This method sequentially combines weak learners to form a stronger model, reducing the model's bias, as shown in Figure 3. Gradient boosting techniques like XGBoost, LightGBM, and CatBoost are notable examples. They address over-fitting through loss function optimization and effectively handle categorical data and large-scale datasets [13,19,20,21,22,23,24,25], as shown in Figure 4.
Each technique offers unique benefits, making them suitable for different aspects of churn prediction in the telecommunications sector. For individuals seeking a more in-depth understanding, refer to this study [26], which offers an extensive and detailed comparative analysis pertinent to this subject matter.
IV. Method
The research paper applies machine learning (ML) techniques for predicting customer churn in the telecommunications sector. Utilizing a publicly accessible dataset, several ML models were implemented, including Artificial Neural Networks, Decision Trees, Support Vector Machines, Random Forests, Logistic Regression, and advanced gradient boosting techniques such as XGBoost, LightGBM, and CatBoost [27,28,29,30].
The primary aim of these ML models is to predict and categorize customers into two groups: churn or non-churn, which represents a binary classification problem. This classification is crucial in the telecommunications sector, where customer retention is key to maintaining revenue and reducing marketing costs, given the high costs associated with acquiring new customers.
Standard metrics such as Precision, Recall, F1-score, and the Receiver Operating Characteristic Area Under Curve (ROC AUC) were employed for evaluation. These metrics provide a comprehensive assessment of the models' accuracy and ability to classify customers accurately into churn or non-churn categories.
The research contributes to the field by examining how different machine learning techniques, when applied to imbalanced data, can affect predictive accuracy. This comprehensive framework aims to provide subscription-based companies with practical tools for predicting customer churn, vital in the current data-centric business environment.
A. Training and Validation Process
The study employs k-fold cross-validation for evaluating classifiers, but this method has limitations with imbalanced data, as some folds may lack examples from the minority class. To counter this, stratified sampling is used during the train-test split or k-fold cross-validation, ensuring equal representation of minority class instances in each split. The paper also emphasizes the importance of handling imbalanced data by up-sampling or down-sampling post data split to avoid data leakage, which could lead to overestimating model performance.
B. Evaluation Metrics
The study uses two types of metrics:
Threshold Metrics: These metrics minimize error rates and determine the number of mismatched predicted values. Standard accuracy metrics are insufficient for imbalanced data, as they mainly consider the majority class. Therefore, precision, recall, and F1-score derived from the confusion matrix are preferred for evaluating ML models in minority classes. The F1-score combines precision and recall and provides a balanced measure of the model's overall performance.
In Table 1, the abbreviations TP and FP represent True Positive and False Positive outcomes, respectively, while FN and TN denote False Negative and True Negative outcomes. The metrics of Precision, Recall, Accuracy, and F1-score are derived using specific formulas as follows:
Ranking Metrics: The Receiver Operating Characteristic (ROC) Curve is a key ranking metric. It visualizes the True Positive and False Positive rates at various thresholds, as shown in Figure 5. The Area Under the ROC Curve (AUC) gives a single score to evaluate model performance. However, the Precision–Recall curve is more appropriate for highly imbalanced datasets as it focuses on the classifier's performance on the minority class. Nonetheless, considering the dataset in this study does not exhibit an extremely high imbalance ratio, employing PR AUC for the assessment might not be essential.
The paper asserts the importance of the F1-score and ROC AUC metrics due to their effectiveness in handling imbalanced datasets. The ROC AUC, ranging from 50% to 100%, provides a robust measure for comparing different models, with higher percentages indicating better prediction capabilities.
In summary, the study highlights the critical aspects of evaluating machine learning models for churn prediction, considering the challenges posed by imbalanced datasets and emphasizing the importance of appropriate metric selection for accurate model assessment.
V. Results
This section delves into the setup and results of simulations conducted to evaluate various classification techniques for customer churn prediction. The section is divided into two parts: Simulation Setup and Simulation Results.
A. Simulation Setup
The study's primary aim is to assess the performance of several classification methods, including Decision Tree, Logistic Regression, Random Forest, Support Vector Machine, XGBoost, LightGBM, and CatBoost, in predicting customer churn. These simulations were carried out using Python and libraries like Pandas, NumPy, and Scikit-learn. A real-world dataset from Kaggle [31] was employed, featuring 20 attributes and a mix of 4250 training instances and 750 testing instances. This dataset showed a churn rate of 14.1% and an active subscriber rate of 85.9%. Pre-processing steps, such as handling categorical variables, feature selection, and outlier removal, were applied before evaluating the models using Precision, Recall, F1-score, and ROC AUC metrics.
A. Simulation Results
The study evaluated the performance of various machine learning models using unseen data from the testing dataset. The evaluation metrics included Precision, Recall, F1-score, ROC AUC, and Precision–Recall AUC. The machine learning models in this study were selected as they are commonly used in customer churn prediction, as the authors have shown in the interesting, comprehensive review on customer churn prediction between 2020 and 2024, see Figure 6.
The assessment aimed to gauge the models' generalization abilities and effectiveness on unseen data. After completing the pre-processing and feature selection steps, the outcomes were systematically compiled into a table. This highlighted the enhanced performance of boosting models, particularly regarding F1-score and ROC AUC metrics, as illustrated in Table 2. The most notable results are emphasized in bold and marked with an asterisk for clarity. LightGBM emerged as a standout performer, achieving a notable F1-score of 92% and an ROC AUC of 91%. The ROC curves of these models post pre-processing and feature selection are also illustrated in Figure 7, demonstrating the comparative performance of the different models.
Figure 7 displays the ROC curve diagram for various models, illustrating their performance following the pre-processing and feature selection steps.
In conclusion, this section of the paper highlights the effectiveness of various machine learning models in churn prediction, emphasizing the robust performance of boosting models like LightGBM in handling the given dataset.
VI. Conclusions
The research presented in this paper thoroughly investigates the effectiveness of various machine learning models for predicting customer churn in the telecommunications sector. Central to our findings is the clear distinction in performance among the evaluated algorithms, with a particular emphasis on the results from the advanced gradient boosting techniques such as XGBoost, LightGBM, and CatBoost.
The study's results highlight the superior performance of boosting models in handling the intricate dynamics of customer churn prediction. Notably, LightGBM stood out, achieving an impressive F1-score of 92% and an ROC AUC of 91%. These metrics significantly surpass those attained by traditional models like Decision Trees (DT) and Logistic Regression (LR), underscoring the effectiveness of advanced machine learning techniques in navigating the complexities of imbalanced datasets and intricate feature relationships.
The research emphasized the importance of rigorous model evaluation, especially in the context of imbalanced data prevalent in the telecommunications industry. The application of precision, recall, and F1-score metrics, derived from the confusion matrix, provided a more nuanced assessment of model performance compared to standard accuracy measures. This comprehensive evaluation approach was critical in revealing the nuanced capabilities of each model, particularly the efficacy of gradient boosting techniques.
The study's simulation results, encapsulating various metrics across different models, shed light on the generalization capabilities of these algorithms on unseen data. The standout performance of LightGBM, evidenced by its high scores in both F1-score and ROC AUC, demonstrates its potential as a robust tool for churn prediction in real-world scenarios. These findings offer substantial implications for subscription-based businesses in the telecommunications sector, highlighting the value of integrating advanced machine learning models into their customer retention strategies.
In conclusion, this paper advances our understanding of machine learning applications in churn prediction and provides practical insights for businesses looking to leverage data-driven techniques to enhance customer retention. The demonstrated superiority of gradient boosting models, particularly LightGBM, marks a significant step forward in predictive analytics, offering a potent tool for companies in their ongoing efforts to understand and mitigate customer churn.
References
- Alok, K.; Mayank, J. Ensemble Learning for AI Developers; BApress: Berkeley, CA, USA, 2020. [Google Scholar]
- Van Wezel, M.; Potharst, R. Improved customer choice predictions using ensemble methods. Eur. J. Oper. Res. 2007, 181, 436–452. [Google Scholar] [CrossRef]
- Ullah, I.; Raza, B.; Malik, A.K.; Imran, M.; Islam, S.U.; Kim, S.W. A Churn Prediction Model Using Random Forest: Analysis of Machine Learning Techniques for Churn Prediction and Factor Identification in Telecom Sector. IEEE Access 2019, 7, 60134–60149. [Google Scholar] [CrossRef]
- Lalwani, P.; Mishra, M.K.; Chadha, J.S.; Sethi, P. Customer churn prediction system: A machine learning approach. Computing 2021, 104, 271–294. [Google Scholar] [CrossRef]
- Tarekegn, A.; Ricceri, F.; Costa, G.; Ferracin, E.; Giacobini, M. Predictive Modeling for Frailty Conditions in Elderly People:Machine Learning Approaches. Psychopharmacol. 2020, 8, e16678. [Google Scholar]
- Ahmed, M.; Afzal, H.; Siddiqi, I.; Amjad, M.F.; Khurshid, K. Exploring nested ensemble learners using overproduction and choose approach for churn prediction in telecom industry. Neural Comput. Appl. 2018, 32, 3237–3251. [Google Scholar] [CrossRef]
- Shaaban, E.; Helmy, Y.; Khedr, A.; Nasr, M. A proposed churn prediction model. J. Eng. Res. Appl. 2012, 2, 693–697. [Google Scholar]
- Hur, Y.; Lim, S. Customer churning prediction using support vector machines in online auto insurance service. In Advances in Neural Networks, Proceedings of the ISNN 2005, Chongqing, China, 30 May–1 June 2005; Springer: Berlin/Heidelberg, Germany, 2005; pp. 928–933. [Google Scholar]
- Lee, S.J.; Siau, K. A review of data mining techniques. Ind. Manag. Data Syst. 2001, 101, 41–46. [Google Scholar] [CrossRef]
- Mazhari, N., et al. "An overview of classification and its algorithms." 3th Data Mining Conference (IDMC'09): Tehran. 2009.
- Linoff, G.S.; Berry, M.J. Data Mining Techniques: For Marketing, Sales, and Customer Relationship Management; John Wiley & Sons: Hoboken, NJ, USA, 2011. [Google Scholar]
- Jadhav, R.J.; Pawar, U.T. Churn prediction in telecommunication using data mining technology. IJACSA Edit. 2011, 2, 17–19. [Google Scholar]
- Witten, I.H.; Frank, E.; Hall, M.A. Data Mining: Practical Machine Learning Tools and Techniques; Elsevier Science & Technology: San Francisco, CA, USA, 2016. [Google Scholar]
- Ho, T.K. Random decision forests. In Proceedings of the 3rd International Conference on Document Analysis and Recognition, Montreal, QC, Canada, 14–16 August 1995; Volume 1. [Google Scholar]
- Breiman, L. Random forests. Mach. Learn. 2001, 45, 5–32. [Google Scholar] [CrossRef]
- Karlberg, J.; Axen, M. Binary Classification for Predicting Customer Churn; Umeå University: Umeå, Sweden, 2020. [Google Scholar]
- Windridge, D.; Nagarajan, R. Quantum Bootstrap Aggregation. In Proceedings of the International Symposium on Quantum Interaction, San Francisco, CA, USA, 20–22 July 2016; Springer: Berlin/Heidelberg, Germany, 2017. [Google Scholar]
- Wang, J.C.; Hastie, T. Boosted Varying-Coefficient Regression Models for Product Demand Prediction. J. Comput. Graph. Stat. 2014, 23, 361–382. [Google Scholar] [CrossRef]
- Al Daoud, E. Intrusion Detection Using a New Particle Swarm Method and Support Vector Machines. World Acad. Sci. Eng. Technol. 2013, 77, 59–62. [Google Scholar]
- Al Daoud, E.; Turabieh, H. New empirical nonparametric kernels for support vector machine classification. Appl. Soft Comput. 2013, 13, 1759–1765. [Google Scholar] [CrossRef]
- Al Daoud, E. An Efficient Algorithm for Finding a Fuzzy Rough Set Reduct Using an Improved Harmony Search. Int. J. Mod. Educ. Comput. Sci. (IJMECS) 2015, 7, 16–23. [Google Scholar] [CrossRef]
- Zhang, Y.; Haghani, A. A gradient boosting method to improve travel time prediction. Transp. Res. Part C Emerg. Technol. 2015, 58, 308–324. [Google Scholar] [CrossRef]
- Dorogush, A.; Ershov, V.; Gulin, A. CatBoost: Gradient boosting with categorical features support. In Proceedings of the Thirty-first Conference on Neural Information Processing Systems, Long Beach, CA, USA, 4–9 December 2017; pp. 1–7. [Google Scholar]
- Ke, G.; Meng, Q.; Finley, T.; Wang, T.; Chen, W.; Ma, W.; Ye, Q.; Liu, T.Y. Lightgbm: A highly efficient gradient boosting decision tree. In Advances in Neural Information Processing Systems; MIT Press: Cambridge, MA, USA, 2017; Volume 30. [Google Scholar]
- Klein, A.; Falkner, S.; Bartels, S.; Hennig, P.; Hutter, F. Fast Bayesian optimization of machine learning hyperparameters on large datasets. In Proceedings of the Machine Learning Research PMLR, Sydney, NSW, Australia, 6–11 August 2017; Volume 54, pp. 528–536. [Google Scholar]
- Imani, M.; Arabnia, H.R. Hyperparameter optimization and combined data sampling techniques in machine learning for customer churn prediction: a comparative analysis. Technologies 2023, 11, 167. [Google Scholar] [CrossRef]
- Joudaki, Majid, et al. "Presenting a New Approach for Predicting and Preventing Active/Deliberate Customer Churn in Telecommunication Industry." Proceedings of the International Conference on Security and Management (SAM). The Steering Committee of The World Congress in Computer Science, Computer Engineering and Applied Computing (WorldComp), 2011.
- Imani, Mehdi, et al. "The Impact of SMOTE and ADASYN on Random Forest and Advanced Gradient Boosting Techniques in Telecom Customer Churn Prediction." 2024 10th International Conference on Web Research (ICWR). IEEE, 2024.
- Joudaki, M.; Imani, M.; Arabnia, H.R. A New Efficient Hybrid Technique for Human Action Recognition Using 2D Conv-RBM and LSTM with Optimized Frame Selection. Technologies 2025, 13, 53. [Google Scholar] [CrossRef]
- Imani, M.; Beikmohammadi, A.; Arabnia, H.R. Comprehensive Analysis of Random Forest and XGBoost Performance with SMOTE, ADASYN, and GNUS Under Varying Imbalance Levels. Technologies 2025, 13, 88. [Google Scholar] [CrossRef]
- Christy, R. Customer Churn Prediction 2020, Version 1. 2020. Available online: https://www.kaggle.com/code/rinichristy/customer-churn-prediction-2020 (accessed on 20 January 2022).
- Imani, M.; Joudaki, M.; Beikmohammadi, A.; Arabnia, H.R. Customer Churn Prediction: A Systematic Review of Recent Advances, Trends, and Challenges in Machine Learning and Deep Learning. Machine Learning and Knowledge Extraction 2025, 7, 105. [Google Scholar] [CrossRef]
Figure 1.
Visualization of the bagging approach [26].
Figure 1.
Visualization of the bagging approach [26].
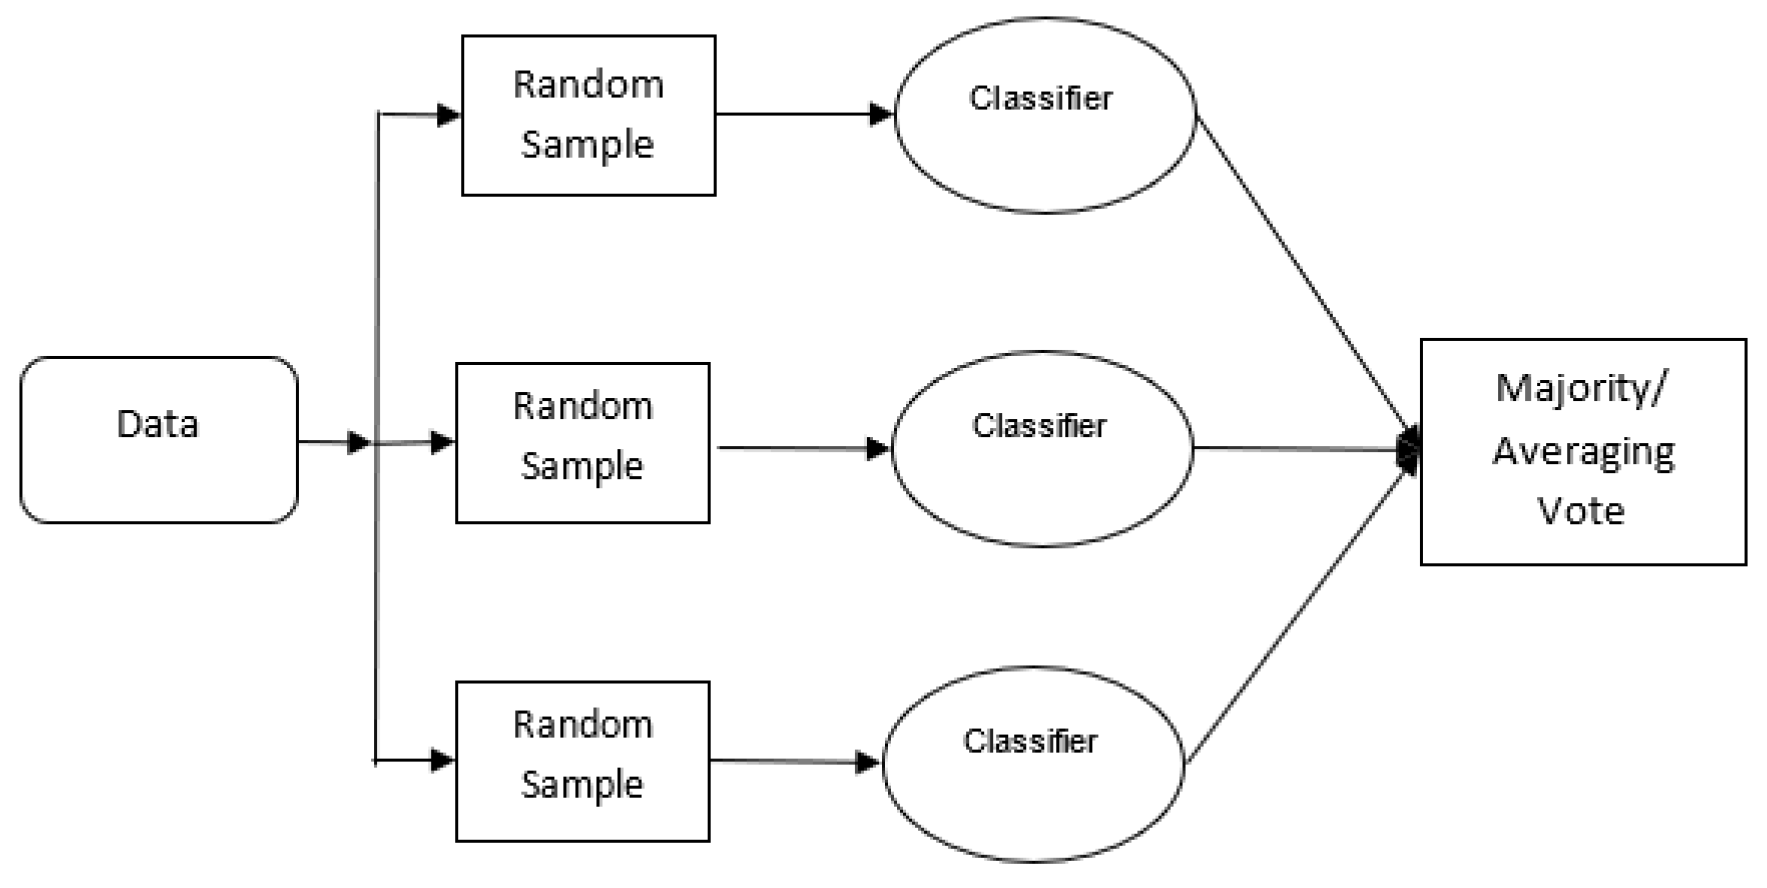
Figure 2.
Visualization of the Random Forest Classifier [26].
Figure 2.
Visualization of the Random Forest Classifier [26].
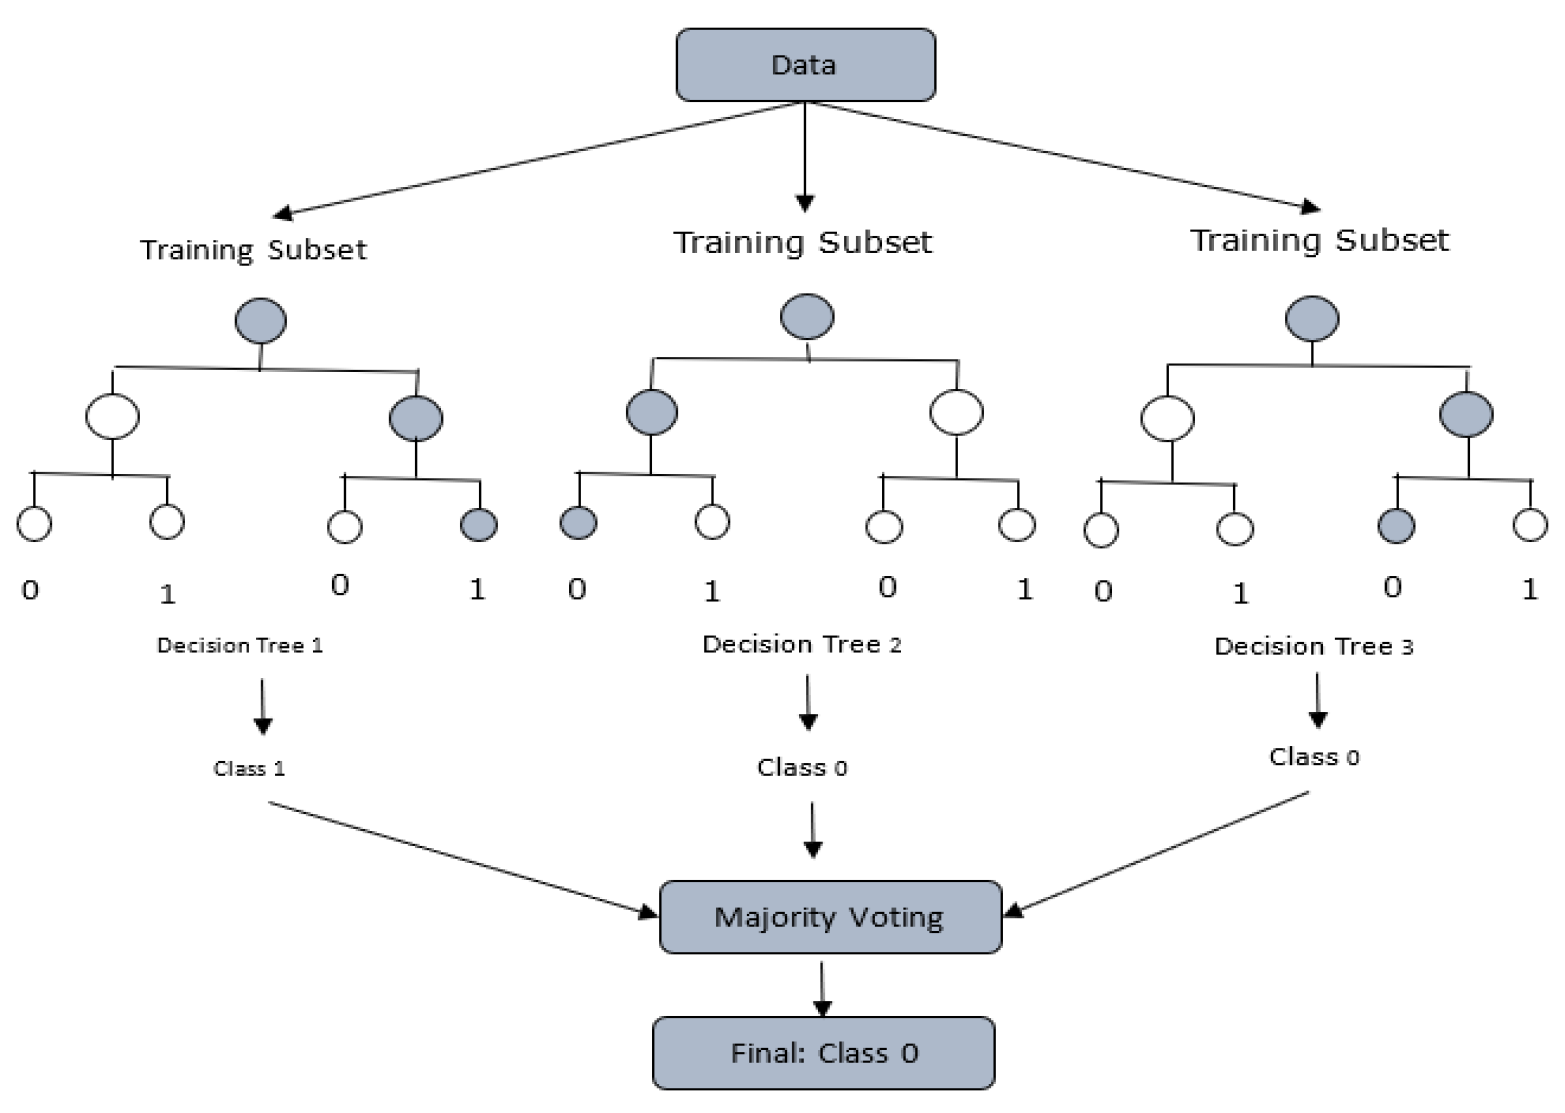
Figure 3.
Visualization of the boosting approach [26].
Figure 3.
Visualization of the boosting approach [26].
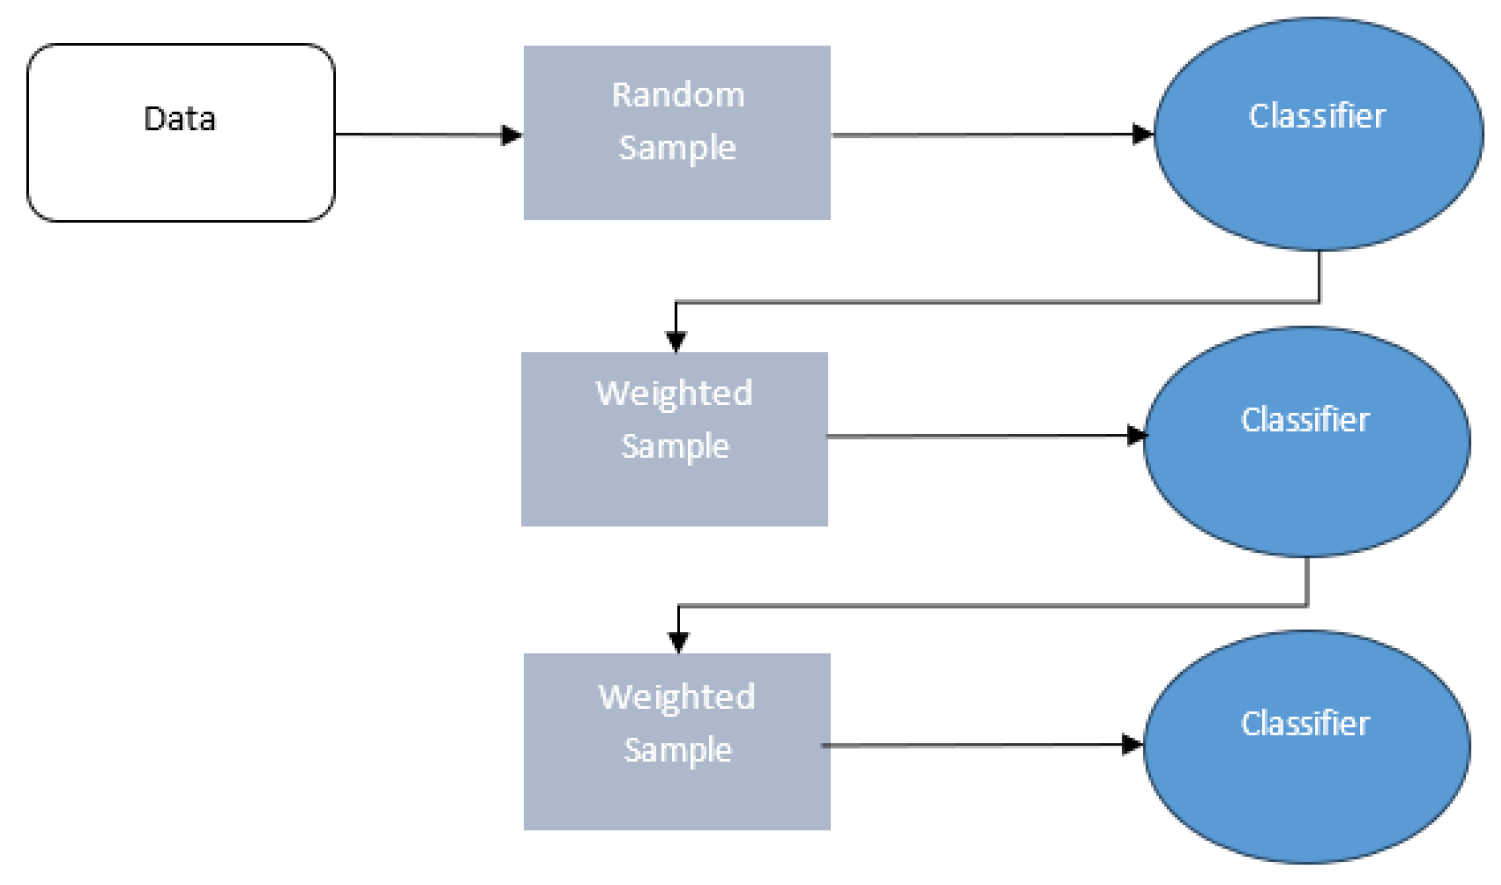
Figure 4.
Comparison of tree growth models, a. XGBoost Level Wise Tree Growth, b. LightGBM Leaf Wise Tree Growth [26].
Figure 4.
Comparison of tree growth models, a. XGBoost Level Wise Tree Growth, b. LightGBM Leaf Wise Tree Growth [26].
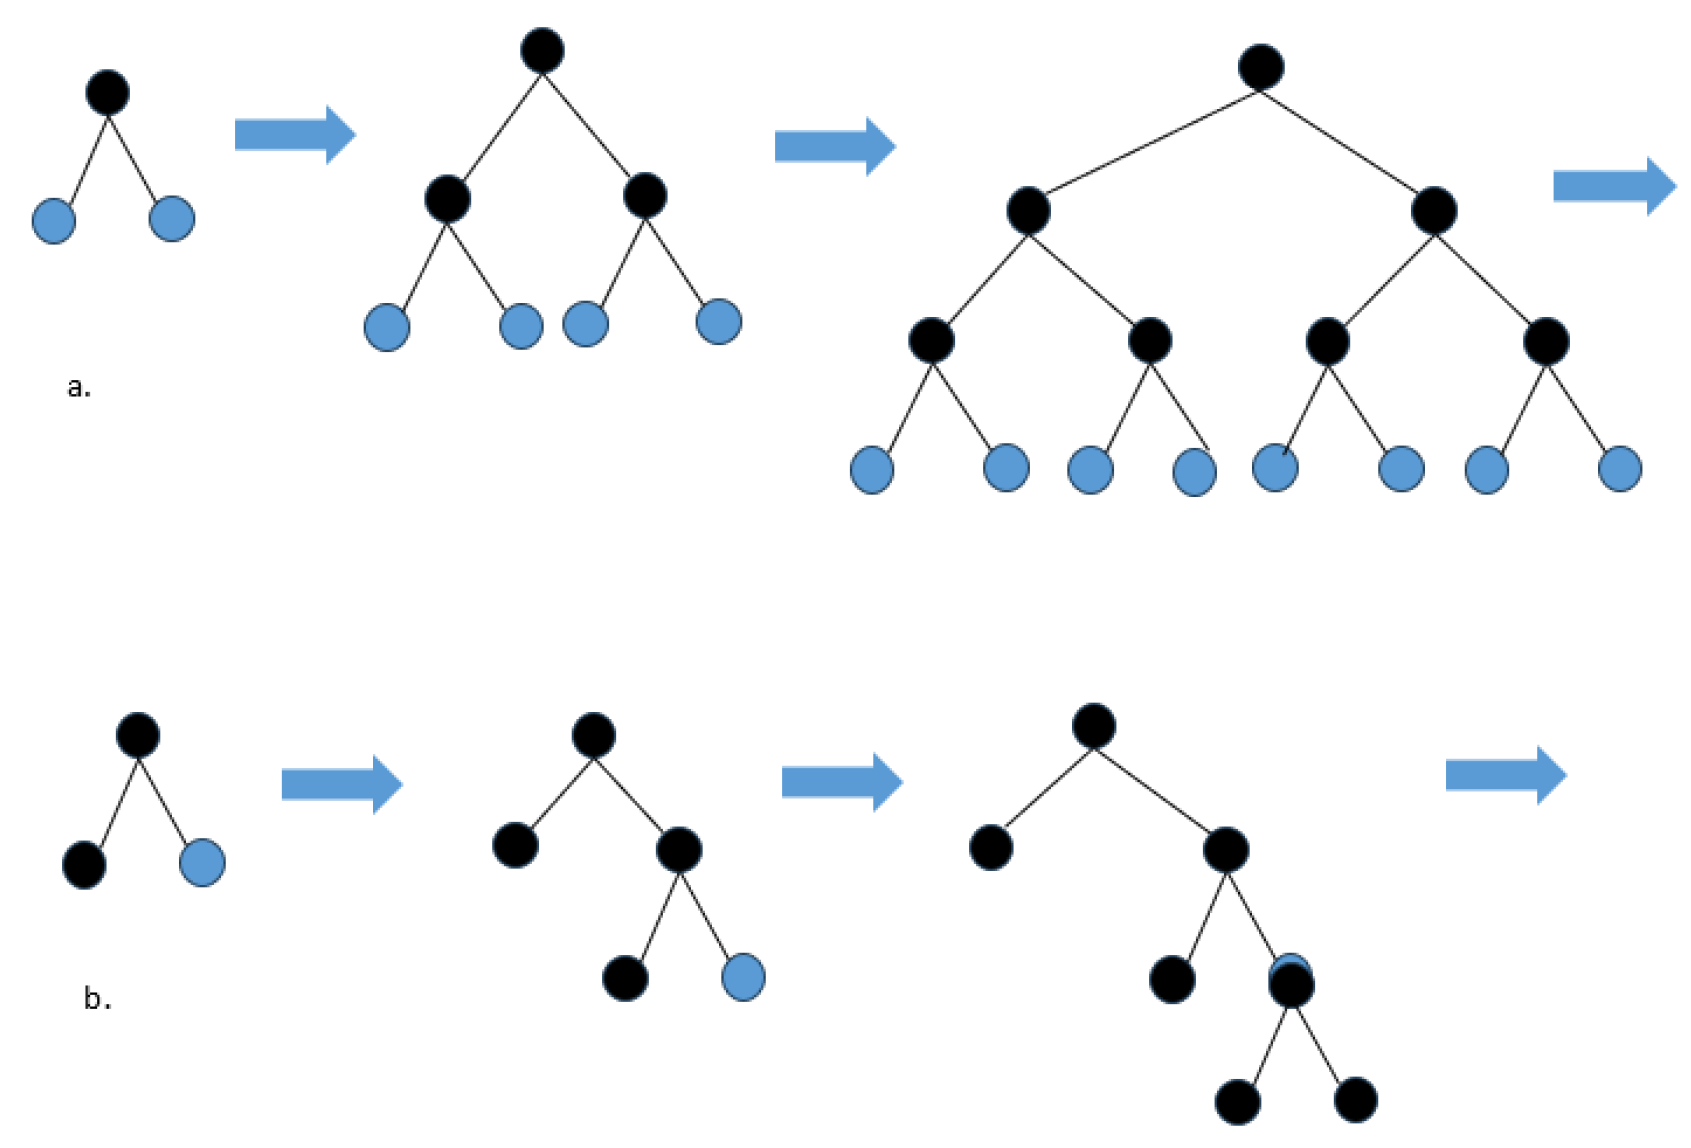
Figure 5.
The ROC Curve.
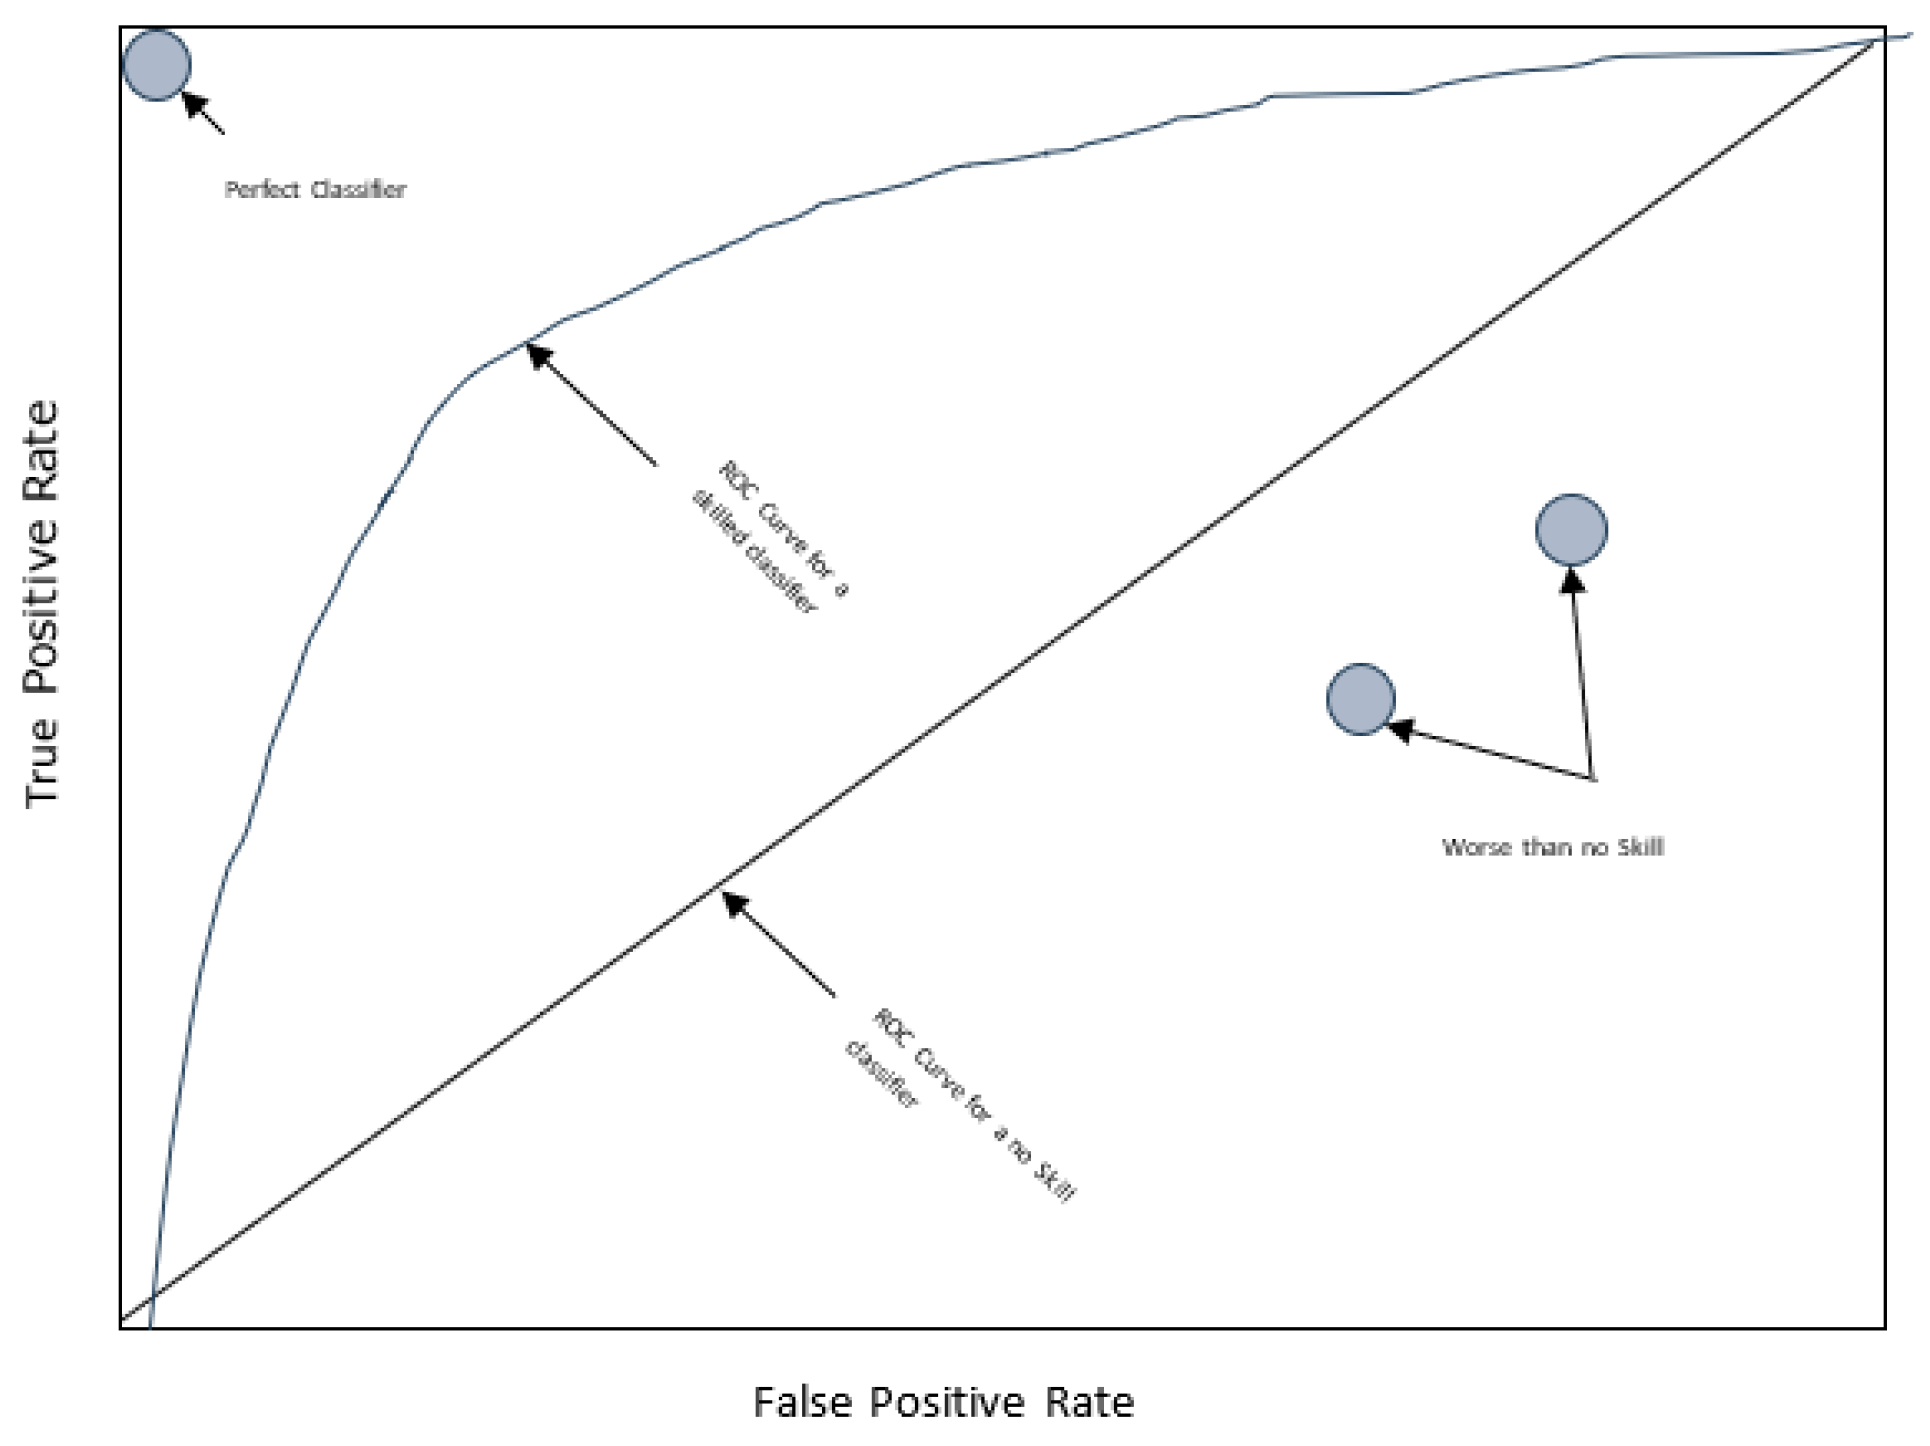
Figure 6.
ROC curve diagram for various models [32].
Figure 6.
ROC curve diagram for various models [32].
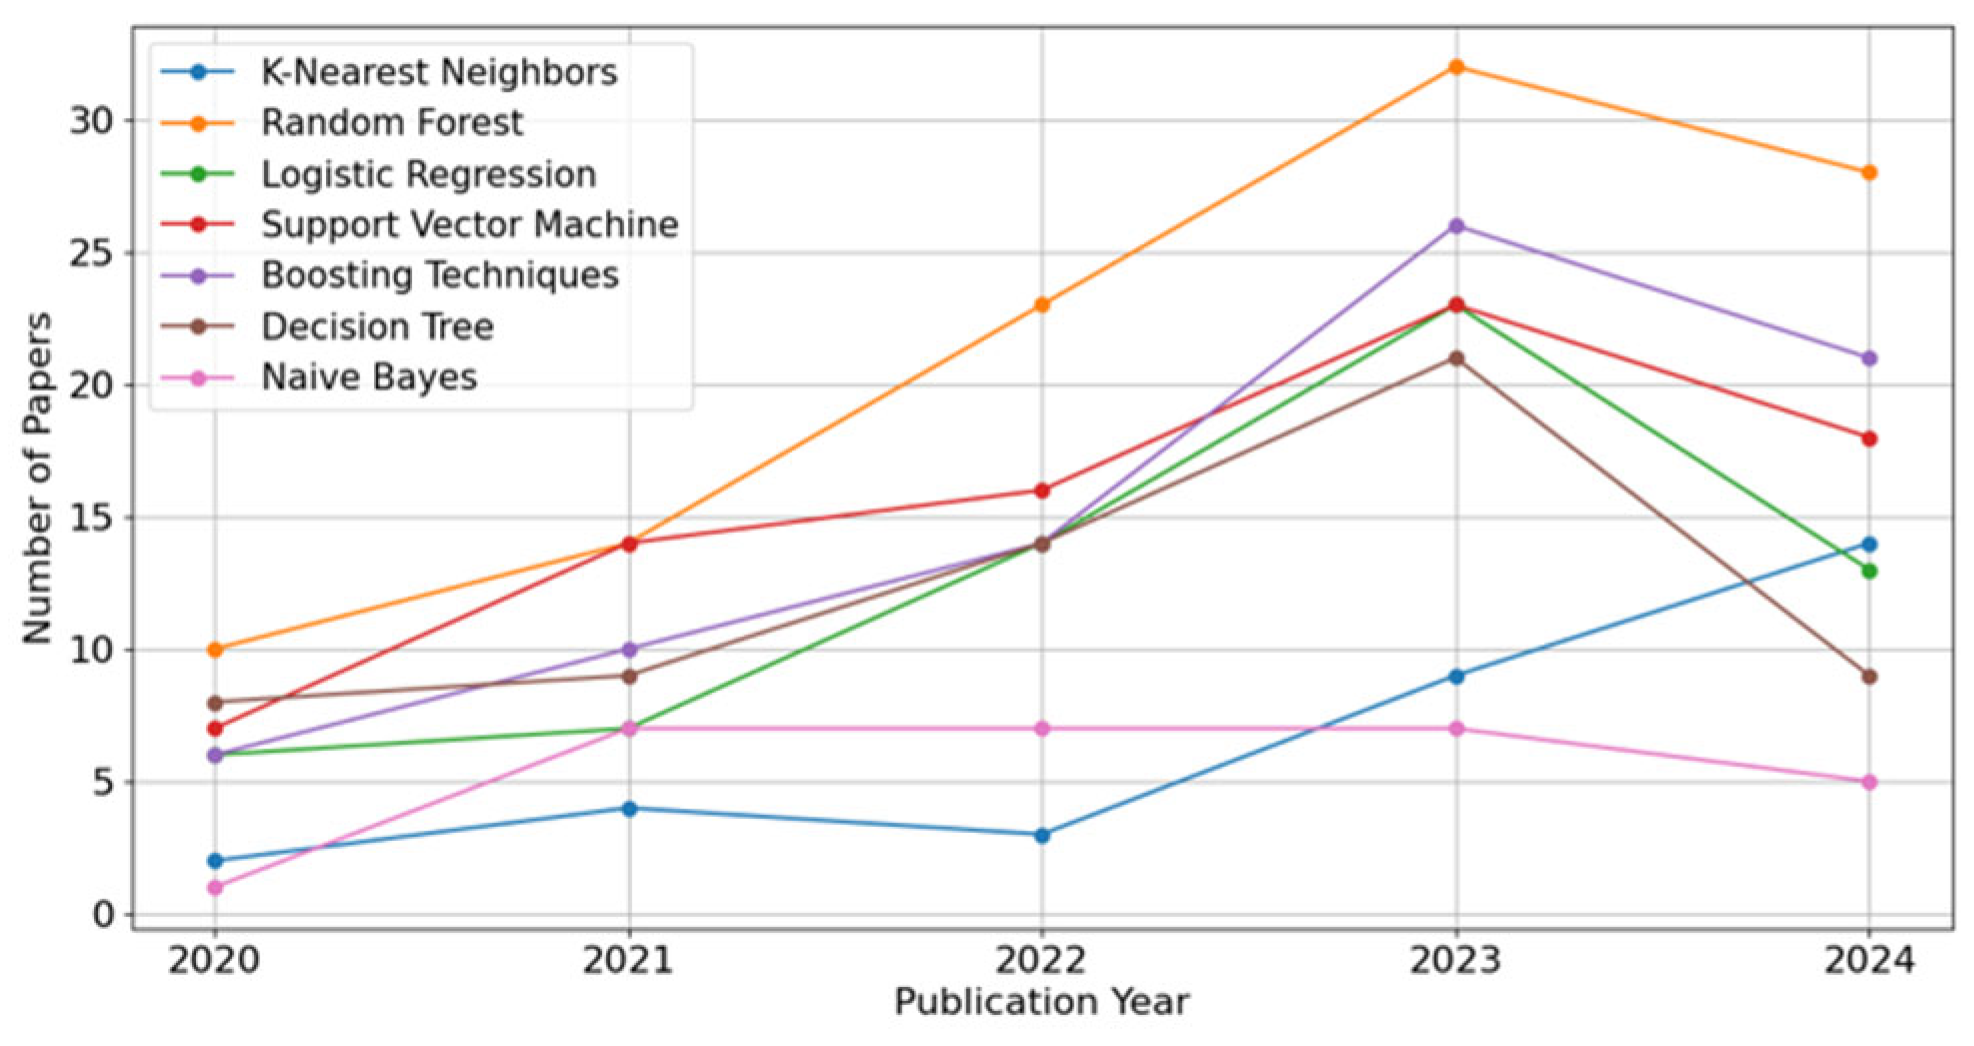
Figure 7.
ROC curve diagram for various models.
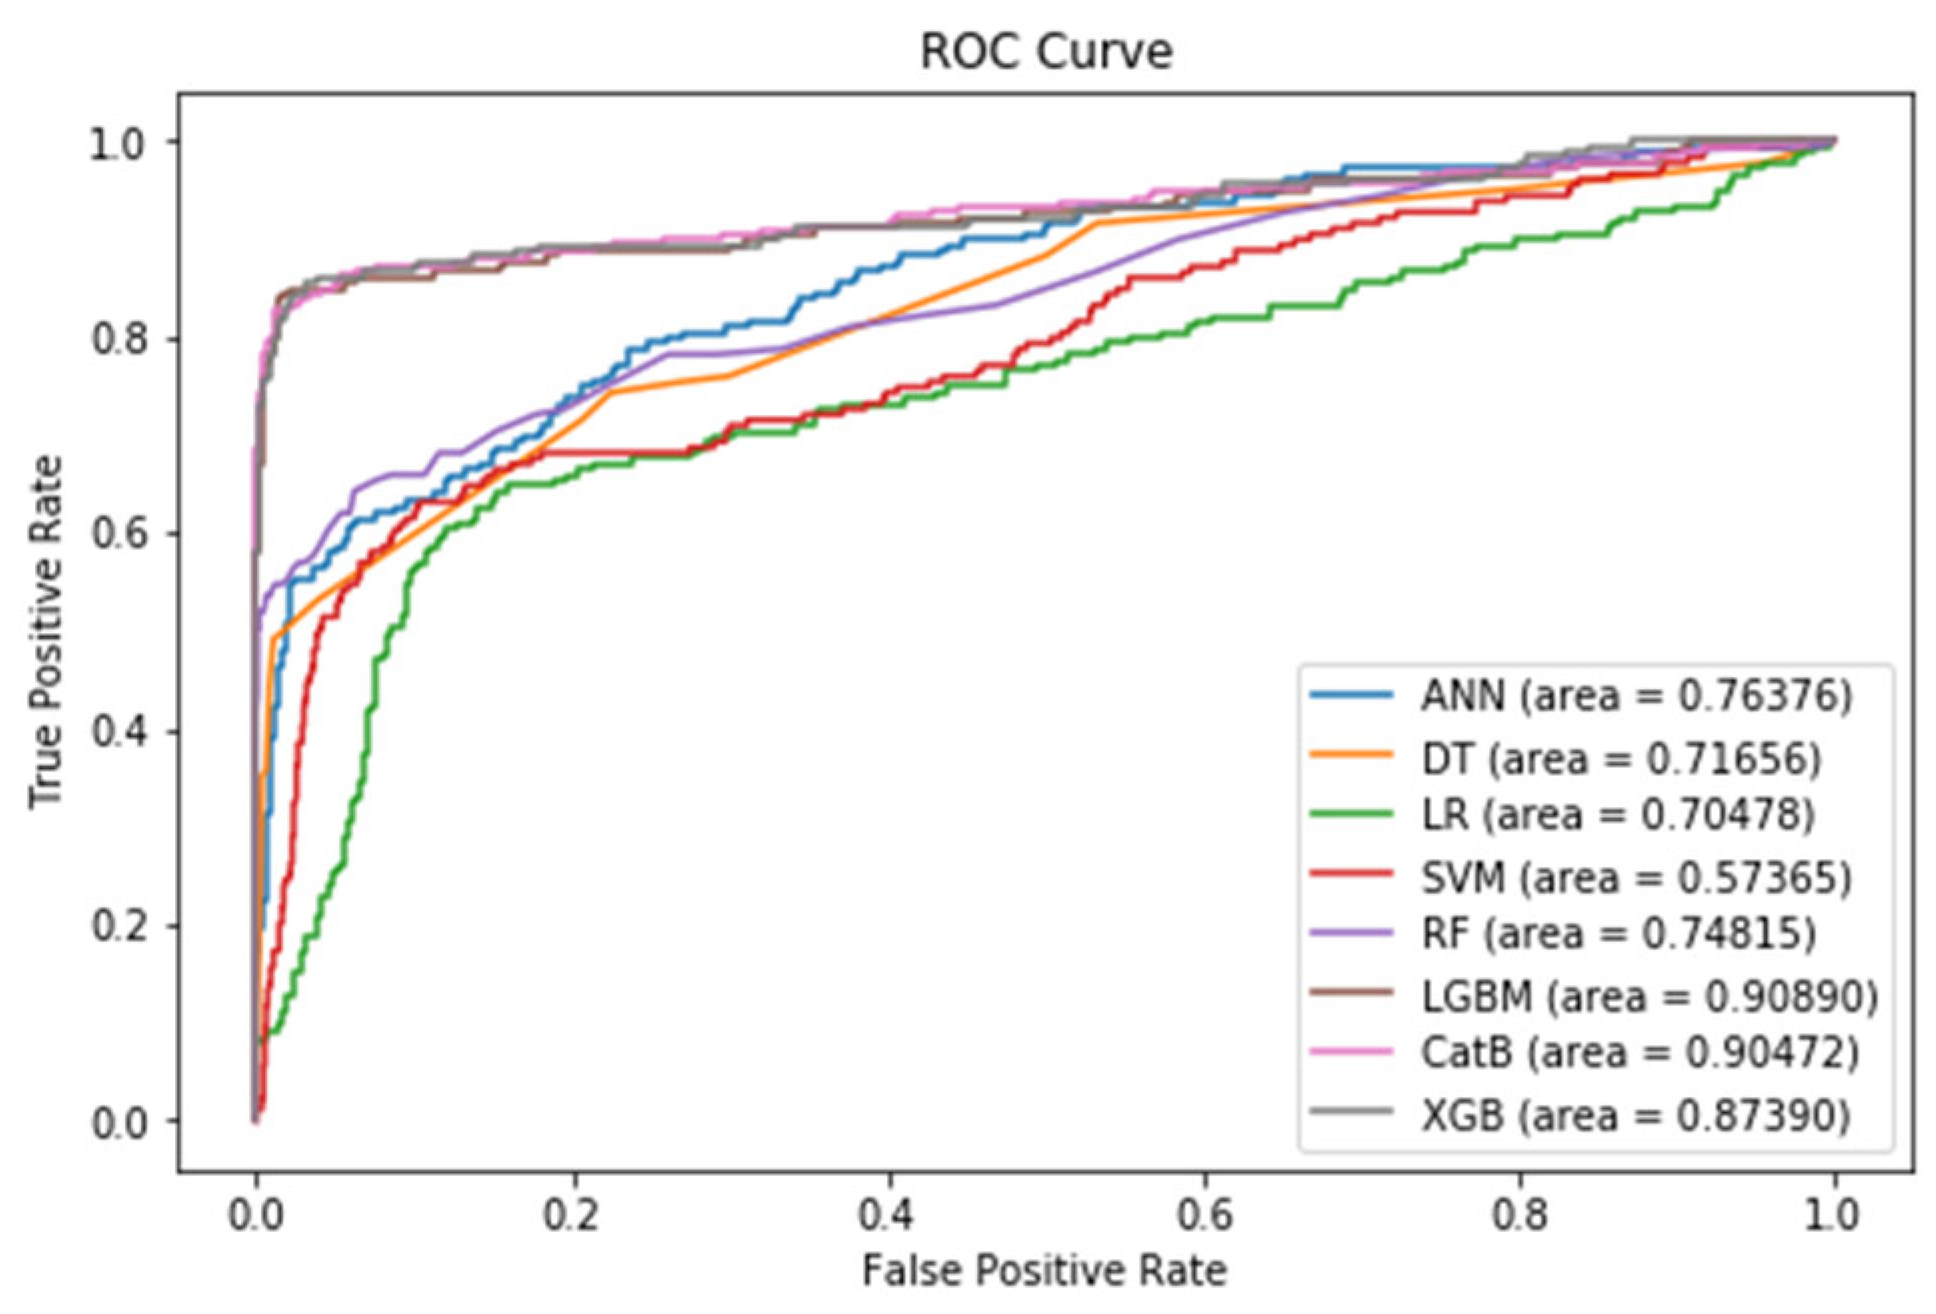

Table 1.
The confusion matrix.
| Predicted Class | |||
| Churners | Non-churners | ||
| Actual Class | Churners | TP | FN |
| Non-churners | FP | TN | |
Table 2.
Evaluation metrics for the different models after pre-processing and feature selection.
| Models | Precision% | Recall% | F1-score% | ROC AUC% |
| DT | 91 | 72 | 77 | 72 |
| ANN | 85 | 76 | 80 | 77 |
| LR | 61 | 70 | 62 | 70 |
| SVM | 81 | 57 | 59 | 57 |
| RF | 96 | 75 | 81 | 75 |
| CatBoost | 90 | 90 | 90 | 90 |
| LightGBM | 94 | 91 | 92* | 91* |
| XGBoost | 96 | 87 | 91 | 87 |
Disclaimer/Publisher’s Note: The statements, opinions and data contained in all publications are solely those of the individual author(s) and contributor(s) and not of MDPI and/or the editor(s). MDPI and/or the editor(s) disclaim responsibility for any injury to people or property resulting from any ideas, methods, instructions or products referred to in the content. |
© 2025 by the authors. Licensee MDPI, Basel, Switzerland. This article is an open access article distributed under the terms and conditions of the Creative Commons Attribution (CC BY) license (http://creativecommons.org/licenses/by/4.0/).
Copyright: This open access article is published under a Creative Commons CC BY 4.0 license, which permit the free download, distribution, and reuse, provided that the author and preprint are cited in any reuse.


