
Submitted:
05 March 2025
Posted:
06 March 2025
You are already at the latest version
Abstract
The study examines the impact of customer-centric quality management systems (hereinafter referred to as QMS) on economic efficiency and customer satisfaction in construction companies in Kazakhstan.
Using regression and cluster analysis, key factors such as quality management costs (QMC), customer satisfaction level (CSL), economic efficiency of QMS (EEQMS) and the company`s period of operation (PO) were analyzed.
The results of the study show that customer-oriented companies that actively invest in quality management demonstrate high profitability and significantly higher levels of customer satisfaction. Cluster analysis identified three groups of companies with varying degrees of customer centricity and efficiency. Companies from the first cluster, which focus on service quality and customer satisfaction, achieved the best financial results.
The study emphasizes the importance of implementing customer-oriented approaches to quality management to improve the competitiveness and long-term sustainability of construction companies.
Keywords:
quality management system
; customer focus
; efficiency
; assessment
; business process optimization
1. Introduction
In today's globalized and increasingly competitive environment, construction companies face challenges that require enhancing their competitiveness by optimizing internal processes and strengthening their focus on customer needs.
One of the key tools for achieving these goals is the implementation of customer-centric quality management systems (hereinafter referred to as QMS). Quality management systems, such as ISO 9001, play an important role in the construction industry by ensuring the quality of services and products, which in turn increases customer satisfaction and improves the financial performance of companies. According to Chen, J., Li, Y., the implementation of customer-oriented approaches in quality management positively impacts company profitability by increasing customer trust and brand loyalty (Chen and Li 2019).
Research in the construction sector also shows that customer satisfaction is closely related to a company’s economic performance. For example, Martinez, L., Torres, P. (2020) demonstrated that customer-oriented strategies in construction companies increase the likelihood of repeat orders and referrals, which directly affects revenue growth (Martinez and Torres 2020).
Moreover, such companies are more resilient to market fluctuations and economic crises, as strong customer relationships create financial stability and flexibility. This approach is especially important for the construction sector, where high customer expectations and strict product quality requirements are key success factors.
Kazakhstani researchers also highlight the importance of quality management systems for construction companies in the country. For example Zhuman Yeldar et al. found that companies implementing QMS according to international standards, such as ISO 9001, demonstrate higher profitability and resource efficiency (Zhuman et al. 2024). These standards help optimize business processes, reduce production costs, and improve quality control. Additionally, the researchers note that the implementation of QMS in Kazakhstani construction companies leads to increased customer satisfaction, which contributes to greater demand and enhanced competitiveness in the domestic market (Makulova et al. 2023).
Thus, this study aims to provide an in-depth analysis of the impact of customer-centric quality management systems on financial results and customer satisfaction in construction companies in Kazakhstan.
The main objective of the study is to identify the relationship between the implementation of QMS and key performance indicators such as profitability, economic efficiency and customer satisfaction. Drawing on both foreign and domestic research, this study seeks to propose new approaches to quality management in construction companies that can contribute to their long-term sustainability and success in the market.
2. Literature Review
In recent years, researchers have increasingly focused on studying how the implementation of customer-centric QMS can affect key business indicators such as profitability, customer satisfaction and operational efficiency.
The scientific works of Gonzalez, A., Rodriguez, M. demonstrated that customer-oriented QMS improves customer satisfaction, which, in turn, positively impacts a company's financial results (Gonzalez and Rodriguez 2019).
Chen, J., Li, Y. discussed the customer-oriented approach in QMS in detail, emphasizing the importance of a strategically focusing on the customer to optimize business processes and improve overall performance indicators (Chen, and Li 2020).
The study by Peter, L., Hopkins, R. found that the implementation of customer-oriented QMS leads to a reduction in operating costs and increased profitability due to the optimization of internal processes (Peter and Hopkins 2021).
Efficiency and business processes optimization are central themes in QMS research. According to Martinez, L., Torres, P., the successful implementation of QMS is associated with a reduced production costs and enhanced product quality control (Martinez and Torres 2021).
Their study also highlights the importance of regularly evaluating the implemented systems to ensure continuous process improvement. Similar conclusions were reached by Kazakhstani authors Abdrasheva, A., Alibekova, G., who showed that assessing the effectiveness of the QMS helps companies build sustainable competitive advantages (Abdrashev and Alibekova 2020).
The key role of QMS in improving operational efficiency is discussed in the work of Nguyen, T., Chang, H., which notes that standardizing processes through QMS helps to improve internal communications and reduce project execution time (Nguyen and Chang 2022).
Mukhamedova, G., Karimov, M. also highlighted that implementing QMS enhances profitability by minimizing defects and failures in the production process (Mukhamedova and Karimov 2021).
The effective assessment of implemented quality management systems has been the focus of several studies. For example, research by Wang, D., Li, H. demonstrated that companies using QMS assessment models achieve better financial results by identifying and eliminating bottlenecks in business processes in a timely manner (Wang and Li 2019).
Brown, K., Smith, J. (2020) emphasized that evaluating the effectiveness of QMS allows companies to optimize their processes and improve overall operational efficiency (Brown and Smith 2020).
Several studies also focus on business process optimization as an important component of QMS. Lopez, J., Parker, S. discuss how companies that implement business process optimization approaches through QMS achieve higher customer satisfaction and increase financial stability (Lopez and Parker 2020).
Thus, there is a consensus among researchers that customer focus, efficiency, evaluation and business processes optimization within the quality management system are interrelated factors that contribute to improving the business performance of companies.
Development of hypotheses. Based on the literature review, the following hypotheses have been identified for further empirical research:
H1
: Implementation of customer-oriented QMS has a positive effect on customer satisfaction.
H2
: Optimization of business processes through QMS leads to increased customer satisfaction and overall operational efficiency.
Review of the leading scientific directions for substantiating hypotheses.
To substantiate the hypotheses, we review the leading scientific works of Peter, L., Hopkins, R., Nguyen, T., Chang, H, which demonstrate that the implementation of a QMS focused on process optimization reduces costs and increases profitability by improving operational efficiency.
Research by Wang, D., Li, H. and Brown, K., Smith, J. confirms that assessing the effectiveness of the QMS enables companies to identify weaknesses in a timely manner and optimize their processes.
Studies by Lopez, J., Parker, S. showed that process optimization through the QMS leads to improved product quality and increased customer satisfaction.
3. Research Methodology
To study the impact of QMS on the financial and operational performance of construction companies, this paper employs several quantitative methods of analysis and modeling based on foreign and Kazakhstani studies. The primary aim and objectives of the study are to identify the relationship between key company indicators (such as sales volumes, profitability and customer satisfaction) and the effectiveness of QMS implementation.
The main areas of data collection include sales volumes, economic efficiency of the QMS, and quality management costs. In the study by Wang, D., Li, H. proposed an approach to assessing the economic efficiency of the QMS using multivariate analysis, which facilitates the identification of the impact of quality management costs on overall company profitability (Wang and Li 2019).
To evaluate product profitability and overall company profitability, regression analysis will also be employed, akin to the approach used by Brown, K., Smith, J., which demonstrated a high correlation between quality costs and profitability (Brown and Smith 2020).
To analyze the level of customer satisfaction, as an important indicator of the effectiveness of QMS implementation, the methodology developed by Martinez, L., Torres, P will be applied. They used the structural equation modeling (SEM) to assess the impact of product quality improvement on customer satisfaction and repeat orders (Martinez and Torres 2021). In addition to regression and multivariate analysis, cluster analysis will be employed to group construction companies based on key indicators.
Cluster analysis will allow for categorizing by the level of QMS implementation effectiveness, as well as by parameters such as sales volumes, product profitability, overall company profitability and customer satisfaction.
To conduct cluster analysis, k-means or hierarchical cluster analysis algorithms will be utilized. Following the methodology proposed by Lopez, J., Parker, S. (2020), companies will be divided into clusters based on performance indicators, such as quality management costs, product profitability, and overall company profitability (Lopez and Parker 2020). The objective to identify groups of companies that exhibit the highest economic efficiency from QMS implementation, as well as those that require process optimization to improve performance.
This methodology allows for taking into account multidimensional relationships between variables, including the company’s operating period and sales volumes, ensuring a comprehensive evaluation of QMS effectiveness.
4. Analysis
In the context of intense global competition and increasingly stringent consumer requirements, construction companies must not only enhance the quality of their products, but also focus more actively on customer satisfaction.
The implementation of QMS allows companies to improve internal business processes and significantly increase customer satisfaction, which is an important driver of long-term success.
Optimizing business processes through the implementation and evaluation of QMS is becoming a vital component in improving company efficiency.
This study aims to conduct an in-depth analysis of the impact of the QMS on key indicators such as product profitability, quality management costs, sales volumes and customer satisfaction. By employing, multivariate analysis, cluster analysis and regression models, the study will explore the relationship between QMS implementation and financial outcomes and will develop recommendations for enhancing quality management efficiency in construction companies.
The following matrix outlines the research problems related to the impact of customer-oriented quality management systems on profits and customer satisfaction in construction companies.
Each cell of the matrix specifies issues and references pertinent studies.
Figure 1.
Matrix of the impact of customer-oriented QMS on profit and customer satisfaction.
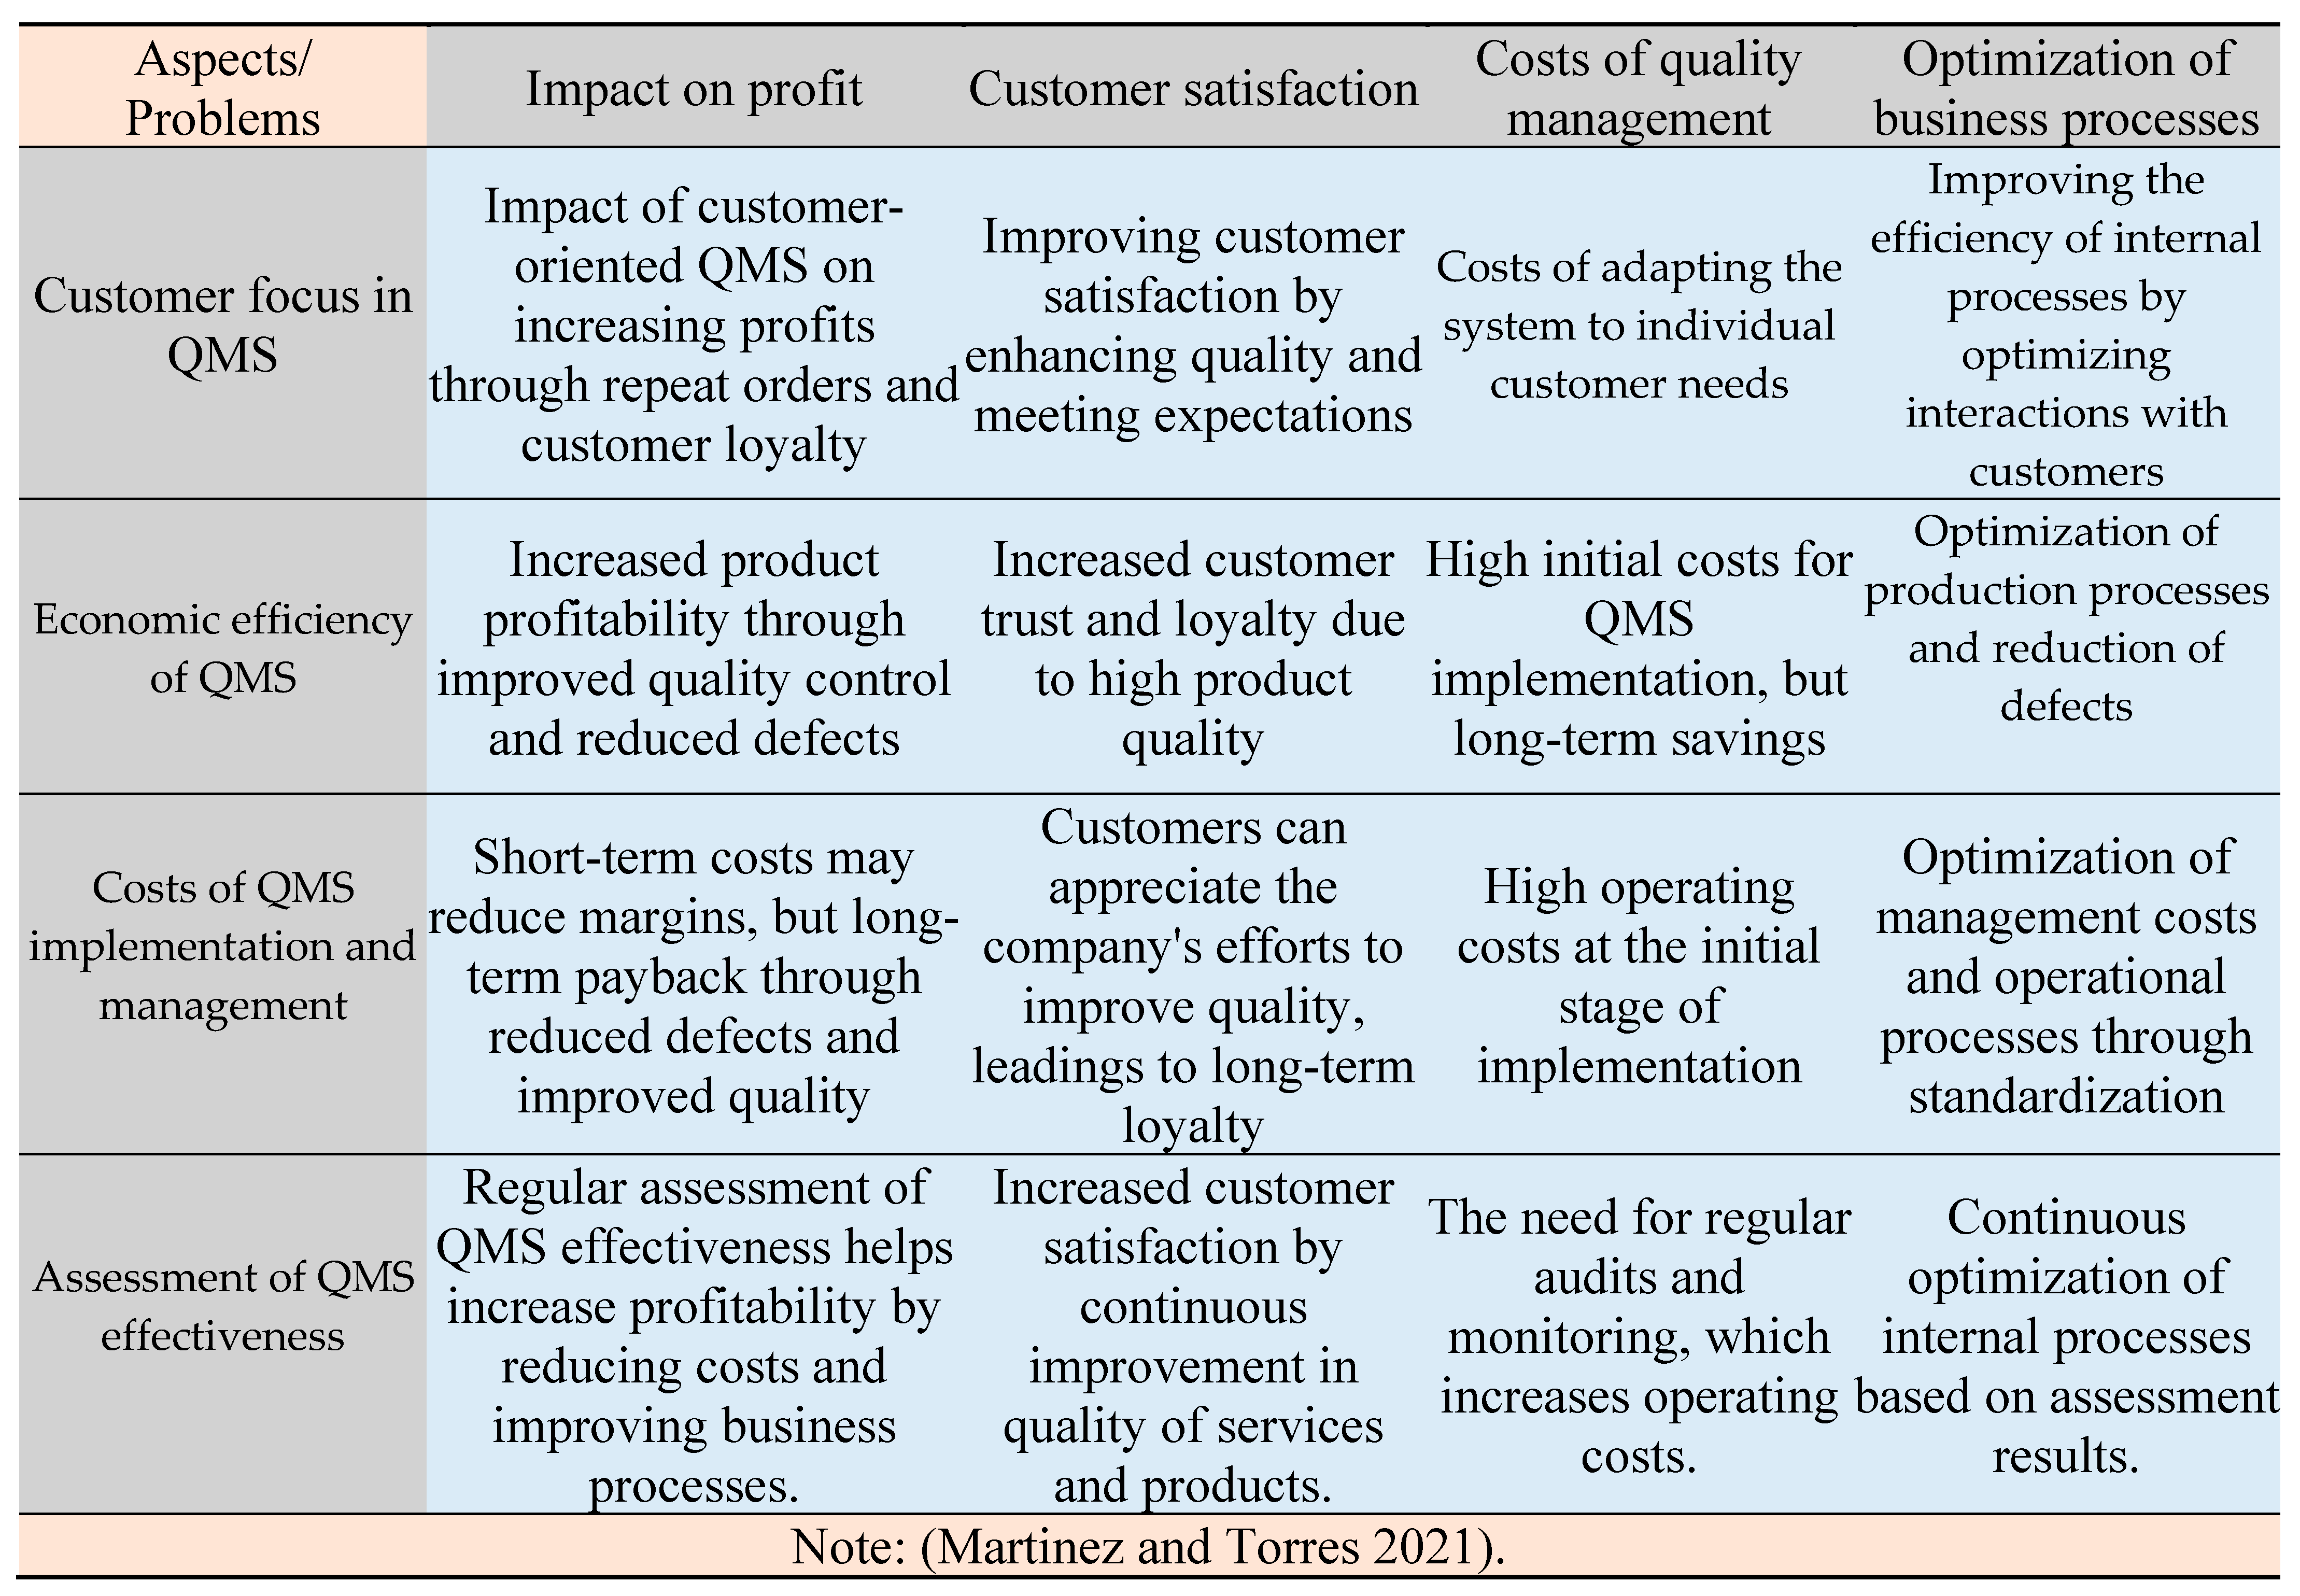
Figure 2.
Impact of customer-oriented QMS on profit and customer satisfaction.
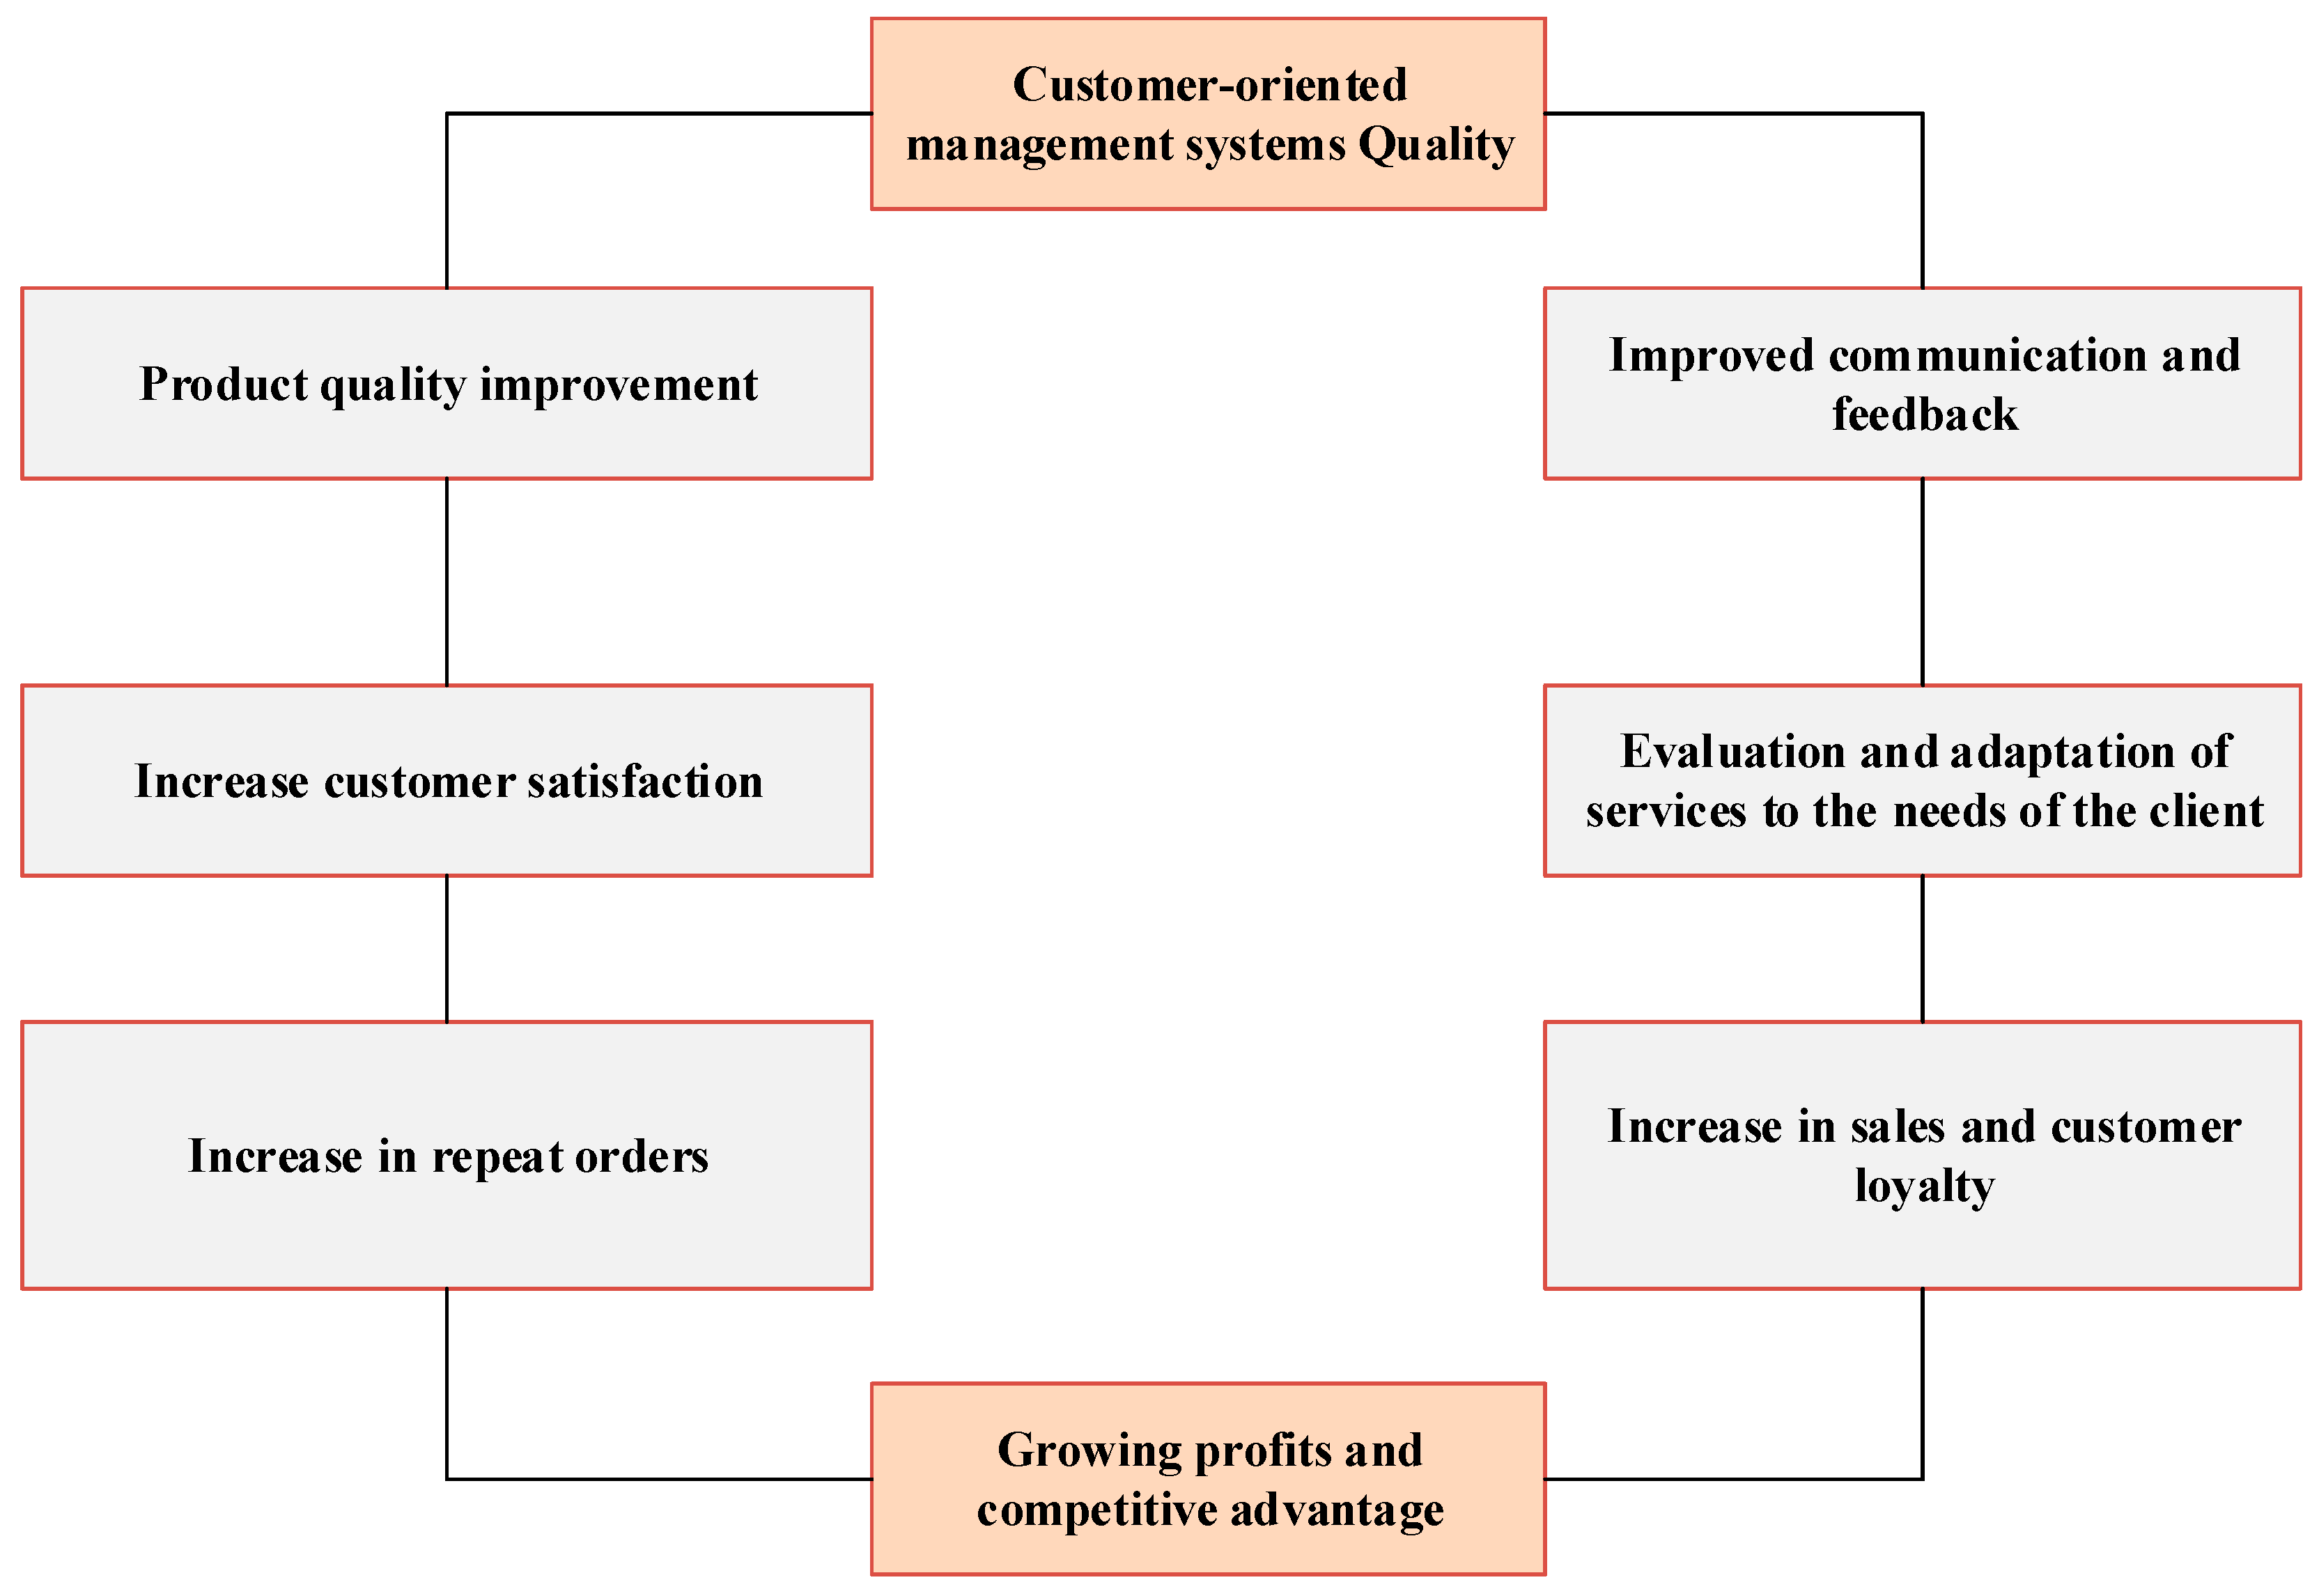
A customer-oriented QMS is a pivotal concept designed to tailor quality management processes and standards in construction companies to meet customer needs effectively.
This section explores how various systems impact productivity and customer interaction. The implementation of a QMS, significantly enhances product quality, which is a primary driver of customer satisfaction. Customer-oriented QMS fosters improved feedback mechanisms between the customer and the company, leading to a more precise understanding of customer expectations.
Enhancements in product quality and feedback processes contribute to greater customer satisfaction. A well-implemented QMS helps in adapting the company's services and products to align with customer needs, thereby fostering long-term relationships. Satisfied customers are more inclined to place repeat orders, which stabilizes sales.
Improvements in customer satisfaction and product quality lead to increased sales and customer loyalty. These factors collectively contribute to higher profits and a stronger company's competitive position in the market.
The preliminary stage of regression analysis begins with identifying the key indicators that will be used in the model to assess the impact of various factors on the target variable.
When conducting regression analysis, it is important to identify both the dependent variable and independent variables to determine their impact on the company's key indicators.
In this case, sales volumes (SV) are the dependent variable, meaning the primary goal is to ascertain which factors influence changes in the sales volumes of construction companies.
Independent variables considered are: economic efficiency of the QMS (EEQMS), quality management costs (QMC), product profitability (PP), overall company profitability (OCP), customer satisfaction level (CSL), and the company's period of operation (PO). Economic efficiency of the quality management system (EEQMS) and quality management costs (QMC) are key factors that that may influence sales volumes.
When conducting regression analysis, it is important to identify the dependent variable and independent variables to determine their impact on the company's target indicators.
To conduct the regression analysis, data were collected from 23 construction companies in Kazakhstan for 2023 year. These companies span various segments of the construction market, including residential, commercial and industrial construction. The analysis focused on the financial indicators of the companies, such as sales volume (SV), quality management costs (QMC), product profitability (PP), overall company profitability (OCP), as well as non-financial factors such as the economic efficiency of the quality management system (EEQMS) and customer satisfaction level (CSL).
A notable aspect of this study is its coverage companies across different sizes and regions within Kazakhstan, enhancing the relevance of the findings for a broad spectrum of construction companies. Utilizing data from a complete calendar year ensures an accurate representation of current market conditions, including macroeconomic factors such as inflation, shifts in demand for construction services and price dynamics for construction materials.
Thus, this data set not only facilitates the identification of general patterns in the impact of quality management systems on key company indicators, but also accounts for the specific features of the work of construction companies in Kazakhstan.
Effective implementation of quality management processes is expected to reduce product defects and improve overall business processes, potentially leading to increased sales volumes.
However, quality management costs may negatively impact financial results in the short term if they do not lead to improvements in product quality.
In such cases, regression analysis will be employed to determine the balance between quality costs and their influence on sales volumes.
Other significant independent variables, such as product profitability (PP), overall company profitability (OCP) and customer satisfaction level (CSL) are crucial in determining sales volume.
Product profitability and overall profitability reflect how effectively a company utilizes its resources to generate profits. Customer satisfaction is a key indicator of the long-term business sustainability and customer loyalty, which can drive repeat orders and, therefore, sales volumes.
Incorporating factors such as the company’s period of operation (PO) into the model will help account for the company's experience and tenure in the market, which can significantly influence a company's ability to boost sales.
Figure 3.
Correlation matrix of variables.
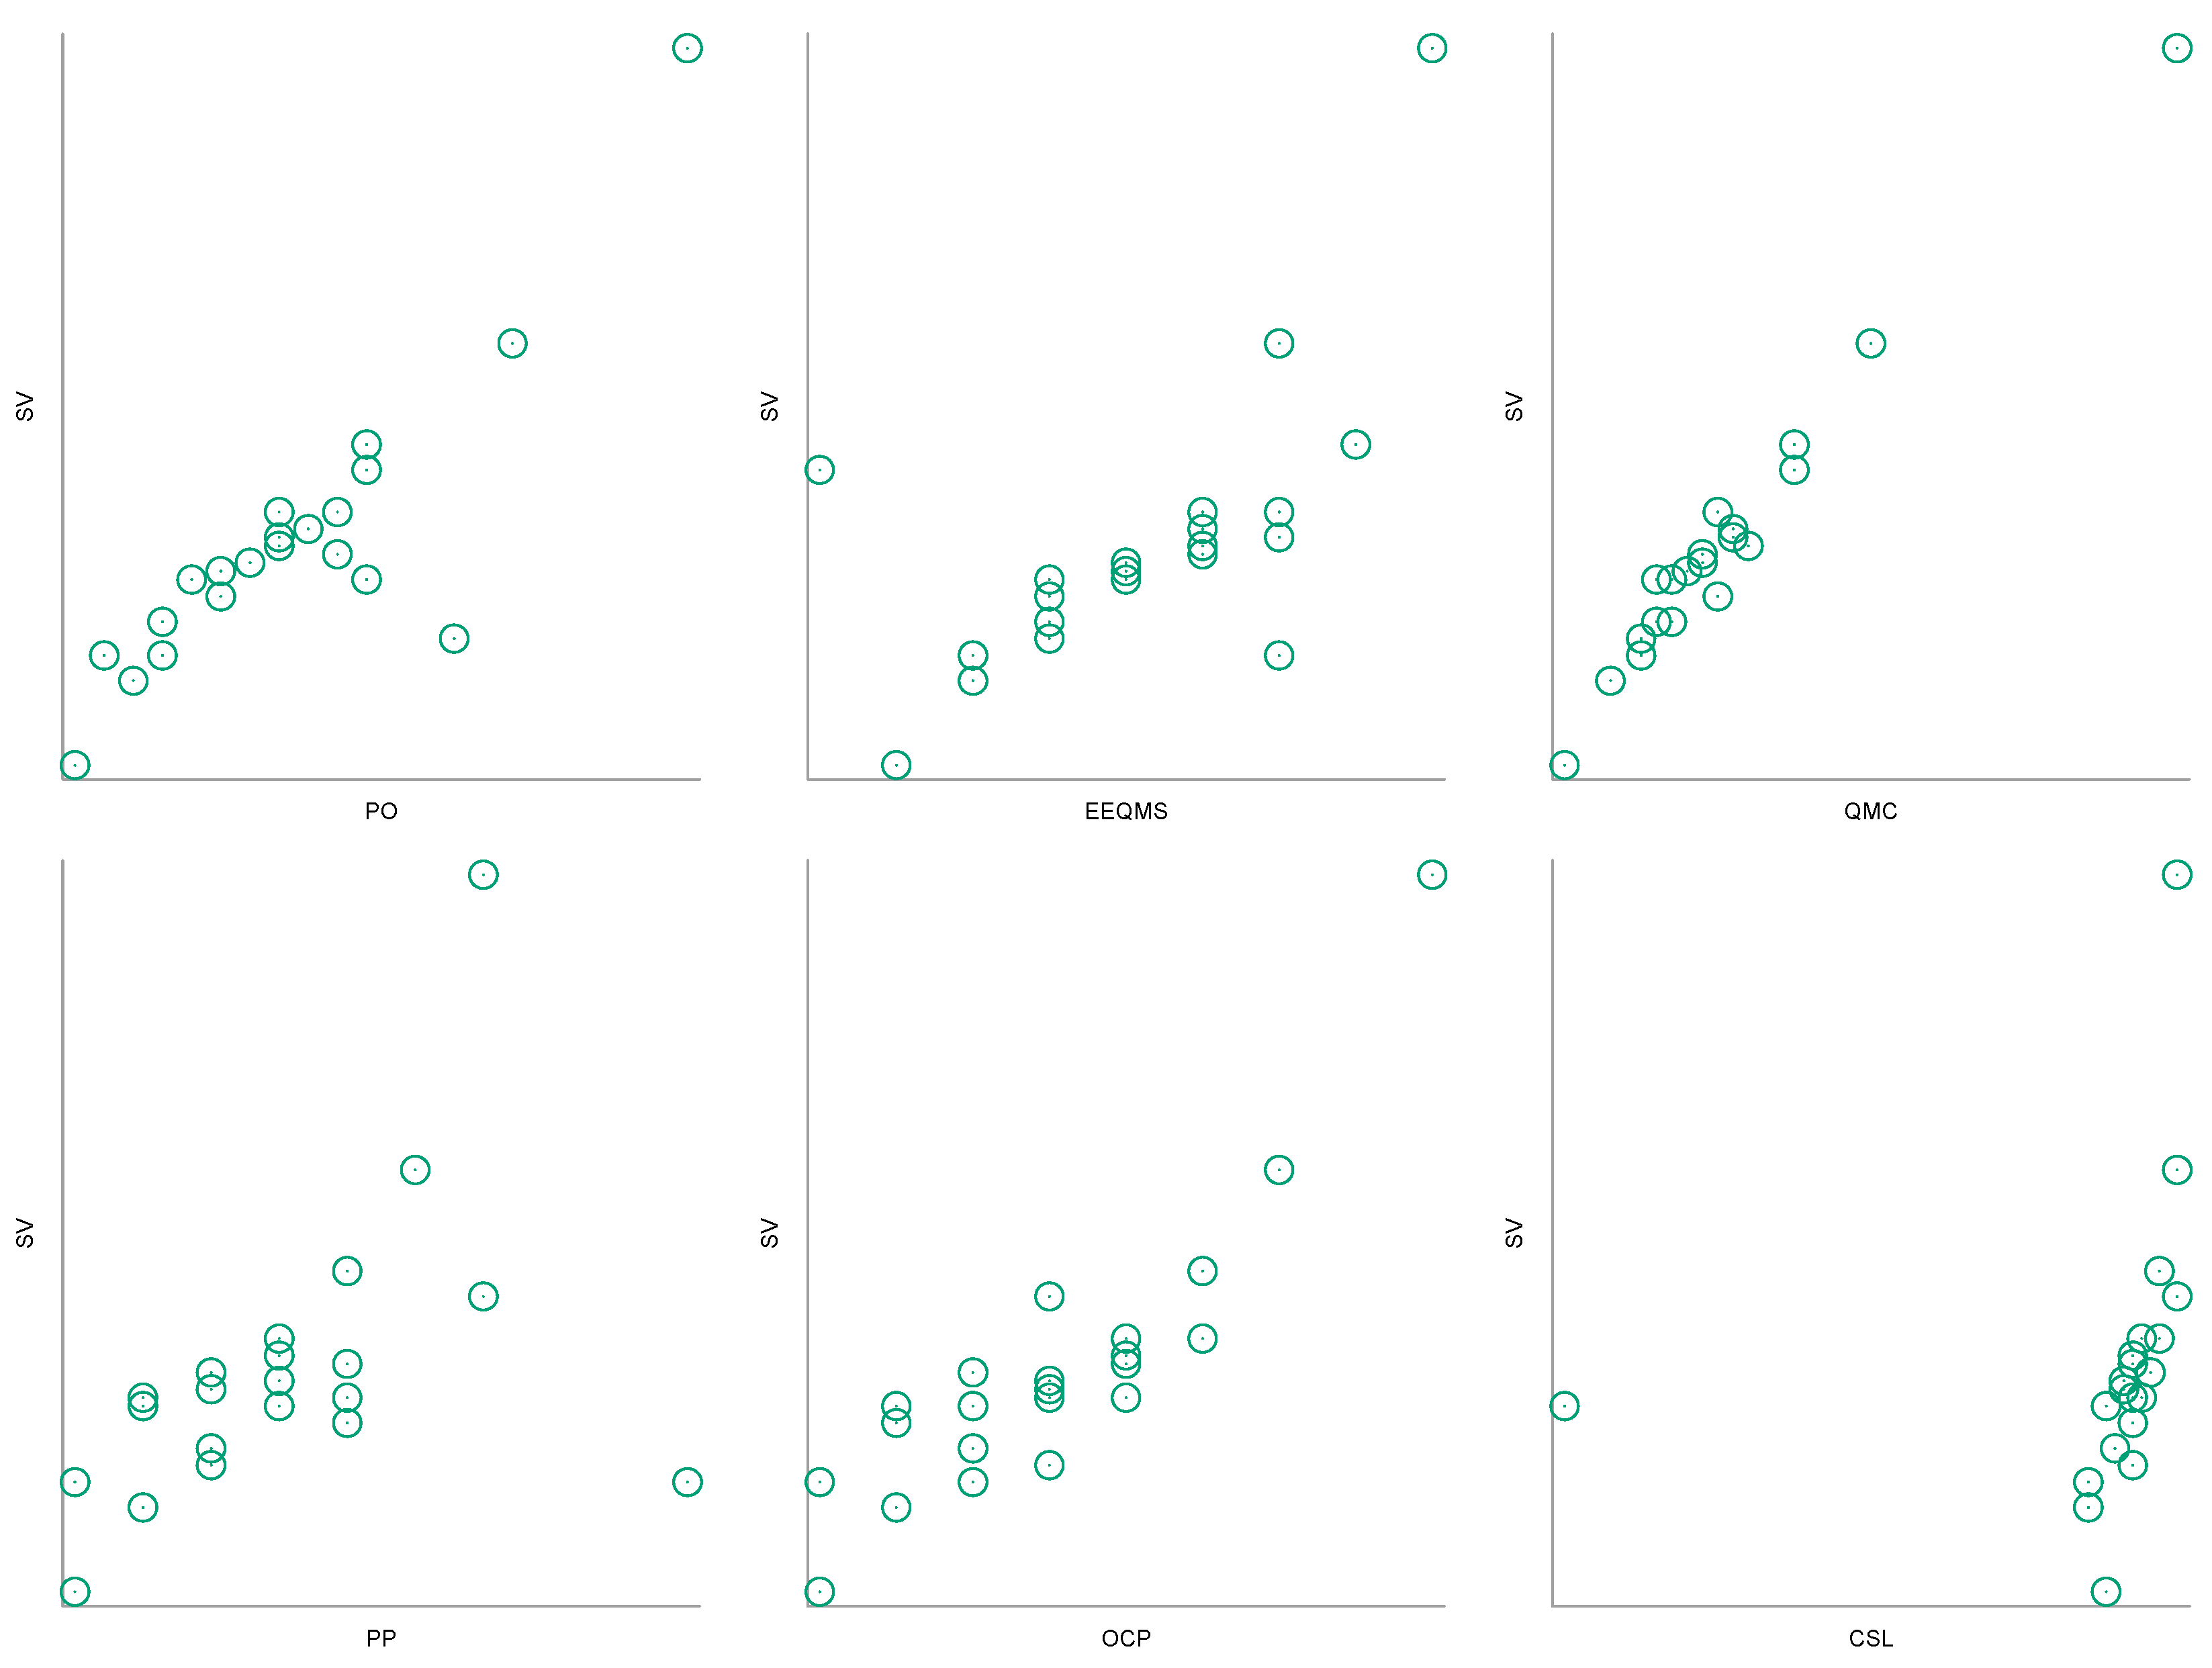
The graph illustrates a positive correlation between the company’s period of operation and its sales volumes (PO - Period of operation of the company).
A weak positive correlation is observed, suggesting that the economic efficiency of the QMS contributes to an increase in sales volumes (EEQMS - Cost-effectiveness of the QMS).
Additionally, a weaker positive correlation is observed, suggesting that higher quality management costs correlate with higher sales volumes (QMC- Quality Management Costs).
A clear positive correlation is evident, demonstrating a strong influence of Further, the correlation is weaker, but there is still a positive direction of the relationship (PP-Product Profitability).
A clear positive correlation is evident, demonstrating a strong influence of overall company profitability on sales volumes (OCP - Overall Company Profitability). Among all variables, the strongest correlation is observed between a high level of customer satisfaction and increased sales volumes (CSL - Customer Satisfaction Level).
The figure provides information on the correlation relationships between the variables, which can be used to construct a regression model for the study.
Model 1. OLS, using observations 1-23. Dependent variable: SV.
| Coefficient | Std. Error | t-ratio | p-value | ||
| const | −2.85727 | 0.729466 | −3.917 | 0.0009 | *** |
| QMC | 0.0172551 | 0.00110741 | 15.58 | <0.0001 | *** |
| OCP | 0.173853 | 0.0450511 | 3.859 | 0.0010 | *** |
| Mean dependent var | 4.078261 | S.D. dependent var | 1.646196 |
| Sum squared resid | 1.076154 | S.E. of regression | 0.231965 |
| R-squared | 0.981950 | Adjusted R-squared | 0.980144 |
| F(2, 20) | 544.0018 | P-value(F) | 3.67e-18 |
| Log-likelihood | 2.578570 | Akaike criterion | 0.842861 |
| Schwarz criterion | 4.249343 | Hannan-Quinn | 1.699581 |
White's test for heteroskedasticity -
- Null hypothesis: heteroskedasticity not present
- Test statistic: LM = 2.96435
- with p-value = P(Chi-square(5) > 2.96435) = 0.705483
- Test for normality of residual -
- Null hypothesis: error is normally distributed
- Test statistic: Chi-square(2) = 6.00192
- with p-value = 0.0497393
Chow test for structural break at observation 12 -
- Null hypothesis: no structural break
- Test statistic: F(3, 17) = 1.66062
- with p-value = P(F(3, 17) > 1.66062) = 0.213026
Constant (const): The coefficient is -2.85727 with a p-value of 0.0009, indicating that this variable is significant for the model.
QMC (Quality Management Costs): The coefficient is 0.0172551 with a p-value < 0.0001, suggesting a strong positive relationship between quality management costs and sales volumes. Each unit increase in QMC is associated with an increase in sales volumes (SV) by 0.017.
OCP (Overall Profitability of the Company): The coefficient is 0.173853 with a p-value of 0.0010, indicating that an increase in overall profitability of the company also has a significant positive impact on sales volumes. Each unit increase in OCP results in an increase in SV by 0.174.
General Characteristics of the Model:
R-squared: 0.981950. The model explains 98.2% of the variation in the dependent variable (SV), indicating high explanatory power.
Adjusted R-squared: 0.980144. The adjusted R-squared value also indicates a very high quality of the model, accounting for the number of predictors.
F-statistic: 544.0018 with a p-value of 3.67e-18, indicating the model is overall significant.
White's Test for Heteroscedasticity: p-value of 0.705483. Since the p-value is greater than 0.05, we conclude that there is no heteroscedasticity, implying that the variance of the residuals is constant.
White's Test for Normality of Residuals: p-value of 0.0497393. This value is close to the 0.05 threshold, suggesting a possible deviation from the normal distribution of residuals.
Chow Test for Structural Break: p-value of 0.213026. There is no significant structural break at the 12th observed point, indicating the stability of the model.
Overall, the model demonstrates high explanatory power, with both predictors (QMC and OCP) having a significant positive effect on sales volumes. Diagnostic tests show the absence of heteroscedasticity and structural breaks.
Figure 4.
Q-Q Plot for Normality Testing of Residuals (uhat5).
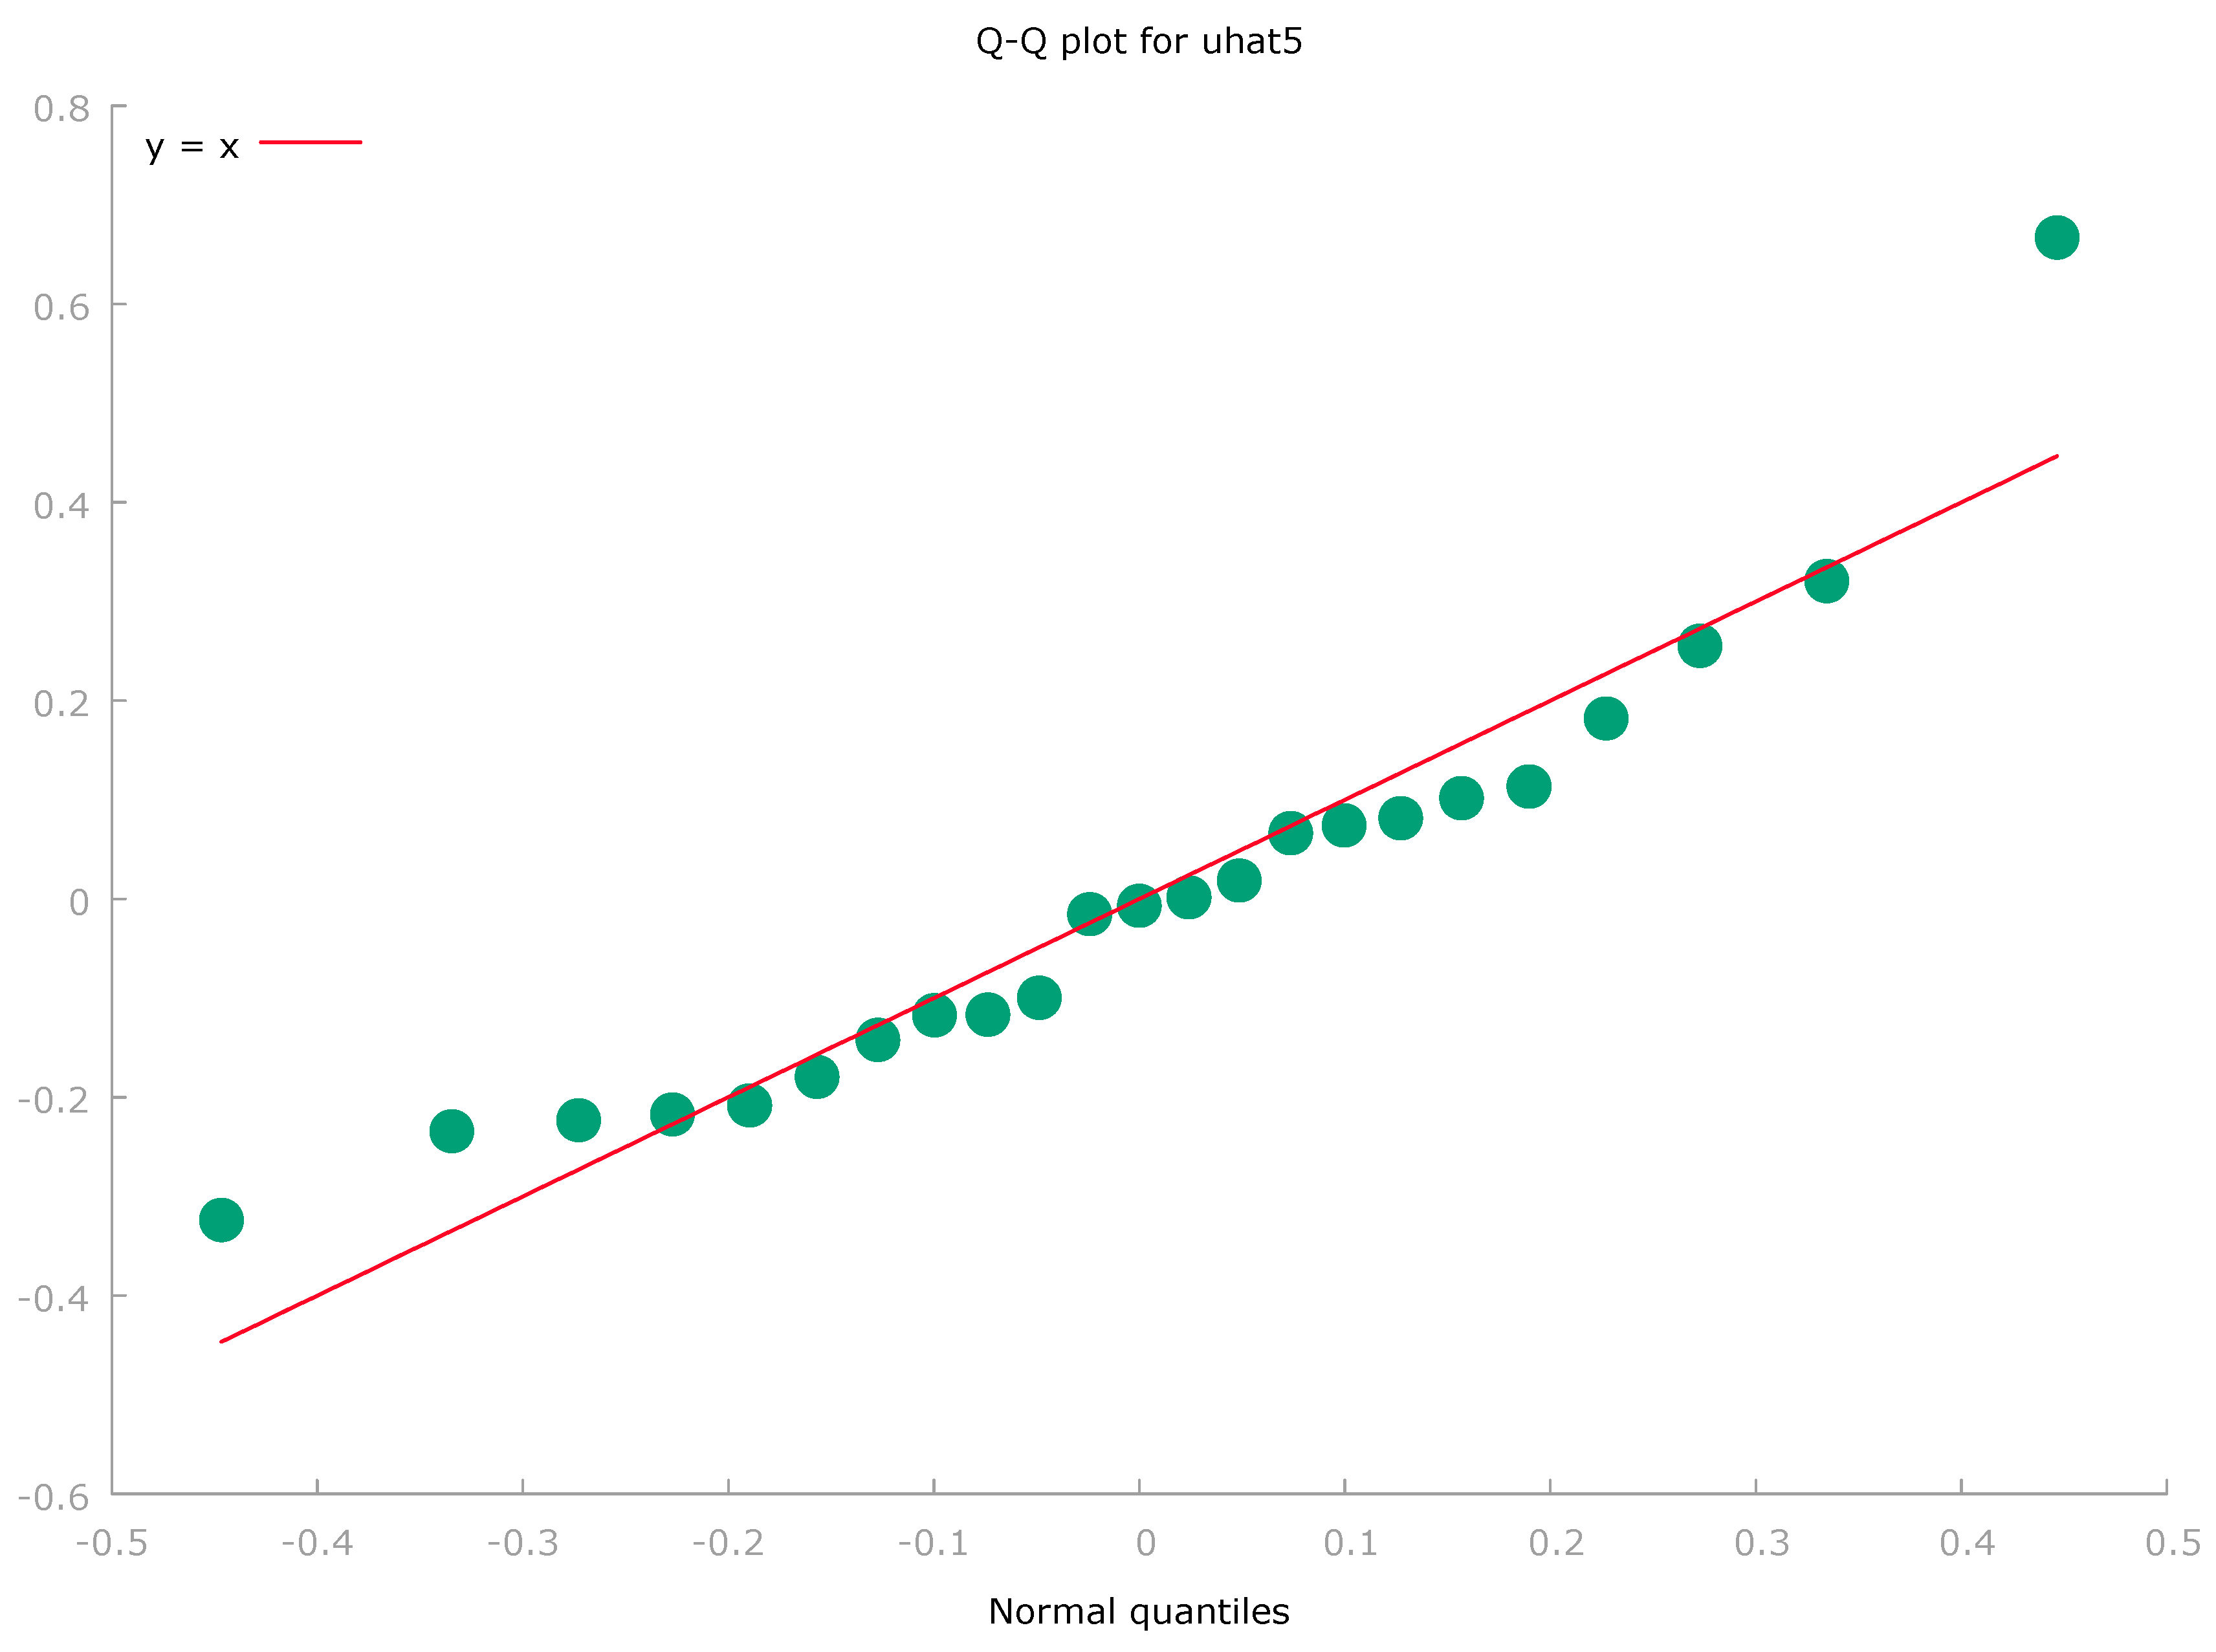
In this figure, most of the points are close to the reference line, indicating that the residuals are normally distributed for the majority of the sample. However, an outlier is visible on the right side of the plot, which may suggest a slight deviation from normality in the tail of the distribution.
While the bulk of the residuals follow a normal distribution, the slight deviation observed in the upper right corner may indicate the presence of outliers. This observation is consistent with the result of the normality test, which reported a p-value of approximately 0.049, suggesting minor deviations from normality.

Table 1.
95% confidence intervals for the OLS model coefficients. t (20, 0.025) = 2.086.
| coefficient | 95 confidence interval | ||
| const | -2.85727 | [-4.37891, -1.33563] | |
| QMC | 0.0172551 | [0.0149451, 0.0195651] | |
| OCP | 0.173853 | [0.0798783, 0.267828] |
The confidence intervals for all coefficients do not include zero, confirming their statistical significance at the 95% confidence level.
The accuracy of the model's forecast was evaluated based on 23 observations.
Forecast evaluation statistics using 23 observations
Mean Error -8.5922e-016
Root Mean Squared Error 0.21631
Mean Absolute Error 0.16375
Mean Percentage Error -0.76392
Mean Absolute Percentage Error 4.8736
Theil's U1 0.024682
Bias proportion, UM 1.686e-029
Regression proportion, UR 5.1001e-028
Disturbance proportion, UD 1
Statistics are used to evaluate the accuracy of the model's forecast based on 23 observations. They assess how well the model predicts the dependent variable values compared to the actual data.
Mean Error: -8.5922e-016. The mean error is nearly zero, indicating that there is no forecast bias; the model does not systematically over- or under-predict values.
Root Mean Squared Error (RMSE): 0.21631. This value indicates good model accuracy, with relatively small deviations between the actual and predicted values.
Mean Absolute Error (MAE): 0.16375. This value suggests small deviations and indicates the model's good predictive ability.
Mean Percentage Error (MPE): -0.76392. A negative value suggests that the model slightly systematically underestimates the predicted values compared to the actual ones.
Mean Absolute Percentage Error (MAPE): 4.8736%. This value indicates high accuracy of the model, with the average error being approximately 4.87%.
Theil's U1 Index: 0.024682. This value indicates that the model outperforms the naive forecast and is accurate.
Bias Proportion (UM): 1.686e−0291. A very small value indicates that the model has almost no systematic bias.
Regression Proportion (UR): 5.1001e−0285. A very low value suggests a good fit between the forecast and the actual trend.
Disturbance Proportion (UD): 1. This value indicates that forecast errors are due solely to unaccounted random factors and not to systematic problems in the model.
Overall, the model demonstrates high forecast accuracy with minimal systematic deviations. The MAPE, RMSE, and Theil's U1 index values indicate a good fit of the model to the actual data.
Figure 5.
Forecast and Actual Values of Sales Volumes (SV) with 95% Confidence Interval.
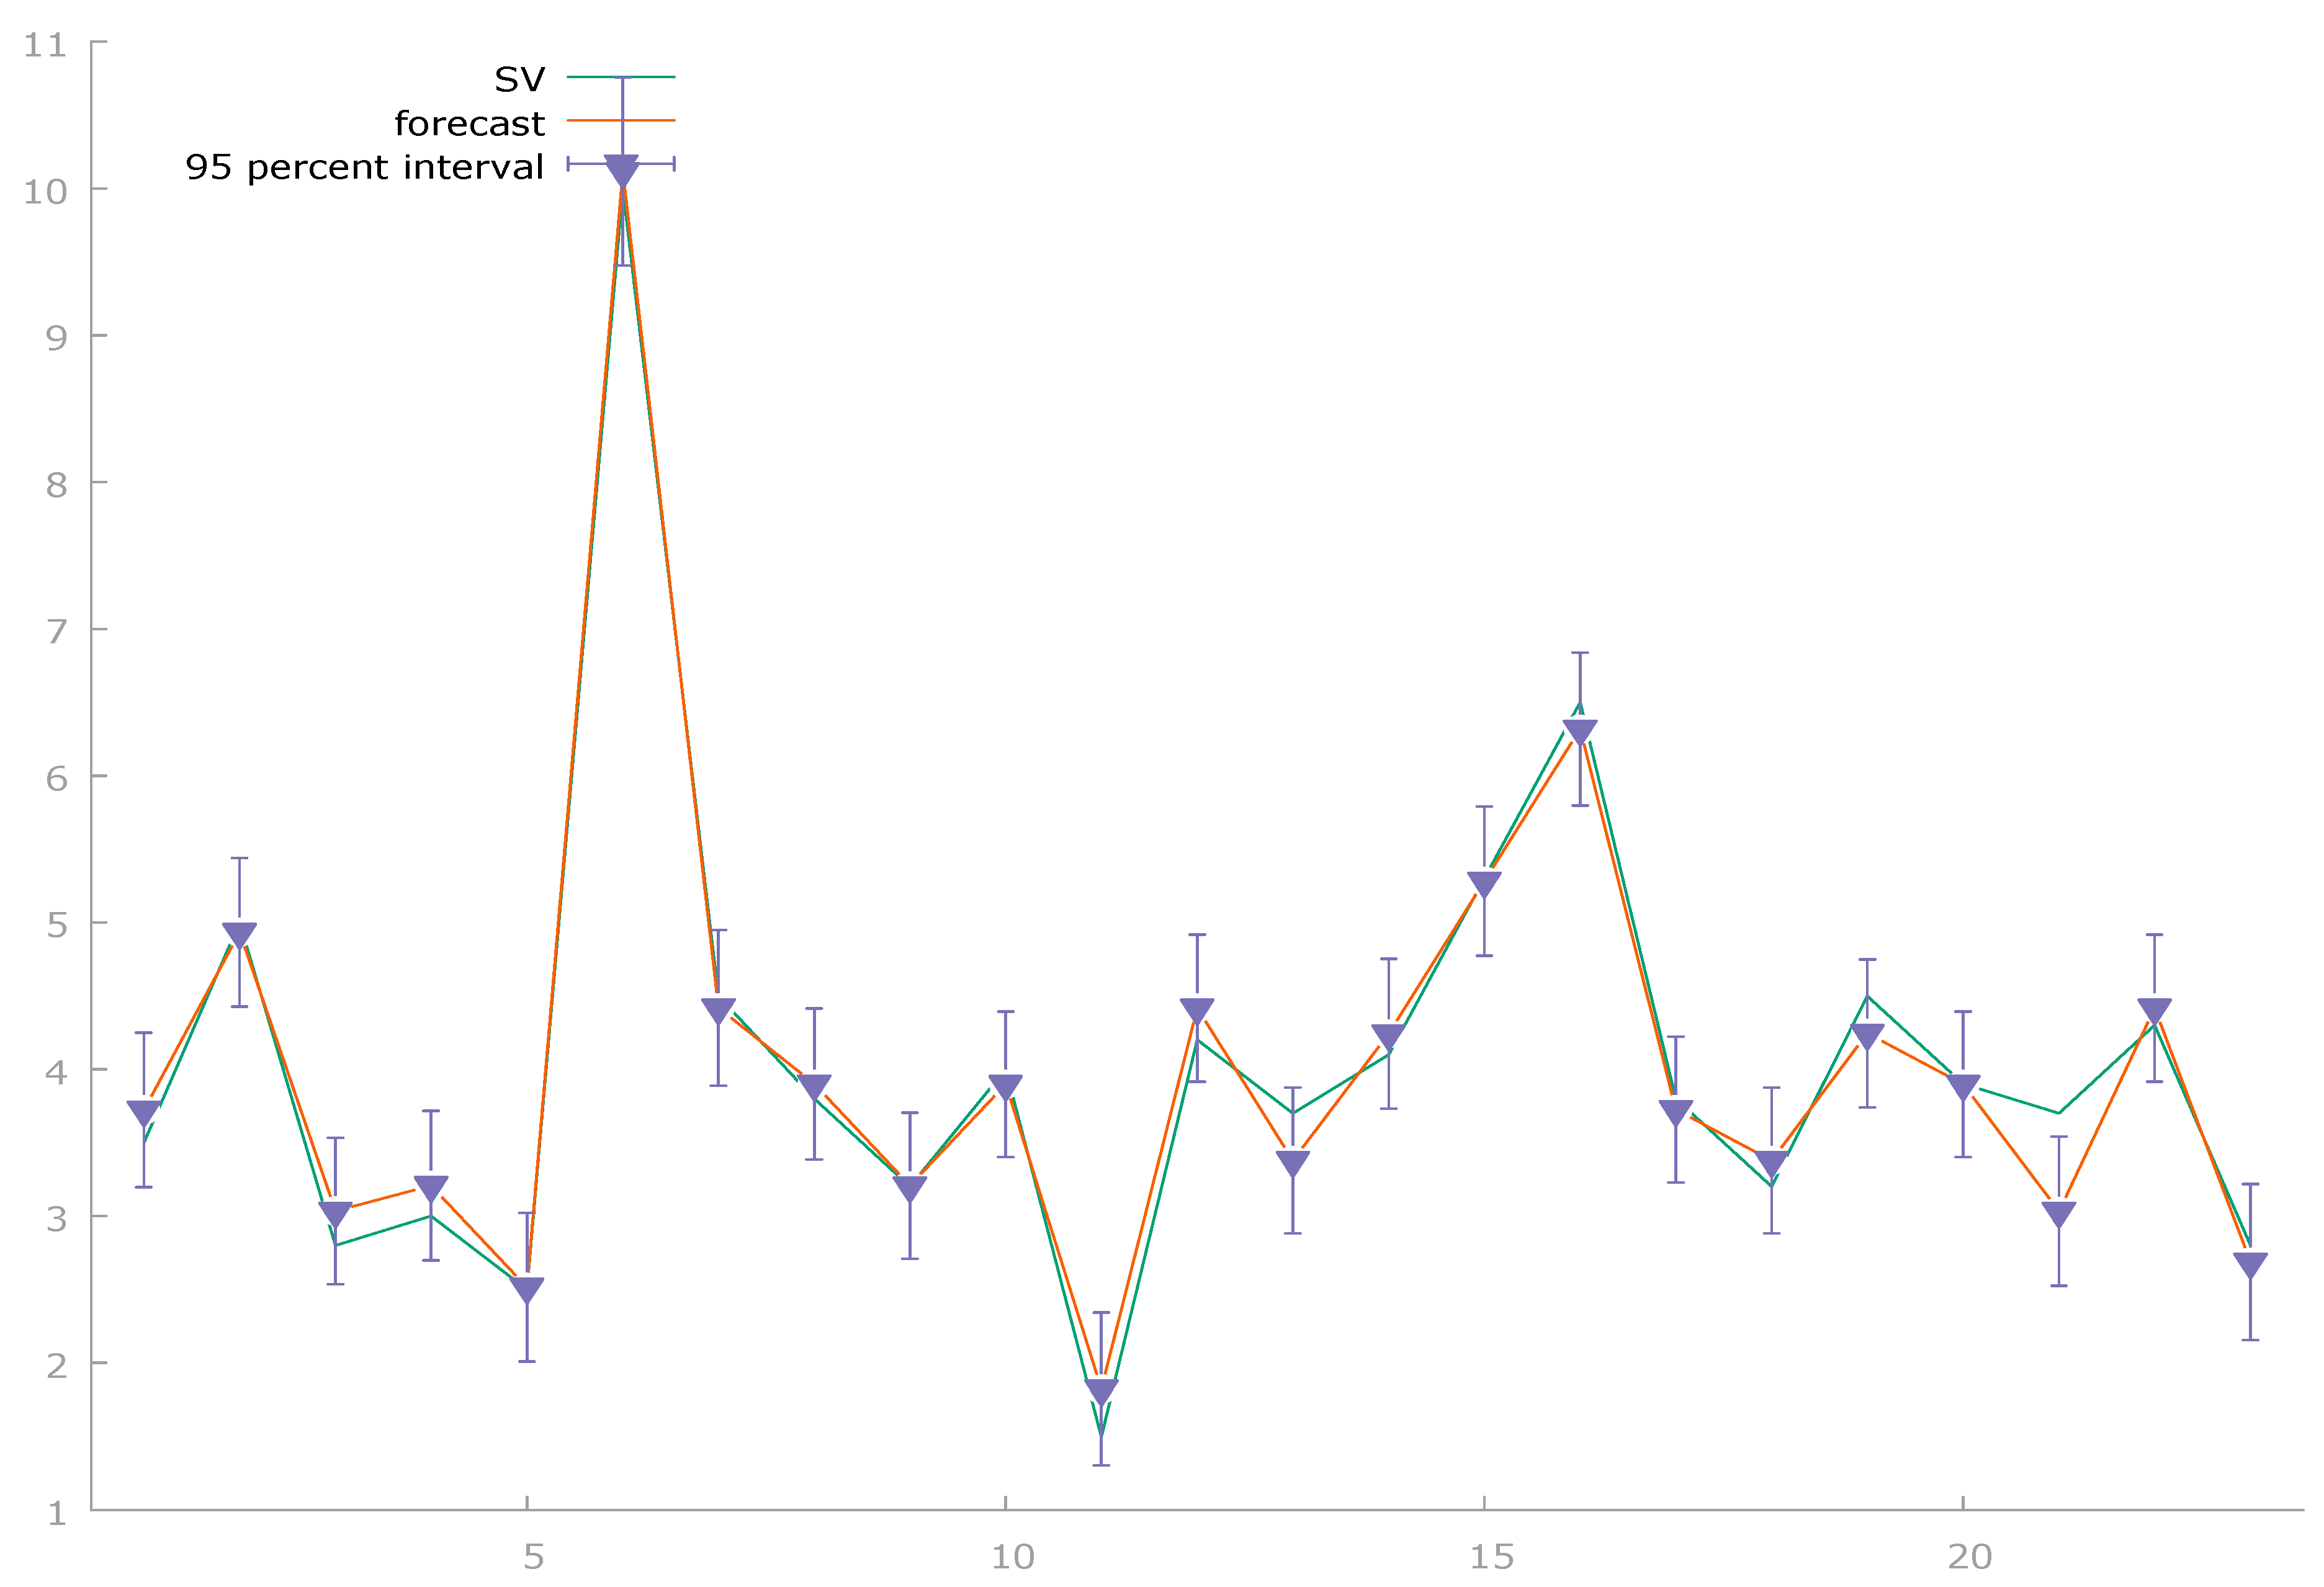
The model demonstrates a strong consistency between the forecasted and actual values of sales volumes. Most forecasts are close to the actual values, and the confidence intervals are relatively narrow, indicating high accuracy of the model.
The results of the regression analysis show that the constructed model has high explanatory power and significance for forecasting sales volumes in construction companies.
The coefficients for quality management costs (QMC) and overall company profitability (OCP) are statistically significant at the 95% confidence level, as confirmed by low p-values (less than 0.001).
The R-squared and adjusted R-squared values (0.981950 and 0.980144, respectively) indicate that the model explains 98% of the variation in the dependent variable, demonstrating its high efficiency. Low values of the root mean square error (RMSE = 0.21631) and the mean absolute percentage error (MAPE = 4.87%) further confirm that the model provides accurate forecasts.
Additional diagnostic tests, including White's test for heteroscedasticity (p-value = 0.705483) and the Chow test for structural breaks (p-value = 0.213026), show that the model does not suffer from heteroscedasticity or structural break issues, increasing its reliability for analysis.
Small deviations from normality in the residuals (p-value for the normality test = 0.0497393) do not significantly impact the overall accuracy of the model.
Overall, the model exhibits a high level of predictive ability and stability, confirming its suitability for analyzing the dependence of sales volumes on quality management and profitability in construction companies. Following this regression analysis, which identified significant factors influencing sales and profitability, the next step in the study will be the segmentation of companies using cluster analysis.
While regression analysis quantitatively assesses the relationship between variables, cluster analysis will classify companies based on the similarity of their characteristics, offering a more detailed understanding of group differences.
The key factors selected for cluster analysis are: overall company profitability (OCP), customer satisfaction level (CSL), economic efficiency of the quality management system (EEQMS), and the company's period of operation (PO). These variables reflect both the financial efficiency of the company and its ability to meet customer needs and implement effective management processes.
Using these factors in cluster analysis will allow us to identify groups of companies with different levels of profitability and customer satisfaction, and assess their relationship with the length of the company's operation and the effectiveness of the quality management system. Clustering will facilitate a more in-depth analysis of quality management strategies and their impact on company success, which is a key step in further research.
The k-means method will be used for effective clustering of companies based on similarity in these variables, helping to identify major types of strategies and approaches to quality management and customer satisfaction. This approach will help identify key groups of companies that are similar effectiveness in quality management systems and customer satisfaction levels, providing a basis for further recommendations to improve management strategies.
Table 2.
Number of observations in each cluster.
| Cluster | 1 | 2,000 | |
| 2 | 13,000 | ||
| 3 | 8,000 | ||
| Valid | 23,000 | ||
| Missingе | 0,000 | ||
Table 3.
Distances between the terminal centers of clusters.
| Cluster | 1 | 2 | 3 |
| 1 | 11,535 | 18,813 | |
| 2 | 11,535 | 7,364 | |
| 3 | 18,813 | 7,364 |
The table presents the inter-cluster distances obtained from the k-means cluster analysis, illustrating the differences between the identified clusters. The largest distance is between Cluster 1 and Cluster 3 (18.813), indicating significant differences between them. Conversely, the smallest distance is between Cluster 2 and Cluster 3 (7.364), suggesting a greater similarity between these two clusters. This implies that Clusters 1 and 3 represent more distinct groups of companies, while Clusters 2 and 3 have more common characteristics.
Table 4.
Final cluster centers.
| Cluster | |||
| 1 | 2 | 3 | |
| OCP | 24,00 | 20,46 | 18,13 |
| CSL | 90,00 | 85,77 | 81,88 |
| EEQMS | 19,00 | 16,62 | 14,88 |
| PO | 23,00 | 13,15 | 7,63 |
The table shows the average values of key indicators for each cluster including overall company profitability (OCP), customer satisfaction level (CSL), economic efficiency of the QMS (EEQMS), and the company's period of operation (PO). Cluster 1 exhibits the highest values for all indicators: OCP = 24.00, CSL = 90.00, EEQMS = 19.00, and PO = 23.00. These high values may indicate that Cluster 1 comprises the most successful companies, characterized by a long period of operation and high customer satisfaction rates. Cluster 2 shows moderate values across all variables, whereas Cluster 3 has the lowest values, particularly for the period of operation (PO = 7.63) and economic efficiency (EEQMS = 14.88). This suggest that Claster 3 includes companies with lower efficiency and satisfaction level.
Figure 6.
Comparison of average values of indicators by clusters (OCP, CSL, EEQMS, PO).
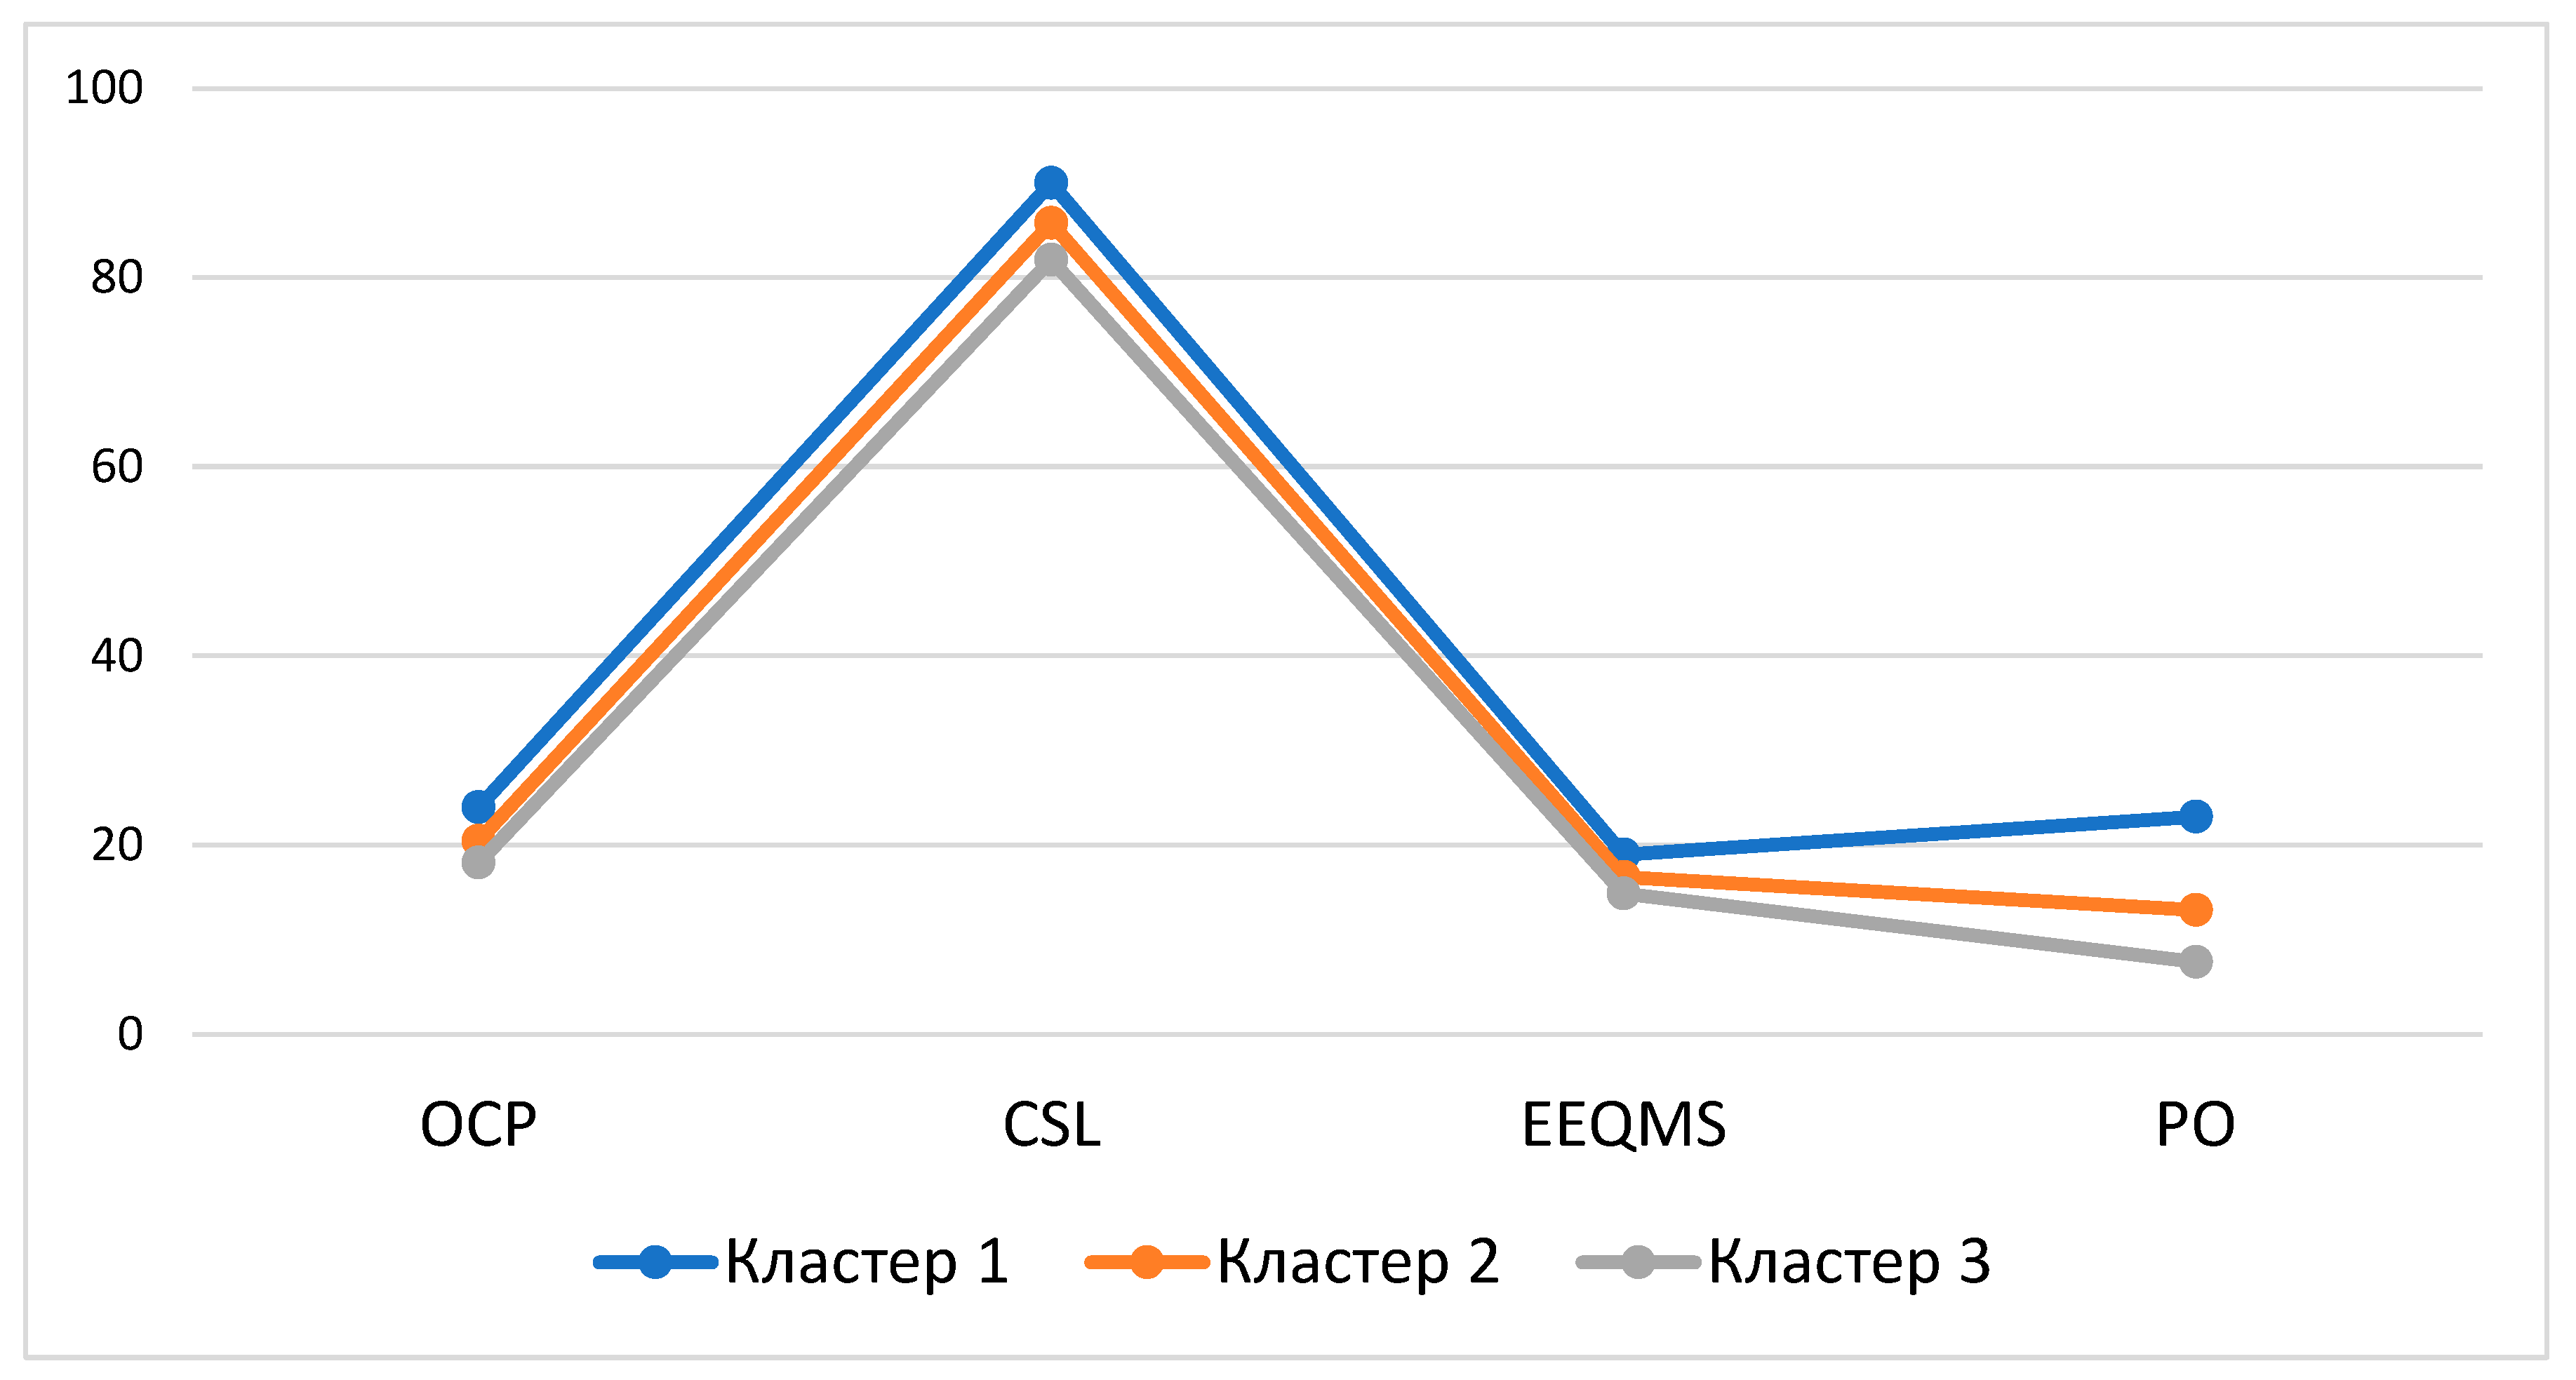
The figure presents the average values of key indicators (overall company profitability, customer satisfaction level, economic efficiency of QMS, and the company's period of operation) for the three selected clusters.
Table 5.
Results of ANOVA analysis of variance.
| Cluster | Error | F | Significance | |||
| Mean Square | Degrees of freedom | Mean Square | Degrees of freedom | |||
| OCP | 31,425 | 2 | ,905 | 20 | 34,713 | ,000 |
| CSL | 67,365 | 2 | 3,759 | 20 | 17,920 | ,000 |
| EEQMS | 15,981 | 2 | 1,898 | 20 | 8,421 | ,002 |
| PO | 206,129 | 2 | 4,978 | 20 | 41,405 | ,000 |
The F-test values should be used for descriptive purposes only, as the clusters are selected to maximize the differences between observations in different clusters. The observed significance levels are not adjusted for this selection, and therefore, they cannot be used to test the hypothesis of equality of cluster means.
The ANOVA table presents the results of one-way analysis of variance for the four indicators (OCP, CSL, EEQMS, PO) with respect to the clusters. All variables have high F-test values and significance level (p-value of the 0.000 or 0.002), indicating significant differences between clusters for each indicator.
For example, the F-test value for OCP (overall company profitability) is 34.713, reflecting strong differences between clusters. Similarly, the F-value for CSL (customer satisfaction level) is 17.920, and for PO (company's period of operation) it is 41.405. It is important to note that the clusters were chosen to maximize the differences between observations.
Table 6.
Clustering of construction companies.
| CN | Distance |
| Cluster 1 Highly efficient companies | |
| BI Group | 3,317 |
| AlmatyStroy LLP | 3,317 |
| Cluster 2 Average performance companies | |
| KazInzhenerin JSC | 5,325 |
| Kazstroypodryad LLP | 5,186 |
| AAEngineering Group LLP | 3,254 |
| KulsarygaS LLP | 3,266 |
| Intergasstroy LLP | 2,051 |
| Set Stroy | 2,032 |
| Exclusive Qurylys LLP | 4,487 |
| Astana Construction LLP | 2,265 |
| Aitkaz Group | 4,054 |
| Nursat Engineering | 3,336 |
| Elite Stroy Kazakhstan LLP | 1,099 |
| KazkomplektStroy LLP | 2,892 |
| IncomStroy LLP | 1,026 |
| Cluster 3 Lower performance companies | |
| AlmatyStroy LLC | 3,929 |
| Nur-Sat LLC | 3,767 |
| Parus Construction | 2,165 |
| RAMS Qazaqstan | 1,479 |
| Smart Remont Ltd | 3,419 |
| EuroAsia Construction | 1,479 |
| Grand Construction Group | 1,392 |
| BestBuild Kazakhstan LLP | 2,861 |
| https://ba.prg.kz/391010000-kostanay/010940002981-too-stroitelnaya-kompaniya-almatystroy/https://kase.kz/ru/issuers/https://bi.group/https://www.kazstroypodryad.com/abouthttps://ramsqz.com/ru/home | |
The table provides information on the clustering of construction companies in Kazakhstan into three clusters based on various characteristics.
Cluster 1, which includes companies such as BI Group and AlmatyStroy LLP, demonstrates an average distance of 3.317. This indicates high efficiency, profitability, and customer satisfaction, characterizing these companies as market leaders with strong performance and stable operations.
Cluster 2 includes companies with average performance, such as JSC KazEngineering, Kazstroypodryad LLP, and Astana Construction LLP. The distances within this cluster range from 1.026 to 5.325, indicating variability in performance and satisfaction. Companies in this cluster exhibit balanced characteristics but have potential for improvement in specific aspects of their operations.
Cluster 3 encompasses companies with lower performance, including AlmatyStroy LLP, Smart Remont Ltd, and BestBuild Kazakhstan LLP. The average distances within this cluster range from 1.392 to 3.929. These companies may face challenges encounter in managing quality, profitability, and customer satisfaction, necessitating significant improvements to reach the performance levels of the companies in Clusters 1 and 2.
Table 7.
Observation summary.
| CN | PO | SV | QMC | ||||
| Observation cluster number | 1 | Total | Average | 23,0000 | 8,2500 | 400,0000 | |
| 1 | BI Group | 26,00 | 10,00 | 500,00 | |||
| 2 | AlmatyStroy LLP | 20,00 | 6,50 | 300,00 | |||
| 2 | Total | Average | 13,1538 | 4,1615 | 200,0000 | ||
| 1 | KazInzhenerin JSC | 15,00 | 5,00 | 250,00 | |||
| 2 | Kazstroypodryad LLP | 18,00 | 3,00 | 150,00 | |||
| 3 | AAEngineering Group LLP | 12,00 | 4,50 | 200,00 | |||
| 4 | KULSARYGAS LLP | 10,00 | 3,80 | 180,00 | |||
| 5 | Intergasstroy LLP | 14,00 | 4,00 | 190,00 | |||
| 6 | Set Stroy | 12,00 | 4,20 | 210,00 | |||
| 7 | Exclusive Qurylys LLP | 15,00 | 3,70 | 170,00 | |||
| 8 | Astana Construction LLP | 12,00 | 4,10 | 220,00 | |||
| 9 | Aitkaz Group | 15,00 | 5,30 | 250,00 | |||
| 10 | Nursat Engineering | 10,00 | 3,80 | 180,00 | |||
| 11 | Elite Stroy Kazakhstan LLP | 14,00 | 4,50 | 200,00 | |||
| 12 | KazkomplektStroy LLP | 11,00 | 3,90 | 190,00 | |||
| 13 | IncomStroy LLP | 13,00 | 4,30 | 210,00 | |||
| 3 | Total | Average | 7,6250 | 2,9000 | 152,5000 | ||
| 1 | AlmatyStroy LLC | 10,00 | 3,50 | 200,00 | |||
| 2 | Nur-Sat LLC | 8,00 | 2,80 | 150,00 | |||
| 3 | Parus Construction | 7,00 | 2,50 | 130,00 | |||
| 4 | RAMS Qazaqstan | 8,00 | 3,20 | 160,00 | |||
| 5 | Smart Remont Ltd | 5,00 | 1,50 | 100,00 | |||
| 6 | EuroAsia Construction | 8,00 | 3,20 | 170,00 | |||
| 7 | Grand Construction Group | 9,00 | 3,70 | 160,00 | |||
| 8 | BestBuild Kazakhstan LLP | 6,00 | 2,80 | 150,00 | |||
| Total | Average | 12,0870 | 4,0783 | 200,8696 | |||
| https://ba.prg.kz/391010000-kostanay/010940002981-too-stroitelnaya-kompaniya-almatystroy/https://kase.kz/ru/issuers/https://bi.group/https://www.kazstroypodryad.com/abouthttps://ramsqz.com/ru/home | |||||||
Cluster 1: Highly Efficient Companies in Cluster 1, such as BI Group and AlmatyStroy LLP, demonstrate superior performance across all parameters. The average period of operation (PO) in this cluster is 23 years, reflecting a long and stable market presence. Sales volumes (SV) average 8.25 million tenge, indicating a high level of market activity and success. Quality management costs (QMC) are notably higher at 400, suggesting significant investment in quality management systems to maintain their high profitability and competitiveness. These companies are likely industry leaders, characterized by their robust performance and established market position.
Cluster 2: Medium Efficiency Companies Cluster 2 includes companies such as JSC KazInzhenerin, Kazstroypodryad LLP, and Astana Construction LLP, which exhibit more balanced but moderate performance metrics. The average period of operation is 13.15 years, indicating a stable, though shorter, market presence compared to Cluster 1. Average sales volumes are 4.16 million tenge, lower than those in Cluster 1. Quality management costs in this cluster are 200, representing the average for the sample. Companies in this cluster have potential for growth and can enhance their efficiency by optimizing quality management costs and increasing sales volumes.
Cluster 3: Low-Performance Companies Cluster 3 comprises companies such as AlmatyStroy LLC, Parus Construction, and Smart Remont Ltd, which exhibit the lowest performance indicators. The average period of operation is 7.63 years, indicating a shorter market presence compared to the other clusters. Sales volumes average 2.90 million tenge, significantly lower than in the other clusters, suggesting lower market activity and efficiency. Quality management costs average 152.5, reflecting minimal investment in quality management systems and potentially lower product or service quality. Companies in this cluster are likely to face challenges in improving profitability and customer satisfaction.
Summary: Cluster 1 represents the top-performing companies with high sales volumes, operational extensive histories, and significant investments in quality management.
Cluster 2 includes mid-level companies that have been in the market longer than the companies in Cluster 3, but still fall short of the leaders.
Cluster 3 contains companies with the lowest indicators for all variables, pointing to potential issues in quality management strategies and overall business development.
Figure 7.
Relationship between QMC and CSL by cluster.
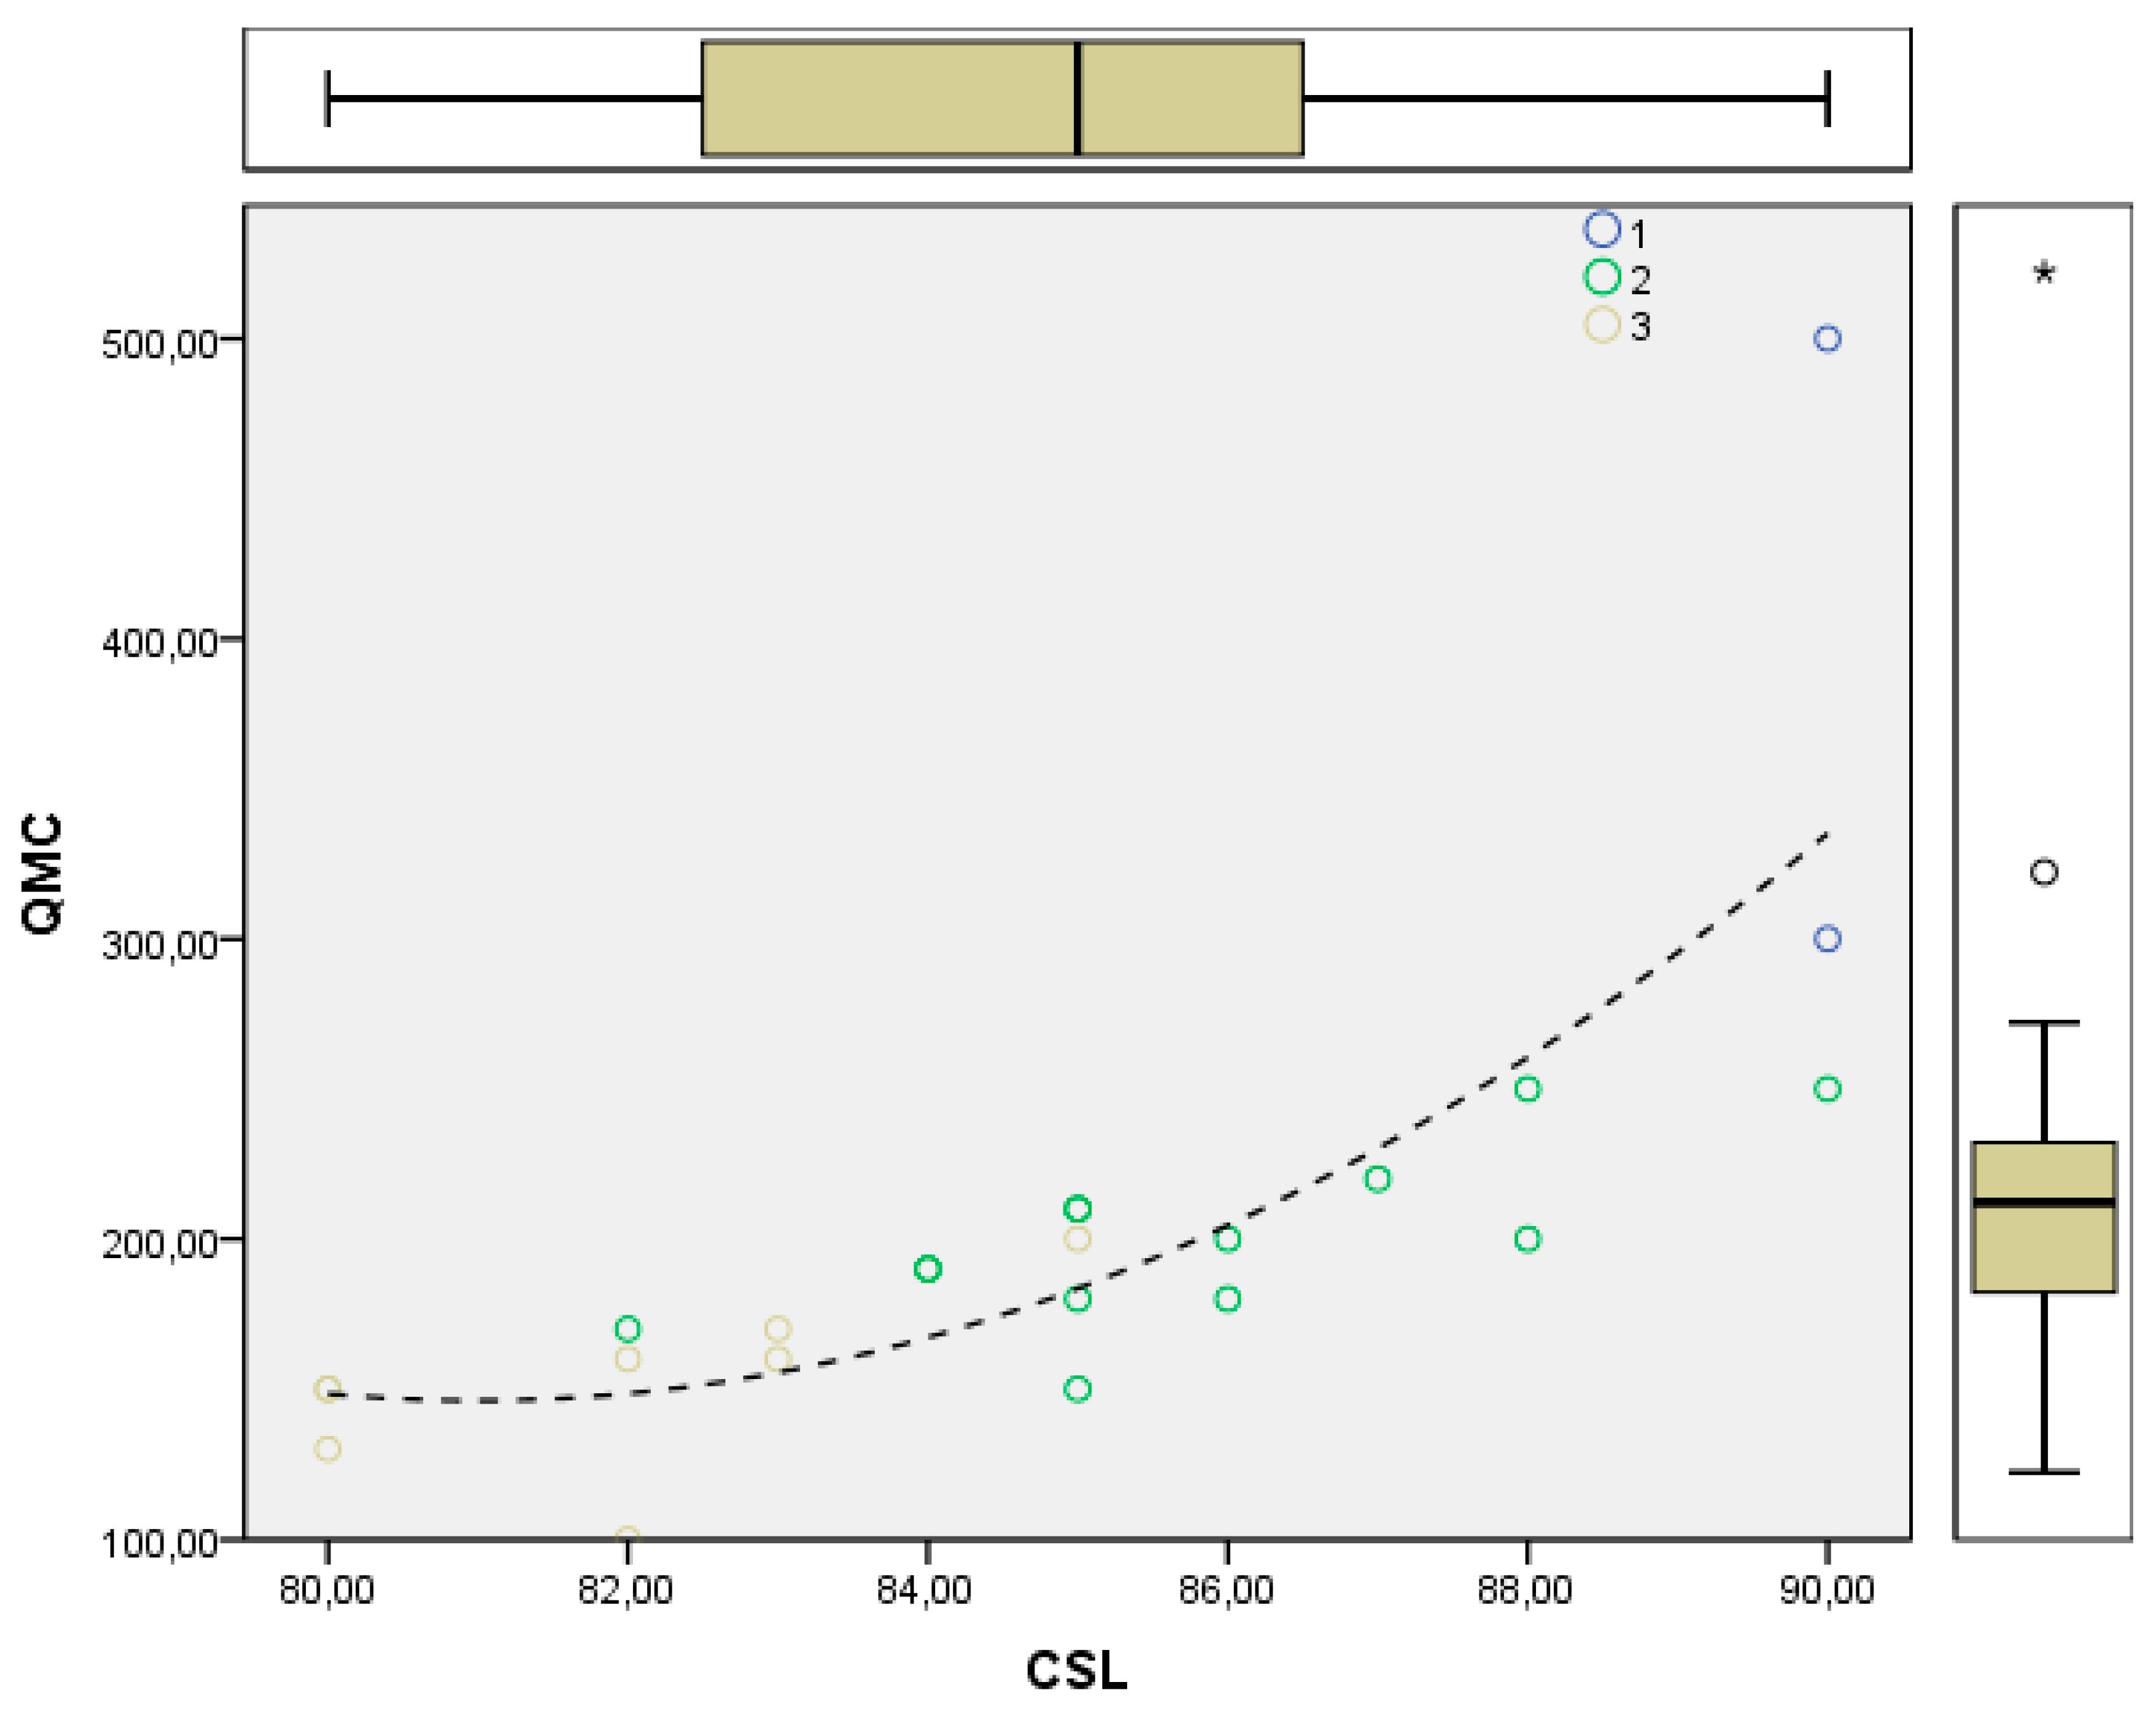
The figure illustrates the relationship between quality management costs (QMC) and customer satisfaction level (CSL) for companies grouped into three clusters. Different colors represent different clusters: blue for Cluster 1, green for Cluster 2, and yellow for Cluster 3. There is a positive relationship between quality management costs and customer satisfaction level: as QMC increases, the CSL also rises. This is confirmed by the trend curve (dashed line), which shows an increase in QMC alongside an increase in CSL.
The figure also presents the distribution of values across the cluster using box plots, which depict data spread and highlight individual outliers, representing specific, which indicate companies.
Figure 8.
Relationship between the economic efficiency of QMS (EEQMS) and quality management costs (QMC) by clusters.
Figure 8.
Relationship between the economic efficiency of QMS (EEQMS) and quality management costs (QMC) by clusters.
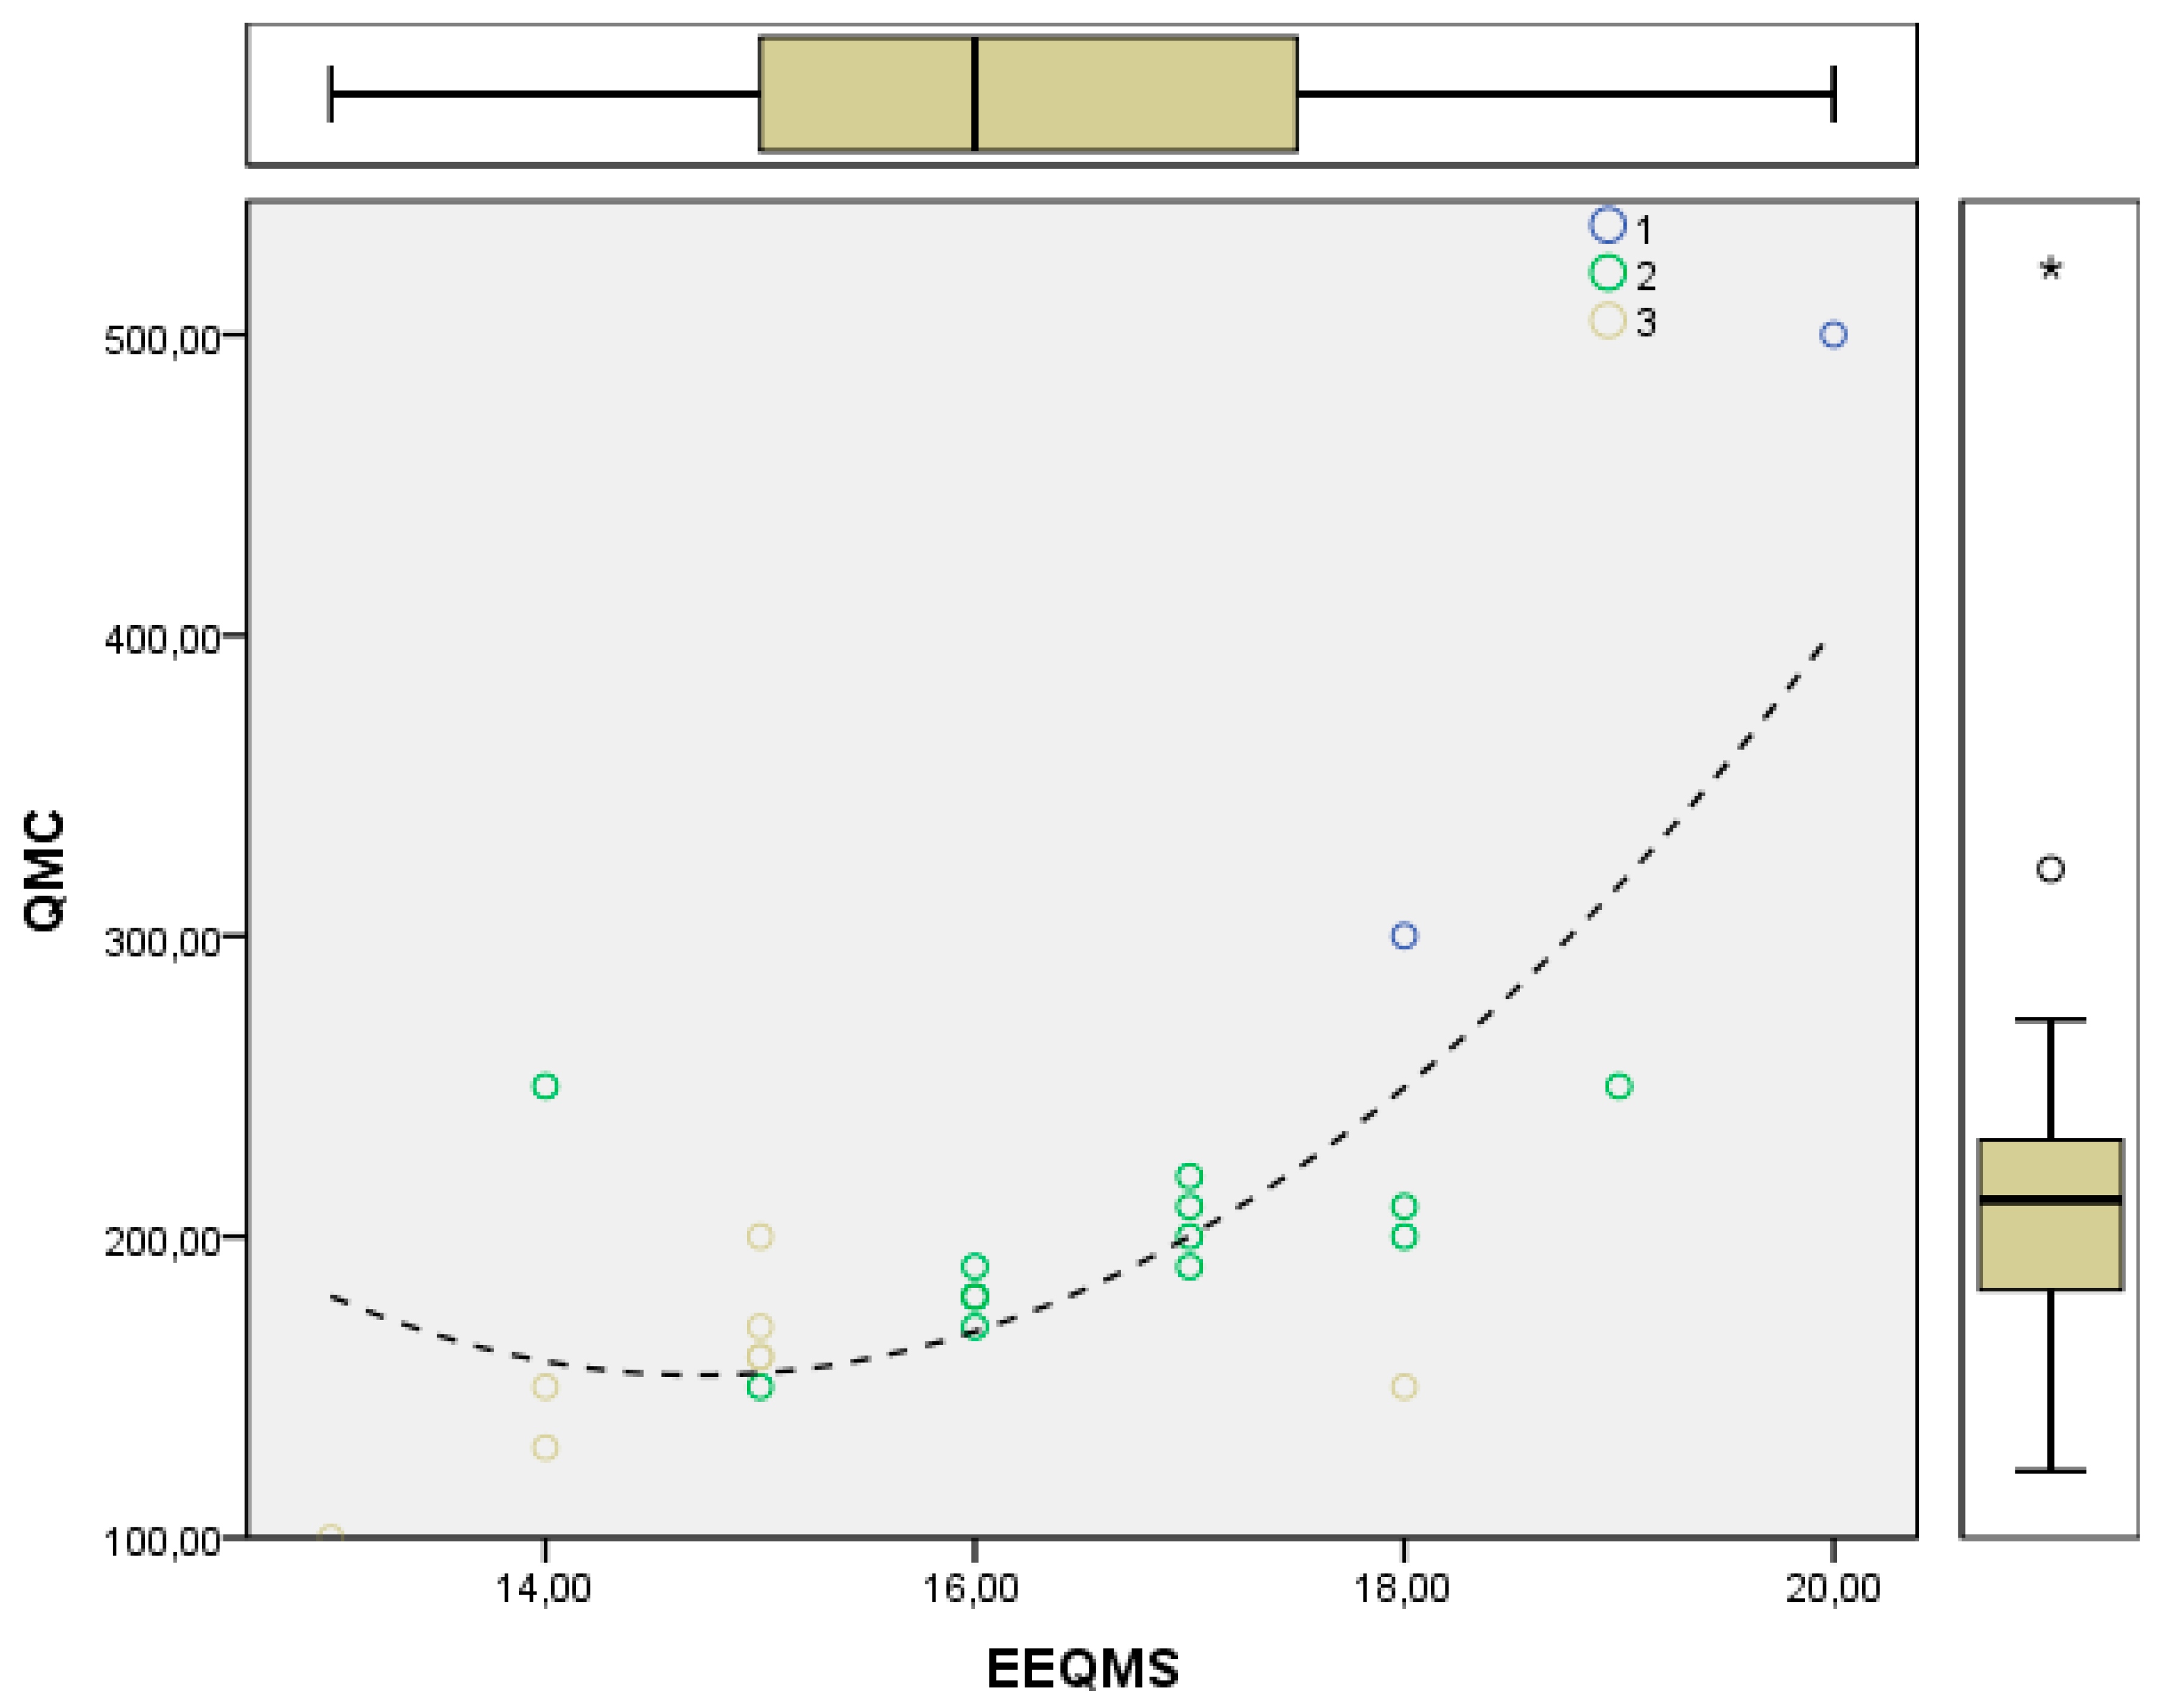
The graph illustrates the relationship between the economic efficiency of quality management systems (EEQMS) and quality management costs (QMC) for companies grouped into three clusters. The clusters are represented by different colors: blue for Cluster 1, green for Cluster 2, yellow for Cluster 3. The figure demonstrates that as the economic efficiency of QMS increases, the quality management costs also rise, which is confirmed by the dotted trend curve. More economically efficient companies tend to invest more in quality management.
Figure 9.
Distribution of quality management costs (QMC) by clusters for construction companies.
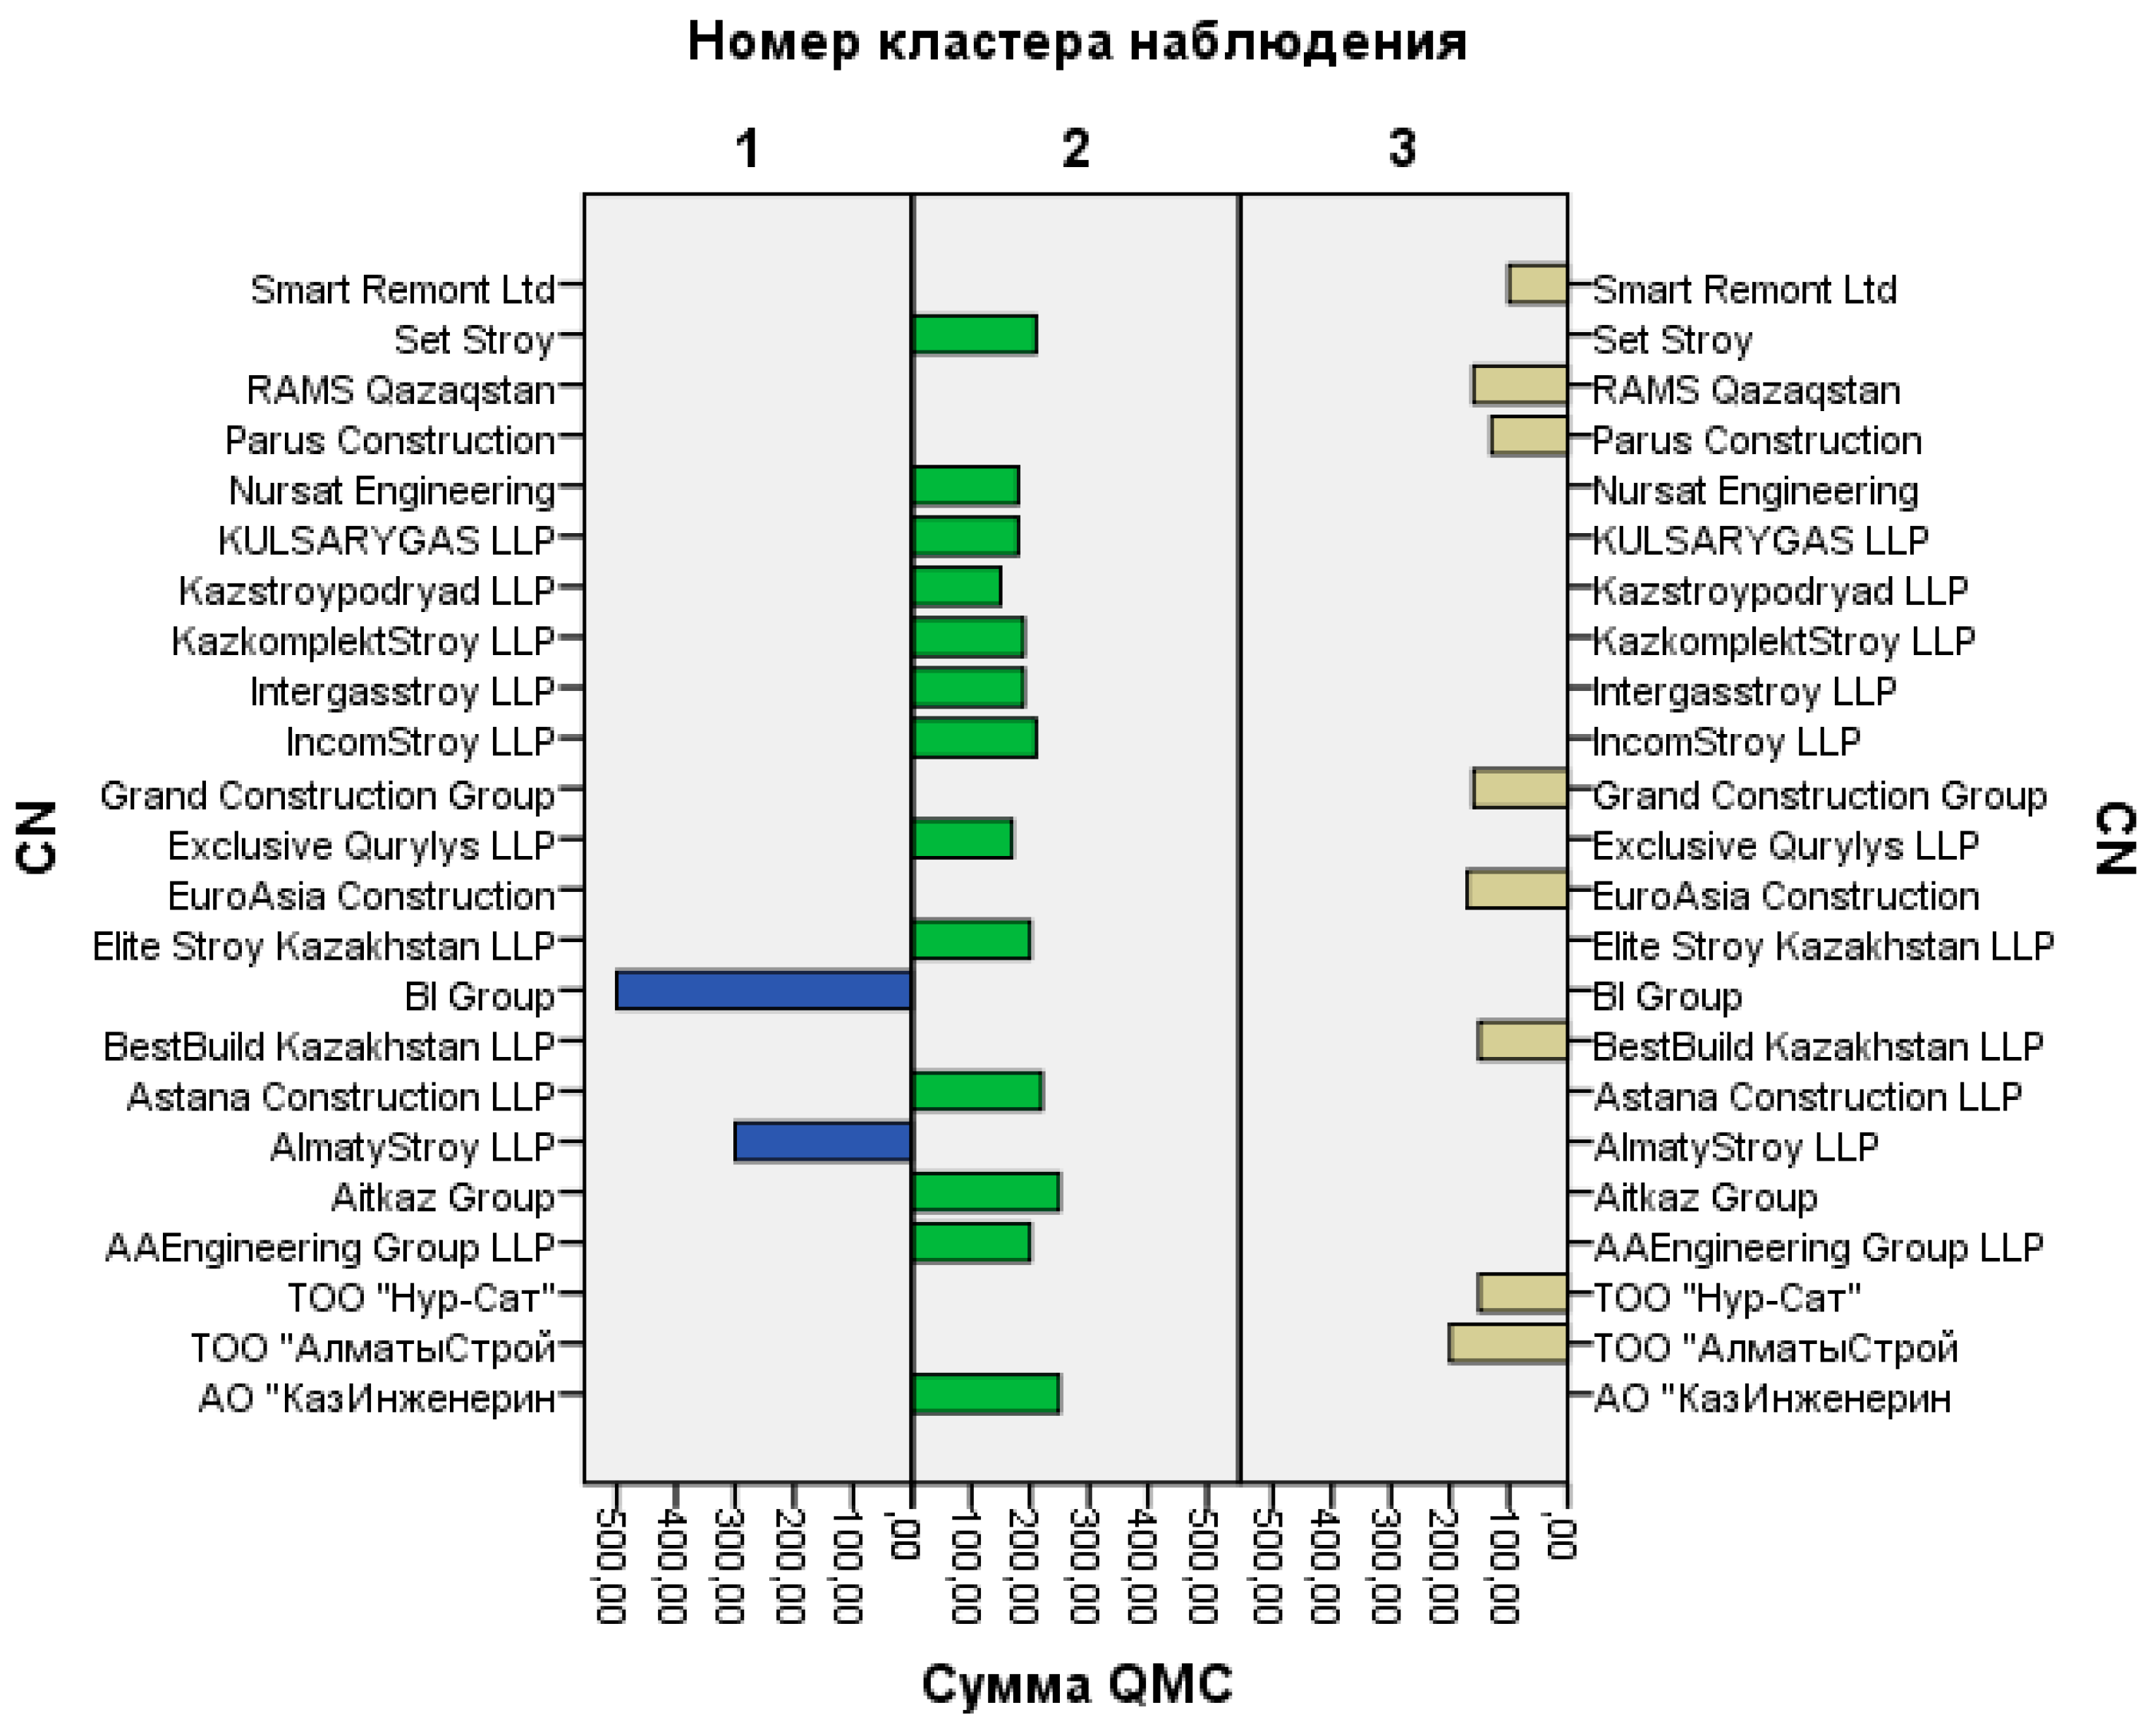
The figure illustrates the distribution of quality management costs (QMC) among construction companies grouped into three clusters. Clusters 1, 2 and 3 are represented by differently colored columns. The table shows that companies in Cluster 1 (e.g. BI Group and AlmatyStroy LLP) have significantly higher quality management costs compared to other clusters. In Cluster 2, average QMC costs are moderate, with companies such as Kazstroypodryad LLP and Elite Stroy Kazakhstan LLP demonstrating diversity in cost levels. Cluster 3 is characterized by lower QMC values, as seen in companies like Smart Remont Ltd and Set Stroy.
Companies in Cluster 1 invest more in quality management, which may be linked to their leading positions in the market. Cluster 2 companies exhibit balanced quality costs, while Cluster 3 companies have low QMC costs, suggesting a need for optimization in their quality management processes.
The cluster analysis of construction companies reveals significant differences in key indicators of quality management costs (QMC), economic efficiency (EEQMS), customer satisfaction level (CSL) and company's period of operation (PO). Companies in Cluster 1, such as BI Group and AlmatyStroy LLP, are characterized by the highest quality management costs and high indicators of cost effectiveness and customer satisfaction. Large companies, which actively invest in quality, are more likely to achieve leading market positions. Companies in the Cluster 2 display stable indicators, suggesting growth opportunities through more effective quality management.
Companies in the Cluster 3 have the lowest values across all indicators, especially for quality management costs, which may indicate less developed management processes. Firms such as Smart Remont Ltd and Set Stroy could face challenges in improving their competitiveness in the market without additional investments in products and services quality.
The results of the analysis emphasize the importance of systematic quality management for improving economic efficiency and customer satisfaction. It is recommended that companies in the second and third clusters review their quality management strategies to enhance efficiency and strengthen their market positions.
The results of the study indicate that quality management is a key factor in improving cost efficiency and customer satisfaction in construction companies.
The results of the regression analysis revealed a significant relationship between quality management costs (QMC) and profitability indicators, which confirms the importance of investments in quality to achieve high financial results.
The cluster analysis divided companies into three groups based on their quality management cost and performance, highlighting differences in management strategies. Companies in Cluster 1, which actively invest in quality management systems, demonstrate leading positions in profitability and customer satisfaction. In contrast, companies in Clusters 2 and 3 allocate less funding for quality management and, consequently, achieve lower results.
5. Conclusions
The findings of the study highlight the importance of a systematic approach to quality management in the construction industry. Companies that actively invest in quality management systems and optimize their business processes achieve better results in terms of customer satisfaction and profitability.
For companies with lower quality costs, represented in Clusters 2 and 3, the key priority is to improve the quality of their services and products to increase competitiveness.
In the long term, companies should focus on cost optimization and the implementation of quality improvement strategies. This will enable them to strengthen their market position and increase financial stability.
Author Contributions
Conceptualization, A.A.Ch.; Methodology, J.J.; Software, M.A.Y.; Formal analysis, A.T.M. and Y.Zh.; Data curation, M.A.Y.; Writing—original draft, J.J.; A.A.Ch. Writing—review & editing, A.V.K. All authors have read and agreed to the published version of the manuscript.
Funding
This research received no funding.
Informed Consent Statement
Informed consent was obtained from all subjects involved in the study.
Data Availability Statement
New data were created and analyzed in this study: https://ba.prg.kz/391010000-kostanay/010940002981-too-stroitelnaya-kompaniya-almatystroy/; https://kase.kz/ru/issuers/; https://bi.group/;. https://www.kazstroypodryad.com/about; https://ramsqz.com/ru/home.
Conflicts of Interest
The authors declare no conflicts of interest.
References
- Abdrashev, A.; Alibekov, G. The implementation of ISO 9001 in construction companies in Kazakhstan and its impact on economic performance. Journal of Construction and Architecture of Kazakhstan 2020, 19, 45–52. [Google Scholar]
- Abdrashev, A.; Alibekova, G. Implementation of quality management systems in construction companies in Kazakhstan: efficiency analysis. Journal of Economics and Management 2021, 22, 75–85. [Google Scholar]
- BI Group – ofitsial'nyy sayt [BI Group – official website] [Electronic resource]. – URL:. https://bi.group/.
- Brown, K.; Smith, J. Evaluation models for quality management systems and their impact on operational efficiency. Journal of Quality and Productivity 2020, 35, 122–134. [Google Scholar] [CrossRef]
- Chen, J.; Li, Y. The Impact of Client-Centered Quality Management on Construction Company Profitability: An Empirical Study. Journal of Quality Management in Construction 2019, 47, 135–150. [Google Scholar] [CrossRef]
- Chen, J.; Li, Y. The strategic role of client-centric quality management systems in enhancing business process optimization. Journal of Quality Management in Construction 2020, 47, 135–150. [Google Scholar] [CrossRef]
- Gonzalez, A.; Rodriguez, M. Client-oriented quality management systems and their effects on customer satisfaction and financial performance. International Journal of Construction Economics and Building 2019, 28, 112–125. [Google Scholar] [CrossRef]
- Kazstroypodryad LLP – SPARK baza dannykh [Kazstroypodryad LLP – SPARK database] [Electronic resource]. – URL:. https://www.kazstroypodryad.com/about.
- Lopez, J.; Parker, S. Business process optimization through client-centered quality management in construction. Journal of Quality Assurance in Construction 2020, 42, 78–89. [Google Scholar] [CrossRef]
- Makulova, Aiymzhan, Saparbayev, Abdizhapar, Zhuman, Yeldar, Abdibekov, Saken, Madiyarova, Kuralay, Bekbulatova, Rakhima. Application of the TRIZ Methodology in the Construction Industry. Civil Engineering and Architecture 2023, 11, 517–524. [Google Scholar] [CrossRef]
- Martinez, L.; Torres, P. Client-Oriented Quality Management Systems and Their Effect on Repeat Business in the Construction Industry. Construction Economics and Building 2020, 28, 112–125. [Google Scholar] [CrossRef]
- Martinez, L.; Torres, P. The role of quality management systems in enhancing profitability and customer satisfaction in construction. Construction Management Review 2021, 39, 211–226. [Google Scholar] [CrossRef]
- Mukhamedova, G.; Karimov, M. The impact of QMS on the competitiveness of construction companies in Kazakhstan. Economics and Management in Construction 2021, 22, 67–76. [Google Scholar]
- Nguyen, T.; Chang, H. Standardizing business processes through quality management systems: A focus on operational efficiency. Journal of Business Process Management 2022, 50, 88–101. [Google Scholar] [CrossRef]
- Ofitsial'nyy sayt TOO "Almaty Stroy" [Official website of «Almaty Stroy»] [Electronic resource]. – URL:. https://ba.prg.kz/391010000-kostanay/010940002981-too-stroitelnaya-kompaniya-almatystroy/.
- Ofitsial'nyy sayt Kazakhstanskoy fondovoy birzhi [Official website of the Kazakhstan Stock Exchange] [Electronic resource]. – URL:. https://kase.kz/ru/issuers/.
- Peter, L.; Hopkins, R. Process optimization and operational efficiency through quality management systems: A customer-focused approach. Journal of Construction Process Improvement 2021, 30, 98–110. [Google Scholar] [CrossRef]
- RAMS Qazaqstan [Rams Kazakhstan] [Electronic resource]. – URL:. https://ramsqz.com/ru/home.
- Satpayev, B. Customer satisfaction and cost-effectiveness of quality management systems in construction organizations. Bulletin of Construction and Architecture of Kazakhstan 2020, 19, 45–52. [Google Scholar]
- Wang, D.; Li, H. The role of continuous assessment in the optimization of quality management systems in the construction industry. International Journal of Construction Management 2019, 25, 145–160. [Google Scholar] [CrossRef]
- Yeldar, Zhuman, Jappar, Juman, Aiymzhan, Makulova, Bakhytbek, Kalaganov, Akkhozha, Tagay, Uldar, Bastarova. Mechanism of introduction of quality management system at the enterprises of the construction industry: case of the Republic of Kazakhstan. Business, Management and Economics Engineering 2024, 22, 240–254. [Google Scholar] [CrossRef]
Disclaimer/Publisher’s Note: The statements, opinions and data contained in all publications are solely those of the individual author(s) and contributor(s) and not of MDPI and/or the editor(s). MDPI and/or the editor(s) disclaim responsibility for any injury to people or property resulting from any ideas, methods, instructions or products referred to in the content. |
© 2025 by the authors. Licensee MDPI, Basel, Switzerland. This article is an open access article distributed under the terms and conditions of the Creative Commons Attribution (CC BY) license (http://creativecommons.org/licenses/by/4.0/).
Copyright: This open access article is published under a Creative Commons CC BY 4.0 license, which permit the free download, distribution, and reuse, provided that the author and preprint are cited in any reuse.


