Submitted:
05 March 2025
Posted:
06 March 2025
You are already at the latest version
Abstract
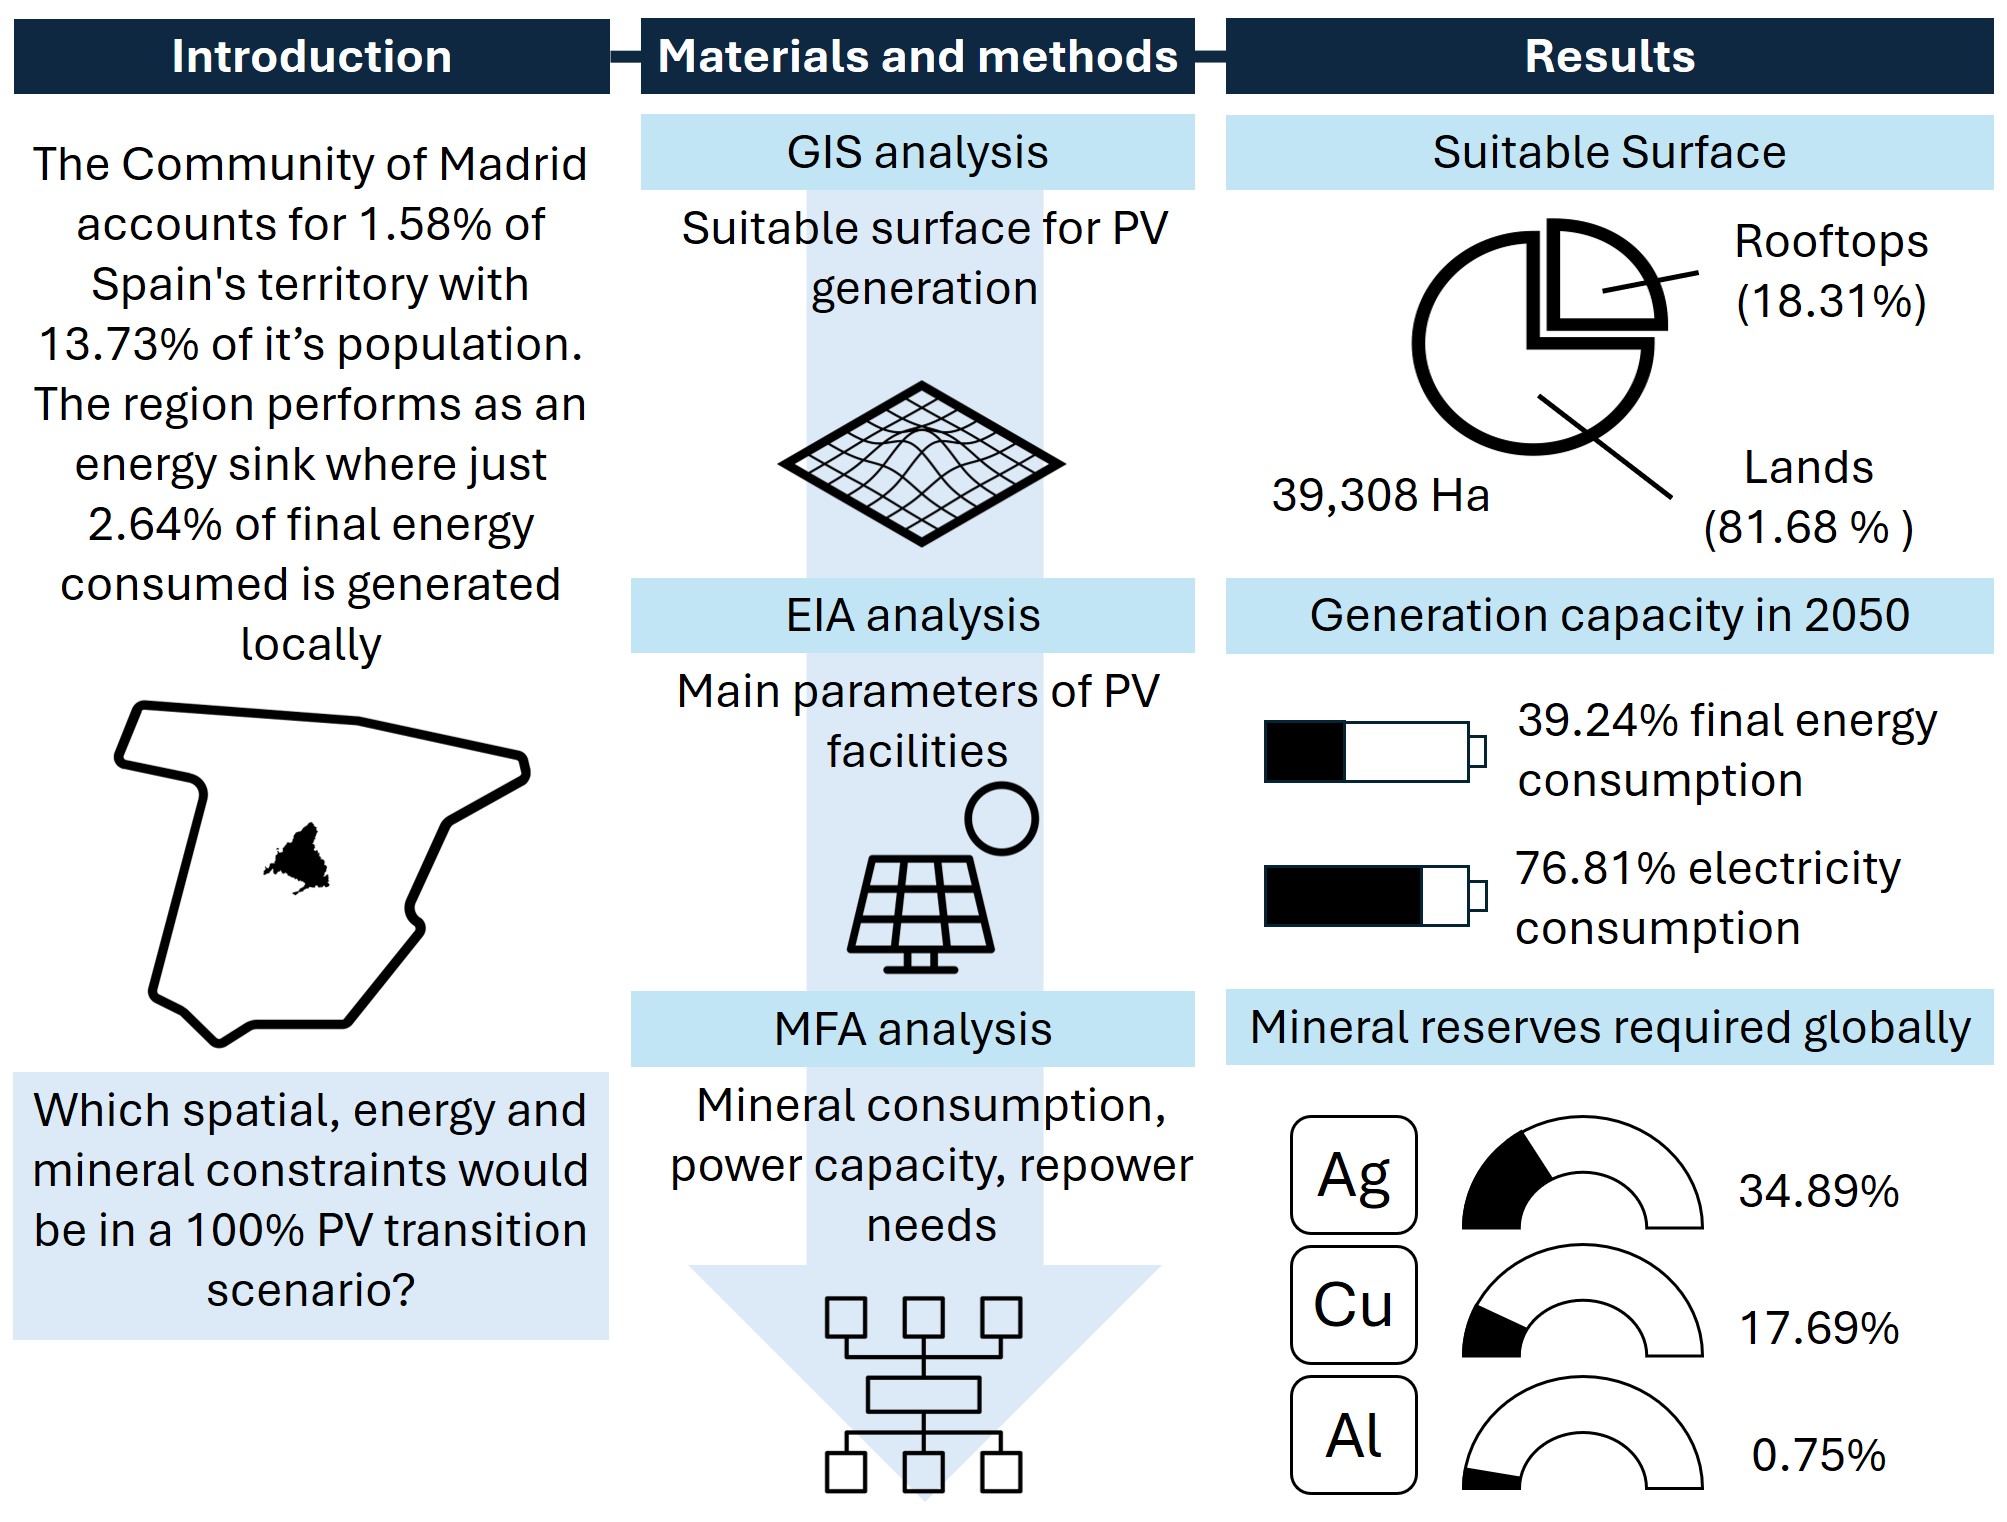
Amidst the backdrop of the fossil fuel energy crisis, the development of renewable energy sources is experiencing an unprecedented acceleration in Spain and focusing in metropolitan areas. This study investigates the potential for photovoltaic energy development in Spanish metropolitan areas, specifically Madrid and its surrounding region. Recognizing the inherent challenges of land use and material scarcity associated with this development, the research aims to quantify the maximum achievable photovoltaic capacity for the region, along with the corresponding land occupation and material consumption requirements. A Material Flow Analysis (MFA) methodology is employed to project these parameters to 2050. The analysis estimates a potential production capacity of 32,163 GWh/year, representing 76.81% of the projected electricity consumption in 2050 (and 39.94% of final energy consumption). This capacity would necessitate the utilization of 32,169 hectares of land (4.01% of the regional area), including 7,139 hectares of rooftop space. Critically, 48% of the suitable land is classified as agricultural land, highlighting potential land-use competition. Furthermore, the study extrapolates the material requirements to a global scale, estimating the percentage of global mineral reserves required for a comparable energy transition. The analysis yields an estimate of 0.75% for aluminum, 17.69% for copper, and 34.89% for silver. These findings provide crucial insights into the material and geographical constraints impacting the feasibility of urban energy transitions.
Keywords:
Solar potential
; Land-use
; Mineral footprint
; Energy transition
; Urban energy transition
1. Introduction
From an energy perspective, human history describes an exponential trend [1]. The extraction of increasing amount of energy from nature is carried out through what Debeir et al. [2] call “energy systems”.
“An energy system is the original combination of various converters that are characterized by the use of specific energy sources and by their interdependence, initiated and controlled by social classes or groups, which develop and strengthen on the basis of this control” [2] (p.5).
Energy systems constitute the modes through which social metabolism appropriates energy. They encompass both technical and social dimensions. The technical component involves energy converters, either biological (e.g., the human body) or artificial (e.g., photovoltaic panels or combustion engines). These converters facilitate the transformation of energy between various forms, including mechanical, electromagnetic, thermal, chemical, and nuclear. Conversely, the social component of energy systems pertains to the appropriation and unequal distribution of energy flows within the social metabolism [2] (p. 26). A critical perspective should also incorporate the often-overlooked spatial dimension of energy systems. This dimension reveals the specific geographies of energy appropriation that energy systems create.
The dominance of energy systems based on non-renewable energy sources (coal, oil, and natural gas) since the 19th century has enabled societies to achieve unprecedented levels of energy consumption [3]. However, this trajectory also generates significant planetary impacts, including climate change, biodiversity loss, ocean acidification, intensifying droughts, and disruptions to nitrogen and phosphorus biogeochemical cycles. These consequences highlight the inherent friction between these energy systems and the biophysical limits of the Earth [4,5,6,7,8].
Two interrelated energy processes are unfolding within this context. Firstly, there is the depletion of energy systems based on finite energy sources. These sources are inherently incapable of providing society with ever-increasing net energy outputs due to their physical limitations [2,3]. This occurs because the energy expended on extraction, transportation, and consumption of finite sources often exceeds the energy they ultimately deliver [9,10,11]). Conversely, energy systems based on renewable resources have witnessed accelerated development since the turn of the 21st century. By 2021, renewable energies accounted for 13.47% of global primary energy consumption. Within this segment, hydroelectric energy comprised 53.89%, wind energy 23.48%, solar energy 13.02%, and other renewables 9.62% [12,13].
However, the large-scale integration of renewable energies to replace finite energy sources presents significant challenges. Key factors conditioning the development of renewable energies include land-use requirements that reshape energy geographies [14,15], leading to potential competition with other land uses. Furthermore, the consumption of critical minerals by renewable energy technologies presents a bottleneck for a smooth energy transition [16,17,18].
Photovoltaic solar energy (PV) is a crucial renewable energy source that has witnessed remarkable growth over the past quarter-century. In Spain, installed photovoltaic power capacity surged from 1.49 MW in 1998 to 22,148 MW in 2023 [19]. Consequently, this raises critical questions regarding the material and spatial feasibility of sustaining this growth trajectory, particularly in regions with high energy consumption that tend to correspond to large urban populations [20].
Cities and their metropolitan areas, as centers of economic and social activity, exemplifies this challenge. They exert a significant influence on their surrounding territory. This influence is manifested in the formation of metropolitan areas, which are extensive urban regions characterized by a strong social, economic, and energy interdependence with the central city. In Spain, the delimitation and study of these metropolitan areas is carried out through the mapping of Metropolitan Areas or Functional Urban Areas, which provide a geographical framework for the analysis of urban and regional dynamics.
Madrid, as the capital of Spain, exerts a particularly notable influence on its regional environment. Its metropolitan area extends through all the municipalities of the Community of Madrid (NUTS 02), reflecting the centrality of the city in the territorial and socioeconomic organization of the region. In this sense, the Community of Madrid (NUTS 02) stands as a representative study area of the Madrid metropolitan area, since it provides an adequate framework for the study of urban and regional dynamics around the Spanish capital. The region spans 8,028 km2 (1.58% of the national territory) and accommodates a population of 6.642 million (13.73% of Spain's population). It functions as an energy sink, as only 2.4% of the final energy consumed within its borders is produced locally. The remaining 97.6% of energy consumption relies on imported petroleum products (47.4%), electricity (26.2%), and natural gas (23.8%) [21]. The region also ranks among the lowest in terms of installed renewable energy capacity. According to the Administrative Registry of Electricity Generation Installations, as of 2024, only 64.49 MW of photovoltaic power capacity exists (constituting 0.29% of Spain's total installed capacity) [19].
However, photovoltaic energy in Spain has experienced significant growth between 2019 and 2023, with positive implications for the Community of Madrid. In 2023, 45 photovoltaic projects received a favorable Environmental Impact Assessment (EIA), which translates to an additional 4,742 MW of capacity upon completion between 2024 and 2025.
In light of these considerations, this study aims to estimate the maximum potential photovoltaic capacity within the Community of Madrid region. Additionally, it will assess the availability of land suitable for photovoltaic generation and the material consumption associated with a large-scale development scenario between 1998 and 2050. To achieve this objective, the following methodological approach is adopted.
A quantitative methodology based on a material flow analysis (MFA) is established in three phases. This analysis considers the installed capacity since 1998 and posits an initial scenario where photovoltaic infrastructure undergoes large-scale development through solar parks, progressively occupying all suitable land within the region by 2050. It also assumes the complete utilization of rooftops suitable for photovoltaic generation by the same timeframe. Subsequently, the study estimates land and roof occupation, material consumption, and generation capacity under this scenario. Finally, the results of the study are presented, followed by a discussion and synthesis of the conclusions.
2. Materials and Methods
To determine the maximum photovoltaic capacity of the Community of Madrid region, a three-phase methodological approach is implemented (Figure 1). The first phase focuses on estimating the available land and roof area suitable for photovoltaic (PV) energy production. This entails the synthesis of land-use and rooftop suitability maps, followed by a cross-referencing process with the land-use cartography offered by Copernicus Corine Land Cover 2018 database. This integrated analysis allows for the identification of current land uses within areas potentially designated for PV electricity generation.
The second phase involves establishing the basic technical specifications of a model PV installation. This is achieved through the analysis of technical characteristics reported in the Environmental Impact Assessments (EIAs) of existing PV projects. By analysing these EIAs, an average capacity per installation can be estimated.
The findings from the first two phases serve as key inputs for the material flow model, which constitutes the third phase of analysis. This model is employed to estimate the study's primary results. Additionally, a set of assumptions is incorporated into the model to enhance the reliability of the generated outcomes.
2.1. GIS Analysis
2.1.1. Land Surface Available
The identification of suitable surfaces for solar panel installation is achieved through a two-step process. The first step involves determining the available land based on a literature review and existing land-use maps. However, these maps require further refinement to exclude areas incompatible with photovoltaic generation, such as designated development zones. This process allows for the identification of suitable land for solar panel deployment. The second step, using a similar methodology, focuses on identifying rooftops within the region that are suitable for photovoltaic production.
The "Environmental Zoning for the Implementation of Photovoltaic Energy in the Community of Madrid" report [22] serves as the primary document for identifying land available for solar panel installation. This report leverages Environmental Impact Assessment (EIA) methodology to pinpoint areas with minimal environmental impact for the construction of solar parks. The core criteria for EIA are outlined in Law 21/2013, of December 9, on Environmental Assessment. Annex I of this law stipulates that projects exceeding 100 hectares and not located on rooftops are subject to a full environmental assessment.
For this study, it is assumed that large-scale installations for solar energy production will involve projects exceeding this size threshold. The EIA process employs a multicriteria methodology that weighs various biogeographical, socioeconomic, and cultural factors. This assessment considers different potential scenarios and incorporates preventive, corrective, and remedial measures during the construction, operation, and decommissioning phases. The "Environmental Zoning for the Implementation of Photovoltaic Energy in the Community of Madrid" report [22] consider the following environmental factors:
- Urban areas and transport infrastructures.
- Water bodies and flood zones.
- Areas of distribution of endangered species and steppe birds.
- Natura 2000 network.
- Protection areas included in law RD 1432/2008, of 29 August, which establishes measures for the protection of birdlife against collision and electrocution on high-voltage power lines.
- Areas of ecological connectivity by means of what are known as wild highways included in [45].
- Protected Natural Areas.
- Biosphere Reserves.
- Wetlands of International Importance considered in the Ramsar List.
- SEO/BirdLife Important Bird Areas [46].
- Habitats of Community Interest.
- Camino de Santiago and cattle trails: The legal regime to which these linear elements are subject (Law 3/1995 at national level and Law 8/1998 in the Community of Madrid) prevents, among other things, the installation of any energy-generating infrastructure.
- Mountains of public utility and preserved mountains.
- Sites of Geological Interest.
- UNESCO World Heritage Sites, Sites of Cultural Interest and Sites of Heritage Interest.
- Agrological capacity and woody crops.
- Landscape units.
- Other areas subject to management, restrictions, or regulations units.
Drawing on the evaluation of these factors, the report establishes an Environmental Capacity Index (ICA) to spatially represent the suitability of land across the Community of Madrid for photovoltaic projects. This index assigns scores ranging from 0 to 10,000, categorized into four distinct classes (Table 2). The ICA is geographically depicted as a raster surface with a 25-meter grid resolution (Figure 2). This index serves as a valuable tool for pinpointing areas with minimal environmental impact for the installation of solar parks. It facilitates a more informed decision-making process and contributes to minimizing the potential negative environmental consequences associated with these projects.

Table 1.
Land categorization based on Environmental Capacity Index (ICA) from [22].
Table 1.
Land categorization based on Environmental Capacity Index (ICA) from [22].
| Land category | ICA |
|---|---|
| Not recommended areas | 0 |
| Areas with low capacity | 1-6,500 |
| Areas with medium capacity | 6,501-8,000 |
| Areas with high capacity | 8,001-10,000 |
This study defines areas with high carrying capacity, characterized by an Environmental Capacity Index (ICA) between 8,001 and 10,000, as potentially suitable for photovoltaic energy production. These areas constitute 7.47% of the Madrid region [22]. However, a portion of these high-capacity lands falls within designated urban or developable zones. Since these areas are either built-up or undergoing development, they are excluded from consideration for photovoltaic installations. The Urban Information System (SIU) [25]) serves as the reference for identifying and removing such areas from the high-carrying capacity layer.
Furthermore, a subset of these lands may possess orographic limitations that hinder solar panel installation, such as unfavorable sun exposure due to poor orientation or steep slopes. To account for these limitations and refine the suitability assessment, additional constraints are applied. The following characteristics are used to exclude high-ICA lands from the Tragsatec [22] report:
- Urban and developable or sectorized lands. These areas are excluded due to existing or planned development.
- Lands with slopes exceeding 45º. Steep slopes significantly reduce the efficiency of solar panels due to a diminished tilt angle. This criterion is more conservative compared to studies that exclude lands exceeding 15° in slope [26].
- North-facing lands with slopes exceeding than 10º. North-facing land with a gentle slope (less than or equal to 10°) is considered potentially suitable and retained in the analysis.
2.1.2. Rooftop Surface Available
To estimate the available rooftop surface area, a digital surface model (DSM) of buildings with a 2.5-meter grid resolution is employed. Building silhouettes are then extracted from the cadastral maps of each municipality and overlaid onto the DSM. This process identifies and eliminates rooftops that meet any of the following exclusion criteria:
- Roofs with slopes exceeding 45°: Similar to land-based installations, steep slopes significantly reduce the efficiency of rooftop solar panels.
- North-facing roofs with slopes exceeding 10°: North-facing rooftops with a gentle slope are considered potentially suitable and retained for further analysis.
These criteria ensure that only rooftops with suitable orientation and inclination are included in the suitability assessment. Steep slopes and unfavorable orientations would significantly reduce the potential electricity generation, making them less viable for photovoltaic installations.
2.1.3. Average Annual Irradiance
Solar irradiance in the Community of Madrid exhibits significant seasonal variations, ranging from 0.683 to 2.935 MWh/m² (Figure 3). However, for the purposes of annual analysis, an average value of 1.71 MWh/m² per year is adopted. This value is derived from data provided by the Spanish State Meteorological Agency for the Community of Madrid [27].
2.2. Environmental Impact Assessment (EIA) Analysis
The basic characteristics of the installations determine the generation capacity on the available surface. To establish realistic technical parameters, a review of the technical characteristics of all photovoltaic projects published in the BOE (Official State Gazette) with a favorable Environmental Impact Assessment (EIA) between 2014 and 2023 in all of Spain has been carried out. Most of the 410 projects reviewed received a favorable EIA between December 2022 and February 2023, reflecting the photovoltaic "boom" that began in 2019 and continues to this day. In this way, the following technical characteristics have been estimated based on the average of the analyzed sample.
2.2.1. Average Panel Power
Based on the review of installations with a favorable EIA between 2014 and 2023, an average panel power of 487W has been observed, which has been rounded down to a final panel power of 490Wp. This value has been considered for the model for both ground-mounted and rooftop installations.
2.2.2. Panel Measures and Trackers
Upon reviewing the Environmental Impact Declarations, it is observed that the most common average panel size measures 1.95 meters high and 0.99 meters wide. These dimensions have been considered for both ground-mounted and rooftop installation panels.
To avoid geometric efficiency losses, most photovoltaic plants have east-west trackers. In the case of the model, the use of trackers is assumed and geometric efficiency losses have not been considered.
2.2.3. Average Panel Efficiency and Performance Ratio
It is crucial to consider the annual increase in the average efficiency of the photovoltaic installation ensemble due to the continuous improvement of photovoltaic panels. To reflect this trend, the efficiencies achieved in the laboratory and reported by Green et al. [28,29,30,31,32,33,34,35] under standard test conditions (STC) (1000 W/m2 irradiation at 25°C and 1.5 ATM) have been taken as a reference. However, the average efficiency of commercially available panels is typically lower.
On the other hand, by analyzing 9 photovoltaic plants with a favorable EIA between 2015 and 2020, an increasing trend in average panel efficiency has been observed (Figure 3). From the installations approved in 2015 with average efficiencies of 14.6%, technological progress has enabled the achievement of efficiencies between 20.39% and 21% for installations approved from 2021 onwards. In fact, in 2022, the global average efficiency of silicon panels on the market reached 20.9%, 5.8 percentage points lower than the maximum obtained in the laboratory the same year (26.7%) [36].
This not only demonstrates a sustained increase in efficiency per panel but also reflects a convergence between the maximum efficiencies obtained under STC and the average efficiencies in the market. While in 2015 the average panel efficiency was 10.97 percentage points below the laboratory efficiency, in 2022 this difference was 5.80 percentage points. Consequently, to estimate the aggregated efficiency of the photovoltaic park in Madrid, these differences have been extrapolated considering a maximum STC efficiency of 33.7% in 2050 in accordance with the Shockley-Queisser theoretical limit. The difference between STC and field efficiency tends to narrow to 3 percentage points. As a result, the average aggregated efficiency of photovoltaic installations in the Community of Madrid in 2050 would be 30.7% (Figure 4).
On the other hand, there are energy losses between the energy generated by the panel and the energy finally injected into the grid. These losses are calculated through the Performance Ratio (PR). In this case, an average PR of 80% has been considered following the assumptions of [37].
2.3. Material Flow Analysis (MFA)
The installation of photovoltaic energy to reach the maximum capacity of the Community of Madrid is a multi-decade process. Therefore, the material flow analysis considers an energy transition between 1998 and 2050 towards a scenario in which all suitable land for photovoltaic generation is occupied by installations. However, during this period, it is very likely that changes will occur in different variables such as average efficiency per panel, obsolescence of older panels, or material consumption per installation, among others. These variables should also be integrated into the material flow analysis (MFA) model (Figure 5).
2.3.1. Annual Installed Power
The installed photovoltaic capacity in the Community of Madrid grew slowly from 2009 to 2023, increasing from 40.35 MW to 64.59 MW [19]. However, in 2023, a total of 4,742 MW received a favorable EIA. According to Royal Decree-Law 23/2020, the maximum period for obtaining the final operating authorization after a favorable EIA is 29 months. Therefore, it is assumed that the approved capacity in 2023 will be installed gradually over a 2.5-year period. Subsequently, the installation rate is estimated to remain constant until all suitable land in the region is occupied by 2050. In the case of rooftop installations, the installation follows a linear trend from historical data until full occupancy of the available surface is reached.
2.3.2. Panel Lifetime and Repower Needs
To model the degradation of photovoltaic installations, a Weibull probability distribution was employed following the methodology of Santos & Alonso-García [38]. The Weibull distribution is commonly used to estimate the lifespan of electronic devices and allows for the estimation of the failure probability of a photovoltaic installation based on Eq 1.
This function has two variables. On the one hand, k is the shape parameter. When k<1, the failure probability decreases over time, a phenomenon that is usually due to design flaws. When k=1, the failure probability is constant and random over time. Finally, when k>1, the failure probability tends to increase over time, corresponding to the life cycle of an installation. On the other hand, λ is the scale parameter, being the time at which the failure probability in an installation is 63.2%. Here, a shape parameter (k) of 2.4928 and a scale parameter (λ) of 30 years have been used (Figure 6).
The failure probability of an installation in a period between and years after its installation is the cumulative probability in that period (see Eq. 2).
Therefore, the failure probability of the installation in year , , is the difference between the cumulative probability in that year and the cumulative probability in the previous year , (see Eq. 3)
In this way, the obsolete power in year , is estimated through the installed power in a year and Eq. 3, as long as (see Eq. 4).
This function is applied for each year considering the installed power in the previous years, obtaining the total annual obsolete power (see Eq. 5).
2.3.3. Power Density
To determine the installation capacity based on the available land, it is necessary to estimate an average energy density for future installations. A sample of 410 installations with a favorable EIA between 2014 and 2023 was used to calculate an energy density considering the peak power and the area occupied by the fenced enclosure of each plant, obtaining an average of 0.58 MW/Ha. This value has been considered for both ground-mounted and rooftop installations and remains constant throughout the years.
2.3.4. Network Power Losses
Furthermore, it is necessary to consider the energy losses that occur during the transmission of high-voltage electricity. The National Commission for Markets and Competition (CNMC) publishes the weighted average energy losses in transmission and distribution in the Electricity Indicators Bulletin. The value of the losses for the last 12 months since June 2023 has been taken, which is 11.80% [39]. The percentage of losses remains constant throughout all years.
2.3.5. Annual Energy Generation
To calculate the energy generated in a specific year, the previously established installation parameters are used, as well as the average annual solar irradiation in the region (1.71 MWh/m²), and the energy losses in the high-voltage grid are also considered. In this way, the available generated energy for consumption in year t is defined in Eq. 6.
Where is the average annual irradiation (MWh/m2), is the area of each solar panel (m2), is the installed power in operation in year (MW), is the average power of each panel (MW), is the average aggregated efficiency of the photovoltaic park in year , is the Performance Ratio y is the percentage of energy lost in the network.
2.3.6. Material Intensity
To estimate the aggregate mineral consumption between 1998 and 2050, the material intensity per MW installed is considered. In this case, it is assumed that all installations will be with monocrystalline silicon (mono-Si) panels, as they currently represent more than 90% of module production [36]. However, as panel production becomes more efficient, the material intensity per MW installed decreases. Therefore, the material intensity parameters obtained in 2018, 2030, and 2050 from [40] (Table 3) have been considered and used in recent works such as [41,42]. These parameters come from the intermediate material demand (MDS) scenario of [40].
2.3.7. Recovery and Recycling Rate
A portion of the photovoltaic panels that reach the end of their useful life are recycled. The collection and recycling rates used in [43] for aluminum, copper, steel, and silver are assumed. In the case of silicon, high recycling rates are considered, taking as a reference the analyses from [44,45] (Table 4).
One way to measure the impact of mineral consumption is through the Global Equivalent Mineral Footprint (GEMF) (see Eq. 7). This indicator expresses the percentage of a mineral's reserves that would be required if the entire world population were to make an energy transition like the one contemplated in this study [47]. For the calculation of the GEMF, the population projections of the Madrid Statistical Institute and the world population projections of the United Nations up to 2050 have been considered [48,49]. On the other hand, static mineral reserves have been considered (Table 5).
2.3.8. Final Energy and Electricity Consumption
A decrease in final energy consumption of 17% between 2019 and 2030 due to efficiency improvements is assumed according to the latest draft of the National Integrated Energy and Climate Plan (PNIEC) of 2023 [50]. Subsequently, this trend remains constant until 2050, resulting in a 36.24% decrease in consumption compared to 2019. On the other hand, the percentage of aggregate electricity consumption is estimated to rise to 34% in 2030 according to the PNIEC and 52% in 2050 according to the Long-Term Decarbonization Strategy (ELP) [51]. This implies a considerable reduction in the per capita energy footprint despite demographic statistics indicating population growth. Extrapolating the demographic projections for the region from the period 2022-2037 [48] to the period 2022-2050, a 32.05% increase in the population between 2024 and 2050 is expected. In this way, final energy consumption would decrease from 1.61 tep/cap to 0.79 tep/cap (a reduction of 50.93%) (Figure 9). This data paints an optimistic scenario where increased efficiency and electrification of the economy allow for ambitious sustainability levels to be achieved.
3. Results
An area of 32,169 Ha of suitable land has been identified, equivalent to 4.01% of the territory of the Community of Madrid. It is worth noting that this area is largely located in the southeastern half of the Community of Madrid (Figure 10). On the other hand, through the analysis of roofs, a total area of 7,139 Ha has been obtained (50.93% of the region's roof area) (Figure 11).
Using the data from the Corine Land Cover System 2018 for Spain and overlaying the land considered suitable for the photovoltaic production model, it is observed that 47.67% of the land on which it would be located has predominantly agricultural use, 37.84% are grasslands and natural vegetation areas, and 9.15% forests (Figure 12). The results of land use show the presence of urban land and transport infrastructures on which the model does not allow the installation of solar parks. This data is due to the width of the raster mesh used to calculate the suitable soils and indicates that if the analysis is carried out with a more precise surface layer, the amount of available soil would be less than that considered.
On the other hand, there is evidence of competition with food production, which is equally important as energy production. If in the future, in the face of the depletion of stock energy, territories are forced to relocate basic sectors such as food and energy production, the availability of land in the vicinity of large urban centers to meet an unsustainable demand will surely be a difficult point of conflict to overcome.
Assuming full occupation of the estimated suitable area, it would be possible to install 18,658MW of photovoltaic energy on land and 4,140MW on roofs. However, the obsolescence of the facilities between 1998 and 2050 would require the replacement of 5,841MW.
In this scenario, the Community of Madrid could produce around 32,163 GWh/year in 2050, which is equivalent to 76.81% of the electricity consumption and 39.94% of the final energy consumption estimated for that year (Figure 13). However, the previous calculations do not consider the intermittency of photovoltaic energy or the need for redundant power that should come from other technologies with less intermittency.
The most consumed materials in the modelled energy transition would be iron, concrete, and plastic (Figure 14). However, the quantities of minerals required are not negligible. Considering the installed capacity and the dynamic collection and recycling rates, the GEMF in 2050 reaches 0.75% for aluminum, 17.69% for copper, and 34.89% for silver. Aluminum is the mineral with the lowest HMEG due to the abundance of reserves. This indicator has only been used for those minerals for which reserve data are available.
4. Discussion and Conclusions
This study has sought to approximate a large-scale photovoltaic energy development scenario in the Autonomous Community of Madrid to highlight the energy, geographical, and material limitations of the energy transition in the region.
Assuming a regional sustainability scenario where energy generation is linked to the territory, slightly over 75% of electricity consumption is exceeded assuming very optimistic consumption hypotheses. In fact, to meet 100% of all energy needs (considering the complete electrification of the economy), it would be necessary to have at least 2.83 territories like the Community of Madrid with a total installed capacity of 52,937MW. However, in future work it will be necessary to improve the resolution of the raster surfaces used to estimate suitable land (25 meters for land and 2.5 meters for roofs). On the other hand, only soils with high ICA have been considered; if soils with medium ICA were considered, the region's generation capacity would increase significantly.
Beyond land occupation, future work will need to consider within the occupied area that used for the extraction and synthesis of the materials consumed by the photovoltaic infrastructure. The development of renewable energies implies a revolution in the ways of appropriating energy, transitioning from an eminently vertical fossil regime (extraction of energy from the subsoil) to a horizontal one (14). However, these energy appropriation modes continue to be linked to mining processes for the extraction of minerals.
In relation to material consumption, the results obtained reveal potential bottlenecks in the development of photovoltaic energy. Despite having considered a decreasing consumption and increasing recycling rates to reach at least 80% in all minerals considered by 2050, the aggregate consumption between 1998 and 2050 is significantly high when analyzed through the GEMF. The case of silver is especially significant, with 34.89% of known reserves. In the case of meeting 100% of final energy consumption with photovoltaic electricity, the GEMF would increase to 1.77% of known reserves for aluminum, 41.98% for copper, and 70.74% for silver. That is, if the whole world made a 100% photovoltaic energy transition, it would be necessary to have more than two-thirds of the current world's silver reserves and more than a third of copper reserves, while per capita energy consumption would have to be reduced by at least 34.2% compared to 2023 levels.
It is worth noting that these estimates do not consider the redundant power that would need to be installed to avoid intermittency, nor do they consider the use of the minerals in other uses, which would translate into a lower availability of these. For example, in 2022 in the United States, the second country with the most installed photovoltaic power and the fifth largest producer of silver, only 13% of production was destined for the photovoltaic industry [46]. Finally, it is important to note that mineral reserves are dynamic, so in future work this dynamism should be integrated into the model through the estimates of the Huber Peak for each mineral.
Data Availability Statement
The raw data supporting the conclusions of this article will be made available by the authors on request.
Conflicts of Interest
The authors declare no conflicts of interest.
References
- Smil, V. Energía y civilización. Una historia, 3rd ed.; Arpa: Barcelona, Spain, 2022.
- Debeir, J.C.; Deléage, J.P.; Hémery D. Une histoire de l’énergie, 1986th ed.; Flammarion: Lonrai, France, 2013.
- Ardillo, J. Las ilusiones renovables: Ecología, energía y poder, 1st ed.; Ediciones El Salmón: Alicante, Spain; 2022.
- Coronel, A. Ecología política de la frontera. Las membranas del metabolismo capitalista Daimon 2022, 87, 83–100.
- Fischer-Kowalski, M.; Hüttler, W. Society’s Metabolism. J. Ind. Ecol. 1998, 2,107–36.
- Clark, B.; York, R. Carbon metabolism: Global capitalism, climate change, and the biospheric rift Theory Soc 2005, 34, 391–428.
- Fischer-Kowalski, M.; Haberl, H. El metabolismo socieconómico Ecología Política 2000; 19, 21–33.
- González de Molina, M.; Toledo, V.M. Metabolismos, naturaleza e historia. Hacia una teoría de las transformaciones socioecológicas, 1st ed. Icaria: Madrid, Spain, 2011.
- Bardi, U.; Jakobi, R.; Hettiarachchi, H. Mineral Resource Depletion: A Coming Age of Stockpiling? BioPhysical Economics and Resource Quality 2016, 4, 1–9.
- Murphy, D. The Oil Drum: The Net Hubbert Curve: What Does It Mean? Available online: http://theoildrum.com/node/5500 (accessed on 17-04-2023).
- Delannoy, L.; Longaretti, P.Y.; Murphy, D.; Prados, E. Peak oil and the low-carbon energy transition: A net-energy perspective Appl Energy 2021, 304, 1-17. [CrossRef]
- Moriarty, P.; Honnery, D. Feasibility of a 100% Global Renewable Energy System. Energies 2020, 13, 1-16. [CrossRef]
- BP. BP Statistical Review of World Energy. 2022. Available online: https://www.bp.com/en/global/corporate/energy-economics/statistical-review-of-world-energy.html (accessed on 17-04-2023).
- Huber, MT.; McCarthy, J. Beyond the subterranean energy regime? Fuel, land use and the production of space. Transactions of the Institute of British Geographers 2017, 42, 655–68. [CrossRef]
- Bridge, G.; Gailing, L. New energy spaces: Towards a geographical political economy of energy transition. Economy and Space 2020, 52, 1037–1050. [CrossRef]
- Durán, R.; Reyes, L. En la espiral de la energía. Vol. 2, 2nd ed.; Libros en acción: Madrid, Spain, 2018.
- Valero, A.; Valero, A.; Calvo, G. Thanatia. Límites materiales de la transición energética, 1st ed.; Prensas de la Universidad de Zaragoza: Zaragoza, 2021.
- García-Olivares, A.; Ballabrera-Poy, J.; García-Ladona, E.; Turiel, A. A global renewable mix with proven technologies and common materials. Energy Policy 2012, 41, 561–74. [CrossRef]
- CNMC. National Commission for Markets and Competition. Available online: https://www.cnmc.es/estadisticas (accessed on 29-12-2023).
- de Juan, I. Ciudades al límite: la sostenibilidad urbana en el paradigma del crecimiento y la escasez. Territorios en Formación 2023, 21, 1–20.
- Fundación de la Energía. Balance Energético de la Comunidad de Madrid (2020). Available online: https://www.comunidad.madrid/sites/default/files/doc/medio-ambiente/balance_energetico_2020_de_la_comunidad_de_madrid.pdf (Accessed on 1-06-2024).
- Tragsatec. Environmental Zoning for the Implementation of Photovoltaic Energy in the Community of Madrid. Available online: https://www.comunidad.madrid/sites/default/files/doc/medio-ambiente/1._memoria_-_noviembre_2022.pdf (Accessed on 20-01-2023).
- WWF. Autopistas Salvajes. Propuesta de WWF España para una Red Estratégica de Correderos Ecológios entre espacios de la Red Natura 2000. Available online: https://www.wwf.es/nuestro_trabajo/especies_y_habitats/conectividad_y_adaptacion_al_cambio_climatico/informe_autopistas_salvajes/ (Accessed on 20-01-2023).
- Infante, O.; Fuente, U.; Atienza, J.C. Las Áreas Importantes para la Conservación de las Aves en España, 1st ed.; SEO/BirdLife: Madrid, Spain, 2011.
- Ministerio de Vivienda y Agenda Urbana. Gobierno de España. Urban Information System (SIU). Available online: https://www.mivau.gob.es/urbanismo-y-suelo/suelo/sistema-de-informacion-urbana (accessed on 22-5-2024).
- Deng, Y.Y.; Haigh, M.; Pouwels, W.; Ramaekers, L.; Brandsma, R.; Schimschar, S.; et al. Quantifying a realistic, worldwide wind and solar electricity supply. Global Environmental Change 2015, 31, 239–52. [CrossRef]
- Sancho, J.M.; Riesco, J.; Jiménez, C.; Sánchez, M.C.; Montero, J.; López, M. Atlas de Radiación Solar en España utilizando datos del SAF de Clima de EUMETSAT, 1st ed; AEMET: Madrid, Spain, 2012.
- Green, M.A.; Emery, K.; Hishikawa, Y.; Warta, W.; Dunlop, E.D. Solar cell efficiency tables (version 40). Progress in Photovoltaics: Research and Applications 2012, 20, 606–14.
- Green, M.A.; Emery, K.; King, D.L.; Igari, S.; Warta, W. Solar cell efficiency tables (version 22). Progress in Photovoltaics: Research and Applications 2003, 11, 347–352.
- Green, M.A.; Dunlop, E.D.; Hohl-Ebinger, J.; Yoshita, M.; Kopidakis, N.; Bothe, K.; et al. Solar cell efficiency tables (Version 60). Progress in Photovoltaics: Research and Applications 2022, 30, 687–701.
- Green, M.A.; Dunlop, E.D.; Levi, D.H.; Hohl-Ebinger. J.; Yoshita, M.; Ho-Baillie, A.W.Y. Solar cell efficiency tables (version 54). Progress in Photovoltaics: Research and Applications 2019, 27, 565–75.
- Green, M.A.; Emery, K.; Hishikawa, Y.; Warta, W. Solar cell efficiency tables (version 37). Progress in Photovoltaics: Research and Applications 2011, 19, 84–92.
- Green, M.A.; Emery, K.; King, D.L.; Igari, S.; Warta, W. Solar cell efficiency tables (version 24). Progress in Photovoltaics: Research and Applications 2004, 12, 365–72.
- Green, M.A.; Emery, K.; King, D.L.; Hisikawa, Y.; Warta, W. Solar cell efficiency tables (version 27). Progress in Photovoltaics: Research and Applications 2006, 14, 45–51.
- Green, M.A.; Dunlop, E.D.; Yoshita, M.; Kopidakis, N.; Bothe, K.; Siefer, G.; et al. Solar cell efficiency tables (Version 63). Progress in Photovoltaics: Research and Applications 2024, 32, 3–13.
- Fraunhofer ISE. Photovoltaics Report 2023. Available online: https://www.ise.fraunhofer.de/en/publications/studies/photovoltaics-report.html (accessed on 29-12-2023).
- Román, E.; Caamaño, E.; Romanillos, G.; Sánchez-Guevara, C. Estudio sobre el potencial de generación de energía solar térmica y fotovotaica en los edificios residenciales españoles en su contexto urbano, 1st ed.; Ministerio de Fomento: Madrid, Spain, 2019.
- Santos, J.D.; Alonso-García, M.C. Projection of the photovoltaic waste in Spain until 2050. J Clean Prod 2018, 196, 1613–1628. [CrossRef]
- CNMC. National Commission for Markets and Competition. Electricity Indicators Bulletin Available online: www.cnmc.es/sites/default/files/4955597_0.pdf (accessed on 27-05-2024).
- Carrara, S.; Alves-Dias, P.; Plazzotta, B.; Pavel, C. Raw materials demand for wind and solar PV technologies in the transition towards a decarbonized energy system, 1st ed.; Publications Office of the European Union: Luxembourg, Luxembourg, 2020.
- Torrubia, J.; Valero, A.; Valero, A. Energy and carbon footprint of metals through physical allocation. Implications for energy transition. Resour Conserv Recycl 2023, 199, 1-9. [CrossRef]
- Liang, Y.; Kleijn, R.; Tukker, A.; van der Voet, E. Material requirements for low-carbon energy technologies: A quantitative review. Renewable and Sustainable Energy Reviews 2022, 161, 1-12. [CrossRef]
- Lallana, M.; Torrubia, J.; Valero, A. Minerales para la Transición energética y digital en España: demanda, reciclaje y medidas de ahorro, 1st ed.; Amigos de la Tierra: Zaragoza, Spain, 2023.
- Sah, D.; Chitra, S.; Kumar, S. Recovery and analysis of valuable materials from a discarded crystalline silicon solar module. Solar Energy Materials and Solar Cells 2022, 246, 1-9. [CrossRef]
- Sim, Y.; Tay, Y.B.; Ankit; Lin, X.; Mathews, N. Simplified silicon recovery from photovoltaic waste enables high performance, sustainable lithium-ion batteries. Solar Energy Materials and Solar Cells 2023, 257, 1-9. [CrossRef]
- USGS. Mineral Commodity Summaries 2023. 1st ed.; U.S. Department of Interior: Virginia, United States, 2023.
- Felipe-Andreu, J.; Valero, A.; Valero, A. Territorial Inequalities, Ecological and Material Footprints of the Energy Transition: Case Study of the Cantabrian-Mediterranean Bioregion Land, 2022, 11, 1-23. [CrossRef]
- Comunidad de Madrid. Instituto de Estadística de la Comunidad de Madrid. Proyecciones de población y hogares. Series 2022-2037. Available online: https://www.madrid.org/iestadis/fijas/estructu/demograficas/censos/estructu_procp.htm (accessed on 11-04-2024).
- UN. Department of Economic and Social Affairs. World Population Prospects 2022. Standard Projections. Available online: https://population.un.org/wpp/Download/Standard/MostUsed/ (accessed on 11-04-2024).
- Ministerio para la Transición Ecológica y el Reto Demográfico. Borrador de actualización del Plan Nacional Integrado de Energía y Clima 2023-2030. 1st ed.; MITECO: Madrid, Spain, 2023.
- Ministerio para la Transición Ecológica y el Reto Demográfico. Estrategia de descarbonización a largo plazo 2050. 1st ed.; MITECO: Madrid, Spain, 2020.
Figure 1.
Methodological approach.
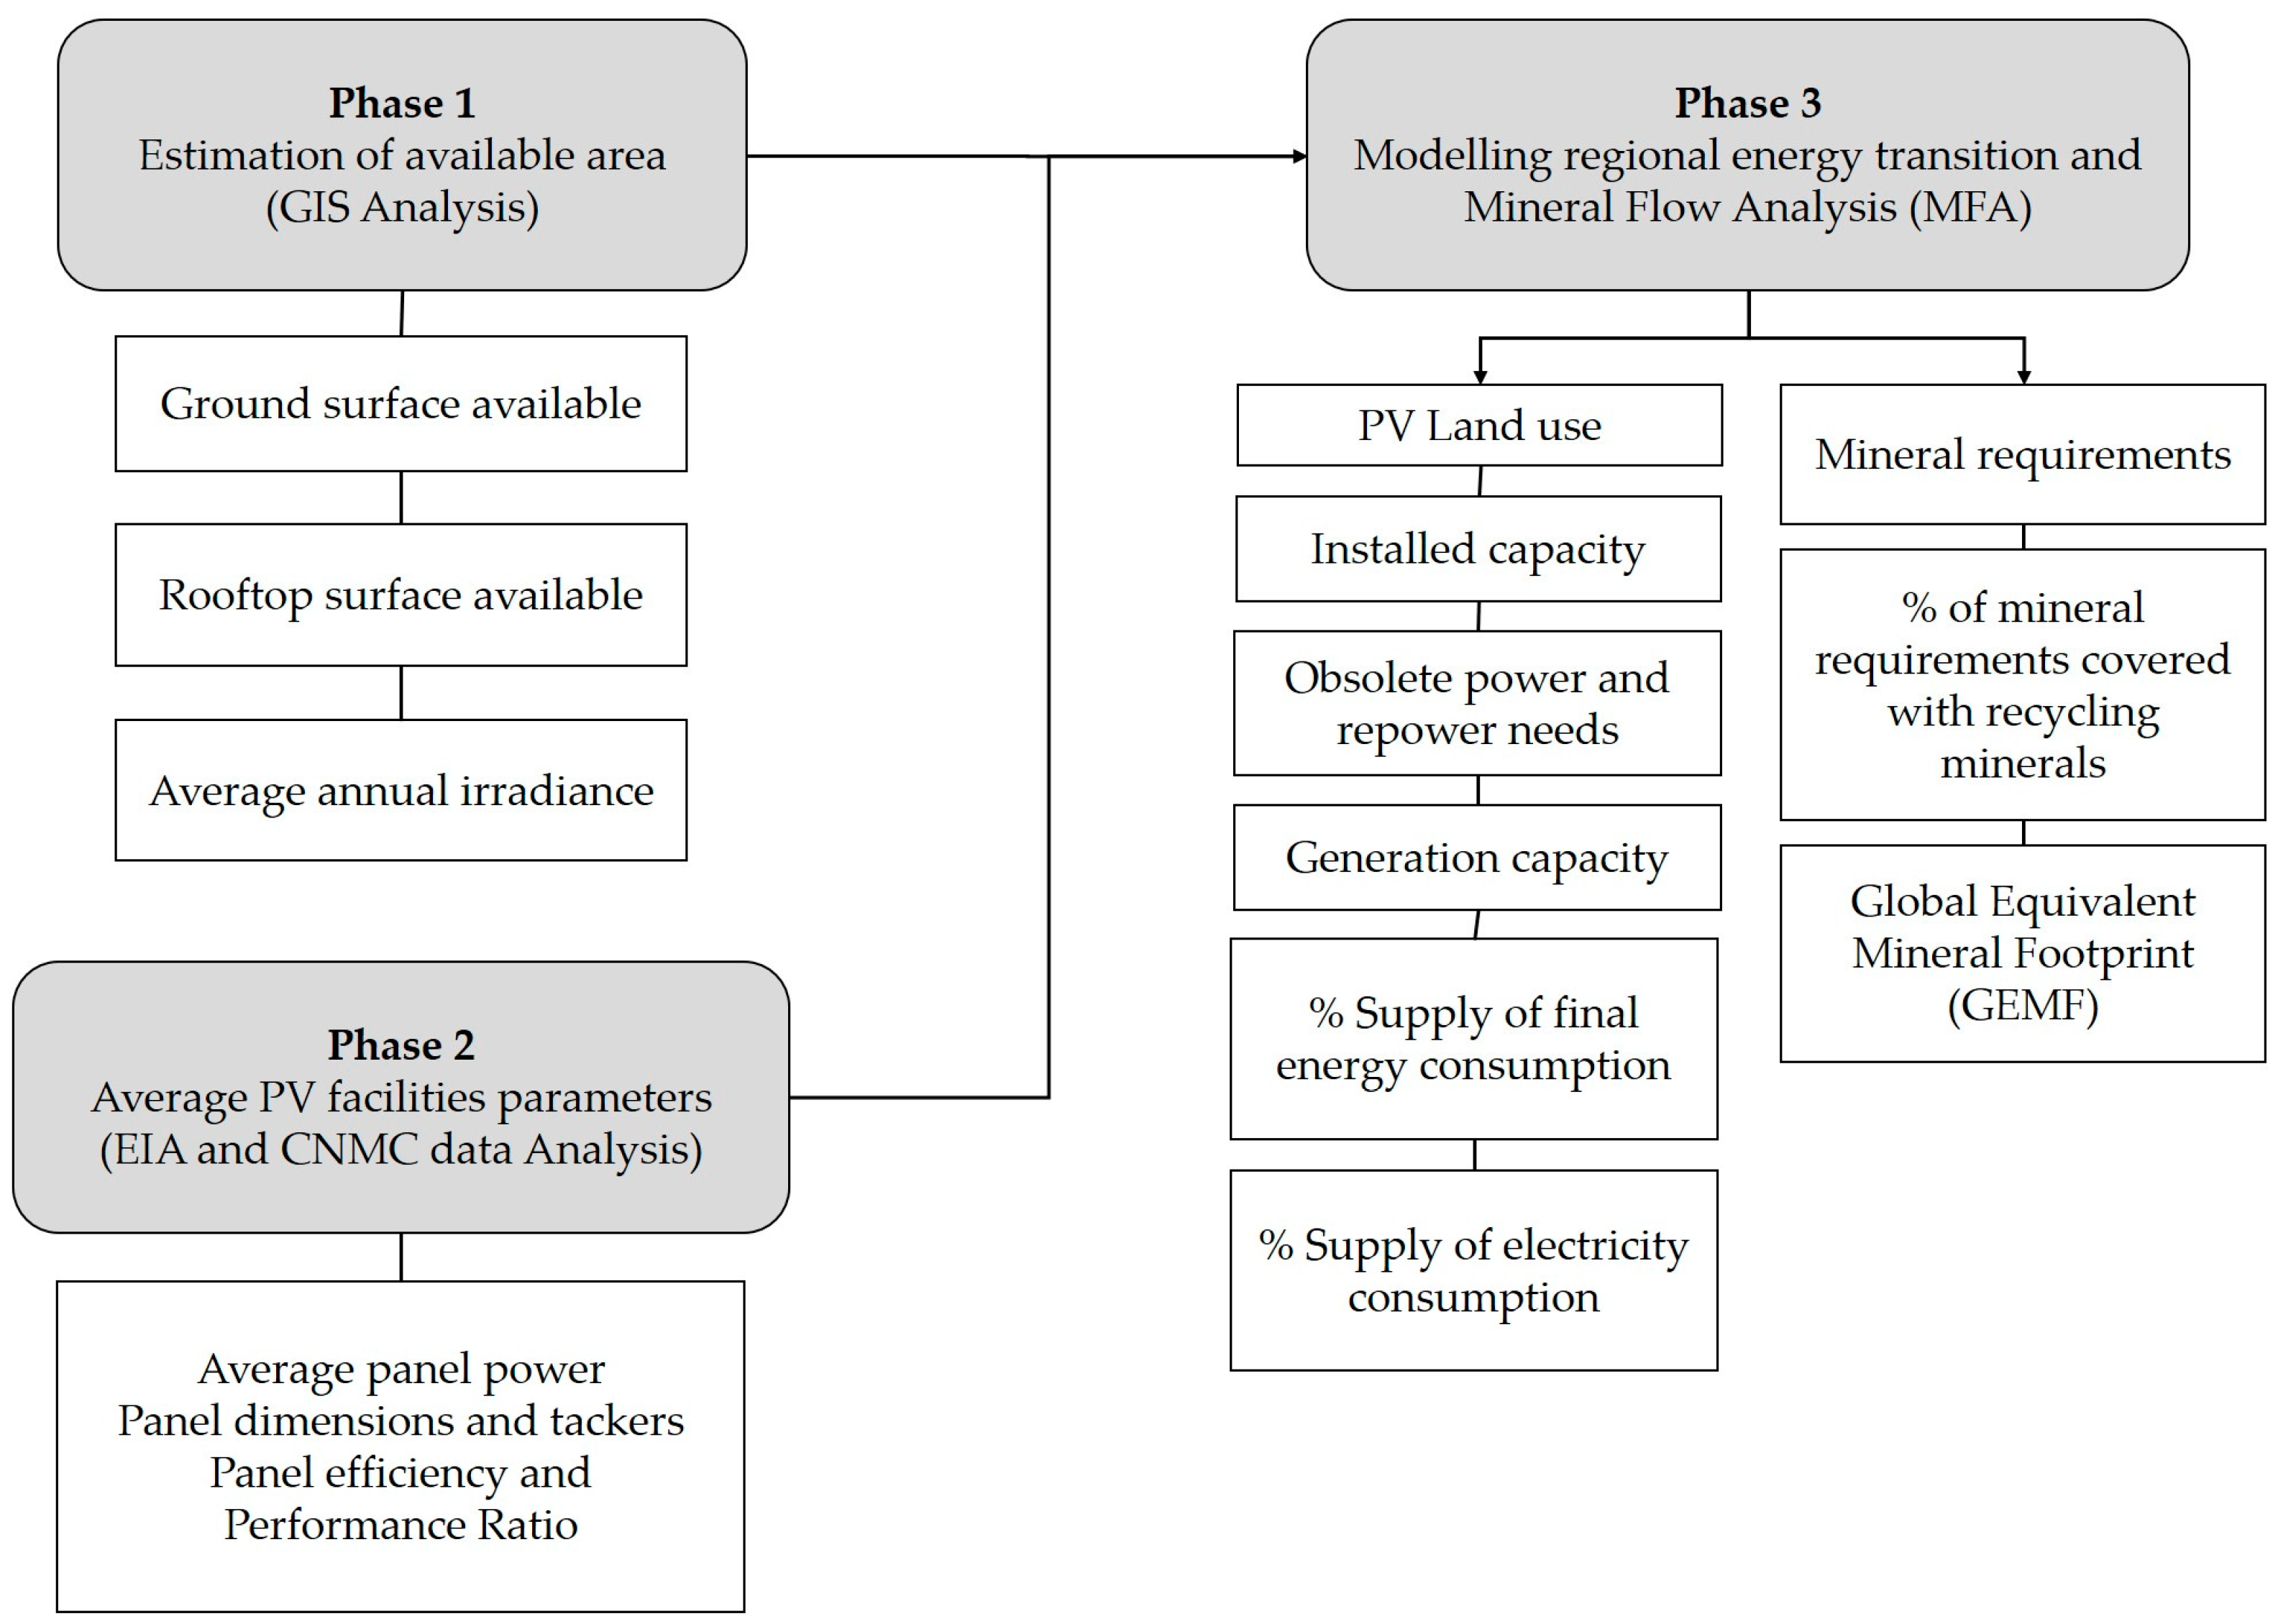
Figure 2.
Environmental Suitability Mapping for Photovoltaic Projects using the Environmental Capacity Index (ICA) from [22].
Figure 2.
Environmental Suitability Mapping for Photovoltaic Projects using the Environmental Capacity Index (ICA) from [22].
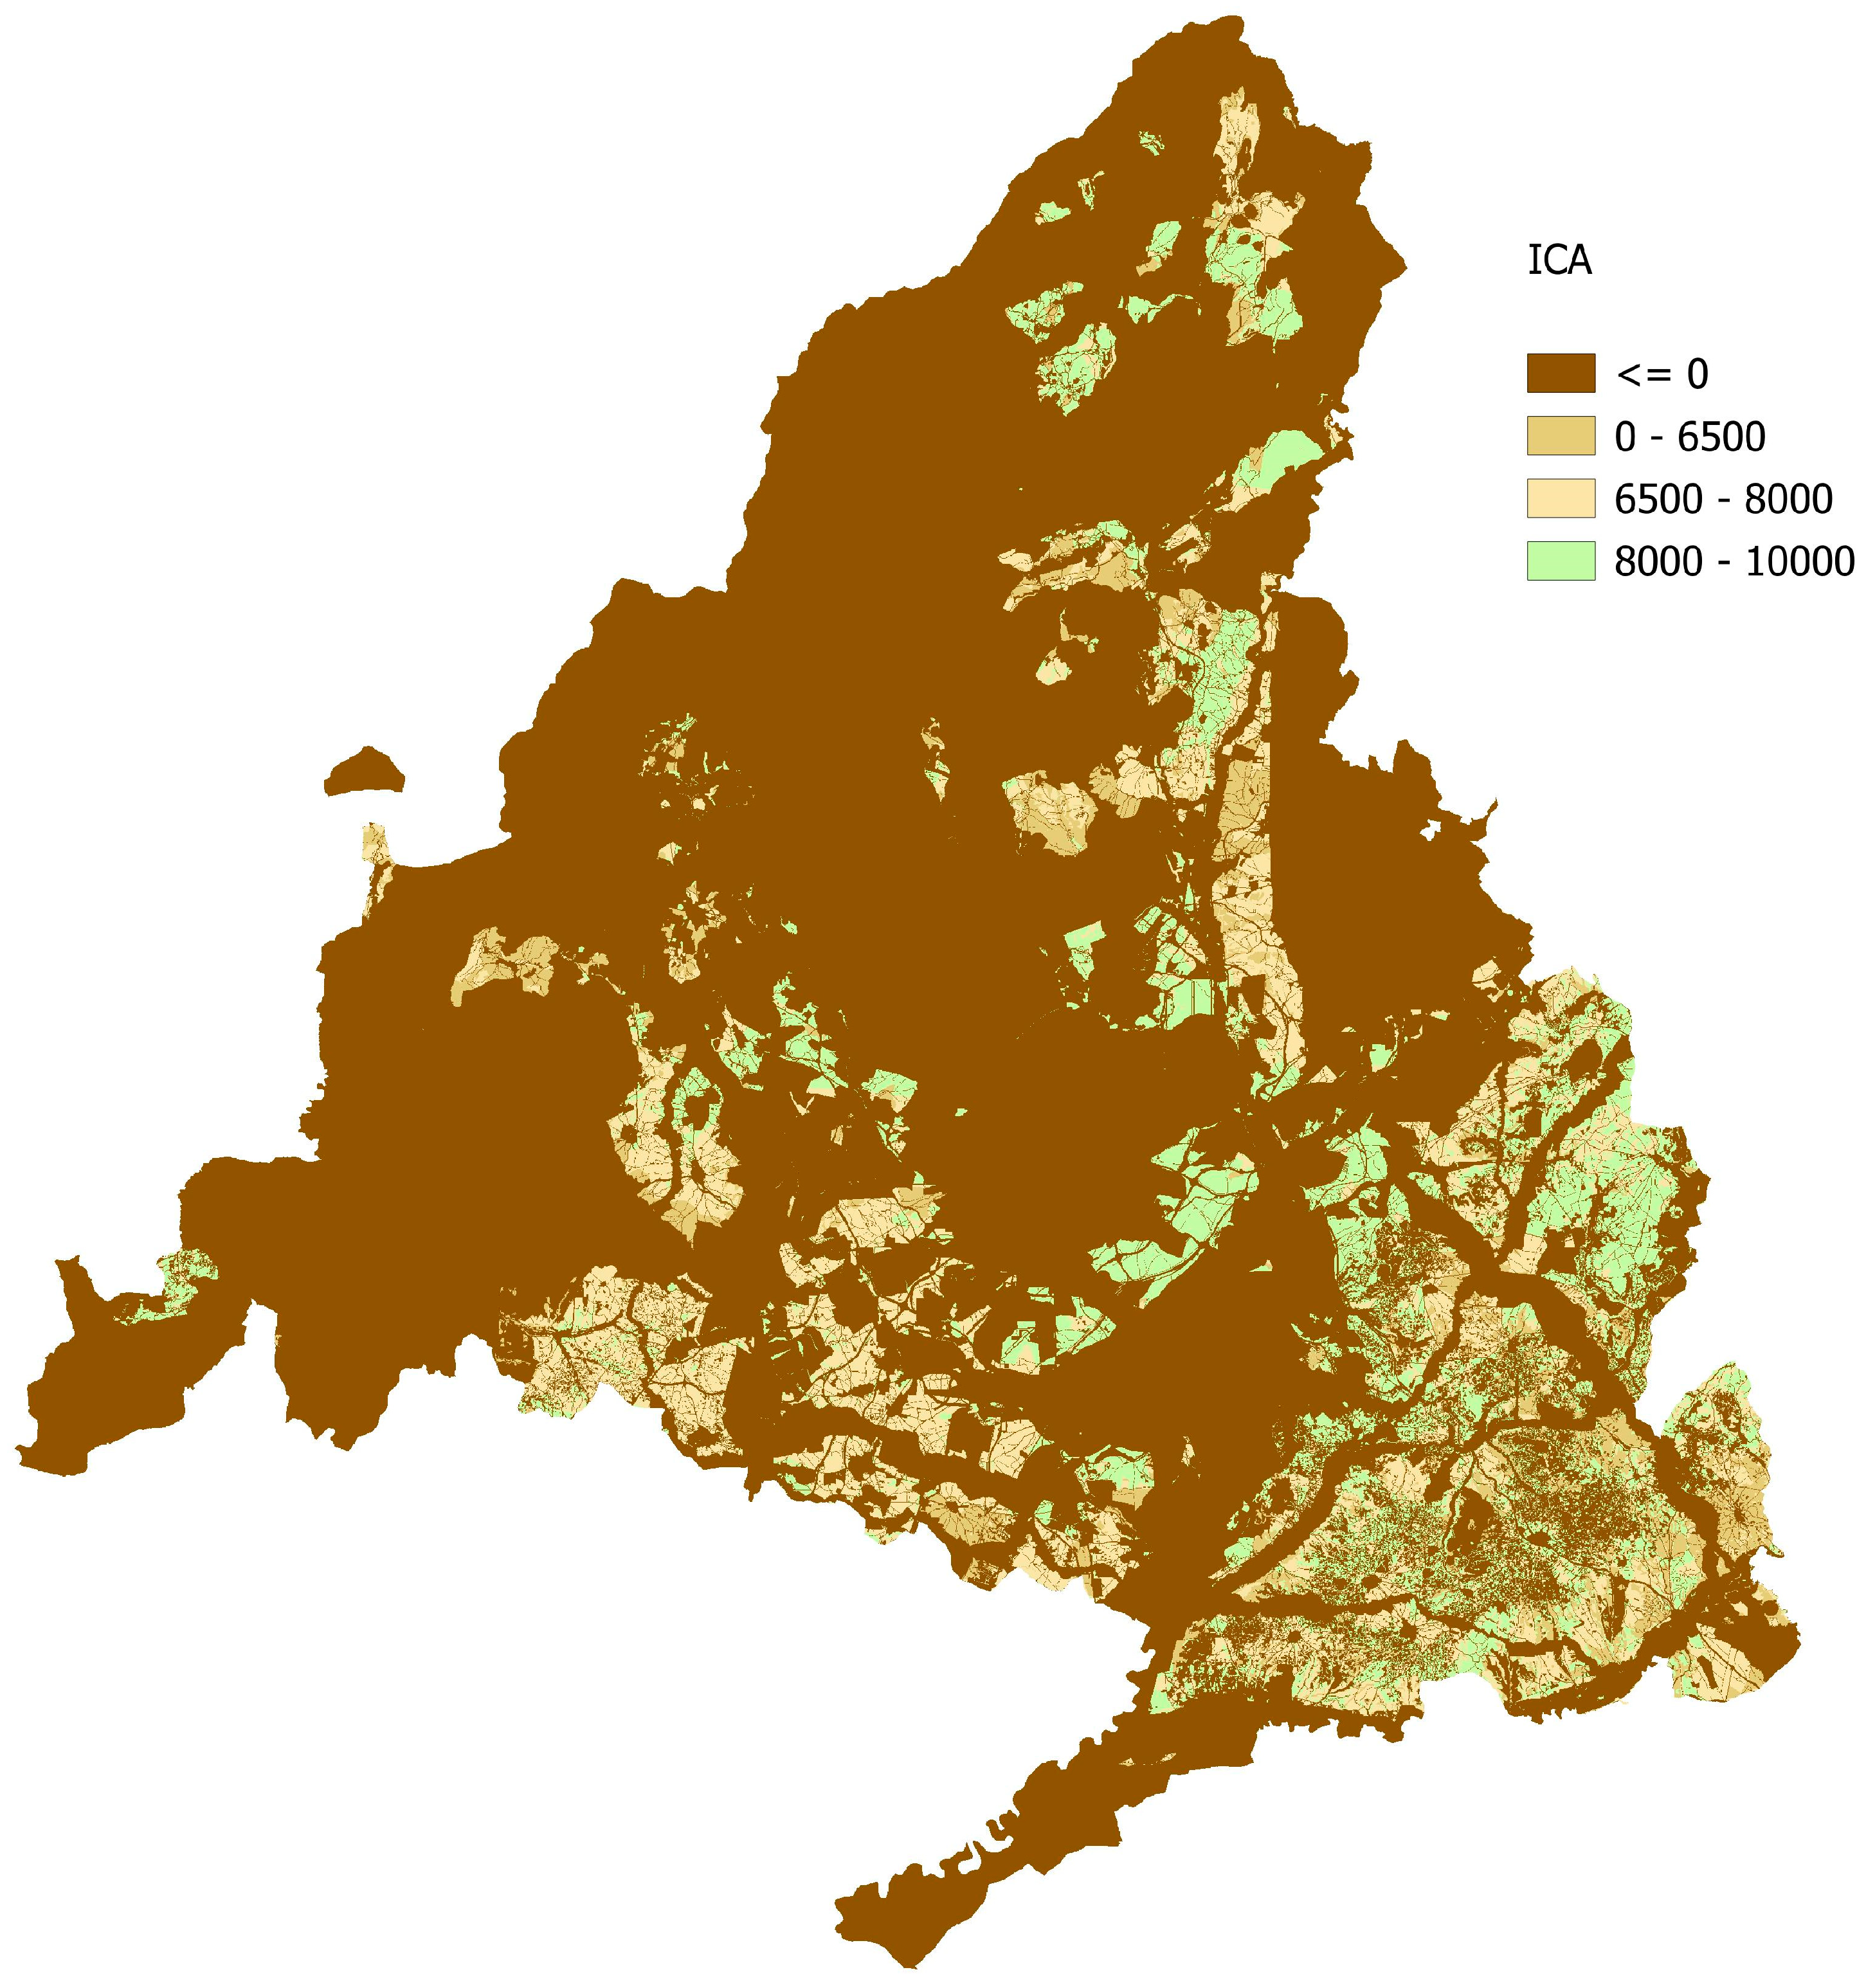
Figure 3.
Evolution of average efficiency per panel in photovoltaic projects with favorable EIA between 2015 and 2023.
Figure 3.
Evolution of average efficiency per panel in photovoltaic projects with favorable EIA between 2015 and 2023.
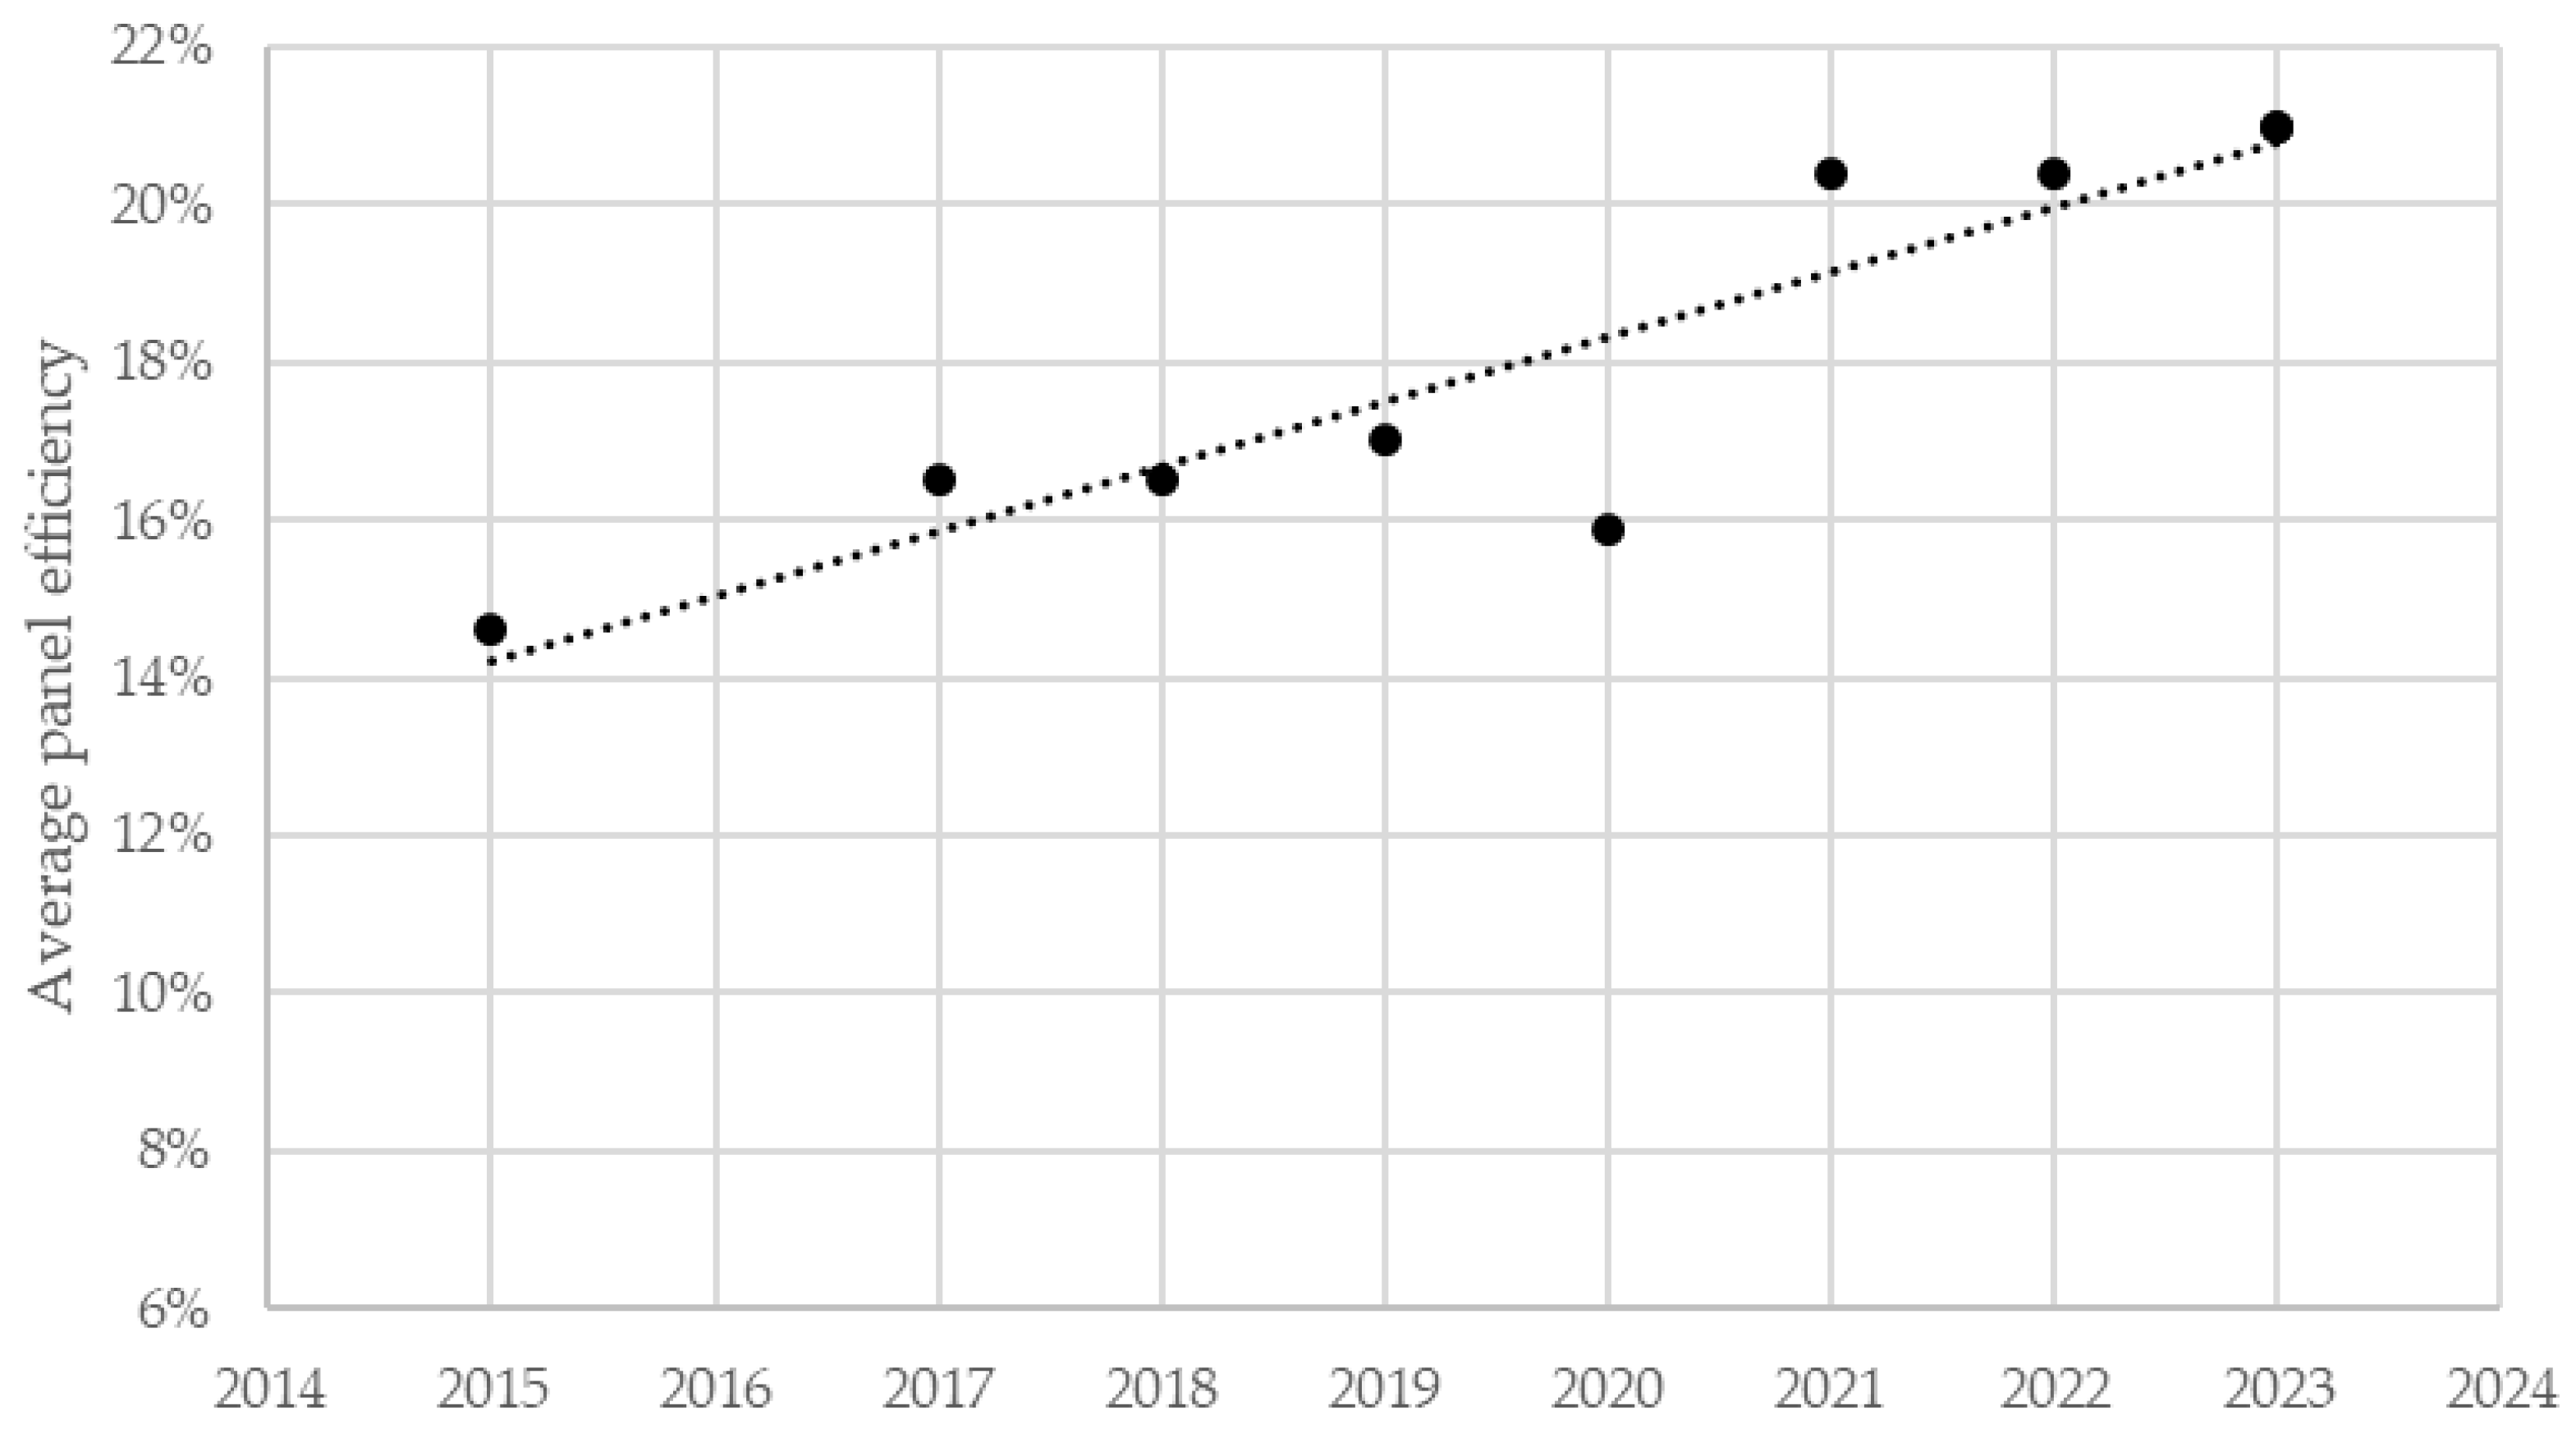
Figure 4.
Estimation of the average efficiency of the photovoltaic park in the Community of Madrid between 1998 and 2050 from [36] and [28,29,30,31,32,33,34,35].
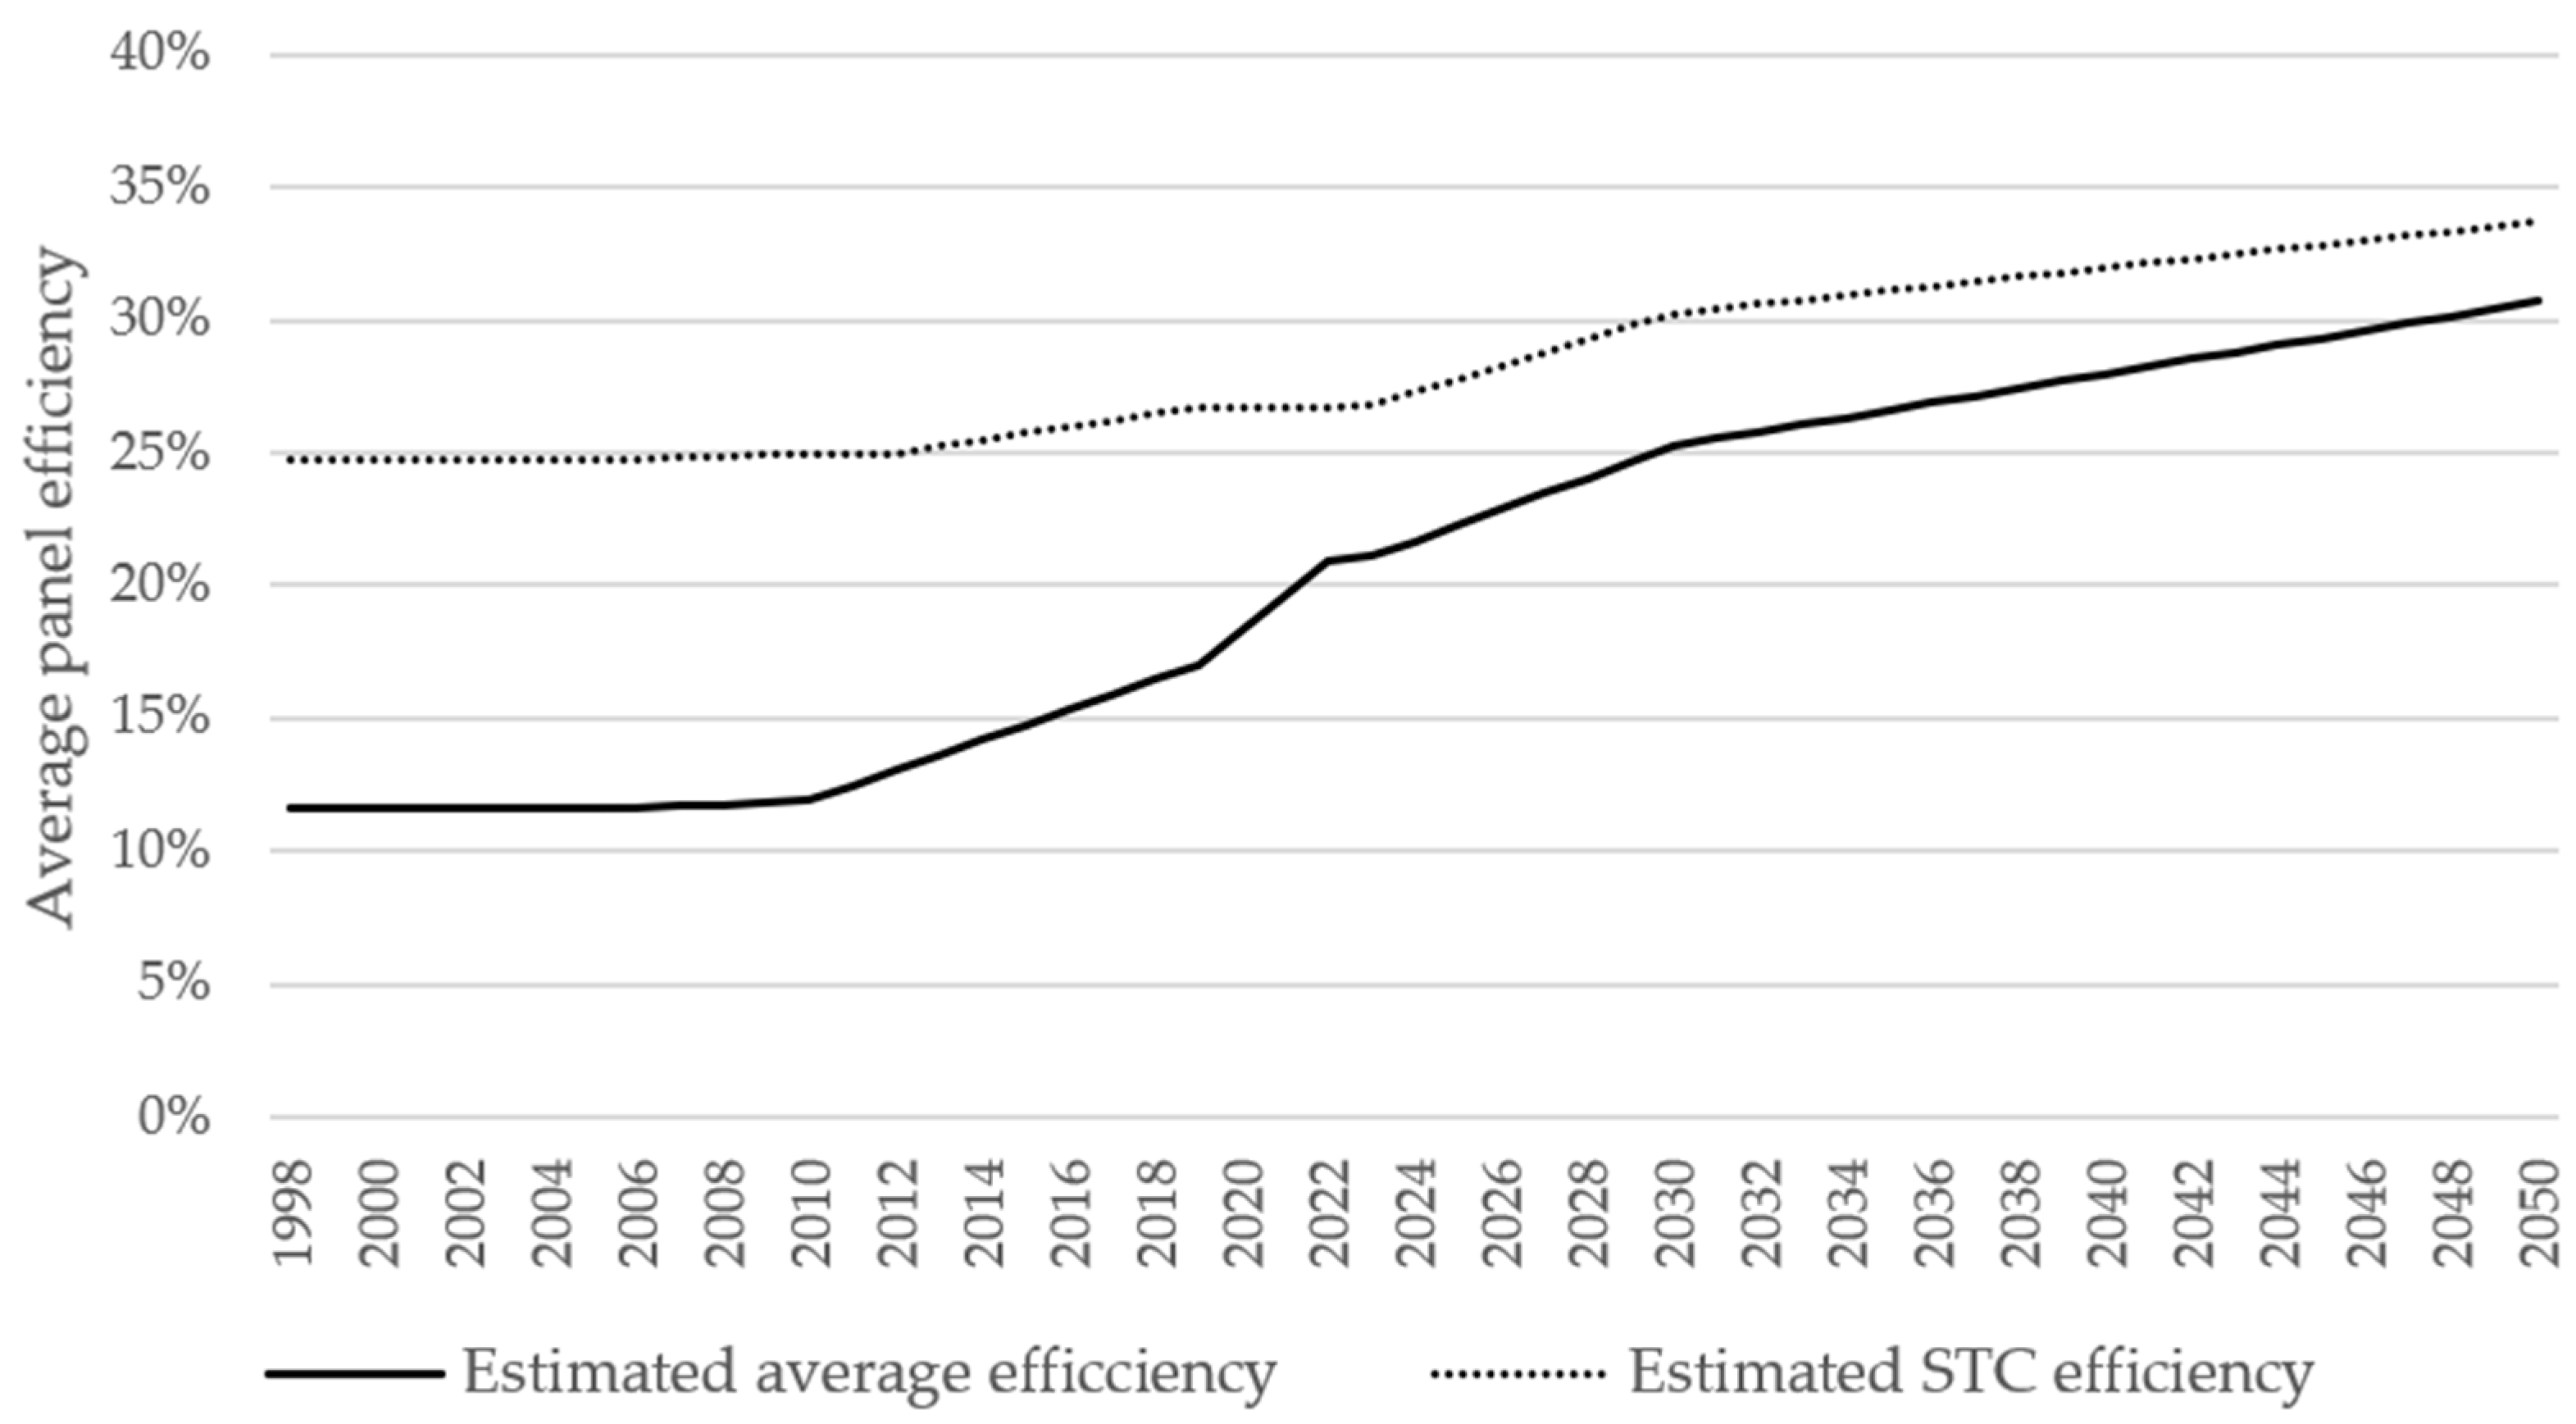
Figure 5.
MFA scheme.
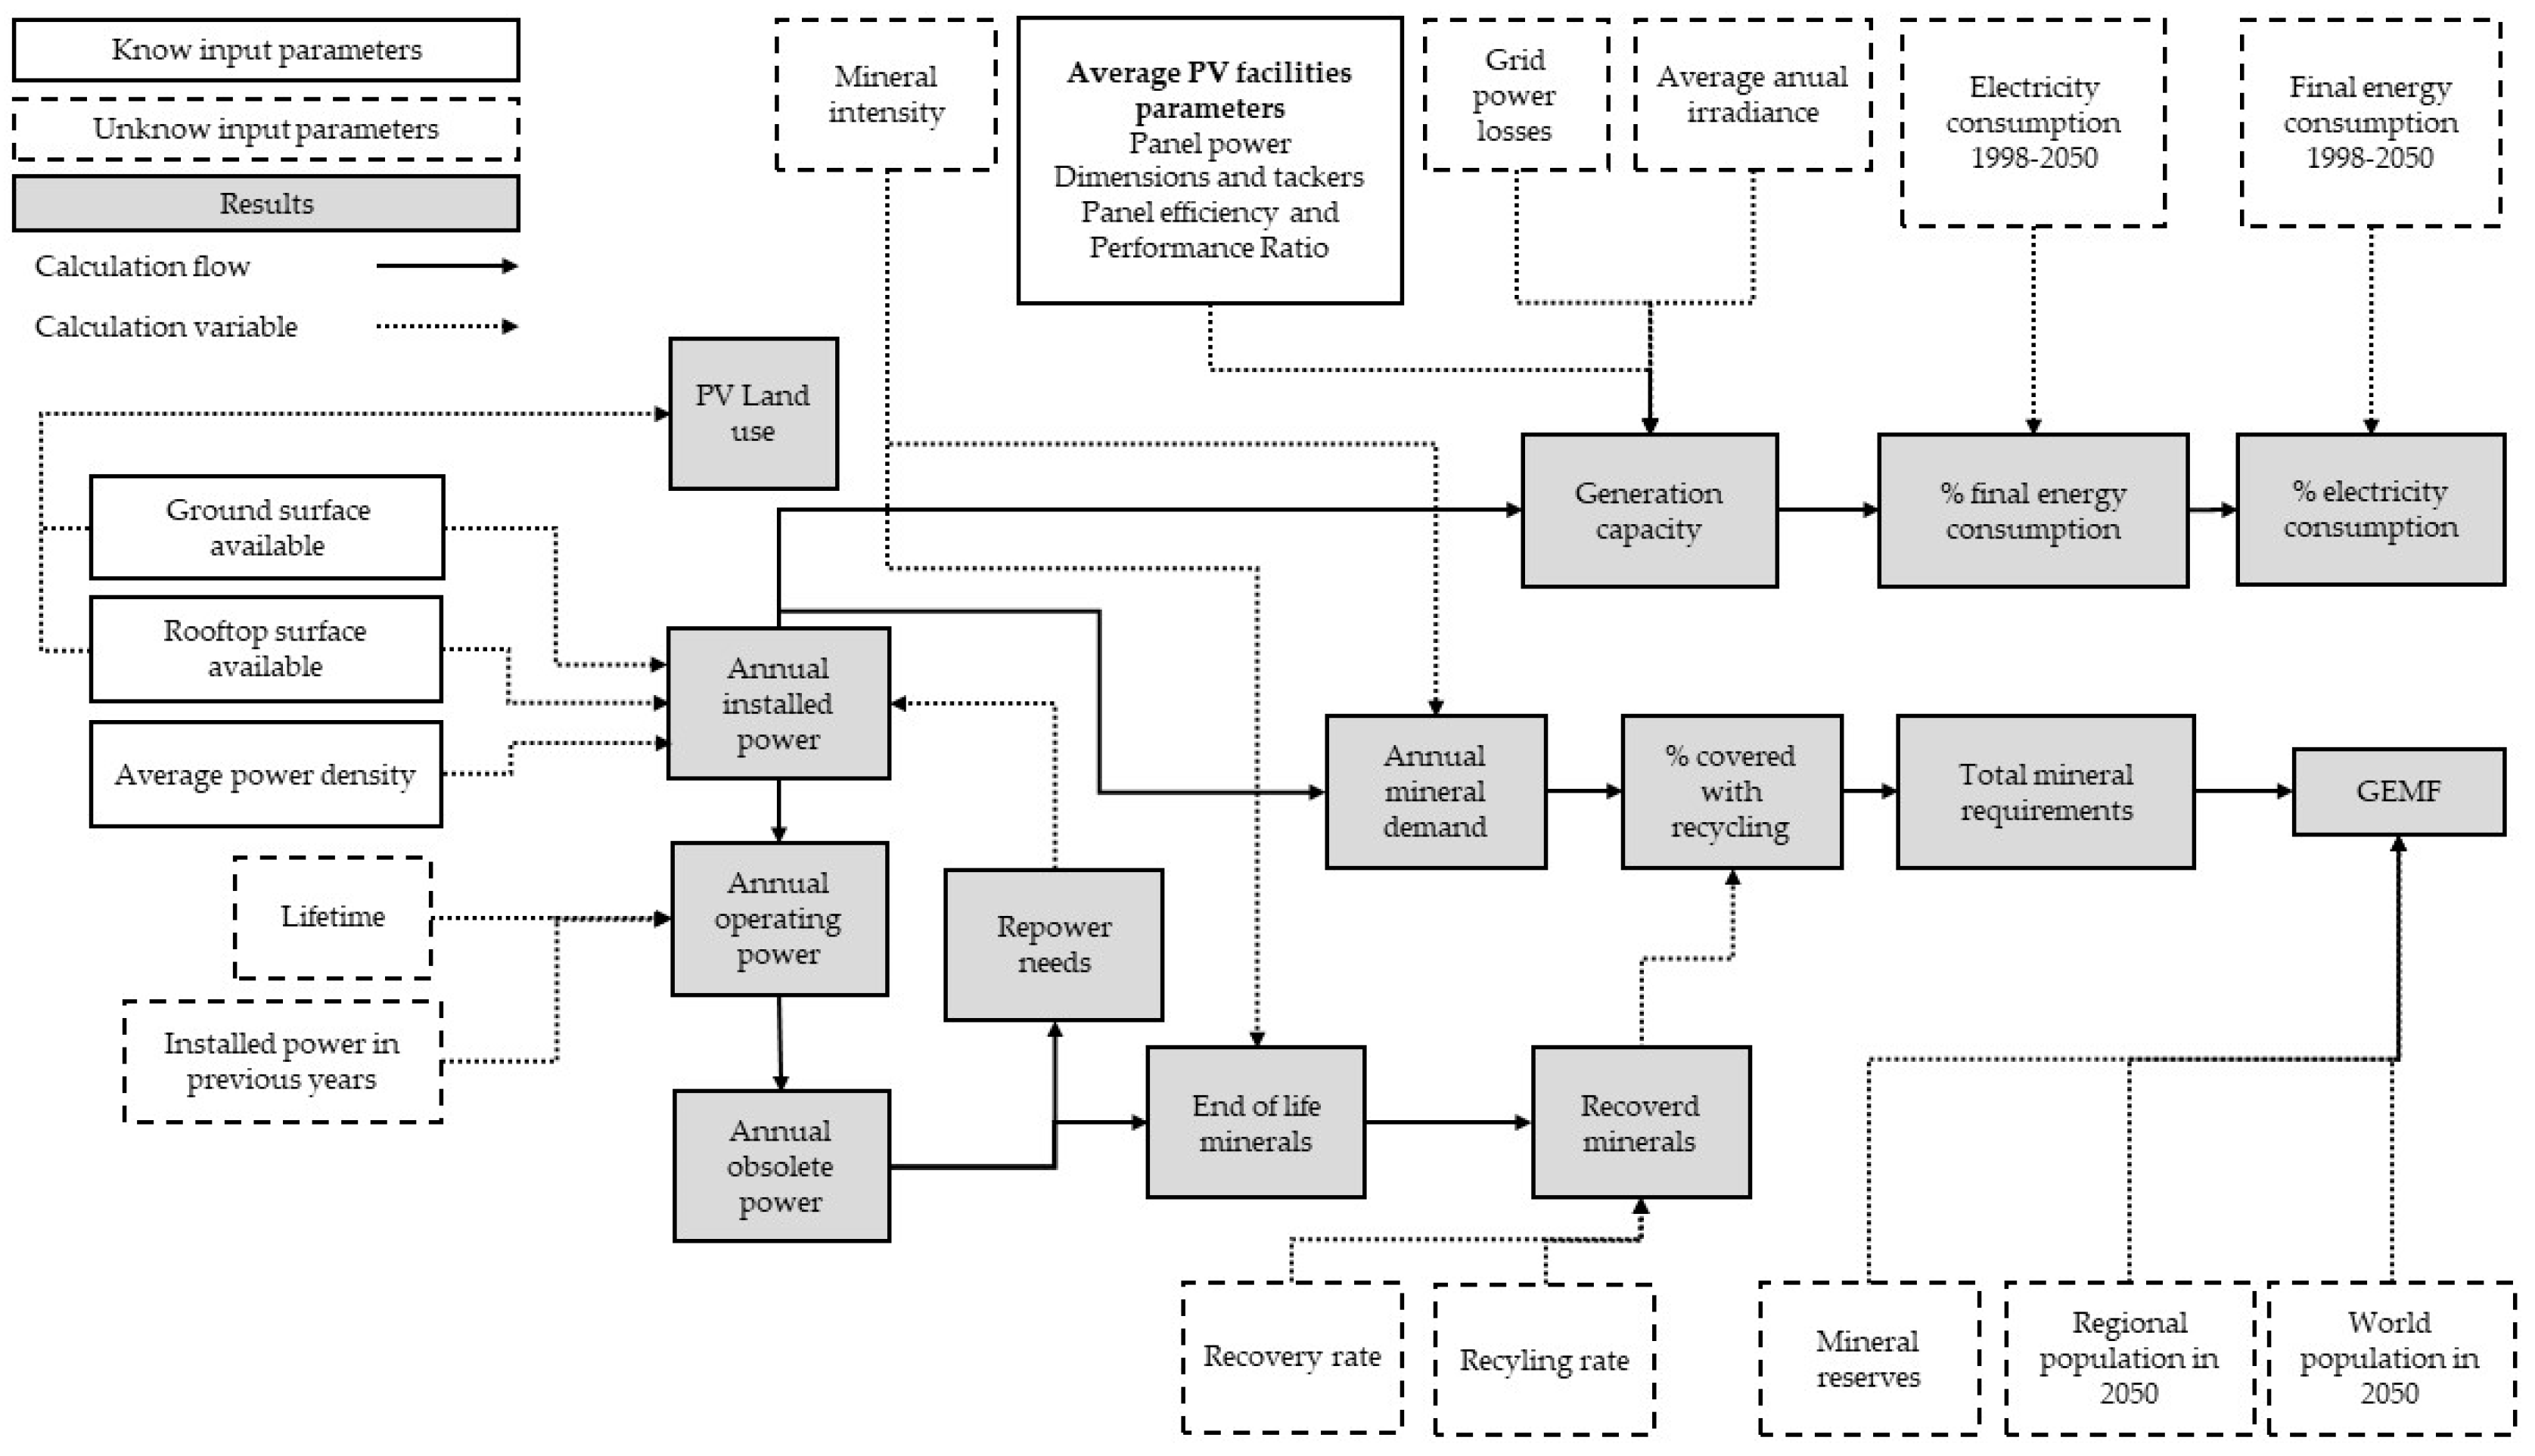
Figure 6.
Weibull probability distribution (Eq. 1) considering k=2.4928 and λ=30 years.
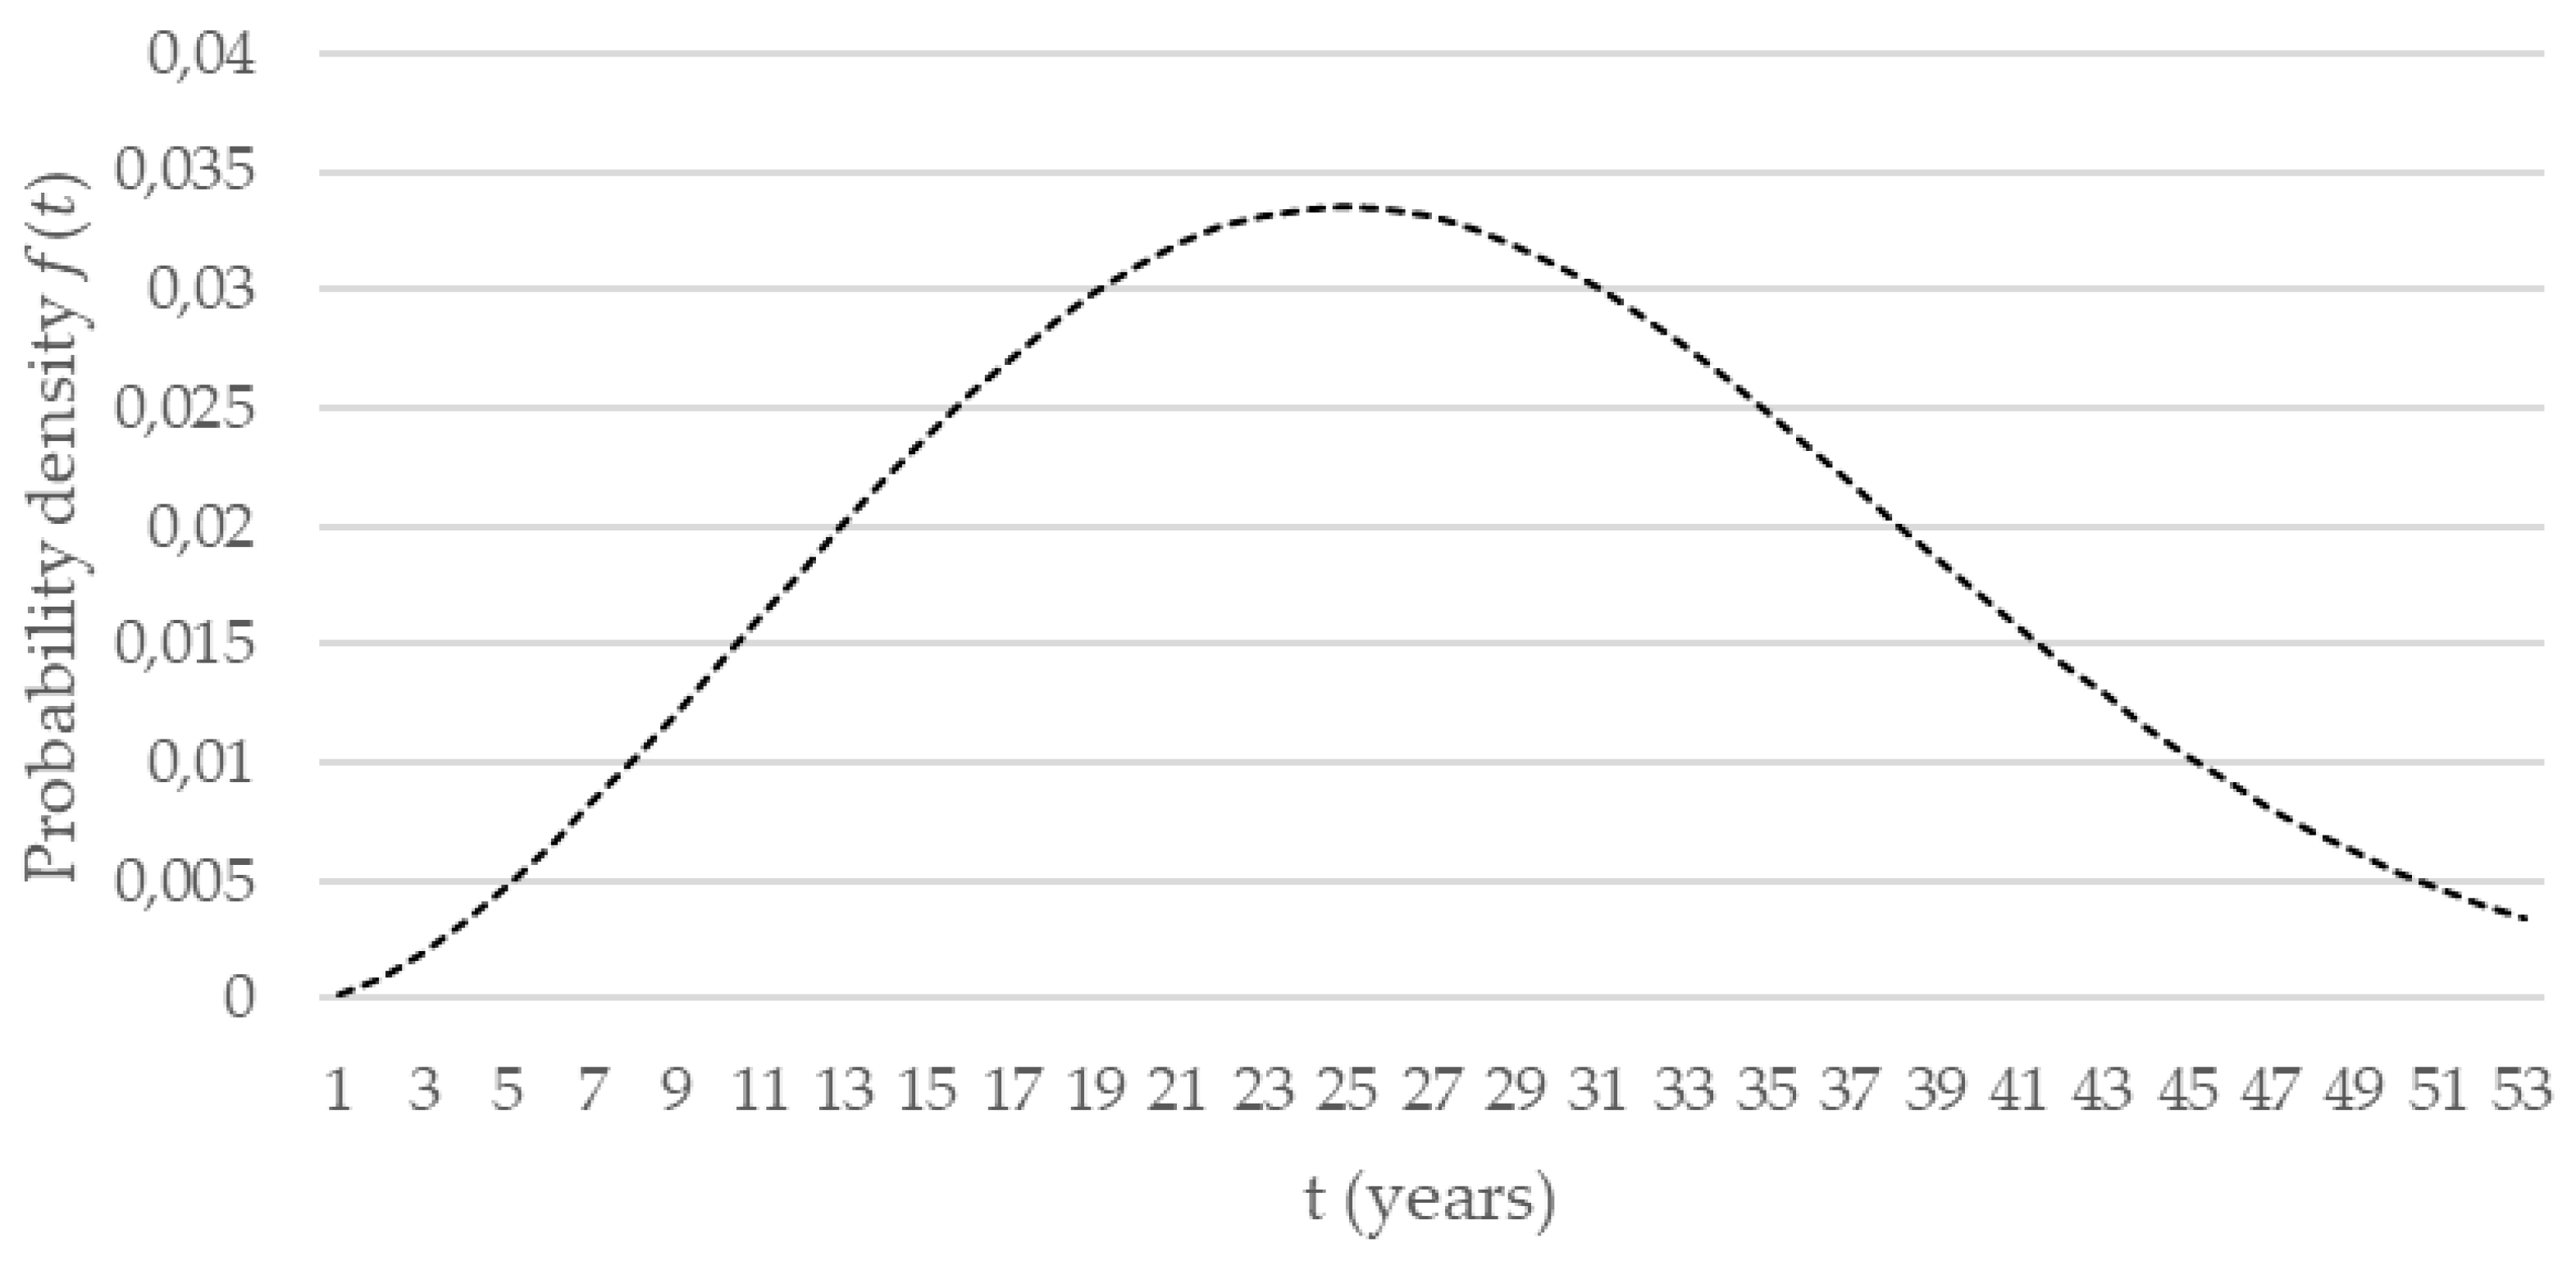
Figure 7.
Annual ground installed power estimated in each iteration.
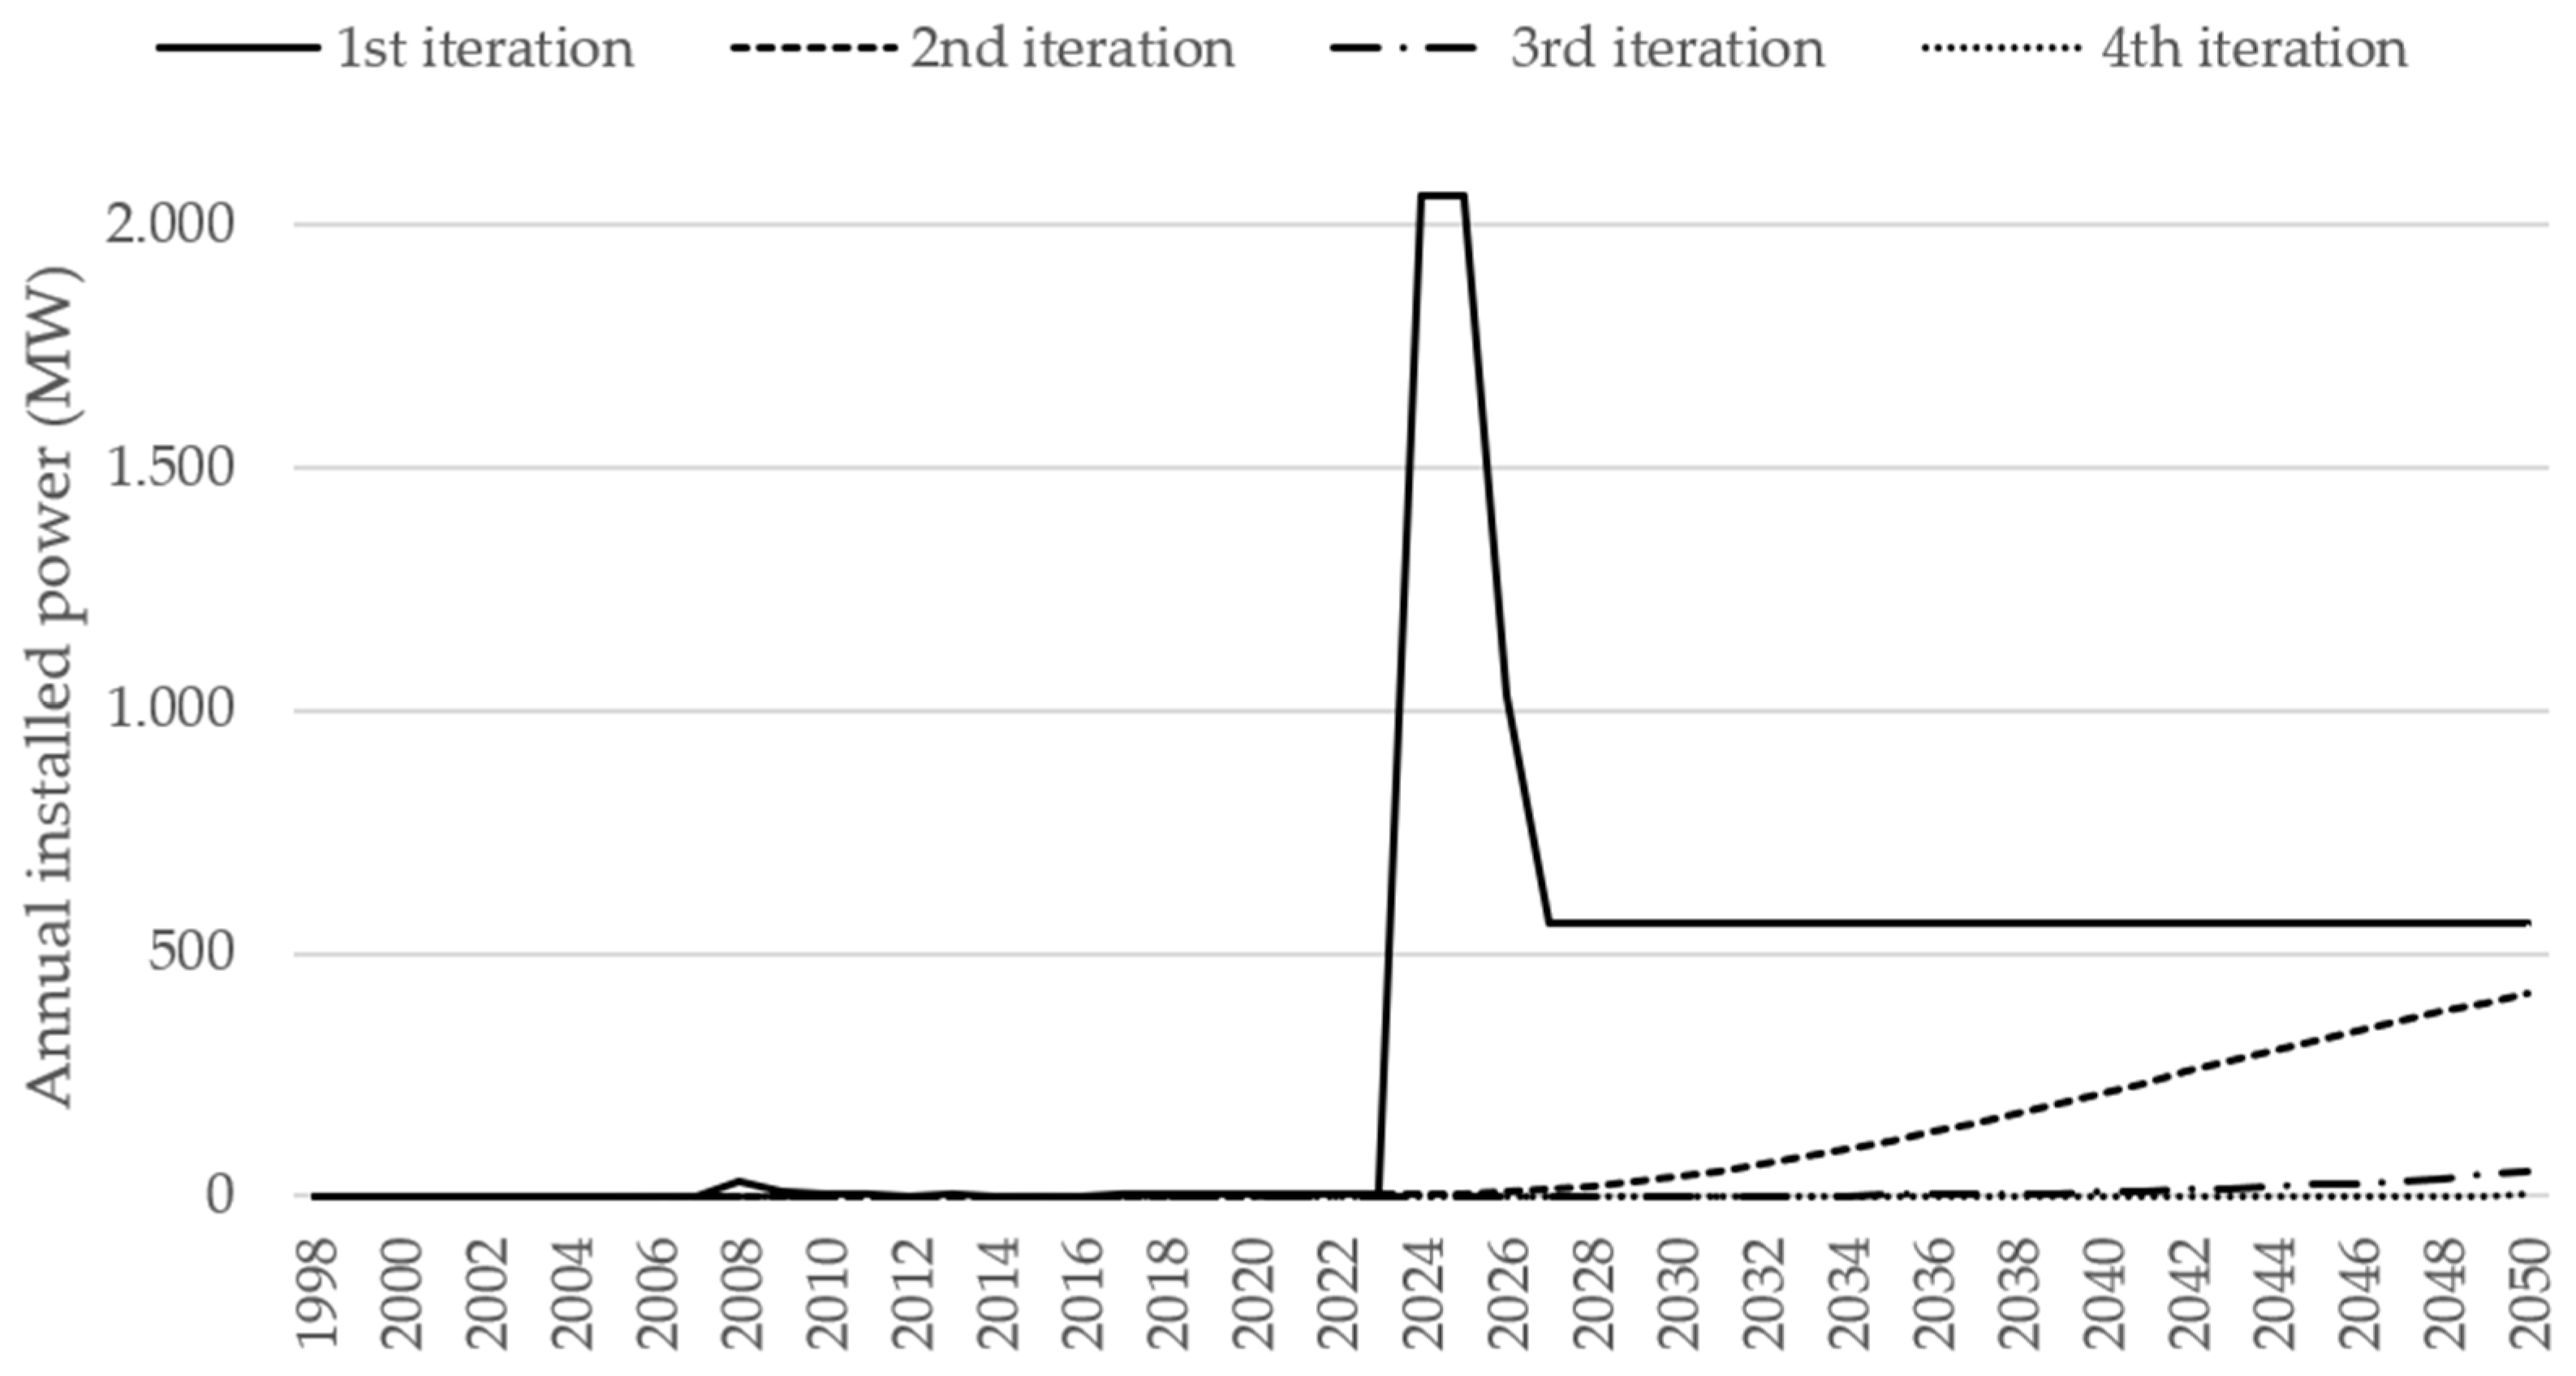
Figure 8.
Annual rooftop installed power estimated in each iteration.
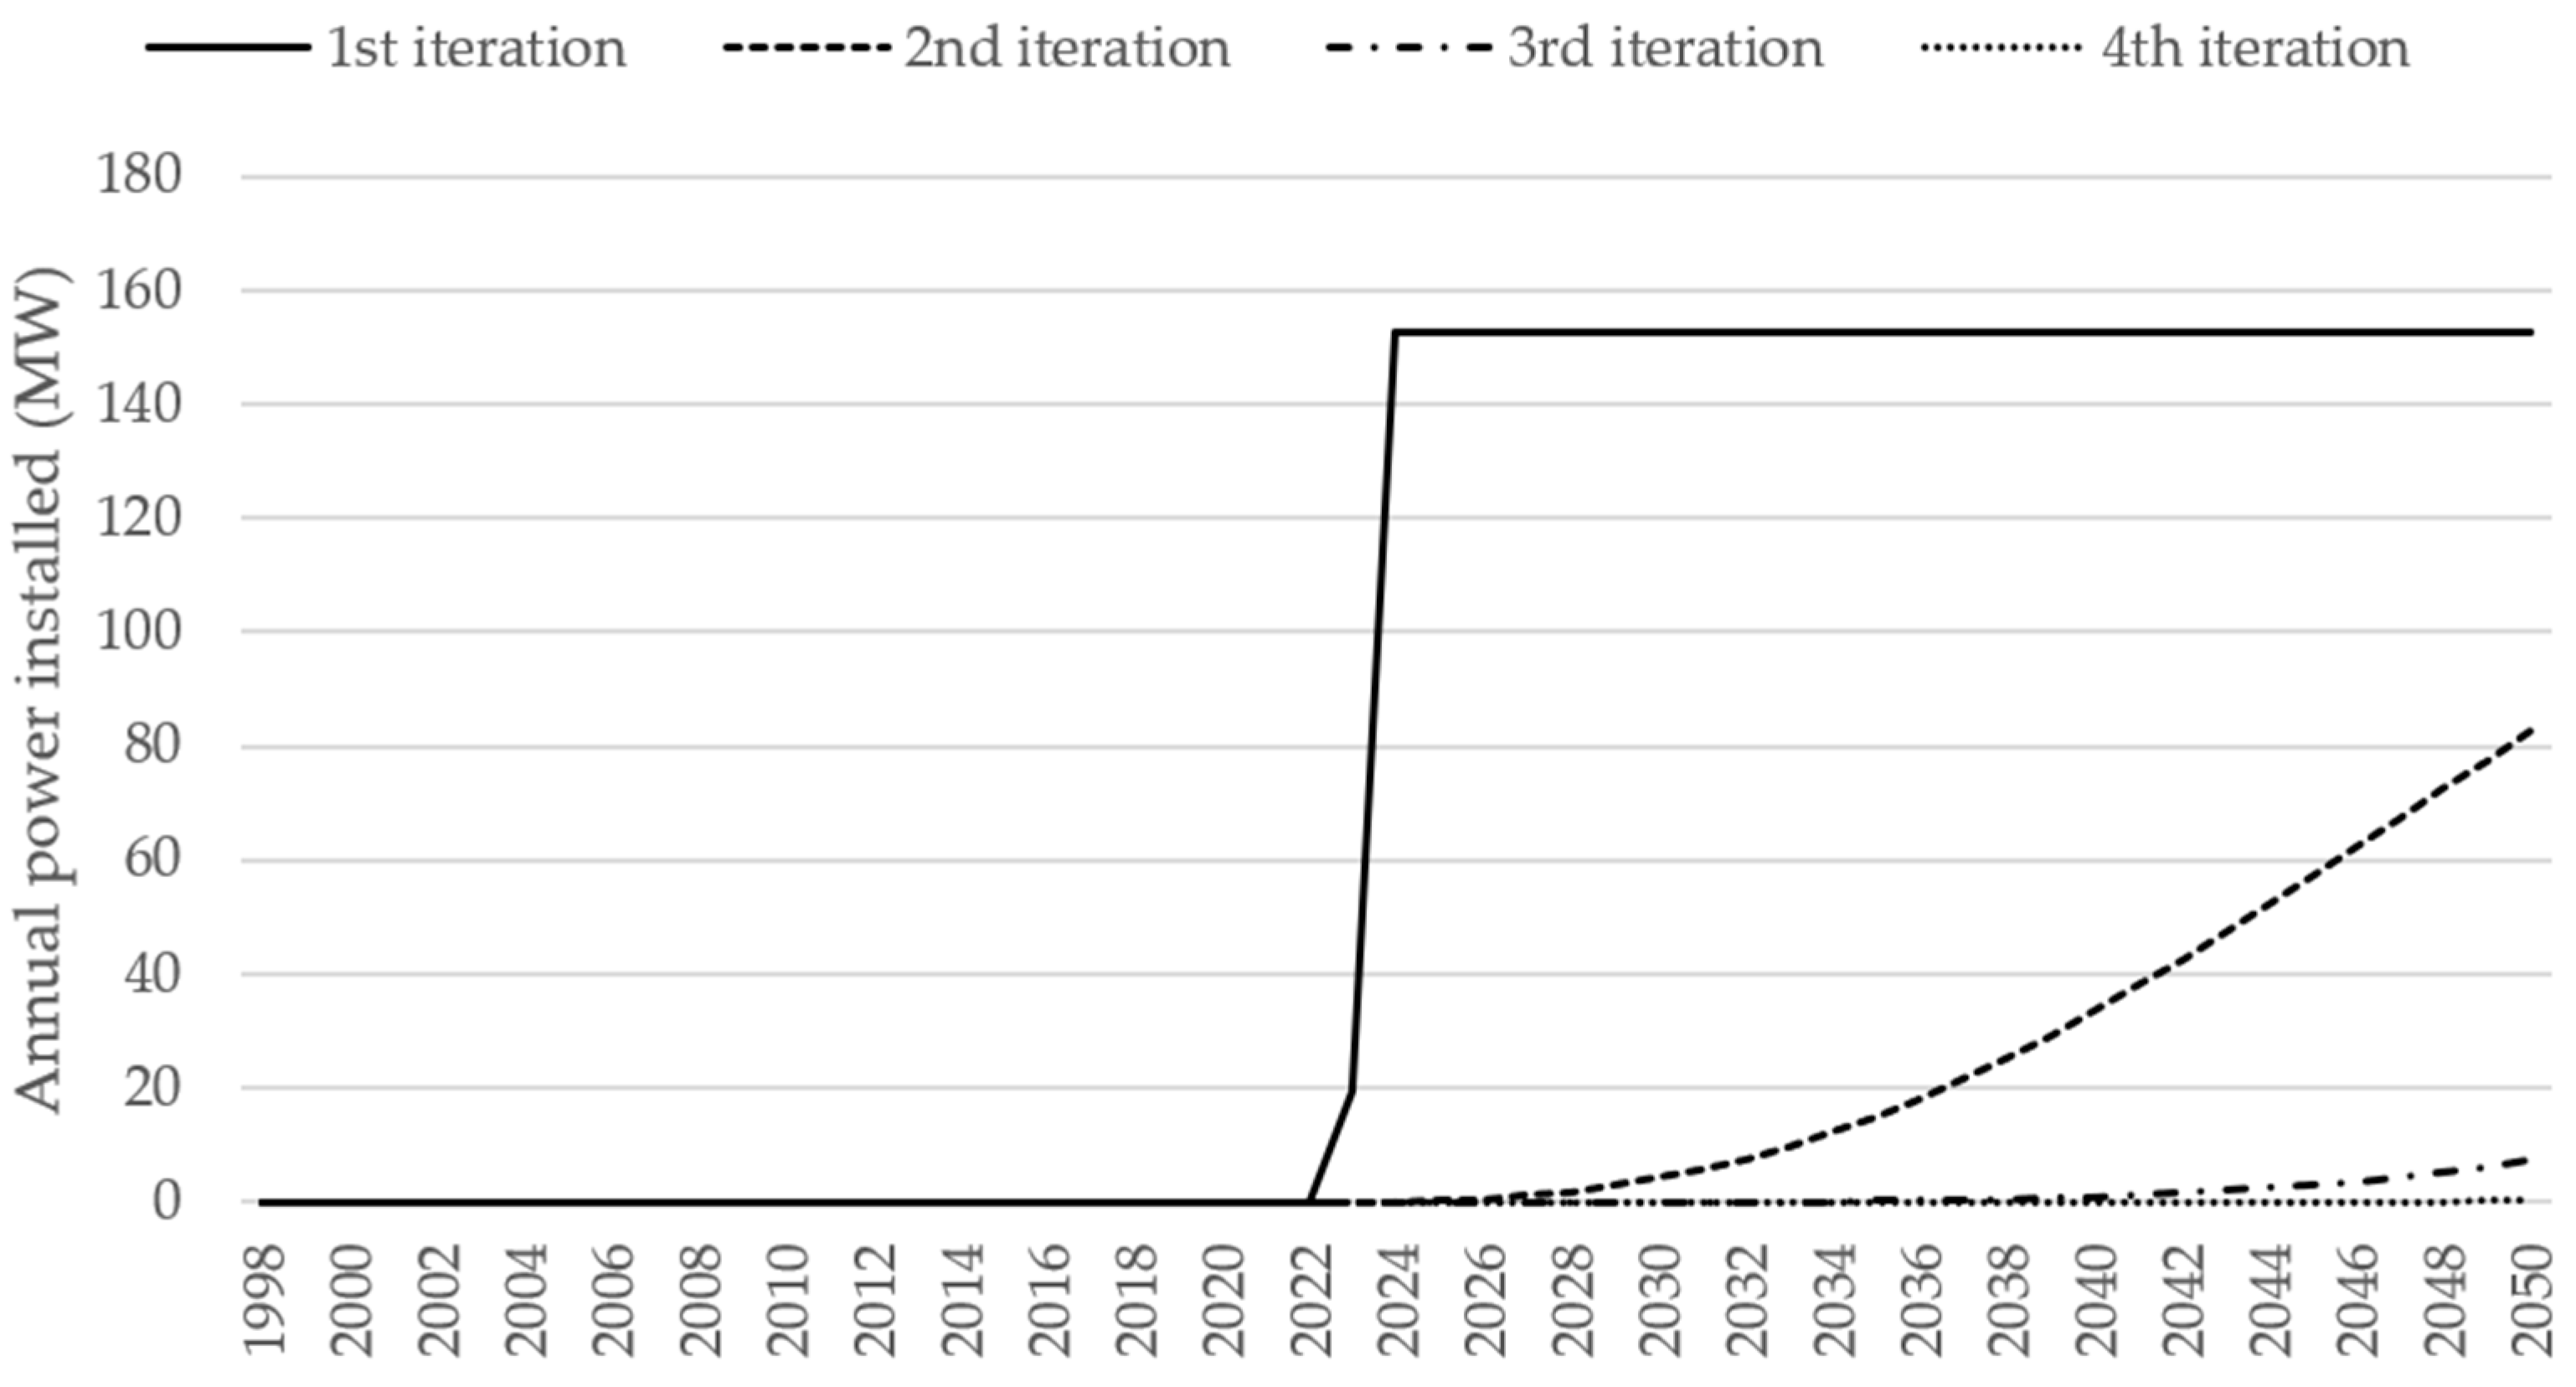
Figure 9.
Estimation of final energy consumption and electricity consumption in the Community of Madrid between 1998 and 2050.
Figure 9.
Estimation of final energy consumption and electricity consumption in the Community of Madrid between 1998 and 2050.
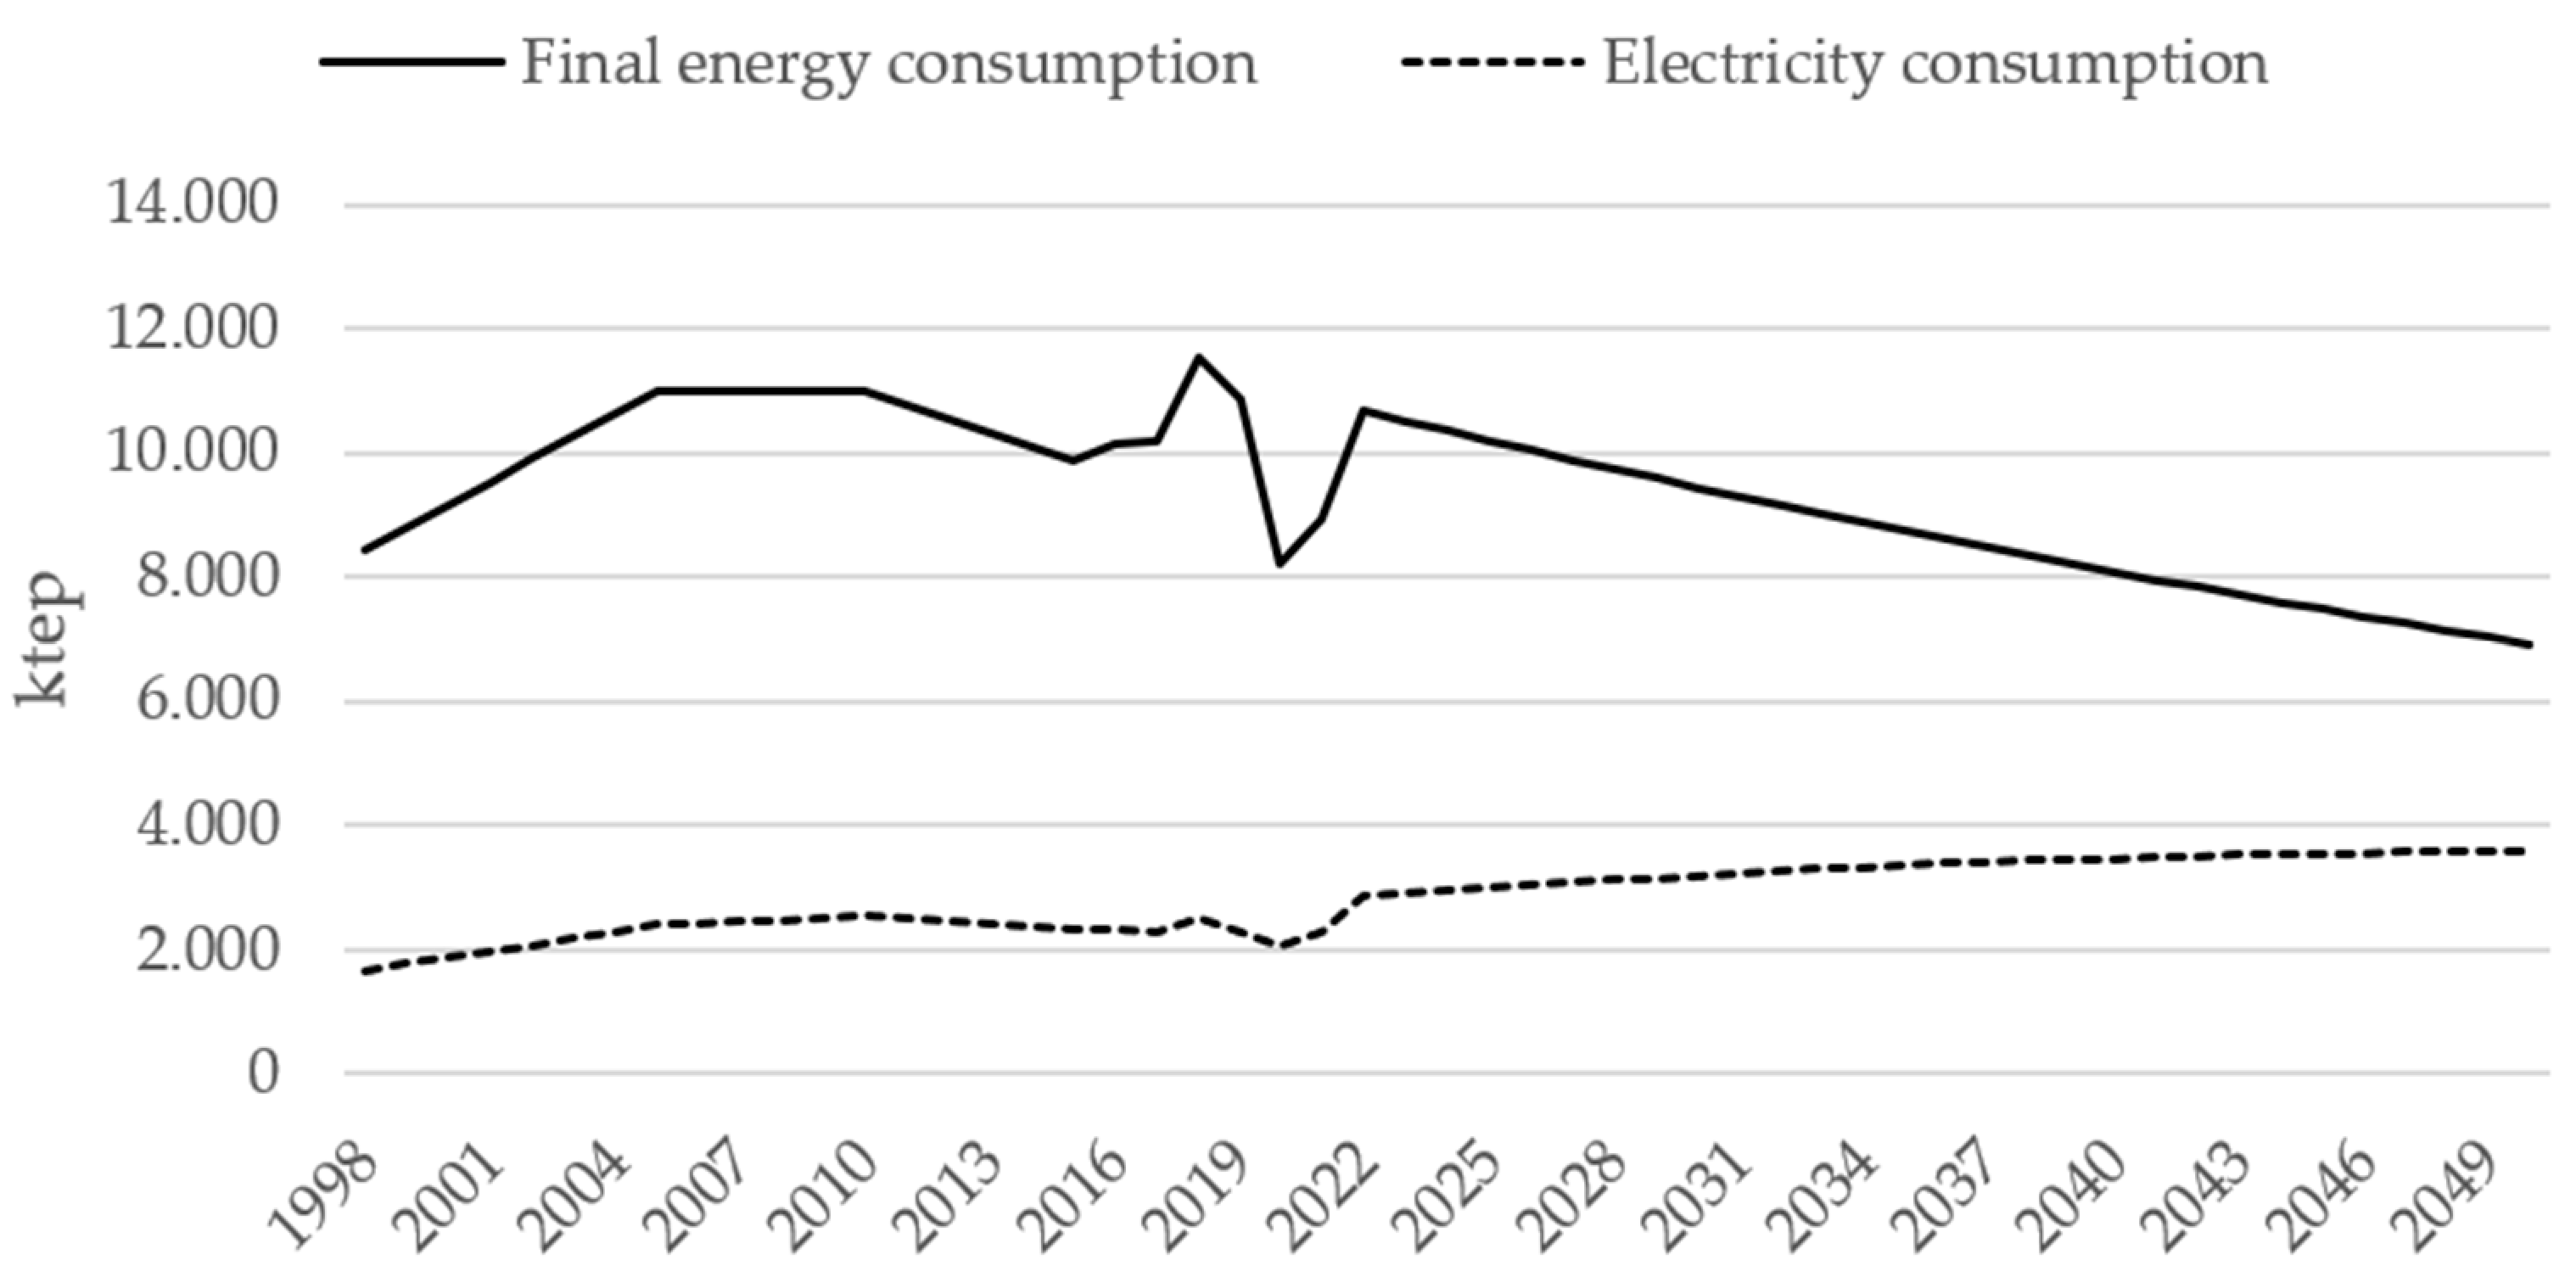
Figure 10.
Ground surface available for PV generation. Source: Own elaboration.
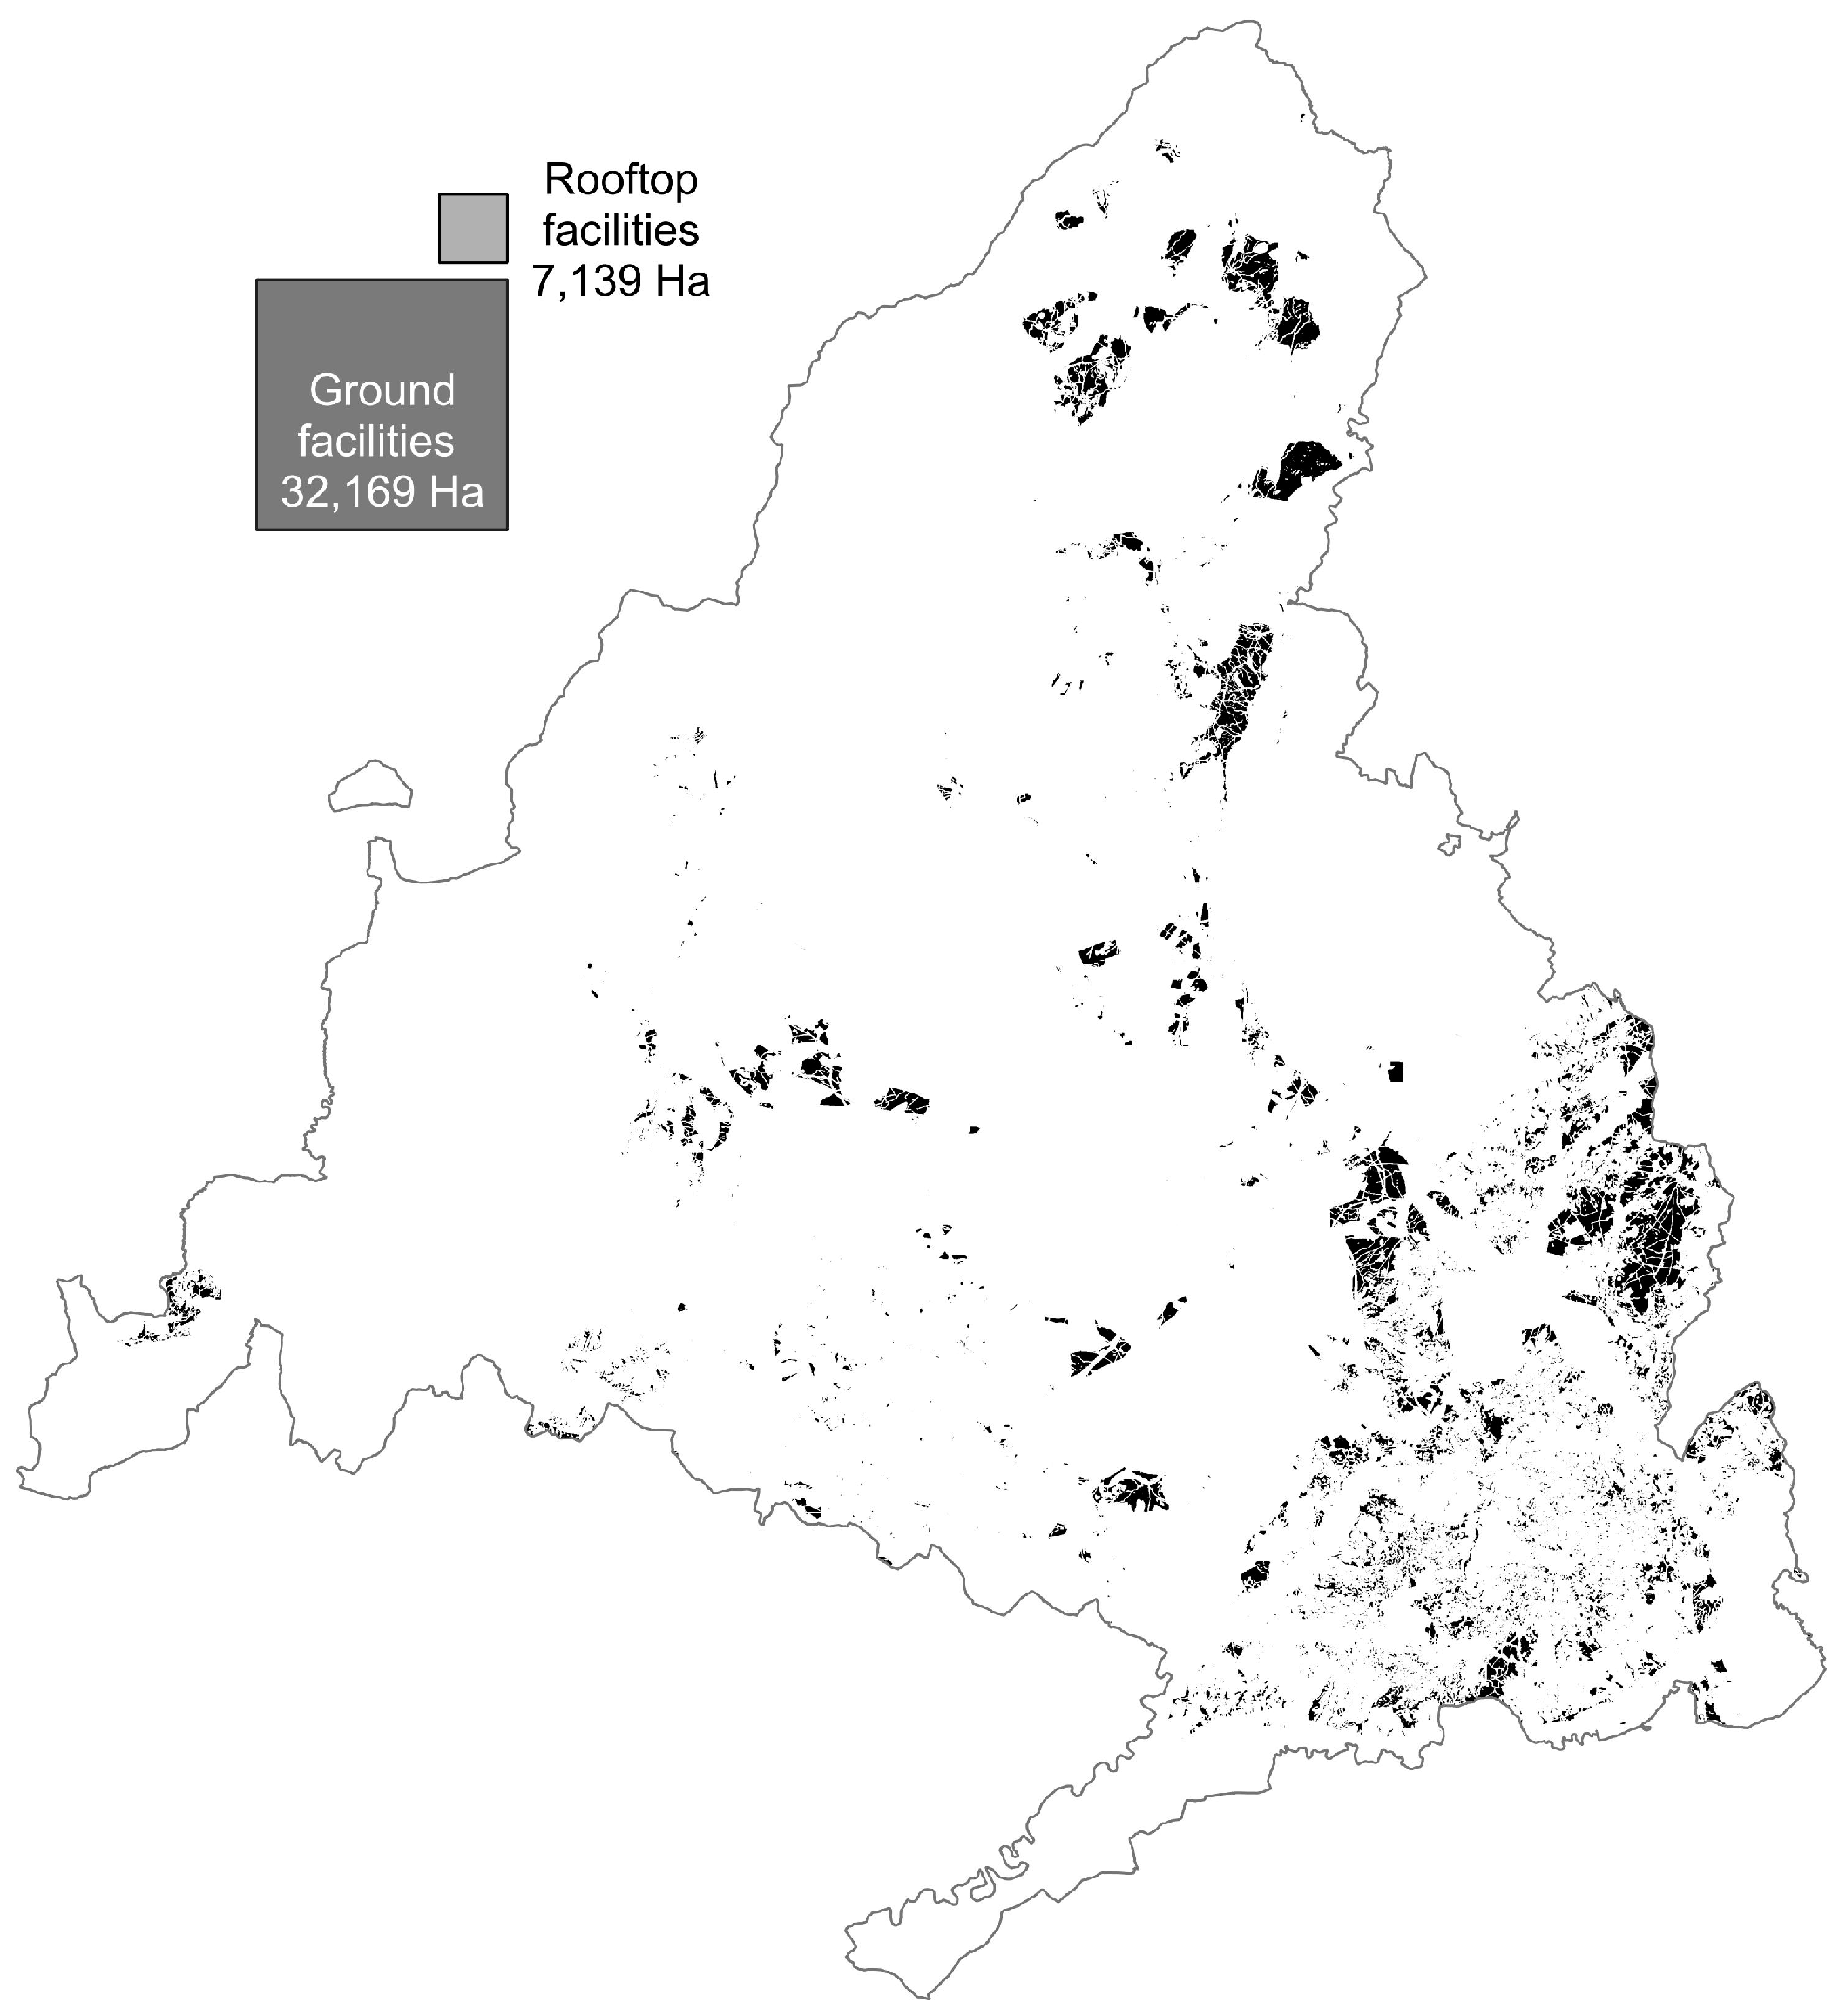
Figure 11.
Figure 11. Rooftop surface available for PV generation. Source: Own elaboration.
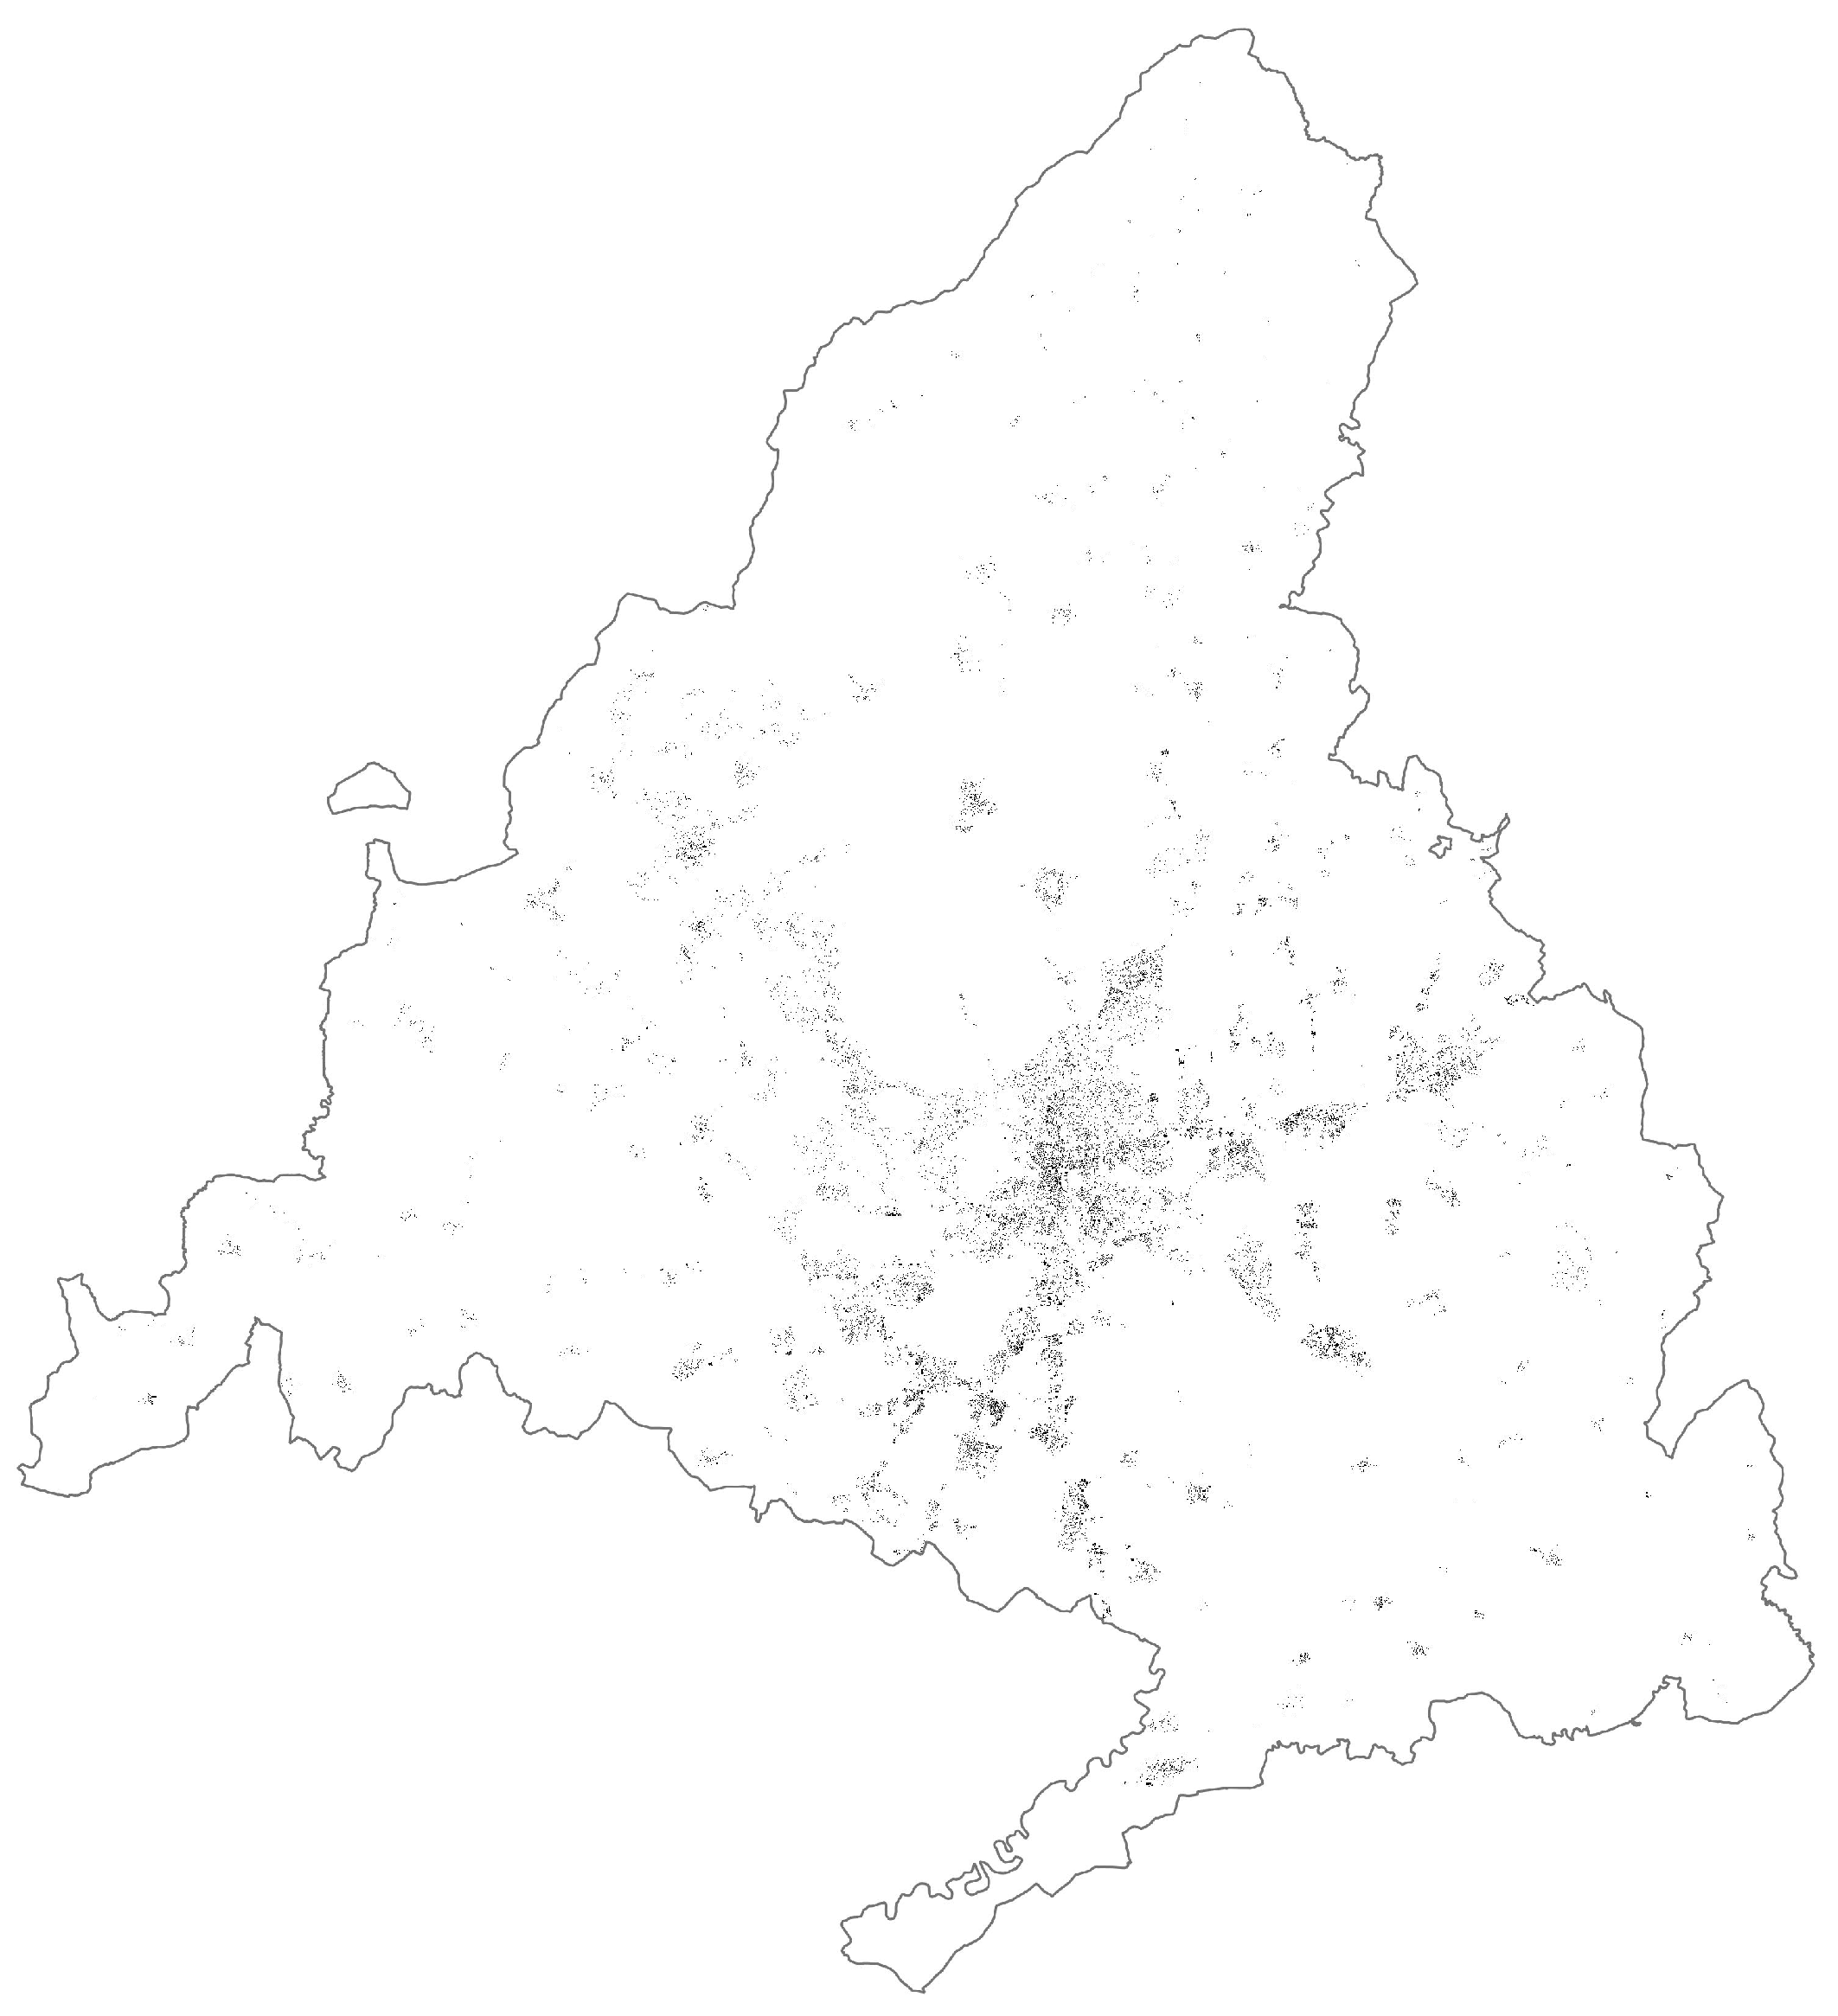
Figure 12.
Land uses of the area considered potentially suitable for the installation of photovoltaic plants.
Figure 12.
Land uses of the area considered potentially suitable for the installation of photovoltaic plants.
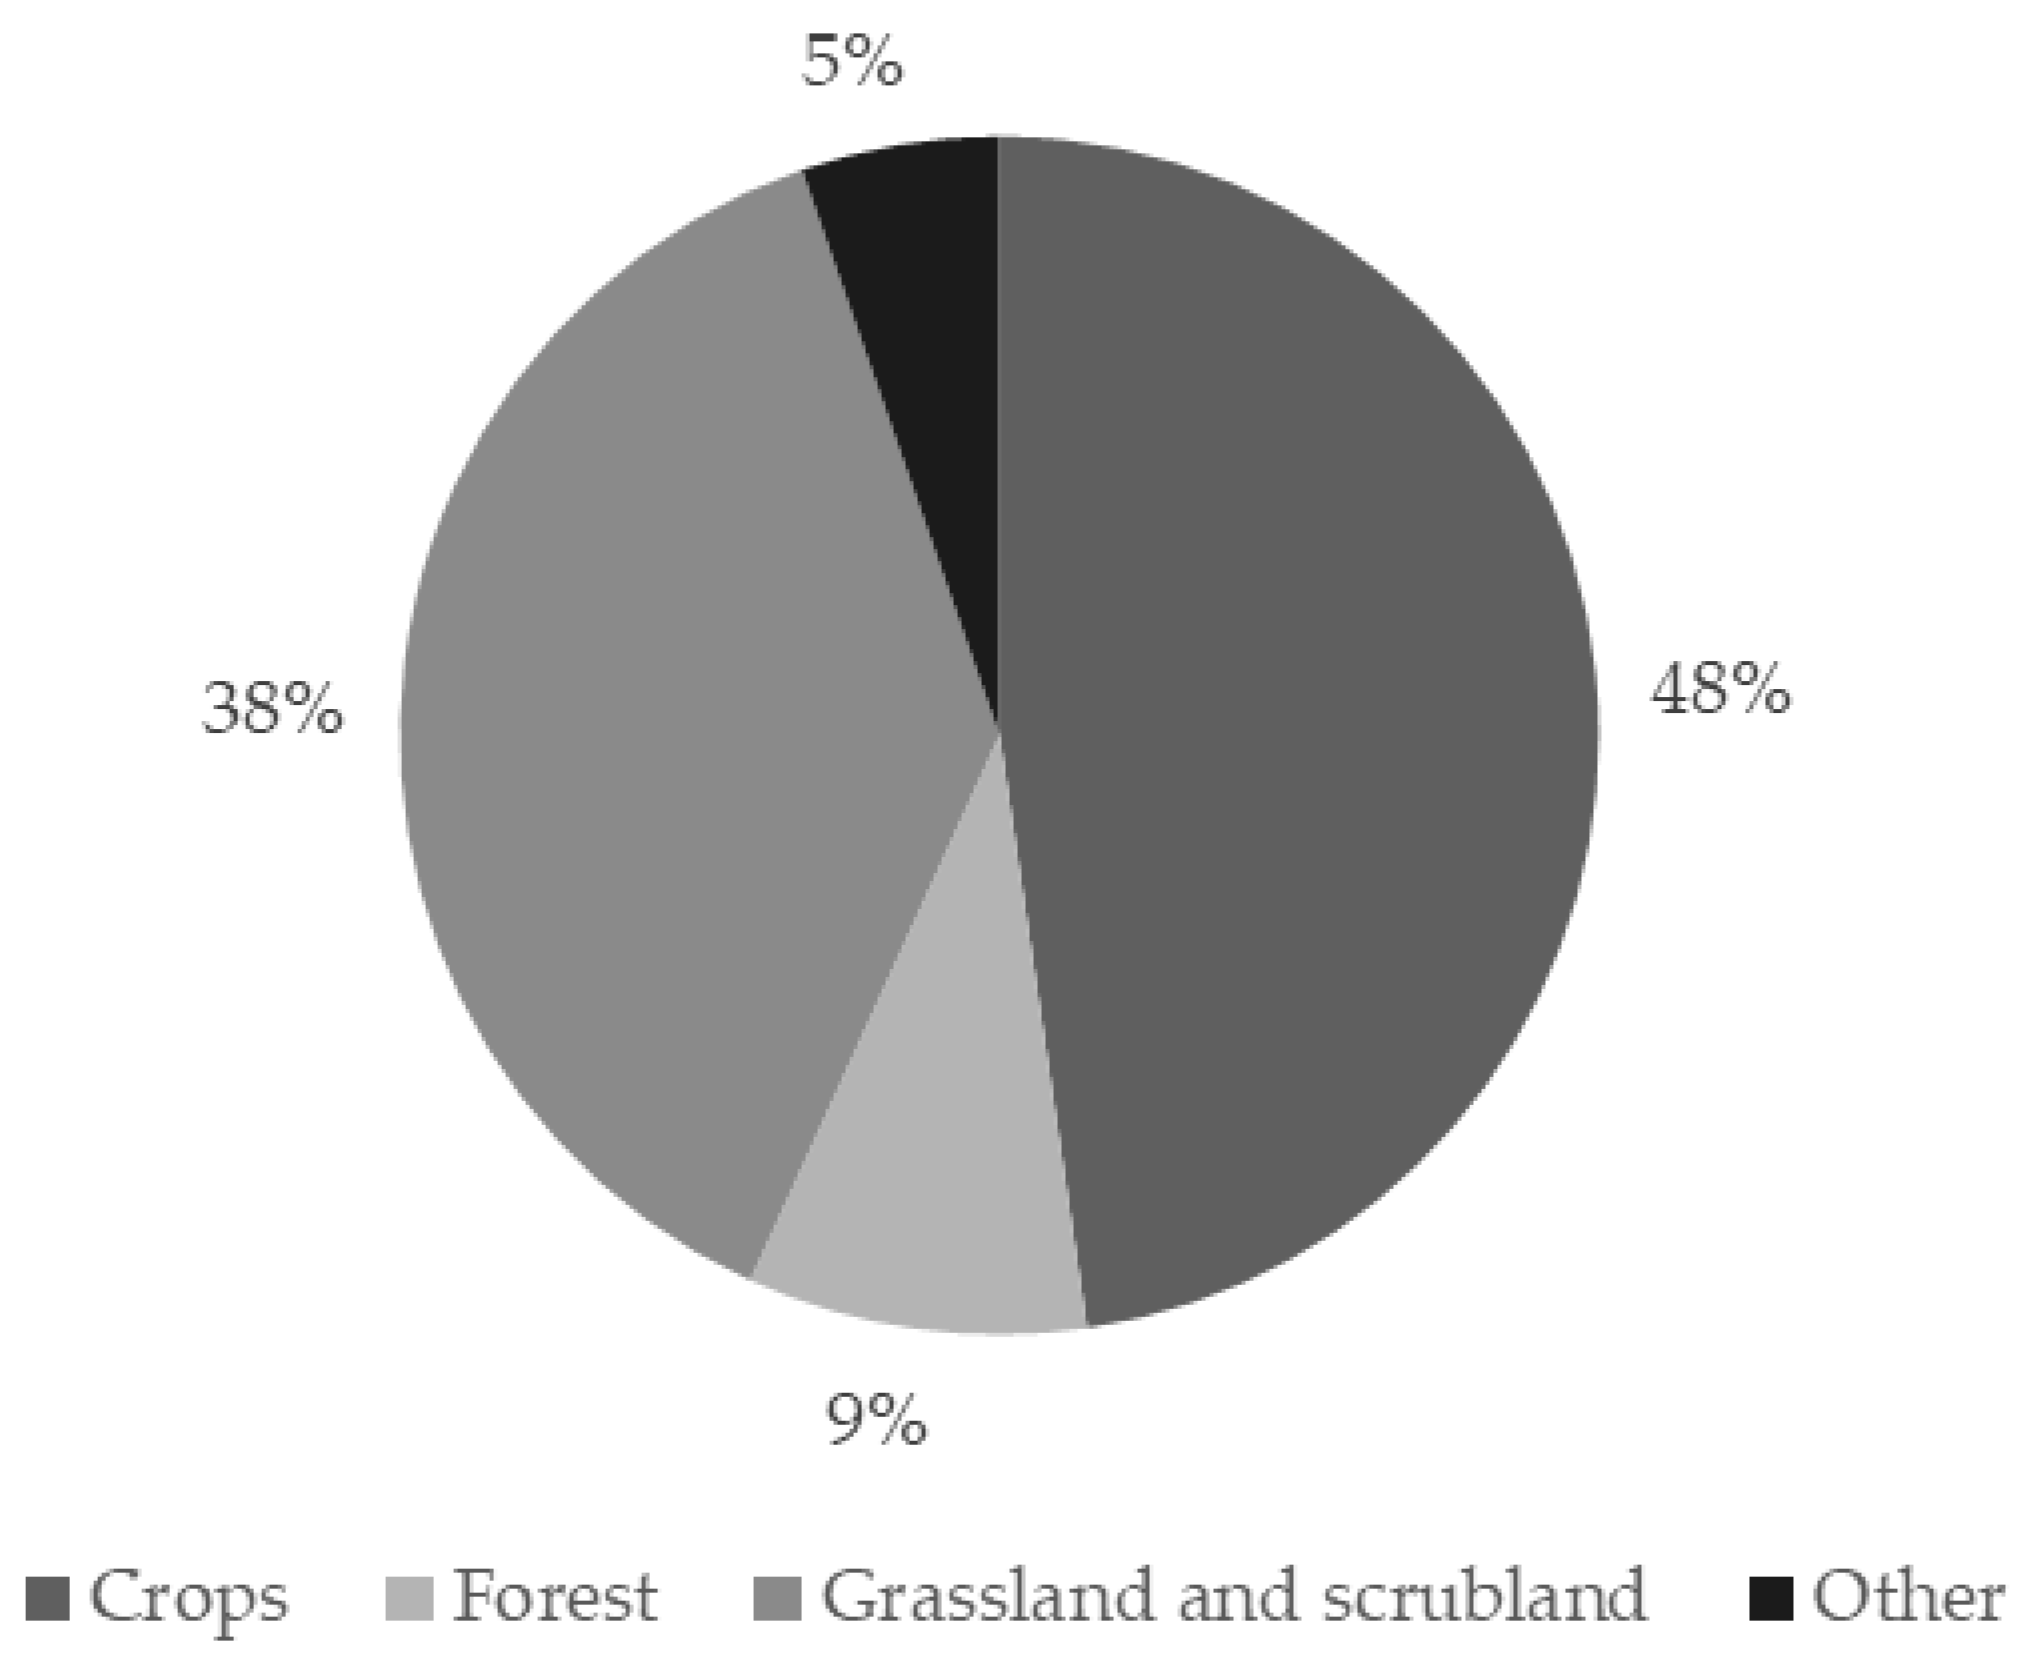
Figure 13.
Photovoltaic generation capacity versus electricity consumption and primary energy consumption (1998-2050).
Figure 13.
Photovoltaic generation capacity versus electricity consumption and primary energy consumption (1998-2050).
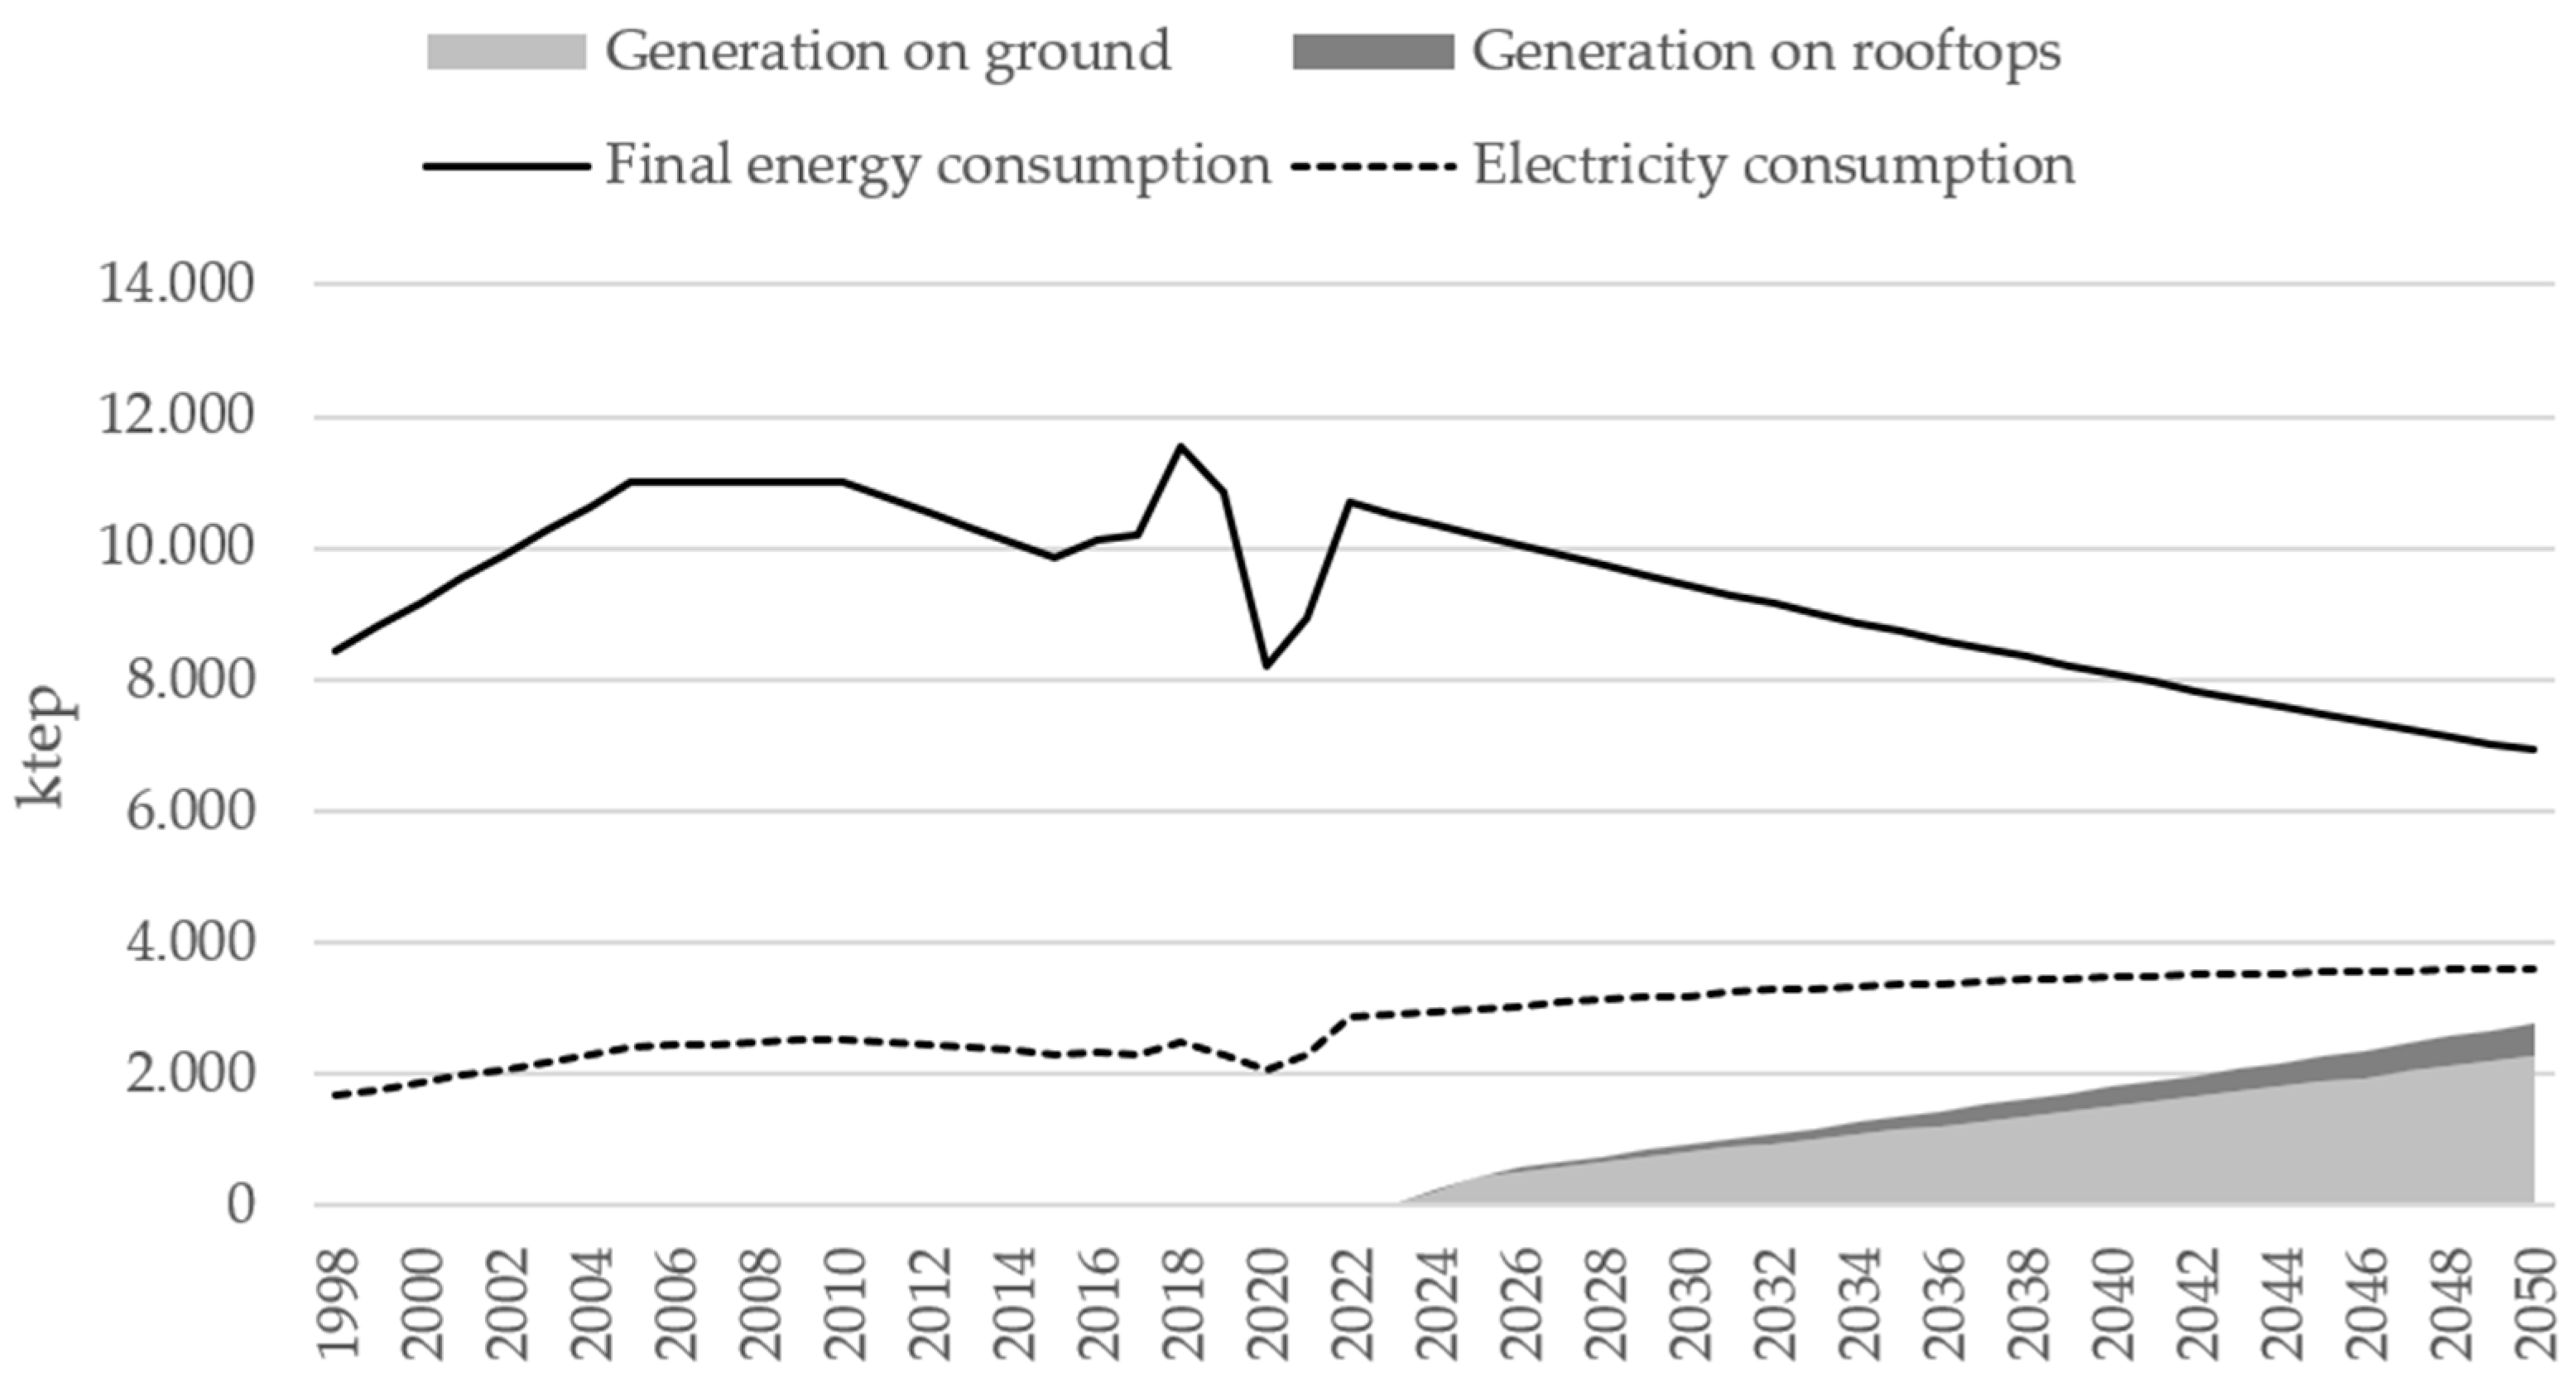
Figure 14.
Estimated cumulative material consumption (1998-2050).
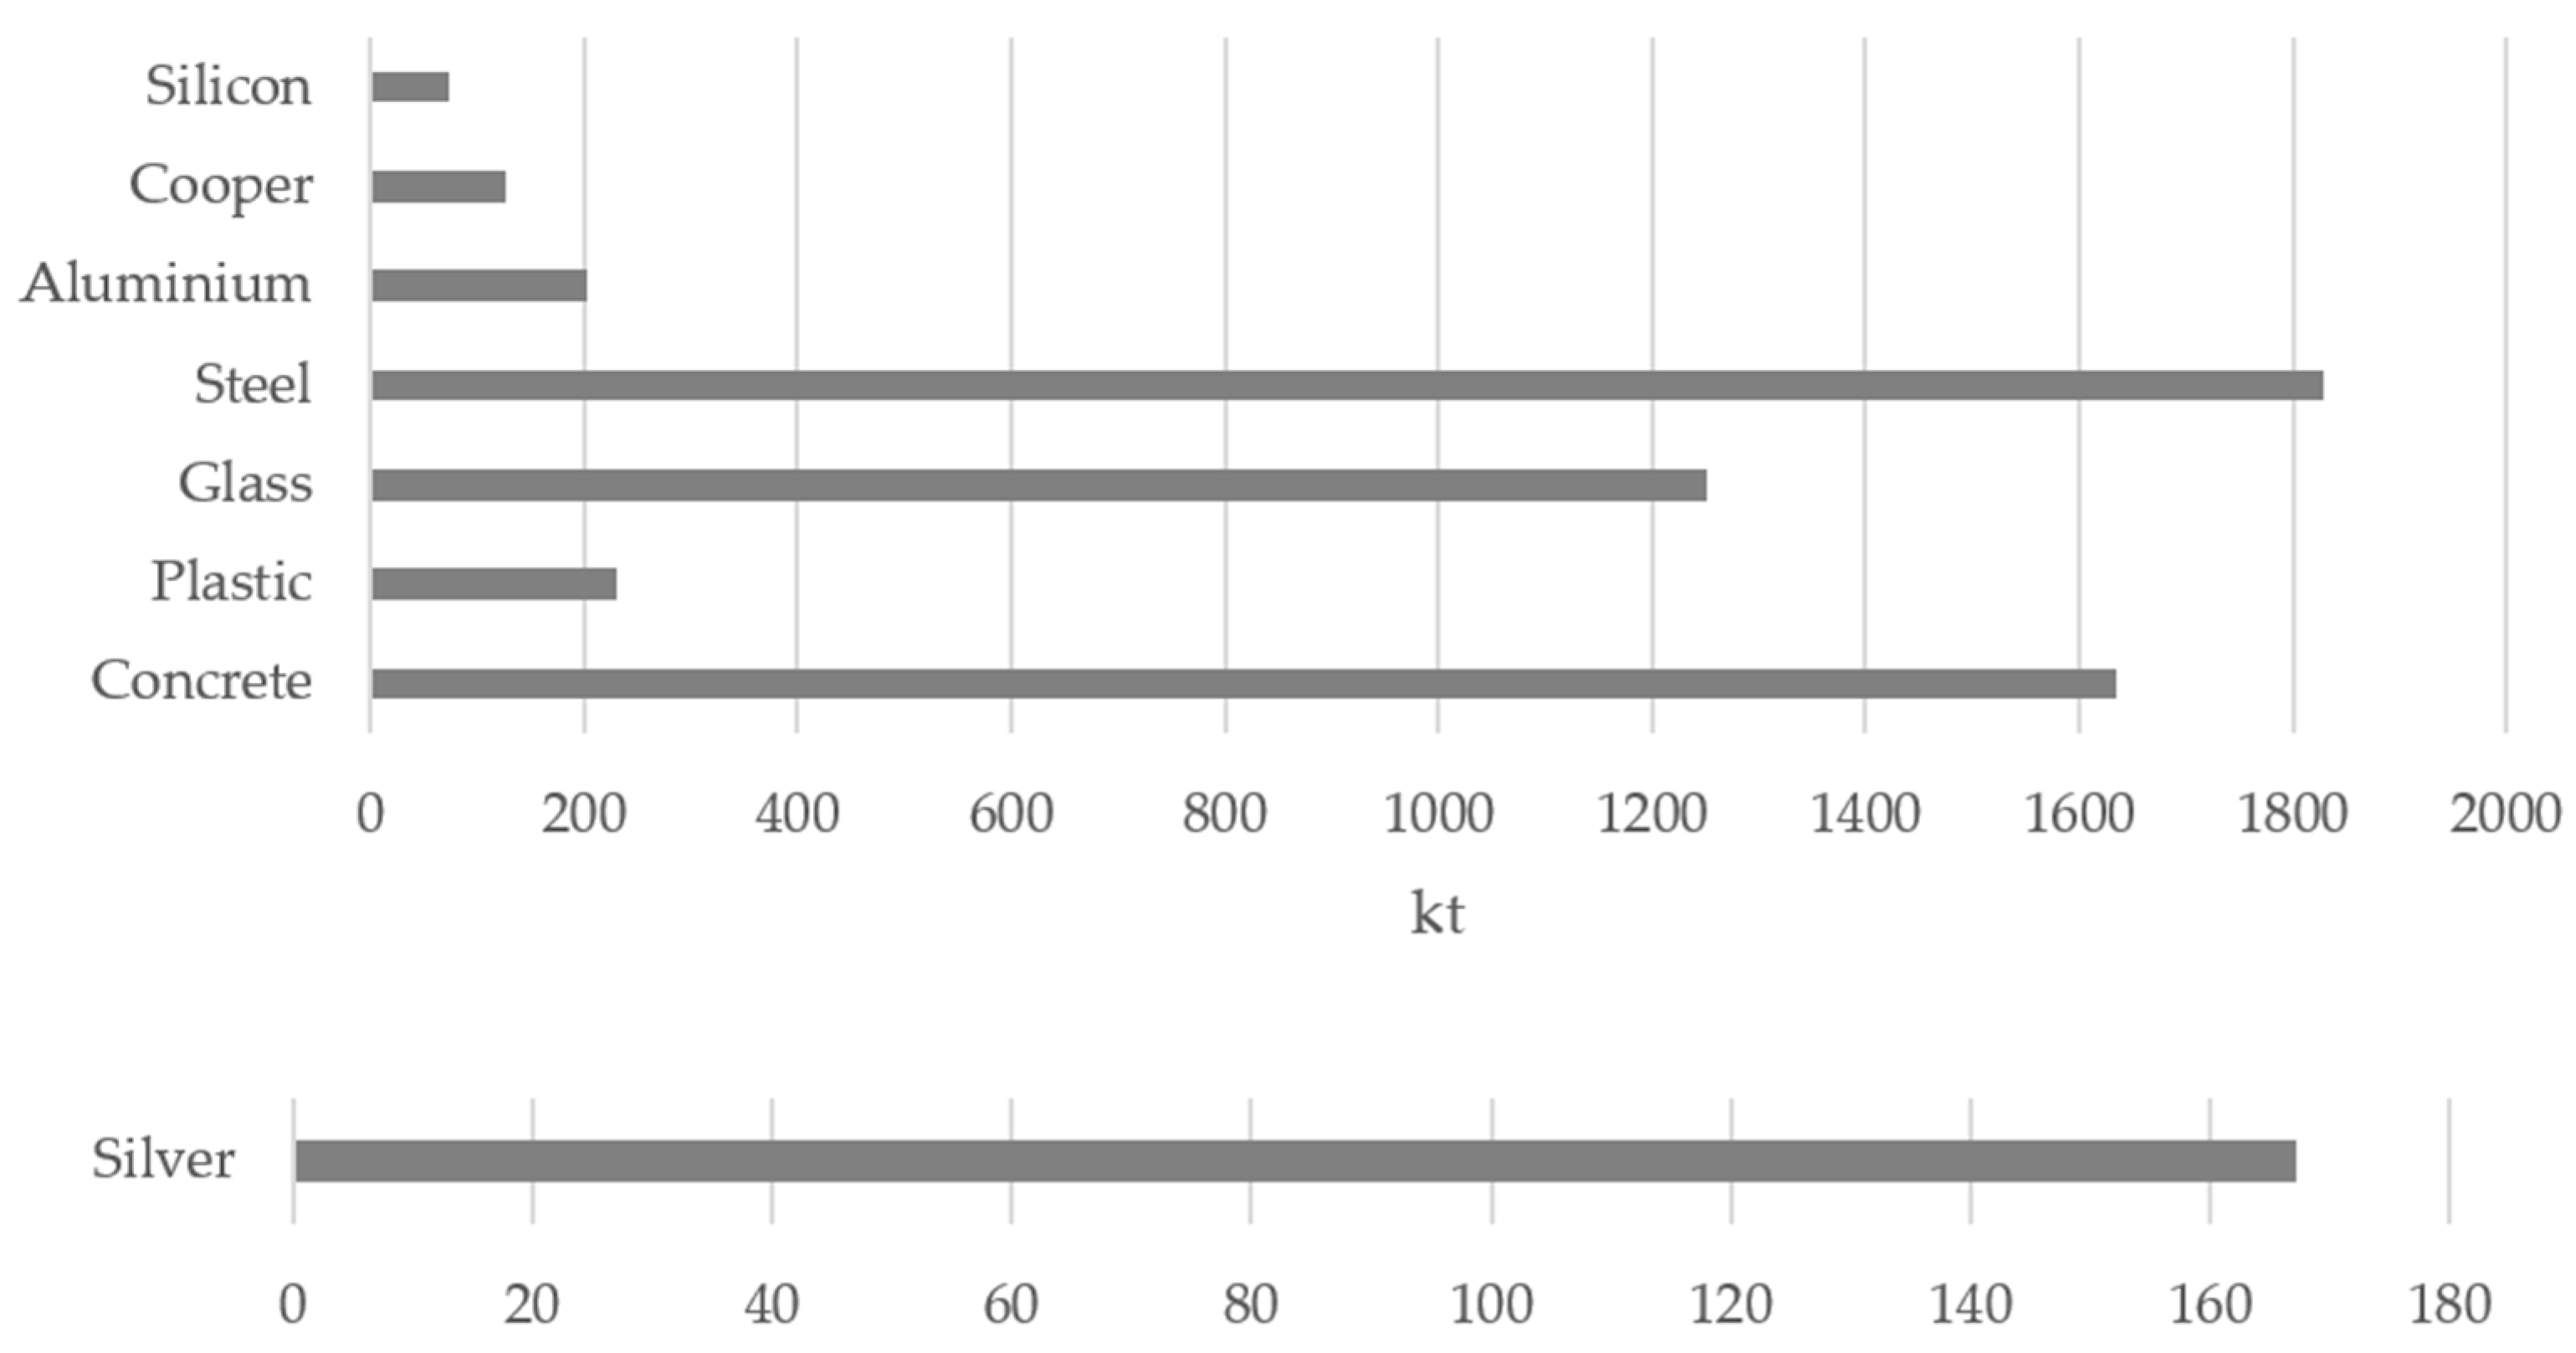
Table 3.
Material intensity considered in the MFA based on (40) (t/MW).
| Year | Concrete | Plastic | Glass | Aluminum | Cooper | Silicon | Steel | Silver |
|---|---|---|---|---|---|---|---|---|
| 2018 | 60.70 | 8.60 | 46.40 | 7.50 | 4.60 | 4 | 67.90 | 0.020 |
| 2030 | 58.40 | 8.30 | 44.70 | 7.20 | 4.50 | 2.75 | 65.30 | 0.006 |
| 2050 | 54.60 | 7.70 | 41.80 | 6.80 | 4.20 | 2 | 61.10 | 0.002 |
Table 4.
Collection and recycling rates considered in the MFA based on [42] for aluminum, copper, and silver; [45] for steel and [44,45] for silicon
| Year | Collection rate | Recycling rate | |||
| Aluminum | Cooper | Silicon | Steel | ||
| 2020 | 65% | 75% | 35% | 90% | 80% |
| 2030 | 72% | 77% | 77% | 95% | 85% |
| 2040 | 78% | 78% | 78% | 95% | 90% |
| 2050 | 85% | 80% | 80% | 95% | 95% |
Table 5.
Known reserves considered in the MFA based on (46).
| Aluminum | Cooper | Silicon |
| 30x109 | 83x107 | 56x104 |
Disclaimer/Publisher’s Note: The statements, opinions and data contained in all publications are solely those of the individual author(s) and contributor(s) and not of MDPI and/or the editor(s). MDPI and/or the editor(s) disclaim responsibility for any injury to people or property resulting from any ideas, methods, instructions or products referred to in the content. |
© 2025 by the authors. Licensee MDPI, Basel, Switzerland. This article is an open access article distributed under the terms and conditions of the Creative Commons Attribution (CC BY) license (http://creativecommons.org/licenses/by/4.0/).
Copyright: This open access article is published under a Creative Commons CC BY 4.0 license, which permit the free download, distribution, and reuse, provided that the author and preprint are cited in any reuse.


