
Submitted:
16 January 2025
Posted:
16 January 2025
You are already at the latest version
Abstract
Decarbonization of the electricity system coupled with electrification of transport, heat and industry represents a practical and cost-effective approach to deep decarbonization. A key question is: where to build new solar and wind farms? This study presents a cost-based approach to evaluate land parcels for solar and wind farm suitability using colour-coded heatmaps that visually depict favourable locations. An indicative cost of electricity is calculated for each pixel by focusing on key factors including resource availability, proximity to transmission infrastructure or load centres, and exclusion of sensitive areas. The proposed approach mitigates the subjectivity associated with traditional multi-criteria decision-making methods, in which both the selection of siting factors and the assignment of their associated weightings rely highly on the subjective judgments of experts. The methodology is applied to Australia, South Korea, and Indonesia, and the results are made publicly available to provide both qualitative and quantitative information that allows comparisons between regions and within a region. The study aims to empower policymakers, developers, communities and individual landholders to make informed decisions, and ultimately, facilitate strategic renewable energy deployment and contribute to global decarbonization.
Keywords:
1. Introduction
1.1. Background and Motivation
1.2. A Review of Siting Criteria for Solar and Wind Farms
1.3. Objectives and Novelties of this Study
- Develop public methodologies to reduce knowledge asymmetry between developers and landholders.
- Empower groups of landholders, perhaps with the support of local governments, to negotiate as a bloc. This can also assist the solar and wind farm developers by reducing the complexity and time required to gain legal access and community acceptance.
- Empower local governments to identify promising potential sites and attract solar and wind farm developers to their district to benefit from the associated economic activity.
- Assist state and regional governments and transmission companies to identify promising Renewable Energy Zones (REZ). This allows focus on a few regions for solar and wind farms, including the provision of new or upgraded transmission.
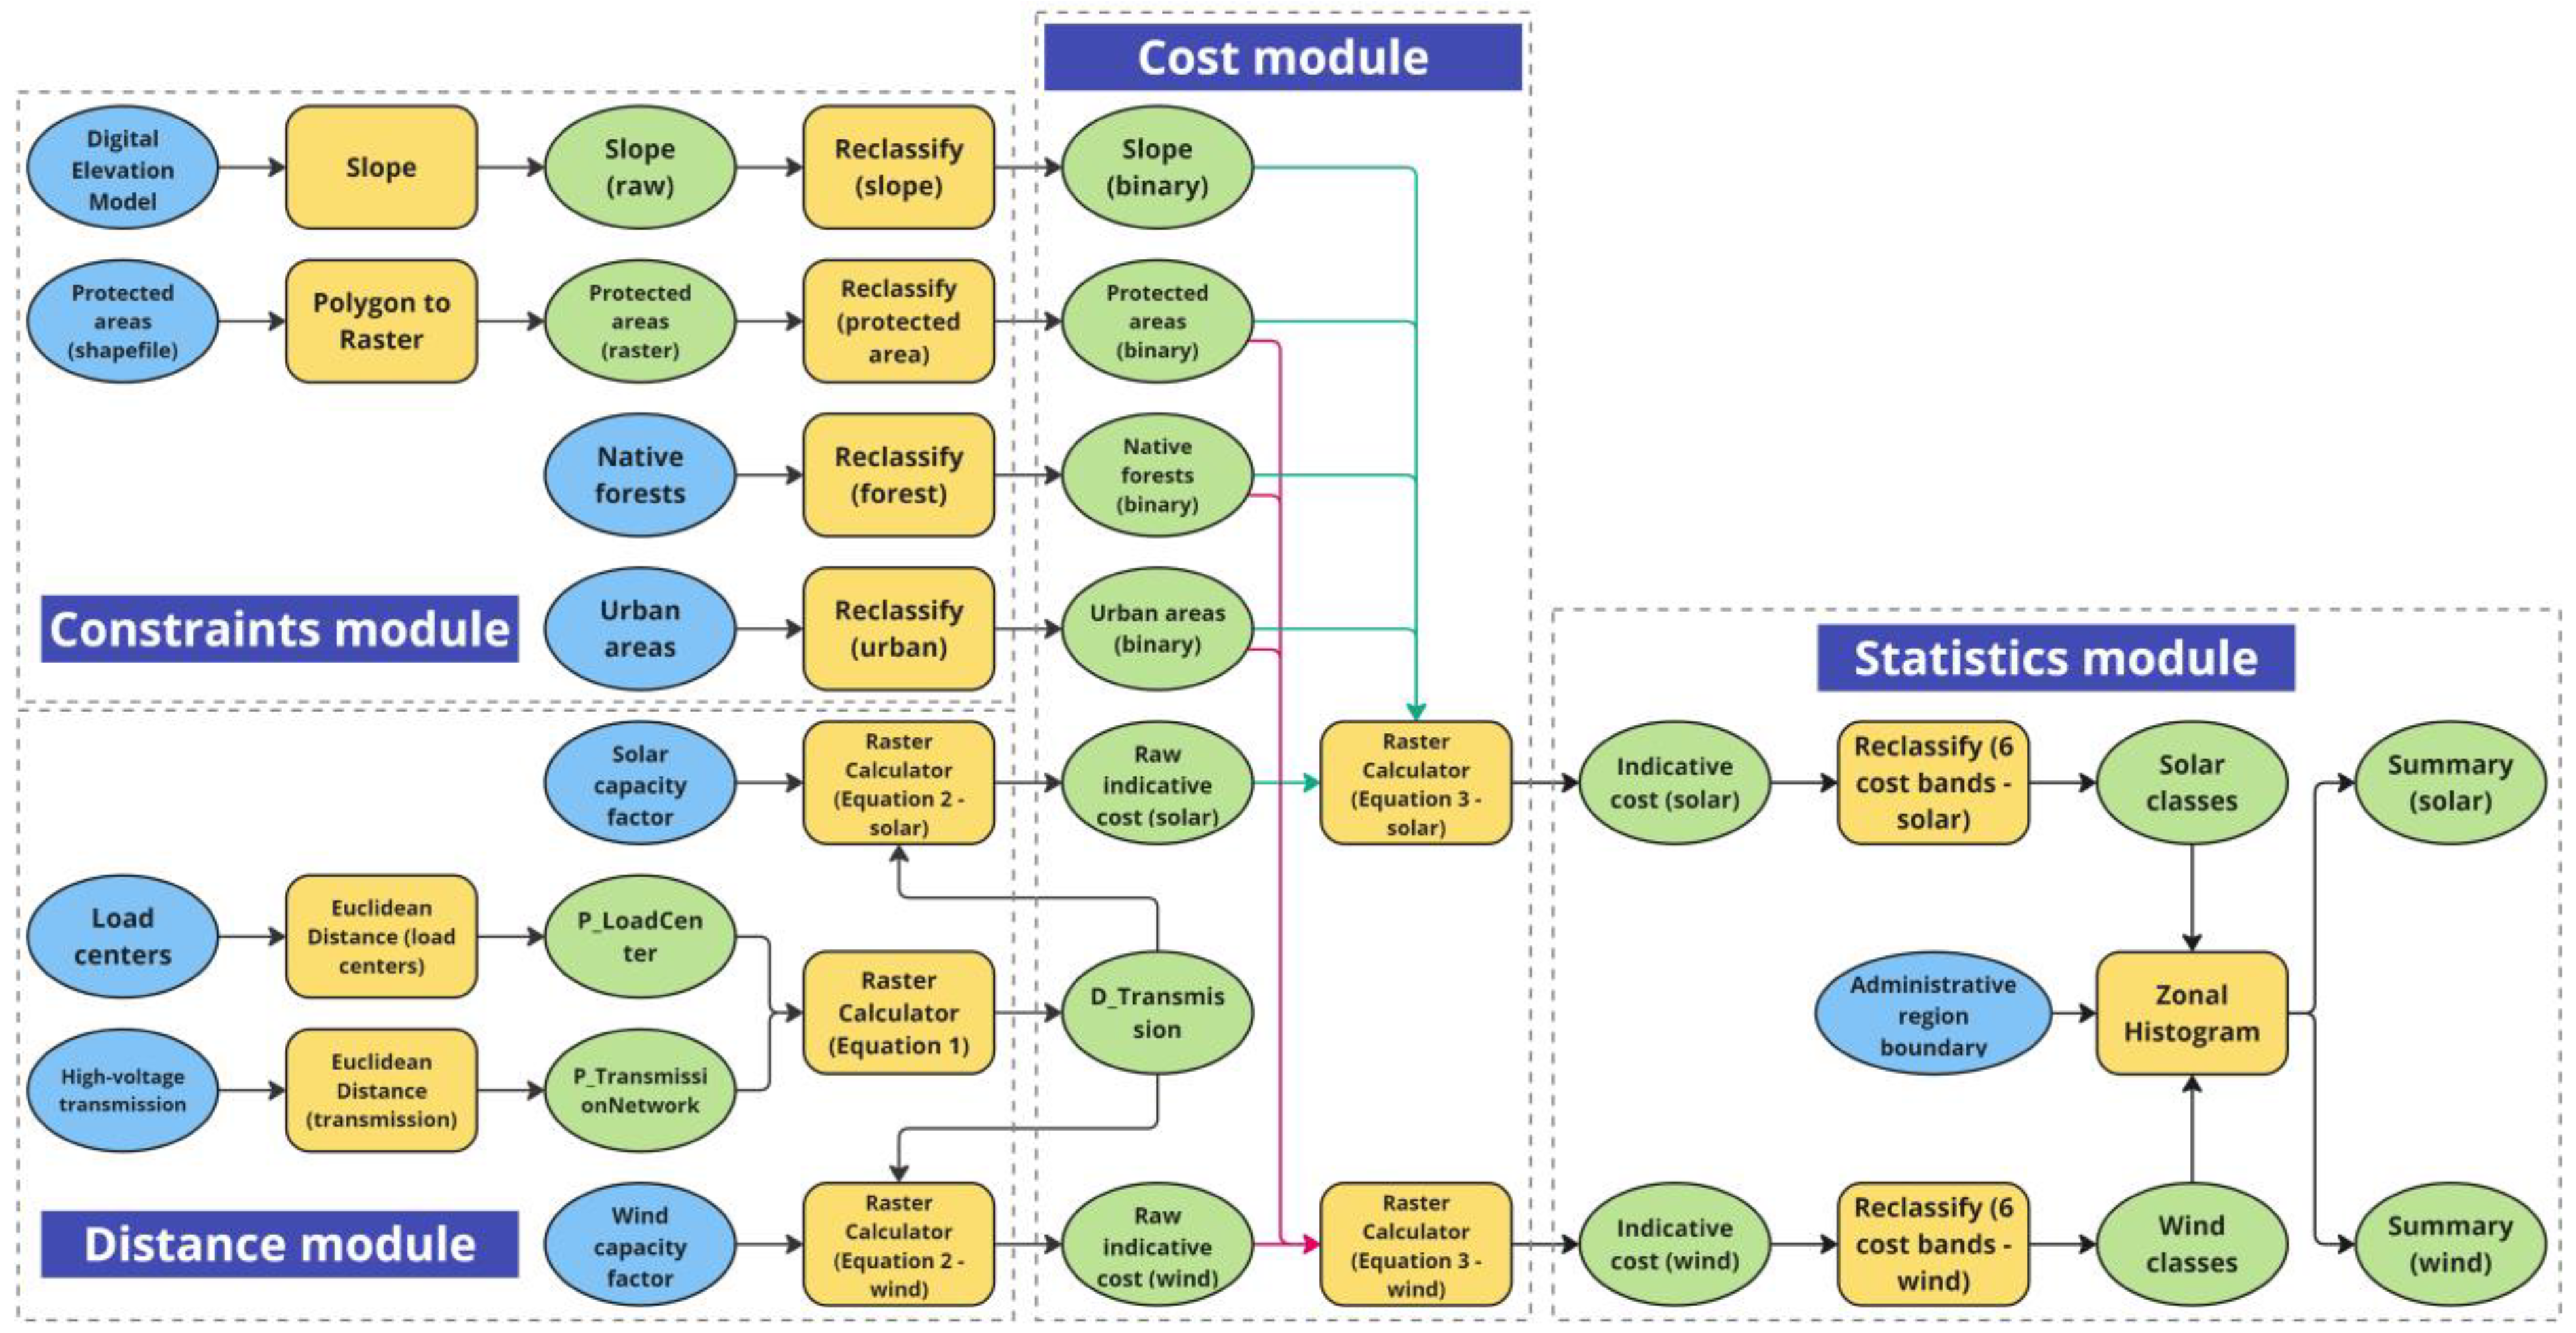
2. Methodology
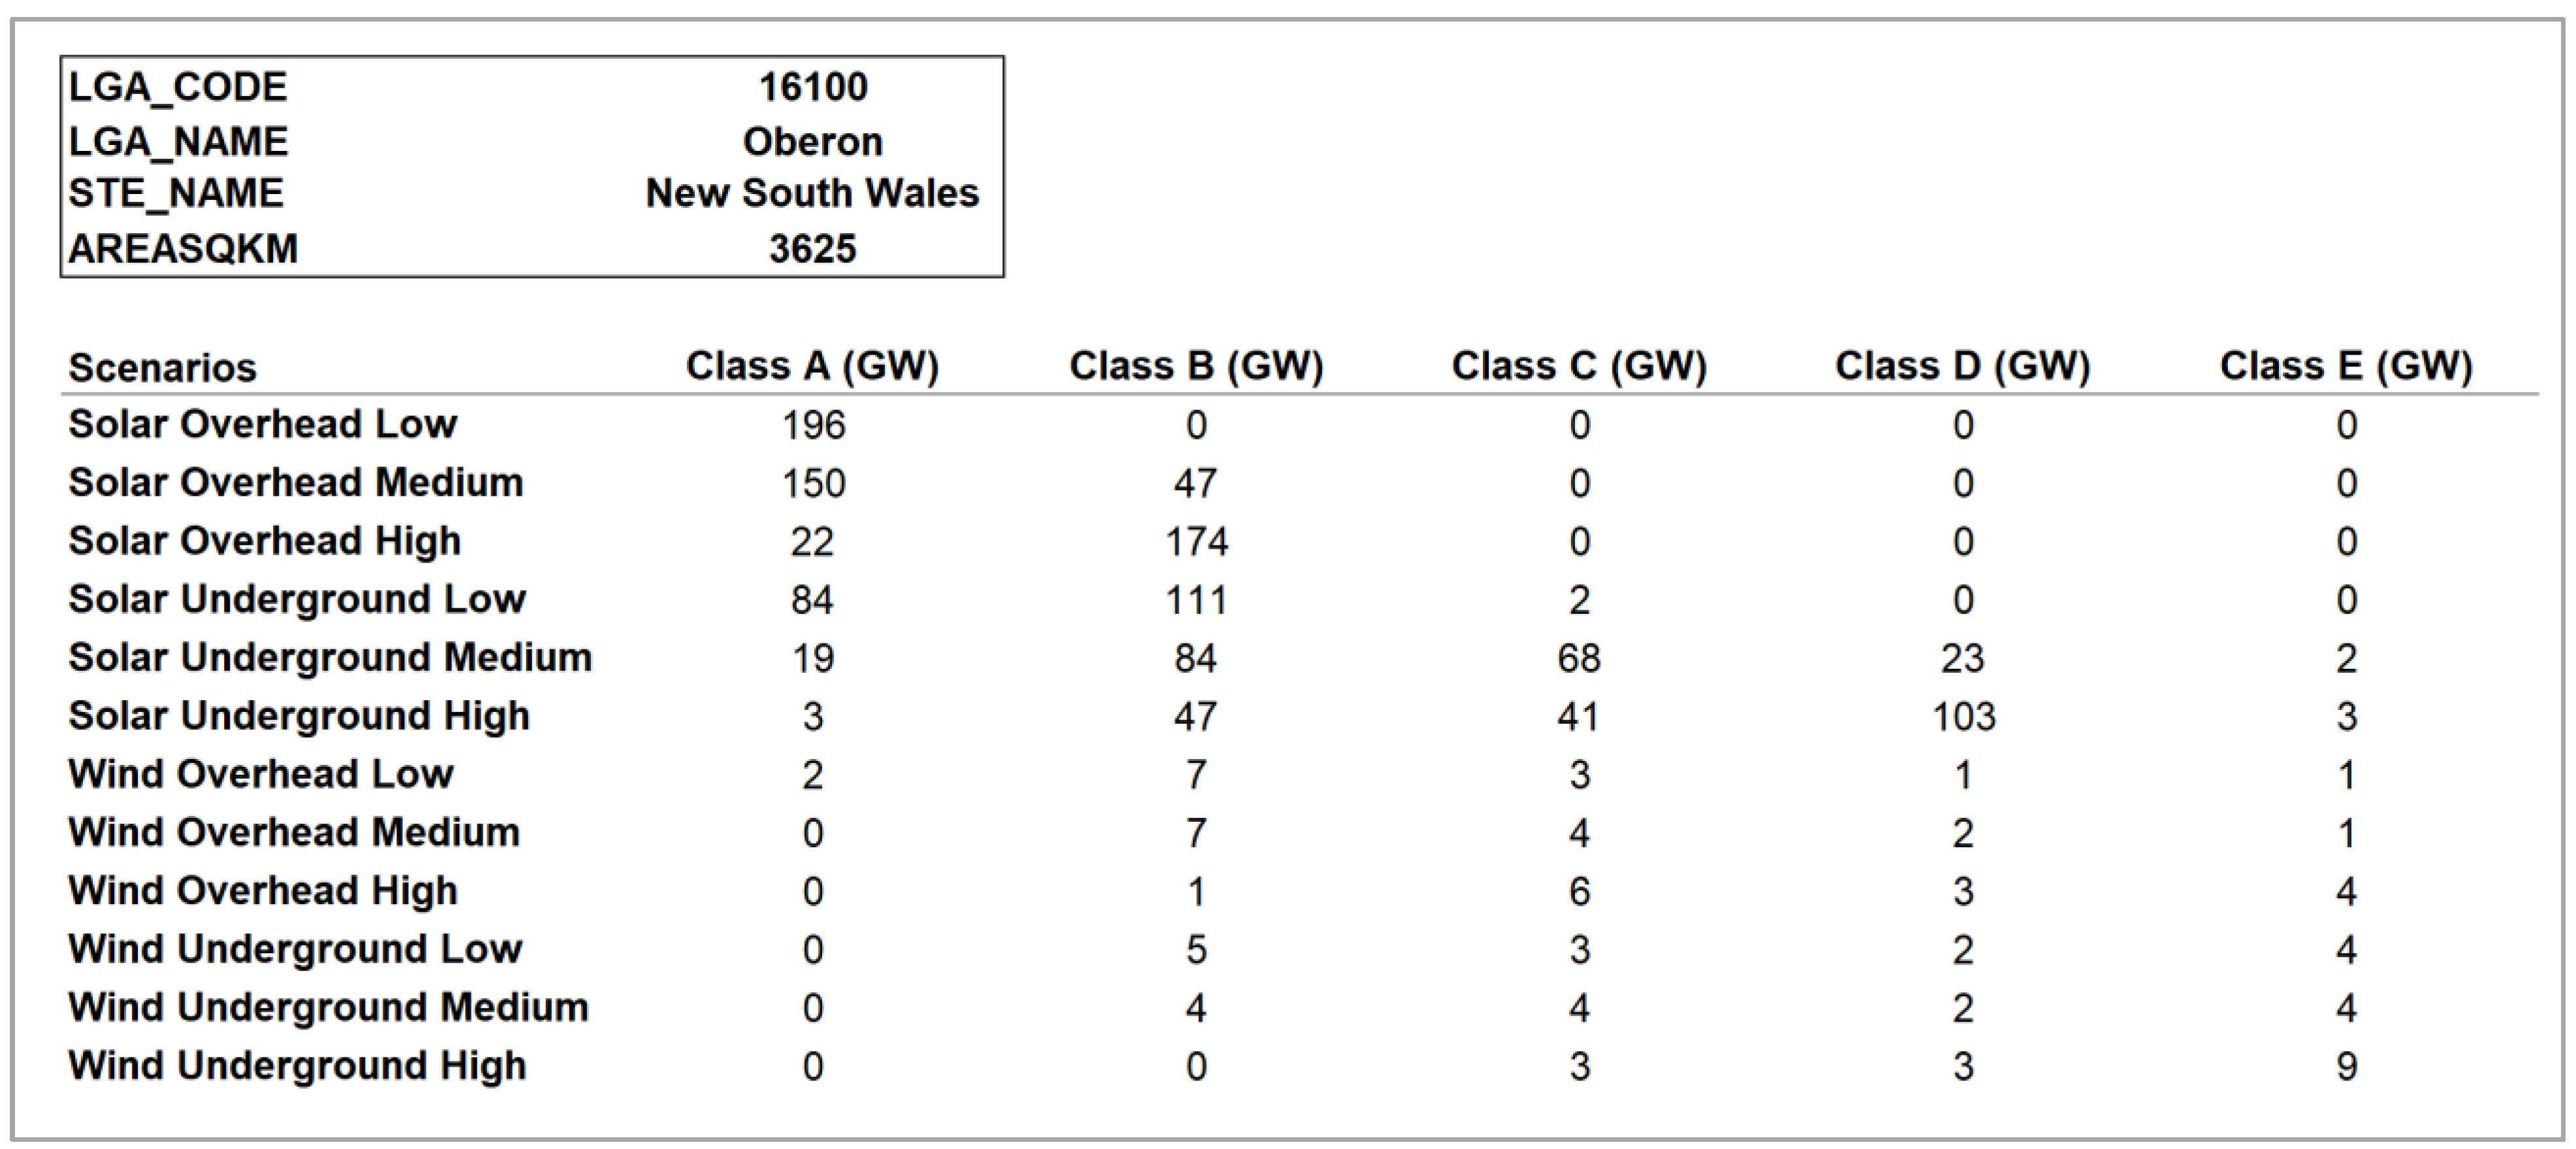
2.1. GIS Analysis
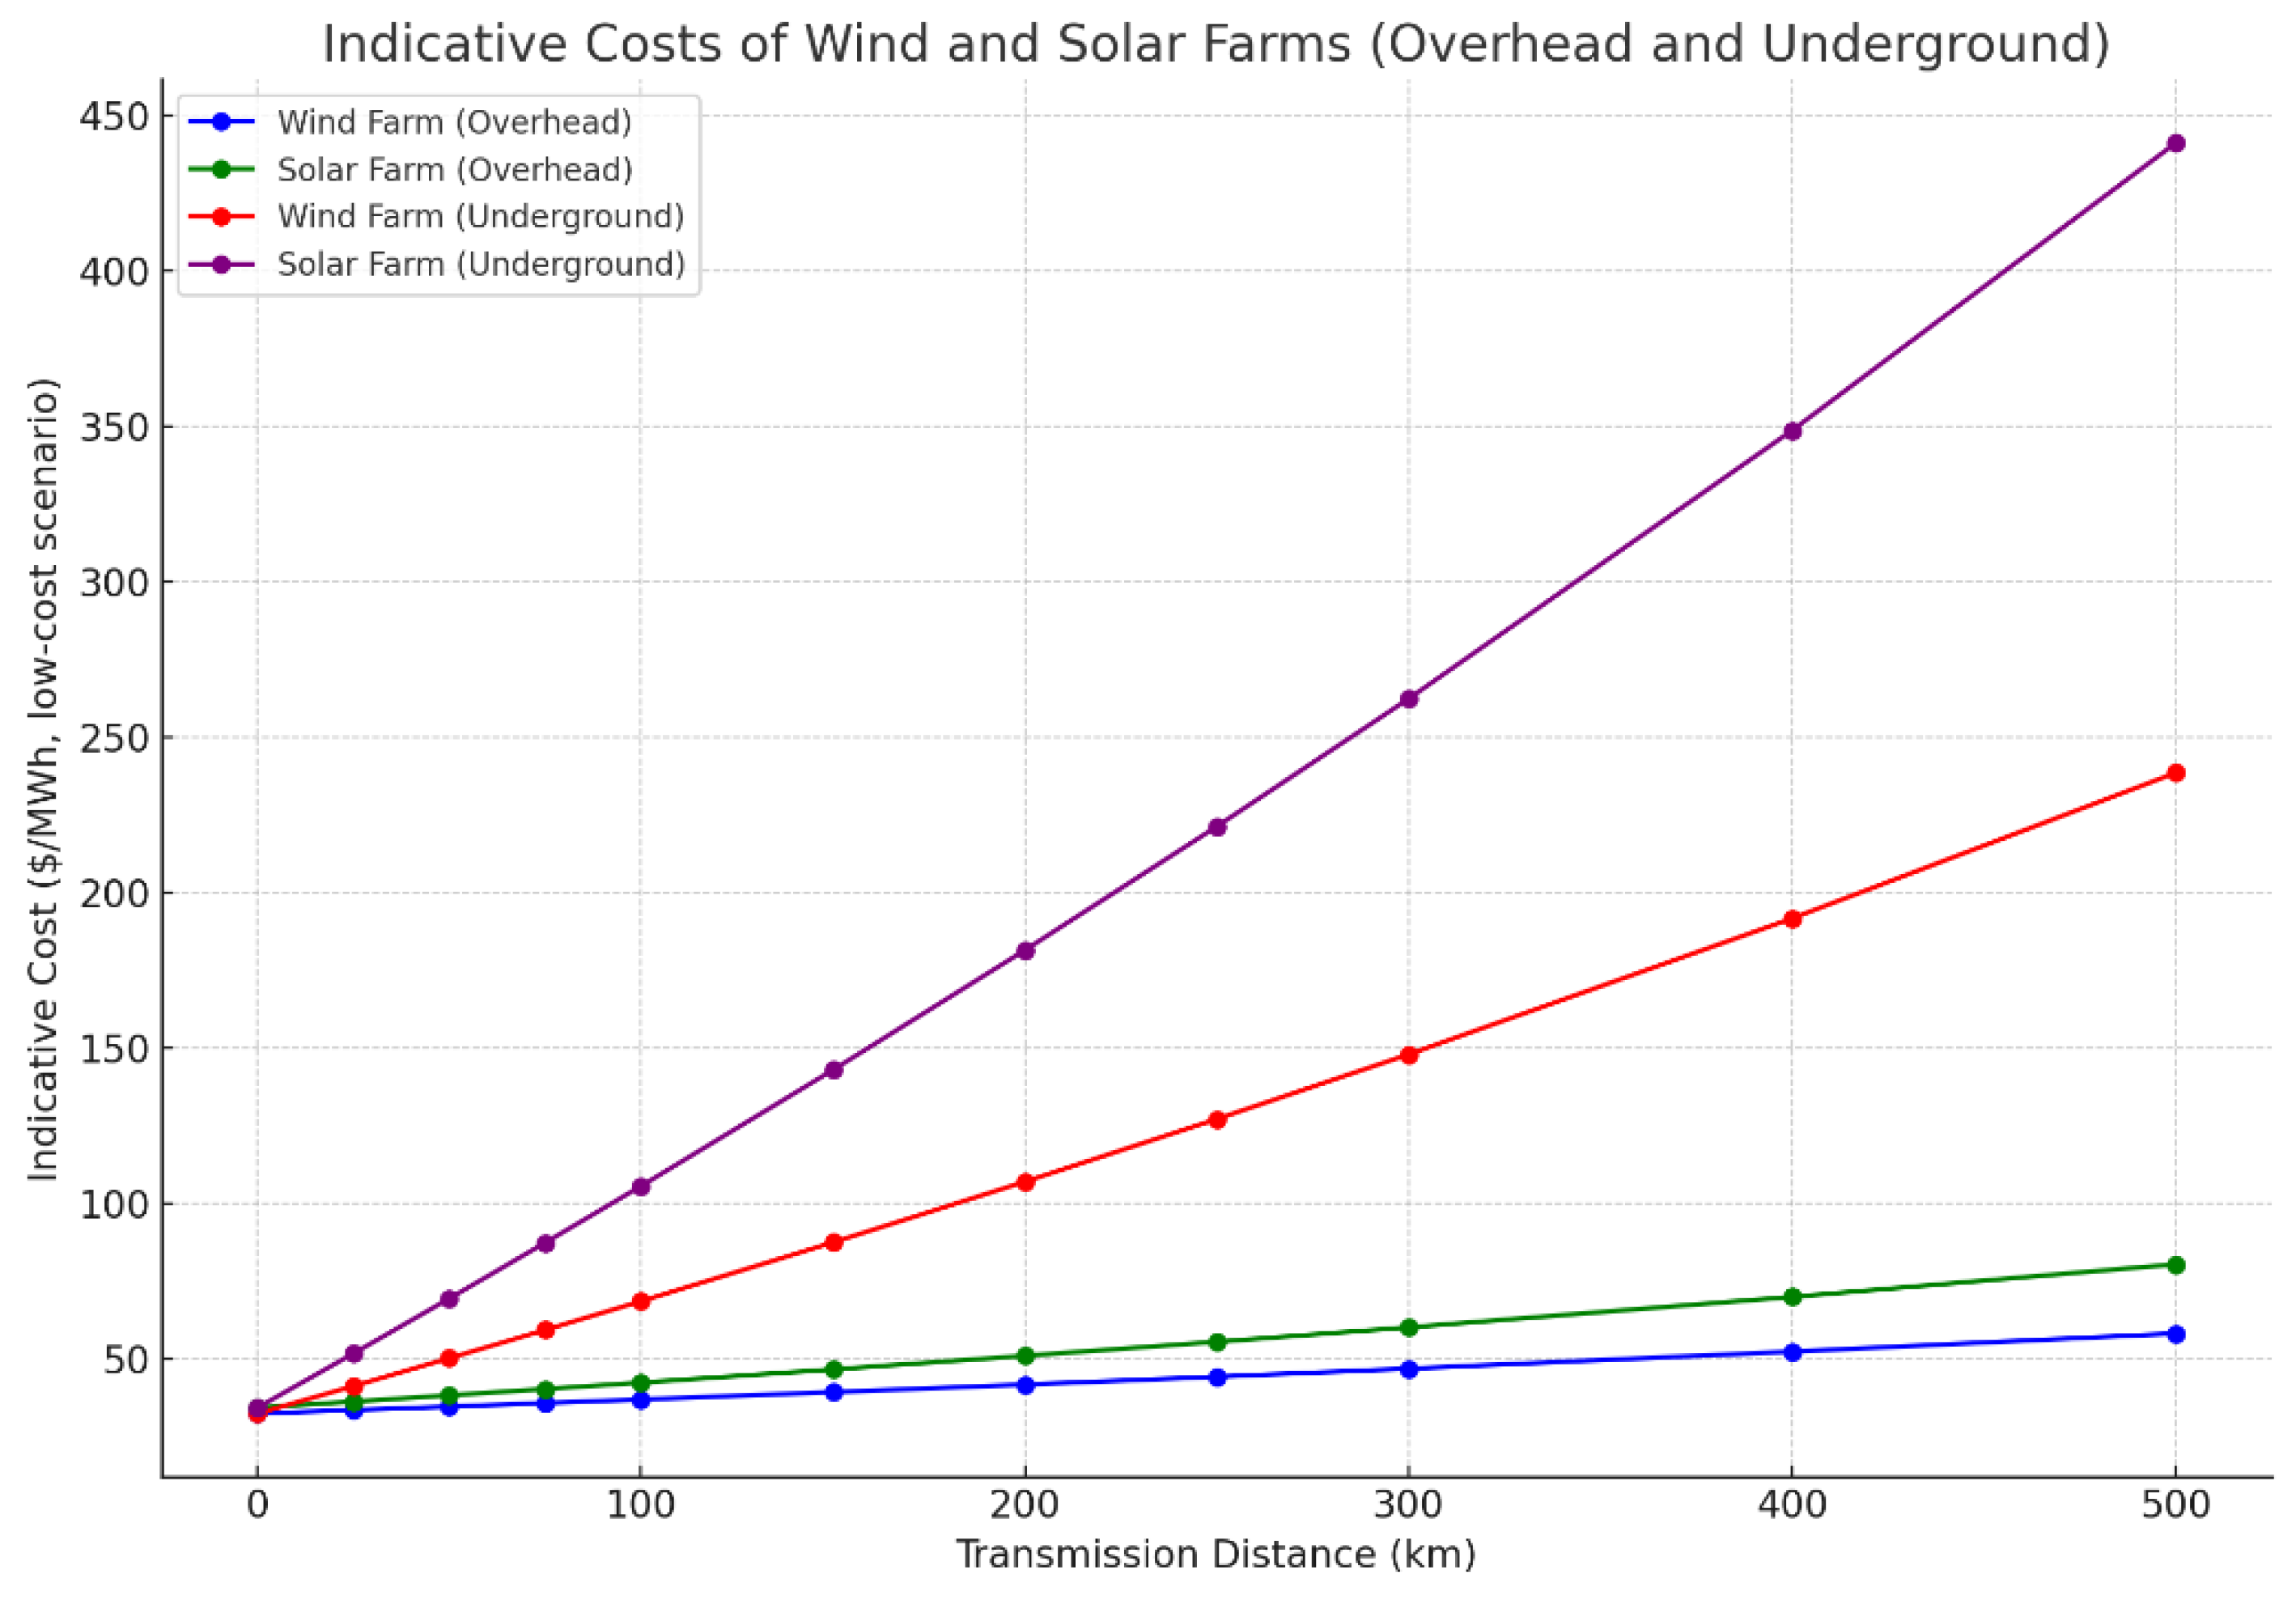
- Transmission CAPEX: Capital expenditure of the transmission line connecting the solar or wind farm to the load centers or the high-voltage transmission network, in $/MW-km.
- Transmission OPEX: Operating expenses of the transmission line, in $/MW-km per annum.
- RE CAPEX: Capital expenditure of the solar or wind farm, in $/MW.
- RE OPEX: Operating expenses of the solar or wind farm, in $/MW per annum.
- : Length of the HVAC powerline connecting the hypothetical solar or wind farm to the load centers or the high-voltage transmission network, in kilometers.
- : Annual capacity factor of the solar or wind farm, expressed as a decimal (e.g., 0.2 for 20%).
- PVF (Present Value Factor): Present value factor calculated using the given discount rate and lifetime of the solar/wind farm and transmission line.
2.2. Cost Estimation
2.3. Land Requirements of Solar and Wind Farms
2.4. Visualization
3. Case Studies
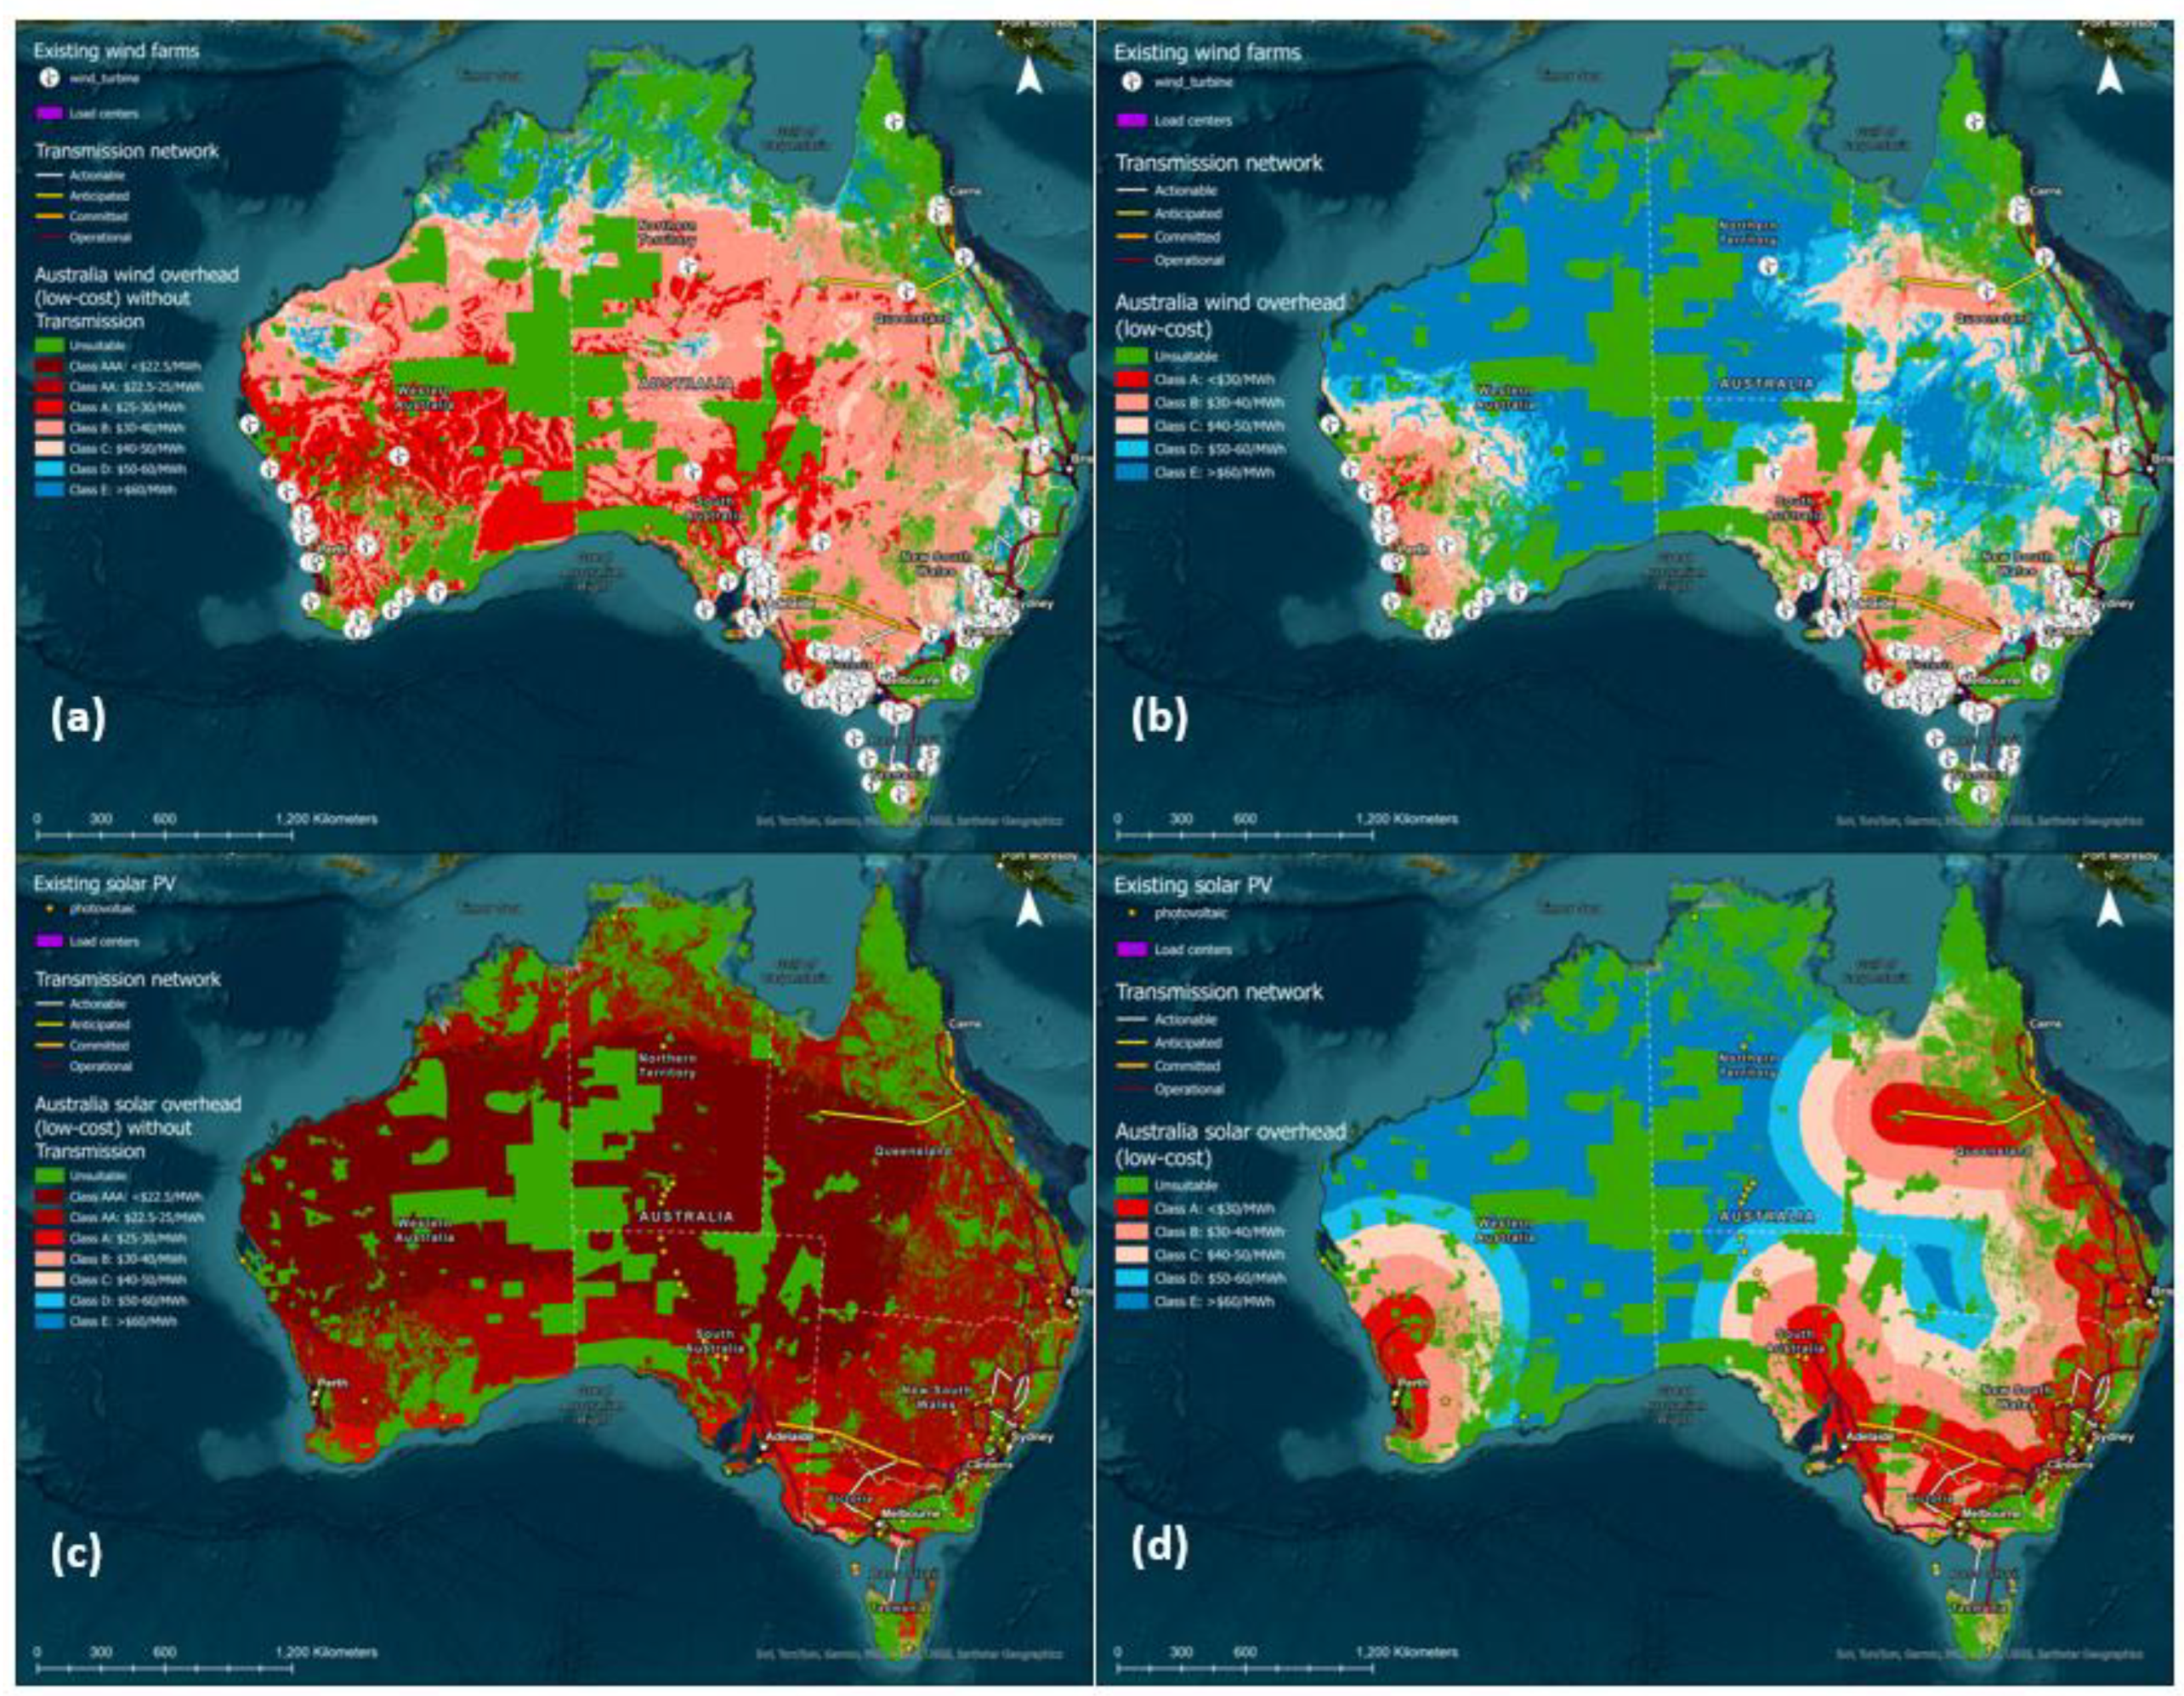
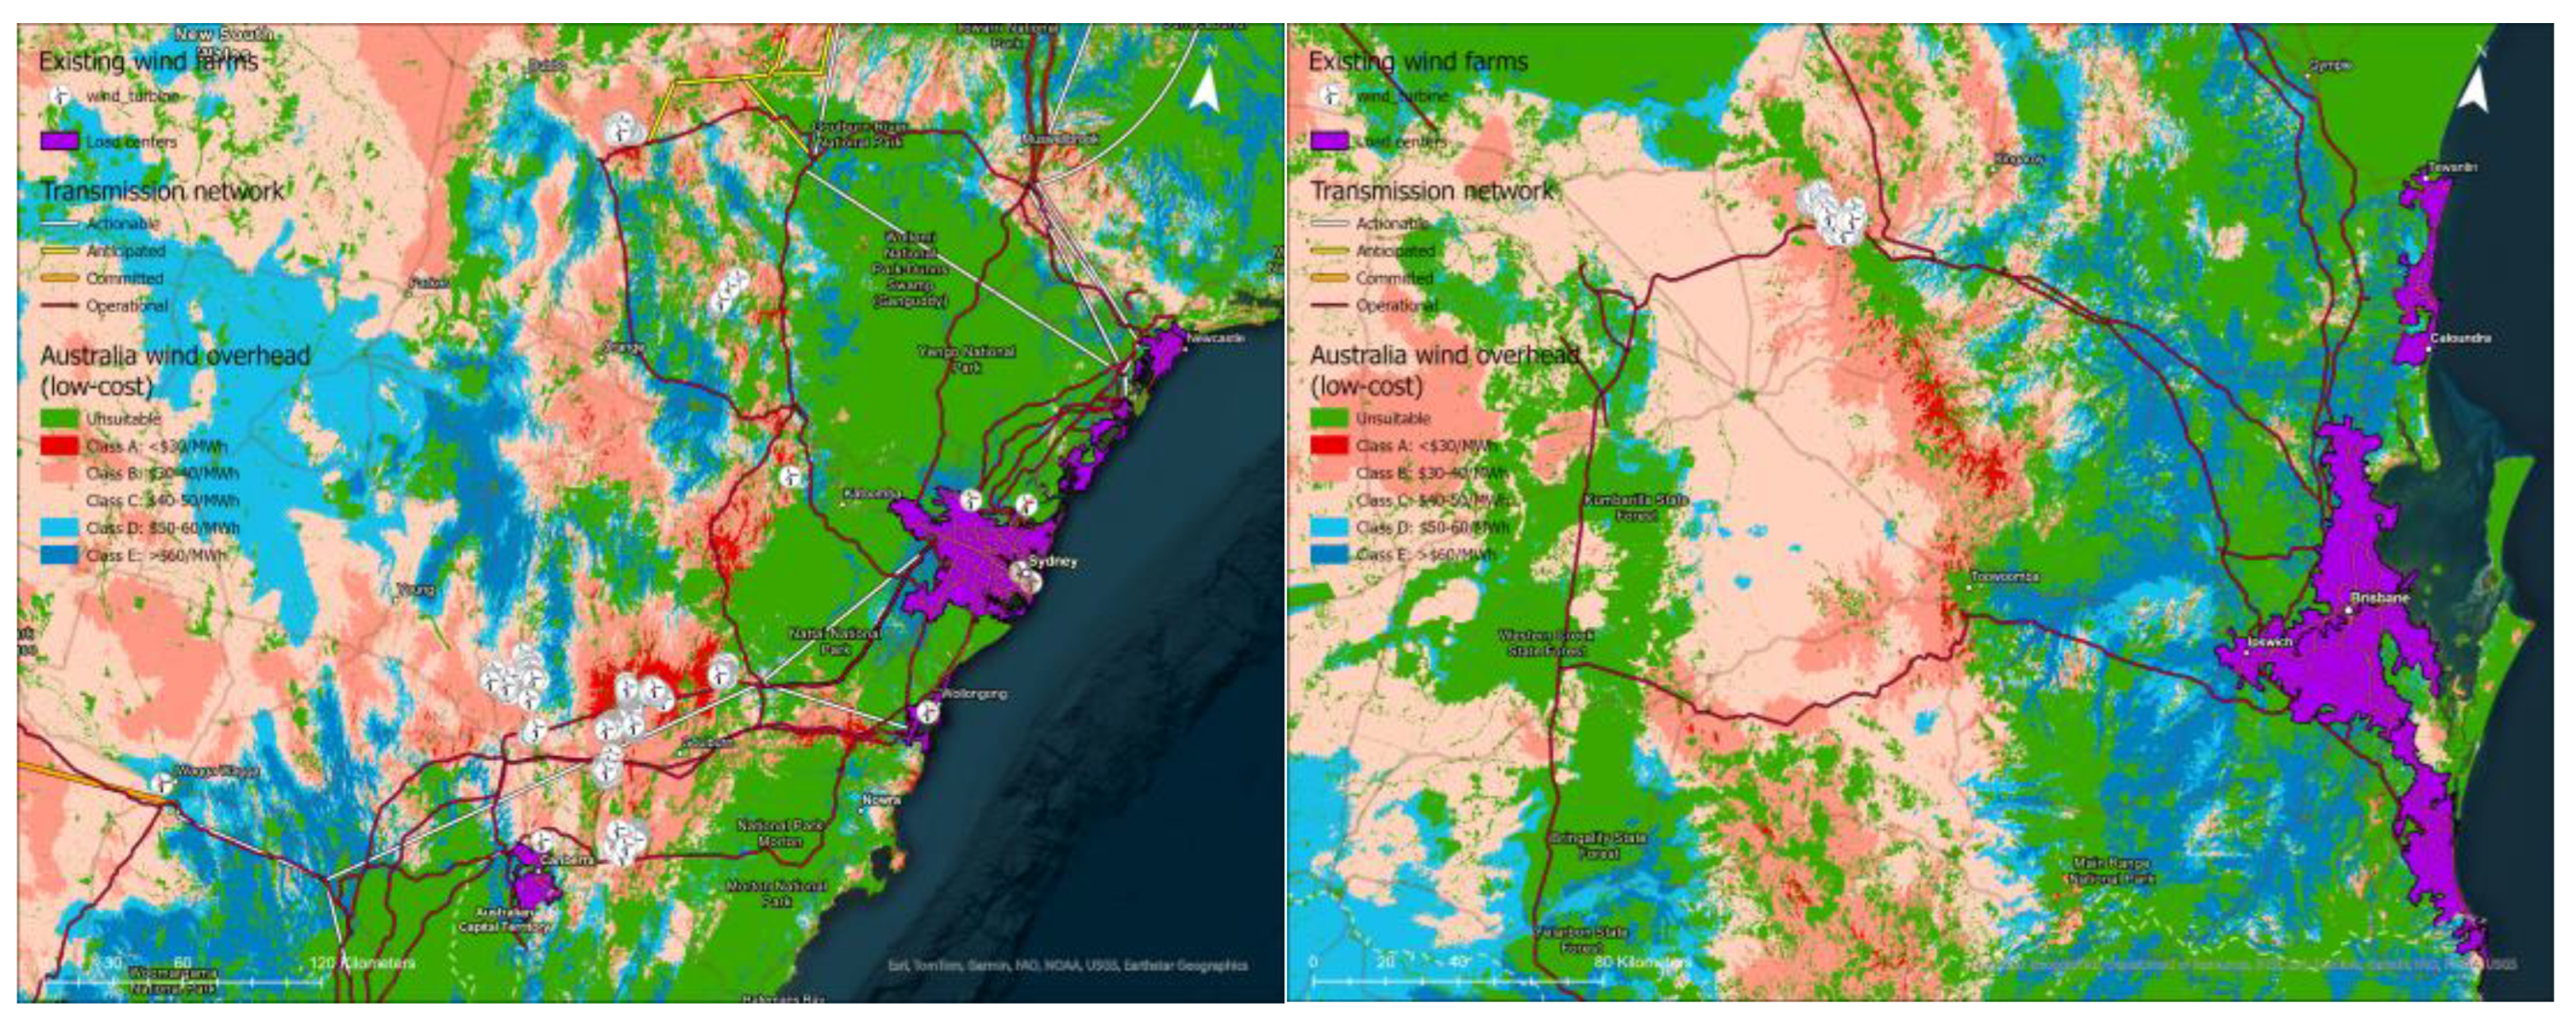
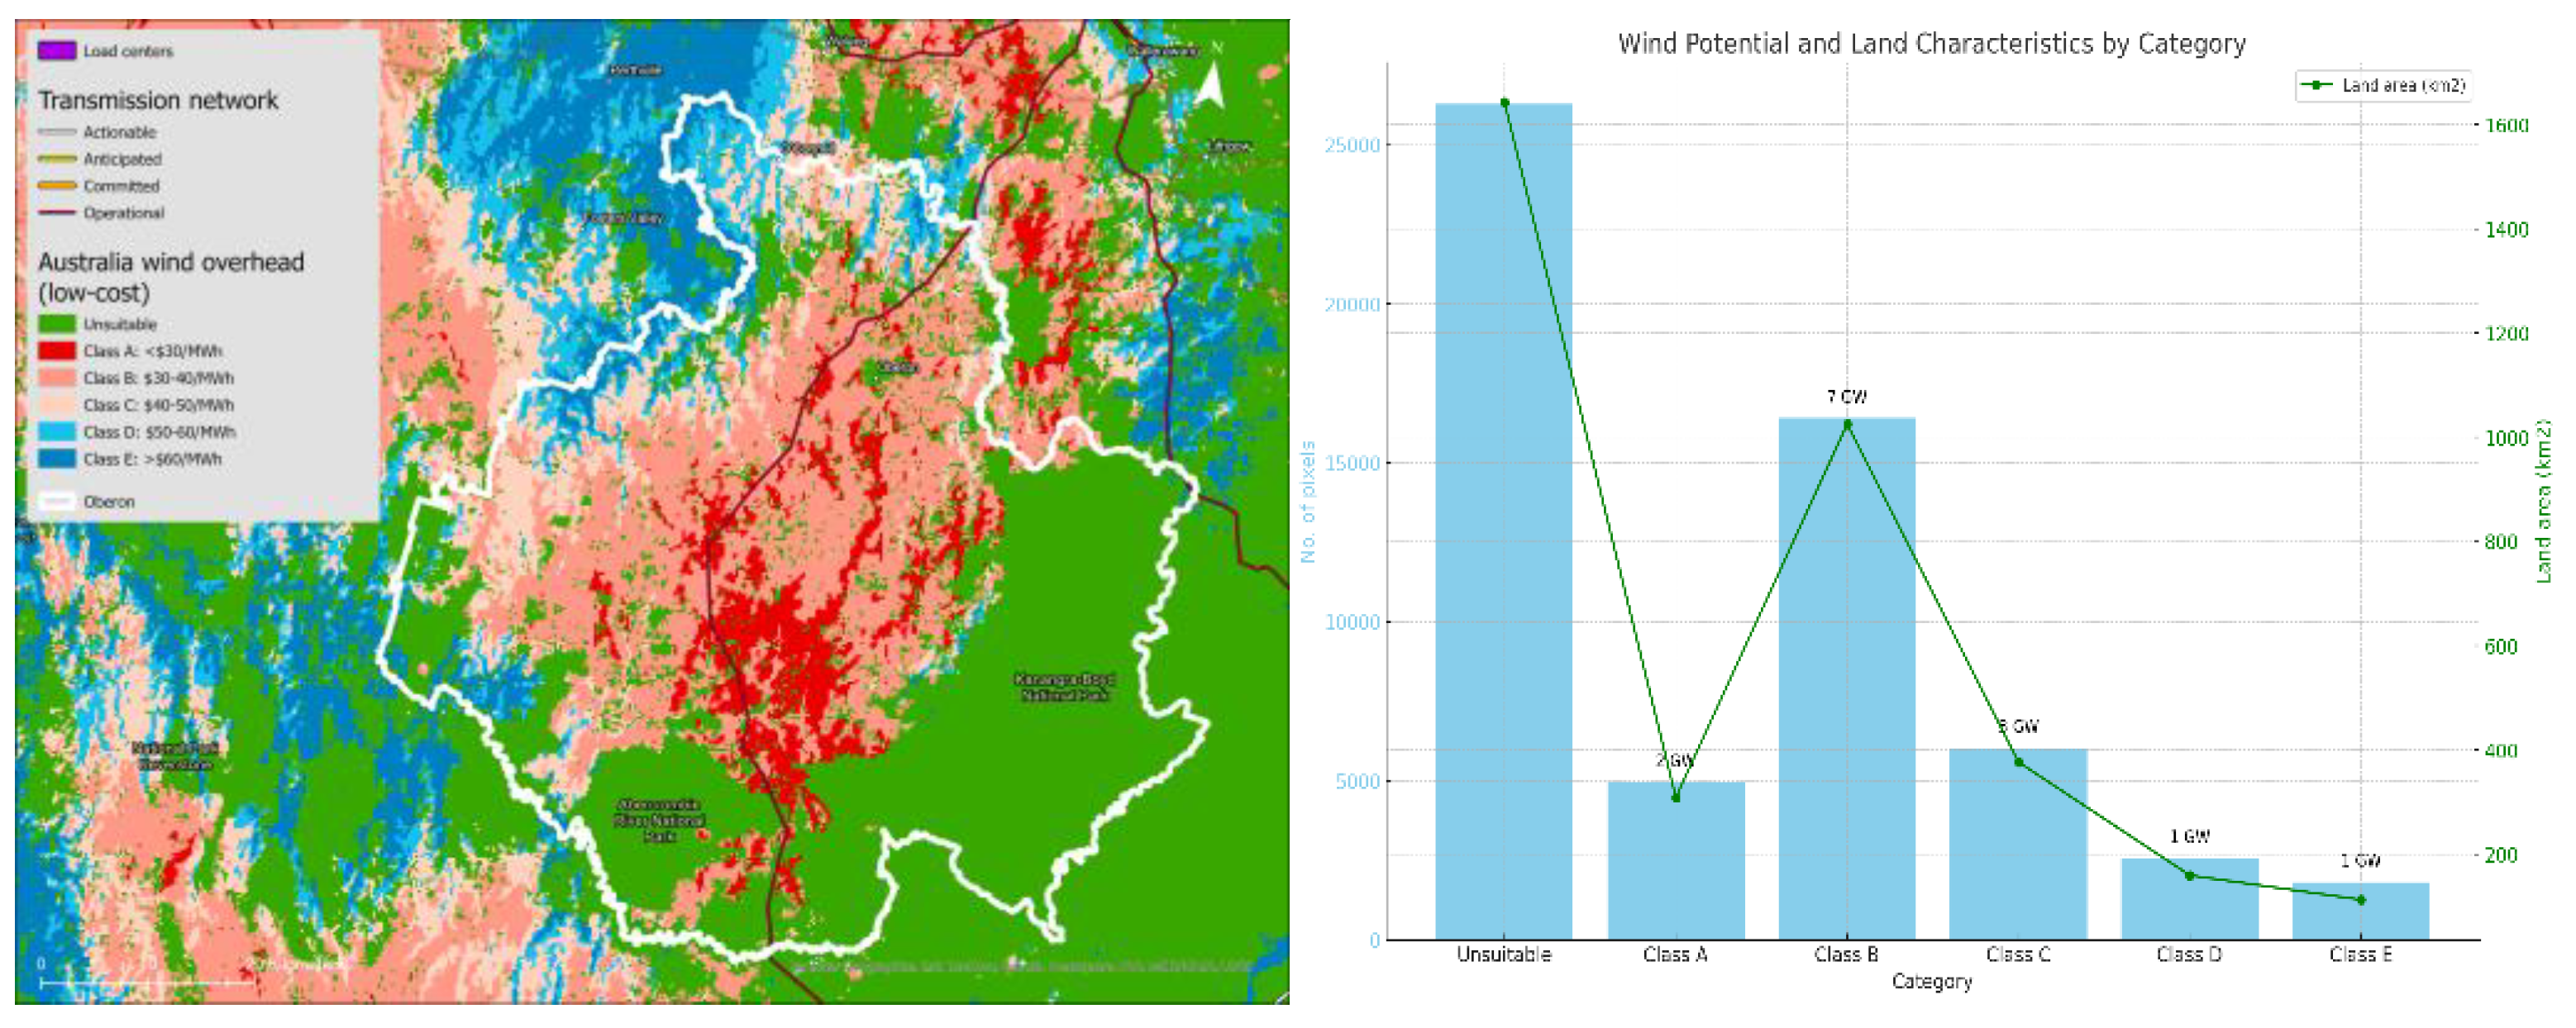
3.1. Australia
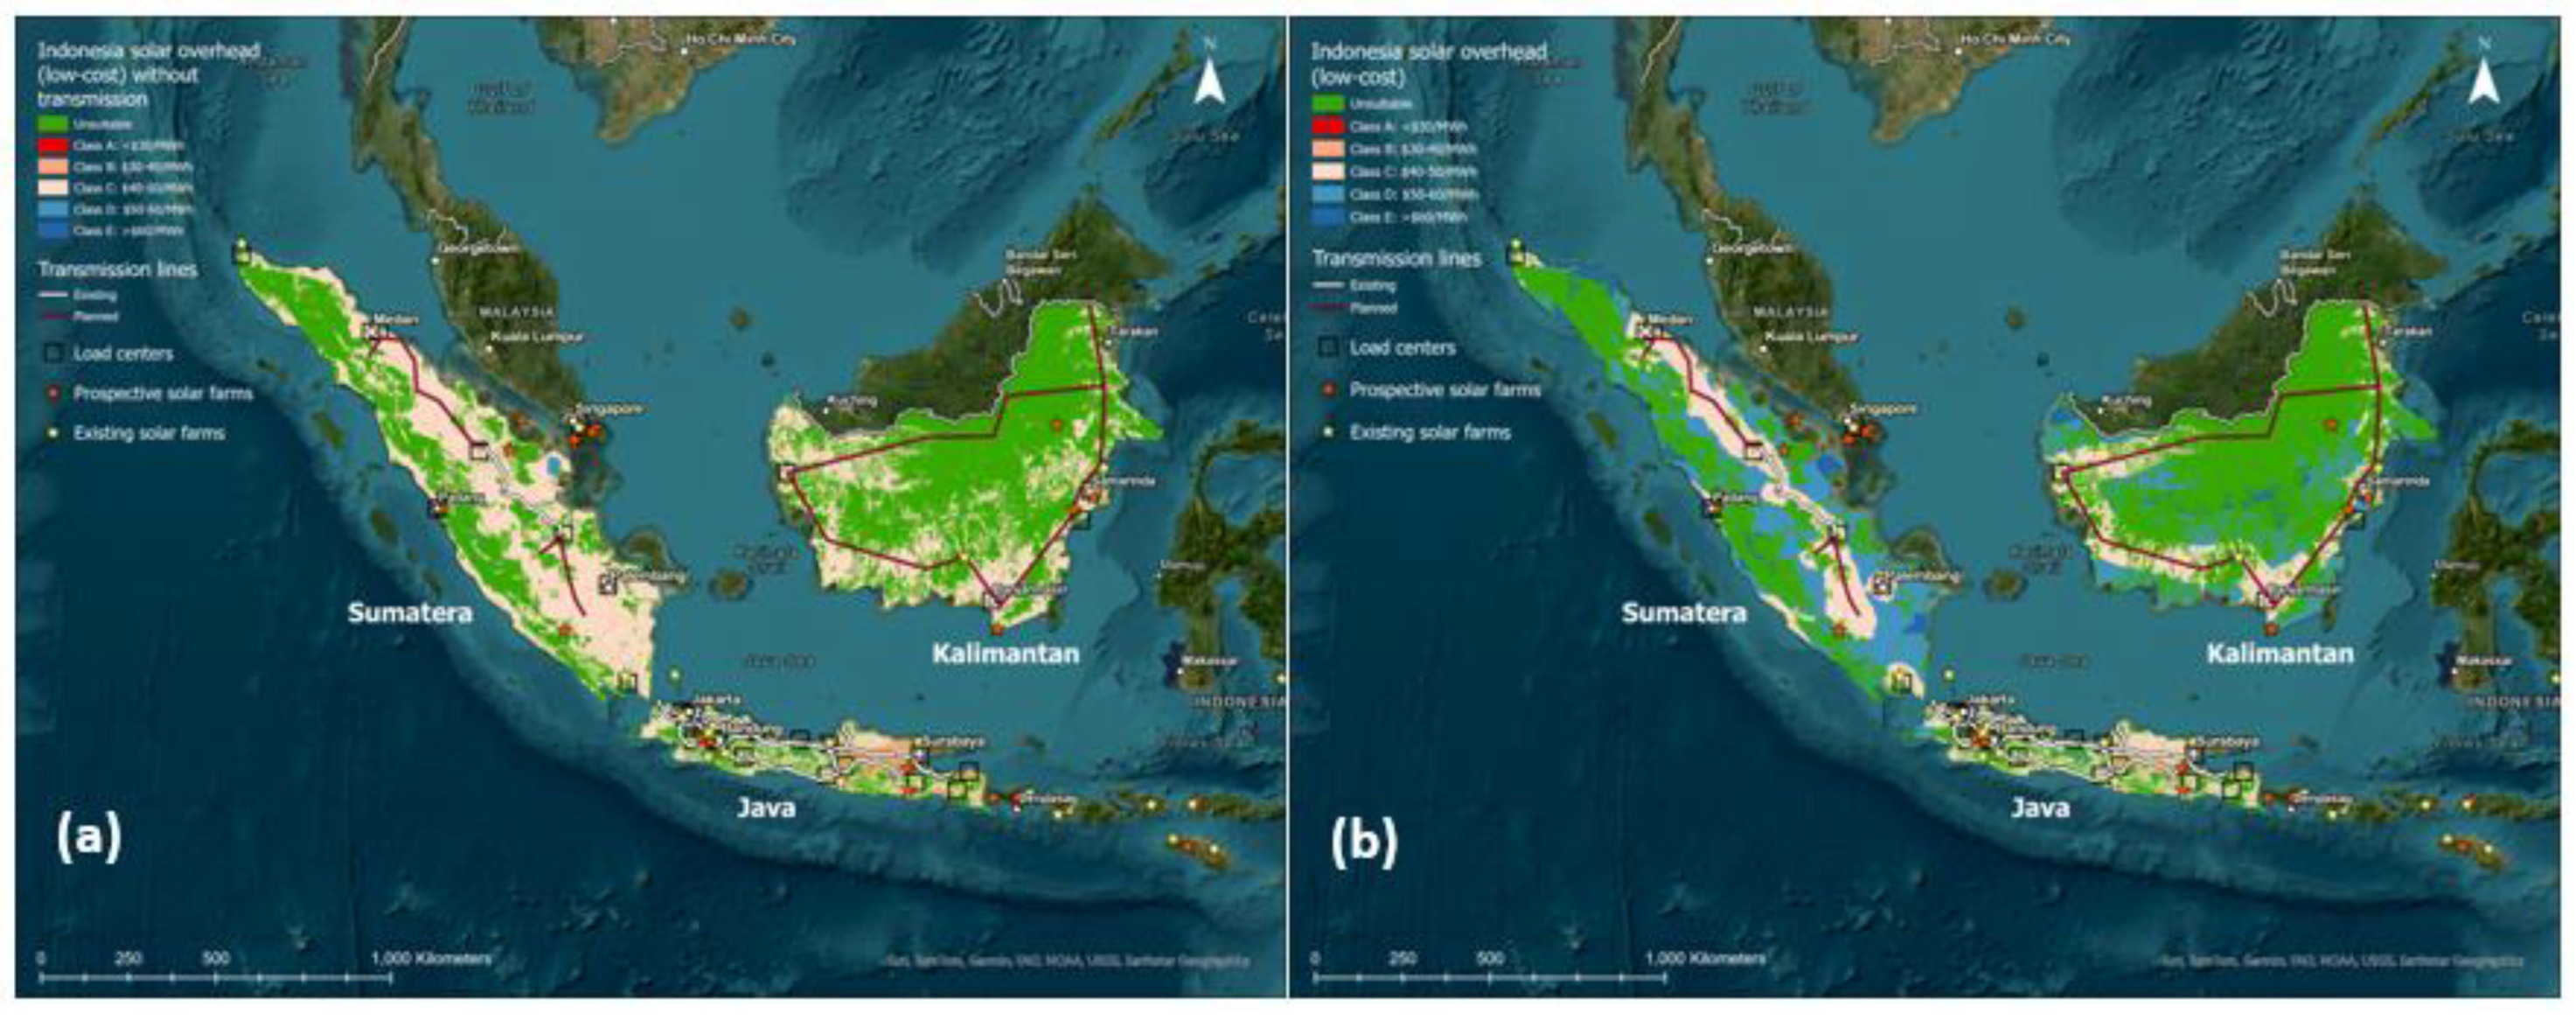
3.2. Indonesia
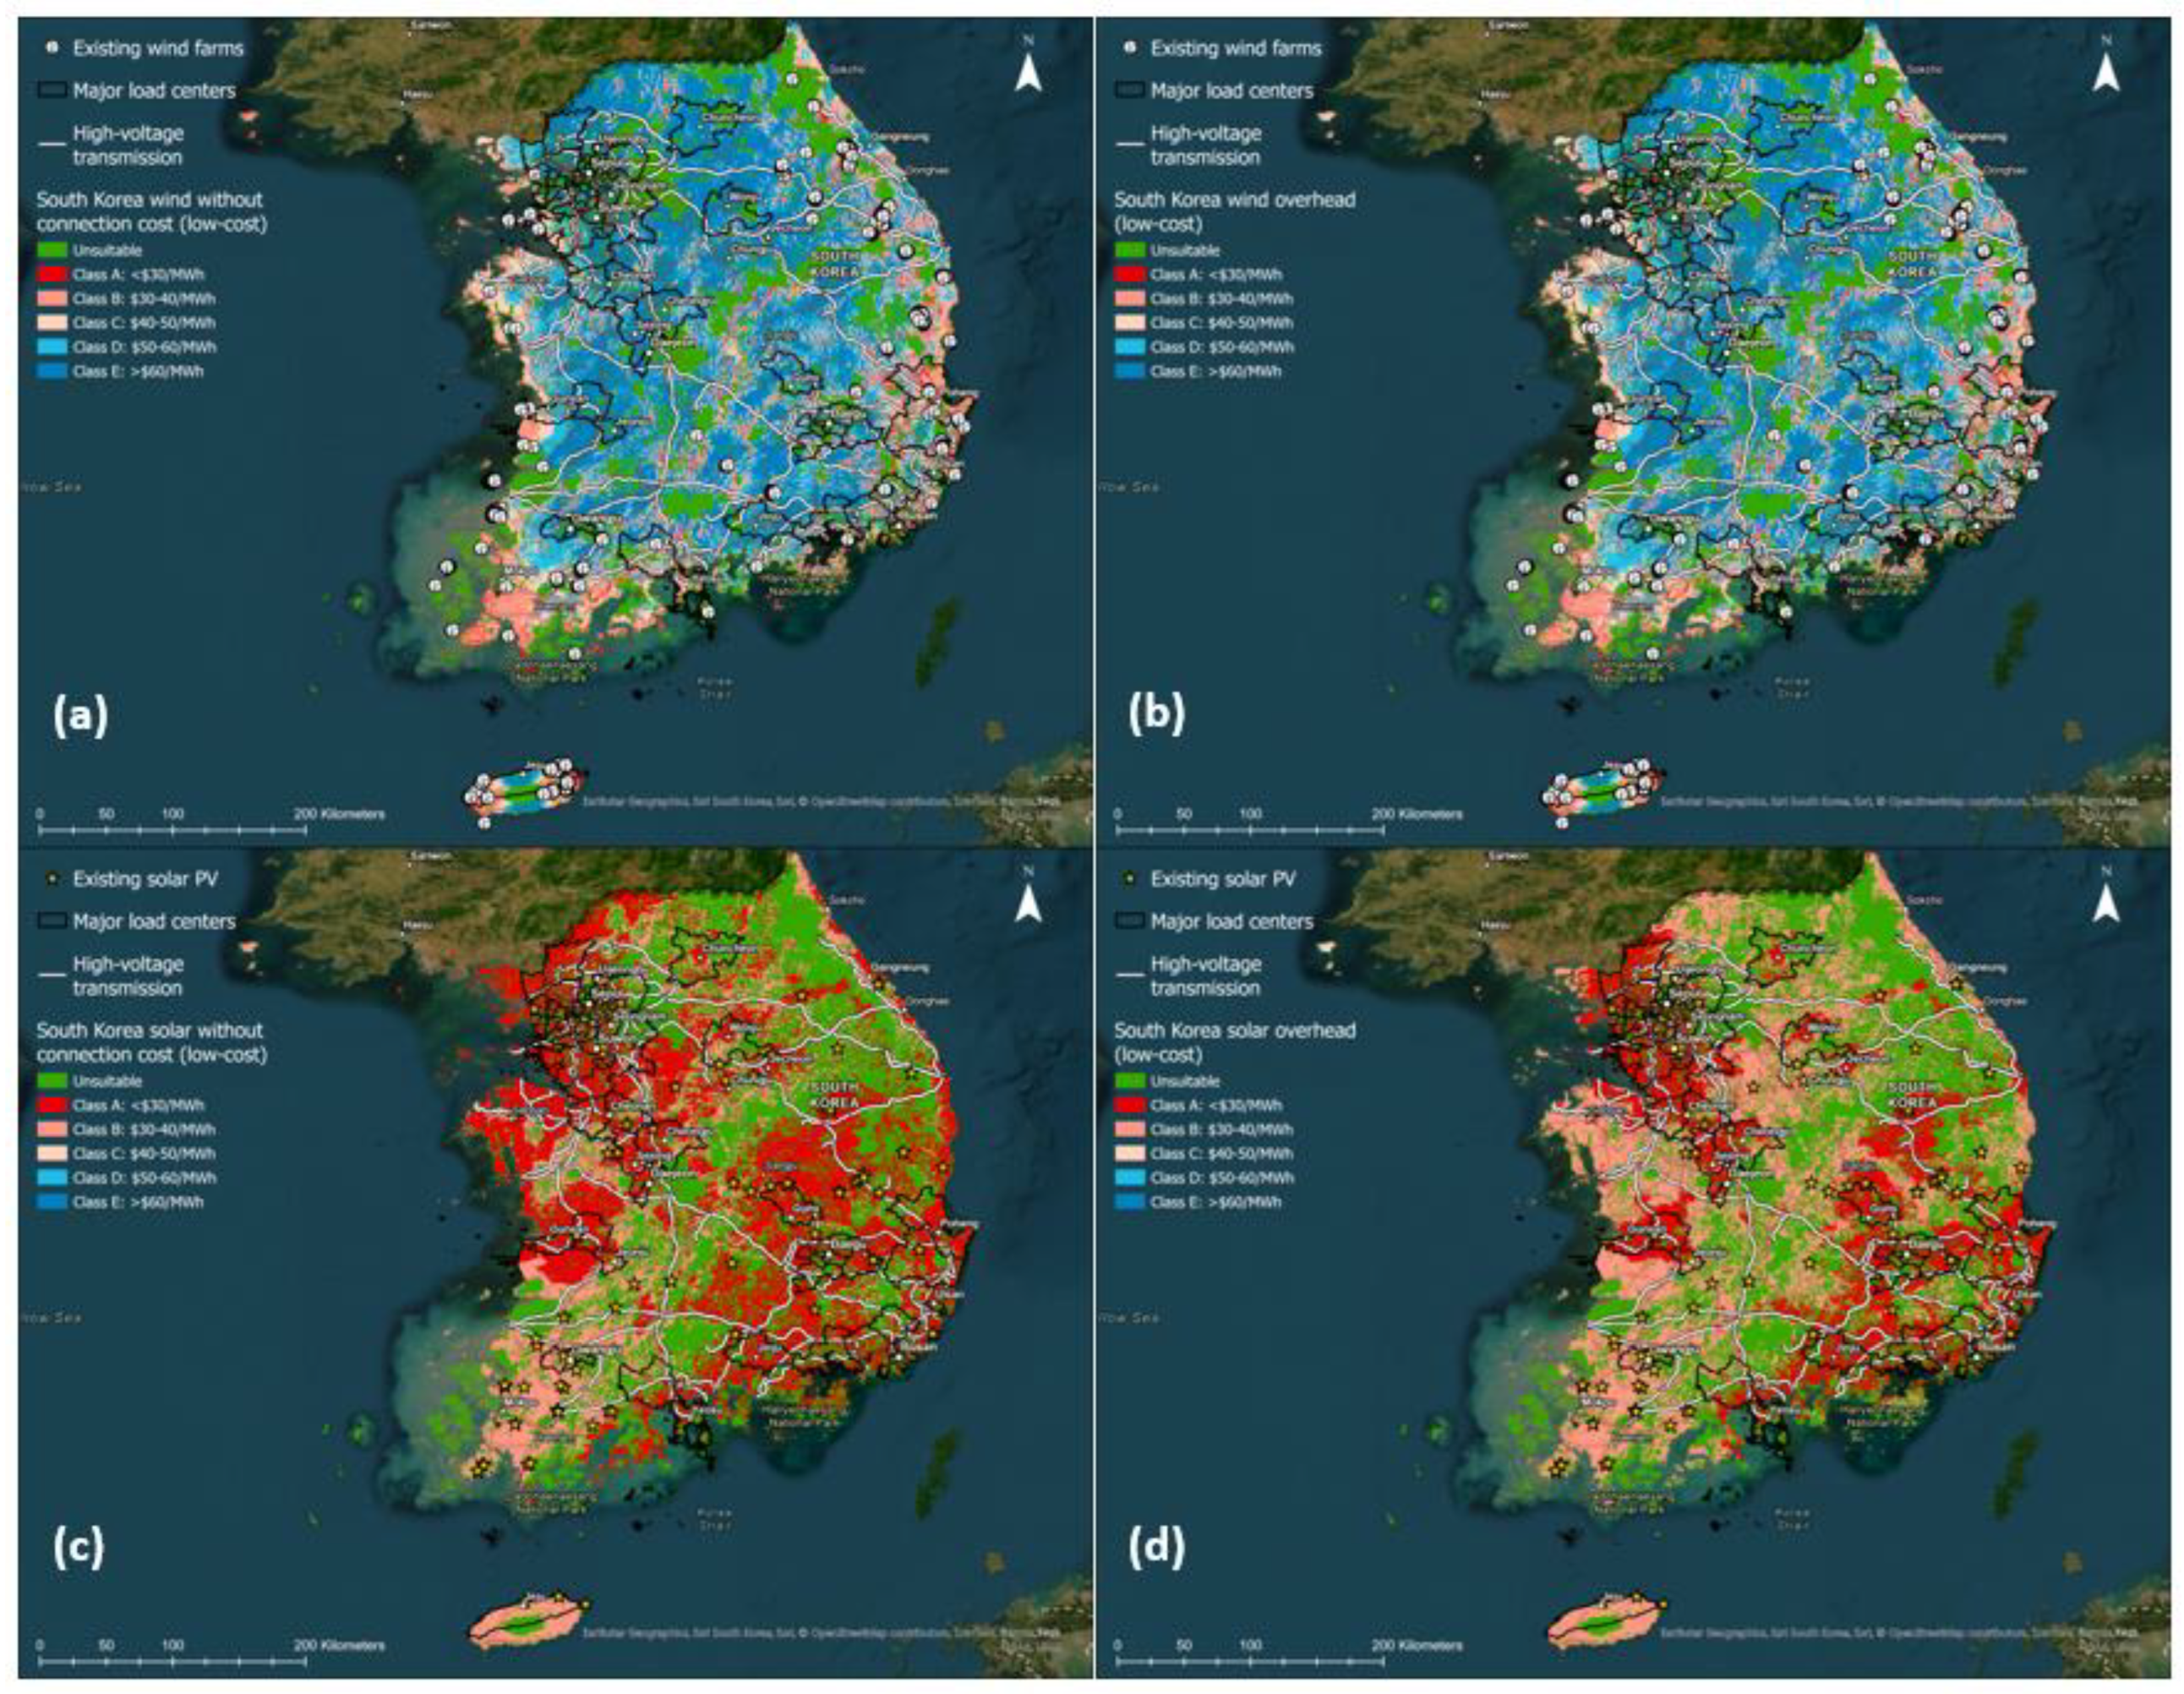
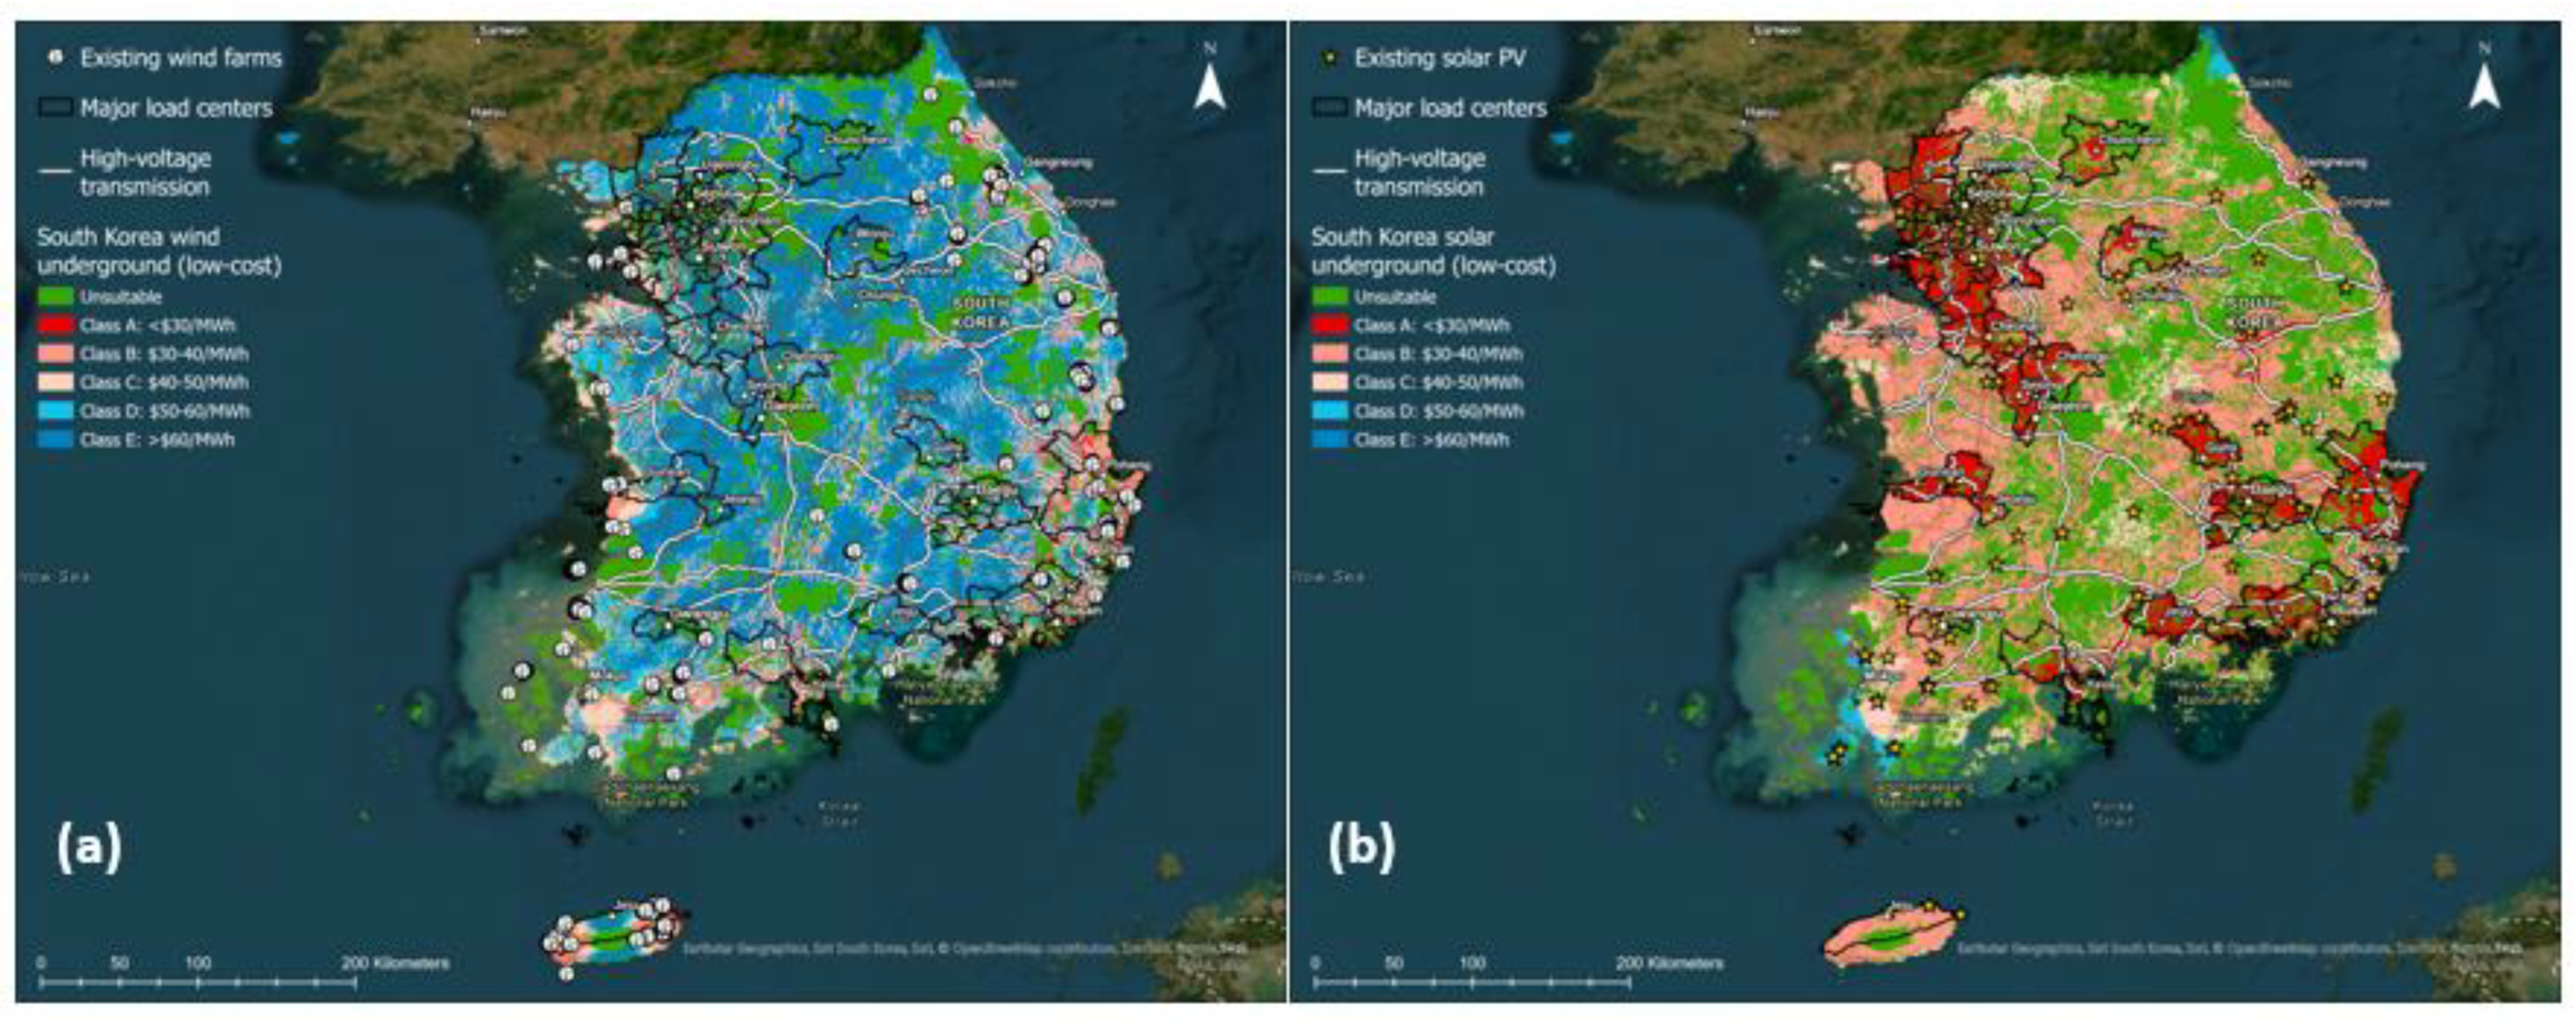
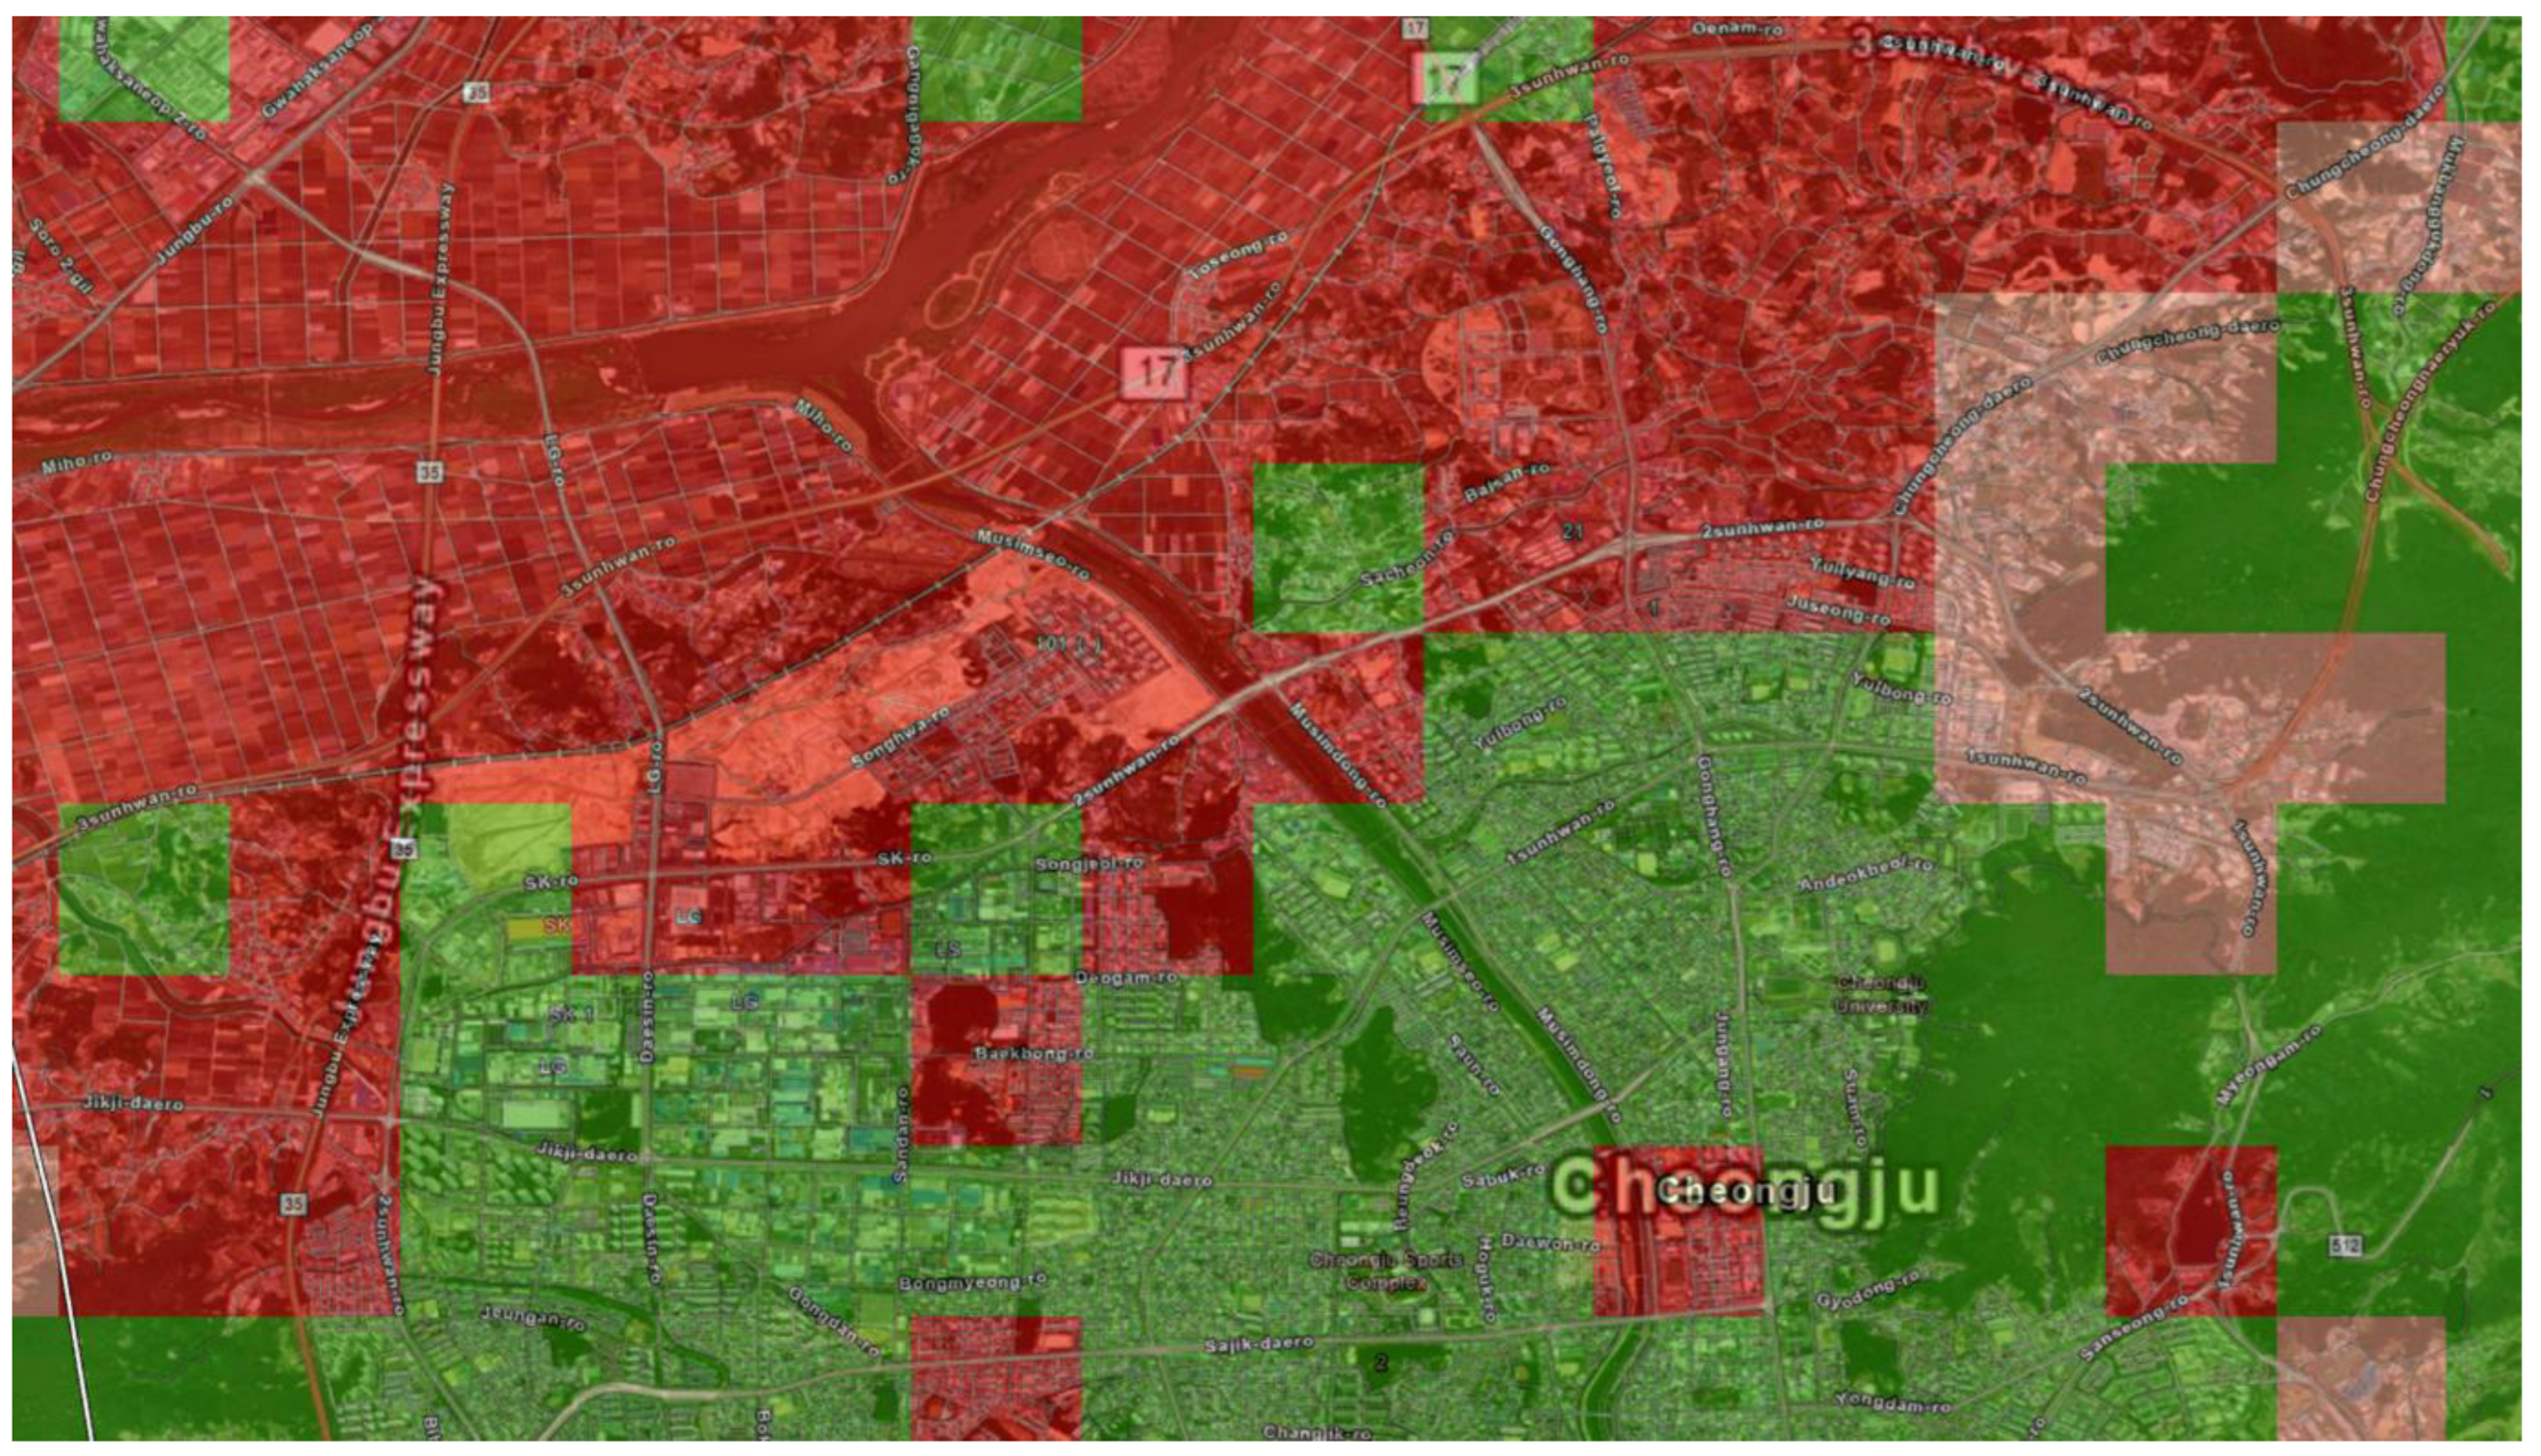
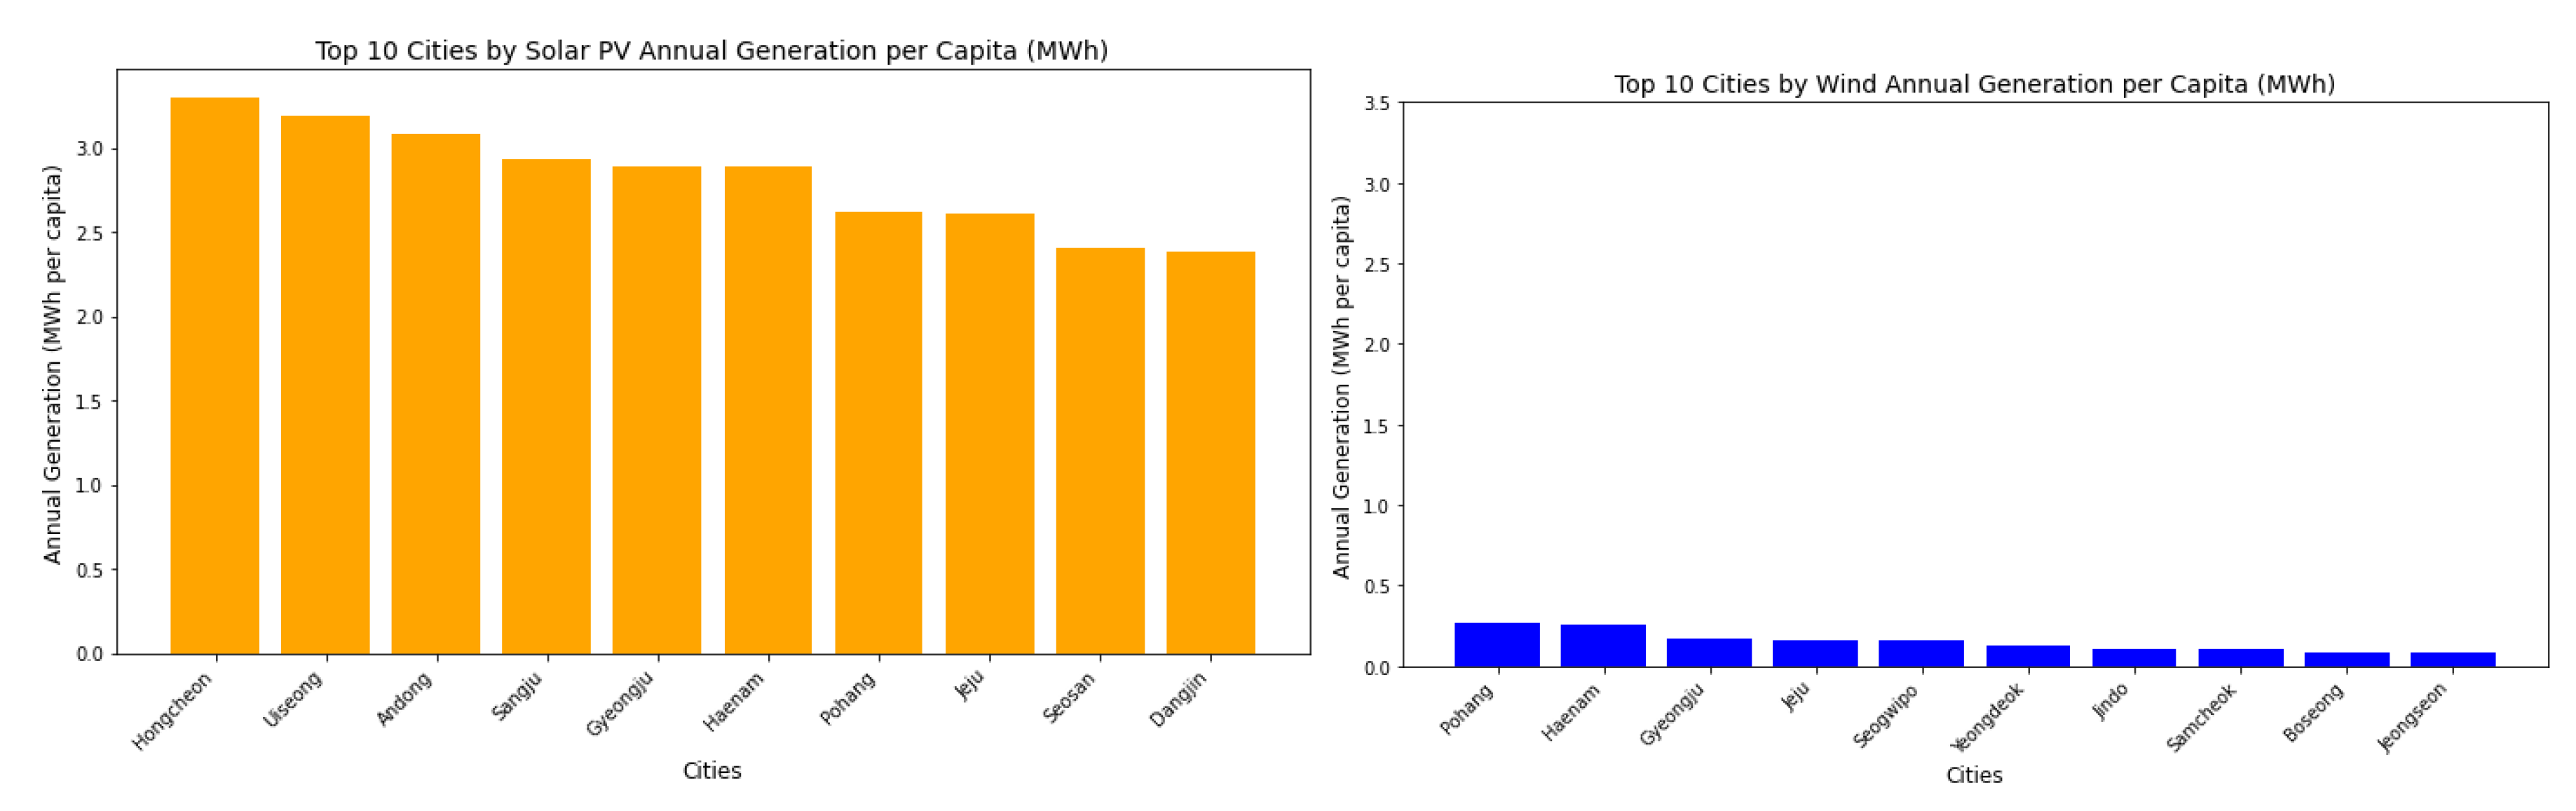
3.3. South Korea
4. Discussion
4.1. Summary of Key Findings
4.2. Implications for Key Stakeholders
4.3. Limitations and future work
5. Conclusion
Acknowledgement: Support for this research from Squadron Energy and Innovation Connections is gratefully acknowledged.
| 1 | RE100 Map: https://re100.anu.edu.au/
|
| 2 | Early-stage cost estimates using concept level scoping with no site-specific review. See AACE’s Cost Estimate Classification System (https://aacei-pittsburgh.org/wp-content/uploads/2021/11/cost-estimating-classification-system.pdf) for details. |
References
- US EPA, “Global Greenhouse Gas Overview.” [Online]. Available: https://www.epa.gov/ghgemissions/global-greenhouse-gas-overview#:~:text=Change%2C Chapter 2.-,Global Emissions by Economic Sector,-Global greenhouse gas.
- Blakers, M. Stocks, B. Lu, C. Cheng, and R. Stocks, “Pathway to 100% Renewable Electricity,” IEEE Journal of Photovoltaics, vol. 9, no. 6, pp. 1828–1833, Nov. 2019. [CrossRef]
- IRENA, “Renewable Capacity Statistics 2024,” 2024.
- Global Energy Monitor, “Global Coal Plant Tracker - Summary Tables,” 2024. [Online]. Available: https://globalenergymonitor.org/projects/global-coal-plant-tracker/summary-tables/.
- World Nuclear Association, “World Nuclear Power Reactors & Uranium Requirements,” Dec-2024. [Online]. Available: https://world-nuclear.org/information-library/facts-and-figures/world-nuclear-power-reactors-and-uranium-requireme.
- S. Rekik and S. El Alimi, “Optimal wind-solar site selection using a GIS-AHP based approach: A case of Tunisia,” Energy Conversion and Management: X, vol. 18, no. February, p. 100355, 2023. [CrossRef]
- M. A. Baseer, S. Rehman, J. P. Meyer, and M. M. Alam, “GIS-based site suitability analysis for wind farm development in Saudi Arabia,” Energy, vol. 141, pp. 1166–1176, Dec. 2017. [CrossRef]
- S. Ali, J. Taweekun, K. Techato, J. Waewsak, and S. Gyawali, “GIS based site suitability assessment for wind and solar farms in Songkhla, Thailand,” Renewable Energy, vol. 132, pp. 1360–1372, 2019. [CrossRef]
- S. K. Saraswat, A. K. Digalwar, S. S. Yadav, and G. Kumar, “MCDM and GIS based modelling technique for assessment of solar and wind farm locations in India,” Renewable Energy, vol. 169, pp. 865–884, 2021. [CrossRef]
- G. Pambudi and N. Nananukul, “A hierarchical fuzzy data envelopment analysis for wind turbine site selection in Indonesia,” Energy Reports, vol. 5, no. 2019, pp. 1041–1047, 2019. [CrossRef]
- N. Wang, T. T. Dang, and N. A. T. Nguyen, “Location Optimization of Wind Plants Using DEA and Fuzzy Multi-Criteria Decision Making: A Case Study in Vietnam,” IEEE Access, vol. 9, pp. 116265–116285, 2021. [CrossRef]
- S. M. Labib, “Investigation of the likelihood of green infrastructure (GI) enhancement along linear waterways or on derelict sites (DS) using machine learning,” Environmental Modelling & Software, vol. 118, pp. 146–165, 2019. [CrossRef]
- K. Gulshad, M. Szydłowski, A. Yaseen, and R. W. Aslam, “A comparative analysis of methods and tools for low impact development (LID) site selection,” Journal of Environmental Management, vol. 354, p. 120212, 2024. [CrossRef]
- J. Malczewski and C. Rinner, Multicriteria decision analysis in geographic information science, vol. 1. Springer, 2015.
- Solargis, “Global Solar Atlas,” 2019. [Online]. Available: https://globalsolaratlas.info/?c=43.866218,86.828145,4. [Accessed: 26-Aug-2019].
- Technical University of Denmark (DTU) and Technical University of Denmark, “Global Wind Atlas,” 2017. [Online]. Available: https://globalwindatlas.info/. [Accessed: 27-Aug-2019].
- T. May, Y. M. Yeap, and A. Ukil, “Comparative evaluation of power loss in HVAC and HVDC transmission systems,” 2016, pp. 637–641.
- N. B. Negra, J. Todorovic, and T. Ackermann, “Loss evaluation of HVAC and HVDC transmission solutions for large offshore wind farms,” Electric Power Systems Research, vol. 76, no. 11, pp. 916–927, 2006. [CrossRef]
- Protected Planet, “Explore the World’s Protected Areas.” [Online]. Available: https://www.protectedplanet.net/en. [Accessed: 17-Dec-2020].
- P. Wang, C. Huang, E. C. Brown de Colstoun, J. C. Tilton, and B. Tan, “Global Human Built-up And Settlement Extent (HBASE) Dataset From Landsat.” NASA Socioeconomic Data and Applications Center (SEDAC), Palisades, New York, 2017.
- USGS EROS, “USGS EROS Archive - Digital Elevation - Shuttle Radar Topography Mission (SRTM) Void Filled,” 2018. [Online]. Available: https://www.usgs.gov/centers/eros/science/usgs-eros-archive-digital-elevation-shuttle-radar-topography-mission-srtm-void?qt-science_center_objects=0#qt-science_center_objects.
- ESRI, “Zonal Histogram (Spatial Analyst).” [Online]. Available: https://pro.arcgis.com/en/pro-app/latest/tool-reference/spatial-analyst/zonal-histogram.htm.
- A.Blakers, “Australia paving way for global solar energy adoption,” PV Magazine, 2023.
- Blakers and R. Rüther, “The fastest energy change in history still underway,” PV Magazine, 24-Apr-2024.
- AEMO, “Transmission Cost Database,” 2023.
- P. Graham, J. Hayward, J. Foster, and L. Havas, “GenCost 2022-23 Final report,” 2023.
- N. Gupta, “A review on the inclusion of wind generation in power system studies,” Renewable and Sustainable Energy Reviews, vol. 59, pp. 530–543, 2016. [CrossRef]
- P. Enevoldsen and M. Z. Jacobson, “Data investigation of installed and output power densities of onshore and offshore wind turbines worldwide,” Energy for Sustainable Development, vol. 60, pp. 40–51, 2021. [CrossRef]
- Vestas Wind Systems A/S, “Vestas introduces the V162-6.8 MW, expanding the EnVentus platform’s power output and market applicability,” 2021. [Online]. Available: https://www.vestas.com/en/media/company-news/2021/vestas-introduces-the-v162-6-8-mw--expanding-the-envent-c3458514.
- 5B, “Solutions for EPCs | 5B - Solar Reinvented.” [Online]. Available: https://5b.co/en/5b-maverick.
- M. Bolinger and G. Bolinger, “Land Requirements for Utility-Scale PV: An Empirical Update on Power and Energy Density,” IEEE Journal of Photovoltaics, vol. PP, pp. 1–6, 2022. [CrossRef]
- GeoServer, “What is GeoServer?” [Online]. Available: https://geoserver.org/.
- ANU RE100 Group, “ANU RE100 Mapping Platform.” [Online]. Available: https://re100.anu.edu.au/.
- TerriaJS, “TerriaMap.” GitHub.
- AEMO, “AEMO Data Dashboard.” [Online]. Available: https://aemo.com.au/en/energy-systems/electricity/national-electricity-market-nem/data-nem/data-dashboard-nem.
- AEMO, “2024 Integrated System Plan,” 2024.
- Geoscience Australia, “Electricity Transmission Lines,” Data.gov.au, 2015. [Online]. Available: https://data.gov.au/dataset/ds-ga-1185c97c-c042-be90-e053-12a3070a969b/details?q=.
- Australian Energy Market Operator, “2023 Transmission Expansion Options Report,” 2023.
- OpenStreetMap Wiki, “Downloading data,” 2023. [Online]. Available: https://wiki.openstreetmap.org/wiki/Downloading_data.
- ANU RE100 Group, “Australian Solar PV and Wind Heat Maps.” [Online]. Available: https://re100.eng.anu.edu.au/heatmaps/.
- ABARES, “Land tenure of Australia 2010–11 to 2015–16, 250 m,” Australian Bureau of Agricultural and Resource Economics and Sciences, 2021. [Online]. Available: https://www.agriculture.gov.au/abares/aclump/land_tenure_2010-11_2015-16.
- ABARES, “Catchment Scale Land Use of Australia – Update December 2023 version 2,” Australian Bureau of Agricultural and Resource Economics and Sciences, 2024. [Online]. Available: https://www.agriculture.gov.au/abares/aclump/land-use/catchment-scale-land-use-and-commodities-update-2023#citation.
- F. Silalahi, A. Blakers, and C. Cheng, “100% Renewable Electricity in Indonesia,” Energies, vol. 17, no. 1, 2024. [CrossRef]
- Technical University of Denmark (DTU), “Global Wind Atlas,” 2017. [Online]. Available: https://globalwindatlas.info/. [Accessed: 27-Aug-2019].
- F. Silalahi, A. Blakers, M. Stocks, B. Lu, C. Cheng, and L. Hayes, “Indonesia’s Vast Solar Energy Potential,” Energies, vol. 14, no. 17, p. 5424, Aug. 2021. [CrossRef]
- F. Silalahi and A. Blakers, “Global Atlas of Marine Floating Solar PV Potential,” Solar, vol. 3, no. 3, pp. 416–433, 2023. [CrossRef]
- R. K. Chopdar, N. Sengar, N. C. Giri, and D. Halliday, “Comprehensive review on agrivoltaics with technical, environmental and societal insights,” Renewable and Sustainable Energy Reviews, vol. 197, p. 114416, 2024. [CrossRef]
- KEMENTERIAN ENERGI DAN SUMBER DAYA MINERAL, “National Electricity Roadmap (RENCANA UMUM KETENAGALISTRIKAN NASIONAL) 2019 - 2038,” 2019.
- A. Pribadi, “Speaking at COP26, Energy Minister Gives Indonesia’s Commitment to Net Zero Emission,” MINISTRY OF ENERGY AND MINERAL RESOURCES,REPUBLIC OF INDONESIA, 2021.
- MASDAR, “President of Indonesia Inaugurates Southeast Asia’s Largest Floating Solar Plant,” 2023.
- Global Energy Monitor, “Global Solar Power Tracker Summary Data - June 2024,” 2024. [Online]. Available: https://docs.google.com/spreadsheets/d/1zxx8JDhgzJlt8ScLxSjl_6pc9lShpdNUV33mwhf5vQ0/edit?gid=1977021392#gid=1977021392.
- International Energy Agency, “An Energy Sector Roadmap to Net Zero Emissions in Indonesia,” 2022.
- CENTRAL BUREAU OF STATISTICS, “Population size and distribution - 2020 Population Census.” [Online]. Available: https://sensus.bps.go.id/main/index/sp2020.
- PT PLN (Persero), “Rencana Usaha Penyediaan Tenaga Listrik (RUPTL),” 2021.
- PT Bukit Asam Tbk, “PTBA Business Diversification to Become a Sustainable Company,” 2023. [Online]. Available: https://www.ptba.co.id/news/ptba-business-diversification-to-become-a-sustainable-company-1676.
- Institute for Essential Services Reform, “Beyond 443 GW—Indonesia’s Infinite Renewable Energy Potentials,” 2021.
- Alius, Qayyum, Mamun, Afifah, and Chung, Ka Yi Karen, “Optimising Solar PV Placement in Indonesia: AHP Multi-Criteria Decision Analysis for Ideal Locations,” E3S Web Conf., vol. 545, p. 2003, 2024. [CrossRef]
- J. Langer et al., “Geospatial analysis of Indonesia’s bankable utility-scale solar PV potential using elements of project finance,” Energy, vol. 283, p. 128555, 2023. [CrossRef]
- NextGIS, “Web GIS made easy.” [Online]. Available: https://nextgis.com/.
- GADM, “Download GADM data (version 4.1).” [Online]. Available: https://gadm.org/download_country.html.
- Michael Bauer Research GmbH, “South Korea SiGun Boundaries.” [Online]. Available: https://www.arcgis.com/home/item.html?id=86fb5b8529f04084865619bac87ee890.

| Project attributes | High-cost | Medium-cost | Low-cost |
|---|---|---|---|
| Overhead line | 1 × Mango SCST 306 MVA, 220kV | 2 × Lychee SCST 491 MVA, 220kV | 2 x Phosphorus SCST 796 MVA |
| Contract delivery model | EPC contract | EPC contract | EPC contract |
| Delivery timetable | Long | Optimum | Optimum |
| Greenfield or brownfield | Brownfield | Partially brownfield | Greenfield |
| Jurisdiction | NSW | NSW | NSW |
| Land Use | Developed area | Grazing | Desert |
| Location wind loading zones | Cyclone region | Non-cyclone region | Non-cyclone region |
| Proportion of environmentally sensitive areas | 100 percent | 50 percent | None |
| Terrain | Mountainous | Hilly/Undulating | Flat/Farmland |
| Location (regional/distance factors) | Remote | Regional | Urban |
| Project network element size | 50 km | 50 km | 50 km |
| Risks | BAU & Class 5b 2 | BAU & Class 5b | BAU & Class 5b |
| Stakeholder and community sensitive region | Highly sensitive | Sensitive | Commensurate with land use |
| Total cost(USD) | 104 million | 84 million | 58 million |
| Unit cost (CAPEXin USD) | $6,800/MW-km | $3,400/MW-km | $1,450/MW-km |
| Transmission OPEX(USD) | 1% of CAPEX p.a. | ||
| Transmission lifetime | 30 years | ||
| Cost components | High-cost | Medium-cost | Low-cost |
|---|---|---|---|
| Solar CAPEX | $1,100/kW | $732/kW | $662/kW |
| Solar OPEX | $12/kW p.a. | ||
| Solar lifetime | 30 years | ||
| Wind CAPEX | $1,849/kW | $1,397/kW | $1,229/kW |
| Wind OPEX | $18/kW p.a. | ||
| Wind lifetime | 25 years | ||
| Discount rate | 5.99% | ||
| Overhead transmission | Underground transmission | |||||
|---|---|---|---|---|---|---|
| High-cost | Medium-cost | Low-cost | High-cost | Medium-cost | Low-cost | |
| Solar (1000m) | Solar overhead high-cost | Solar overhead medium-cost | Solar overhead low-cost | Solar underground high-cost | Solar underground medium-cost | Solar underground low-cost |
| Wind (250m) | Wind overhead high-cost | Wind overhead medium-cost | Wind overhead low-cost | Wind underground high-cost | Wind underground medium-cost | Wind underground low-cost |
| Cost Classes | Sumatera | Java | Kalimantan |
|---|---|---|---|
| Class A: <$30/MWh | - | - | - |
| Class B: $30-40/MWh | - | 1,145 GW | - |
| Class C: $40-50/MWh | 10,363 GW | 6,698 GW | 9,193 GW |
| Class D: $50-60/MWh | 13,708 GW | 471 GW | 7,253 GW |
| Class E: >$60/MWh | 3,488 GW | 1 GW | 1,041 GW |
| Total | 27,559GW | 8,316GW | 17,487GW |
| Population (millions) | 61 | 152 | 17 |
| Cost Classes | Solar PV | Wind (onshore) |
|---|---|---|
| Class A: <$30/MWh | 3,188 GW | 14 GW |
| Class B: $30-40/MWh | 4,853 GW | 75 GW |
| Class C: $40-50/MWh | 9 GW | 100 GW |
| Class D: $50-60/MWh | 0 GW | 101 GW |
| Class E: >$60/MWh | 0 GW | 264 GW |
| Total | 8,050 GW | 555 GW |
Disclaimer/Publisher’s Note: The statements, opinions and data contained in all publications are solely those of the individual author(s) and contributor(s) and not of MDPI and/or the editor(s). MDPI and/or the editor(s) disclaim responsibility for any injury to people or property resulting from any ideas, methods, instructions or products referred to in the content. |
© 2025 by the authors. Licensee MDPI, Basel, Switzerland. This article is an open access article distributed under the terms and conditions of the Creative Commons Attribution (CC BY) license (https://creativecommons.org/licenses/by/4.0/).


