1. Introduction
The remote sensing techniques available at this time seem promising for the study and monitoring of mangrove cover, but their use requires extensive knowledge in the area of remote sensing, which the relevant decision makers generally do not have. For example [
1] analyzed the changes in mangrove forest dynamics over the last 20 years in Bangladesh, using Google Earth Engine (GEE) and the IDRISI program to detect forest changes with the CA-Markov model. Another example is the research of Jia et al. [
2], who also use GEE and algorithms such as OBIA and Random Forest to estimate the global distribution of mangrove cover. In order for users to be able to replicate this research, a background in programming, geographic information systems, remote sensing and classification algorithms would be required. Often, those who manage these lands do not have this set of skills.
Principal component analysis (PCA) is a simple technique that is easy to replicate in virtually any geographic information system. The main objective is to summarize the information contained in a group of variables into a new, smaller set without losing a significant part of the information [
3]. Satellite image acquisitions in adjacent bands of the spectrum tend to detect redundant information due to the fact that different canopies on the ground present similar behavior when their electromagnetic spectrum lengths are close to each other. PCA is widely used for a variety of purposes in the study of mangrove swamps. For example, Tossi et al. [
4] propose a mangrove disturbance index for Iranian mangrove swamps that is generated by means of a PCA generated from WorldView-2 and Sentinel-2 multispectral images.
This study proposes the use of images from any Landsat Collection Level-2 platform for extracting mangrove cover. The method has the advantage that the data collected are scientific products that provide images of the spectral reflectance of the Earth’s surface as it would be measured at ground level in the absence of atmospheric scattering or absorption. USGS Landsat Collection 2 offers improved processing, geometric accuracy, and radiometric calibration compared to the previously available Collection 1 products.
2. Materials and Methods
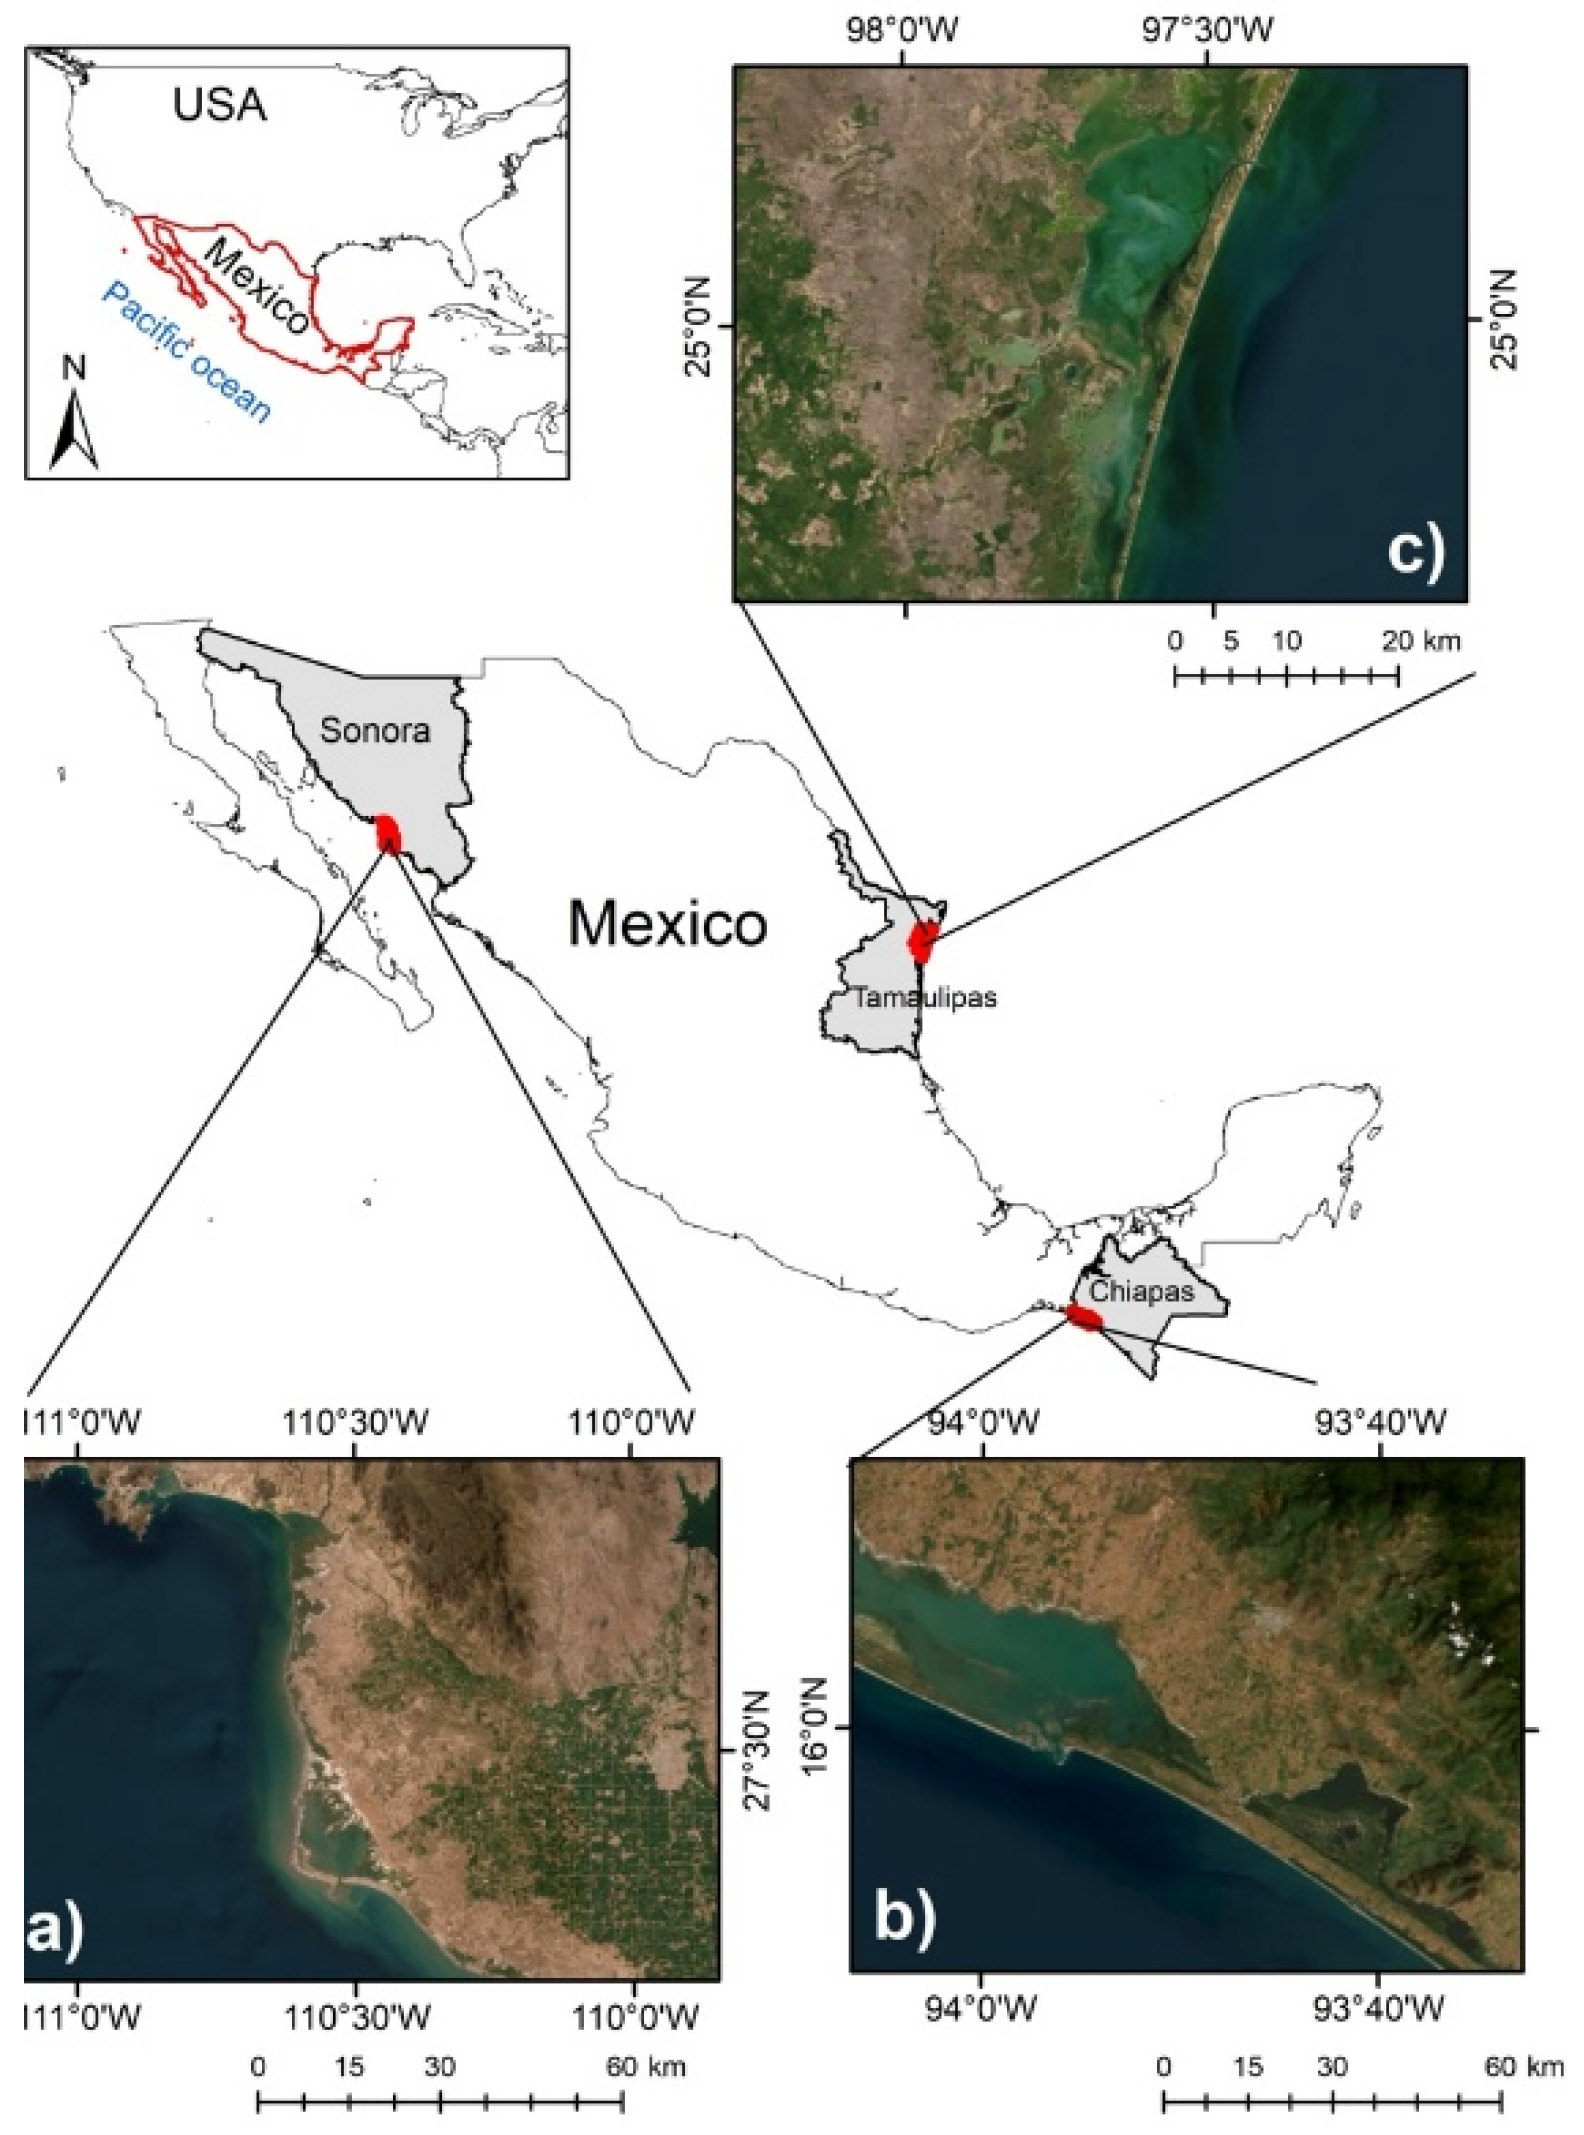
Three RAMSAR sites in Mexico were selected, to represent the different hydroclimatic conditions of the coasts of Mexico. 1) Laguna Guasima, located in northern Sonora state (
Figure 1a), this lagoon is dominated by mangrove swamp of the Gulf of California, which is in the transition between tropical and subtropical climates [
5,
6] 2) Puerto Arista in the state of Chiapas (
Figure 1b), has the tallest mangroves (35 m) in North America and is one of the few flooded mangrove forests in Mexico [
7]. 3) La Laguna Madre in the state of Tamaulipas (
Figure 1c), this lagoon is of vital importance for the redhead (Aythya americana), as more than 75% of the global population of this duck spends the winter there each year [
8].
The images used in the study are from Landsat satellites and were downloaded from the United States Geological Survey (USGS) website
www.earthexplorer.com. Specifically, the images used were from Landsat 9 OLI-2 (operational land imager) for Laguna Guasima, Landsat 5 TM (thematic mapper) for La Laguna Madre, and Landsat 8 OLI for Puerto Arista with date of acquisition in cloud-free months and before the rains. The purpose of using different Landsat products is to determine whether the different radiometric resolutions affect the PCA result, and if not, then users can conduct multitemporal analyses with these Landsat products.
The spectral bands of these images have temporal consistency within the same band and are therefore suitable for comparison purposes [
9,
10]. The images are from Collection 2 Level-2, which have the advantage of being radiometrically calibrated and have high precision orthocorrection using ground control points and a digital elevation model (DEM). To obtain the bands in TOA (top of the atmosphere) values for both TM and OLI sensors, users of Level-2 imagery need only multiply by the scaling factor and subtract the additive factor as shown in the following the Equation:
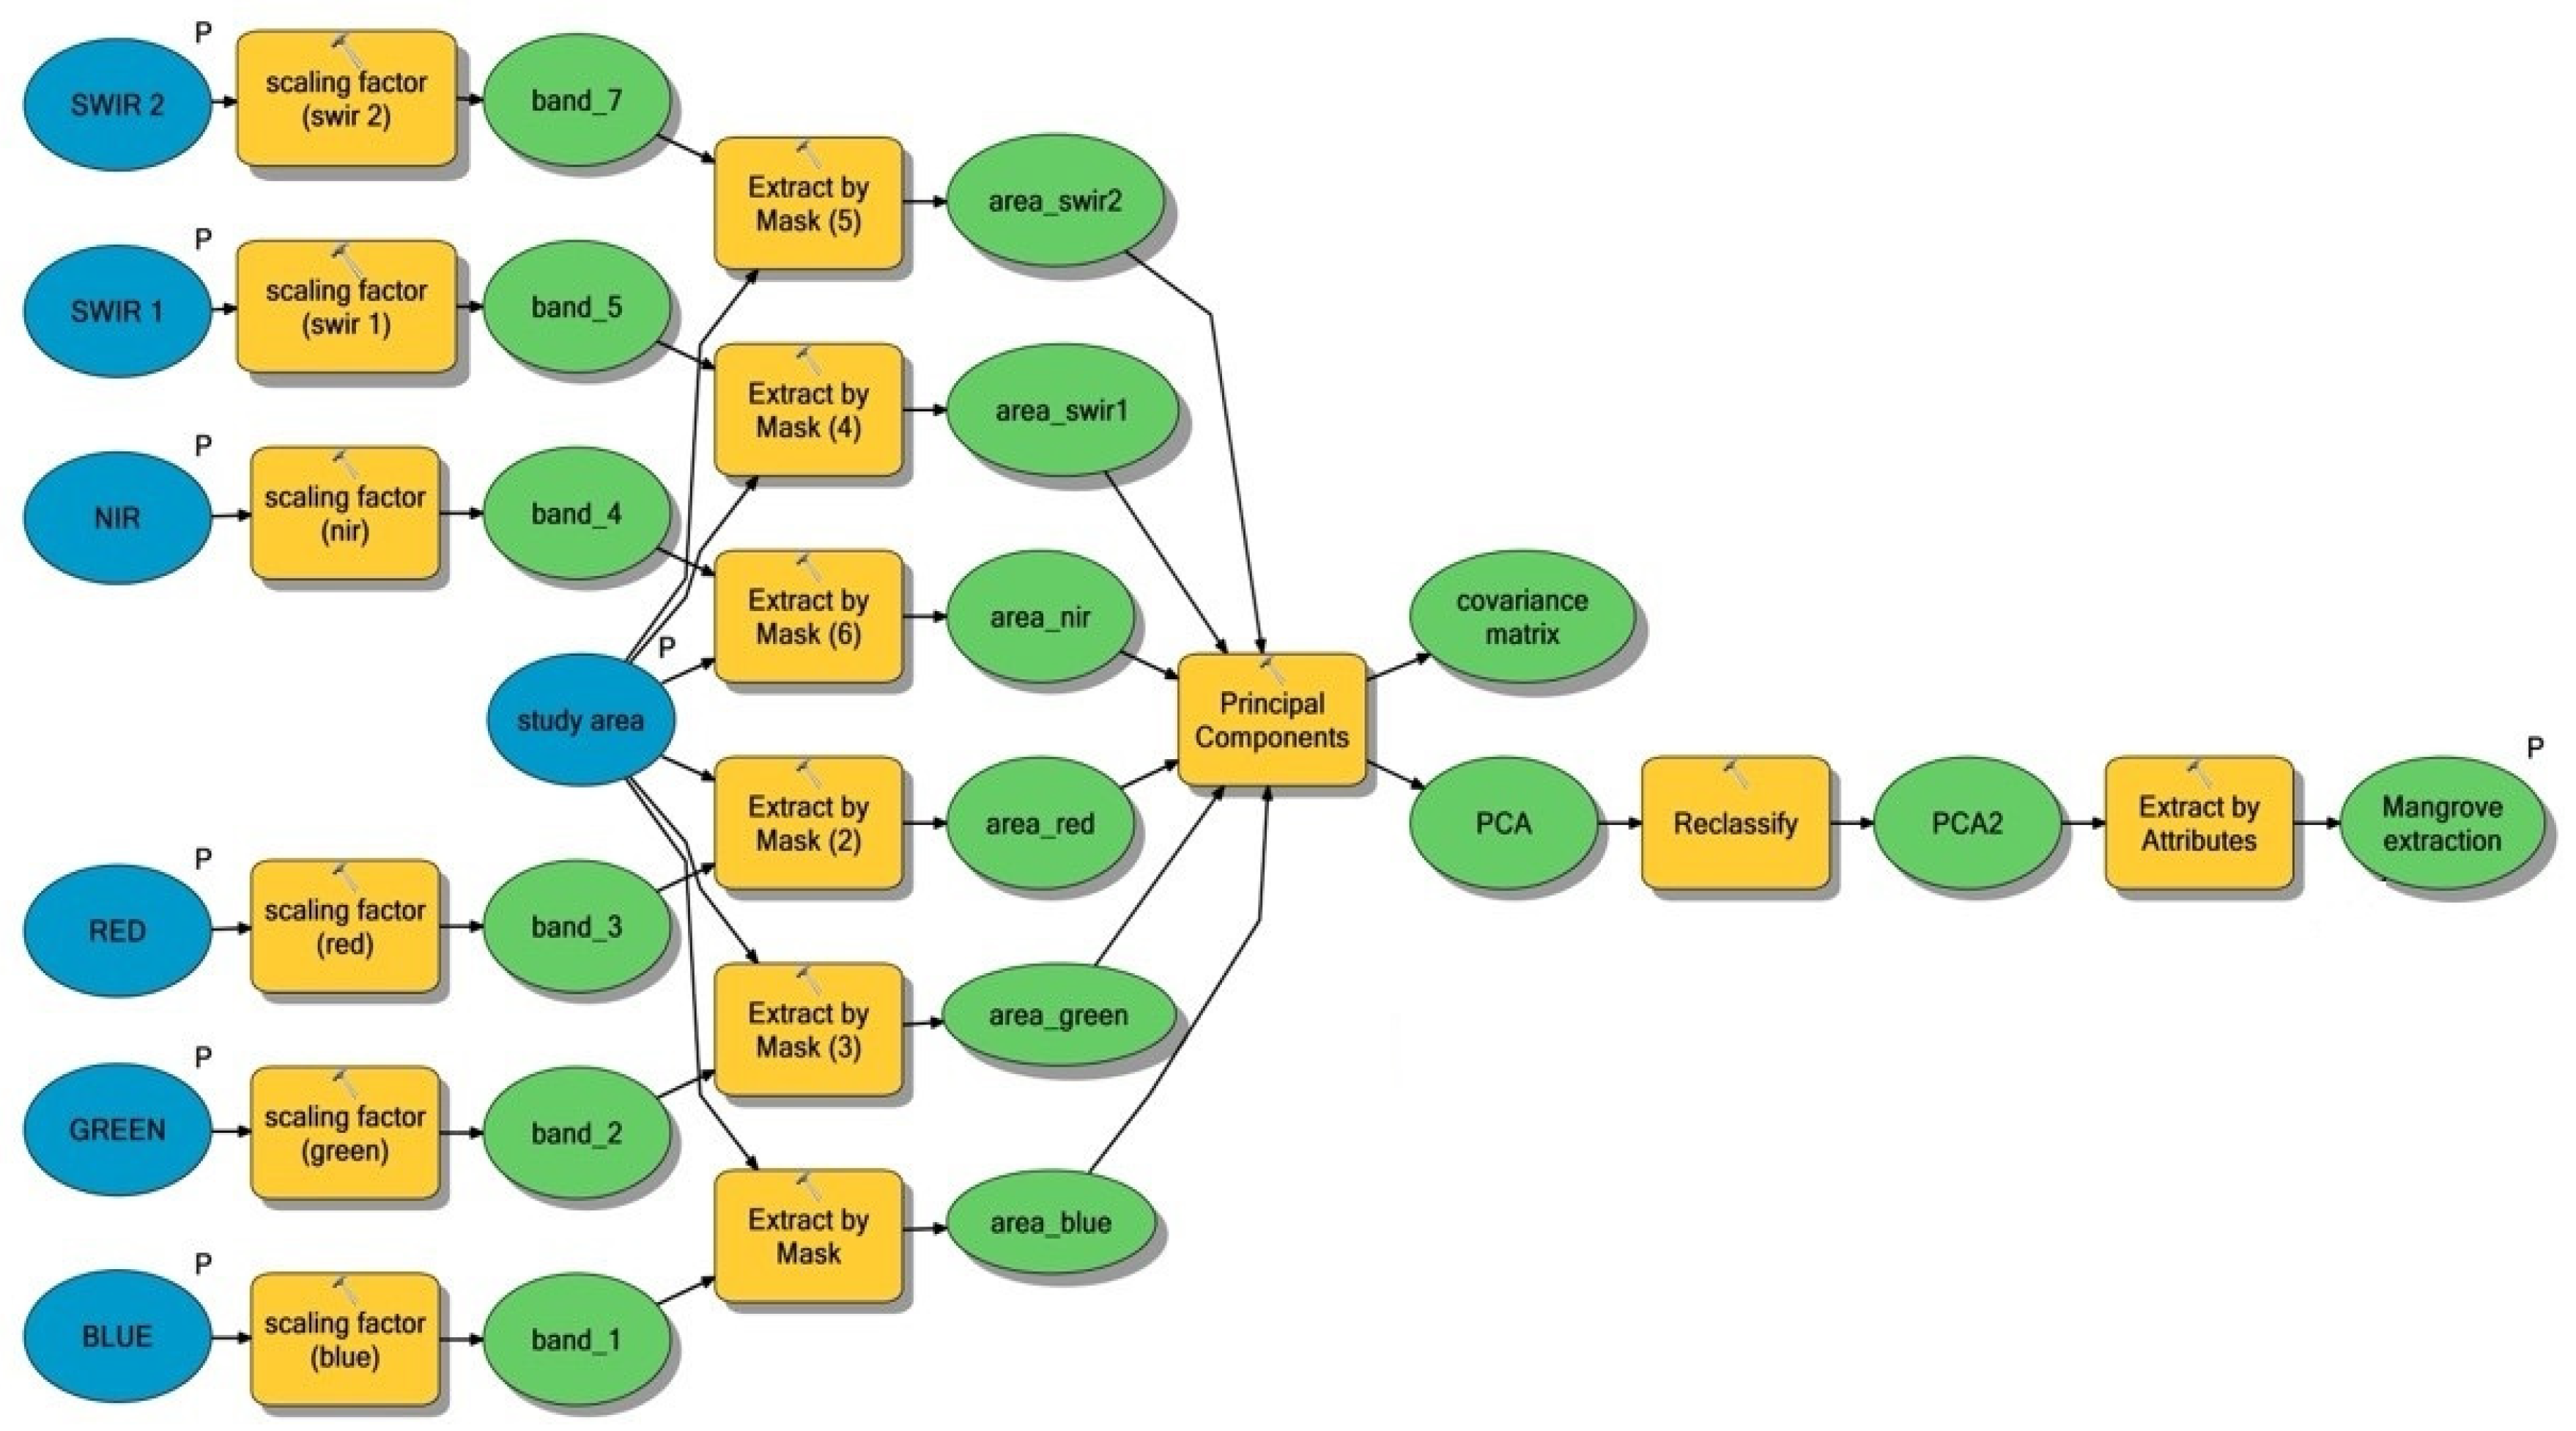
The model builder in ArcGIS was used to carry out an automatization process to extract both mangrove cover polygons. This tool has the advantage that it can be exported to a Python script. The first step is to scale the atmospherically corrected bands to be used in the principal component analysis (PCA). These bands correspond to the visible, near infrared, and mid-wave infrared regions of the electromagnetic spectrum Atmospheric correction is already provided for each of the Landsat image bands from Collection Level-2, so it is only necessary to convert the values to TOA. The next step is to delimit the bands to the area of interest (Ramsar sites) so that all bands can be included in the PCA. The PCA process in ArcGIS basically consists of the following: 1) calculate the variance–covariance matrix of the spectral bands, 2) extract the eigenvalues that represent the magnitude of the vector of each successive component, and 3) produce a raster with the components that retain the information (
Figure 2).
The PCA raster was reclassified following the Jenks natural breaks method [
11], whose main objective is to generate homogeneous groups that maximize the variance between class means and minimize the variance within classes [
12]. This procedure is carried out with the Reclassify function in ArcGIS (
Figure 2). Three classes were defined, which correspond to the first three components, which contain the highest variance in a multispectral image [
3]. The result of the reclassification was an integer raster containing integer values of 1 for pixels corresponding to PC1; values of 2 for PC2 pixels, a principal component which has been reported to have a close relationship with dense vegetation areas [
13] and mangroves [
14]; and values of 3 for PC3, which corresponds to pixels with low multispectral variability, which has been reported to be related to water bodies [
15]. Pixel classification by Jenks’s method has proven to be useful for mangrove classification when using spectral bands from satellite images [
16].
3. Results
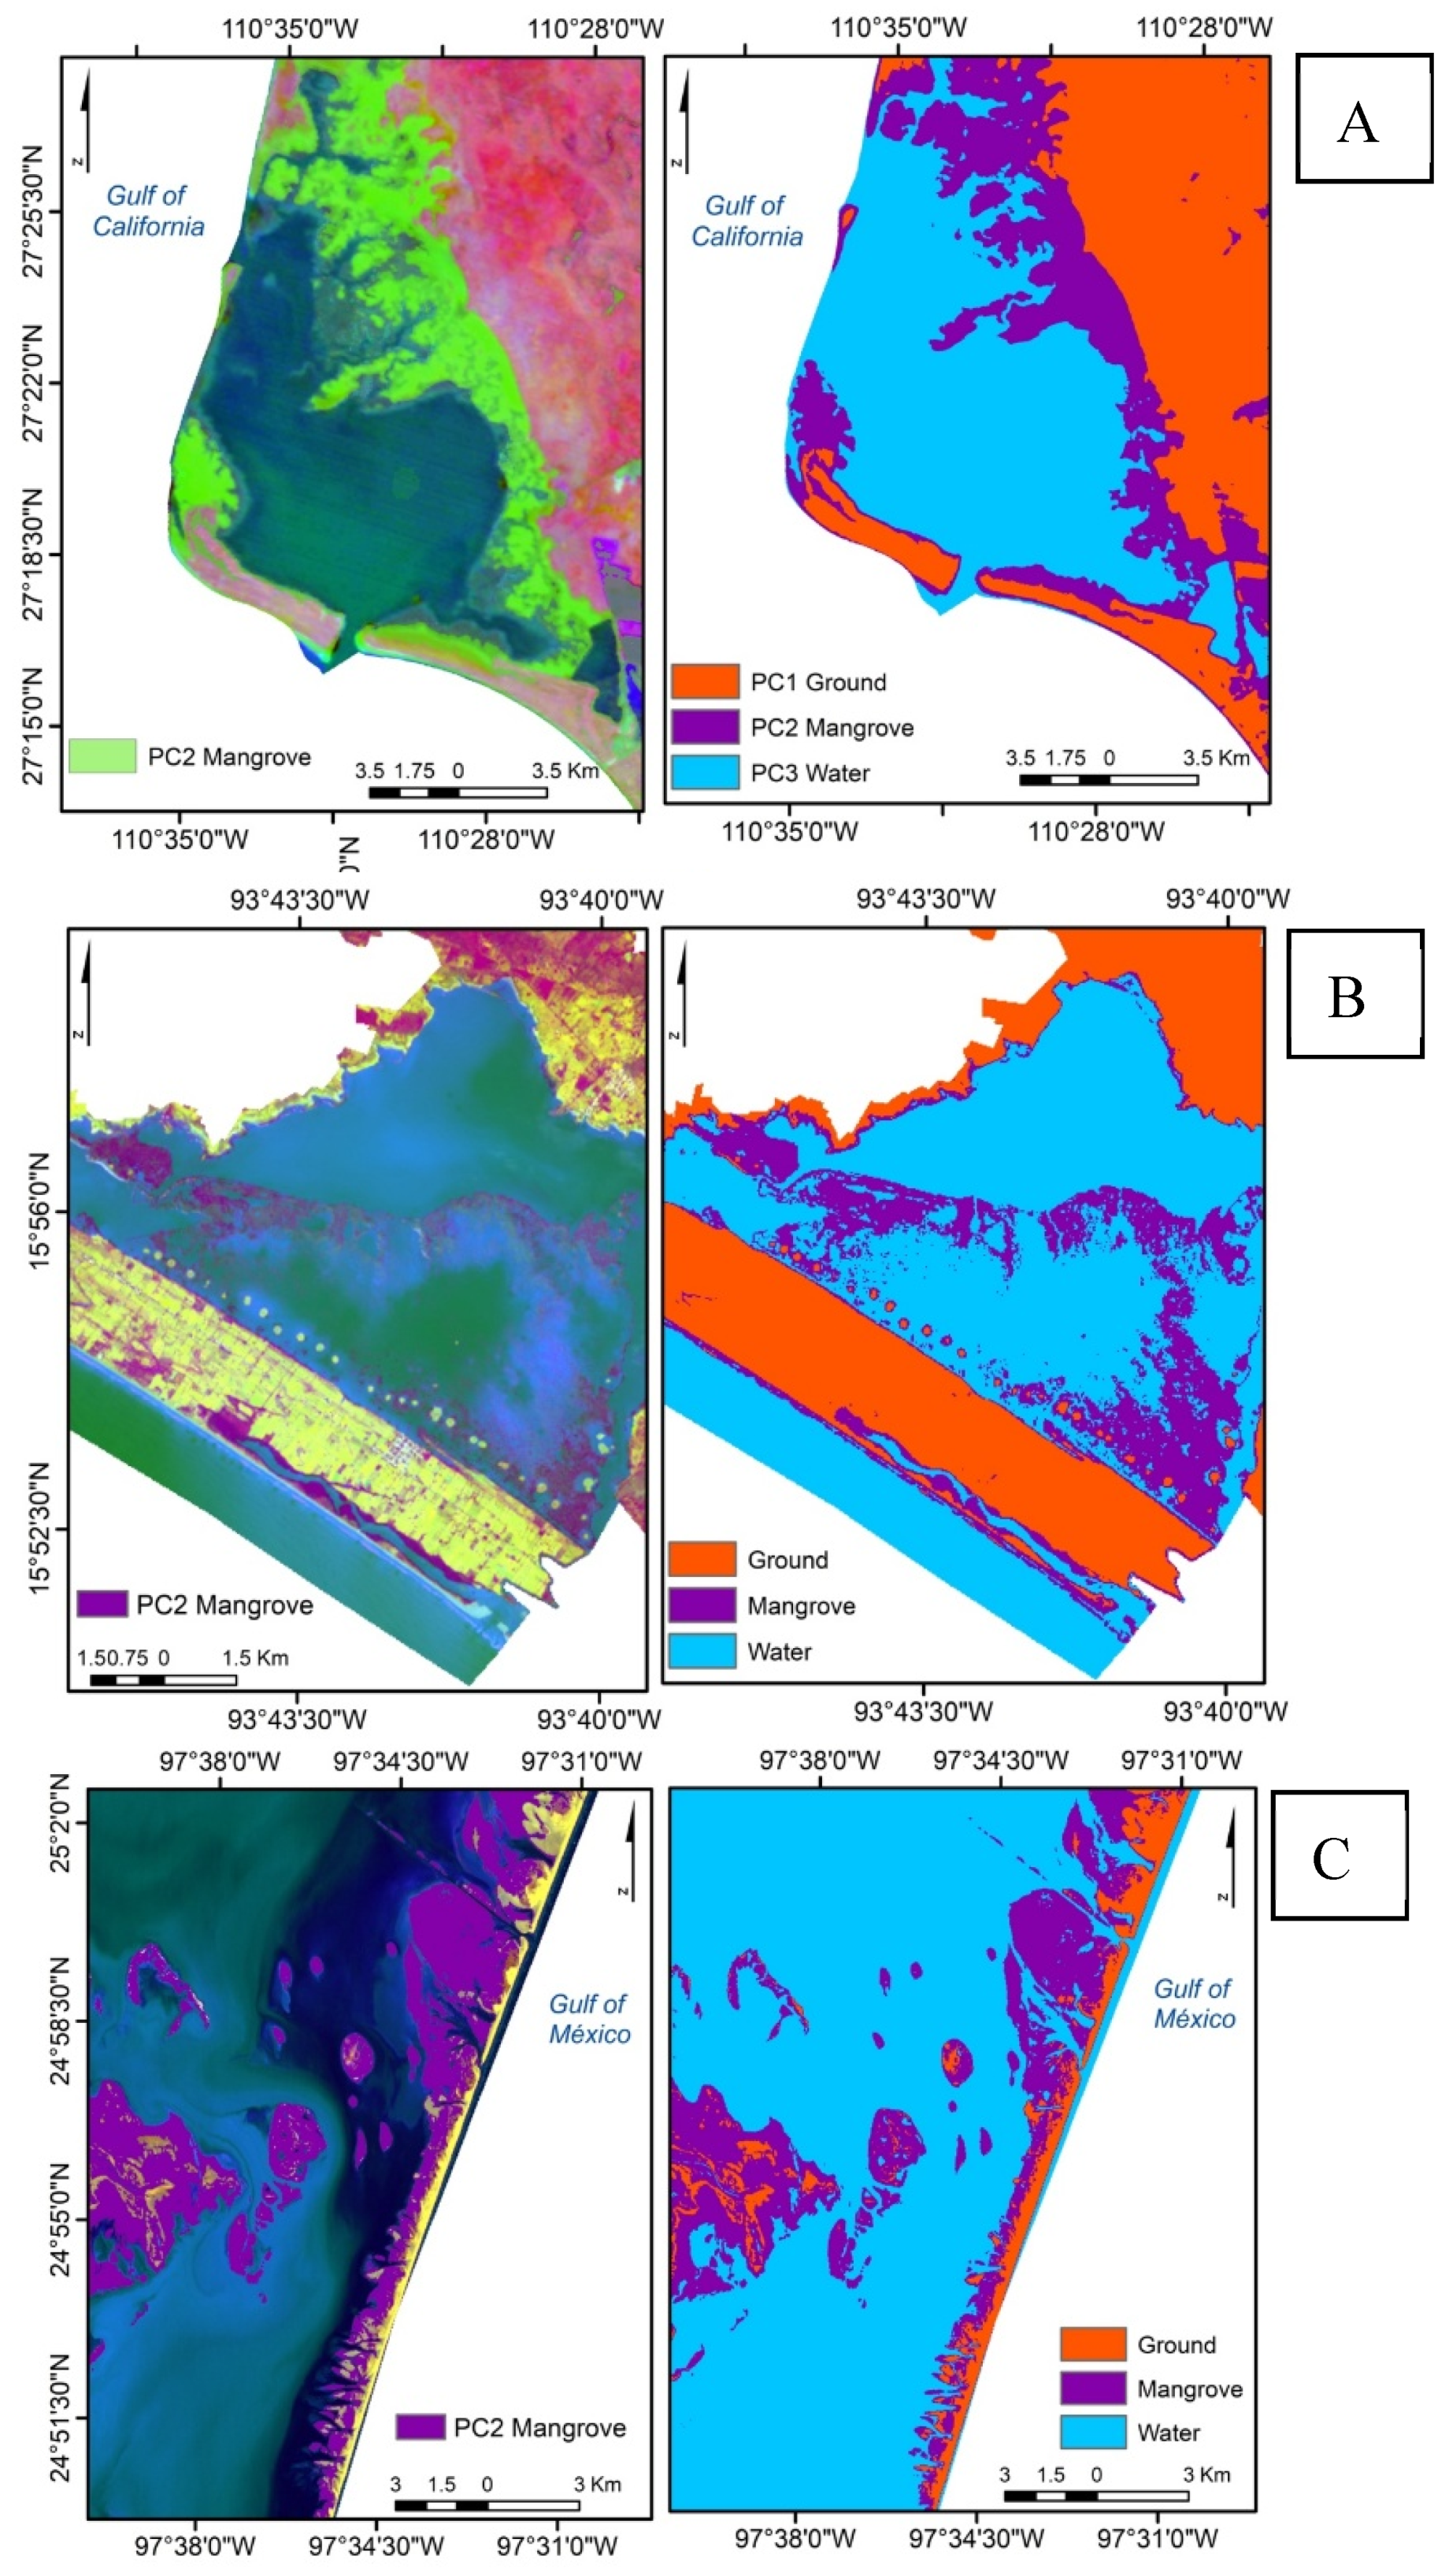
In all Ramsar sites, mangrove cover was clearly delimited in PC 2 with cumulative variances of 3% to 14%. The mangrove swamp with the lowest percentage of variance was Laguna Guasima (
Table 2,
Figure 3). PC 3 for the three sites had cumulative variance of less than 5% and in the images always corresponded to bodies of surface water (
Table 2,
Figure 2), while PC 1 ranged from 80% to 92% of cumulative variance for the three sites and corresponded to areas of cropland, urban land, and vegetation (
Table 2,
Figure 3). For the eigenvectors of PC 2 it was found that in Laguna Madre the spectral band that made the greatest contribution was the NIR, while for Puerto Arista it was SWIR 1 and SWIR 2, and for Laguna Guasima it was the red and green bands (
Table 2). In PC 1 all eigenvectors were positive and the highest values were found in the SWIR bands for all three areas (
Table 3). In PC 3, in Laguna Madre and Puerto Arista the eigenvector with the highest value was in the red band while for Puerto Arista it was the NIR band (
Table 3).
4. Discussion
PCA is a multivariate statistical technique that is very useful in remote sensing because it reduces the dimensionality of the spectral bands [
17]. For example, in our study, transforming the multispectral images composed of three visible bands, one near infrared and two mid-wave infrared, resulted in a set of uncorrelated bands (orthogonal) that facilitated the detection of mangrove cover and water bodies. The detection of mangrove cover in PC 2 coincides with the detection of dense vegetation areas in other investigations such as in Valencia, Spain [
13]. For the case of mangrove cover in Puerto Arista, the eigenvector value of the infrared band is indeed the highest (
Table 3). PCA is considered one of the most efficient methods for mangrove cover detection; for example, Green et al. [
18] mapped mangrove cover in the Turks and Caicos Islands using various sensors; Landsat, SPOT, and Compact Airborne Spectrographic Imager. They tested different classification methods, from visual interpretation to supervised and unsupervised classification and concluded that PCA has up to 92% accuracy. Once again, the eigenvalues of NIR and red were the highest in PC 2. A similar pattern in cumulative variance was found to that reported by Sunkur et al. [
14] in mangrove cover in Madagascar, but they use Sentinel-2 satellite images, finding cumulative variances for PC 2 between 5% and 8%, which is similar to the variances reported in this study (
Table 2). PCA, besides being useful for mangrove cover detection [
19] can also be used for change detection as reported by Prerna et al. [
20] in their investigation of mangrove swamp in the Gulf of Kachchh. Here, in addition to extracting mangrove cover with PCA, it was possible to identify dense and sparse mangroves, and to detect an increase in cover, from 30.69 km2 in 1999 to 38.81 km2 in 2010.
The advantage of using Landsat Collection Level 2 is that there is an archive managed by the USGS of imagery from virtually all over the world that is over 50 years old. Collection 2 images have better geolocation as well as radiometric calibration (Landsat 5, 8, 9) and contain global surface reflectance and surface temperature bands, which allows for multi-temporal analyses [
21]. Another advantage of Collection 2 is the atmospheric correction; traditional algorithms were based on dark objects and assumed that the TOA spectral reflectance of an object was equal to atmospheric reflectance [
22]; however, these algorithms did not correct for atmospheric variations such as scattering and absorption captured by the image. In contrast, the surface reflectance obtained from Collection 2 Level-2 images is atmospherically corrected with the Landsat Ecosystem Data Adaptive Processing System (LEDAPS) algorithm [
23]. This algorithm uses the solar spectrum vector (6SV) by band and retrieves the aerosol optical thickness (AOT) independently using a dense and dark vegetation (DDV) approach [
21].
5. Conclusions
This paper proposes a practical geoprocessing model for identifying and measuring mangrove cover using principal component analysis (PCA). The advantages of this method are: 1) it proposes the use of Collection 2 Level-2 images, which have radiometric and atmospheric corrections, 2) implementing the model in ArcGIS Model Builder enables an automated model that is intuitive, and allows the results to be exported to a Python script, and 3) the model can be replicated accurately with the QGIS model builder tool.
Author Contributions
JGEF conceived the project. JGEF, SS analyzed the data, wrote the paper, edited the paper.
Funding
This research received no external funding
Institutional Review Board Statement
Not applicable
Informed Consent Statement
Not applicable.
Acknowledgments
The tool to obtain the mangrove cover is available in the following toolbox:
Conflicts of Interest
The authors declare no conflicts of interest.
References
- Saoum, M.R.; Sarkar, K.S. Monitoring mangrove forest change and its impacts on the environment. Ecological Indicators 2024, 159, 111666. [Google Scholar] [CrossRef]
- Jia, M.; Wang, Z.; Luo, L.; Zhang, R.; Zhang, H. Global status of mangrove forests in resisting cyclone and tsunami. The Innovation Geoscience. 2023, 1, 100024. [Google Scholar] [CrossRef]
- Chuvieco, E. Teledetección ambiental: La observación de la Tierra desde el espacio. Ariel. 2019.
- Tossi, N.B.; Soffianian, A.R.; Waser, L.T. Mapping disturbance in mangrove ecosystems: Incorporating landscape metrics and PCA-based spatial analysis. Ecological Indicators. 2022, 136, 108718. [Google Scholar] [CrossRef]
- Lluch-Cota, S.E.; Tripp-Valdez, M.; Lluch-Cota, D.B.; Lluch-Belda, D.; Verbesselt, J.; Herrera-Cervantes, H.; Bautista-Romero, J.J. Recent trends in sea surface temperature of Mexico. Atmósfera. 2013, 26, 537–546. [Google Scholar] [CrossRef]
- Páez-Osuna, F.; Sanchez-Cabeza, J.A.; Ruiz-Fernández, A.C.; Alonso-Rodríguez, R.; Piñón-Gimate,A. ; Cardoso-Mohedano, J.G.; Flores-Verdugo, F.J.; Carballo, J.L.; Cisneros-Mata, M.A.; Álvarez-Borrego, S. Environmental status of the Gulf of California: A review of responses to climate change and climate variability. Earth-Science Reviews. 2016, 162, 253–268. [Google Scholar] [CrossRef]
- Mendoza, O.E. Support of the project to protect and conserve sea turtles in “La Encrucijada” Biosphere Reserve, Chiapas, México. In: Mosier A, Allen F, Beth B (Eds.) Proceedings of the Twentieth Annual Symposium on Sea Turtle Biology and Conservation. NOAA Tech Memo. NMFS-SEFSC, Orlando, Florida, USA. 2000. 340–342.
- Onuf, C. Laguna Madre. In Handley, L.; Altsman, D., Ed.; DeMay, R. Seagrass Status and Trends in the Northern Gulf of Mexico: 1940–2002, U.S. Geological Survey Scientific Investigations Report. 2007. [Google Scholar]
- Wulder, M.A.; White, J.C.; Loveland, T.R.; Woodcock, C.E.; Belward, A.S.; Cohen, W.B.; Fosnight, E.A.; Shaw, J.; Masek, J.G.; Roy, D.P. The global Landsat archive: Status, consolidation, and direction. Remote Sens Environ. 2016, 185, 271–283. [Google Scholar] [CrossRef]
- Teixeira, P.C.; Jing, X.; Leigh, L. Evaluation analysis of Landsat level-1 and level-2 data products using in situ measurements. Remote sensing. 2020, 12, 2597. [Google Scholar] [CrossRef]
- Jenks, G.F. Optimal data classification for choropleth maps. Occasional paper No. 2. Lawrence, Kansas: University of Kansas, Department of Geography. 1977.
- Chen, J.; Yang, S.T.; Li, H.W.; Zhang, B.; Lv, JR. Research on geographical environment unit division based on the method of natural breaks (Jenks). The International Archives of the Photogrammetry. Remote Sensing and Spatial Information Sciences. 2013, 40, 47–50. [Google Scholar]
- Estornell, J.; Ruiz, L.A.; Velázquez-Martí, B.; Hermosilla, T. Estimation of biomass and volume of shrub vegetation using LiDAR and spectral data in a Mediterranean environment. Biomass and Bioenergy. 2012, 46, 710–721. [Google Scholar] [CrossRef]
- Sunkur, R.; Kantamaneni, K. , Bokhoree, C.; Ravan, S. Mangroves’ role in supporting ecosystem-based techniques to reduce disaster risk and adapt to climate change: A review. Journal of Sea Research. 2023, 196, 102449. [Google Scholar] [CrossRef]
- Balázs, B.; Bíró, T.; Dyke, G.; Kumar, S.S.; Szabó, S. 2018. Extracting water-related features using reflectance data and principal component analysis of Landsat images. Hydrological Sciences Journal. 2018, 63, 269–284. [Google Scholar] [CrossRef]
- Nuarsa, I.W.; Adnyana, I.W.S.; Sugimori, Y.; Kanno, S.; Nishio, F. Development of The New Algorithm for Mangrove Classification. International Journal of Remote Sensing and Earth Science. 2010, 2, 57–64. [Google Scholar] [CrossRef]
- Harsanyi, J.C.; Chang, C.I. Hyperspectral image classification and dimensionality reduction: an orthogonal subspace projection approach. IEEE TGARS. 1994, 32, 779–785. [Google Scholar] [CrossRef]
- Green, E.P.; Mumby, P.J.; Edwards, A.J.; Clark, C.D.; Ellis, A.C. The assessment of mangrove areas using high resolution multispectral airborne imagery. Journal of Coastal Research. 1998, 14, 433–443. [Google Scholar]
- Kuenzer, C.; Bluemel, A.; Gebhardt, S.; Quoc, T.V.; Dech, S. Remote sensing of mangrove ecosystems: A review. Remote Sens. 2011, 3, 878–928. [Google Scholar] [CrossRef]
- Prerna, R.; Naidu, V.; Sukumaran, S.; Gajbhiye, S. Observed decadal changes in extent of mangroves and coral reefs in southern Gulf of Kachchh using principal component analysis and geo-spatial techniques: a case study. Journal of Coastal Conservation. 2015, 19, 257–267. [Google Scholar] [CrossRef]
- Crawford, C.J.; Roy, D.P.; Arab, S.; Barnes, C.; Vermote. E.; Hulley, G., Gerace, A.; Choate, M.; Engebretson, C.; Micijevic, E.; Shmidt, G.; Anderson, C.; Anderson, M.; Bouchard, M.; Cook, B; Dittmeier, R.; Howard, D.; Jenkerson, C.; Kim, M.; Kleyians, T.; Zahn, S. The 50-year Landsat collection 2 archive. Science of Remote Sensing. 2023, 8, 100103. [Google Scholar] [CrossRef]
- Chavez, Jr P. S. Image-based atmospheric corrections—revisited and improved. Photogramm. Eng Rem Sens. 1996, 62, 1025–1036. [Google Scholar]
- Masek, J.G.; Vermote, E.F.; Saleous, N.E.; Wolfe, R.; Hall, F.G.; Huemmrich, K.F.; Gao, F.; Kutler, J.; Lim, T.K. A Landsat surface-reflectance dataset for North America. 1990–2000. IEEE Geoscience and Remote Sensing Letters. 2006, 3, 68–72. [Google Scholar] [CrossRef]
|
Disclaimer/Publisher’s Note: The statements, opinions and data contained in all publications are solely those of the individual author(s) and contributor(s) and not of MDPI and/or the editor(s). MDPI and/or the editor(s) disclaim responsibility for any injury to people or property resulting from any ideas, methods, instructions or products referred to in the content. |
© 2025 by the authors. Licensee MDPI, Basel, Switzerland. This article is an open access article distributed under the terms and conditions of the Creative Commons Attribution (CC BY) license (http://creativecommons.org/licenses/by/4.0/).