
Submitted:
03 March 2025
Posted:
05 March 2025
You are already at the latest version
Abstract
Good leptomeningeal collaterals (LMC) after large vessel occlusion (LVO) extend the time window for endovascular therapy. The mechanisms regulating LMC activation are not fully understood. The aim of this study was to investigate the potential role of two vasoactive molecules Endothelin-1 (ET1) – vasoconstrictor agent - and nitric oxide (NO) – vasodilator agent - in the regulation of post-stroke LMC. Ischemic stroke patients within 6 hours of LVO were included. Collateral status was assessed using the Menon scoring system based on Computed Tomography Angiography scans. Patients were accordingly divided into three groups: poor, intermediate, and good LMC. Recanalization was evaluated using the modified Thrombolysis in Cerebral Infarction (mTICI) score. Serum levels of ET1 and NO were measured at three time points: T0 (<6 hours), T1 (24 hours), and T2 (48 hours). A total of 105 patients were enrolled (mean age 76 ± 12.8 years): 44 with good (46.2%), 36 with intermediate (37.8%), and 22 with poor LMCs (23.1%). NO values decreased whereas ET1 values increased from T0 to T1 in all groups of patients. No significant association was found between serum ET-1 levels and collateral status. Higher ET-1 levels at T1 correlated with poor outcome regardless the LMC status and the degree of recanalization (p = 0.030). A significant linear positive correlation was revealed at T0 between high levels of ET-1 and neutrophils count (Spearman’s rho = 0.236; p=0.035). Subgroup analysis showed a significant inverse correlation at T1 between NO and the collateral score (Spearman’s rho= -0.251, p=0.021). Although we observed no significant association between LMC score and serum ET-1 concentrations, at 24 hours higher ET-1 serum levels were predictive of poor outcome and higher NO levels were correlated with poor collateral status. These findings may indicate an inadequate microvascular reperfusion possibly due to ET-1 mediated vasoconstriction, neutrophil activation and NO mediated oxidative stress, suggesting their potential role in no-reflow phenomenon.
Keywords:
ET-1
; NO
; leptomeningeal collaterals
; acute ischemic stroke
; reperfusion
1. Introduction
The In the past 10 years significant progress has been made in the treatment of acute ischemic stroke (AIS). This progress has stemmed primarily from advances in the scientific knowledge on pathophysiology of brain ischemia and a deeper comprehension of infarct progression over time. The ischemic penumbra refers to the hypoperfused and yet viable tissue that relies on the activation of collateral circulation and its persistence over time. Recently, alongside the still valid concept of “Time is brain”, two other clock concepts have been established: the “collateral-clock” [1] and the “clot-clock” [2] concept. The collateral-clock refers to the persistence in certain individuals of collateral circulation, which play a critical role in sustaining the ischemic penumbra. Thanks to collaterals the therapeutic time window has been extended to 24 h from stroke onset [3,4]. The clot-clock refers to the evolution of the clot inside the blood vessel. Over time, the occluding thrombus changes and becomes not more lysable from thrombolytic agents and less removable from endovascular procedures [2]. Patients with poor collateral circulation as shown in multiphasic computed tomography angiography (CTA) studies have a worse clinical outcome, even if revascularized within 4,5-6 hours, compared to patients with good collateral circulation who are revascularized beyond this time window (“fast and slow progressors") [5]. In other cases, the arterial revascularization is not followed by an efficacious microvascular reperfusion, leading to the so-called “futile recanalization” [6]. Understanding the mechanisms underlying collaterals activation after ischemic stroke is crucial in developing potential therapies to sustain and improve collateral circulation, enabling endovascular treatment for more patients affected by stroke. In addition to the circle of Willis which represents a valuable anastomotic ring at the base of the brain connecting the left and right carotid arteries and the anterior and posterior brain circulation, leptomeningeal collaterals (LMC) represent an important network of small arteriole-to-arteriole bypass vessels that connect the anterior, middle, and posterior cerebral arteries (ACA, MCA, PCA) in the pia mater [7].
The extent of collateral circulation varies greatly among individuals, particularly with respect to the circle of Willis. There are substantial differences in the extent and completeness of intracranial circulation in normal individuals. Collaterogenesis seems to have a genetic basis. Allelic variants of Rab GTPase-effector binding protein 2 (Rabep 2), in the Dce1 locus on chromosome 7 account for about 80% of the anatomical variation of LMC in mice. Rabep 2 is involved in VEGF A-VEGFR 2 signaling and its absence leads to impaired embryonal collateral formation [8]. LMC are involved in normal brain function, dilating in response to activity in specific brain areas [9]. In pathological conditions, the recruitment of inactive collaterals can occur rapidly: for example, maximum dilation of leptomeningeal arteries occurs within 12 seconds after occlusion of the common carotid artery [10]. Pressure gradients between the various arterial territories involved are thought to activate LMC [11]. However, the degree and persistence of LMC activation varies significantly between individuals [9,11]. The reasons for this individual variability and the precise mechanisms for LMC activation remain incompletely understood. Anatomic, metabolic and hemodynamic factors have been proposed, and clinical studies have shown that poor collaterals correlate with older age, metabolic syndrome, hyperuricemia and chronic hypertension [11].
Nitric oxide (NO) and Endothelin-1 (ET1) are two pleiotropic molecules with opposite effect on smooth muscle cells contraction involved in autoregulation of cerebral blood flow (CBF). NO is a potent gaseous, lipophilic vasodilator produced by NO synthase (NOS) which also has a variety of other actions [12]. NOS is present in nature into three isoforms: neuronal-NOS (nNOS), endothelial-NOS (eNOS) and inducible-NOS (iNOS). The first two isoforms are constitutively expressed in various mammalian cell types and produce NO in response to elevated intracellular calcium concentrations. In contrast, iNOS activity is independent of calcium levels and is regulated by the activation of transcription factors in response to cytokines and growth factors. NO production by iNOS is delayed, more abundant and sustained and is thought to be primarily responsible for neurotoxic post-ischemic brain injury [13]. The massive production of reactive oxygen and nitrogen species in neurons due to NOS uncoupling, contributes to neurotoxicity. In contrast, eNOS-induced NO increases immediately after stroke and seems to play a neuroprotective role through vasodilation, inhibiting platelet aggregation, and preventing leukocyte adhesion and migration, thereby limiting neuronal damage [14].
NO induces vasodilation by activating guanylate cyclase, which increases cyclic guanosine monophosphate (cGMP)-dependent protein kinase in smooth muscle cells. Soluble guanylate cyclase deficiency in mice impairs the vascular response to NO and is associated with larger infarct sizes and worse neurological outcomes during reperfusion after transient cerebral ischemia, suggesting that cGMP regulates CBF during reperfusion [15].
Additionally, NO exerts its vasoactive function by inhibiting the intracellular biosynthesis of the potent vasoconstrictor endothelin-1 (ET-1), reducing the release of soluble Endothelin Converting Enzyme-1 (ECE-1) from endothelial cells. ECE-1 cleaves ET-1 precursor, BigET-1, and is considered the rate-limiting step in the production of ET-1 [16,17]. The potent vasoconstrictor effect of ET-1 on smooth muscle cells can be reversed by NO donors in epicardial arteries, which also inhibits ET-A receptor binding [18,19].
The primary aim of this study was to investigate, in vivo in humans, how two key molecules, NO and ET-1, may influence the activation of LMCs following large vessel occlusion (LVO) AIS. Secondary objectives were: 1) to evaluate NO and ET1 serum levels time course after AIS; 2) to investigate the potential relationship between NO and ET1 serum levels and the degree of recanalization; 3) to examine the correlation between NO and ET-1 serum levels and clinical outcomes.
2. Results
We enrolled 105 patients with LVO AIS, 39 males (37.1%) and 66 females (62.9%); mean ±SD age 76.0 ±12.8 years. 30 patients (28.5%) had a wake-up stroke or unknown onset of symptoms.
2.1. Patients’ Characteristics and Clinical Outcome
We did not find any statistically significant differences between the three groups as regards demographic characteristics, previous medical therapy, blood pressure, heart rate, and serum glucose values at the three time points (Table 1, Supplementary Tables S1 and S2). Patients with poor collateral status had a more severe stroke with higher NIHSS score at T0 (poor vs. intermediate vs. good collateral status group, p=0.035). Clinical outcome expressed by mRS at 90 days post-stroke was not influenced by the collateral status (Supplementary Table S3).
2.2. Biomarkers
ET-1 serum level increased whereas NO serum levels decreased from T0 to T1 in the overall population (ET-1 11.93 pg/mL vs. 16.63 pg/mL; NO 49.71 μM vs. 23.46 μM) regardless of the collateral status (Figure 1). ET-1 levels reached a plateau from T1 and T2, while NO levels showed a slight further decrease from T1 to T2 (Figure 1; Supplementary Tables S4 and S5).
The biomarker values − both in the peripheral venous and pre- and post-occlusion arterial intracranial blood samples − examined at the three time points did not show significant differences between groups according to the collateral status (Figure 2, Supplementary Tables S4 and S5).
Patients with higher ET-1 levels at T1 had poor outcome (mRS at 3 months) regardless of the LMC status and the degree of recanalization (Table 2).
Subgroup analysis showed a significant inverse correlation at T1 between NO and the collateral score (Spearman’s rho= -0.251, p=0.021; Figure 3).
A significant linear positive correlation was found at T0 between high levels of ET-1 and neutrophils count (Spearman’s rho = 0.236; p=0.035) (Figure 4).
3. Discussion
Authors The autoregulation of cerebral arteries and the neurovascular coupling remain highly complex and not fully elucidated phenomena [26]. The primary goal is to maintain stable cerebral blood flow (CBF) across the brain, adjusting dynamically to variations in metabolic demand. The small cerebral arteries, arterioles, venules, and capillaries are essential for preserving blood flow within the brain. During ischemic conditions, the initial defense mechanism is the vasodilation of cerebral arterioles and the activation of LMCs, which help to support the ischemic penumbra [11] until recanalization. A thorough understanding of the mechanisms underlying LMC activation is imperative. In fact, this knowledge is pivotal for the development of novel therapeutic strategies aimed at preserving the ischemic penumbra, thereby optimizing recovery following recanalization interventions.
Main aim of this study was to investigate the role of ET-1 and NO in post-LVO stroke LMC activation in vivo in humans. We did not find a statistically significant correlation between serum concentrations of ET-1 and extent of LMCs suggesting that their activation is a complex, multifactorial process influenced by multiple interacting factors.
We found an opposite time course of ET-1 and NO after AIS. The ET-1 increases while NO decreases from T0 to T1 regardless of LMC status. A plausible explanation is that NO plays a key role in LMC activation, with higher concentrations in the early phases of stroke to promote collateral vasodilatation, followed by a progressive decline; on the contrary, ET-1 levels rise over the first 24 hours, likely as a counterregulatory response. Indeed, there are evidences that ET-1 and NO directly regulate each other to achieve vascular tone homeostasis. Stimulation of NO production in endothelial cells can reduce ET-1 expression and production [12]. We can hypothesize that, following the rapid response of the vascular endothelium to reduced CBF —characterized by decreased ET-1 and increased NO [27] in order to activate LMCs— there may be a subsequent decrease in peripheral NO levels and a concurrent rise in ET-1, as observed in our study. In fact, ET-1 exerts its vasoconstrictive action mainly through the ETA receptors widely represented on the smooth muscle cells of brain arterioles and its raise not counteracting by the vasodilator effect of NO could lead to vasoconstriction of brain arterioles and poor reperfusion [28].
Moreover, we observed that higher NO levels at 24 hours were associated with baseline poorer collateral status. This may be explained by the hypothesis that increased NO production in patients with limited leptomeningeal collaterals serves as a compensatory mechanism, potentially enhancing the activation and vasodilation of underdeveloped collateral pathways to better support the ischemic penumbra. Another possible explanation could be that at 24 hours the vasodilator effect of NO is overcome by the deleterious nitrosative production of free radicals and neurotoxic effects. In endothelial cell dysfunction eNOS expression increases and the enzyme becomes uncoupled, producing the highly reactive superoxide species instead of NO [13]. We also found that higher ET-1 levels at 24 hours correlated with poor outcome regardless of the LMC status and the degree of recanalization, suggesting that this may be attributable to its impact on the microcirculation.
Indeed, we observed a positive correlation between ET-1 levels and neutrophil counts at baseline, supporting also the role of ET-1 in post-stroke neuroinflammation. Several studies have shown that ET-1 enhances neutrophil adhesion to endothelial cells, promotes the production of chemotactic factors and activates specific endothelin receptors (ETB), all of which contribute to the inflammatory response and neutrophil recruitment, particularly in ischemic injury [30,31,32]. This sequence of events could have toxic effects on the microvasculature after LVO recanalization, leading to incomplete reperfusion of the ischemic brain tissue (no-reflow phenomenon) and ultimately resulting in a poor outcome [6].
This is further supported by previous studies in humans that have observed a positive correlation between elevated ET-1 levels and unfavorable outcomes [33,34]. However, other studies have reported normal ET-1 levels following AIS [35,36,37,38]. These conflicting results may be due to the different timing of sampling across studies: in the early stage of stroke (within 24 hours after the onset of symptoms), ET-1 levels were increased, as in our study, whereas they were reported to be normal if the sampling was performed after 24 hours. To the best of our knowledge, this is the first study investigating the relationship between ET-1 and collateral activation following AIS.
The primary limitation of our study is the small sample size of subgroups, which may have limited our ability to detect statistically significant differences in the association between collateral status and some of the examined biomarkers.
In addition, some considerations need to be made. First, LMCs activation is very fast after LVO; it has been demonstrated in animals that the leptomeningeal arteries reach their maximum dilation within 12 seconds following the occlusion of the common carotid artery [10]. T0 in our study represents the admission time at the emergency room which was variable within 4.5 and 24 hours from stroke onset. It is possible that the concentration we have dosed in the peripheral and intracranial blood is only a far surrogate of what could be found in the brain during the first minutes after LVO. Second, NO is a gaseous lipophilic molecule not measurable in the blood. We determined the metabolites of NO (nitrites and nitrates), and this could have partly invalidated the study results. Third, NO is produced by different NOS isoform: the endothelial, which acts as a powerful vasodilator, the neuronal and the inducible NOS with different actions [12,13]. Unfortunately, we cannot distinguish the metabolites of NO to determine which isoforms they are generated from. Moreover, the biochemistry of NO is highly complex, with new insights into the regulation of NO biosynthesis and the mechanisms of signal transduction continuously emerging [12].
Finally, the single-center design of the project may limit the generalizability of our findings.
The strengths of this study lie in a comprehensive biomarker analysis of both peripheral/intracranial blood samples and integration with neuroimaging techniques, a specific focus on clinically relevant condition such as leptomeningeal collateral activation after AIS, and the prospective design.
In conclusion, although our results do not demonstrate a direct correlation between ET-1/NO levels and the degree of collateral status at baseline, it is not possible to exclude the potential role of these vasomotor agents in LMC activation. Further investigations in order to study the vasoactive effects of these molecules on collaterals activation in experimental middle cerebral artery occlusion are needed. In our population, higher ET-1 at admission correlated with neutrophils count and at 24 hours predicted 3-month poor outcome, whereas an inverse correlation between NO and the collateral score was observed at 24 hours. These findings may suggest a novel hypothesis about the involvement of these molecules in the no-reflow phenomenon. Further explorations could provide valuable insights to a better understanding of futile recanalization mechanisms.
4. Materials and Methods
4.1. Patients
This is a prospective observational study. We enrolled consecutive AIS patients aged 18 years or older, who were admitted to the Emergency Department of our teaching hospital between November 2019 and December 2021.
Inclusion criteria were AIS within six hours onset or wake up stroke, presence of LVO of anterior cerebral circulation (tandem occlusion – internal carotid artery [ICA] plus middle cerebral artery [MCA] - MCA occlusion, M1 or proximal M2 segments) evaluated with multiphasic Computed Tomography Angiography (CTA).
Exclusion criteria were evidence of hemorrhagic stroke, stroke without LVO or any contraindication to contrast media injection. Upon admission, we performed a general and neurological examination and ECG. Clinical data were recorded including demographic characteristics, presence of stroke risk factors (hypertension, atrial fibrillation, diabetes, hypercholesterolemia, significant carotid stenosis, tobacco use, alcohol abuse, history of transient ischemic attack (TIA), previous stroke, myocardial infarction, renal failure, cancer and current medications use. Functional status was evaluated with modified Ranking Scale (mRS) before the index stroke and at 3 months after stroke onset as measure of outcome. Stroke etiology was classified according to Trial of Org 10,172 in Acute Stroke Treatment (TOAST) criteria [20].
We defined 3 timepoints: time 0 (T0) at admission; time 1 (T1) at 24 hours and time 2 (T2) at 48 hours. At any timepoint stroke severity was assessed using the National Institutes of health Stroke Scale (NIHSS) and blood samples were performed. Glucose levels, arterial pressure, heart rate and temperature were also measured at the defined time points.
4.2. Laboratory Data
Blood samples obtained from patients were collected into tubes with or without anticoagulant (with 3.8% sodium citrate) and centrifuged at 300 g for 10 min at room temperature to obtain supernatant. Plasma and serum samples were immediately stored at −80 ◦C until the time of analysis. Additional blood samples were analyzed for routine exams at T0 (e.g. complete blood count, CRP, creatinine, glucose, cholesterol), some exams were repeated at T1 and T2 (blood count, CRP, glucose).
The intracranial blood samples were obtained during the endovascular procedure: 1) at pre-occlusion time, directly from the microcatheter adjacent to the intracranial site of occlusion; 2) at post-occlusion time, directly from the microcatheter beyond the intracranial site of occlusion.
4.2.1. ET1
Quantitative determination of ET-1 levels was measured in serum samples by ELISA kit [TEMA ricerca srl, Castenaso (Bologna), Italy] according to the manufacturer’s instructions. The values for for ET-1 was expressed in pg/mL. Both intra- and inter-assay coefficients of variation were <10%.
4.2.2. NO
Dosing NO for scientific purpose is very difficult due to its very short-lasting half-life, about 6 second, for this reason it is accepted to use, for measure NO presence, analysis of its metabolites ions nitrite (NO2 ) and nitrate (NO3-), together referred as NOx [21].
NO production was evaluated in the serum samples. A colorimetric assay kit (Abcam, Cambridge, UK) was used to determine the metabolites of NO (nitrites and nitrates, NOx) in 100 µL of samples under stirring conditions for 10 min at 37 ◦C. Values are expressed as µM. Intra- and inter-assay coefficients of variation were 2.9% and 1.7%, respectively.
4.3. Radiological Data
All patients underwent multiphasic CTA at admission to confirm the presence of LVO and indication for endovascular treatment and to grade extent of collateral circulation. Patients with wake up/unknown onset stroke performed CT perfusion or MRI perfusion also, they were included in the study only if a CTA was performed.
LMCs scoring was performed using rLMCm (regional LMC method) as described by Menon et al. (2011) [22]. This scoring system evaluates the retrograde filling of leptomeningeal collaterals distal to the occluded vessel - MCA or intracranial ICA - making comparison with the healthy contralateral side. The score is assigned separately to different regions and six MCA region, ACA region and basal ganglia region. The score assigned 0 point, if vessels are not detectable compared to contralateral side, 1 point if they are less prominent or 2 points if they are equal or more prominent. Higher scores were assigned to sylvian sulcus vessels because they are considered marker of good retrograde LMC filling, and particularly 0 point, if vessels are not detectable compared to contralateral side, 2 points if they are less prominent or 4 points if they are equal or more prominent. The LMC status is obtained by summing the scores of individual regions, with a range from a minimum of 0 to a maximum of 20 points. Patients are classified as having good LMC if their score is between 17 and 20, medium LMC if their score is between 11 and 16, and poor LMC if their score is 10 or lower. Based on collateral status, we divided our population into three groups (good collaterals 17-20; intermediate collaterals 11-16; poor collaterals 0-10).
Alberta stroke program early CT score (ASPECTS) was calculated on non-contrast CT [23].
Patients eligible for endovascular treatment underwent digital subtraction angiography (DSA).
Recanalization rate was defined on DSA images using modified treatment in cerebral infarction (mTICI) score as follows: grade 0 no perfusion; grade 1 anterograde reperfusion past the initial occlusion, but with little or slow distal reperfusion; grade 2a anterograde reperfusion of less than half of the occluded artery territory (e.g. in one major division of the middle cerebral artery (MCA); grade 2b anterograde reperfusion of more than half of occluded artery territory (e.g. in two major divisions of the MCA) and grade 3 complete anterograde reperfusion of the previously occluded artery [24].
We dichotomize our patients having poor recanalization with mTICI score 0-2a or good recanalization with score 2b-3.
The final ischemic lesion volume was evaluated by diffusion weighted images (DWI) MRI sequences, using ABC/2 formula [25]. MRI was performed at 24-48 h from admission. Follow-up CT scan was performed in patients with contraindications to MRI.
Three expert neuroradiologists rated the LMC status, the ASPECT score and ischemic lesion volume on multiphasic CTA. Disagreement was resolved by revision of neuroimaging and discussion to meet a consensus. A fourth neuroradiology expert was consulted to decide if consensus was not achieved initially.
4.4. Statistical Analysis
The descriptive statistical analysis of the total population and of the three groups of interest was carried out by calculating means or medians for continuous variables based on their normal or non-normal distribution as well as by calculating frequencies and proportions (or percentages) for dichotomic/categorical variables. We compared categorical variables using the Fisher test or chi-square test when appropriate. Correlations between variables were assessed by calculating the Pearson or Spearman coefficient as appropriate. We presented the course of the molecular biomarkers across different time points. For all tests that were performed, a value of p < 0.05 was considered statistically significant. Statistical analysis was performed using SPSS statistical software (IBM Corp, SPSS Statistics for Windows, Version 25, Armonk, NY, USA)
Supplementary Materials
The following supporting information can be downloaded at the website of this paper posted on Preprints.org, Figure S1: title; Table S1: title; Video S1: title.
Author Contributions
Conceptualization, MI, AR and MDM; methodology, AR, PA and SL.; validation, RC, VC, SL; formal analysis, PA and SL; investigation, MI, AR, MTDM and MDM; resources, MDM.; data curation, IB, FB, CC; writing—original draft preparation, MI and MDM; writing—review and editing, MI, PA, SL and MDM; visualization, MI and PA; supervision, DT; project administration, MI and MDM; funding acquisition, MI and MDM. All authors have read and agreed to the published version of the manuscript.
Funding
This study was supported by Sapienza, University of Rome: Ricerca Ateneo Sapienza Progetti per Avvio alla ricerca (protocol number: AR120172B783068D).
Institutional Review Board Statement
All study participants provided written informed consent. The study was conducted according to the Declaration of Helsinki and approved by the Ethics Committee of the University Hospital Umberto I (ID: 5323).
Informed Consent Statement
Written informed consent has been obtained from all the patients to publish this paper.
Data Availability Statement
Data are contained within the article and Supplementary Materials.
Conflicts of Interest
The authors declare no conflicts of interest.
References
- Vagal, A.; Aviv, R.; Sucharew, H.; Reddy, M.; Hou, Q.; Michel, P.; Jovin, T.; Tomsick, T.; Wintermark, M.; Khatri, P. Collateral Clock Is More Important Than Time Clock for Tissue Fate. Stroke 2018, 49, 2102–2107. [CrossRef]
- De Michele, M.; Lorenzano, S.; Bertuccini, L.; Iosi, F.; Toni, D. “Time lost is clot resolution lost”: the neglected perspective of the therapeutic time window for ischemic stroke. Front. Neurol. 2023, 14, 1177609. [CrossRef]
- Nogueira, R.G.; Jadhav, A.P.; Haussen, D.C.; Bonafe, A.; Budzik, R.F.; Bhuva, P.; Yavagal, D.R.; Ribo, M.; Cognard, C.; Hanel, R.A.; et al. Thrombectomy 6 to 24 Hours after Stroke with a Mismatch between Deficit and Infarct. N. Engl. J. Med. 2018, 378, 11–21. [CrossRef]
- Albers, G.W.; Marks, M.P.; Kemp, S.; Christensen, S.; Tsai, J.P.; Ortega-Gutierrez, S.; McTaggart, R.A.; Torbey, M.T.; Kim-Tenser, M.; Leslie-Mazwi, T.; et al. Thrombectomy for Stroke at 6 to 16 Hours with Selection by Perfusion Imaging. New Engl. J. Med. 2018, 378, 708–718. [CrossRef]
- Rocha, M.; Jovin, T.G. Fast versus slow progressors of infarct growth in large vessel occlusion stroke: Clinical and research implications. Stroke 2017, 48, 2621–2627.
- Jia M, Jin F, Li S, Ren C, Ruchi M, Ding Y, Zhao W, Ji X. No-reflow after stroke reperfusion therapy: An emerging phe-nomenon to be explored. CNS Neurosci Ther. 2024;30(2):e14631.
- Liebeskind, D.S. Collateral circulation. Stroke 2003, 34, 2279–2284.
- Kofler, N.; Corti, F.; Rivera-Molina, F.; Deng, Y.; Toomre, D.; Simons, M. The Rab-effector protein RABEP2 regulates endosomal trafficking to mediate vascular endothelial growth factor receptor-2 (VEGFR2)-dependent signaling. J. Biol. Chem. 2018, 293, 4805–4817. [CrossRef]
- Logothetis, N.K.; Pauls, J.; Augath, M.; Trinath, T.; Oeltermann, A. Neurophysiological investigation of the basis of the fMRI signal. Nature 2001, 412, 150–157.
- Morita, Y.; Fukuuchi, Y.; Koto, A.; Suzuki, N.; Isozumi, K.; Gotoh, J.; Shimizu, T.; Takao, M.; Aoyama, M. Rapid Changes in Pial Arterial Diameter and Cerebral Blood Flow Caused by Ipsilateral Carotid Artery Occlusion in Rats.. Keio J. Med. 1997, 46, 120–127. [CrossRef]
- Maguida, G.; Shuaib, A. Collateral Circulation in Ischemic Stroke: An Updated Review. J. Stroke 2023, 25, 179–198. [CrossRef]
- Lundberg, J.O.; Weitzberg, E. Nitric oxide signaling in health and disease. Cell 2022, 185, 2853–2878. [CrossRef]
- Wang, Z.; Chen, G.; Chen, Z.-Q.; Mou, R.-T.; Feng, D.-X. The role of nitric oxide in stroke. Med Gas Res. 2017, 7, 194–203. [CrossRef]
- Iadecola, C.; Pelligrino, D.A.; Moskowitz, M.A.; Lassen, N.A. Nitric oxide synthase inhibition and cerebrovascular regula-tion. J. Cereb. Blood Flow Metab. 1994, 14, 175–192.
- Atochin, D.N.; Yuzawa, I.; Li, Q.; Rauwerdink, K.M.; Malhotra, R.; Chang, J.; Brouckaert, P.; Ayata, C.; Moskowitz, M.A.; Bloch, K.D.; et al. Soluble Guanylate Cyclase α1β1 Limits Stroke Size and Attenuates Neurological Injury. Stroke 2010, 41, 1815–1819. [CrossRef]
- Ohkita, M.; Takaoka, M.; Shiota, Y.; Nojiri, R.; Matsumura, Y. Nitric oxide inhibits endothelin-1 production through the suppression of nuclear factor kB. Clin. Sci. 2002, 103, 68–71.
- Kuruppu, S.; Rajapakse, N.W.; Dunstan, R.A.; Smith, A.I. Nitric oxide inhibits the production of soluble endothelin con-verting enzyme-1. Mol. Cell. Biochem. 2014, 396, 49–54.
- Wiley, K.E.; Davenport, A.P. Novel nitric oxide donors reverse endothelin-1-mediated constriction in human blood vessels. J. Cardiovasc. Pharmacol. 2000, 36.
- Wiley, K.E.; Davenport, A.P. Physiological antagonism of endothelin-1 in human conductance and resistance coronary ar-tery. Br. J. Pharmacol. 2001, 133, 568–574.
- Adams, H.P. Jr; Bendixen, B.H.; Kappelle, L.J.; Biller, J.; Love, B.B.; Gordon, D.L.; Marsh, E.E. 3rd. Classification of Subtype of Acute Ischemic Stroke. Definitions for Use in a Multicenter Clinical Trial. TOAST. Trial of Org 10172 in Acute Stroke Treatment. Stroke 1993, 24(1), 35–41.
- Lauer, T.; Preik, M.; Rassaf, T.; Strauer, B.E.; Deussen, A.; Feelisch, M.; Kelm, M. Plasma nitrite rather than nitrate reflects regional endothelial nitric oxide synthase activity but lacks intrinsic vasodilator action. Proc. Natl. Acad. Sci. 2001, 98, 12814–12819. [CrossRef]
- Menon, B.; Smith, E.; Modi, J.; Patel, S.; Bhatia, R.; Watson, T.; Hill, M.D.; Demchuk, A.; Goyal, M. Regional Leptomeningeal Score on CT Angiography Predicts Clinical and Imaging Outcomes in Patients with Acute Anterior Circulation Occlusions. Am. J. Neuroradiol. 2011, 32, 1640–1645. [CrossRef]
- Aviv, R.; Mandelcorn, J.; Chakraborty, S.; Gladstone, D.; Malham, S.; Tomlinson, G.; Fox, A.; Symons, S. Alberta Stroke Program Early CT Scoring of CT Perfusion in Early Stroke Visualization and Assessment. Am. J. Neuroradiol. 2007, 28, 1975–1980. [CrossRef]
- Zaidat, O.O.; et al. Recommendations on angiographic revascularization grading standards for acute ischemic stroke: A consensus statement. Stroke 2013, 44, 2650–2663.
- Sims, J.R.; Gharai, L.R.; Schaefer, P.W.; Vangel, M.; Rosenthal, E.S.; Lev, M.H.; Schwamm, L. ABC/2 for rapid clinical estimate of infarct, perfusion, and mismatch volumes. Neurology 2009, 72, 2104–2110. [CrossRef]
- Iadecola, C. The Neurovascular Unit Coming of Age: A Journey through Neurovascular Coupling in Health and Disease. Neuron 2017, 96, 17–42. [CrossRef]
- Džoljić E, Grbatinić I, Kostić V. Why is nitric oxide important for our brain? Funct Neurol 2015, 30(3):159-63.
- Shah, R. Endothelins in health and disease. Eur. J. Intern. Med. 2007, 18, 272–282. [CrossRef]
- Franceschini R, Gandolfo C, Cataldi A, Del Sette M, Rolandi A, Corsini G, Rolandi E, Barreca T. Twenty-four-hour endo-thelin-1 secretory pattern in stroke patients. Biomed Pharmacother 2001, 55(5):272-6.
- Farré, A.L.; Riesco, A.; Espinosa, G.; Digiuni, E.; Cernadas, M.R.; Alvarez, V.; Montón, M.; Rivas, F.; Gallego, M.J.; Egido, J. Effect of endothelin-1 on neutrophil adhesion to endothelial cells and perfused heart.. Circulation 1993, 88, 1166–1171. [CrossRef]
- Hofman, F.M.; Chen, P.; Jeyaseelan, R.; Incardona, F.; Fisher, M.; Zidovetzki, R. Endothelin-1 induces production of the neutrophil chemotactic factor interleukin-8 by human brain-derived endothelial cells.. 1998, 92, 3064–72.
- Koehl, B.; Nivoit, P.; El Nemer, W.; Lenoir, O.; Hermand, P.; Pereira, C.; Brousse, V.; Guyonnet, L.; Ghinatti, G.; Benkerrou, M.; et al. The endothelin B receptor plays a crucial role in the adhesion of neutrophils to the endothelium in sickle cell disease. Haematologica 2017, 102, 1161–1172. [CrossRef]
- Ziv, I.; Fleminger, G.; Djaldetti, R.; Achiron, A.; Melamed, E.; Sokolovsky, M. Increased plasma endothelin-1 in acute ischemic stroke.. Stroke 1992, 23, 1014–1016. [CrossRef]
- Estrada, V.; Téllez, M.J.; Moya, J.; Fernández-Durango, R.; Egido, J.; Cruz, A.F. High Plasma Levels of Endothelin-1 and Atrial Natriuretic Peptide in Patients With Acute Ischemic Stroke. Am. J. Hypertens. 1994, 7, 1085–1089. [CrossRef]
- Suzuki, H.; Sato, S.; Suzuki, Y.; Takekoshi, K.; Ishihara, N.; Shimoda, S. Increased endothelin concentration in CSF from patients with subarachnoid hemorrhage. Acta Neurol. Scand. 1990, 81, 553–554. [CrossRef]
- Lampl, Y.; Fleminger, G.; Gilad, R.; Galron, R.; Sarova-Pinhas, I.; Sokolovsky, M. Endothelin in cerebrospinal fluid and plasma of patients in the early stage of ischemic stroke.. Stroke 1997, 28, 1951–1955. [CrossRef]
- Hamann, G.; Isenberg, E.; Strittmatter, M.; Moili, R.; Schimrigk, K. Big-endothelin in acute ischemic stroke. J. Stroke Cerebrovasc. Dis. 1993, 3, 256–260. [CrossRef]
- Haapaniemi, E.; Tatlisumak, T.; Hamel, K.; Soinne, L.; Lanni, C.; Opgenorth, T.J.; Kaste, M. Plasma Endothelin-1 Levels Neither Increase nor Correlate With Neurological Scores, Stroke Risk Factors, or Outcome in Patients With Ischemic Stroke. Stroke 2000, 31, 720–725. [CrossRef]
Figure 1.
Temporal course of peripheral biomarkers (ET-1 and NO) in the three collateral groups.
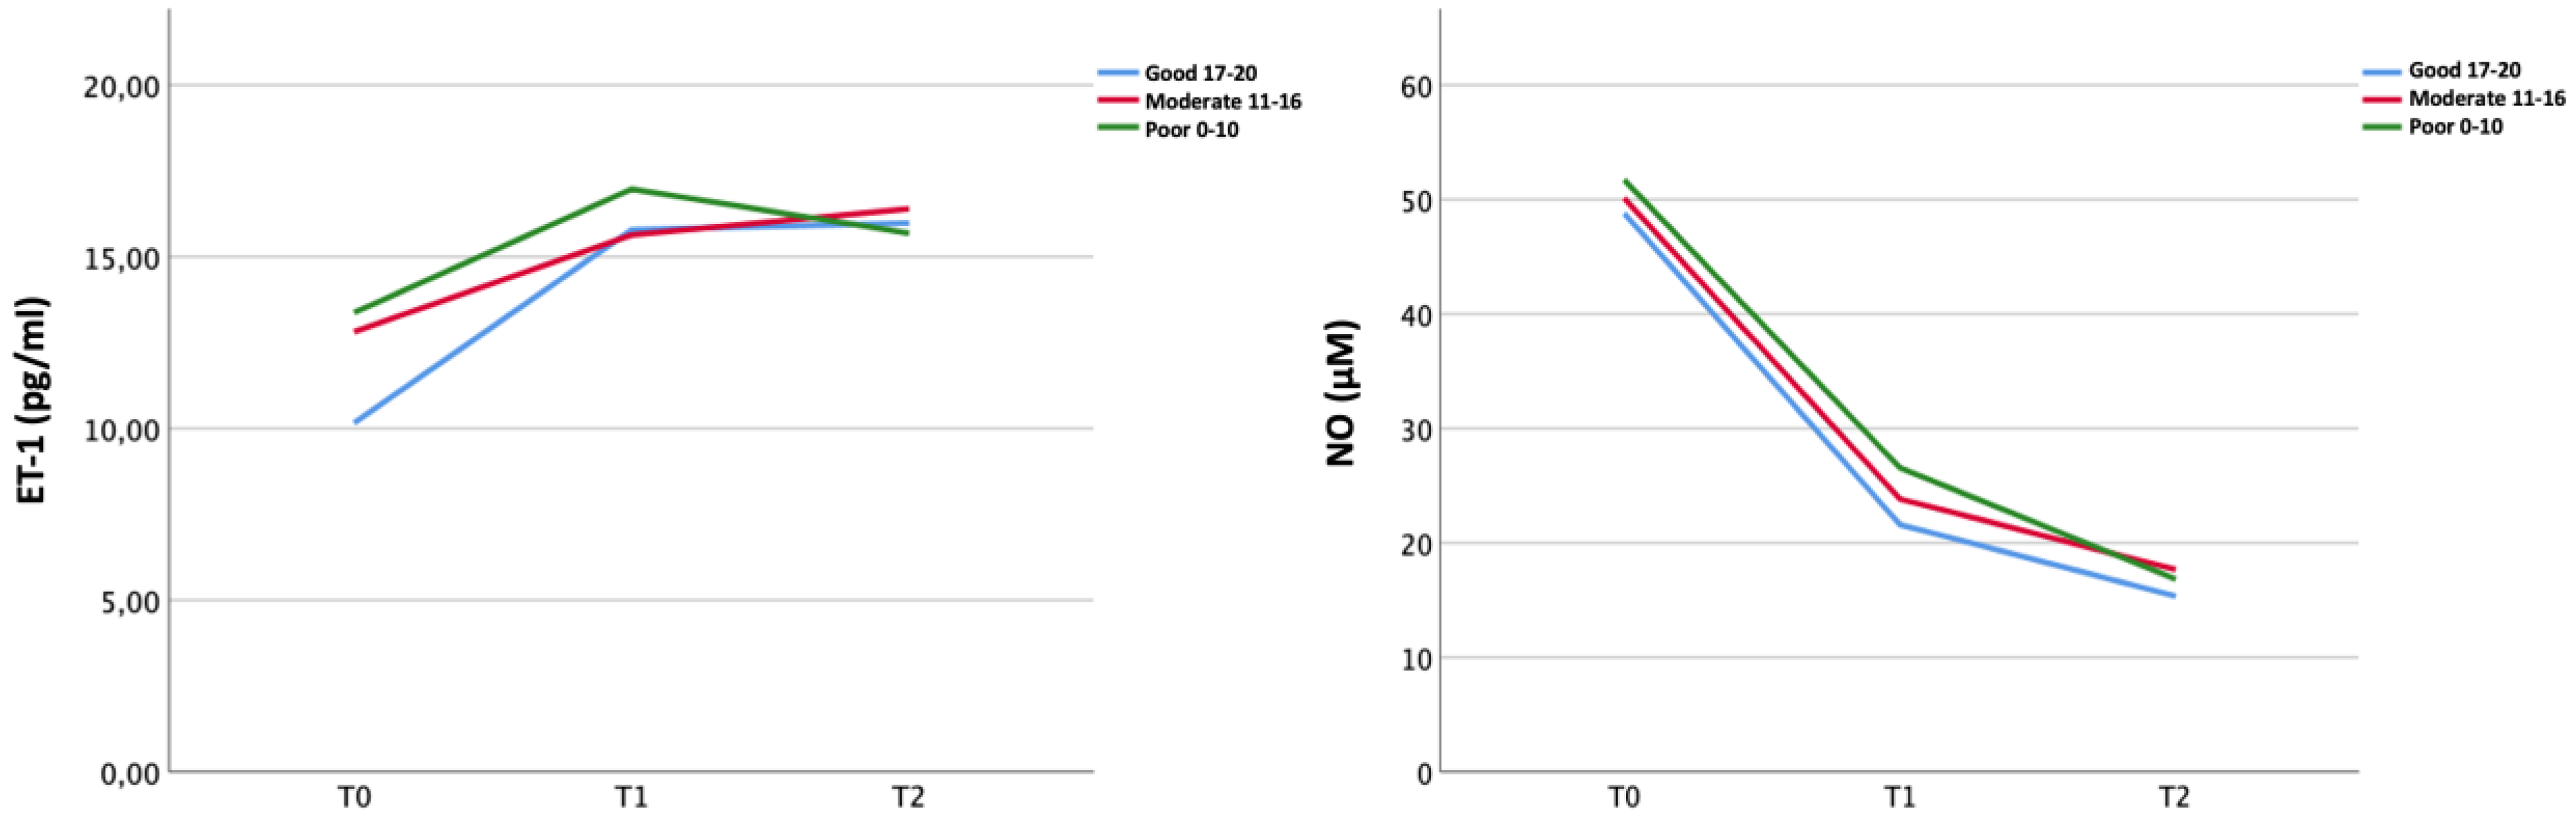
Figure 2.
Differences in biomarker values from peripheral and intracranial blood by collateral status over time.
Figure 2.
Differences in biomarker values from peripheral and intracranial blood by collateral status over time.
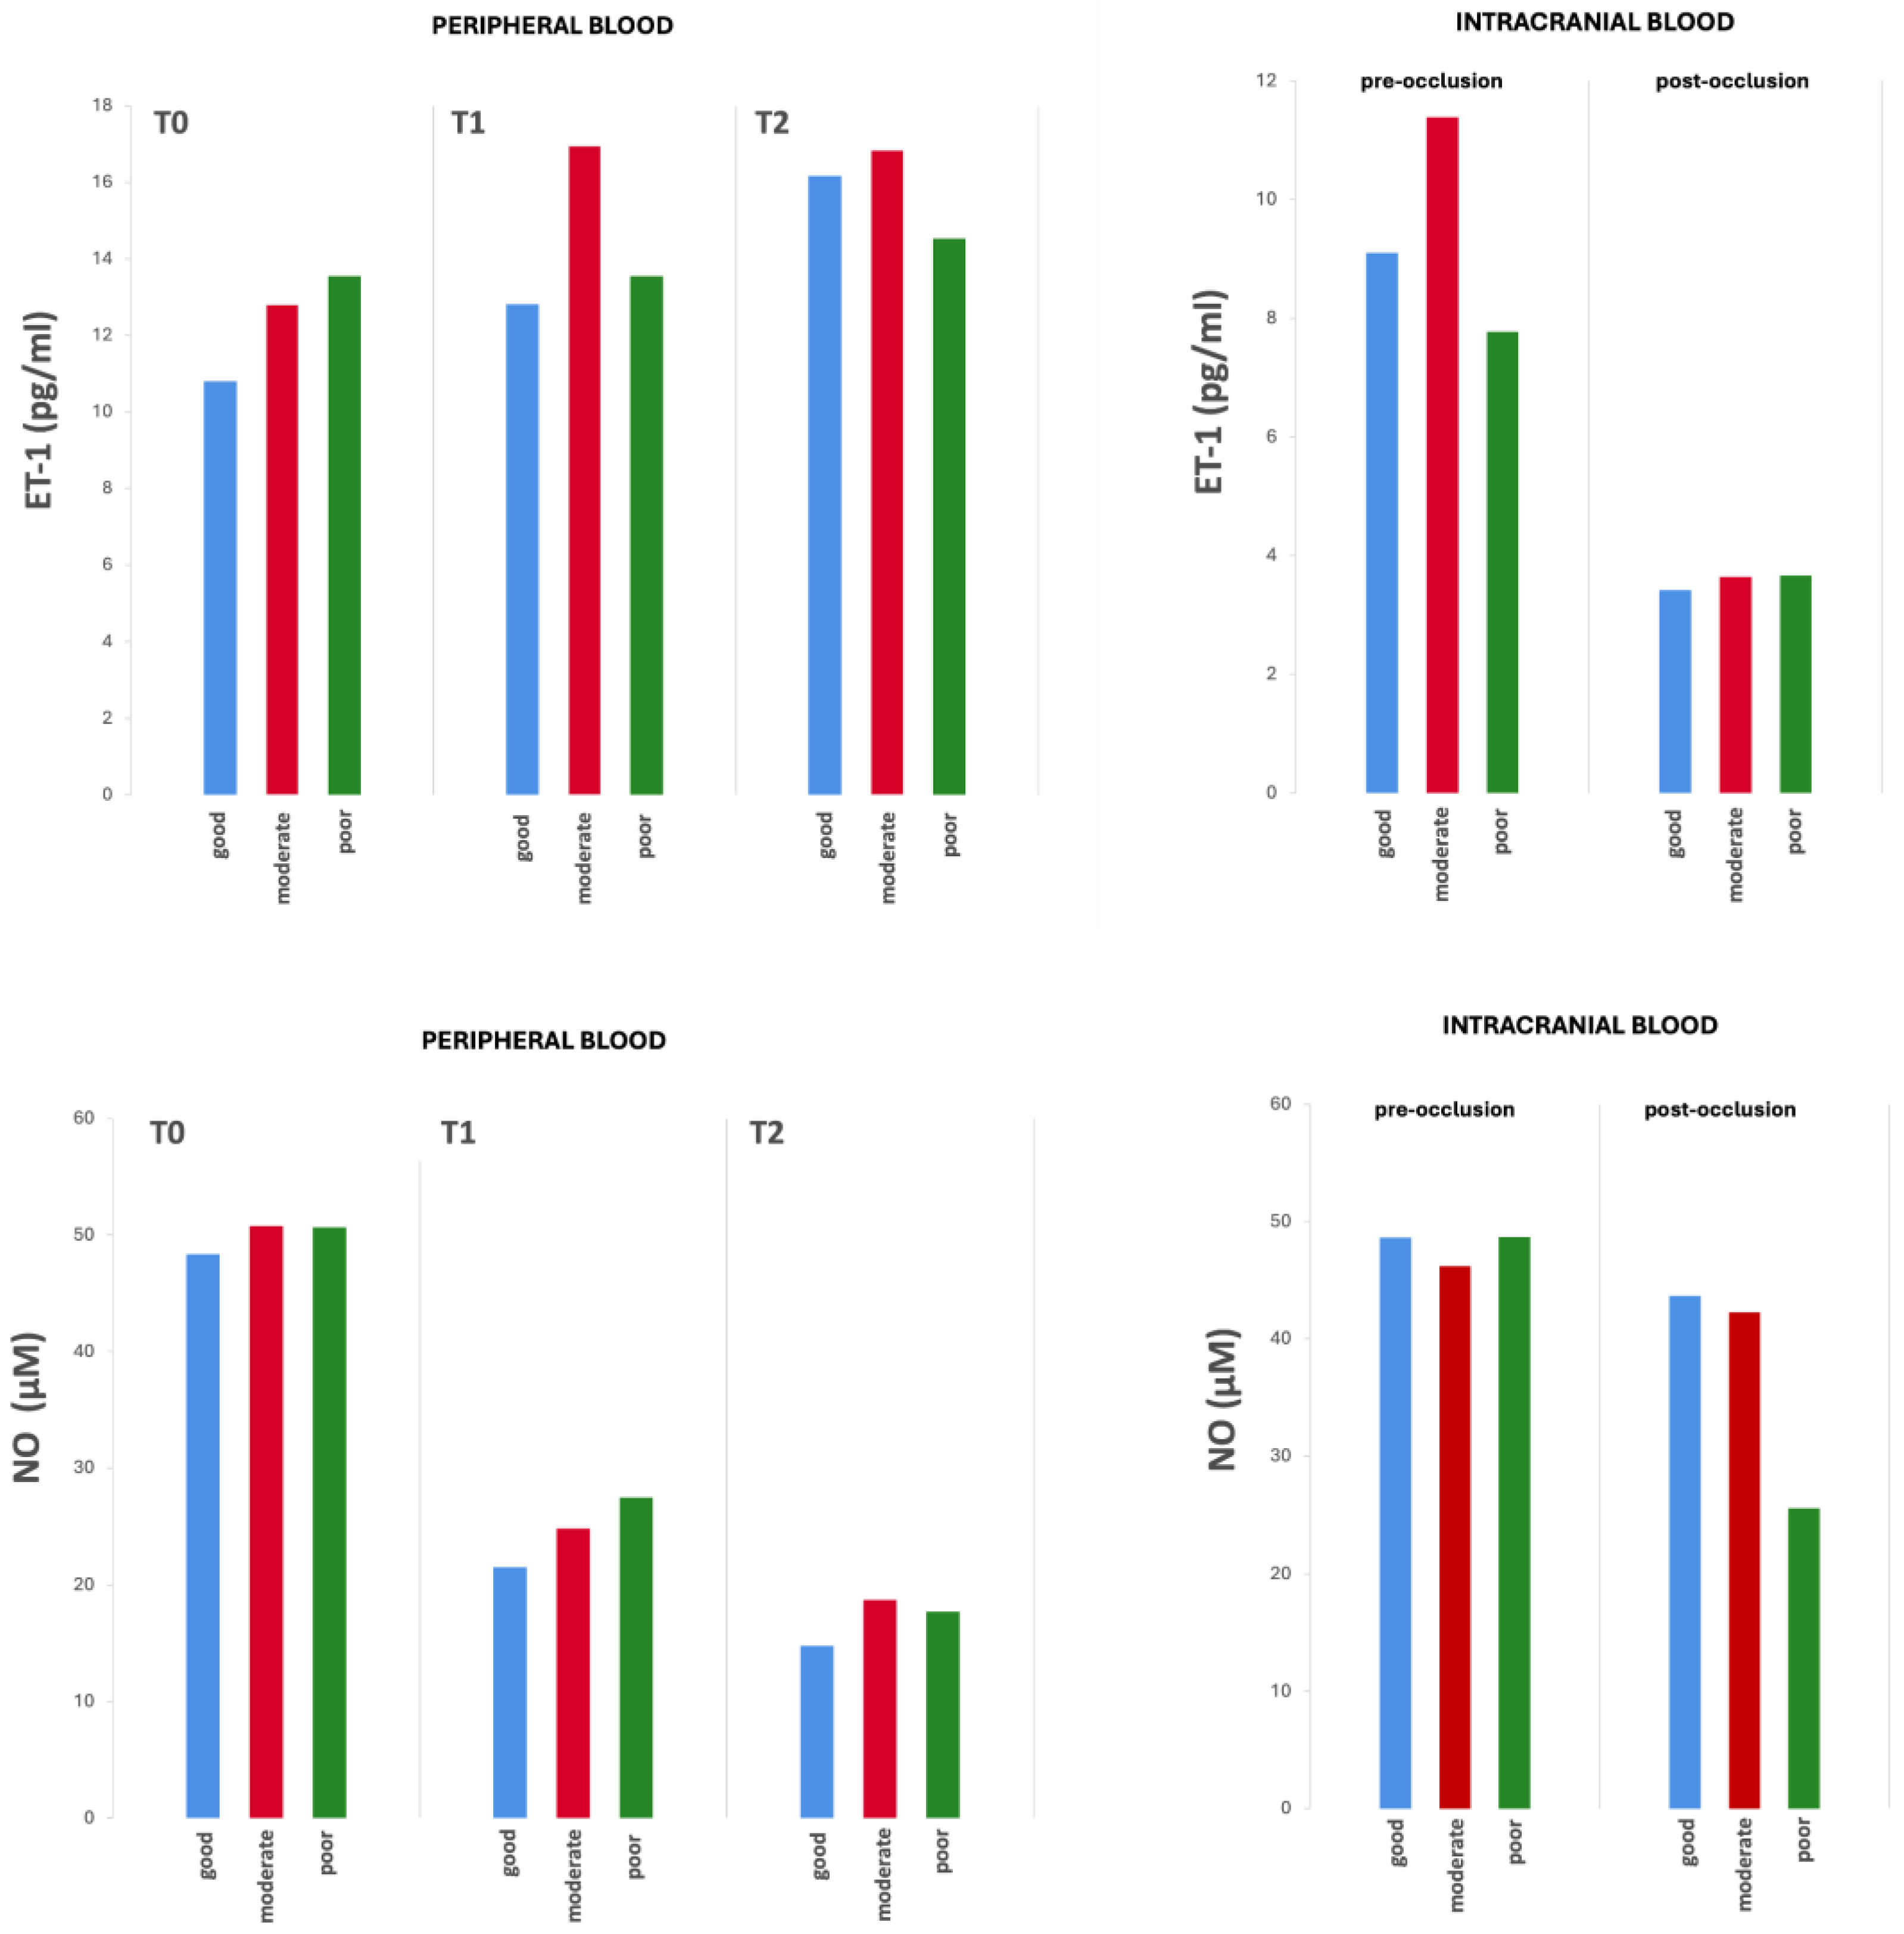
Figure 3.
Significant correlation between the peripheral NO values (μM) and the collateral score at T1.
Figure 3.
Significant correlation between the peripheral NO values (μM) and the collateral score at T1.
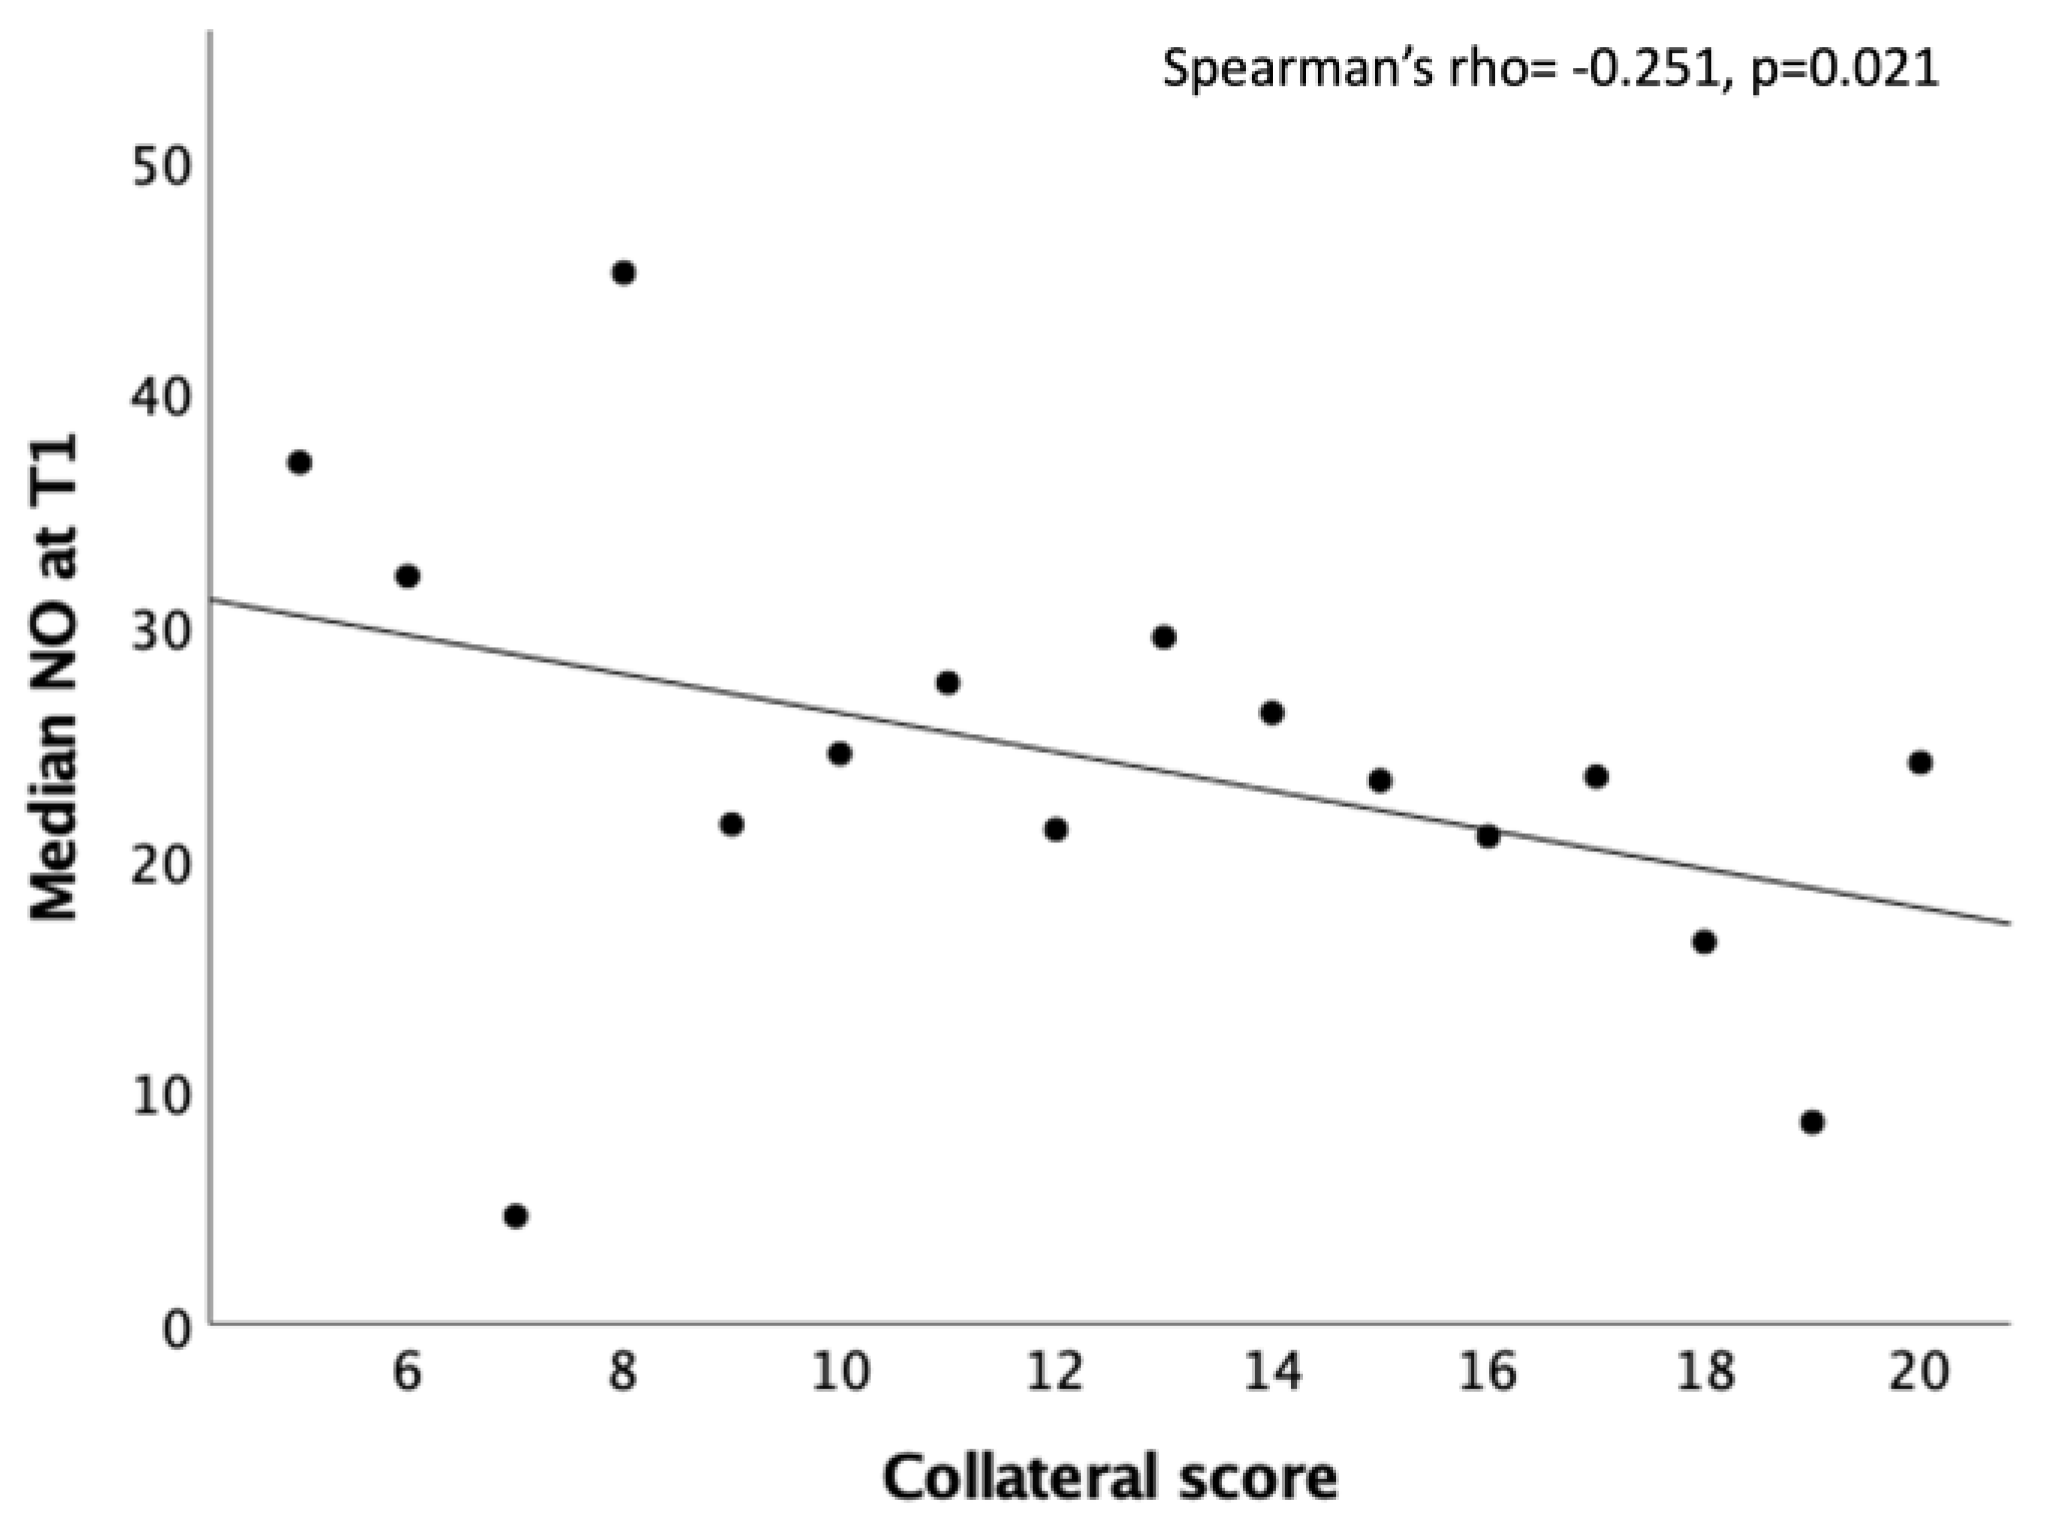
Figure 4.
Significant correlation between the peripheral ET-1 values (pg/ml) and the neutrophils count at T0.
Figure 4.
Significant correlation between the peripheral ET-1 values (pg/ml) and the neutrophils count at T0.
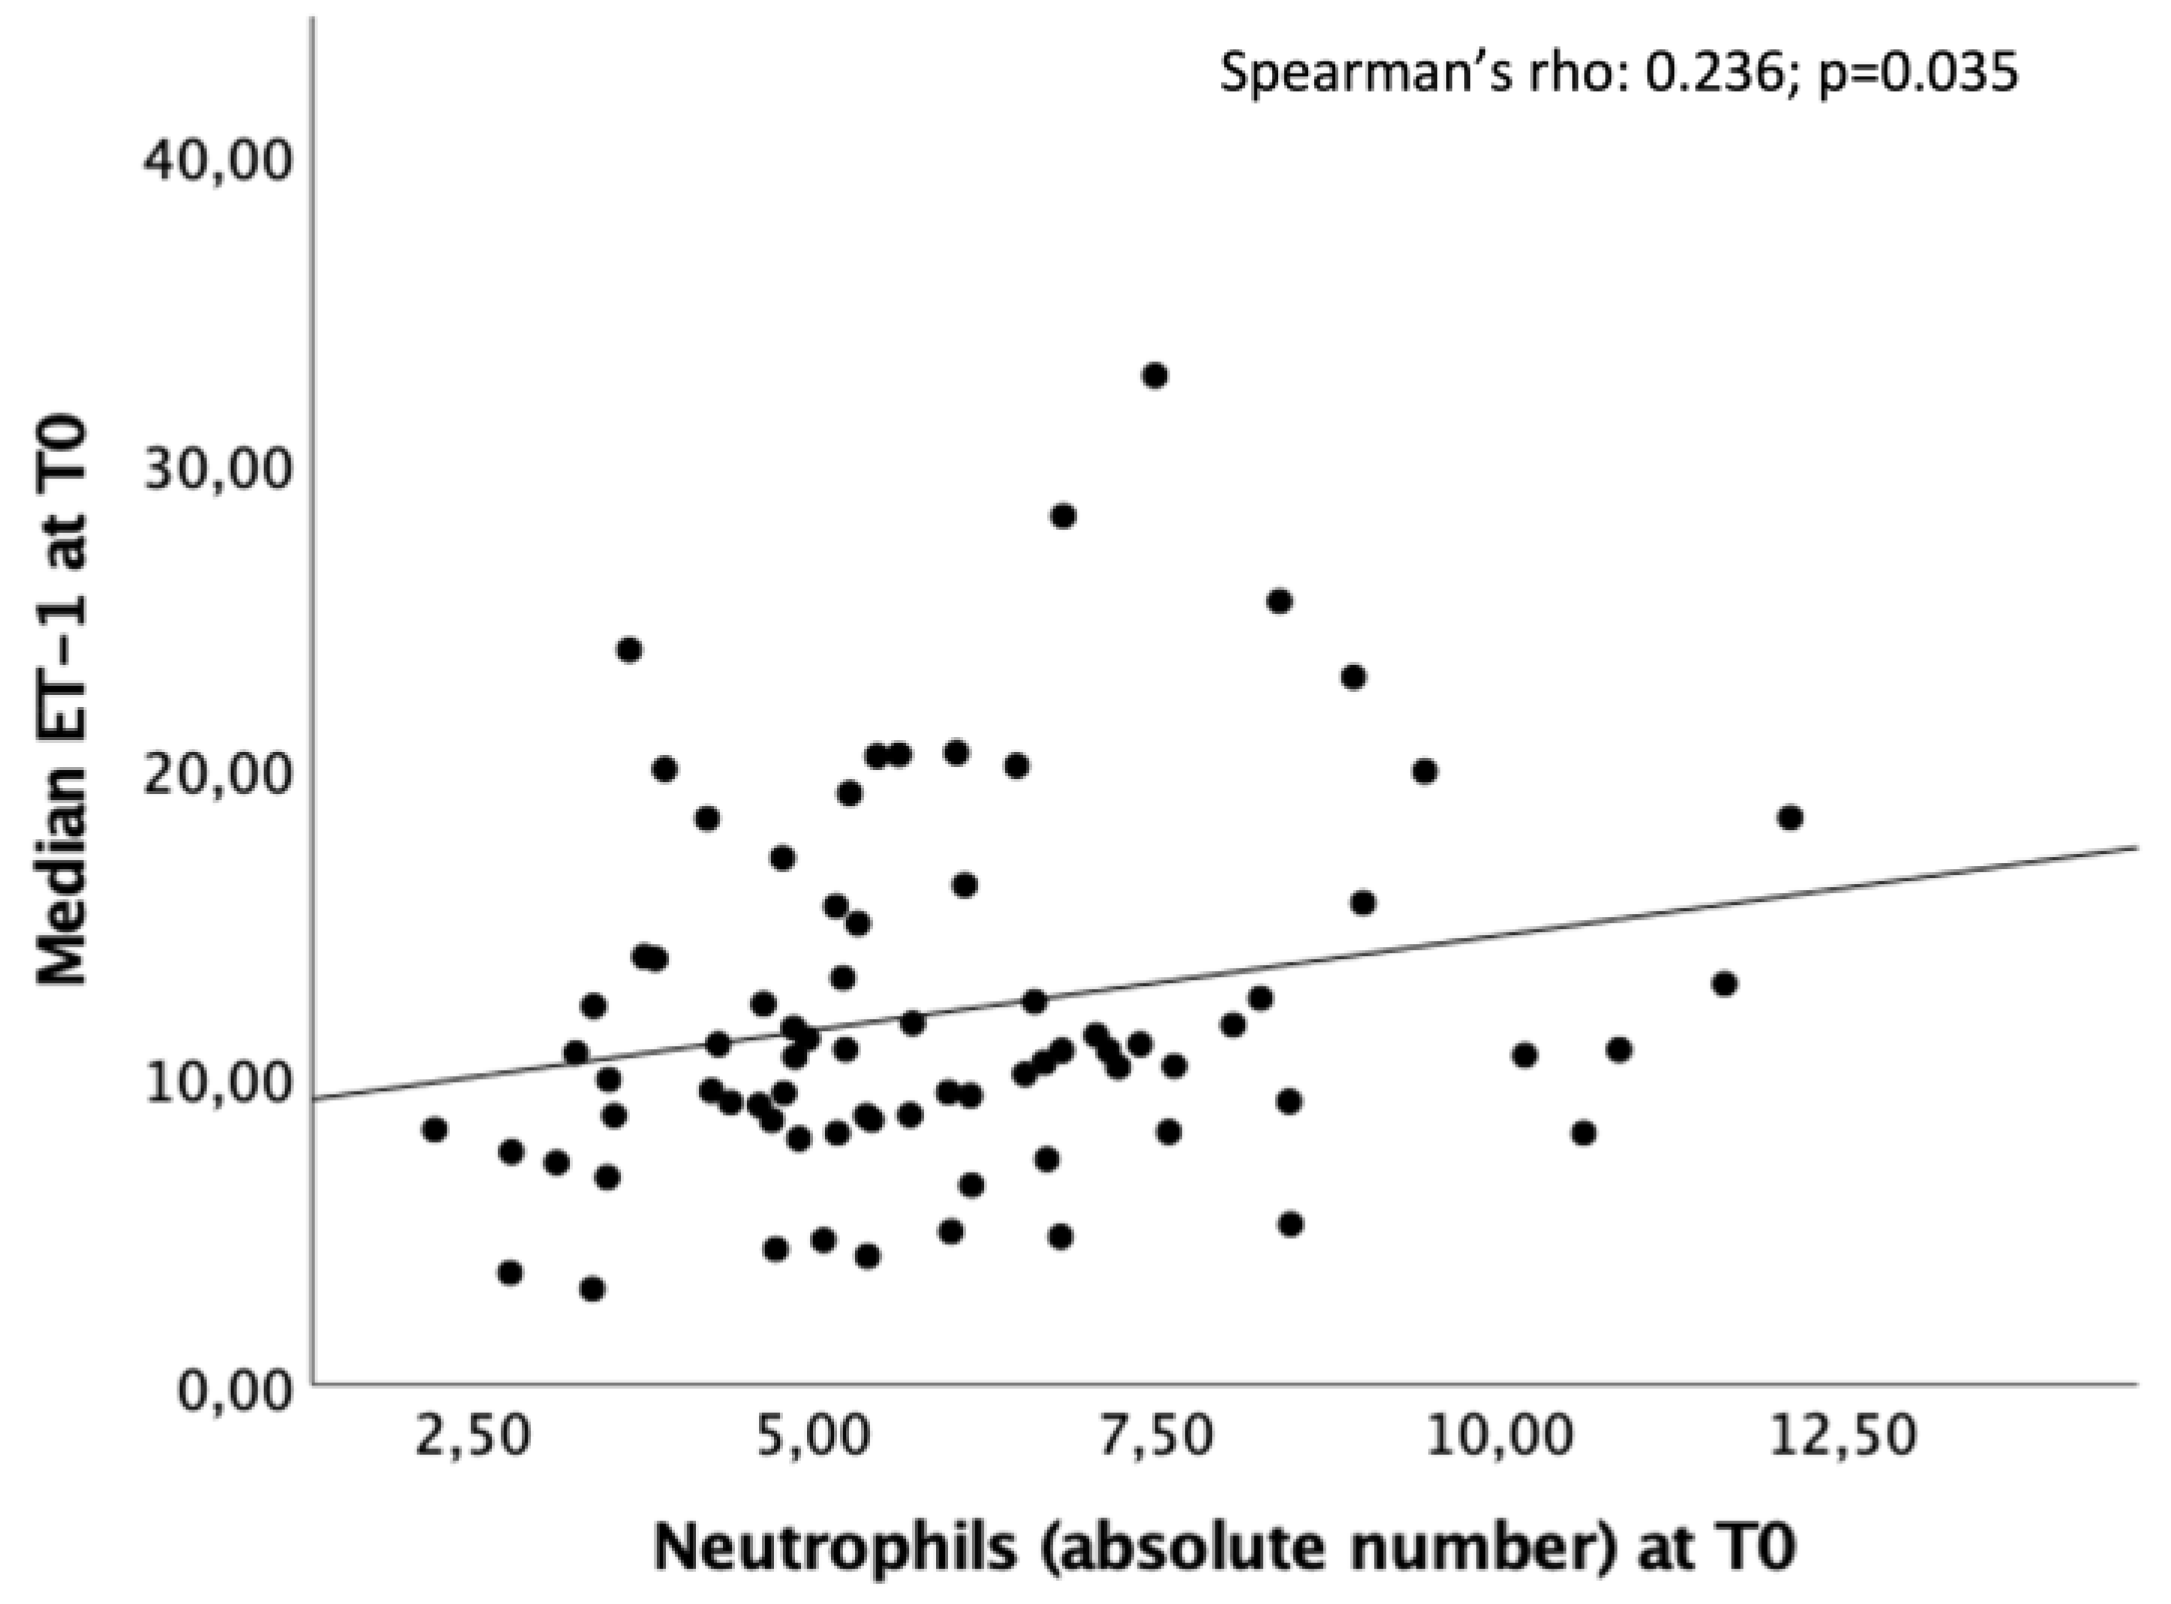

Table 1.
Demographics and clinical characteristics in the overall study population and by collateral status.
Table 1.
Demographics and clinical characteristics in the overall study population and by collateral status.
| All patients N=105 |
Good n=44 |
Moderate n=36 |
Poor n=22 |
p value | |
|---|---|---|---|---|---|
| Demographics and clinical characteristics | |||||
| Age (years), mean (SD) | 76.0 (12.8) | 75.0 (11.1) | 77.1 (14.9) | 77.8 (10.1) | 0.604 |
| Sex (females) (%) | 66 (62.9) | 32 (72.7) | 20 (55.6) | 13 (59.1) | 0.248 |
| Pre-stroke mRS (%) - 0 - 1 - 2 - 3 - 4 - 5 |
77 (73.3) 8 (7.6) 6 (5.7) 11 (10.5) 2 (1.9) 1 (1.0) |
38 (86.4) 2 (4.5) 3 (6.8) 1 (2.3) 0 0 |
23 (63.9) 3 (8.3) 3 (8.3) 6 (16.7) 1 (2.8) 0 |
14 (63.6) 3 (13.6) 0 3 (13.6) 1 (4.5) 1 (4.5) |
0.132 |
| Pre-stroke mRS 0-1 (%) | 85 (81) | 40 (90.9) | 26 (72.2) | 17 (77.3) | 0.087 |
| Obesity (%) | 16/100 (16.0) | 8/42 (19.0) | 3/34 (8.8) | 5/21 (23.8) | 0.291 |
| Smoking (%) | 16/99 (16.2) | 8/43 (18.6) | 3/33 (9.1) | 5/20 (25.0) | 0.289 |
| Alcohol consumption (%) | 6/104 (5.8) | 1 (2.3) | 4/35 (11.4) | 1 (4.5) | 0.221 |
| Drug abuse (%) | 3/104 (2.9) | 0 | 2/35 (5.7) | 1 (4.5) | 0.294 |
| Hypertension (%) | 84/103 (81.6) | 33/43 (76.7) | 30/35 (85.7) | 19 (86.4) | 0.493 |
| Hyperlipidemia (%) | 56/100 (56.0) | 29/43 (67.4) | 17/34 (50.0) | 8/20 (40.0) | 0.089 |
| Atrial fibrillation (%) | 63/102 (61.8) | 25/43 (58.1) | 20/35 (57.1) | 18/21 (85.7) | 0.060 |
| Ischemic cardiopathy (%) | 32/104 (30.8) | 10 (22.7) | 11/35 (31.4) | 9 (40.9) | 0.301 |
| Diabetes mellitus (%) | 25/104 (24.0) | 8 (18.2) | 11/35 (31.4) | 6 (27.3) | 0.381 |
| Previous stroke (%) | 18/102 (97.1) | 5 (11.4) | 8/34 (23.5) | 4/21 (19.0) | 0.357 |
| Previous TIA (%) | 8/103 (7.8) | 2 (4.5) | 5/35 (14.3) | 1/21 (4.8) | 0.236 |
| Previous CEA (%) | 4/104 (3.8) | 1 (2.3) | 3/35 (8.6) | 0 | 0.203 |
| Carotid artery stenosis <50% (%) | 35/103 (34.0) | 15/43 (34.9) | 13/35 (37.1) | 7 (31.8) | 0.919 |
| Carotid artery stenosis (50-70%) | 7/103 (6.8) | 4/43 (9.3) | 3/35 (8.6) | 0 | 0.343 |
| Carotid artery stenosis >70% (%) | 15/104 (14.4) | 4/43 (9.3) | 5/35 (14.3) | 6 (27.3) | 0.146 |
| Stroke characteristics | |||||
| Stroke onset on awakening/unknown (%) - Stroke on awakening |
30/104 (28.8) 22/105 (21.0) |
14 (31.8) 10/44 (22.7) |
12/35 (34.3) 9 (25.0) |
3 (13.6) 2 (9.1) |
0.204 0.312 |
| NIHSS, median (IQR) - Admission (T0) - 24 h (T1) - 48 h (T2) - Discharge |
15 (10-20) 10 (4-17) 9.50 (3-17) 5 (2-9) |
14 (10-20) 8 (2-14) 6 (2-16) 4 (1-9) |
15 (9-17) 10.50 (5.50-20) 10.50 (4-18) 5 (2-11) |
18 (14-22.50) 14 (10-17.25) 13.9 (7.8) 5 (4.50-14.25) |
0.035 0.090 0.095 0.281 |
| ASPECTS - mean (SD) - median (IQR) |
8.22 (1.32) 8 (7-9) |
8.48 (1.19) 9 (8-9) |
8.24 (1.23) 8 (7.75-9) |
7.86 (1.21) 8 (7-8.25) |
0.155 |
| Vessel occlusion site (%) - M1 - M2 - ICA - Tandem ICA+M1 |
57/97 (58.8) 29/97 (29.9) 2/97 (2.1) 9/97 (9.3) |
24/41 (58.5) 12/41 (29.3) 0 5/41 (12.2) |
17/34 (50.0) 14/34 (41.2) 1/34 (2.9) 2/34 (5.9) |
13/19 (68.4) 3/19 (15.8) 1/19 (5.3) 2/19 (19.5) |
0.424 |
| Collateral status - mean (SD) - median (IQR) |
14.65 (4.18) 15.50 (11-18) |
18.45 (1.0) 18 (18-19) |
13.72 (1.73) 14 (12-15) |
8.50 (2.33) 8.50 (6.75-10) |
<0.001 |
| Recanalization treatment (%) - IVT - MT - IVT+MT |
53 (50.5) 90/104 (85.3) 42 (41.2) |
20 (45.5) 38 (86.4) 15 (34.1) |
20 (55.6) 32/35 (91.4) 18 (50.0) |
12 (54.5) 18 (81.8) 9 (40.9) |
0.622 0.562 0.355 |
| MT technique - Thromboaspiration - Stent retrieving - Thromboaspiration + - Stent retriever - Other |
41/80 (51.2) 11/80 (13.8) 23/80 (28.7) 5/80 (6.3) |
17/36 (47.2) 3/36 (8.3) 12/36 (33.3) 4736 (11.1) |
14/28 (50.0) 7/28 (25.0) 7/28 (25.0) 0 |
10/15 (66.7) 1/15 (6.7) 3/15 (20.0) 1/15 (6.7) |
0.202 |
| Onset to IVT time (min), median (IQR) |
150.0 (120-190) |
150.0 (131.25-205.0) |
151.0 (110-190) |
135.0 (100.0-177.0) |
0.635 |
| Onset to MT time (min), Median (IQR) |
265.0 (197.50-350) |
265.0 (213-347.50) |
286.0 (194.50-438.50) |
208.50 (177.0-332.0) |
0.300 |
| TICI (%) - 0 - 1 - 2a - 2b - 3 |
7/83 (8.4) 5/83 (6.0) 11/83 (13.3) 17/83 (20.5) 43/83 (51.8) |
1/36 (2.8) 0 5/36 (13.9) 10/36 (27.8) 20/36 (55.6) |
3/30 (10.0) 4/30 (13.3) 5/30 (16.7) 5/30 (16.7) 13/30 (43.3) |
3/16 (18.8) 0 1/16 (6.3) 2/16 (12.5) 10/16 (62.5) |
0.090 |
| TICI 2b-3 (%) | 60/83 (72.3) | 30/36 (83.3) | 18/30 (60.0) | 12/16 (75.0) | 0.102 |
| Imaging for V measurement: - RM (%) - CT (%) |
85/103 (82.5) 18/103 (17.5) |
36 (81.8) 8 (18.2) |
31/35 (88.6) 4/35 (11.4) |
17/21 (81.0) 4/21 (19.0) |
0.655 |
| Infarct volume, median (IQR) |
9.70 (3.60-20.50) |
5.90 (2.80-12.25) |
13.35 (5.08-20.50) |
14.60 (8.85-41.80) |
0.482 |
| Stroke etiopathogenesis (%) - LV atherothrombosis - Cardioembolic - Other determined cause - Other indetermined cause |
10/99 (10.1) 68/99 (68.7) 7/99 (14.1) 14/99 (14.1) |
5/41 (12.2) 25/41 (61.0) 4/41 (9.8) 7/41 (17.1) |
1/34 (2.9) 25/34 (73.5) 3/34 (8.8) 5/34 (14.7) |
4/21 (19.0) 17/21 (81.0) 0 0 |
0.134 |
SD=standard seviation; mRS=modified Rankin Scale; TIA=transient ischemic attack; CEA=carotid endarterectomy; NIHSS=National Institutes of Health Stroke Scale; IQR=interquartile range; T0=timepoint 0; T1=timepoint 1; T2=timepoint 2; ASPECTS=Alberta Stroke Program Early CT Score; M1=M1 segment of the Middle Cerebral Artery; M2=M2 segment of the middle cerebral artery; ICA=internal carotid artery; IVT=intravenous thrombolysis; MT=mechanical thrombectomy; TICI=thrombolysis in cerebral infarction; V=volume: RM=Magnetic Resonance Imaging; CT=Computed Tomography; LV=large vessel;.p-values highlighted in bold indicate statistically significant results (p < 0.05). Section headings are formatted in italics and highlight in gray to distinguish different categories of data within the table.
Table 2.
ET-1 values at T1 in the overall study population by clinical outcome.
| mRS 0-2 (n=39) | mRS 3-6 (n=61) | p value | |
|---|---|---|---|
| ET-1 at T1 (pg/ml), median (IQR) | 12.44 (10.61-16.58) | 16.95 (11.81-23.44) | 0.017 |
mRS= modified Rankin Scale; ET-1=Endothelin-1; T1=timepoint 1; pg/dL=picograms per deciliter; IQR=interquartile range;. p-values highlighted in bold indicate statistically significant results (p < 0.05).
Disclaimer/Publisher’s Note: The statements, opinions and data contained in all publications are solely those of the individual author(s) and contributor(s) and not of MDPI and/or the editor(s). MDPI and/or the editor(s) disclaim responsibility for any injury to people or property resulting from any ideas, methods, instructions or products referred to in the content. |
© 2025 by the authors. Licensee MDPI, Basel, Switzerland. This article is an open access article distributed under the terms and conditions of the Creative Commons Attribution (CC BY) license (http://creativecommons.org/licenses/by/4.0/).
Copyright: This open access article is published under a Creative Commons CC BY 4.0 license, which permit the free download, distribution, and reuse, provided that the author and preprint are cited in any reuse.


