
Submitted:
12 March 2025
Posted:
13 March 2025
You are already at the latest version
Abstract
In Central Asian countries (CACs) atmosphere pollution is increasing due to population growth, economic growth, agricultural development, energy consumption and climate change. The countries of region developed climate change adaptation strategies - Nationally Determined Contributions (NDCs) under the UN Framework Convention on Climate Change (UNFCCC). At the same time, regional integration, which should be a necessary condition for achieving the Sustainable Development Goals (SDGs) in the solving of general environmental problems, is not involved. This article shows the importance of a comprehensive analysis of greenhouse gas (GHG) and non-greenhouse emissions into the atmosphere for the entire Central Asian region as a single ecosystem. The energy intensity of national economies structure was chosen as the main factor determining the level of pollution. The analysis shows that over the past 30 years, the main part of the commodity exports (73.6 - 81.4%) of Kazakhstan and Turkmenistan has been fossil natural resources. There is a strong economic dependence on coal and other types of fuel, which leads to the atmospheric emissions. The analysis shows that limited financial resources, lack of effective systemic monitoring and control of air quality that meets modern international requirements and standards, leads to absence of tangible changes in practice yet. Over 30 years in CACs, the share of CO2 emissions associated with the fossil fuels combustion has not decreased and amounts to 78%. The key mechanisms for reducing atmospheric emissions are significantly increase investments in the transformation of the economies in the context of regional development, interstate cooperation, the introduction of environmental norms, standards harmonized with world ones, green technologies based on alternative energy, sustainable transport and logistics infrastructure.
Keywords:
air pollutants reduction
; carbon dioxide
; climate change
; GHGs
; fossil fuels combustion
; Central Asia
; regional cooperation
; co-benefit
1. Introduction
The most important aspect of environmental balance and sustainable development of any region in the world is air quality. A significant deterioration in the quality of air breathed by more than 50% of the world’s population has been observed in the last decade [1]. The global economic losses due to premature mortality caused by fine particulate matters (PM) and ground-level ozone air pollution are estimated by the Organization for Economic Co-operation and Development (OECD) to exceed USD 1.7 trillion per year. It is equivalent to about 3.5% of global gross domestic product (GDP) [2].
Central Asia, which includes five states – Kazakhstan, Kyrgyzstan, Uzbekistan, Tajikistan and Turkmenistan, is certainly not a single economic space. Each of the CACs have its own development paradigm, its own national currency, its own vision of entering the global economy, its own model of building an economy, and a combination of market and state. These states participate in international and regional trade, cooperation and interaction to different levels. The multi-vector nature of economic policy, the diversity of economic models and social reforms, and competition for foreign investment determine the region’s indicators heterogeneity [3]. At the same time, these states have much in common. They are geographical location, previously established economic and transport links, the availability of common resources, cultural proximity, as well as a set of unresolved transboundary environmental problems. In recent years, interstate relations within the region have also undergone dramatic changes at all levels, and mutually beneficial cooperation is gradually developing [4].
The benefits of globalization for the region are linked to the international division of labor in the context of the region’s special geographical position – between Europe and China. The position of CACs at the transport corridors crossroads creates opportunities for the transit potential development both in terms of goods transportation and for the involvement of the regional countries in cross-border production chains. The importance of Asian states in the foreign trade is increasing [5]. The turnover of foreign trade in goods of CACs with other countries amounted to USD 165.5 billion in 2021 and has grown six-fold since 2000. During the same period, the volume of trade between countries within the Central Asia region exceeded 11 billion dollars in 2024. Important factors include the strengthening of China’s position and the CACs involvement in the “One Belt, One Road” initiative implementation. UN experts suggest that the development of cooperative ties in Central Asia will allow the regional GDP to double within 10 years, ensuring the efficient use of the regions’ resource potential and their sustainable development [6]. Thus, strengthening multifaceted cooperation has made it possible to increase the combined GDP of CACs from USD 297 billion in 2018 to USD 450 billion in 2023[1]. The region has stepped up its integration into the global economy and maintains trade and economic relations with almost all countries in the world. The EU, Russia and China account for about 60% of the volume of CACs foreign trade[2]. Moreover, foreign trade with China exceeds both the EU (European Union) and Russia. Thus, in 1992, the volume of trade between China and Central Asia was only USD 527 million, and in 2024 - about USD 89 billion.
The raw materials-exporting economic model that has developed in the countries of Central Asia leads to large socio-ecological-economic problems [7]. This, in turn, maintains a high dependence on coal and other fossil fuels in the economies of CACs. The use of extensive technologies and energy sources in the industrial and domestic sectors causes the atmospheric emissions. Thus, the fossil fuel-based industry and energy sector in these countries accounts for the bulk of GHG emissions [8]. Research and knowledge on air quality changes in this region are very limited, mostly focused on individual countries, cities or economic sectors. The data that allows us to study and assess risks is not systematic and not homogeneous, which significantly complicates the analysis and adoption of management decisions. [7,8,9,10,11]. It is necessary to jointly solve the air pollution problem. The need for an integrated approach to solving this issue lies in the fact that the deterioration of CACs air quality is the multifactorial.
In the world energy security system, Central Asia is of great importance because it has huge reserves of oil, gas, coal, hydro resources, etc. The region has large deposits of fuel resources, such as Kashagan on the Caspian shelf of Kazakhstan - the world’s largest coastal field, the Karachaganak oil and gas condensate field in the West Kazakhstan region; South Yoloten in Turkmenistan, one of the three largest gas fields on the planet. The complexity of risk management in the region is determined by three common, interrelated risk factors: global warming and environmental destruction; linked and complicated economies, communities and population changes [12]. During the last half-century, the regional climate become noticeably warmer. The general properties of the climate of the CACs are expressed in a combination of moderate and subtropical elements, sharp continentality and aridity, climatic risks. CACs faces serious challenges related to climate risks. The data from the Climate Risk Profile for Central Asia [13] and the results of the “Analysis of Climate Change in Central Asia” indicate that the environment in Central Asia has undergone transformations due to global warming [14,15].
Global warming accelerates natural resources depletion, as production and consumption under these conditions, against the backdrop of continuing atmospheric pollution, require more energy and materials. The areas of energy, water resources, and food supply are particularly sensitive to climate challenges. This hinders economic growth, deteriorates the environmental conditions, adversely affects human health and exacerbates regional disparities.
Climate changes in Central Asia is caused by the following natural and anthropogenic regional factors: drying up of the Aral Sea, increased wind erosion of the dried-up seabed surface, glaciers thawing, snow cover decrease and desertification [16]. Rising extreme temperatures and extreme weather events present significant risks not only to human health, but also to natural ecosystems, agricultural systems, water management, energy resources and infrastructure.
One of the most significant global warming consequences in Central Asia is the thawing of glaciers and the resulting creation of glacial lakes. The rate of decrease in glacier volume in Central Asia is 0.2-1% per year. Overall, during the past 50-60 years, due to changing climate conditions, the surface area of glaciers in Central Asia, which are the main source of fresh water, has decreased by 30% [17]. Drought has always been a typical phenomenon for Central Asia, but recently drought cycles have become more frequent. As a result, the Central Asia region is classified as a water stressed region [18]. The observed decrease in river flow (the estimated decrease in the Syr Darya and Amu Darya basins water volumes by 2050 is 10-15%) will have a negative impact in the near future [19]. According to international experts, climate changes will affect all CACs and will lead to variations in precipitation levels and temperature background of the entire region [20].
Against this background, climate change is becoming an increasingly acute problem for agricultural growth in CA. The agro-ecological zones boundaries are predicted to shift, and the region as a whole will become hotter and less suitable for traditional farming. According to the international scientific journal Nature, the region consumes 2.5 cubic meters of water per dollar of GDP, which places the CACs among the world leaders in the inefficient water resources usage [21].
The presence of manufacturing plants in the region, including metallurgical, oil and gas, coal mining, mineral extraction, as well as transport vehicles, especially the multiple increase in passenger cars and trucks, has led to a rise in atmospheric pollutants, especially in urbanized areas. Unlike EU countries and China, where significant investments are made in environmental technologies and monitoring programs, in Central Asia insufficient attention is paid to systematic monitoring of air quality. Limited financial resources and lack of effective regulation prevent the implementation of modern air purification technologies. However, the problem is not limited to just a technological solution to the issue of cleaning the air from industrial pollutants. The use of pesticides, fertilizers and irrigation methods in agriculture in the arid climate of the region require more and more energy resources, which also affects the environmental situation, in particular the growth of atmospheric emissions. The growing internal migration of rural populations to cities in search of work has many consequences. Among other things, it leads to a disproportionate increase in industrial activity, housing and infrastructure construction, automobile traffic, increased energy consumption, accumulation of household waste and other negative factors. In the context of increasing urbanization, the lack of modern public transport and the old vehicle fleet also contribute to the deterioration of air quality [5].
To keep temperatures below 1.5°C, a central objective of global initiatives aimed at addressing climate change is to decrease emissions of CO2 and other GHGs by 45% by the year 2030, relative to levels recorded in 2010 [22,23]. In this context, leading countries, with a 25% share of global GDP, have established legal obligations to achieve net-zero emissions targets under the Paris Agreement[3]. All CACs have signed the Paris Agreement. Moreover, within the framework of its implementation, Kazakhstan has undertaken obligations to achieve a reduction in GHG emissions of 15% by 2030 compared to the 1990 baseline level with the possibility of increasing this target to 25% under specific conditions [24].
Currently, Kazakhstan, Turkmenistan and Uzbekistan have defined national targets as part of their green economy strategies, while Kyrgyzstan and Tajikistan have chosen to concentrate on programs for climate change mitigation and adaptation, likely because of significant contribution of hydropower in the country’s energy balance. CACs are gradually including in their national programs and policies the development of renewable energy sources (RES), stimulation of sustainable agricultural development and implementation of a circular approach to the use of natural resources [25].The World Bank projects that global growth will increase to an average of 2.7% in 2025-2026[4]. Based on the World Economic Outlook report from the International Monetary Fund (IMF), among the CACs, Uzbekistan has the highest projected real GDP growth for 2026 (5.5%), followed by Kazakhstan (4.4%), Kyrgyzstan, Tajikistan (4% each) and Turkmenistan (3.7%)[5].
All of the above allowed us to formulate, the research problem is to identify the key factors that determine the level of air pollution in CACs, analyze their relationship with the economic structure of the region and develop recommendations for reducing emissions in the context of regional development. The problem of assessing air quality is becoming especially relevant in the region, where various sources of pollution cause significant damage to the environment and have a negative impact on public health [26]. The relevance and validity of this approach is explained not only by the climatic and geographical similarity of the ecosystem in question, but also, first of all, by the commonality of unresolved transboundary environmental problems and, to a significant extent, by the limited knowledge of the state of air quality in the region.
This research addresses the scientific gaps concerning the air pollution in CACs. Previously, studies of air pollution in Central Asia focused on individual aspects. Global emission reports (Emissions Database for Global Atmospheric Research (EDGAR), World Bank, International Energy Agency (IEA)) analyze the dynamics of CO₂, but without detailed consideration of economic and regional factors. Work on air quality (UNECE (United Nations Economic Commission for Europe), United Nations Environment Programme (UNEP), KazHydromet) considers the level of PM2.5 and SO₂, but does not link them to industry and the energy intensity of the economy. It is especially important to study the impact of economic structure on atmospheric emissions in Central Asia as a single ecosystem. Energy sector research (IEA, Enerdata) focuses on the structure of energy consumption but does not assess its impact on emissions in Central Asia. NDCs, Paris Agreement of Central Asian countries declare intentions to reduce emissions, but do not contain an objective analysis of their implementation.
The novelty of our study lies in several key aspects. For the first time, a unified comparative analysis of the dynamics of CO₂, PM2.5 and SO₂ emissions in Central Asian countries for the period 1990–2024 has been conducted, which makes it possible to identify long-term pollution trends. Unlike previous studies, the study examines the impact of the energy intensity of the economy and the carbon intensity of GDP on pollution levels, which allows us to establish a direct relationship between economic structure and emissions. Another important element is to take into account the role of economic structure in shaping emissions: previous studies have not detailed the dependence of emissions on dominant economic sectors such as oil and gas, coal and metallurgy. Thus, the novelty of the research idea is based on the fact that the impact of climate change and environmental degradation in the region must be considered in relation to the region’s economy.
In this context, the uniqueness of this study lies in the following aspects. First, the energy intensity of national economies was selected as the primary determinant of pollution levels. Second, unlike many existing studies that focus solely on GHG or non-GHG pollutants, this research examines the effects of both types of emissions within the same regional framework. Third, the hypothesis will be tested using a combination of analytical and descriptive methods, providing a comprehensive review-based approach to the investigation.
The idea underlying the study and the problems raised allowed us to formulate the hypothesis of this study. H1: The energy-intensive structure of the Central Asian economy, focused on the extraction and export of hydrocarbons, is the main factor behind the high level of atmospheric emissions. The transition to a low-carbon economy is possible with a comprehensive approach that includes: the development of renewable energy sources (RES), improved energy efficiency, tighter environmental standards and deeper regional cooperation. According to this hypothesis, as a null hypothesis H0, the study assumes that the energy-intensive structure of the national economies of Central Asia does not in any way affect the maintenance of an elevated level and the growth of atmospheric emissions. The high level of emissions is due to other factors such as climate conditions, population growth and increasing energy consumption.
Goal of this research is to comprehensively analyze the dynamics of atmospheric emissions since 1990, identify key factors in their formation and assess possible mechanisms for their reduction.in the context of dependence on the energy-intensive structure of the national economy in CACs. The study:
- compares CO₂, PM2.5 and SO₂ emissions in CACs countries,
- assesses the impact of economic structure on pollution levels,
- examines current strategies for reducing emissions and provides recommendations for adapting them to regional conditions.
The results obtained will make it possible to formulate scientifically based recommendations for the development of regional environmental strategies and measures to decarbonize the Central Asian economy.
2. Materials and Methods
2.1. Research Methodology
This study is interdisciplinary in nature and combines cartographic analysis, econometric modeling, comparative analysis of economic and environmental indicators, and a systems analysis of policies to reduce emissions in Central Asia. The choice of methodology is determined by several factors:
- the heterogeneity of data across countries in the region, which requires a comprehensive approach to their analysis; the dynamic nature of emissions, which must be assessed over time (1990–2024);
- the relationship between economic structure and pollution levels, which requires the use of econometric indicators;
- international commitments of CACs to reduce emissions, which makes a comparative analysis of strategies and policies necessary.
The rationale for the choice of methodology lies in the combined use of quantitative and geospatial methods, which allows us to identify patterns and determine the dynamics of emissions at the regional level. The use of statistical and econometric indicators ensures the objectivity of the analysis and reveals long-term trends. A comparative analysis of strategies makes it possible to assess the effectiveness of existing measures and propose sound recommendations. The main limitations of the study are related to incomplete data for some countries, such as Turkmenistan, which requires the use of alternative sources, including modeling and indirect estimates. Differences in emission accounting methods between countries may cause discrepancies in the data, which is also taken into account in the interpretation of the results.
The methodology for executing this research is structured around addressing the following tasks, for which the stages are outlined:
- Scientometric analysis of publications. It will be study of publications devoted to the problem of air pollution.
-
Identification of the Central Asia economy sectors features. It will be identify answer to the question: What economic sectors and factors have the most significant impact on air quality? To assess the relationship between the economic structure of countries and the level of pollution, methods of descriptive statistics, correlation analysis and regression modeling are used. Then it is necessary to estimate problems and challenges. To evaluate the energy efficiency of the CACs economies, indicators such as:
- a.
- Energy Intensity of CACs for the period 1990-2022;
- b.
- Specific CO2 Emissions per capita;
- c.
- Specific CO2 Emissions per GDP;
- d.
- GDP per unit of energy consumption, quoted in dollars per kilogram of oil equivalent were used.
- Assessment of the ecological-climatic changes impact on air quality of the region. To study the pollution dynamics, a statistical analysis of time series (1990–2024) of CO₂, PM2.5 and SO₂ emissions is carried out. To achieve this goal indicators such as:
a. the volume of GHGs in CACs for the period 1990-2021;
b. Average CO2 emission (carbon factor) during 1990-2023;
c. Dynamics of CO2 emissions by burning fossil fuels of CACs for the period 1990-2022;
d. Dynamics of PM 2.5, SO2 in CACs for the period 1990-2024 were used.
- Econometric modeling in the R program was used to identify relationships between CO2 emissions from fuel combustion and the factors that determine it, taking into account the specifics of country development:
Dependent and independent variables were identified for all five countries;
b A correlation analysis of the dependence of the indicators was carried out, a thermal matrix was constructed;
c A fixed effects (FE) model and a random effects (RE) model were constructed;
d They were tested using the Hausman test to select the best model, the White test to check for heteroscedasticity, and a recalculation of the random effects model with robust standard errors was performed;
e A forecast of indicators based on the constructed model for all five countries to identify the achievability of the climate parameters declared by the countries by 2030 was built.
- Strategies in Central Asia for implementing measures to reduce air pollution. Development of Recommendations for improvement. To provide a comparative analysis of emission reduction strategies, the environmental strategies of the CACs are examined in comparison with successful cases from other regions, including EU policies (ETS, European Green Deal), the Chinese air pollution strategy and the US experience in emission regulation.
2.2. Object of Study: CACs
2.3. Data Sources
The study is based on three groups of data. The first group is environmental indicators, including emissions of CO₂, PM2.5 and SO₂. The data were obtained from EDGAR, World Bank Open Data, UNEP, national statistical services of Kazakhstan, Uzbekistan, Kyrgyzstan, Tajikistan and Turkmenistan and national reports of CACs countries under the UNFCCC.
The second group is economic and energy indicators extracted from TheGlobalEconomy.com, World Energy & Climate Statistics (Enerdata), IEA.
The third group includes regional and international strategies to reduce emissions, such as The Paris Agreement and NDCs of CACs, the EU Green Deal policies, the Chinese Blue Sky Defense program, as well as the UN Sustainable Development Programs and UNECE recommendations.
- Scientometric analysis of publications from Scopus and Web&Science databases was carried out using VoSViewer: by keywords, by country, by author [27].
- Identification of the Central Asia economy sectors features was carried out using environmental indicators, economic and energy indicators that make it possible to understand the relationship between economic activity and the level of atmospheric pollution [17,23,28,29,30,31,32,33,34]. Data regarding energy, fuel consumption and air emissions are gathered and systematized by national statistical offices, energy departments and environmental protection agencies. The work used information from National Statistics Bureau of the CACs, however, it should be noted that they are systematized mainly in Kazakhstan and Kyrgyzstan. Thus, only in Kazakhstan and Kyrgyzstan are the National Ambient Air Quality Standards (NAAQS) enshrined in laws available for review [29,35]. The following are used as key indicators:
Energy intensity, koe/USD15p - is the ratio of the energy consumed by the system to the results of its operation. Energy intensity is expressed in tons of conventional fuel (tons of oil equivalent) per GDP of the country, (USD1,000 in 2015 prices at purchasing power parity), data are presented in: https://yearbook.enerdata.net/.
Specific CO2 emissions per capita are calculated as the total amount of CO2 emissions divided by the population. This indicator allows us to assess how efficiently a country uses its resources and what its environmental impacts are per capita, data is presented at: https://www.theglobaleconomy.com/.
Specific CO2 emissions per unit of GDP are calculated as the total amount of CO2 emissions divided by the gross domestic product expressed in constant prices. This indicator provides an understanding of how much CO2 is emitted per unit of economic activity, which is critical for analyzing the sustainability and environmental performance of countries. This allows us to estimate the efficiency of resource use in the economy and the level of pollution per unit of economic activity, data is presented at: https://www.theglobaleconomy.com.
GDP per unit of energy consumption, expressed in dollars per kilogram of oil equivalent, is an important indicator reflecting the energy of a country economy. This indicator reflects how much GDP is generated for each unit of energy consumed in oil equivalent, data is presented at: https://data.worldbank.org/assets/images/placeholder.png.
- Assessment of the ecological-climatic changes impact on air quality of the region: It was used the National Communications and the Biennial Reports of the CACs to the UNFCCC [36,37,38,39,40]. The use of GHG inventory data in the analysis of atmospheric emissions in Central Asia is justified, because they are based on international standardized methodologies Intergovernmental Panel on Climate Change (IPCC) Guidelines 2006, mainly Tier 1, (Tier 2 Method: for waste, agriculture sectors) which allows for the comparison of analogous data, the assessment of emissions and their sources [41]. CH4 emissions mainly occur in agricultural production were obtained from GHG inventory data, supplemented by data from the Bureau of National Statistics and the TheGlobalEconomy.com [28,35,42]. The lack of data on other pollutants from industry, transport, and energy that are not related to GHGs, such as PM2,5, was filled in from relevant sources [29,30,31,32,33,34].
In this regard, analytical reports of the EDB, 2022; UNECE, 2019, data from the World Bank, World Energy&Climate Statictics-Yearbook, 2024; The U.S. Energy Information Administration were used, which include environmental and economic indicators that make it possible to understand the relationship between economic activity and the level of atmospheric pollution [17,23,28,29,30,31,32,33,34].
- The average CO2 emission factor, also known as the carbon factor is determined by calculating the ratio of CO2 emissions to primary energy consumption. It shows the amount of CO2 emitted per unit of energy, such as per kilowatt hour (kWh) or per tons of fuel burned. This indicator is vital for evaluating the effects of various energy sources on climate change. The data is presented at https://yearbook.enerdata.net/ [32].
- The ratio of specific CO₂ emissions from fuel combustion to GDP is expressed in kilograms of CO₂ per unit of GDP and serves as a significant measure for assessing the carbon intensity of an economy. The data is presented at UNECE, Data Portal https://w3.unece.org/SDG/ru/Indicator?id=28 [38].
Geospatial analysis of emissions is performed using mapping modeling in ArcGIS 10.8 based on EDGAR data and Sentinel-5P satellite measurements. The analysis produced maps of the geographic distribution of CO₂, PM2.5 and SO₂ in 2020, heat maps of emissions changes from 1990 to 2024, and a mapping analysis of urban areas with the highest emissions. ArcMap 10.8 software was used to create maps of CO₂ emissions and average monthly concentrations of PM2.5 air pollution in CACs in 2020 (Figure 9, 11). Emissions data were taken from public sources such as global environmental databases (e.g., EDGAR, Global Carbon Project) and national environmental monitoring agencies. ArcMap 10.8 introduced basemaps that visualize data using color gradations, from light for low outliers to dark for high outliers. Data of PM2.5 concentrations in individual cities, taken from [9] are presented as colored circles of different sizes and colors symbolizing a certain level of air pollution. Data on PM2.5 concentrations collected from ground stations or satellite sources [9]. These data were grouped into ranges (27, 74, 99, 110 and 112 μg/m³) to reflect the degree of pollution in each city represented.
- Strategies in Central Asia for implementing measures to reduce air pollution. Development of Recommendations for improvement.
It was used the results of the work performed, analytical reports of Eurasian Development Bank (EDB), 2022; the UNECE, 2019; OECD, 2019; WMO, 2024, UNEP, 2021; data from the World Bank; TheGlobalEconomy.com; The U.S. Energy Information Administration and national reports of the CACs to the UNFCCC [17,20,23,29,31,33,34,36,37,38,39,40].
3. Results
3.1. Scientometric Analysis of Publications
An analysis of the problem knowledge showed that in the period from 1990 to 2025, 15,360 articles were published which in one way or another revealed the issues of the atmospheric emissions impact and environmental pollution. In research on atmospheric emissions, an increase in publications has been observed since 2016, when publication activity increased several times [43]. In our opinion, this is linked to the adoption of the Sustainable Development Goals (SDGs) by the UN in 2015, as a significant portion of the SDGs are either directly or indirectly related to addressing air pollution. As part of this study, a scient metric analysis of data from the Scopus and Web&Science databases was guided using some keywords: “climate change in Central Asia”, “air pollutants reduction”, “emissions into the atmosphere”, “reduction in air quality”, “atmospheric emissions in Central Asia”, “decarbonization of the economy”. It is worth noting that the majority of the research, specifically 51%, was conducted by scientists from China and the United States. The next group includes scientists from the UK, Germany, Italy and India – just over 22%. Moreover, according to the heat map in Appendix A (https://drive.google.com/drive/folders/1qnzzYoEWraOvDGTqQ5V8KdhiXSdlmzaI), the majority of publications, more than 40% since 2018 are focused on the use of keywords such as: “air quality”, “particulate matters”, “emissions control”, “carbon dioxide”, and since 2020: “decarbonization”, “sustainability”, “energy policy”, “electric vehicles”. On the one hand, this reflects ongoing changes in global policies related to clean air, as well as the implementation of programs aimed at reducing atmospheric emissions and combating global warming. Conversely, it indicates a shift in research focus from pollution processes to their consequences and potential solutions.
Figure 1.
Country activity of air pollution research (via software VoSViewer).
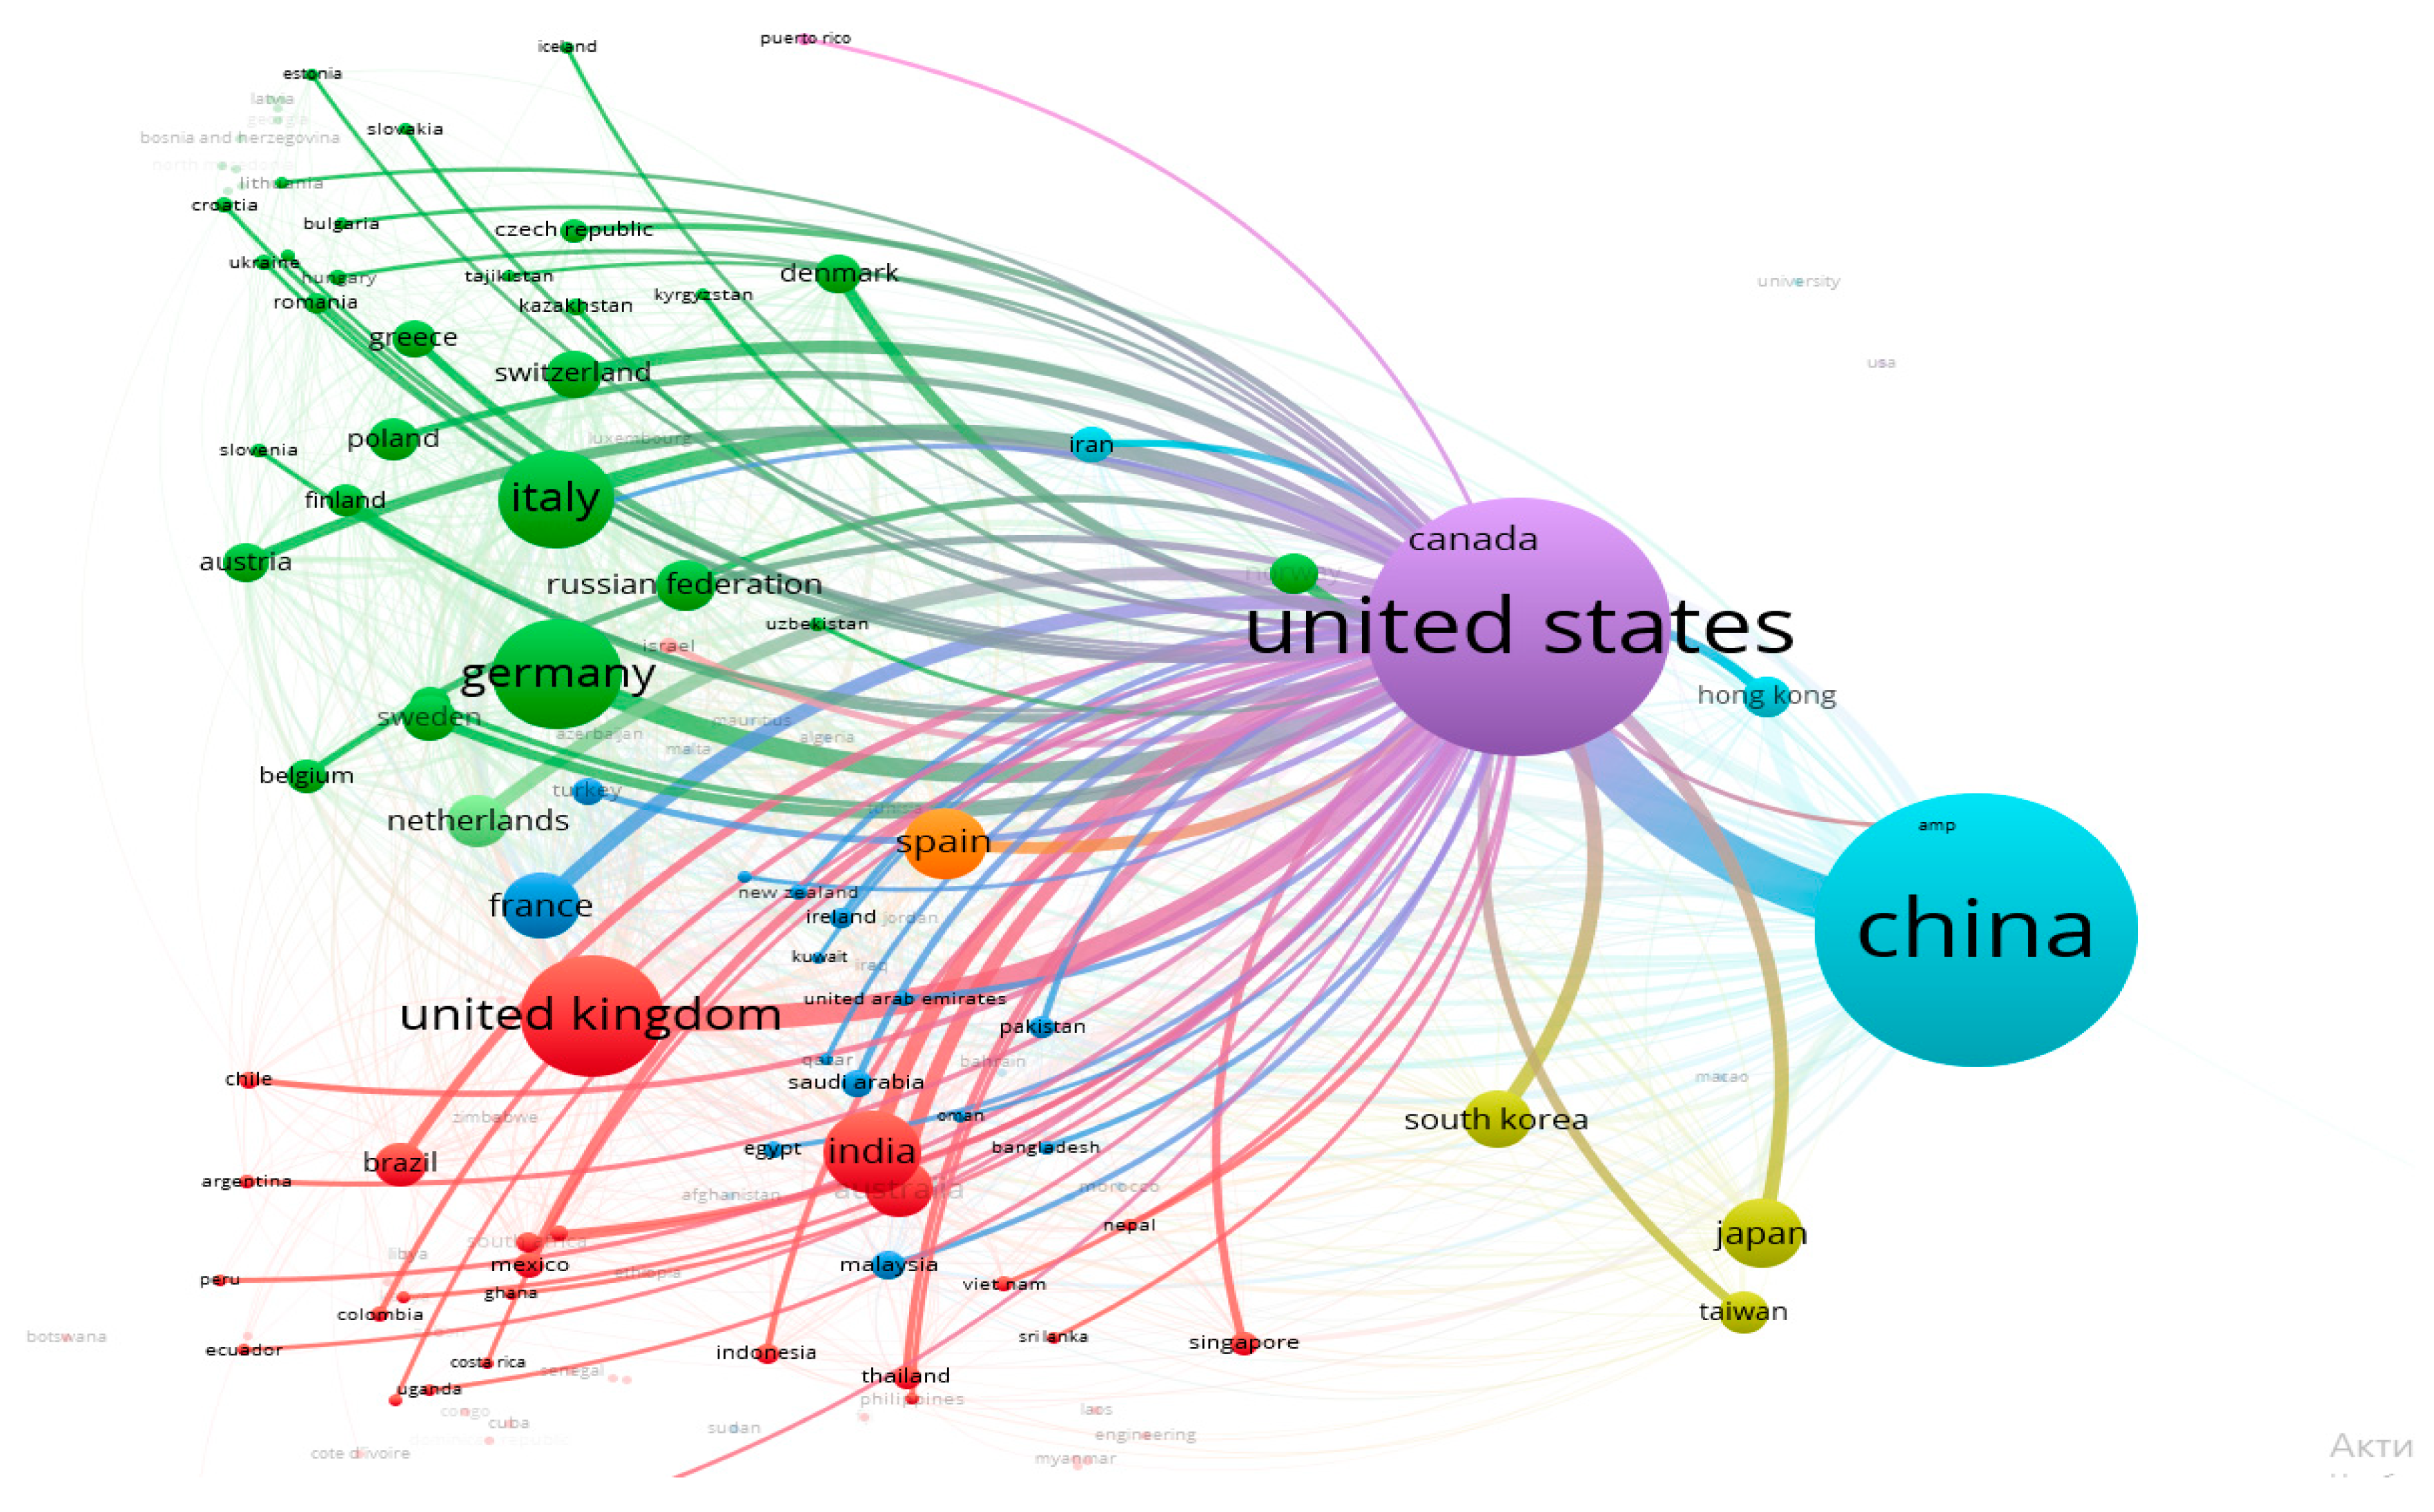
The bibliometric analysis of author contributions (Appendix B,https://drive.google.com/drive/folders/1qnzzYoEWraOvDGTqQ5V8KdhiXSdlmzaI) reveals that Chinese researchers are among the leading authors publishing articles on air pollution. Notable contributors include Zhang, Y.; Yang, W.; Wang, J.; Zhang, K.; Hao, Y.; Li, Q.; Jiang, J.H.; Wu, D.L., and others [15,16,44]. This trend underscores a significant increase in publication activity in recent years, focusing on air pollution and its potential adverse impacts on human health.
A notable geographic shift in publication activity has been observed, with a decline in contributions from Europe and the USA and a rise in output from Southeast Asian countries, particularly China. However, an analysis of available materials on the Central Asia region indicates a relative scarcity of systematic studies on air quality monitoring and assessment. There is a lack of comprehensive research in the scientific literature that investigates how the economic structure influences emissions in Central Asia. Existing research in the CACs is often fragmented and lacks continuity, primarily conducted within the framework of individual international grant-funded projects. Furthermore, data on atmospheric pollution in the CACs remain limited [44].
Despite these gaps, several high-impact articles address climate change and related greenhouse gas (GHG) emissions in the Central Asian region (CACs) [14,16,19,23,45]. Additionally, some studies focus on atmospheric pollution caused by non-greenhouse substances, particularly fine particulate matter (PM2.5) [8,9,26,44]. There are no studies that combine the analysis of GHG and non-GHG emissions. This would allow for a more objective assessment of atmospheric pollution in the region.
The need for a comprehensive approach to addressing this issue is driven by the importance of studying the region as a single, interconnected ecosystem. This necessity arises from several key factors: the geographical proximity of the countries, the similarity of their climatic and environmental conditions, and the mutual influence of atmospheric circulation patterns. Consequently, there is a mutual dependence among regional emissions, as pollutants released in one area can significantly affect air quality across borders. Thus, the results of the scientometric analysis provide additional arguments supporting the choice of the Central Asian region as the focus of this study.
3.2. Identification of the Central Asia Economy Sectors Features
The CACs are characterized by a heterogeneous economic structure. Thus, the structure of Kazakhstan’s GDP (Figure 2) is typical of countries with an above-average income level: the economy has a significant share of services (55.8%) and industry (27%), while agriculture, with huge land reserves, accounts for only 5.3%.
In contrast to Kazakhstan, an analysis of the GDP structure of Kyrgyzstan, Tajikistan, and Uzbekistan reveals that their economies are characteristic of lower-middle-income countries, where agriculture plays a more significant role (15.3–26.1%). In Turkmenistan, industry dominates (49.5%), primarily due to the country’s specialization in mineral extraction (Figure 2). By comparison, in global production, the services and trade sector hold a stable leading position, accounting for approximately 64%, while agriculture contributes only 4.27%. This disparity suggests that much of the value created by humanity is driven by the pursuit of marginal income rather than the generation of real added value. Such trends are reshaping societal awareness of the need for environmental protection.
3.2.1. A Comparative Assessment of Key Fuel and Energy Resources
In Central Asia, organic fuel occupies a dominant position in the production of key fuel and energy resources. The region’s primary exports include oil, gas, coal, metals, and other resources from the extractive sector [11,36]. Raw material exports remain a significant factor in the regional economy (Figure 3). A comparative analysis of the trends in income from natural resources as a percentage of GDP over a 30-year period (1990–2022) shows that the share of natural resource income in GDP for CACs varies from 1.91% in Tajikistan to 38.55% in Turkmenistan. In Kazakhstan, this figure ranged from 3.40% to 33.25% during the same period. Among the main export products, fuel and energy resources accounted for 67.7% in 2016, with ferrous metals at 5.4%, copper at 4.4%, and ore at 2.4%. Furthermore, between 2017 and 2022, Kazakhstan dominated total commodity exports in the Central Asian region, accounting for 72%. The shares of the remaining CACs were distributed as follows: Uzbekistan (15.6%), Turkmenistan (8.4%), Kyrgyzstan (2.3%), and Tajikistan (1.7%). This uneven distribution of export revenues is largely attributable to variations in the reserves and production levels of minerals in demand on international markets [46,47].
Between 2000 and 2007, Kazakhstan’s economy experienced an average annual growth rate of 10%, while between 2010 and 2014, it grew by nearly 6%. These high growth rates were primarily driven by the exploitation of hydrocarbon fields in Western Kazakhstan, coupled with the rise in global raw material prices. In terms of oil reserves, Kazakhstan ranks 12th globally and is among the top twenty countries with the largest natural gas reserves. This strong correlation between Kazakhstan’s economy and oil prices underscores its resource dependence.
The region also holds immense potential in the water and energy sectors. Not only are some of the world’s richest oil and gas fields located here, but there is also significant, yet underutilized, potential for RES. For instance, hydropower resources are abundant due to the region’s mountainous terrain, which covers more than 17% of the total area. Additionally, solar energy potential is substantial, as two major deserts—the Karakum and Kyzylkum – account for over 16% of the region’s total land area [5].
Turkmenistan, Uzbekistan, and Kazakhstan possess substantial natural gas reserves, with Kazakhstan also holding significant coal deposits. In contrast, Tajikistan and Kyrgyzstan are rich in hydropower resources, controlling approximately 60% of the region’s water reserves, despite having minimal accessible fossil fuel reserves [17,47]. Over the period from 1990 to 2020, the share of RES in Tajikistan and Kyrgyzstan averaged 32.37% and 25.48%, respectively [28]. In other countries within the region, which have significant potential for expanding solar and wind energy, the share of these energy sources remains low. The share of RES (excluding hydropower) in the region’s energy balance remains low: 3% in Kazakhstan, 1.2% in Uzbekistan, and less than 0.5% in Turkmenistan [47]. This is due to a number of factors, including outdated infrastructure, lack of investment and the absence of a clear government energy policy.
The data presented in Figure 4 indicate that approximately three-quarters of electricity in Central Asia is generated by power plants utilizing coal, oil, and natural gas. The power generation profiles of each of CACs highlight the regional imbalance in available energy sources. Kazakhstan, Turkmenistan, and Uzbekistan predominantly rely on fossil fuels for electricity generation (approximately 90%), whereas Kyrgyzstan and Tajikistan generate over 90% of their electricity from hydropower [17,47].
The increase in energy consumption in the region can be attributed to several factors:
- -
- population growth (in 2023, the population growth rate in the region ranged from 1.3% to 2.1%, compared to the global average of 0.9%);
- -
- rising urbanization (urbanization rates in the region ranged from 38% to 58% in 2023, compared to the global average of 57%);
- -
- an increase in housing construction (for example, between 1990 and 2019, Kyrgyzstan’s housing stock increased by 30 million m²);
- -
- infrastructure development (in 2023, the share of services in Kazakhstan’s GDP reached 55.97%, aligning closely with the global average of 54.52%) [34].
Notably, Kazakhstan exhibits a high level of energy consumption, with per capita energy use reaching 5,890 kWh in 2023, significantly higher than the global average of 3,200 kWh per capita (Figure 4). Furthermore, Figure 4 reveals that between 2014 and 2023, the CACs experienced a decline of 8–27% in GDP per unit of energy consumed, indicating a decrease in energy efficiency. In contrast, during the same period, global GDP per unit of energy consumed increased by 4%. This decline in energy efficiency in Central Asia is primarily driven by rising energy consumption and the expansion of energy-intensive industries within the regional economies. It is worth noting that the growing construction sector currently accounts for more than a fifth of global emissions in energy demand and emissions. The building sector is seeing a resurgence in expansion, which has a tremendous direct and indirect effect on the environment taken as one of the most waste-producing and waste-producing sectors of the economy [48]. The global construction sector emitted a total of 5.7 billion tons in 2009, accounting for 23% of the total CO2 emissions generated by economic activities worldwide [48,49]. The residential sector is the largest consumer of electricity after the mining and industrial sectors in CACs. About 75% of buildings in the region were built in the 1950s-1990s and do not meet modern energy efficiency standards. For example, energy consumption in the residential sector of Kazakhstan is about 270 kWh/m2, which is 2.7 times higher than in Europe[6].
The link between economic structure and emissions levels is confirmed by econometric indicators: the carbon intensity of GDP in countries dependent on hydrocarbon exports (Kazakhstan, Turkmenistan), is 0.5-0.6 kg CO₂/$1 GDP, while in Kyrgyzstan and Tajikistan this figure is lower (0.2-0.3 kg CO₂/$1 GDP). Evidence of excessive energy consumption in CACs, particularly in Uzbekistan and Kazakhstan, is demonstrated by the energy intensity indicator, measured as energy use per $1,000 of GDP for the period 1990–2023 (Figure 5). This indicator is significantly higher than that of developed countries, such as Norway (2–4 times higher) and China (1.5–2 times higher), which were selected for comparison [32]. High energy intensity is often associated with the predominant use of fossil fuels for energy generation, leading to elevated GHG emissions. The data presented herein suggest that Kazakhstan and Uzbekistan exhibit the highest levels of energy and carbon intensity within the Europe and Central Asia region.
The high energy demand per unit of GDP in Kazakhstan can be attributed to several factors, including:
a. the historically established energy-intensive structure of the industrial economy with low added value;
b. the overall technological backwardness of production processes;
c. the severe continental climate, characterized by prolonged and harsh winters;
d. the vast territory and extensive transport infrastructure, including oil and gas pipelines, electricity transmission lines, and water supply systems.
This disparity between the relatively low share of industrial output and the disproportionately high level of energy consumption is, in our view, a critical factor exacerbating air pollution not only in Kazakhstan but also in other countries within the region.
3.2.2. The Relationship Between the Economic Structure of Countries and the Level of Pollution
An integral indicator for assessing anthropogenic impacts within the context of a resource-based economy is the total emissions of pollutants per unit of GDP. For comparative analysis, the dynamics of changes in CO₂ emissions per unit of GDP (Figure 6a) were examined. This metric serves as a universal indicator for evaluating the environmental impact of energy production, industrial activities, agriculture, and municipal services. It reflects energy intensity, the efficiency of manufacturing technologies, and the extent of fossil fuel consumption. The analysis revealed that the highest values of this indicator are observed in Kazakhstan, Turkmenistan, and Uzbekistan.
Additionally, to assess the contribution of each Central Asian country to global emissions, the dynamics of specific CO₂ emissions per capita were analyzed. In Kyrgyzstan (Figure 6b), specific emissions have declined since 1990, with a slight increase in recent years, reaching just over 2 tons per person. This trend is likely due to the country’s growing emphasis on agriculture. For comparison, CO₂ emissions per capita in Kazakhstan reached 16.7 tons per person in 2011 [36]. Kazakhstan and Turkmenistan, as significant global exporters of oil and gas, have increased their per capita emissions by more than 70% from 1998 to 2014, nearing the levels recorded in 1990 [28,50].High energy intensity and air pollution are interconnected elements in the broader issue of sustainable development and environmental protection. Against this background, the issue of using clean energy as an alternative solution to combat climate change also occupies an important place. Switching to RES and applying energy conservation technologies can help reduce both energy intensity and air pollution. The development of RES is hampered by limited access to financing, weak institutional support and a lack of regional coordination in environmental policy. This indicates the region’s high dependence on fossil fuels and a lack of investment in alternative energy.
Thus, in Central Asia despite the relatively high average yearly economic growth rate – 6.2%, in the last 30 years, the main part of the commodity exports of Kazakhstan and Turkmenistan has been fossil natural resources and products of their primary processing (73.6-81.4% of all commodity exports in 2023). This is characterized by a low level of product diversification, accompanied by high energy consumption, and demonstrates an export-dependent economy vulnerable to external shocks, which is exacerbated by a lack of financing. CACs face vulnerabilities not only from the risks linked to climate change and global warming but also from external economic shocks, heavy dependence on resource rents and volatility of global oil prices. This means that natural resources start as a “resource blessing” but eventually turn into a “resource curse” [51].
3.3. Assessment of the Impact of Ecological-Climatic Changes on the Regional Air Quality
3.3.1. Comparative Analysis of National GHG Emission Reduction Strategies
A major contribution to a current climate change is the substantial influx of GHGs into the atmosphere resulting from unregulated human economic activity. The reports from the IPCC, 2022, 2023 affirm with a strong level of certainty that there exists an almost linear correlation between total human-caused carbon emissions and the resulting global warming they induce [52]. Restricting global warming caused by human activities to a specific level necessitates controlling the total CO2 emissions as well as substantially reducing emissions of other GHGs. In order to evaluate the effects of environmental and climatic changes on atmospheric air, an analysis of changes in the volume of GHGs in CACs from 1990 to 2021 (Figure 6) was conducted using available data sources.
In Kazakhstan, the primary source of GHG emissions (Figure 7) is the energy sector, which accounted for 83.02% in 1990 and 77% in 2023 of the total emissions, which is equivalent to 261.9 million tons of CO₂-equivalent (CO2-eq.) [36]. Of this value, 75% of pollution originate from stationary sources, including power plants. In addition to traditional energy and heat production, the Energy Activities sector, according to the IPCC classification, includes the following categories: Manufacturing and Construction, Transport, Other Sectors [41]. An analysis of total national emissions showed that GHG emissions fell by only 1.55% between 2012 and 2021[53]. In Kazakhstan, coal occupies the dominant portion of total primary energy use, making up 49.6% of the fuel and energy balance. The following biggest contributors to total primary energy use are natural gas at 26.7%, oil and oil products at 21.7%. More than 90% of all balance reserves of hydrocarbons are concentrated in the western region of Kazakhstan, including 13,466.9 million tons of geological and 4,457.3 million tons of recoverable oil reserves, as well as 1,322.6 billion m3 of free gas. At the same time, the Atyrau region accounts for 73% of oil reserves, and the West Kazakhstan region accounts for 62% of free gas reserves [35].
GHG emissions in industry rose by 26.1% from 2012 to 2021, according to the results of the national inventory. In 1990, the industry accounted for 19,292.85 thousand tons of CO2-eq, which is 5.05%, and in 2020 - 24,960.81 thousand tons of CO2-eq or 6.3%. The primary contributors of GHG emissions include the production of iron and steel, ferroalloys, aluminum, cement, use of limestone and dolomite. During the specified period, the volume of GHG emissions from waste increased by 58.17%, the share of which amounted to 2.03% in 2020 [36].
In Kyrgyzstan, the main volume of GHG emissions (Figure 7) came from the energy sector: from 73% in 1990, 54% in 2010, to 68.3% in 2021. The second largest source of GHGs in the republic is agriculture. Thus, the share of the “Agriculture” sector accounted for 33.5% in 2010, 31.05% in 2018. The share of Industrial Processes in the Energy sector in 1990 was 2,5%, in 2021- 8,5%. Overall, GHG emissions from the Energy sector have declined, driven by increased use of hydropower [37].
An analysis of GHG emissions by sector in the Republic of Tajikistan (Figure 7) reveals that in 1990, 60% of the country’s total GHG emissions originated from the energy sector, followed by agriculture (35%) and industry (9%) [54]. Within the energy sector, the largest contributors to CO₂ emissions were subsectors such as energy production, manufacturing and construction, transport, as well as cement and aluminum production [38]. By 2021, GHG emissions in CO₂-eq. from the energy sector accounted for 42.91% of the country’s total emissions, while agriculture contributed 38.54%, industry 13.4%, and waste 5.21% (GHG emissions in Tajikistan, https://www.emission-index.com/countries/tajikistan).
In Uzbekistan, GHG emissions increased by 42.4% between 1990 and 2020 (Figure 7). The energy sector remained the dominant contributor, accounting for 67.95% of total emissions in 2020. Agriculture ranked second, contributing 16.07% in 2020, with a significant increase of 172.7% over the 1990–2020 period. The industrial sector was the third-largest contributor, accounting for 14.56% of emissions in 2020, with a growth rate of 121% over the same period [39].
In 2021, Turkmenistan emitted 189 million metric tons of CO₂-eq., representing a 2.3% increase compared to 2020. The primary sources of GHG emissions in Turkmenistan include the energy, industrial, transport, agricultural, and residential and communal services sectors. The energy sector was the largest emitter, producing 174 million tons of GHG emissions in 2021, which accounted for 92.1% of the total (GHG Emissions in Turkmenistan, https://www.emission-index.com/countries/turkmenistan). Agriculture and industrial processes were the second and third largest contributors, accounting for 6.3% and 0.79% of total emissions, respectively. Waste accounted for 1.5 million tons, or 0.79%, of total emissions in 2021 (https://www.emission-index.com/countries/turkmenistan).
Accurate data on the dynamics of GHG emissions in Turkmenistan for the entire period from 1990 to 2021 remain unavailable due to contradictory and insufficient information. However, estimates indicate that the total volume of GHG emissions in the country more than doubled between 2000 and 2017. Emissions from fuel combustion increased by 62%, primarily driven by the combustion of flare gas. The highest emissions occur during fuel combustion, as well as during the extraction, transportation, and storage of oil and gas [40]. According to another source, the average annual growth rate of emissions since 1990 has been 0.85% (https://www.emission-index.com/countries/turkmenistan). Nevertheless, the energy sector remains the primary source of GHG emissions in Turkmenistan.
Thus, the primary contribution to GHG emissions in all CACs is made by Energy sector, which is linked to the production and increasing utilization of organic fuel. The main source of emissions from burning fossil fuels increased by more than 60% between 2001 and 2021[7]. A comparative analysis of national emission reduction strategies has found that, despite international commitments, actual emission reductions remain small. Kazakhstan has committed to reducing CO₂ emissions by 15% by 2030, but as of 2024 their level remains higher than in 1990.Moreover, in terms of GHG emissions, the largest amount was emitted by Kazakhstan. Uzbekistan plans to cut by 10%, but dependence on natural gas prevents significant improvements. Over the same period, Kyrgyzstan showed a smaller increase in emissions - by 43.3%, and Tajikistan - by 29.7%, which is obviously related to the use of hydropower, which accounts for 90-98% of electricity generation. While Kyrgyzstan and Tajikistan are betting on hydropower, investment growth in green energy remains slow. The data underscores the high reliance of CACs on fossil energy, which presents obstacles to meeting climate objectives and shifting towards RES. Unlike the EU and China, which have strict emissions quotas and carbon trading systems, Central Asian countries lack an effective carbon regulation mechanism.
The average CO2 emission factor (carbon factor) which is the ratio of CO2 emissions to primary energy consumption for the CACs, is the highest globally, exceeding 2.0-2.5 tCO2 per tons of oil equivalent (toe) in both 1990 and in 2023. For Kazakhstan it was 3.18 in 2023 [32] (Figure 8). Accordingly, Kazakhstan, Uzbekistan and Turkmenistan rank among the 100 countries globally with highest carbon footprints and significant CO2 emissions [54,55,56].
3.3.2. Study of the Dynamics of Fossil CO₂, PM2.5 and SO₂ Emissions in Central Asian Countries
This subsection examines the dynamics of fossil CO₂, PM2.5 and SO₂ emissions in CACs, as well as their geographical distribution and relationship with the economic structure of the region. Considering that the main atmospheric emissions in the CACs are determined by emissions from fuel combustion, it was considered appropriate in this paper to examine in more detail the dynamics of CO2 emissions from fuel combustion ().
Since CO2 accounts for 99.7% of the volume when burning fuel, other greenhouse gases CH4 and N2O account for 0.3%, and all information in the international classification of countries in the ratings of the World Bank, UNECE, US Energy Information Administration, etc. is given for CO2 [28,30,32,34]. The data obtained indicate that in CACs, CO2 emissions associated with the combustion of fossil fuels have not decreased for many years. Interpretation of these results shows that the high CO₂ emissions in Kazakhstan and Uzbekistan are associated with the continued high share of coal-fired generation and industrial production, while the low emissions in Kyrgyzstan and Tajikistan are due to the high share of hydropower. However, this makes their energy systems vulnerable to seasonal climate changes. For visualization, the map (Figure 10a) shows a comparison of CO2 emissions from fuel combustion in CACs in 2020 (Kyrgyzstan – 9089, Tajikistan – 9329, Kazakhstan – 211890, Turkmenistan – 63665, Uzbekistan – 115589 tons).
The map (Figure 10b) shows CO₂ emissions per capita in metric tons, allowing a comparison of the environmental burden created by the average person in each country. In terms of emissions per capita, Kazakhstan is among the world’s largest emitters, ranking 12th in 2020 [47].
The map (Figure.10c) shows the ratio of specific CO₂ emissions to GDP (in kilograms per unit of GDP) (Tajikistan - 0.21, Kyrgyzstan - 0.26, Uzbekistan - 0.43, Kazakhstan - 0.44, Turkmenistan - 0.61 kg CO₂ per unit of GDP), which allows us to estimate the carbon intensity of each country’s energy sector. As can be seen from (Figure 10c), in Kazakhstan CO2 emissions per unit of GDP are 73%, higher than the global average (0,25). Kyrgyzstan and especially Tajikistan have significantly lower indicators, which is explained by the large share of clean energy, on average 25.48%, 52.37% respectively [47]. Thus, a comparative analysis of the spatial distribution of CO2 emissions revealed significant territorial differences in pollution levels. These data indicate the need for a territorially differentiated approach to environmental policy, taking into account the characteristics of natural conditions and industrial development.
Simultaneously, the combustion of various fuels releases several over pollutants, including carbon monoxide (CO), non-methane volatile organic compounds (NMVOC), sulfur dioxide (SO2), nitrogen oxides (NOX), and PM, all of which contribute to air pollution on local, regional, and even global scales [33]. PM2.5 are dangerous for human health air pollutants, which includes black carbon and tropospheric ozone [26]. Below are data (Figure 11) showing PM2,5 emissions in CACs since 1990.Almost the entire population of the region is exposed to their impact for a long time, which is associated with the climatic, geographical and meteorological characteristics of the region, which create conditions for the accumulation of polluting particles in the air, primarily in large cities and industrial centers, especially during the heating season (the concentration of PM2.5 increases sharply). This problem is particularly relevant for some large cities in CA, where it can be aggravated by socio-economic factors and geographical features [47].
Typically, urban and industrialized areas with high population density have the highest levels of air pollution. Although the sources of PM2.5 vary somewhat from country to country, they are definitely related to activities such as fuel combustion, agricultural waste, municipal solid waste, industrial activities, etc. An analysis of PM2.5 emission sources obtained with a model using satellite measurements from a global low-resolution network dataset showed the following sources: wind-blown dust - 33%, energy (CHP and heating) - 40%, waste - 7%, industry - 4% and transport - 3% PM levels indicate significant excess of World Health Organization (WHO) recommended values (5 µg/m3) [57]. The data obtained correlate with the findings of other studies on PM2.5 emissions [9,44,58].
The map (Figure 12) displays the annual average levels of PM2.5 air pollution in the region. In addition, the average monthly concentrations (January 2020) in 5 cities of Central Asia obtained in the work [9] are presented in the form of colored circles of different sizes. These data were grouped into ranges (27, 74, 99, 110 and 112 μg/m³) to reflect the degree of pollution in each city. Each color demonstrates a certain level of air pollution, indicated in the legend. It was shown that average monthly concentrations of PM2.5 in these Central Asia cities exceeded WHO standards (5.0 μg/m3) by 4.3–12.6 times [9]. High concentrations of PM2.5 in the cities of Almaty, Tashkent and Bishkek in winter exceed 100 μg/m³, which is significantly higher than WHO standards. Elevated PM2.5 concentrations in major cities indicate the impact of motor vehicle transport, coal heating and adverse weather conditions in winter. According to the 2021 study, the authors [9,57] associate higher concentrations of PM 2.5 in winter in the aforementioned Central Asia cities with heating, as well as a high frequency of ground-level inversions, stagnant weather conditions with lower planetary boundary layer heights and calmer wind conditions that impair PM 2.5 dispersion and dilution. It should be noted that in 2021, PM2.5 levels in Kazakhstan exceeded WHO recommended limits by 2-15 times in 25 out of 27 cities [58]. According to IQAir, a global air quality monitoring platform, the concentration of PM2.5 in the city of Uralsk in 2022 is 2.5 times higher than the WHO recommended values. Thus, in large industrial centers, concentrations of PM 2,5 reach critical levels, while in mountainous and sparsely populated areas the level of pollution remains low.
Over 80% of SO₂ emissions are anthropogenic [59]. Below are data (Figure 13) showing SO₂ emissions in CACs since 1990.
According to 2019 data, three of the world’s top 20 SO2 emitters were in Central Asia: Kazakhstan (10th place), Uzbekistan (14th place) and Turkmenistan (17th place) [59]. Of course, the presented data are episodic in nature, since they are related to the activities of external experts, or within the framework of the implementation of grant projects. They need to be systematized and confirmed by ground measurements, but at the same time, they allow us to identify the main reasons for the decline in air quality in the region so that governments can make appropriate decisions.
Thus, the analysis of the results shows that the high level of emissions in the region is due to the structure of the economy based on fossil fuels, underdeveloped emission regulation mechanisms and weak integration into global initiatives to reduce air pollution. Moreover, the main contribution to GHG emissions is made by energy. In CACs, the proportion of CO2 emissions from the combustion of organic fuels has not changed significantly over the past 30 years and ranges from 54 to 78%. As a result, carbon factor for CACs is the highest in the world – over 2,0-2,5 t CO2/toe both in 1990 and in 2023. This is due to high energy and resource intensity of the region’s economy, there is inefficient use of natural resources and high energy consumption. This requires a comprehensive approach to reducing emissions, including the development of RES, the modernization of old coal-fired power plants, the introduction of stricter environmental standards and increased regional cooperation on air quality management.
3.4. Econometric Modeling in the R Program
To test the hypotheses put forward, econometric modeling was used to identify the level of dependencies between the dependent variable and the factors that determine it.. The collection and processing of data across five countries allowed us to create a panel data set for the period 2012-2023, which included:
| Variables | |||
| y1 | CO2 emissions from fuel combustion, Mt | x6 | GDP, billion USD |
| x1 | coal consumption, Mt | x7 | Energy consumption, Mtoe |
| x2 | Oil product consumption, Mt | x8 | SO2 emissons,kt |
| x3 | natural gas consumption, Mt | x9 | PM2,5 emission, kt |
| x4 | global carbon factor, tCO2/toe | x10 | share of RES, % |
| x5 | energy intensity, koe/$15p | x11 | CO2 emissions per capita, t /person |
Correlation analysis of data across countries revealed the next level of closeness of relationships, which allows for the selection of variables for further modeling (Appendix C).
The graph in Figure 14 presents the correlation matrix in three-dimensional space for all five countries using panel data for the period 2012-2023, where: Axis X and Y are variables, Axis Z is the value of the correlation coefficient. The color scale shows the level of correlation; the darker the color, the negative the relationship.
Strong positive correlations (yellow dots, closer to 1): CO₂ and GDP – high positive correlation; CO₂ and energy consumption – confirms that energy consumption is directly related to CO₂ emissions; SO₂ and coal - makes sense, since coal generation increases sulfur emissions.
Strong negative correlations (dark purple dots, closer to -1): RES_Share and Oil – alternative energy sources replace oil; RE_Share and Coal Consumption – RES reduces coal consumption; Energy efficiency and oil consumption - the higher the oil consumption, the lower the energy efficiency.
Medium strength connections (green-blue dots): Carbon_Factor and GDP - moderate relationship, manifested through the energy intensity of the economy; SO₂ and PM2.5 - SO₂ emissions are associated with PM2,5 pollution.
As the presented data shows, RES_Share is highly correlated with Oil, Coal, Energy_Intensity. This indicator is subject to exclusion in the modeling process, since it duplicates the influence of other variables. In turn, the analysis of the closeness of the Energy_Intensity dependence indicates a high dependence on coal and oil, which also requires the exclusion of this indicator. Since oil and coal consumption are highly correlated with each other (-0.79), for modeling purposes we use the coal consumption indicator, as its impact on CO₂ emissions is more significant, which is consistent with our earlier conclusions. Using these results, we will build a model in the R program using two modeling effects: a fixed effects model (FE - Fixed Effects) and a random effects model (RE - Random Effects).

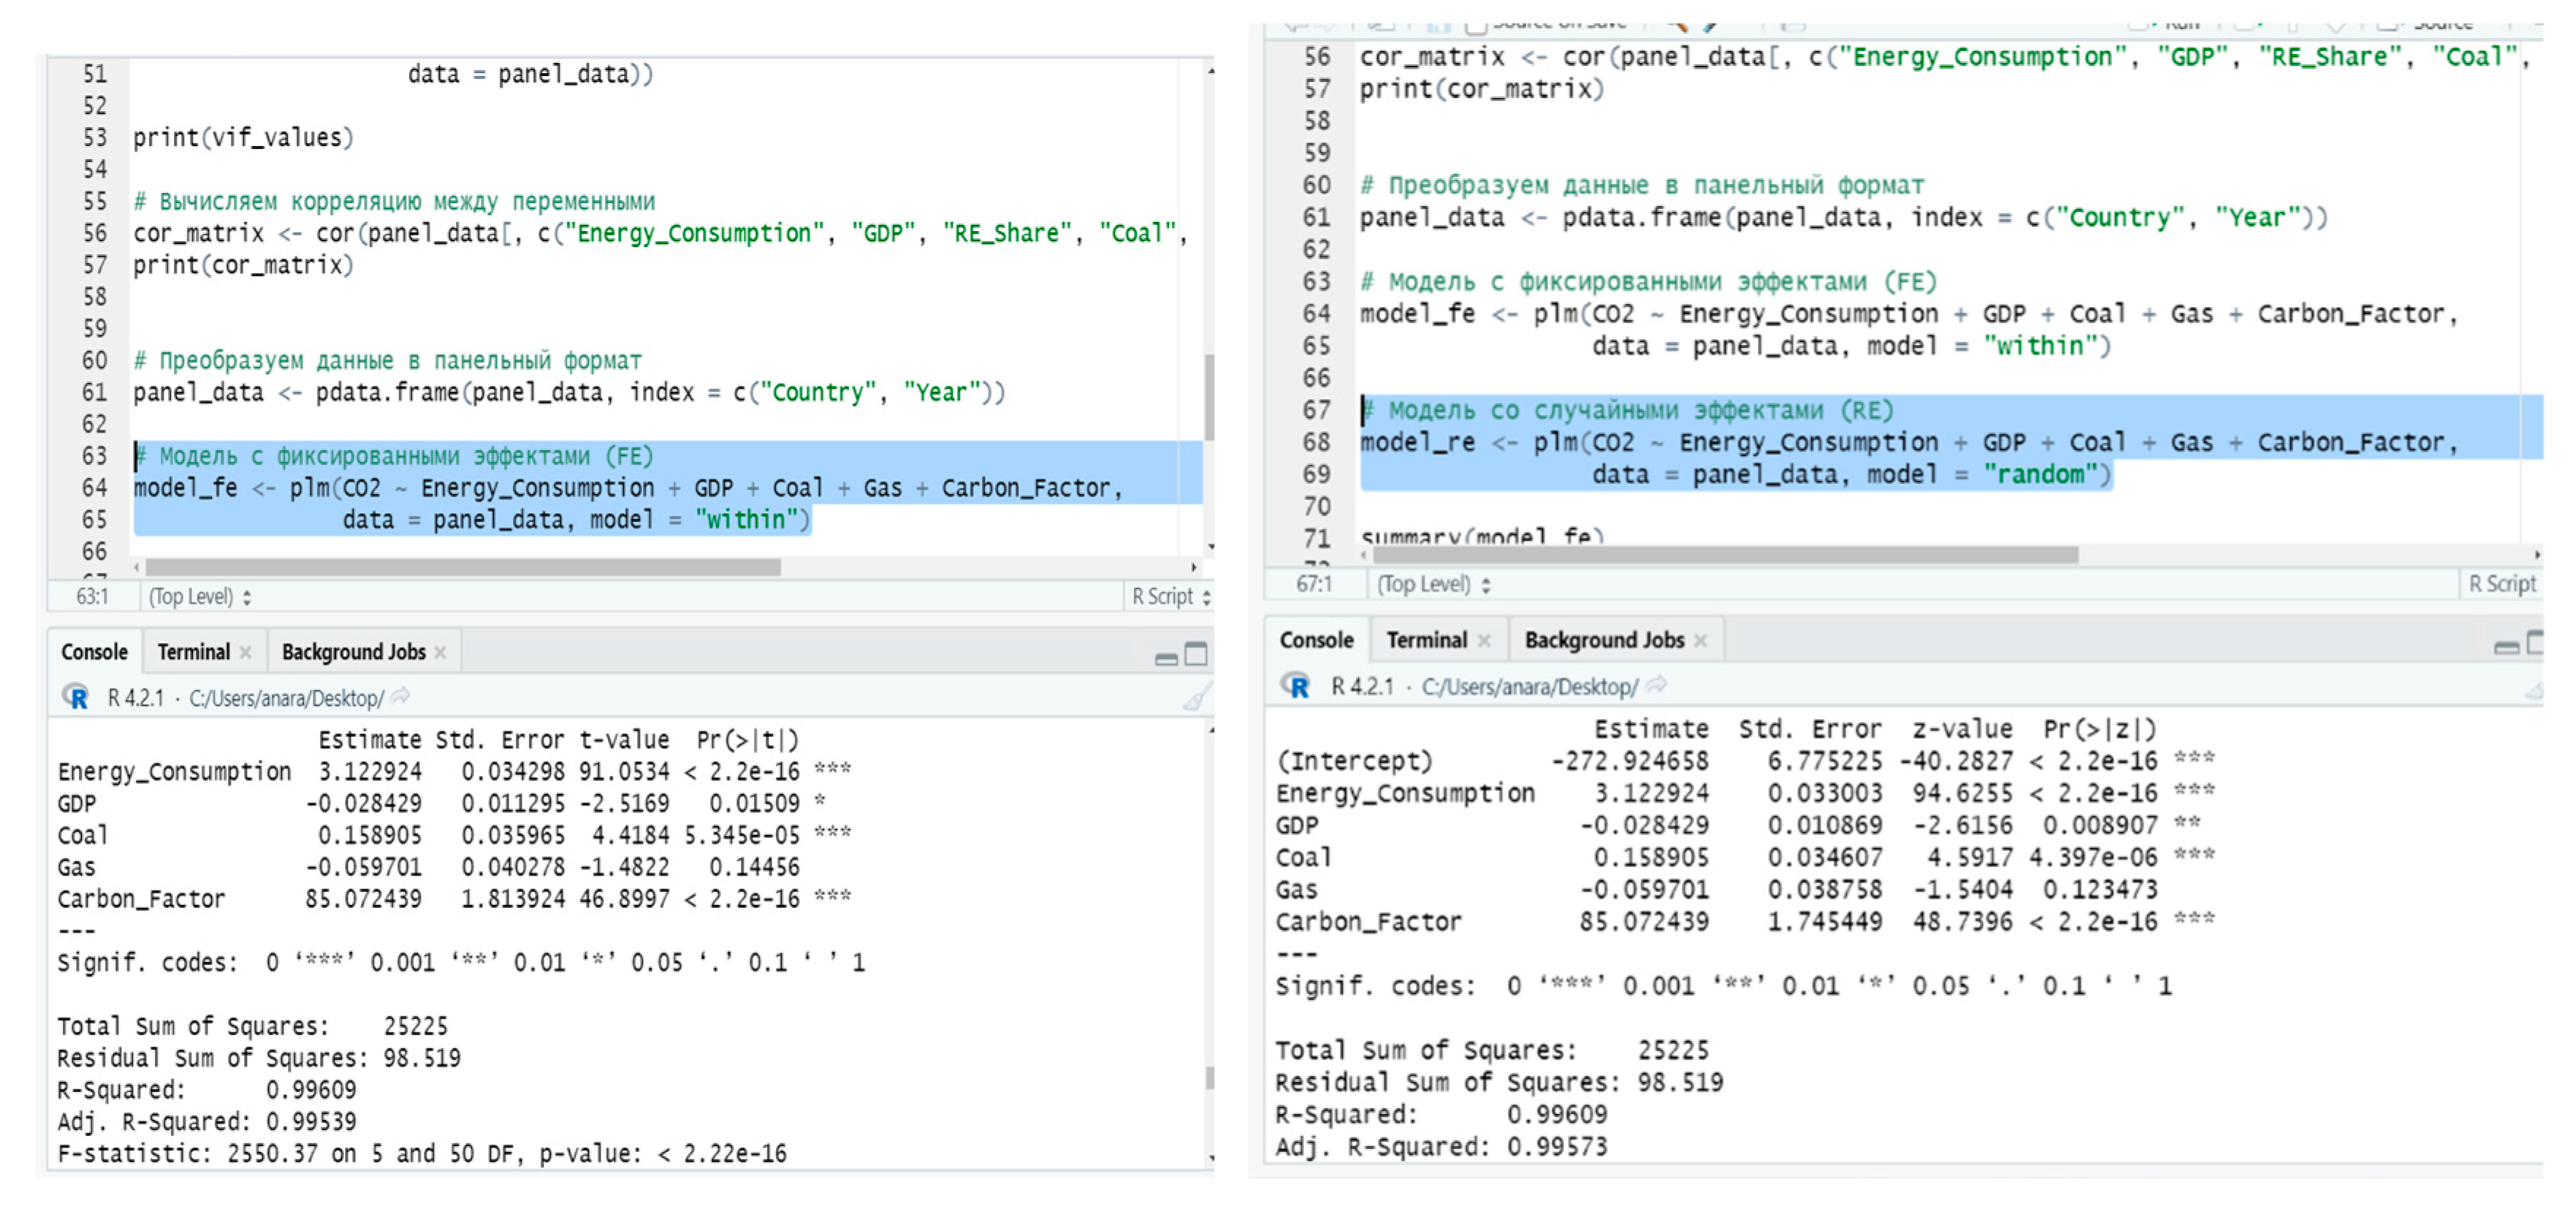
Table 1.
Results of modeling taking into account modeling effects.
| Model |
Fixed effects model (FE) model_fe <- plm(CO2 ~ Energy_Consumption + GDP + Coal + Gas + Carbon_Factor, data = panel_data, model = “within”) |
Random effects model (RE) model_re<- plm(CO2 ~ Energy_Consumption + GDP + Coal + Gas + Carbon_Factor, data = panel_data, model = “random”) |
| Description |
Coefficients: Estimate Std. Error t-value Pr(>|t|) Energy_Consumption 3.122924 0.034298 91.0534 < 2.2e-16 *** GDP -0.028429 0.011295 -2.5169 0.01509 * Coal 0.158905 0.035965 4.4184 5.345e-05 *** Gas -0.059701 0.040278 -1.4822 0.14456 Carbon_Factor 85.072439 1.813924 46.8997 < 2.2e-16 *** Total Sum of Squares: 25225 Residual Sum of Squares: 98.519 R-Squared: 0.99609 Adj. R-Squared: 0.99539 F-statistic: 2550.37 on 5 and 50 DF, p-value: < 2.22e-16 |
Coefficients: Estimate Std. Error z-value Pr(>|z|) (Intercept) -272.924658 6.775225 -40.2827 < 2.2e-16 *** Energy_Consumption:3.122924 0.033003 94.6255 < 2.2e-16 *** GDP:-0.028429 0.010869 -2.6156 0.008907 ** Coal: 0.158905 0.034607 4.5917 4.397e-06 *** Gas: -0.059701 0.038758 -1.5404 0.123473 Carbon_Factor:85.072439 1.745449 48.7396 < 2.2e-16 *** Total Sum of Squares: 25225 Residual Sum of Squares: 98.519 R-Squared: 0.99609 Adj. R-Squared: 0.99573 Chisq: 13772 on 5 DF, p-value: < 2.22e-16 |
Figure 15.
Modeling in R (left model FE, right model RE). Note: built in R based on research data.
To select one of the significant models for the study, the Hausman test was used, within the framework of which the following intermediate modeling hypotheses were introduced:
МH₀: There is no difference between FE and RE, random effects are preferable.
МH₁: There is a difference, fixed effects are more acceptable.
In this case, a low p-value would indicate the need to use a fixed effects model and confirm hypothesis MH1. Otherwise, the null hypothesis and the random effects model are confirmed.
Hausman Test Result
data: CO2 ~ Energy_Consumption + GDP + Coal + Gas + Carbon_Factor
chisq = 4.2944e-25, df = 5, p-value = 1
alternative hypothesis: one model is inconsistent
p-значение > 0,05 → The non-consistency hypothesis is rejected, meaning that the random effects (RE) model is preferred.
The equation shows that the variable “Gas” is not significant and does not affect the performance indicator in any way,
based on this, we remove it and build a new model (table, RE model. GAS p-value 0.123473>0.05).
Random effects model (RE1)
model_re1 <- plm(CO2 ~ Energy_Consumption + GDP + Coal + Carbon_Factor,
data = panel_data, model = “random”)
CO2(i,t)=−272.71+3.124⋅Energy_Consumption(i,t)−0.0326⋅GDP(i,t)+0.1467⋅Coal(i,t)+85.243⋅Carbon_Factor(i,t)+ui+
+ϵi,t (1)
where:
CO2(i,t) — CO₂ emissions in country i in year, t
Energy_Consumption(i,t) — energy consumption (the higher, the more emissions).
GDP(i,t)— gross domestic product (GDP growth helps reduce emissions).
Coal(i,t)— coal consumption (increase leads to increased emissions).
Carbon_Factor(i,t)— carbon intensity of the economy (the higher, the more emissions).
ui— random effects reflecting individual characteristics of countries.
ϵi,t - random model error.
Figure 16.
Random effects model (RE1) Note: built in R based on research data.
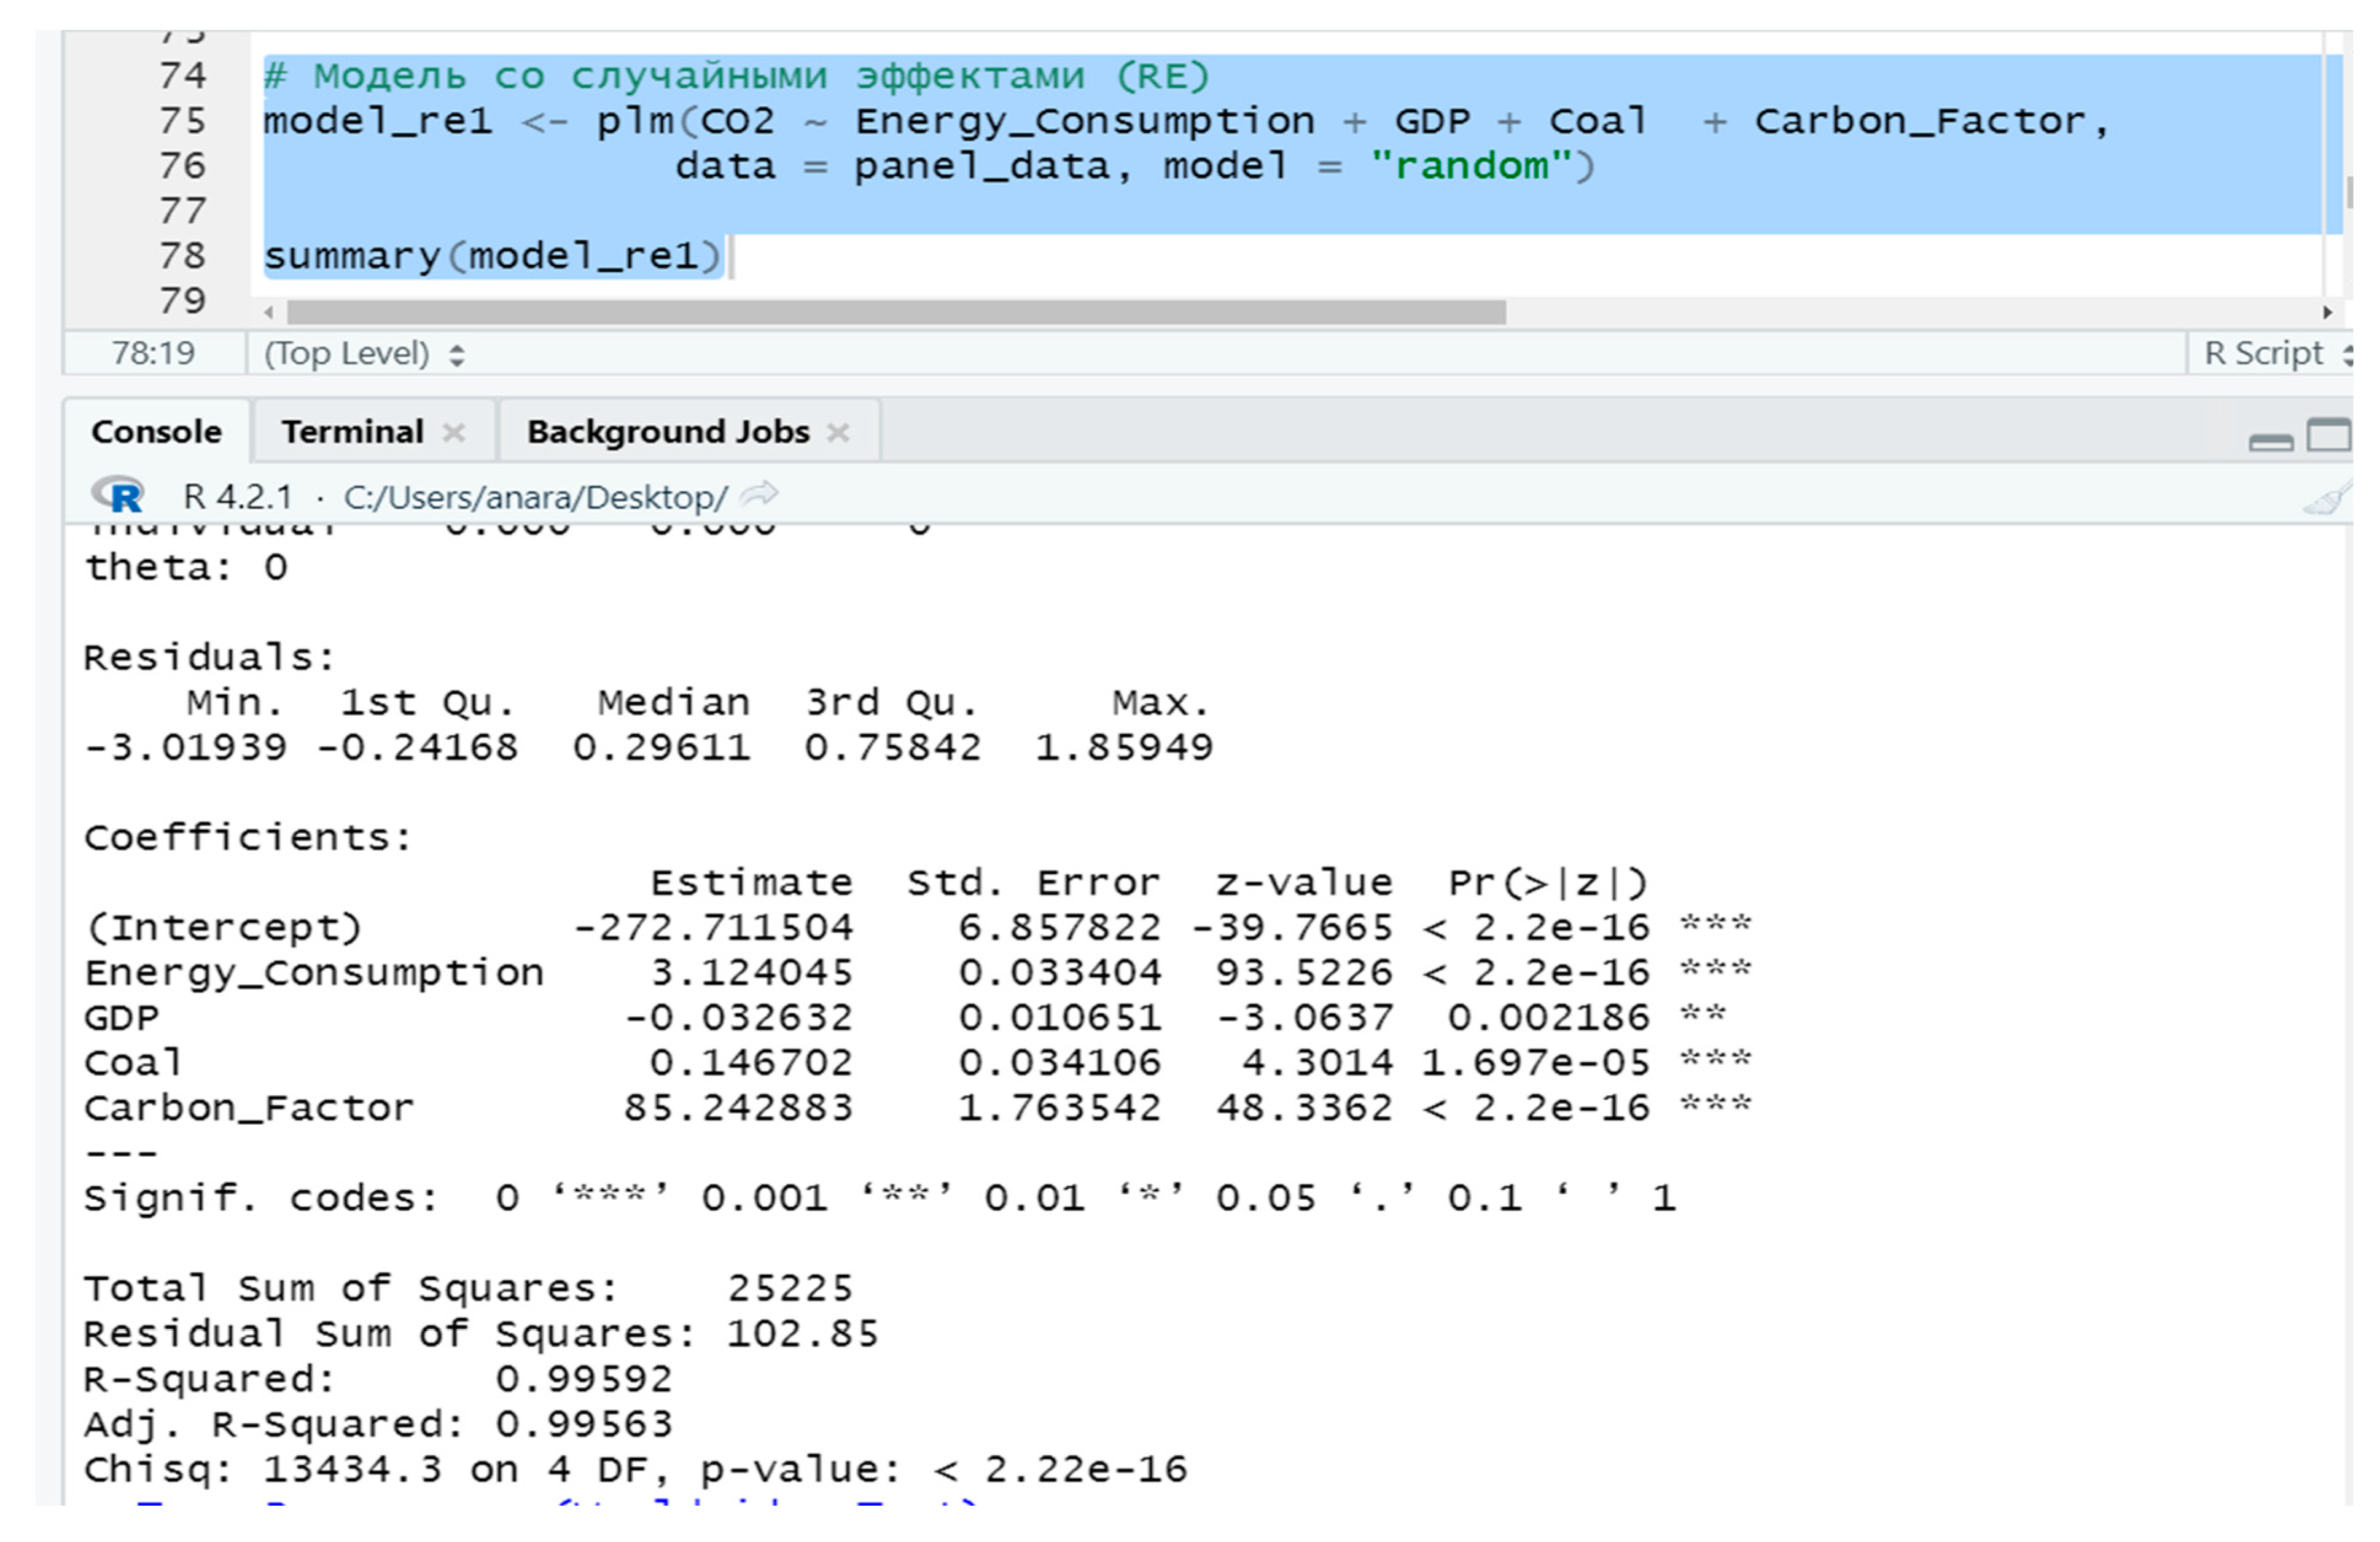
As we can see from the figure, model 2 improved the p-values of some variables. Although the random effects model (RE1) is better according to the Hausman test, we test the model for heteroscedasticity using the White Test changing the variance of errors.
The Result:
BP = 48.734, df = 9, p-value = 1.862e-07, as we can see p-value is less than 0.05. This means that the variances in the residuals are not constant, which can lead to inefficient estimates of standard errors and, accordingly, incorrect statistical inferences. We use robust standard errors that remove heteroscedasticity.
Refitting RE model with robust standard errors.
robust_se <- coeftest(model_re1, vcovHC(model_re1, type = “HC3”))
The model is now adjusted to account for heteroscedasticity (unstable error variance).
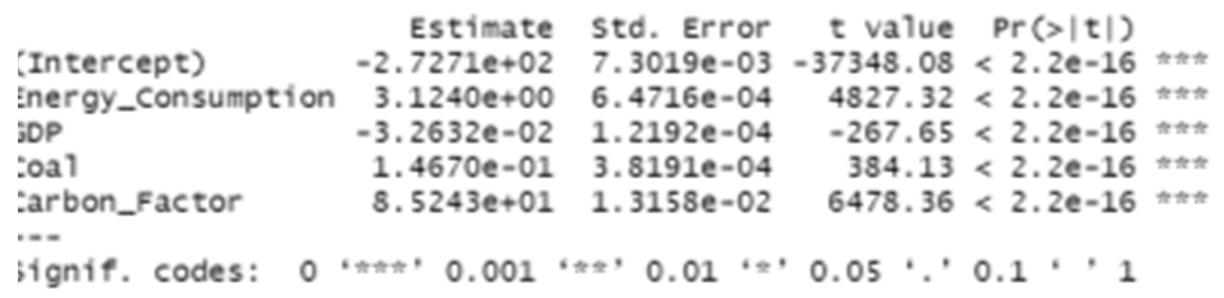
Analysis of the results of a random effects model with robust standard errors
All variables are statistically significant (p-value < 2.2e-16). Thus, a random effects model (RE-model) was constructed for the Central Asian countries (Kazakhstan, Kyrgyzstan, Uzbekistan, Turkmenistan, Tajikistan) for 2012–2023. This model was adjusted using robust standard errors. This eliminates the problem of instability of the error variance.
The use of a random effects (RE) model indicates that differences between countries are random and are modeled as part of the error term. The RE model allows for general trends to be taken into account and does not require the inclusion of a separate coefficient for each country. This model is particularly significant and relevant since the study is conducted on panel data from five countries with different levels of economic development and emissions levels. Individual differences between countries are random. Equation (1), Table 2 show how key factors influence the level of CO₂ emissions, taking into account differences between countries as random effects. In particular, Energy_Consumption (+3.124) means that an increase in energy consumption by 1 unit leads to an increase in CO₂ emissions by 3.124 units. The more energy a country uses, the higher its emissions. GDP (-0.0326) - economic growth reduces CO₂ emissions, which can be attributed to improved energy efficiency and the transition to cleaner technologies. Coal Consumption (+0.1467) - increased coal consumption leads to increased emissions. Carbon_Factor (+85.243) – indicates that the economy depends on “dirty” energy sources.
The RE model takes into account that countries have individual differences that may affect CO₂ emissions, but these differences are not systematic and do not correlate with the explanatory variables included in the model. In terms of the findings, this means that:
1) Each country has its own unique baseline level of CO₂ emissions, related to its characteristics (economic structure, natural resources, climate).
2) These differences are random and are treated as part of the random error rather than as fixed parameters.
3) The RE model assumes that there is no correlation between individual country effects and predictors (energy consumption, GDP, coal, etc.), which allows us to draw more general conclusions about the relationship between factors and CO₂ emissions for all countries in the region. The significance of this finding is important because the goal was to identify not so much specific differences between countries as general patterns and forecasting based on random variations in the data.
4) The RE model allows one to study in practice the influence of macroeconomic and energy factors on CO₂ emissions, take into account differences between countries and make forecasts. It is a valuable tool for developing effective sustainable development policies, regulating emissions and assessing the impact of economic decisions. The model can also be used to predict CO₂ emissions depending on future values of GDP, energy consumption and the carbon factor. This is applicable for the development of energy transition scenarios, in particular when switching to RES.
3.5. CO₂ Emissions Forecast for 2024-2030 by Country
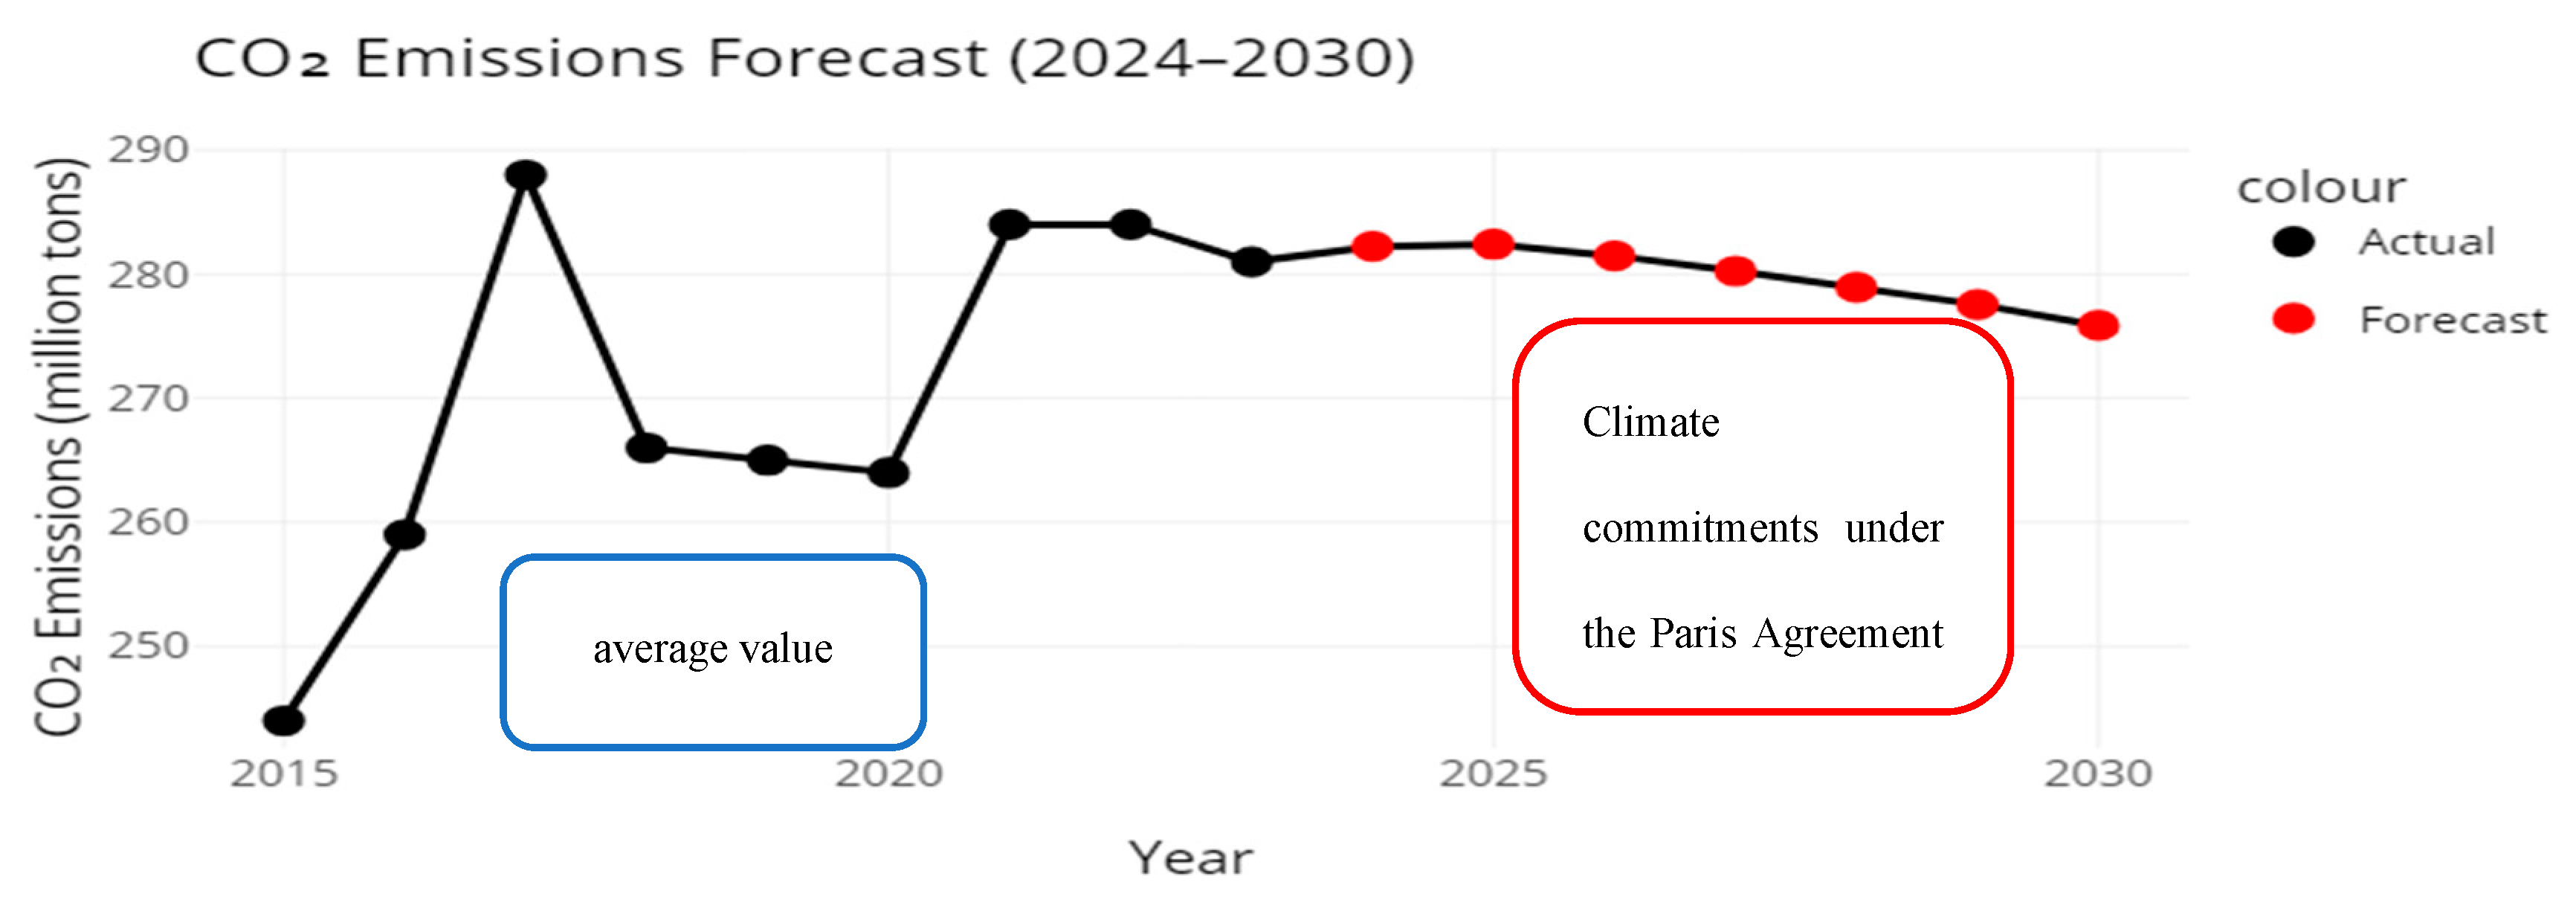
To forecast CO₂ emissions for six years ahead (2024-2030, including 2024 since there are currently no data for 2024), we use the calculated RE model (1). For the Kazakhstan’s forecast we use the following scenarios of changes in factors presented in Table 3
The presented scenario is realistic, as it reflects current trends and plans of the Central Asian countries: historical data on the dynamics of economic growth, the level of energy efficiency and international climate commitments within the framework of the signed Paris Agreement.
Let’s look at graph 17A, which will show a trend line with the forecast values marked, which will allow us to clearly represent the stabilization of CO₂ emissions in Kazakhstan. The forecast shows a slowdown in emissions growth, but the pace of the slowdown is modest, this further underlines the conclusion that current measures are not sufficient to quickly transition to a low-carbon economy. Let’s look at a screenshot of the model in the R program (Appendix D), which will show a trend line with marked forecast values, which will allow us to clearly represent the stabilization of CO₂ emissions.
Figure 17A shows the forecast of CO₂ emissions (2024-2030) in Kazakhstan. It is clear that emissions remain at approximately the same level, which is explained by the compensating effect of factors: the growth of energy consumption and economic development contributes to an increase in emissions, while the reduction in coal consumption and the reduction in the carbon intensity of the economy are not significant. As a result, the influence of these factors leads to the maintenance of the level of CO₂ emissions according to the forecast in the range of 281-282 million tons, which is higher than even the average level for the period 2012-2023 (275.87). The developed model suggests that, based on the current trends in Kazakhstan’s national economic development and the government’s goals for decarbonization, the country is unlikely to meet its commitments to reduce CO2 emissions. Because since by 2030 the model shows an expected level of 277.4 million tons instead of the stated 180-200 million tons. All this indicates that a more radical transition to clean energy sources and more ambitious measures to transition to a green economy will be required to significantly reduce emissions.
Figure 17.
A- CO2 emissions from fuel combustion forecast (2024-2030) in Kazakhstan. Note: constructed in R based on simulation data in Table 4.
Figure 17.
A- CO2 emissions from fuel combustion forecast (2024-2030) in Kazakhstan. Note: constructed in R based on simulation data in Table 4.
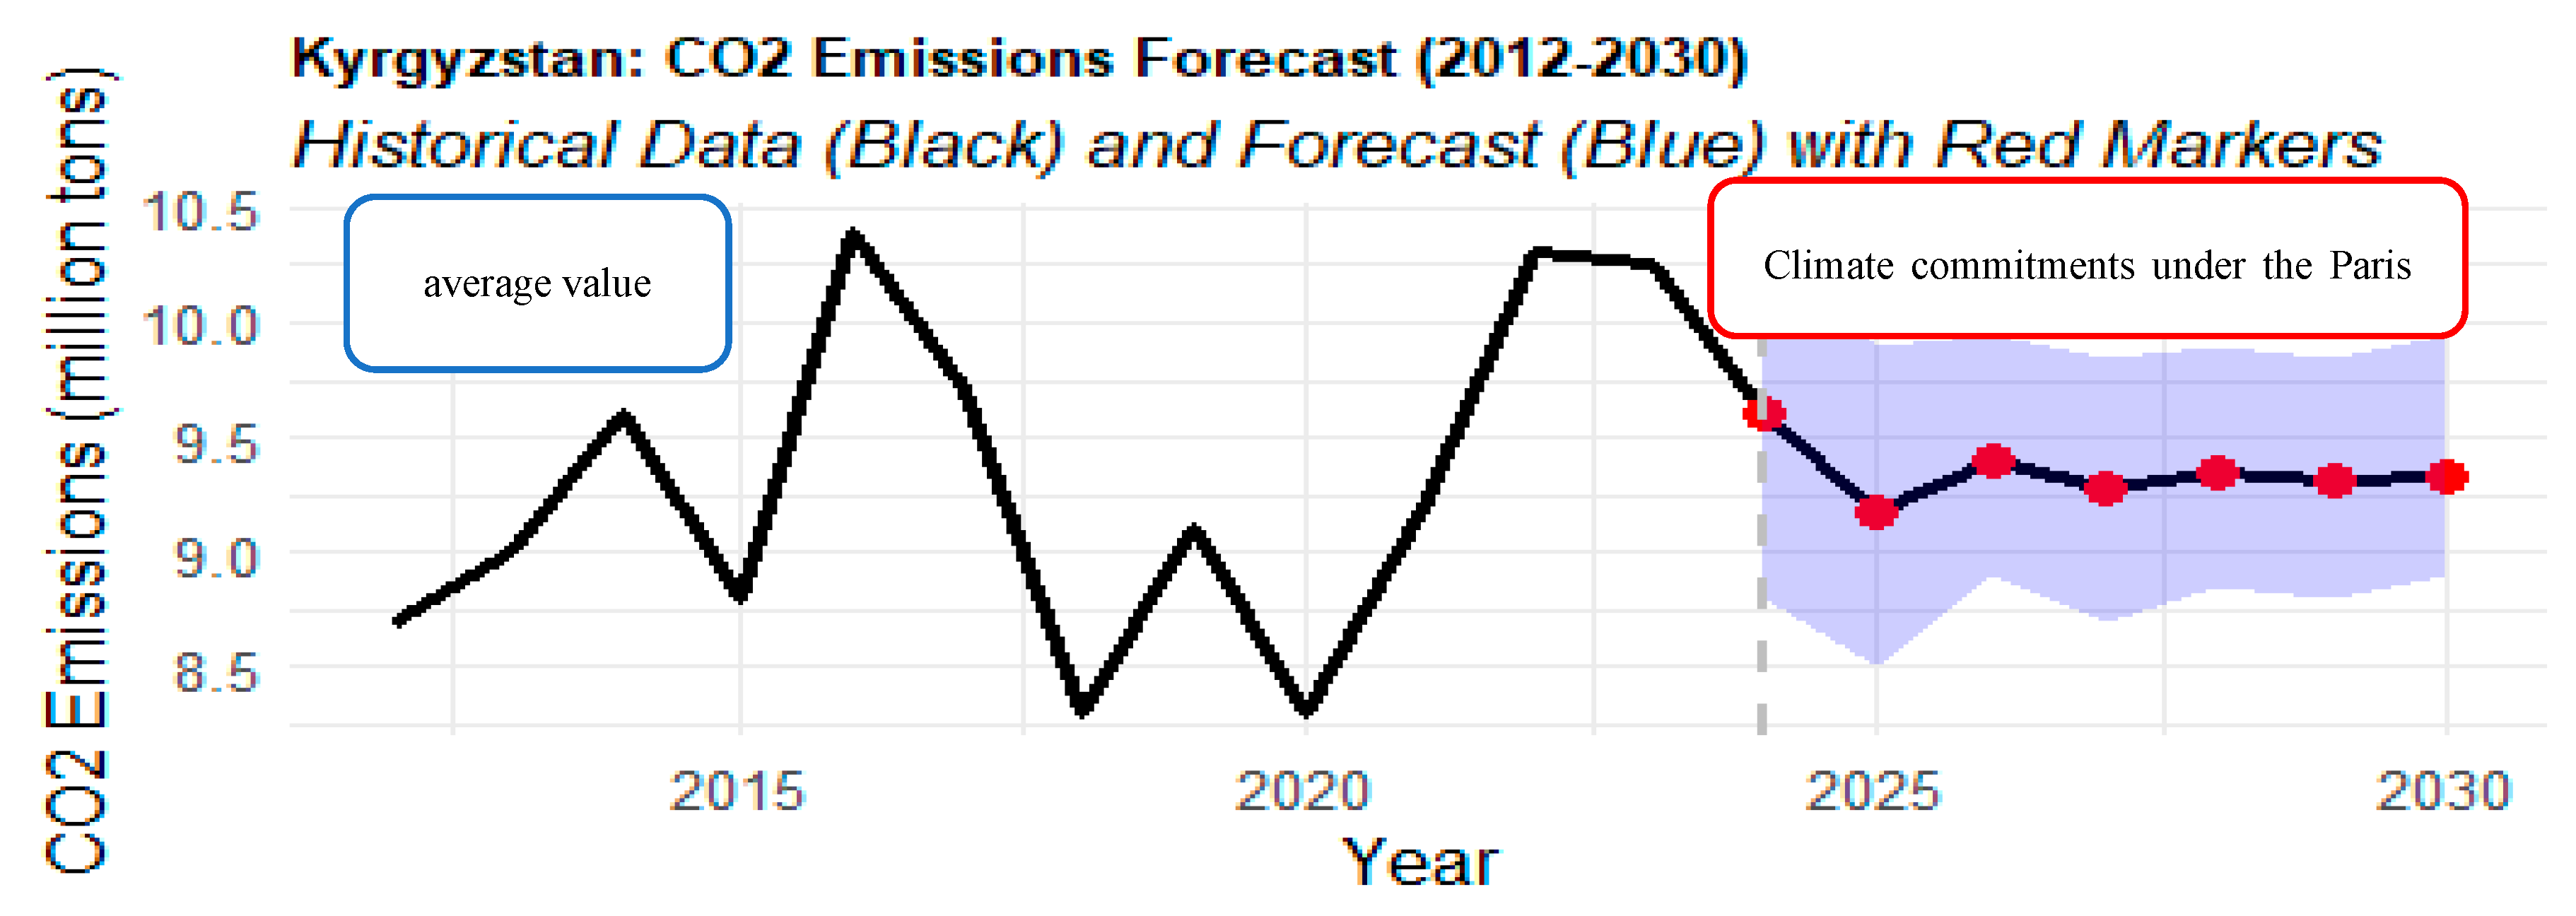
Kyrgyzstan’s forecast for the output indicator CO2 emissions from fuel combustion, million tons, was carried out using the ARIMAX model with the introduction of exogenous variables, which were taken into account in the panel data model, similar to all other countries (Appendix D). Figure 17B shows that the assessment of the impact of the factors studied indicates that the level of CO₂ emissions is projected to remain in the range of 9.3–9.5 million tons, which by about 2030 will be at the level of the average value for the period 2012–2023 (9.3).
Figure 17.
B - CO2 emissions from fuel combustion forecast (2024-2030) in Kyrgyzstan Note: built in R based on simulation data in Appendix D.
Figure 17.
B - CO2 emissions from fuel combustion forecast (2024-2030) in Kyrgyzstan Note: built in R based on simulation data in Appendix D.
The presented Uzbekistan’s projections (Figure 17C) show a gradual decrease of CO₂ emissions from 104.11 million tons in 2024 to 103.78 million tons in 2030. This is consistent with Uzbekistan’s ongoing efforts to transition to RES and modernize its energy infrastructure (https://www.enerdata.net/publications/daily-energy-news/uzbekistan-targets-27-gw-renewable-capacity-40-power-generation-2030.html). However, the data obtained indicate that Uzbekistan, as well as Kazakhstan and Kyrgyzstan, will not be able to achieve the declared environmental parameters by 2030.
Figure 17.
C - CO2 emissions from fuel combustion forecast (2024-2030) in Uzbekistan Note: built in R based on simulation data in Appendix D.
Figure 17.
C - CO2 emissions from fuel combustion forecast (2024-2030) in Uzbekistan Note: built in R based on simulation data in Appendix D.
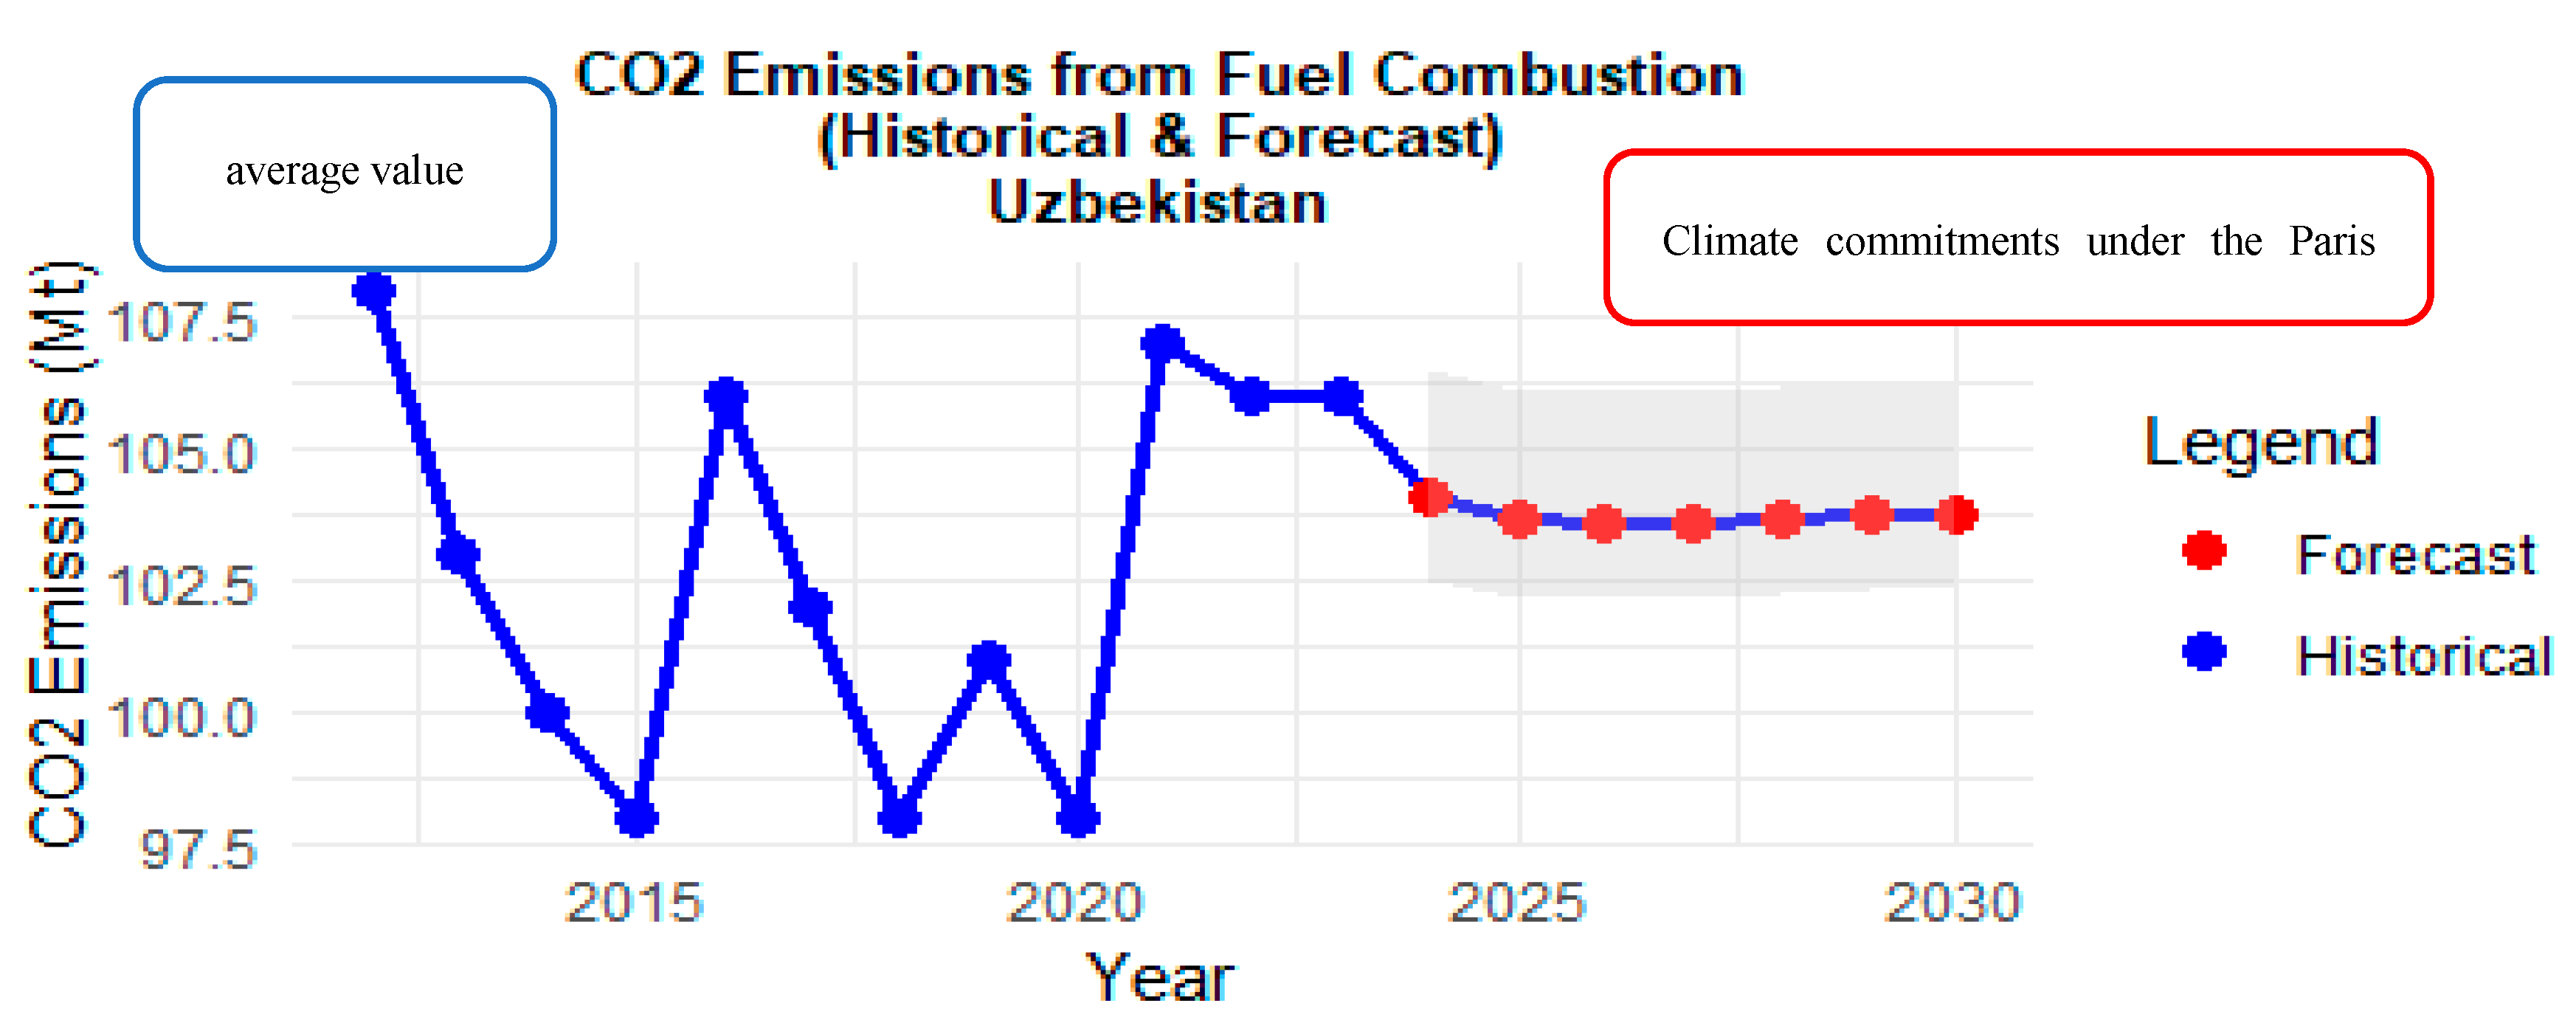
Figure 17D shows historical (blue) and projected (red) CO₂ emissions in Turkmenistan from 2012 to 2030. It can be seen that after 2023 the forecast shows a downward trend in emissions. This may be related to planned measures to reduce the carbon footprint, including the development of renewable energy sources.
Figure 17.
D- CO2 emissions from fuel combustion forecast in Turkmenistan Note: built in R based on simulation data in Appendix D.
Figure 17.
D- CO2 emissions from fuel combustion forecast in Turkmenistan Note: built in R based on simulation data in Appendix D.
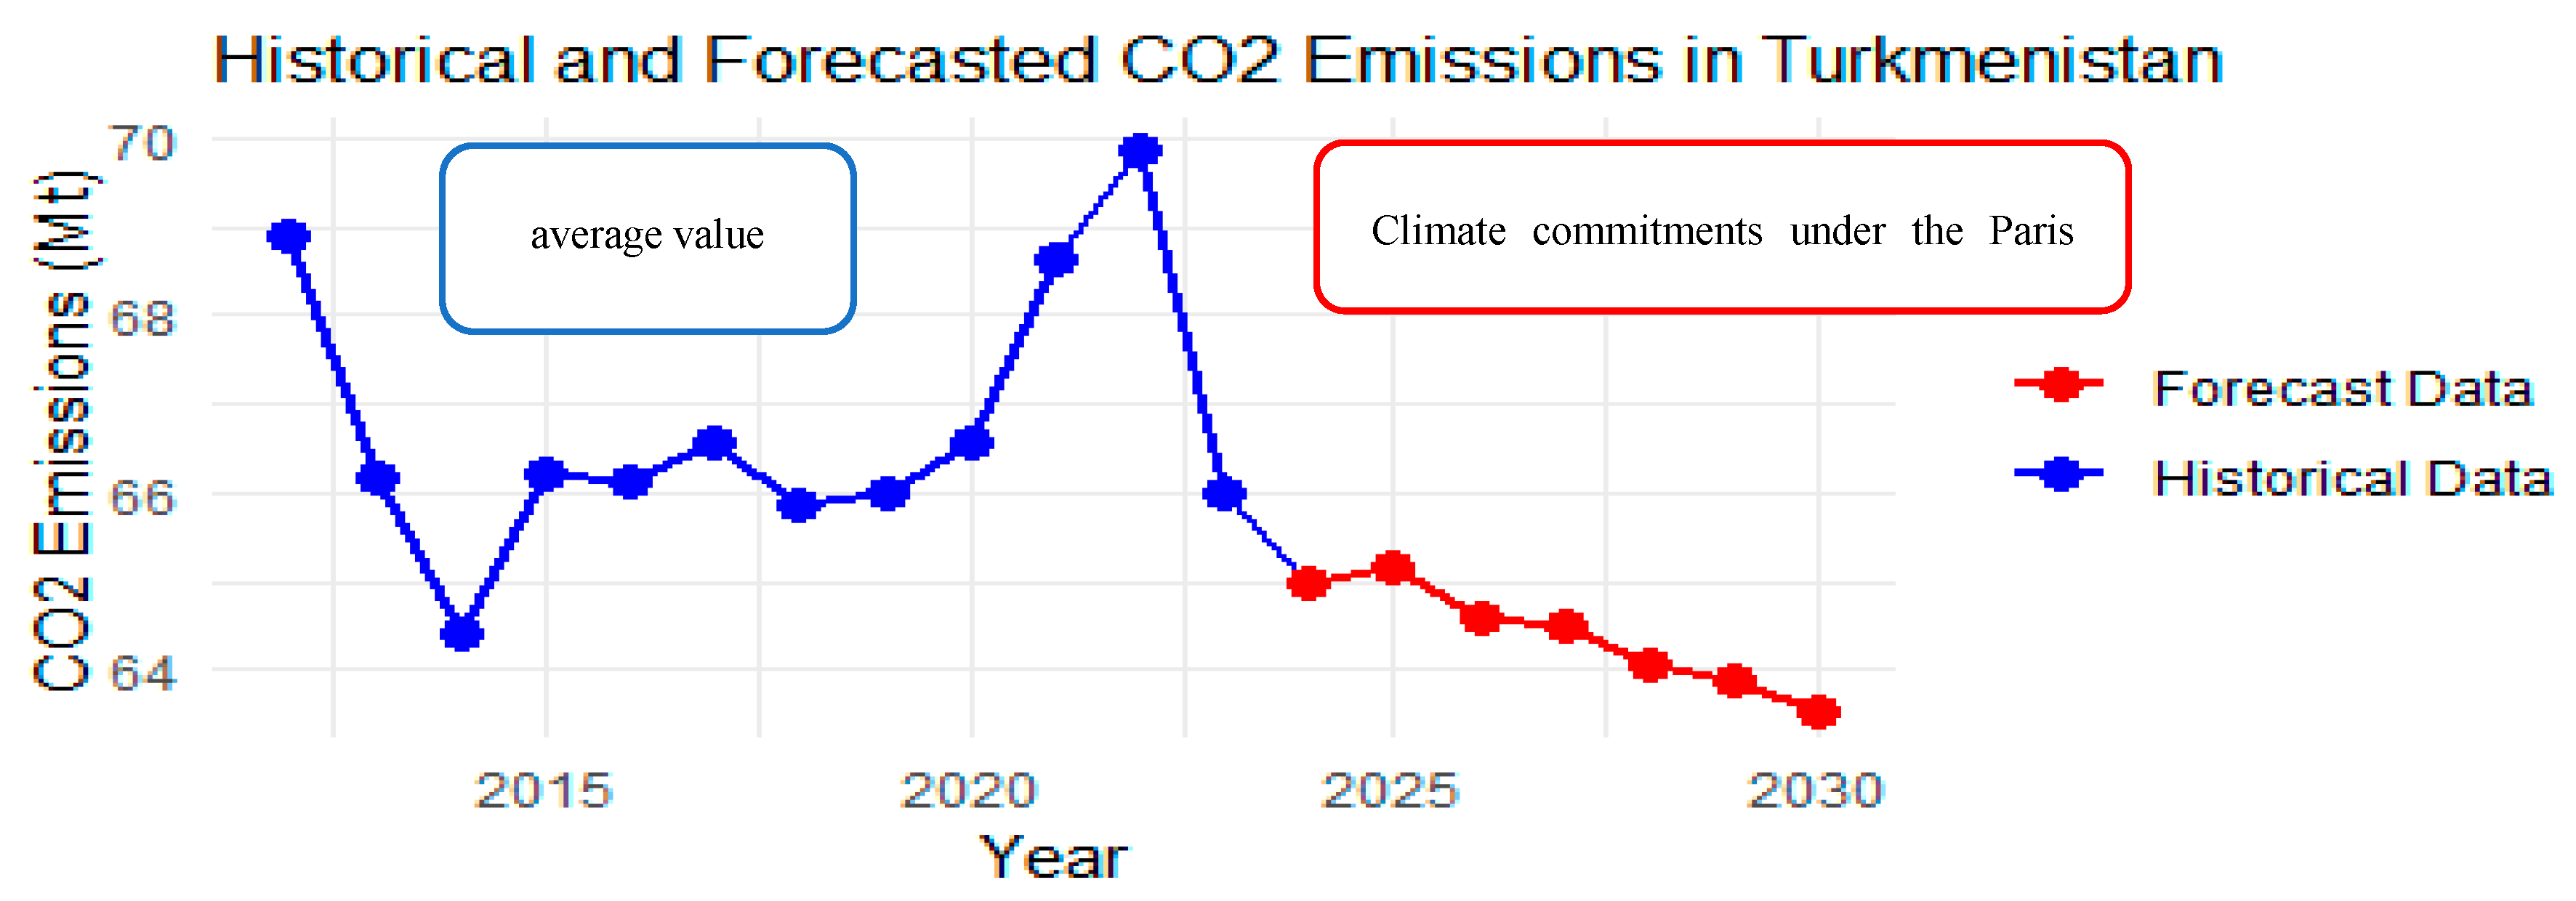
According to the data, Turkmenistan plans to reduce GHG emissions by 20% by 2030 compared to a business-as-usual scenario relative to 2010 emissions levels (https://climatepromise.undp.org/what-we-do/where-we-work/turkmenistan). However, predictive modeling data indicates that by 2030 Turkmenistan will be able to achieve emissions levels of 63.52 million tons.
According to the data presented, CO₂ emissions from fuel combustion in Tajikistan show an upward trend: from 9.04 million tons in 2019 to a projected 14.7 million tons in 2030 (Figure 17E). However, the long-term forecasts are influenced by many factors, including global economic conditions, domestic reforms and foreign economic relations Thus, although absolute CO₂ emissions in Tajikistan are growing, the country remains the leader in terms of low per capita emissions in the region. But, given the projected increase in emissions, it is important to continue to implement measures to reduce the carbon footprint and improve energy efficiency. It should be taken into account that long-term forecasts are influenced by many factors, including global economic conditions, domestic reforms and foreign economic relations.
Figure 17.
E - CO2 emissions from fuel combustion forecast in Tajikistan Note: built in R based on simulation data in Appendix D.
Figure 17.
E - CO2 emissions from fuel combustion forecast in Tajikistan Note: built in R based on simulation data in Appendix D.
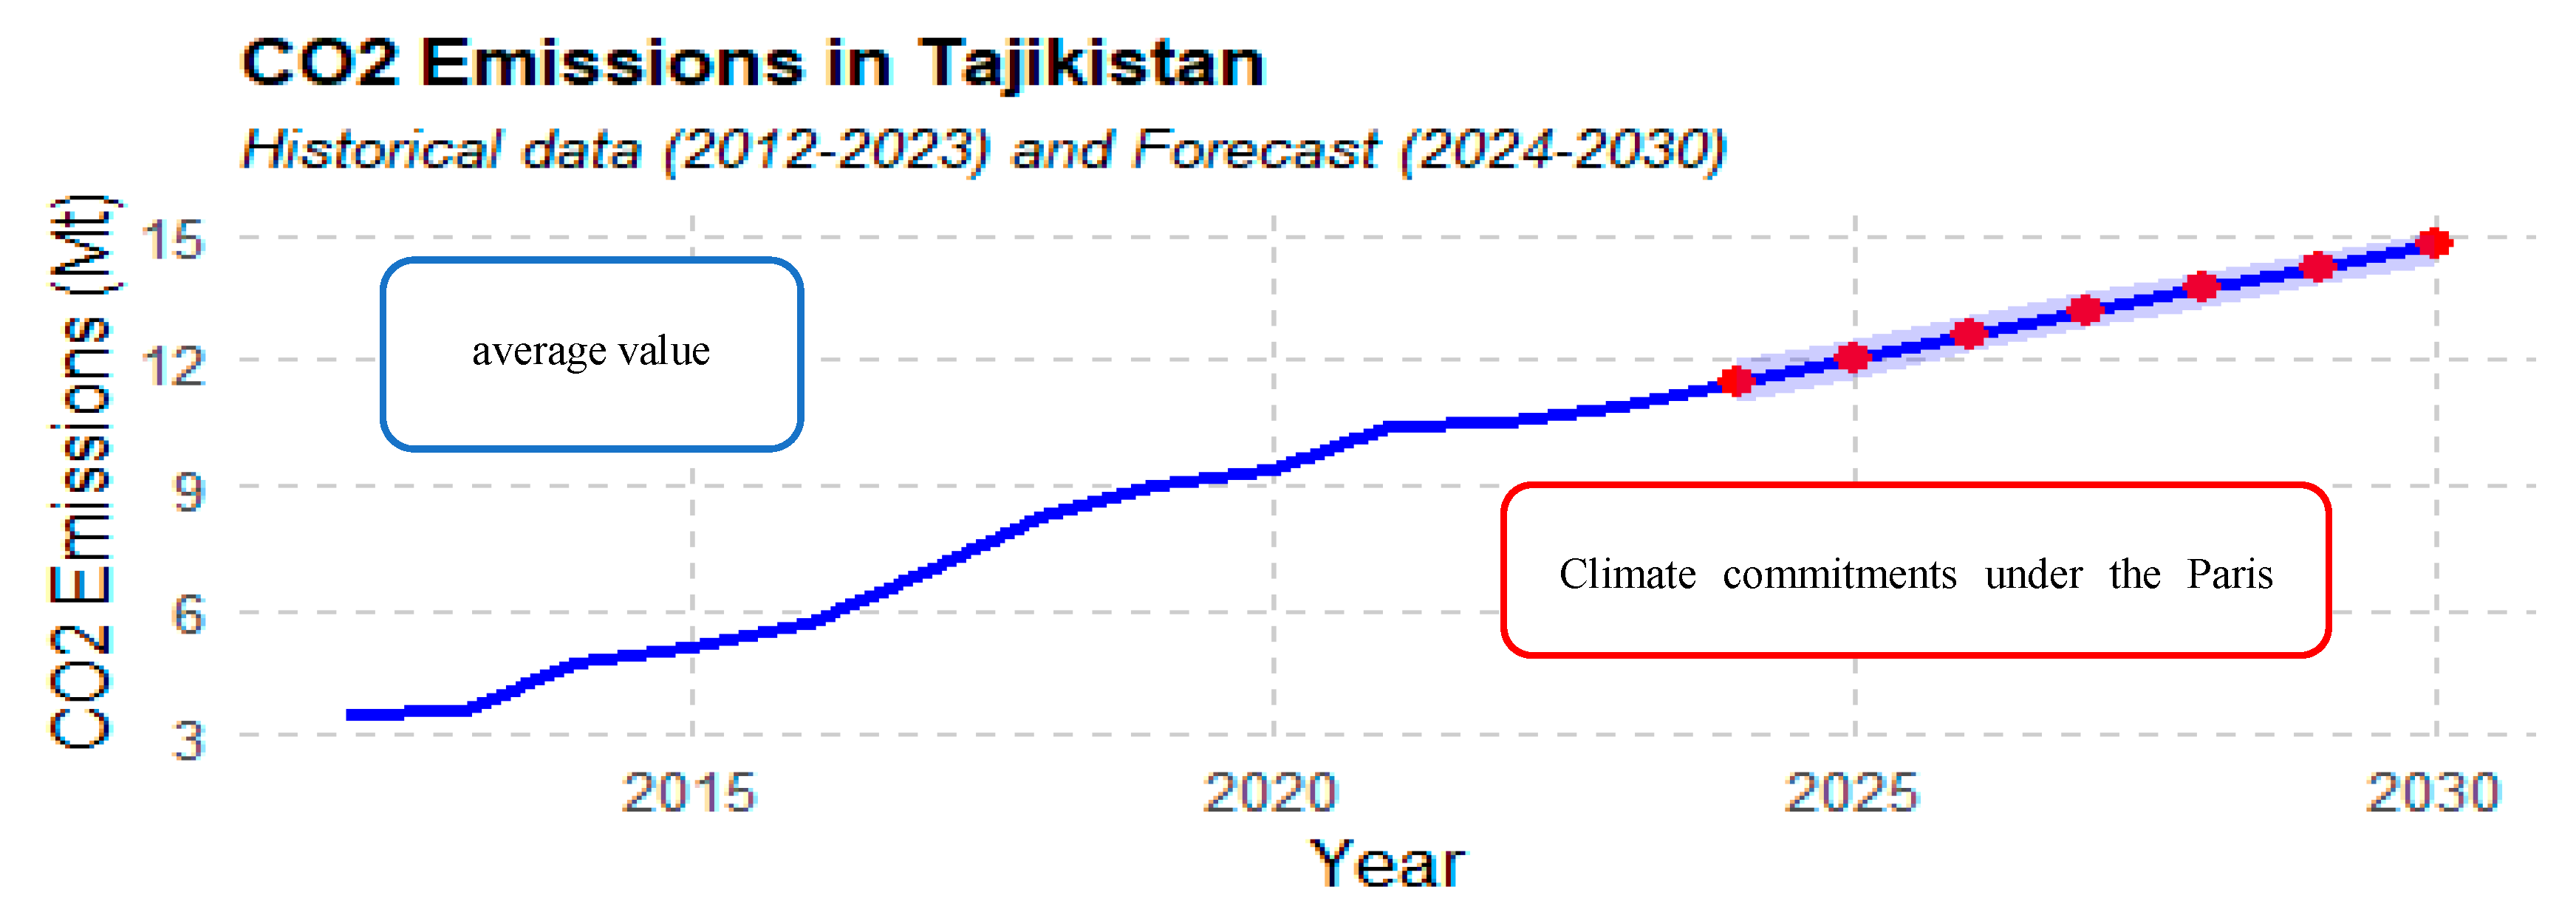
Nevertheless, as the conducted study shows, confirmed by the results of econometric modeling, the random effects model RE constructed taking into account historical data on CO2 emissions for all five Central Asian countries demonstrated the validity of the proposed hypothesis H1.The closeness of the relationship between dependent and independent variables and their influence proved that the energy intensity of the structure of national economies of Central Asian countries is the main factor in the high level of emissions into the atmosphere. The study found that countries’ stated climate commitments under the Paris Agreement will not be achieved by 2030. Some experts have already made similar assumptions about countries around the world in general [60]. However, the value of this study is that, by using various quantitative methods, it was econometrically proven that the measures currently being implemented by countries are insufficient. The transition to a low-carbon economy is possible with a comprehensive approach that includes: the development of RES, increased energy efficiency, tighter environmental standards and deeper regional cooperation.
3.5. Strategies in Central Asia for Implementing Measures to Reduce Air Pollution
Central Asia strategies to implement measures for air pollution reduction
Analysis of the data presented in the study confirmed the assumption that Central Asia is one of the most energy-intensive and resource-intensive regional economies in the world. Experts believe that by 2030, CACs will consume 34% more energy resources due to population growth [61]. In our view, if this resource-intensive economic model continues, the expected rapid population and economic growth will lead to a significant increase in atmospheric emissions and will exert significant strain on essential natural resources and ecosystems.
Addressing the issue of air pollution necessitates a comprehensive approach and collaborative efforts of government entities, private sector and public organizations. At present, there are relatively few policy instruments in the CACs to regulate atmosphere pollution. According to an analysis of air quality legislation in 194 countries of the world, (with CACs), Global Assessment of Air Pollution Legislation (GAAPL) found that 34% of countries lacked any legislatively established standards for atmospheric air quality [37]. The establishment and enforcement of rigorous environmental regulations harmonized with the best world practices at the regional level will enhance collaboration in environmental protection efforts [61].
In the view of IEA, there is a potential for reducing atmospheric pollution, through enhancement of regional integration in the energy system and the revitalization of the unified energy system of the CACs. It is possible to develop the unique hydropower resources of the region. Thus, the annual hydropower potential of Tajikistan is about 527 TWh, but only 23 TWh has been developed [62]. However, one should not think that countries in the region such as Kazakhstan, Uzbekistan, and Turkmenistan, given the lack of investment, will be able to switch to renewable energy sources so quickly. For example, for Kazakhstan, Uzbekistan, and partially (in winter) for Tajikistan and Kyrgyzstan, the most acceptable and feasible option in practice at this stage may be the transition to low-emission and cleaner coal technologies. This requires upgrading existing coal-fired power plants, boiler houses and industrial plants with filters for PM, SO2 and NOx that meet modern emission standards, and installing equipment for continuous monitoring and control of atmospheric emissions. Research has shown that many of the air pollution control measures adopted under China’s 2+26 program have achieved notable declines in GHG emissions (mainly CO2) within the existing energy structure. In addition, the “Action Plan for the Prevention and Control of Air Pollution” resulted in a reduction in SO2, NOx and PM2.5 emissions by 36%, 31% and 30% respectively [63,64]. Of course, simply increasing RES capacity is not enough to transition to a low-carbon energy system. This transition requires increased energy efficiency, which comes from investments in improved energy storage systems, carbon capture and sequestration systems, and smart energy distribution systems. [65,66].
The results of the analyses conducted and examination of reports of EDB, 2022;the UNECE, 2019; OECD, 2019; WMO, 2024, UNEP, 2021; along with data from the World Bank; TheGlobalEconomy.com; The U.S. Energy Information Administration.com and national reports of the CACs to the UNFCCC [17,20,23,27,29,31,33,34,36,37,38,39,40] as well as several additional sources that include environmental and economic indicators allow us to understand the connection between economic activity and the atmospheric emission levels [67,68,69,70,71,72,73,74,75]. A matrix was constructed in the context of sustainable development of the region, (Table5).
Table 5.
Central Asia strategies to implement measures for air pollution reduction.
| Factors/Conditions | Expected results | Risks | Sustainable Development Goals: Indicators |
| Population and economic growth | increase atmospheric emissions and place excessive pressure on key natural resources and ecosystems | drying up of the Aral Sea, water shortages, droughts, extreme heat, unstable precipitation patterns, dust storms | SDG3: Good Health and Well Being; SDG2: Zero Hunger; SDG 8: Decent Work and Economic Growth; SDG10: Reduced Inequality; SDG 11: Sustainable Cities and Communities SDG 13: Climate Action |
| Decarbonization of the economy | national low-carbon development strategies, strengthening regional cooperation mechanisms to identify measures for adaptation to climate change, priorities for the most effective allocation of investments, development of a joint environmental protection program for sustainable development in Central Asia. | Financial burden on the budget of countries; social risks associated with job losses, difficulties in adaptation and implementation of new technologies | SDG 7: Affordable and Clean Energy; SDG5: Gender Equality; SDG 8: Decent Work and Economic Growth; SDG9: Industry, Innovation and Infrastructure; SDG11: Sustainable Cities and Communities; SDG12: Responsible Consumption and Production; SDG 13: Climate Change Adaptation. |
| Formation of a green strategy | investments in low-carbon technologies, replacement of coal with gas fuel at thermal power plants, “green” projects, including RES, energy-efficient and resource-efficient technologies, modernization of the water and energy complex, land reclamation projects, combating desertification and reforestation, creating a modern transport and logistics system, “transition” to sustainable transport, efficient waste management | significant investment in sustainable technologies and infrastructure will be required; social, technological and political risks | SDG 7: Affordable and Clean Energy; SDG 8: Decent Work and Economic Growth; SDG 11: Sustainable Cities and Communities; SDG12: Responsible Consumption and Production; SDG 13: Climate Change SDG 15: Life on Land |
| Implementation of international air quality standards, control systems and the best available technologies | Use of NetZero, water and waste management, Air Quality Control System, implementation of Air Quality Standards, energy strategy for Sustainability | Rising energy costs | SDG 3: Good Health and Well Being; SDG 9: Industry, Innovation and Infrastructure; SDG11: Sustainable Cityes and Communities; SDG12: Responsible Consumption and Production; |
| Environmental Aspects Registers (EnvAR) electronic registers of environmental aspects | Documentation and Analysis; Automatic tracking: waste, emissions, spills, energy consumption; Documentation and Analysis; Regulatory Compliance, Support for Environmental Management System; Transparency and Accountability |
Additional costs | SDG3: Good Health and Well Being; SDG 8: Decent Work and Economic Growth; SDG11: Sustainable Cities and Communities; SDG12: Responsible Consumption and Production; SDG 13: Climate Change |
Recommendations for the Establishment on Effective Air Quality Management System
The presented matrix systematizes factors, conditions, and possible risks in the implementation of air pollution tasks focusing on the establishment on effective air quality management system in the context of regional development. The following measures can be proposed to reduce air pollution:
- Introducing United data metric
The creation of a unified air quality monitoring system will allow CACs to more effectively monitor the level of atmospheric pollution and promptly identify sources of pollution, which includes:
- Data standardization: development of common standards for collecting and analyzing air quality data, which will ensure comparability of data between countries. First of all, countries in the region need to move from declarative environmental regulation to strict, scientifically based standards governing emissions of CO₂, PM 2.5, SO₂ and other pollutants;
- Improved monitoring: the introduction of modern technologies for monitoring pollutants, which will allow for more accurate assessment of pollution levels and the adoption of measures to prevent them. This requires the creation of independent emission control agencies, the introduction of a mandatory air quality monitoring system based on modern technologies, including remote measurements and automated databases.
- The introduction of a digital reporting system and the integration of emission data into national and regional platforms will increase the transparency of environmental regulation and reduce corruption risks.
- 2.
- Changing the structure of national economies
Transition to less energy-intensive technologies and the introduction of RES are key steps to reduce air pollution, which include:
- Investment in RES: increasing the share of RES: hydropower, solar and wind energy, which will help reduce dependence on fossil fuels and reduce carbon emissions. Countries can work with international financial institutions, such as the World Bank and the Asian Development Bank, to obtain funding for RES projects. These organizations can offer both financial support and technical assistance. Also China’s involvement in solar and wind energy development could be an important factor in increasing the share of RES in the region. Kazakhstan and Uzbekistan have set goals to significantly increase the share of RES [24,25,39]. Other CACs may also develop national strategies to increase the share of RES;
- Adopting of Best Available Technologies: stimulating the transition to technologies that require less energy to produce and operate;
- It is necessary to modernize the existing coal infrastructure by introducing carbon capture, utilization and storage (CCUS) technologies;
- Development of legislative initiatives: adoption of laws and regulations aimed at supporting clean technologies and reducing air pollution from stationary emission sources. For example, it is necessary to create and implement legislation that supports the use of RES, including tax incentives for investors, subsidies for solar and wind installations, and guarantees for the purchase of electricity from RES.
3. Strengthening regional and international cooperation
Given the transboundary nature of air pollution, it is important to develop comprehensive cooperation on the following issues:
- Mitigation of the effects of climate change and adaptation to it. Key aspects include the development of highly accurate models for predicting climate risks and assessing the impact of emissions on the environment and public health.
- Combating desertification;
- Environmental protection in general, and in particular, protection of atmospheric air;
- Rational use of water and energy resources. Implementation of joint energy projects. The creation of joint projects, including RES projects between Central Asian countries can facilitate the exchange of experience and technologies. For example, joint research and development in the field of RES can lead to more efficient solutions adapted to local conditions;
- A combination of policy incentives and international cooperation is needed to significantly increase the share of RES in Central Asia. This includes the creation of a favorable legislative framework, targeted programs, and active interaction with international partners to attract investment and technology.
Regional integration should be considered as a necessary condition for achieving the SDGs of ensuring water, energy and food security in the CACs, as well as the successful resolution of regional environmental problems. The collective Statement issued by the leaders of Central Asia noted the importance of further strengthening regional cooperation on climate change mitigation and adaptation, combating desertification, efficient consumption of water and energy resources, provision of clean drinking water, environmental protection, conservation of biodiversity and glaciers, promotion of projects and programs in the specified areas [4,52]. However, as the analysis has shown, at present the main actions in the protection of atmospheric air are carried out to a greater extent at the national level with minimal regional integration. In terms of strengthening regional cooperation mechanisms, developing climate monitoring, information exchange and forecasting systems is essential.
To this end, it is necessary to increase the potential and capabilities for exchanging data on hydrometeorological indicators. To implement an effective system for managing the quality of atmospheric air in the region, it is necessary to create a current pollutant monitoring database employing GIS technologies that make it possible to predict the quality of atmospheric air taking into account the socio-economic development of the CACs. International cooperation is also essential to addressing air quality issues and can facilitate knowledge sharing, capacity building and technology transfer, allowing the region to benefit from global expertise and resources. This concerns, first of all, the protocol of the UNECE Convention on Long-Range Transboundary Air Pollution on the issue of financing the Joint Programme for Monitoring and Evaluation of the Spread of Atmospheric Pollutants.
Thus, the transition to a low-carbon economy in Central Asia is possible only if comprehensive measures are implemented, including strict environmental regulation, development of renewable energy sources, modernization of industry, transformation of transport infrastructure and strengthening of regional cooperation.
4. Discussion
In this work, an attempt was made to conduct a comprehensive analysis of both GHG and non-greenhouse emissions for the Central Asia region. The hypothesis formulated in the work that the energy-intensive structure of the national economies of the CACs determines the high level of air pollution in the region was fully confirmed during the study. At the same time, the opposite null hypothesis of the study was refuted. This study fills several important scientific gaps related to the analysis of pollutant emissions in CAs.
First, previous studies of emissions in the region have either focused on CO₂ emissions without taking into account PM and sulphur dioxide, or have looked at air quality without regard to economic structure. This study is the first to combine the analysis of CO₂, PM2.5 and SO₂ emissions, allowing us not only to assess the level of pollution but also to identify its key sources.
Secondly, there is no systematic study in the scientific literature examining the impact of economic structure on emissions in Central Asia. Previous studies have limited themselves to analyzing energy consumption, but have not linked it to industrial sectors, energy efficiency levels, or structural changes in the economy. This study is the first to assess the carbon intensity of GDP and energy intensity of economies in the region, providing insight into which sectors contribute most to pollution and what changes could reduce emissions.
The third research gap is the lack of comparative analysis of national emission reduction strategies in Central Asia. While international organizations publish countries’ projections and targets under the Paris Agreement, there has been no detailed assessment of the effectiveness of these strategies compared to actual emissions trends. This study is the first to compare national goals of Central Asian countries with actual trends and to analyze barriers to meeting these commitments.
The fourth aspect is to identify regional differences in air pollution. Most previous studies presented average data across countries, without taking into account territorial heterogeneity. This study shows that in industrialized regions (Kazakhstan, Uzbekistan) emissions continue to grow, while in countries with a high share of hydropower (Kyrgyzstan, Tajikistan) air pollution remains at relatively low levels. For the first time, a detailed analysis is being conducted of how geographic and climatic factors, including terrain features and air circulation, influence emissions dynamics in the region.
Furthermore, this study fills a gap in the area of applied recommendations for Central Asian countries. Most emission reduction proposals presented in international reports focus on developed economies or large developing countries such as China and India, and do not take into account regional specificities. Our study suggests tailored measures including upgrading coal power, promoting possible renewable energy and strengthening regional cooperation.
Thus, this study closes several scientific gaps at once:
- -
- the lack of a comprehensive analysis of CO₂, PM2.5 and SO₂ emissions in relation to the economic structure of the region
- -
- insufficient study of the impact of the sectoral structure of the economy on the level of emissions,
- -
- the lack of a comparative analysis of the effectiveness of national strategies to reduce pollution
- -
- regional differences in the level of air pollution.
In addition, it provides science-based recommendations for reducing emissions that take into account the economic and institutional realities of Central Asia.
Along with this, it should be emphasized that the key regional atmospheric pollution are emissions from energy, industry, transport, agriculture and waste. Unsustainable agricultural practices and food security issues, poor road infrastructure, high wear and tear of power lines, heating networks - 50.4%, water supply systems - 60.5%, sewer systems - 61.3%, minimal waste disposal (no more than 11.5%) lead to pollution of all components of the environment, and first of all, the atmosphere [10,11,17,23,76,77,78]. Based on the analysis of air pollution in Central Asia, the following can be noted:
- CACs are implementing measures to enhance air quality and decrease pollution. However, the imperfection of environmental taxation, limited financial resources, and the lack of effective systemic monitoring and control of air quality that meets modern international requirements and standards lead to the fact that there are no tangible changes in practice yet; the share of CO2 emissions from the combustion of fossil fuels per capita and per unit of GDP is one of the highest in the world. Assessing the impact of these factors will help identify additional opportunities to address the raised issues; however, the range of these questions falls within the realm of other scientific knowledge and requires detailed research. A quantitative assessment of the impact of these factors will allow us to identify additional opportunities for solving the problems raised, but the range of issues relates to the sphere of other scientific knowledge and requires detailed research.
- It has been established that there is no coordinated water and energy policy, transport and logistics system that would allow for the optimization of resource management, provision of regulation and implementation of strategic planning in the management of atmospheric air quality both within a single country and at the regional level. The study of these problems could resolve issues of interstate and country management and regulation aimed at the sustainable development of CACs.
- The key mechanisms for reducing atmospheric emissions are the transformation of the region’s economies in the context of regional development, interstate cooperation. It is need to significantly increase investments for the modernization of the water and energy complex based on low-carbon technologies and projects, including RES, combating desertification and forest restoration, the formation of sustainable transport and logistics system. It is important to harmonize regional legislation of the CACs with the best world practices in matters of air protection, to implement the environmental norms, standards, to create the modern information database of pollutants using GIS technologies. Regional integration should be considered as a necessary condition for achieving the SDGs. It guarantees the security of water, energy and food of CACs, as well as successfully solving common environmental problems, including air pollution.
- Further research into pollutant emissions and their impact on the environment in Central Asia could cover several key areas. An in-depth analysis of the spatio-temporal dynamics of CO₂, PM2.5 and SO₂ emissions is needed using high-precision modeling methods taking into account spatio-temporal changes and the influence of economic factors. It is important to develop models that assess the effectiveness of pollution reduction mechanisms such as carbon taxation and incentives for renewable energy sources. A promising area is forecasting the consequences of climate change on air quality and the regional economy. Research into the impact of pollution on human health and ecosystems is also needed to help develop evidence-based strategies for reducing emissions and promoting sustainable development in Central Asia.
5. Conclusions
1. The scientometric analysis of the study revealed that publication activity has increased several times since 2016, which is associated with the adoption of the SDGs (2015). At the same time, it has been established that since 2018, the focus of research has shifted from the processes of pollution itself to overcoming its consequences. Moreover, data on air pollution in Central Asia is quite limited and unsystematic. The information base is the main foundation for making management decisions in both political-social and undoubtedly economic directions. Achieving the SDGs for the sake of preserving our planet is impossible without adequate, timely, and systematic data on the state of various aspects related to the corresponding SDG indicators. There is a pressing need to establish unified mandatory markers for information on emissions and environmental pollution. The research conducted in the Central Asia region as part of this work revealed a significant lag in data both in terms of format and timing, content, and the approaches to their presentation.
2. The results obtained in this study confirm the hypothesis that the high level of emissions in Central Asian countries is a consequence of the prevailing raw material and energy-intensive economic model based on the extraction and consumption of fossil fuels. A comprehensive analysis of the dynamics of CO₂, PM2.5 and SO₂ emissions over the period 1990–2024 revealed that the most polluted regions remain countries with dominant coal and oil and gas industries, such as Kazakhstan, Uzbekistan and Turkmenistan, while Kyrgyzstan and Tajikistan, which rely on hydropower, show lower emissions. An examination of the trends in GHG and non-greenhouse emissions in the CACs have shown that the shares of greenhouse emissions from the combustion of organic fuels have not changed significantly over the past 30 years, ranging from 54% to 78%. The results obtained confirm the key role of the carbon intensity of GDP and the energy intensity of the economy in the formation of emissions, proving that a country’s economic model is a determining factor in its ecological footprint.
3.The analysis of the countries ‘economic structure has shown that for more than 30 years, it relies heavily on the extraction and export of natural resources, which is linked to high energy consumption and carbon emissions. Thus, the main part of commodity exports of Kazakhstan and Turkmenistan consists of fossil natural resources and products of their primary processing (73.6–81.4%), which characterizes a low level of commodity diversification, accompanied by high energy intensity. This demonstrates an export-dependent economy that is vulnerable to external shocks, further exacerbated by a financing deficit.
4. For the first time, a comprehensive comparative analysis of the spatial distribution of emissions was carried out and revealed significant territorial differences in pollution levels. It was found that the level of emissions in the region is not uniform and is determined not only by economic activity, but also by geographical and climatic factors. In large industrial centres, concentrations of pollutants reach critical levels, while in mountainous and sparsely populated areas the level of pollution remains low. These data indicate the need for a territorially differentiated approach to environmental policy, taking into account the characteristics of natural conditions and industrial development.
5. An important scientific contribution of the study is the critical assessment of national emission reduction strategies of CACs. The analysis showed that despite the declarative commitments under the Paris Agreement and nationally determined contributions (NDCs), their implementation remains insufficiently effective. The analysis showed that despite the declarative commitments under the Paris Agreement and NDCs, their implementation remains insufficiently effective. The main obstacles are the lack of strict emission regulation mechanisms, limited funding for climate programs, insufficient institutional support and weak interstate cooperation. Unlike leading global economies such as the EU, China and the USA, CACs have not yet implemented effective carbon regulation instruments, including emissions trading systems, carbon taxes and strict energy efficiency standards, leaving the region vulnerable to global climate challenges.
6. Econometric modeling was used to construct an integrated random effects model RE, expressing the dependence of CO2 emissions on the level of energy consumption, coal consumption, GDP and carbon intensity of national economies for all five CACs. The closeness of the relationship between dependent and independent variables and their influence proved that the energy intensity of the structure of national economies of CACs is the main factor in the high level of atmospheric emissions. The study found that countries’ stated climate commitments under the Paris Agreement will not be achieved by 2030. The value of this study is that, using various quantitative methods, it was econometrically proven that the measures currently being implemented by countries are insufficient.
7. The study not only achieved its goal – to comprehensively analyze the dynamics of atmospheric emissions, identify their key sources and assess possible ways of reduction – but also formed scientifically based recommendations focused on the realities of Central Asia. To effectively reduce emissions, the region needs a comprehensive strategy that includes a transition to a low-carbon economy, large-scale development of RES, industrial modernization, the introduction of carbon regulation and environmental taxation mechanisms, and strengthening regional cooperation in the field of climate policy. The recommendations developed during the study not only allow us to adapt advanced international practices to the conditions of Central Asia, but also form the basis for further scientific research aimed at finding the most effective tools for the environmental transformation of the region.
Author Contributions
Saken Kozhagulov: Conceptualization, formal analysis, writing—original draft preparation. Ainagul Adambekova: methodology, scientometric analysis of publications, formal analysis, econometric modeling and statistical analysis, writing—review and editing. Jose Carlos Quadrado: methodology, supervision. Vitali Salnikov: Conceptualization, project administration, validation. Aina Rysmagambetova: software. Ainur Tanybayeva.: data curation. All authors have read and agreed to the published version of the manuscript.
Funding
This research received no external funding.
Data Availability Statement
The data presented in this study are available on request from the corresponding author due to privacy restrictions.
Acknowledgments
We would like to thank the three anonymous reviewers for their constructive comments and suggestions, which significantly enhanced the quality of this paper.
Conflicts of Interest
The authors declare no competing interests.
Appendix A.
Appendix B. Supplementary Data
Supplementary data to this article can be found online.
Access link in Google Drive for access:
Appendix С
Figure A1.
emissions according to the RE1 model for Kazakhstan.
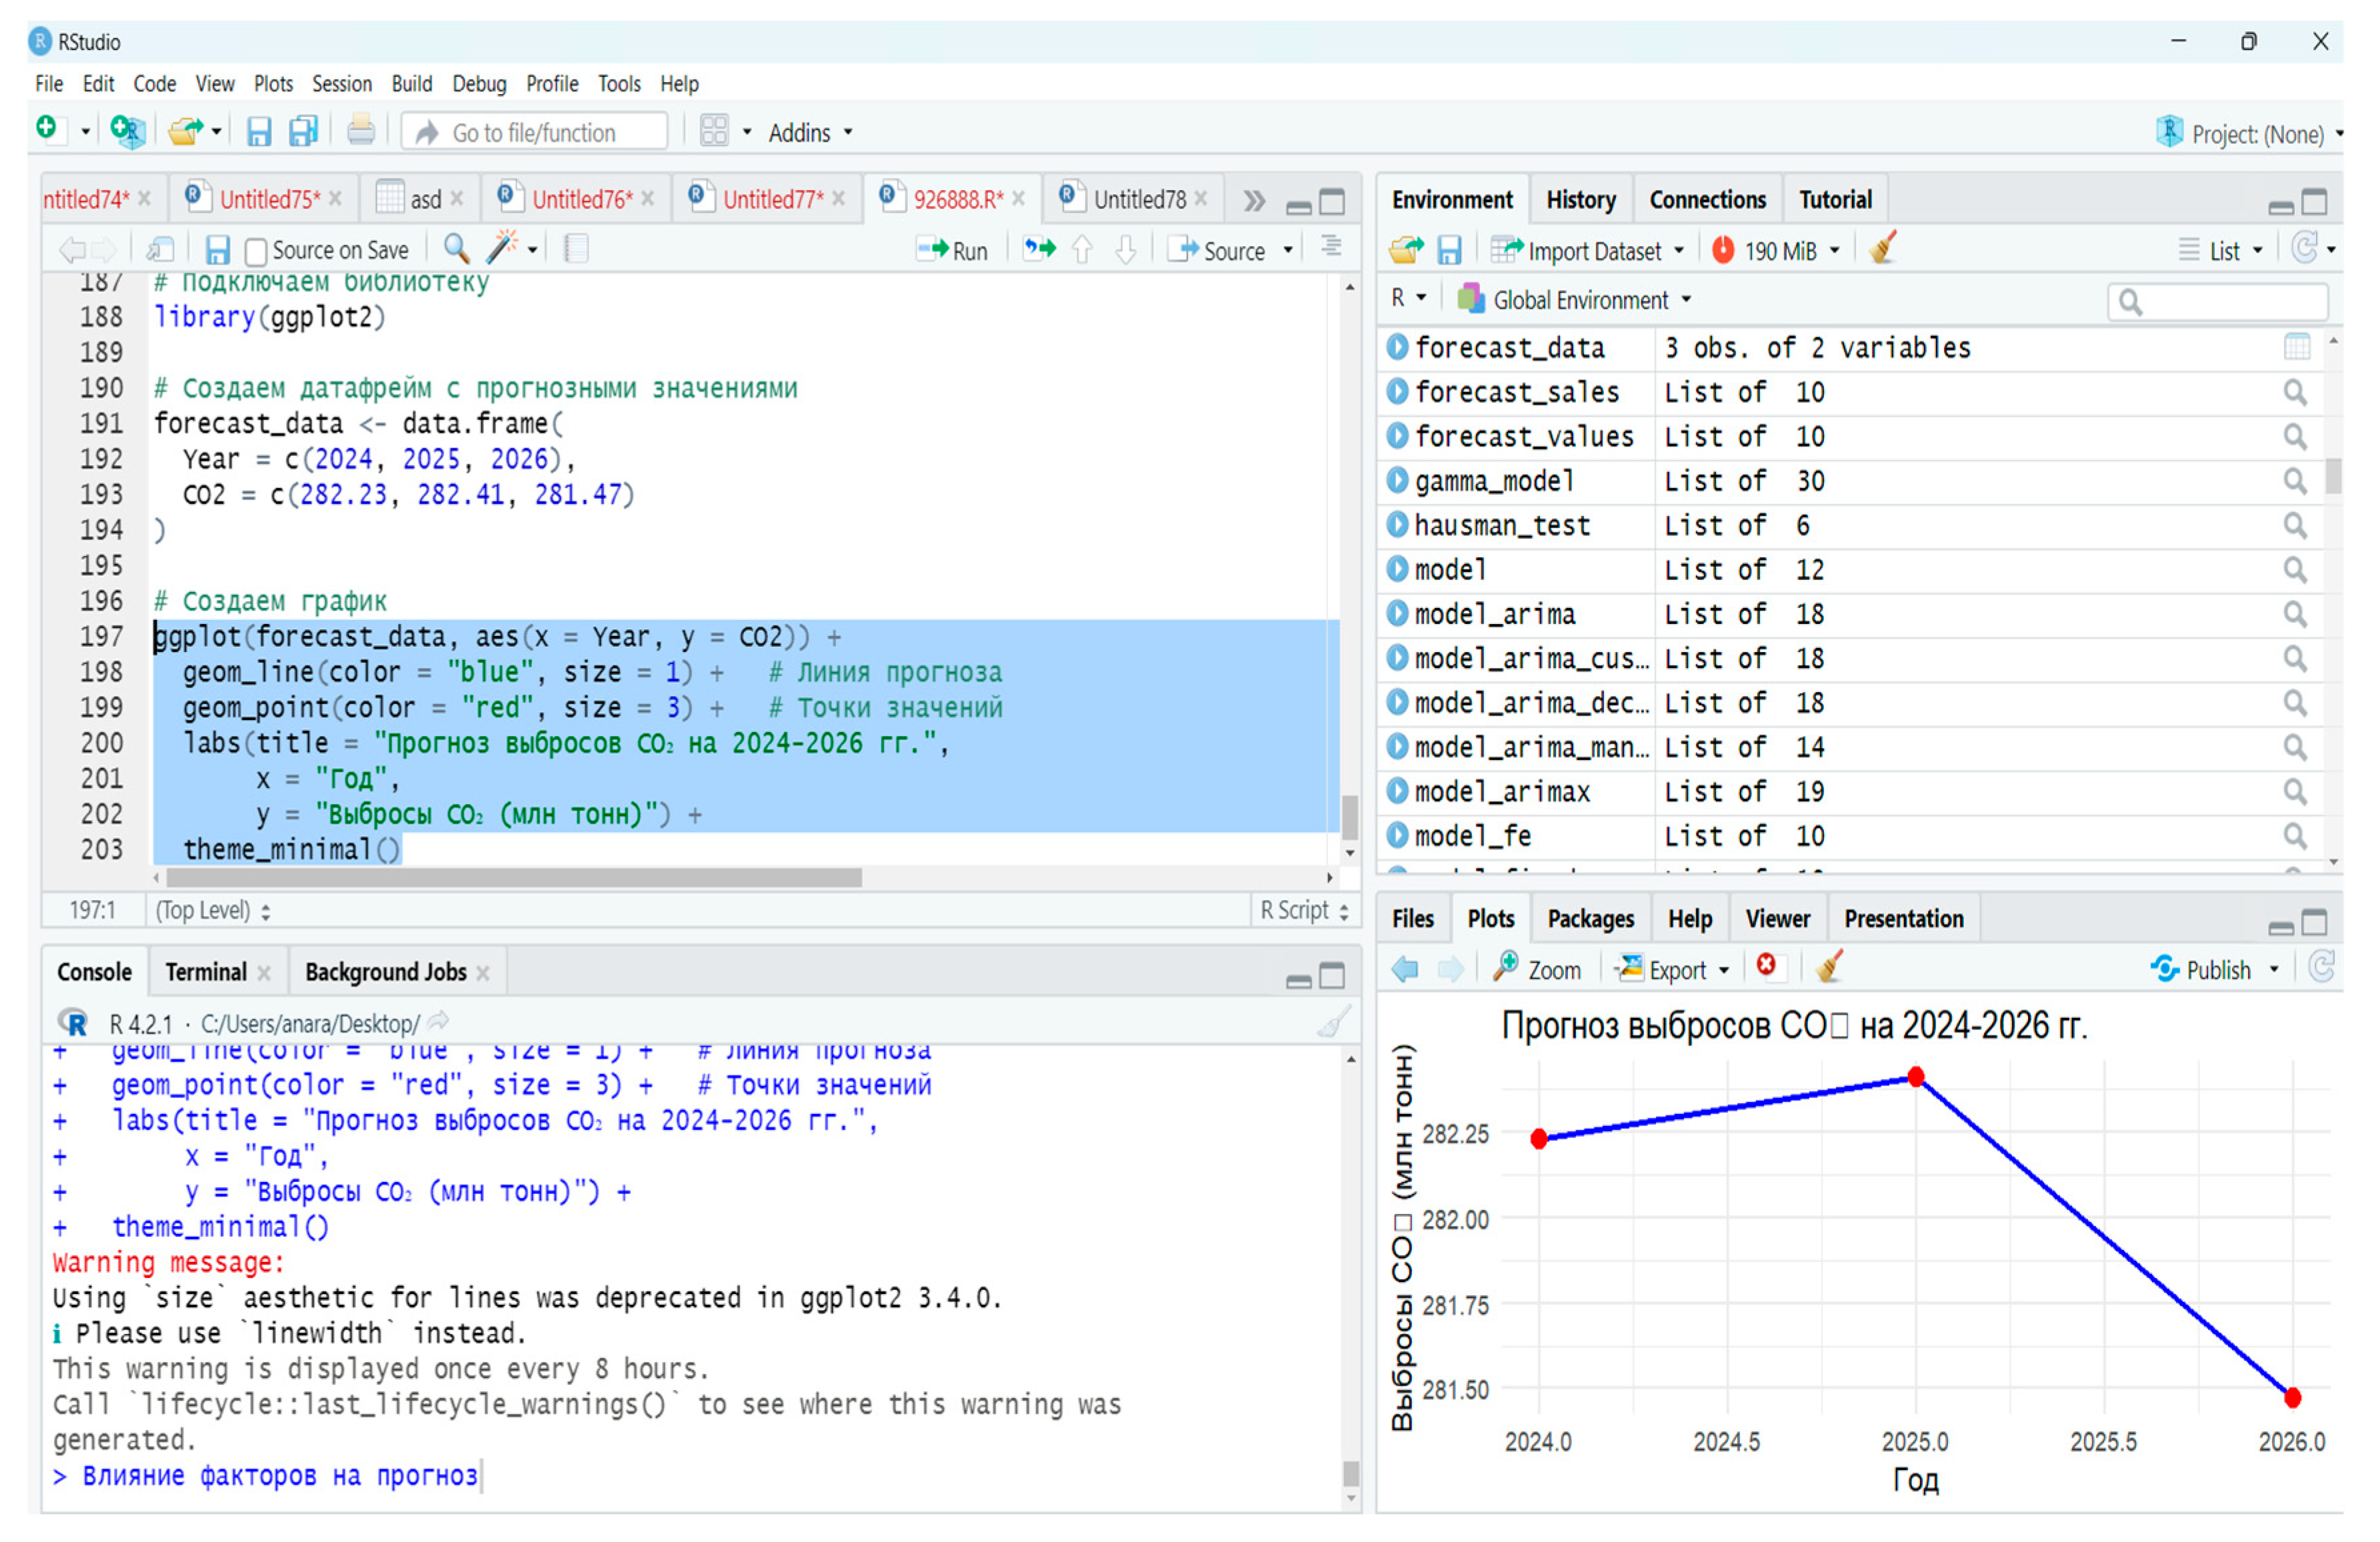
Appendix D
Table A1.
emissions according to the RE1 model for other CACs.
| periods | Prediction Kyrgyzstan | Prediction Uzbekistan | Prediction Turkmenistan | Prediction Tadjikistan |
| 2024 | 9.59675 | 104.114 | 64.9670 | 11.4958 |
| 2025 | 9.17165 | 103.640 | 65.1498 | 12.0735 |
| 2026 | 9.40098 | 103.560 | 64.5644 | 12.6359 |
| 2027 | 9.27727 | 103.588 | 64.4725 | 13.1826 |
| 2028 | 9.34401 | 103.647 | 64.0636 | 13.7135 |
| 2029 | 9.30800 | 103.715 | 63.8584 | 14.2287 |
| 2030 | 9.32742 | 103.785 | 63.5223 | 14.7282 |
References
- Asrar,G., Lucas,P.L., van Vuurenet, D.P., Pereira, L.,Vervoort,J., Bhargava,R. (2019). Chapter 19: Outlooks in GEO-6. UN Environment (Ed) In: Global environment outlook - GEO-6: Healthy Planet Healthy People. pp.463-469.Cambridge University Press: Cambridge,United Kingdom. ISBN 9781108707664. [CrossRef]
- Bobylev, S.N., Solovyeva, S.V., Astapkovich, M. (2022). Air quality as a priority issue for the new economy. The World of the New Economy,16(2),76-88. [CrossRef]
- Ahrens, J.& Hoen, H. W. (2013). Institutional Reform in Central Asia: Politico-economic Challenges. Routledge: London and New York, 285p. ISBN 978-0-415-60200-6.
- Tokaev,K.K.(2024).Renessans Tsentral’noy Azii: Na puti k ustojchivomu razvitiju i protsvetaniju. Central Asian [Renaissance: Towards Sustainable Development and Prosperity].https://www.zakon.kz/politika/6444287 (in Russian).
- Hejfets, B. A. &Chernova, V. Ju. (2024). Novyj vzglyad na strategiju economicheskoj integratsii Rossii so stranami Tsentral’noj Azii v sovremennyh geopoliticheckih realiyah mirovoj ekonomiki. [A new look at the strategy of economic integration of Russia with the countries of Central Asia in the modern geopolitical realities of the world economy]. Rossiya i sovremennyj mir.,1(122), 7-24. [CrossRef]
- Ziyadullaev,N.S. (2022).Geo-Economic Priorities of Region-Building in Central Asia. Russian Foreign Econ. J, 4, 86-102. [CrossRef]
- Adambekova, A. , Kozhagulov, S., Quadrado, J. C., Salnikov, V., Polyakova, S., Tazhibayeva, T., Ulman, A. (2024). Reduction of Atmosphere Pollution as Basis of a Regional Circular Economy: Evidence from Kazakhstan. [ Preprint]. Preprints org. [CrossRef]
- Sabyrbekov, R. , Overland, I., Vakulchuk, R(Eds). (2023).Introduction to Climate Change in Central Asia. In Climate Change in Central Asia: Decarbonization, Energy Transition and Climate Policy (pp. 1-11).Springer: Cham/ Switzerland. ISBN 978-3-031-29830-1. [CrossRef]
- Tursumbayeva, M. , Muratuly, A.,Baimatova, N., Karaca, F.,Kerimray, A. (2023).Cities of Central Asia: New Hotspots of Air Pollution in the World.Atmos. Environ, 309, 119901. [CrossRef]
- Bespalyy,S.,& Petrenko,A. (2024).Analysis of public transport in Central Asian cities in comparison with leading cities in Southeast Asia and Europe: the search for sustainable urban solutions. E3S Web of Conferences 535, 04011 -. [CrossRef]
- Assanov, D.; Kerimray, A.; Batkeyev, B.; Kapsalyamova, Z. (2021). The effects of COVID-19- related driving restrictions on air quality in an industrial city. Aerosol Air Qual. Res., 21 (9), 200663. [CrossRef]
- Amaratunga, D., Anzellini, V., Guadagno, L.;,Hagen, J. S,, Komac, B., Krausmann, E., ... & Wood, M. (2023). Regional Assessment Report on Disaster Risk Reduction2023: Europe and Central Asia. United Nations office for disaster risk reduction, Geneva, https://www.undrr.org/report/rar-2023-europe-and-central-asia.
- Lioubimtseva, E. , & Henebry, G. M. (2009). Climate and environmental change in arid Central Asia: Impacts, vulnerability, and adaptations. J. Arid Environ, 73(11), 963-977. [CrossRef]
- Salnikov, V., Turulina, G., Polyakova, S., Petrova, Y. & Skakova, A. (2015). Climate change in Kazakhstan during the past 70 years. Quaternary Int., 358, 77-82. [CrossRef]
- Li, J. , Chen, X., Kurban, A., Van de Voorde, T., De Maeyer, P., & Zhang, C. (2021). Coupled SSPs-RCPs scenarios to project the future dynamic variations of water-soil-carbon-biodiversity services in Central Asia. Ecol. Indic., 129, 107936. [CrossRef]
- Wang, X. , Chen, Y., Li, Z., Fang, G., Wang, F., & Liu, H. (2020).The impact of climate change and human activities on the Aral Sea Basin over the past 50 years. Atmos. Res., 245, 105125. [CrossRef]
- Eurasian Development Bank(2023). Vinokurov, E. Eurasian Development Bank(2023). Vinokurov, E.,Ahunbaev, A.,Usmanov, N.,Sarsembekov, T. Regulirovanie vodno-energeticheskogo kompleksa Tsentral’noj Azii [Regulation of the water energy complex of Central Asia]. Doklady i rabochie dokumenty.22/4.Almaty, Moscow: Eurasian Development Bank.https://eabr.org/analytics/special-reports/regulirovanie-vodno-energeticheskogo-kompleksa-tsentralnoy-azii.
- Reyer, C. P. , Otto, I. M., Adams, S., Albrecht, T., Baarsch, F., Cartsburg, M., Coumou, D., Eden, A., Ludi, E., Marcus, R., Mengel, M., Mosello, B., Robinson, A., Schleussner, C.F., Serdeczny, O., & Stagl, J. (2017). Climate change impacts in Central Asia and their implications for development. Reg. Environ. Change. [CrossRef]
- Tursunova, A. Tursunova, A., Medeu, A., Alimkulov, S., Saparova, A., & Baspakova, G. (2022).Water resources of Kazakhstan in conditions of uncertainty. J. Water Land Dev., 54, 138-149. [CrossRef]
- World Meteorological Organization.(2024). CLIMA, T., & Te, W.(Eds). State of the Climate in Asia2023. Geneva, Switzerland: World Meteorological Organization. ISBN 978-92-63-11350-4.
- Mehta, K. , Ehrenwirth, M., Trinkl, C., Zörner, W., & Greenough, R. (2021). The energy situation in Central Asia: A comprehensive energy review focusing on rural areas. Energies. [CrossRef]
- Friedlingstein, P., O’Sullivan,M., Jones, M.W.,Andrew, R.M.,Gregor, L., Hauck, J., Le Quéré, C., Luijkx, et al. (2022).Global Carbon Budget 2022. Earth Syst. Sci. Data, 14 (11),4811-4900. 11). [CrossRef]
- Organization for Economic Cooperation and Development.(2019). Sustainable Infrastructure for Low-Carbon Development in Central Asia and the Caucasus: Hotspot Analysis and Needs Assessment, Green Finance and Investment. OECD Publishing. ISBN 978-92-64-64520-2. [CrossRef]
- Adilet.zan.kz. (2023). The Strategy on Achieving Carbon Neutrality by 2060. https://adilet.zan.kz/rus/docs/U2300000121 (accessed 20.01. 2025).
- Adilet.zan.kz. (2013). Concept on Transition towards Green Economy by2050.URL https://www.greenkaz.org/ images/for_news/pdf/npa/koncepciya-po- perehodu.pdf (accessed 20. 01.2025).
- Beisenova, R. , Kuanyshevich, B. Z., Turlybekova, G., Yelikbayev, B., Kakabayev, A. A., Shamshedenova, S. & Nugmanov, A. (2023). Assessment of Atmospheric Air Quality in the Region of Central Kazakhstan and Astana. Atmosphere. [CrossRef]
- Gingras,Y.(2016). Bibliometrics and Research Evaluation: Uses and Abuses. The MIT Press. ISBN electronic:9780262337656. [CrossRef]
- World Bank.(n.d.).TheGlobalEconomy.com: Global economy, world economy. https://www.theglobaleconomy.com.
- United Nations Environmental Programme.(2021). Regulating Air Quality: The First Global Assessment of Air Pollution Legislation. UNEP. Publishing Services Section. UNON. ISBN: 978-92-807-3872-8 https://www.unep.org.
- United Nations Economic Commission for Europe. (n.d.). Data Portal https://w3.unece.org/SDG/ru/Indicator?id=28.
- United Nations Economic Commission for Europe. (2019). A1–Vybrosy zagryaznyayushih veshestv v atmosphernyj vozduh. UNECE, 16aya Sessiya Sovmestnoj Tselevoj gruppy po ekologicheskim pokazatelyam i ststistike, Geneva, 28-29 oktyabrya 2019 [16th Session of the Joint Task Force on Environmental Indicators and Statistics]. UNECE. Geneva, 28-29 October 2019. https://unece.org/fileadmin/DAM/stats/documents/ece/ces/ge.33/2019/mtg4/5_3_RU_Ind_A1_A2_Air.pdf.
- Enerdata. (2024).World Energy&Climate Statictics-Yearbook2024. https://yearbook.enerdata.net/.
- World Bank Group. (n.d.). World Bank Data.World Bank.https://data.worldbank.org.
- US.Energy Information Administration.(n.d.).The Global Econony.The Gobal Economy.https://www.theglobaleconomy.com.
- Bureau of National Statistics of the Republic of Kazakhstan. (2025).https://stat.gov.kz/ (accessed 20.01.2025).
- United Nations Development Programme.(2022).The 8th National Communication and the 5th Biennial Report of the Republic of Kazakhstan to the UN Framework Convention on Climate Change https://www.undp.org/kazakhstan/publications/8th-national-communication-and-5th-biennial-report-republic-kazakhstan-un-framework-convention-climate-change.
- United Nations Framework Convention on Climate Change.(2017).The 3rd National Communication of the Kyrgyz Republic under the UN Framework Convention on Climate Change. https://unfccc.int/sites/default/files/resource/NC3_Kyrgyzstan_English_24Jan2017.pdf.
- United Nations Framework Convention on Climate Change.(2022). The 4th National Communication of the Republic of Tajikistan to the UN Framework Convention on Climate Change. https://unfccc.int/sites/default/files/resource/4NC_TJK_ru_0.pdf.
- United Nations Framework Convention on Climate Change.(2016).The 3rd National Communication of the Republic of Uzbekistan under the UN Framework Convention on Climate Change. https://unfccc.int/sites/default/files/resource/TNC_Uzbekistan_under_UNFCCC_rus.pdf.
- Ministry of Foring Affairs of Turkmenistan.(2019).National Strategy Turkmenistan on Climate Change, 2019. https://www.mfa.gov.tm/index.php/en/news/1615.
- Intergovernmental Panel on Climate Change. (2006). 2006 IPCC Guidelines for National Greenhouse Gas Inventories.Chapter 1, Part 1. Introduction to the Guidelines.p.16.https://www.ipcc-nggip.iges.or.jp/public/2006gl/.
- Intergovernmental Panel on Climate Change.(2006). 2006 IPCC Guidelines for National Greenhouse Gas Inventories. Chapter 4 LULUCF Agriculture, forestry and other land use. p.101. https://www.ipcc-nggip.iges.or.jp/public/2006gl/(in Russian).
- Mazilov,S.I., Rajkova,S.V., Gusev,Ju.S., Pozdnyakova,M.V., Komleva,N.E., Miktrov,A.N. (2023). Vliyanie polljutantov atmosphernogo vozduha na zdorov’e naseleniya: naukometrichesrij analiz zarubehznyh angloyazychnyh publikatsij 2017-2022 gg. [The influence of atmospheric air pollutants on the health of the population: scientometric analysis of foreign English-language publications from 2017-2022]. Meditsina truda I ecologiya cheloveka. 4,63-81. [CrossRef]
- Han, Q., Luo, G., Li, C., Shakir, A., Wu, M. & Saidov, A. (2016). Simulated grazing effects on carbon emission in Central Asia. Agric. For. Meteorol., 216, 203-214. [CrossRef]
- Almeida, S. M. , Manousakas, M., Diapouli, E., Kertesz, Z., Samek, L., Hristova, E., ... & IAEA European Region Study GROUP.(2020). Ambient particulate matter source apportionment using receptor modelling in European and Central Asia urban areas. Environ. Pollution, 266, 115199. [CrossRef]
- Asian Development Bank Institute.(2014). Connecting Central Asia with Economic Centers. (124pp.) Asian Development Bank Institute. Tokyo, Japan..ISBN 978-4-89974-050-8 (PDF).
- Ness, J. E., Garvin Heath, & Ravi,V. (2022). An Overview of Policies Influencing Air Pollution from the Electricity Sector in Central Asia. (NREL/TP-7A40-81861).National Renewable Energy Laboratory.. https://www.nrel.gov/docs/fy23osti/81861.pdf.
- Min, J. ,Yan, G., Abed, A. M., Elattar, S., Khadimallah, M. A., Jan, A., & Ali, H. E.(2022). The effect of carbon dioxide emissions on the building energy efficiency. Fuel. [CrossRef]
- Huang, L., Krigsvoll, G., Johansen, F., Liu, Y., & Zhang, X. Carbon emission of global construction sector.(2018) Renew. sustain. energy rev., 81, 1906-1916. [CrossRef]
- United Nations Economic Commission for Europe.(2021). Ekologicheskie pokazateli i osnovannye na nih otsenochnye dokladyVostochnaya Evropa,Kavkaz i Tsentral’naya Aziya. [Environmental indicators and assessment reports based on them Eastern Europe, Caucasus and Central Asia]. (ECE/CEP/140). UN.ISBN978-92-1-416026-7.https://unece.org/sites/default/files/2021-12/ECE-CEP-140.
- Isiksal, A.Z. (2023).The role of natural resources in financial expansion: evidence from Central Asia. Financ Innov., 9. [CrossRef]
- Deutsche Gesellschaft für Internationale Zusammenarbeit (GIZ) GmbH. (2023).Regional’naya strategiya po adaptatsii k izmeneniju klimata v Tsentral’noj Azii. [Regional Strategy for Adaptation to Climate Change in Central Asia]. (p.25). https://greencentralasia.org/wp-content/uploads/2024/04/Strategy_rus-2.pdf. (in Russin).
- Esekina, А. S.,TokpaevZ.R., Cherednichenko, A. V., Kasenov, A. A., Ermahanova, E.M., Kasenova, D. A., ... & Shorman, A. T.(2023). Analiz dinamiki natsional’nyh vybrosov i pogloshenij parnikovyh gazov v Kazakhstane za 2012-2021 gg. [Analysis of the dynamics of national emissions and absorption of greenhouse gases in Kazakhstan for 2012-2021].Hydrometeorology and ecology,3, 6–23. [CrossRef]
- Van‘t Wout, T., Celikyilmaz, G., & Arguello, C. (2021).Policy analysis of Nationally Determined Contributions in the Europe and Central Asia region: 2021. (pp.137).Food & Agriculture Organization.ISBN978.92.5.135360.8.
- Nguyen, A. T. (2019). The relationship between economic growth, energy consumption and carbon dioxide emissions: evidence from Central Asia. Eur. J. Bus. Econ.,12(24), 1- 15. [CrossRef]
- Crippa, M. , Guizzardi, D., Muntean, M., Schaaf, E., Solazzo, E., Monforti-Ferrario, F., Olivier, J.G.J., Vignati, E. (2020).Fossil CO2 emissions of all world countries - 2020 report. (EUR 30358 EN). Publications Office of the European Union. ISBN 978-92-76-21515-8.
- World Bank. (n.d.).Upravlenie kachestvom vozduha v Respublike Tajikistan (Russian). [Air quality management in the Republic of Tajikistan]. Washington, D.C.: WorldBankGroup. http://documents.worldbank.org/curated/en/099081723150529416/P18001408270f40e80b900006bd7a098720.
- Mukhtarov, R. , Ibragimova, O. P., Omarova, A., Tursumbayeva, M., Tursun, K., Muratuly, A., ... & Baimatova, N. (2023). An episode-based assessment for the adverse effects of air mass trajectories on PM2. 5 levels in Astana and Almaty, Kazakhstan. Urban Climate. 49, 101541. [CrossRef]
- Dahiya, S., Anhäuser, A., Farrow, A., Thieriot, H., Kumar, A., & Myllyvirta, L. Global SO2 emission hotspot database. Delhi: Center for Research on Energy and Clean Air & Greenpeace India. October 2020. 48pp. https://energyandcleanair.org/wp/wp-content/uploads/2020/10/SO2report1.pdf.
- United Nations Environment Programme. (2023, November 20). Emissions Gap Report 2023: Broken record – Temperatures hit new highs, yet world fails to cut emissions (again). https://www.unep.org/resources/emissions-gap-report-2023.
- Eurasian Development Bank.(2023). Vinokurov, E. Eurasian Development Bank.(2023). Vinokurov, E., Conrad,A.,Zaboev, A.,Klochkova, E., Malakhov, A., Pereboev, V. Global Green Agenda in the Eurasian Region. Eurasian Region on the Global Green Agenda. (Reports and Working Papers 23/2). Almaty: Eurasian Development Bank, 2023.SSRN: https://ssrn.com/abstract=4456821.
- International Energy Agency (2021).Cross-Border Electricity Trading for Tajikistan: A Roadmap. (IEA Publications). https://www.iea.org/reports/cross-border-electricity-trading-for-tajikistan-a-roadmap.
- Zheng, B., Tong, D., Li, M., Liu, F., Hong, C., Geng, G., Li, H., Li, X., Peng, L., Qi, J., Yan, L., Zhang, Y., Zhao, H., Zheng, Y., He, K., Zhang, Q. (2018). Trends in China’s anthropogenic emissions since 2010 as the consequence of clean air actions. Atmos. Chem. Phys. 18, 14095-14111. [CrossRef]
- Wang, J., Lu, X., Du, P., Zheng, H., Dong, Z., Yin, Z., ... & Hao, J. (2023).The increasing role of synergistic effects in Carbon Mitigation and Air Quality Improvement, and its Associated Health benefits in China. Engineering, 20, 103-111. [CrossRef]
- Mukhamediev,R.I., Mustakayev,R., Yakunin,K., Kiseleva,S., Gopejenko,V. (2019).Multi-Criteria Spatial Decision Making Supportsystem for Renewable Energy Development in Kazakhstan, in IEEE Access., 7, 122275-122288. [CrossRef]
- Faizi, A. , Ak, M. Z., Shahzad, M. R., Yüksel, S., & Toffanin, R. (2024). Environmental Impacts of Natural Resources, Renewable Energy, Technological Innovation, and Globalization: Evidence from the Organization of Turkic States. Sustainability. [CrossRef]
- Liu, W. , Liu, L.,Gao, J. (2020). Adapting to climate change: gaps and strategies for Central Asia. Mitig. Adapt. Strateg. Glob. Change. [CrossRef]
- United Nations Environment Programme. (2023). Emissions Gap Report 2023: Broken Record – Temperatures hit new highs, yet world fails to cut emissions (again). (UNEP, DEW/2589/NA). Nairobi, Kenya: United Nations Environment Programme. ISBN: 978-92-807-4098-1. [CrossRef]
- United Nations.(2014). The Vienna Programme of Action for the Landlocked Developing Countries for the decade 2014-2024. United Nations Secretary-General Ban Ki-moon, Second UN Conference on Landlocked Developing Countries, Vienna–November 2014. https://www.un.org/.
- International Energy Agency.(2021). Net Zero by 2050. A Roadmap for the Global Energy Sector. (Special Report)..https://www.iea.org/reports/net-zero-by-2050.
- Zhao, C., Liu, B., Wang, J., Xue, R., Shan, Y., Cui, C., ... & Dong, K. (2023). Emission accounting and drivers in CACs. Environ. Sci. Pollution Res., 30(46), 102894-102909. [CrossRef]
- Huang, L., Krigsvoll, G., Johansen, F., Liu, Y., & Zhang, X. (2018). Carbon emission of global construction sector. Renew. sustain. energy rev., 81, 1906-1916. [CrossRef]
- European Commission.(2020). Determining the environmental impacts of conventional and alternatively fuelled vehicles through LCA. Final Report for the European Commission, DG Climate Action. (Contract Ref. 34027703/2018/782375/ETU/CLIMA.C.4). https://climate.ec.europa.eu/system/files/2020.09/2020_study_main_report_en.pdf.
- International Transport Forum.(2023). ITF Transport Outlook 2023. (216pp.) Published by OECD/ITF. [CrossRef]
- Jaramillo, P. Kahn Ribeiro, P. Newman, S. Dhar, O.E. Diemuodeke, T. Kajinom D.S. Lee, S.B, Nugroho; X. Ou, A. Hammer Strømman, J.(2022). Whitehead. 2022: Transport. In IPCC, 2022: Climate Change 2022: Mitigation of Climate Change. Contribution of Working Group III to the Sixth Assessment Report of the Intergovernmental Panel on Climate Change [P.R. Shukla, J. Skea, R. Slade, A. Al Khourdajie, R. van Diemen, D. McCollum, M. Pathak, S. Some, P. Vyas, R. Fradera, M. Belkacemi, A. Hasija, G. Lisboa, S. Luz, J. Malley, (eds.)]. Cambridge University Press, Cambridge, UK and New York, NY, USA. [CrossRef]
- Kachestvo vozduha v czentralnoj azii pora bit trevogu.(2020,September1) [Air quality in Central Asia needs to be sounded the alarm]. https://livingasia.online/2020/09/01/.(in Russin).
- Salnikov,V.,Polyakova,S.,Ullman,A.,Kauazov,A.,Tursumbayeva,M.,Kisebayev,D.,Miskiv,D.,Beldeubayev,E.,MusralinovaG., Kozhagulov,S. (2024).Monitoring kachestva atmosphernogo vozduha Zapadno-Kazakhstanskogo regiona:printsypy, metody,podhody. [Monitoring the quality of atmospheric air in the West Kazakhstan region: principles, methods, approaches]. Hydrometeorology and Ecology. [CrossRef]
- Hughes,G.(Ed.). (2017). Central Asia Waste Management outlook. Zoï Environment Network: UNEP,Nairobi, Kenya, pp.100. ISBN: 978-92-807-3666-3.
- Yang, W. , Wang, J., Zhang, K.,Hao, Y. (2023). A novel air pollution forecasting, health effects, and economic cost assessment system for environmental management: From a new perspective of the district-level. J. Clean. Prod. [CrossRef]
| 1 | |
| 2 | |
| 3 | |
| 4 | |
| 5 | |
| 6 | |
| 7 |
Figure 2.
GDP structure of CACs, %. Sourсe: compiled based on The Global Economy.com, https://www.theglobaleconomy.com/.
Figure 2.
GDP structure of CACs, %. Sourсe: compiled based on The Global Economy.com, https://www.theglobaleconomy.com/.
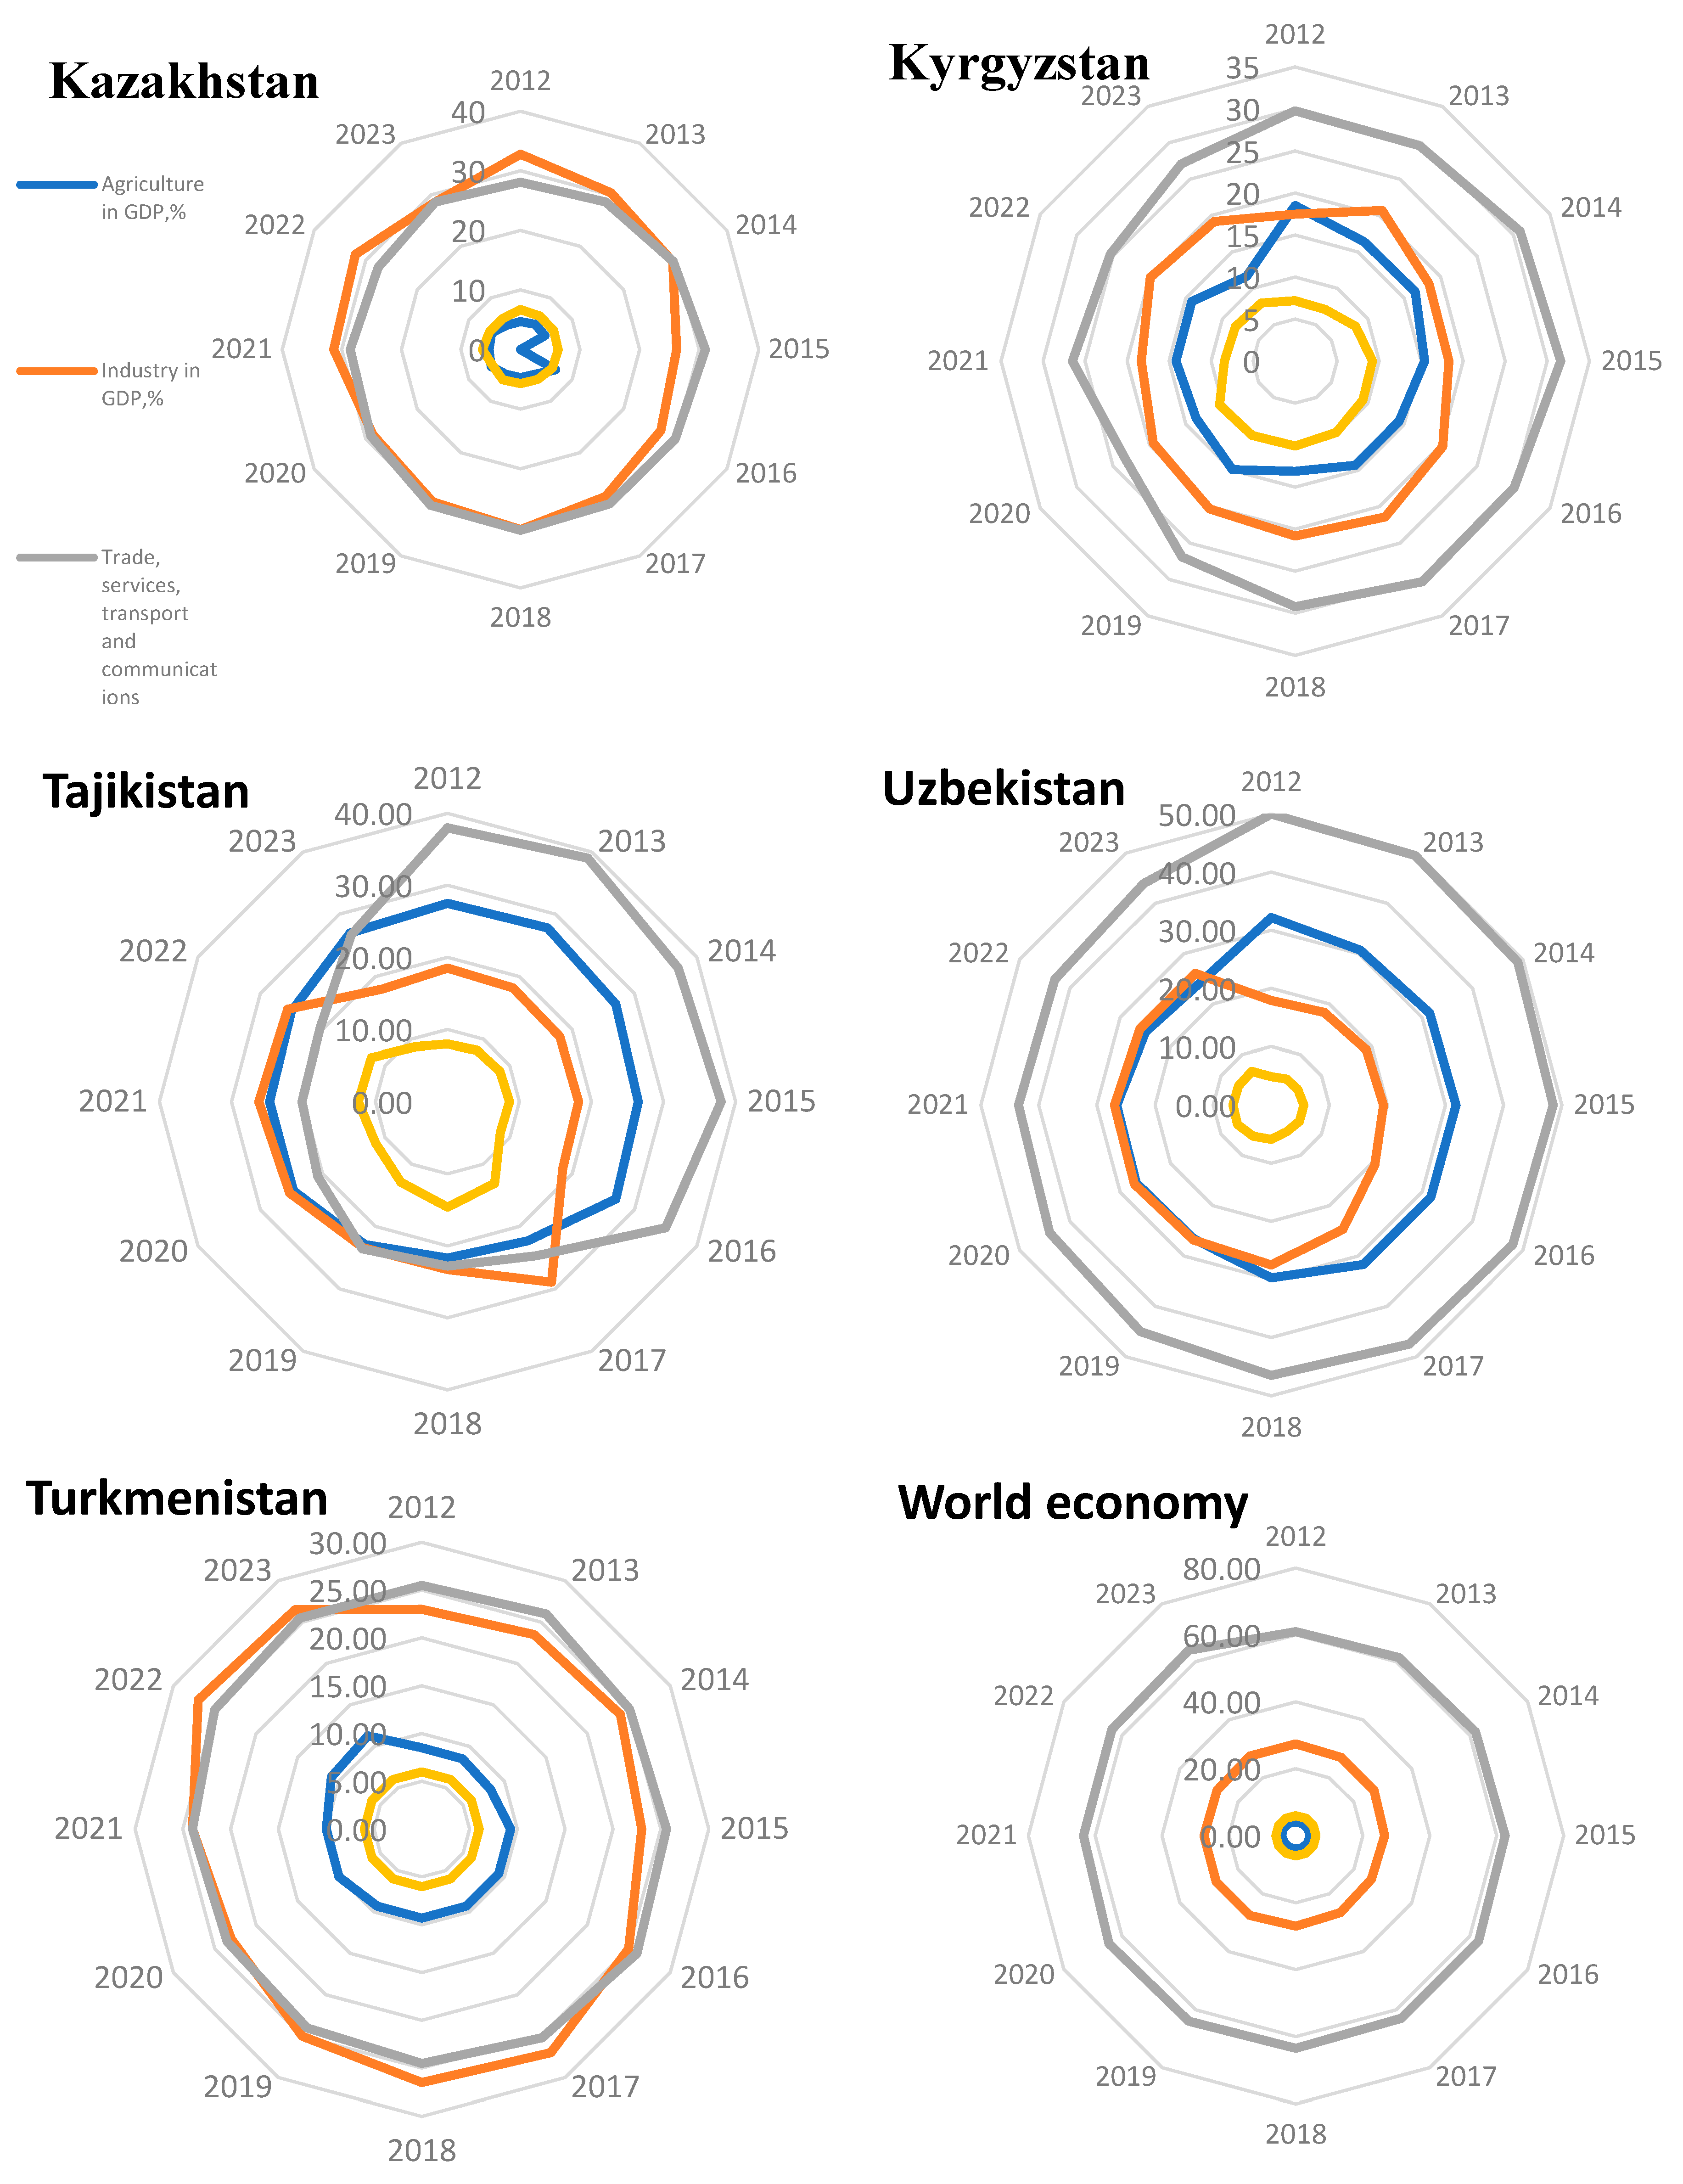
Figure 3.
Export of raw materials in total export volume by CACs and the world, %. Source: compiled based on https://data.worldbank.org/assets/images/placeholder.png.
Figure 3.
Export of raw materials in total export volume by CACs and the world, %. Source: compiled based on https://data.worldbank.org/assets/images/placeholder.png.
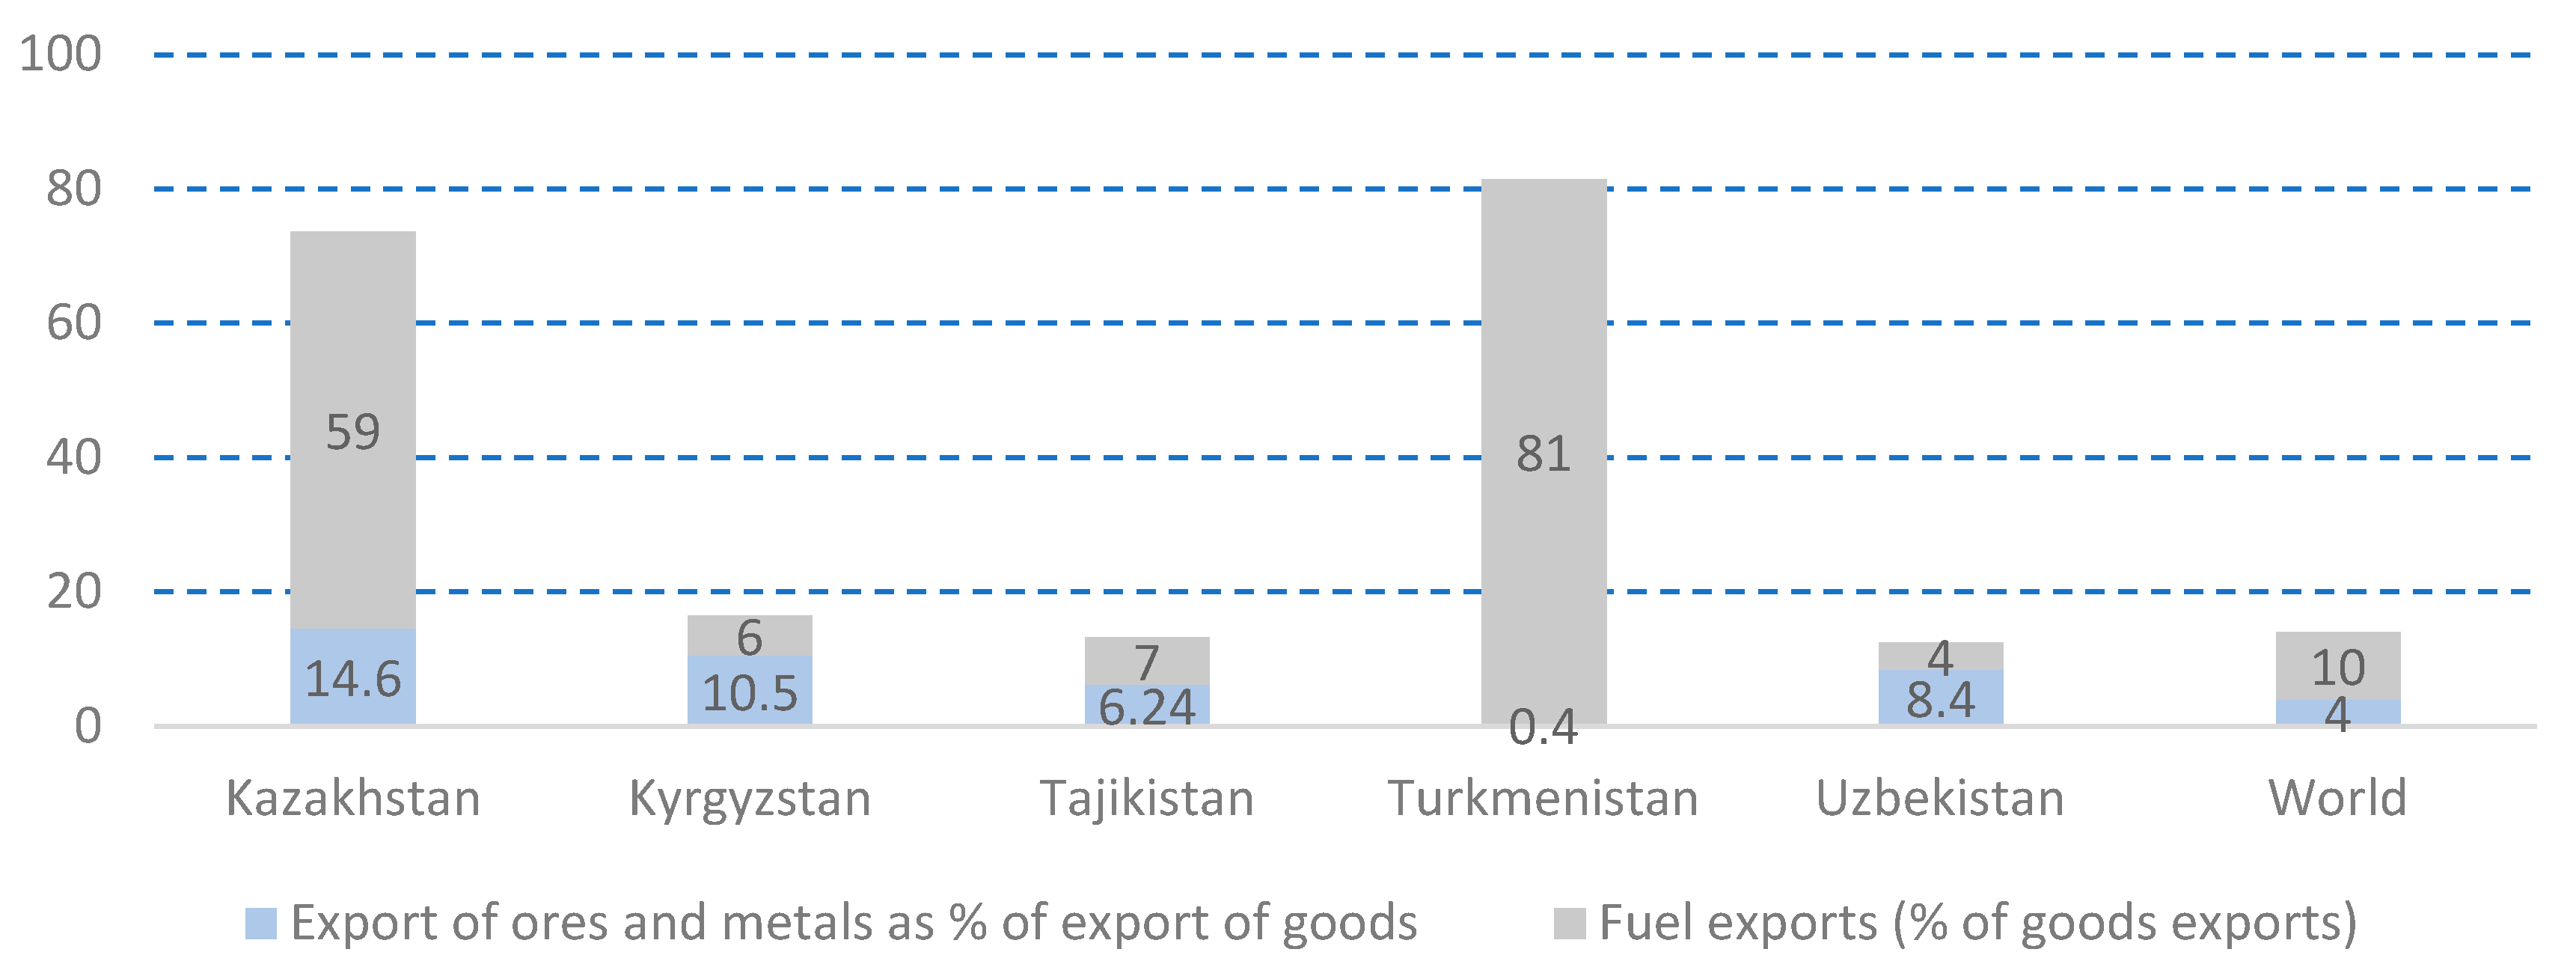
Figure 4.
Indicators of energy consumption and energy production in CACs: Source: compiled based on https://data.worldbank.org/assets/images/placeholder.png.
Figure 4.
Indicators of energy consumption and energy production in CACs: Source: compiled based on https://data.worldbank.org/assets/images/placeholder.png.
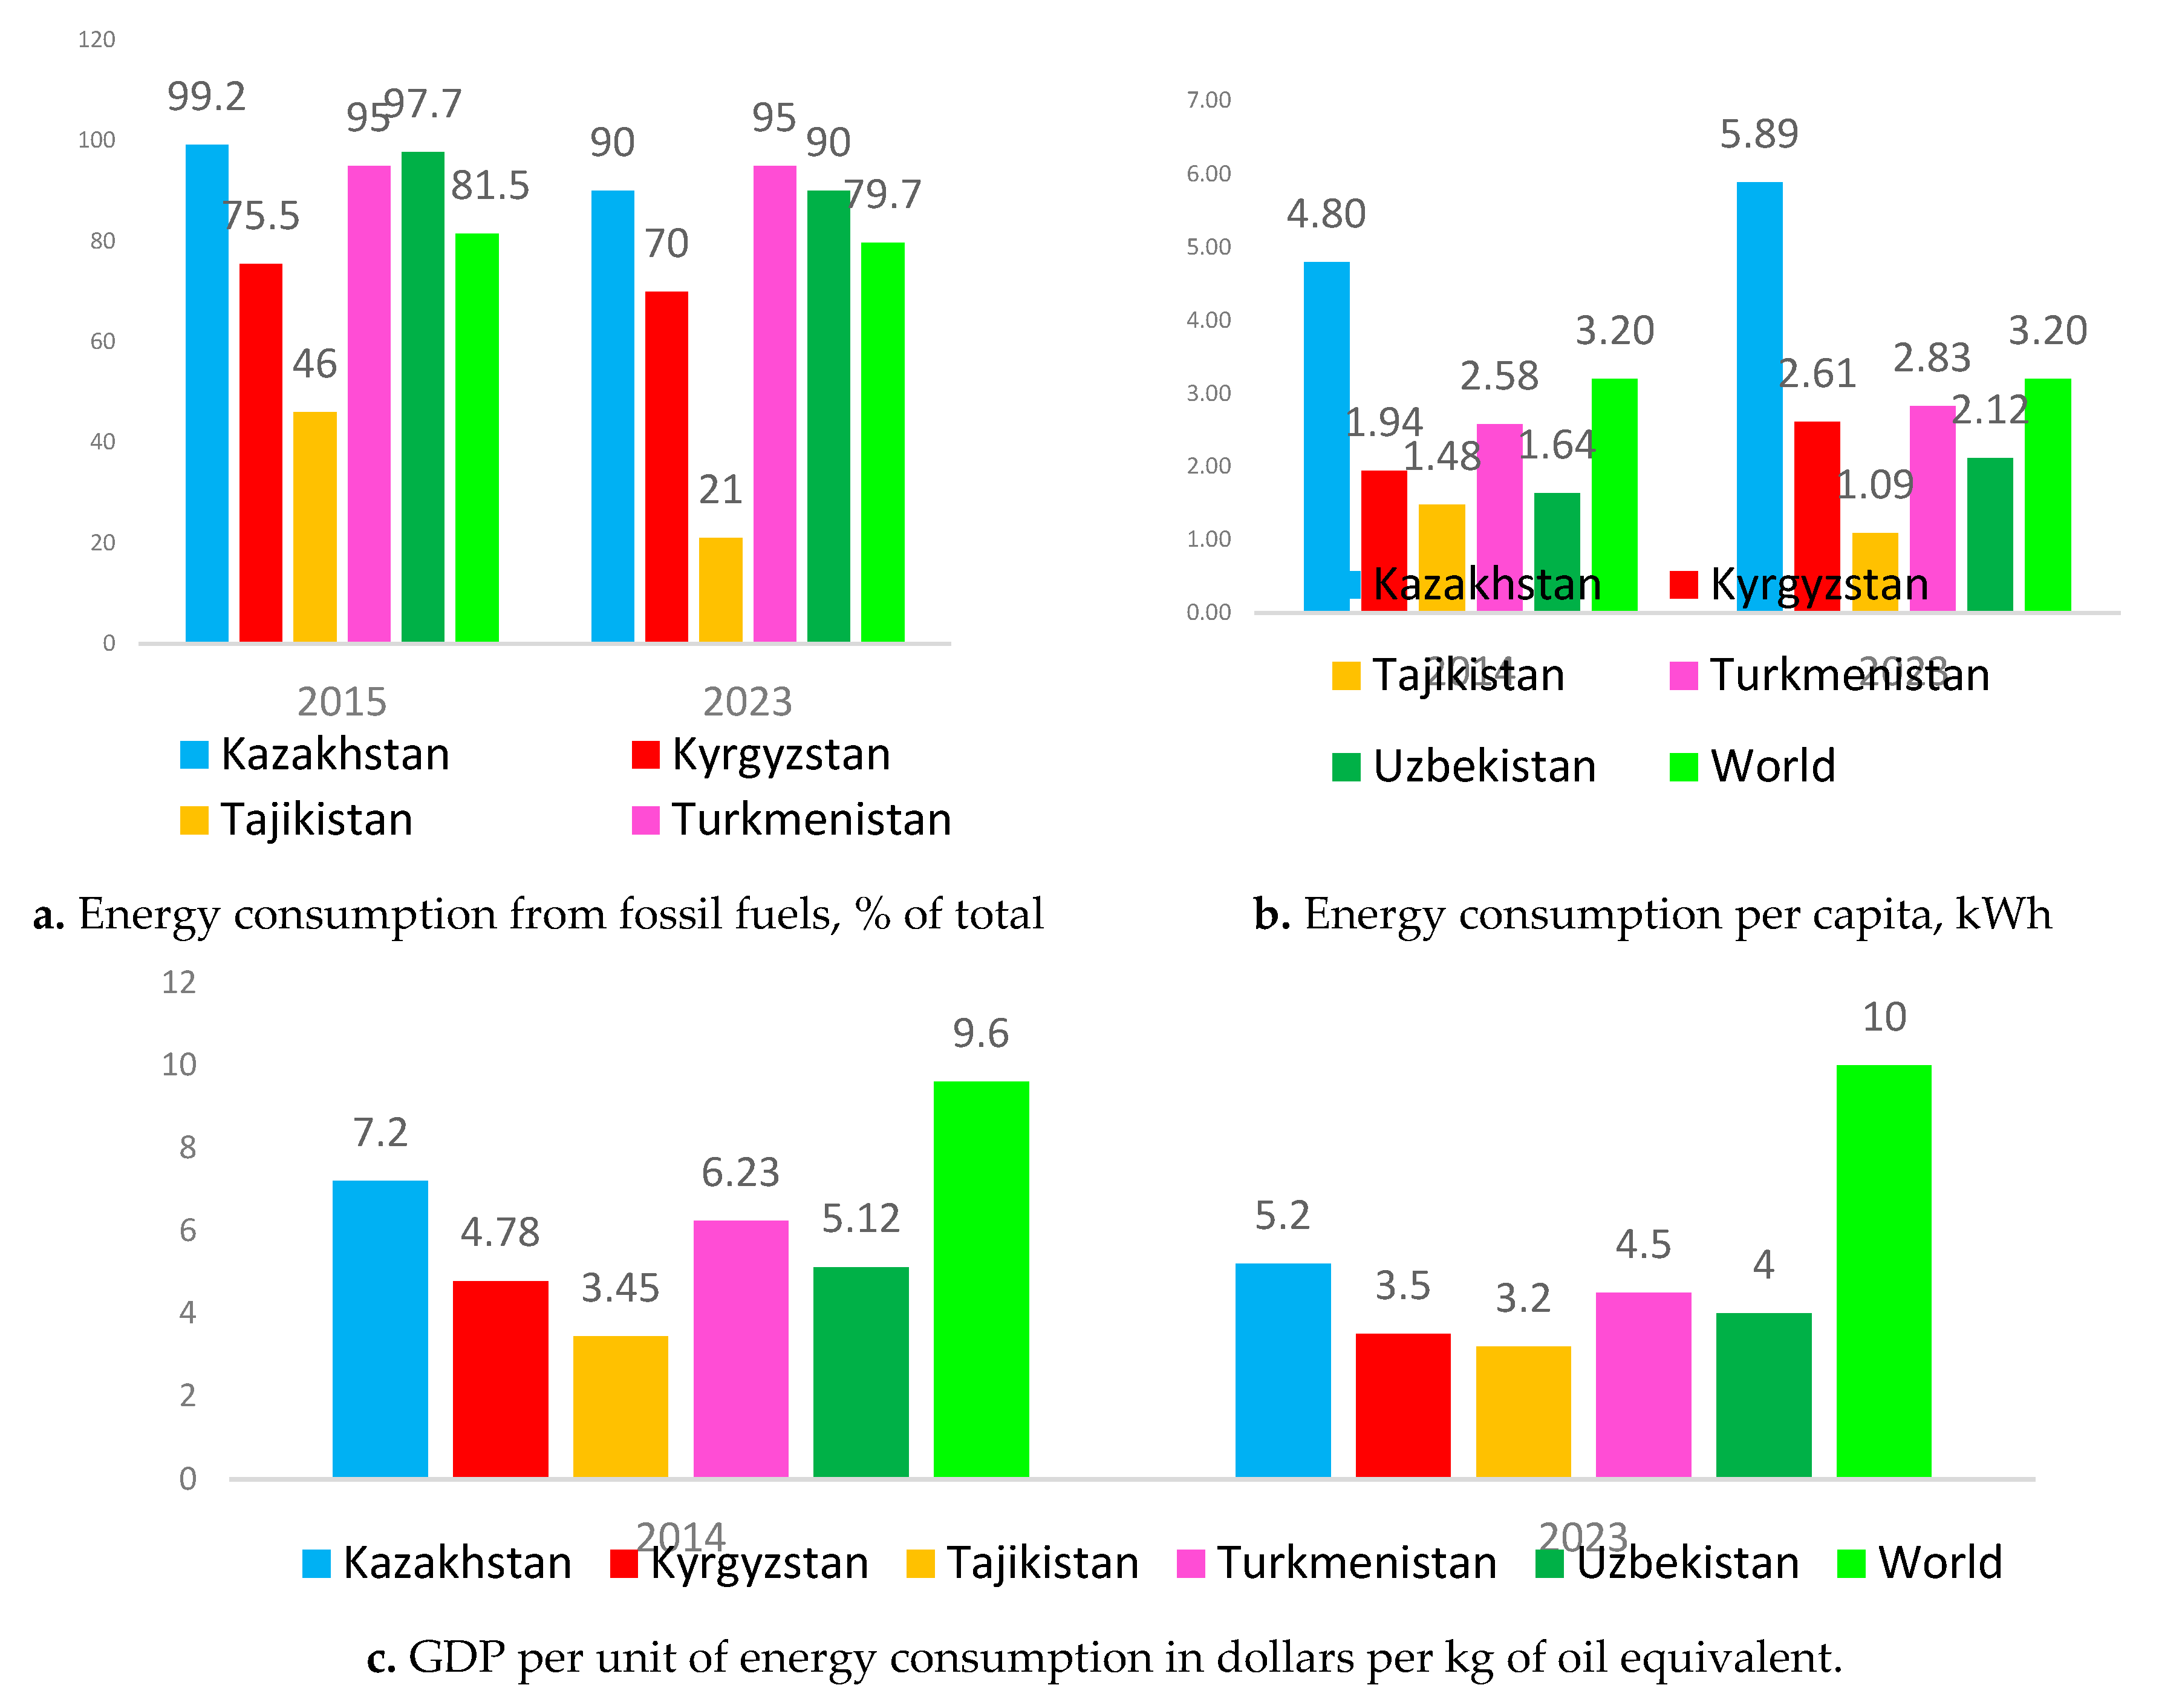
Figure 5.
Energy intensity, koe/USD15p. Intense energy demand per GDP in Kazakhstan. Source: https://yearbook.enerdata.net/.
Figure 5.
Energy intensity, koe/USD15p. Intense energy demand per GDP in Kazakhstan. Source: https://yearbook.enerdata.net/.
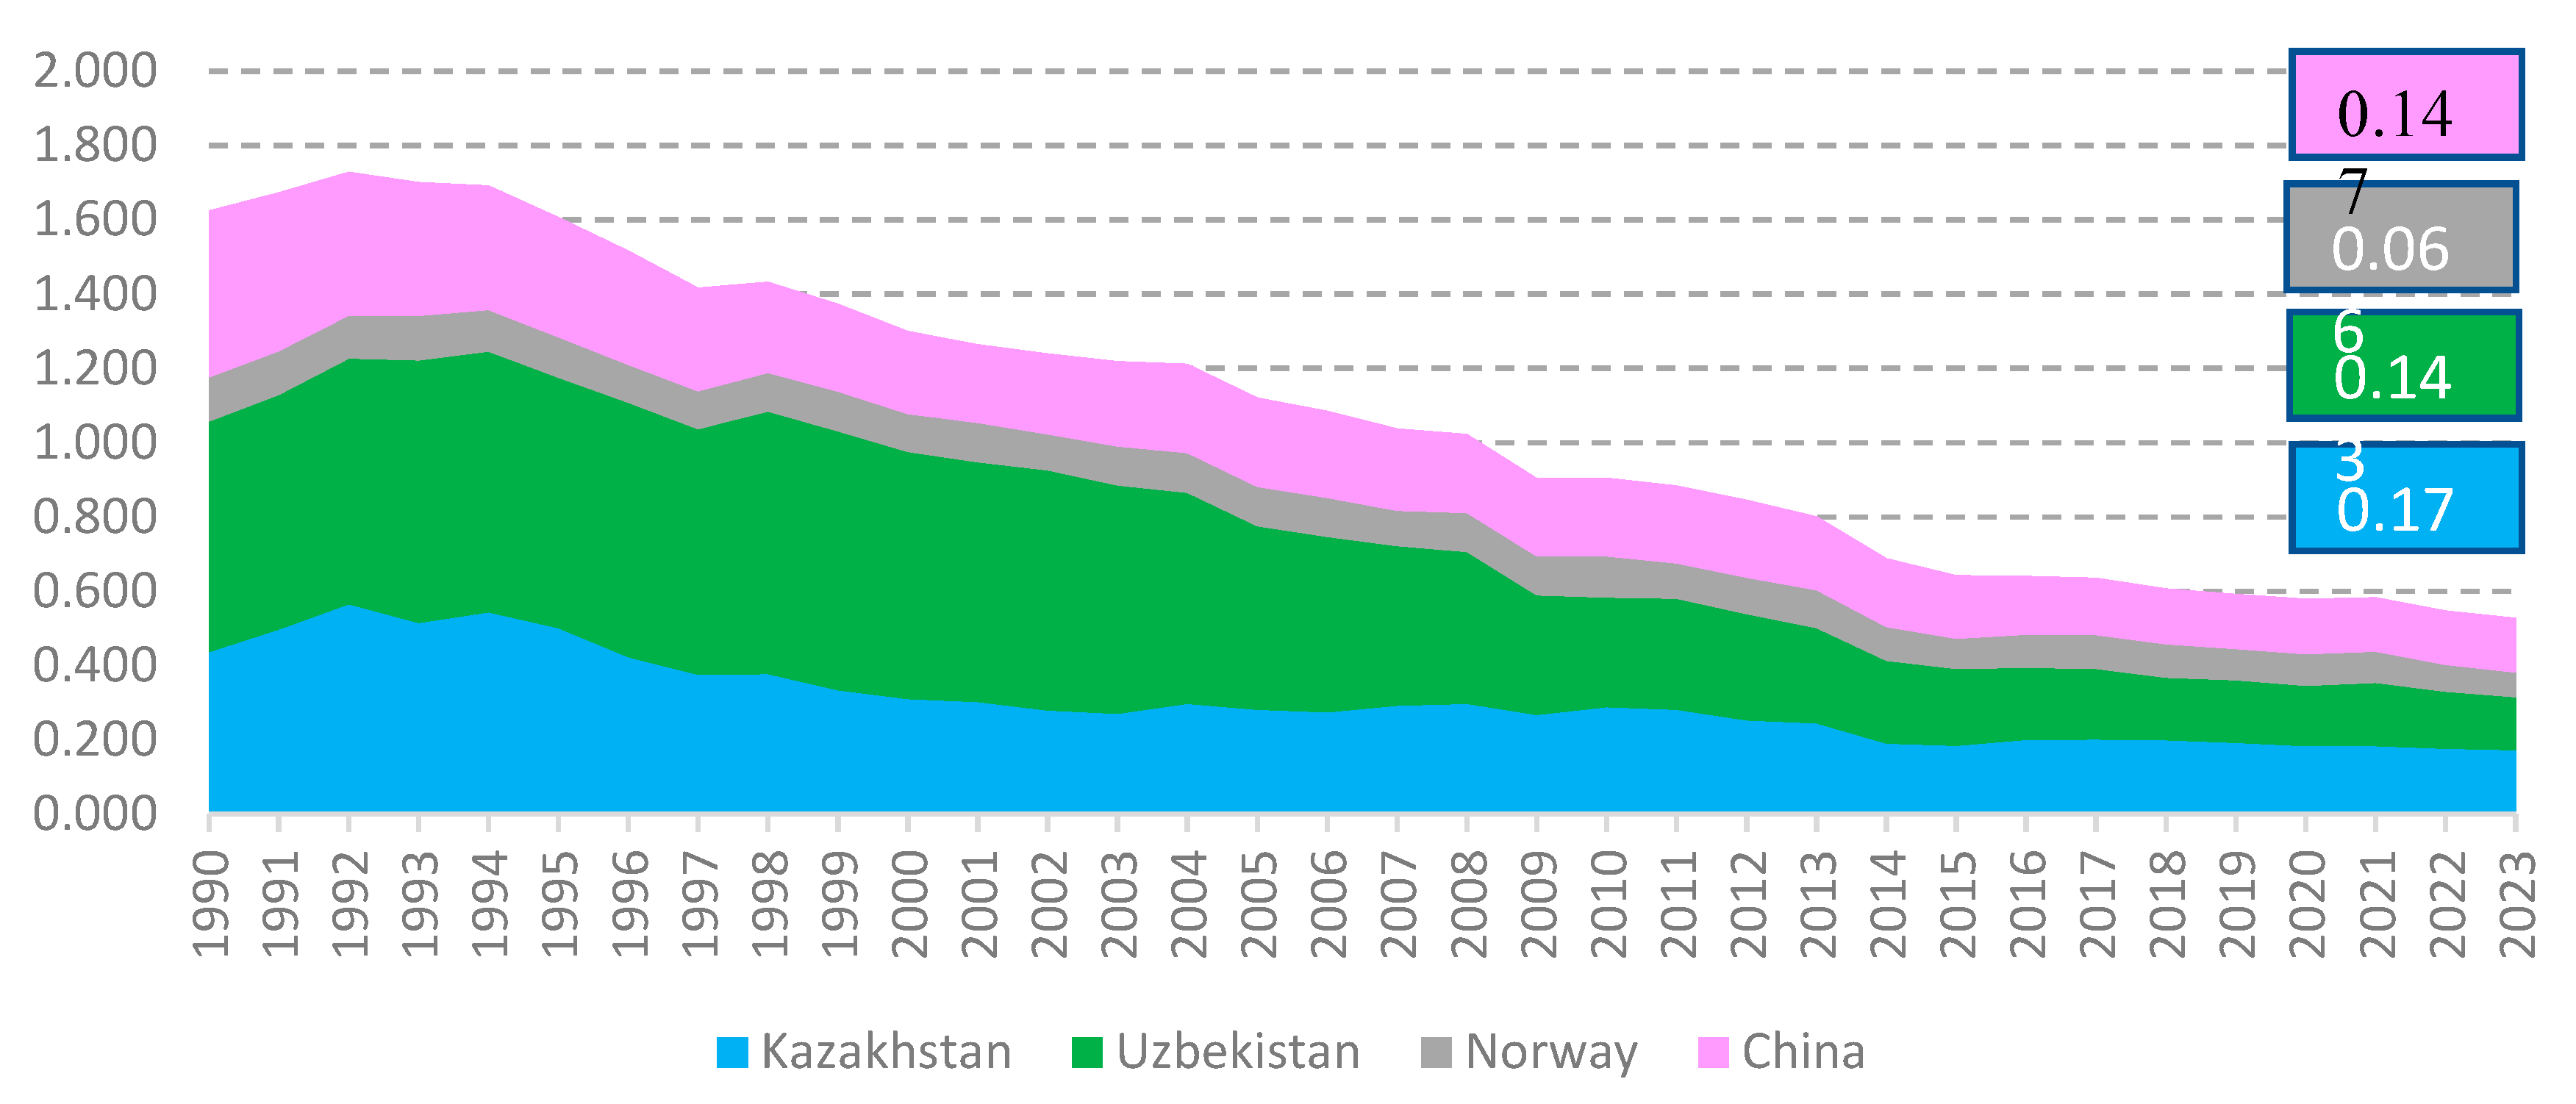
Figure 6.
Dynamics of CO2 emissions in CACs. Sourсe: compiled based on The Global Economy.com, https://www.theglobaleconomy.com/.
Figure 6.
Dynamics of CO2 emissions in CACs. Sourсe: compiled based on The Global Economy.com, https://www.theglobaleconomy.com/.
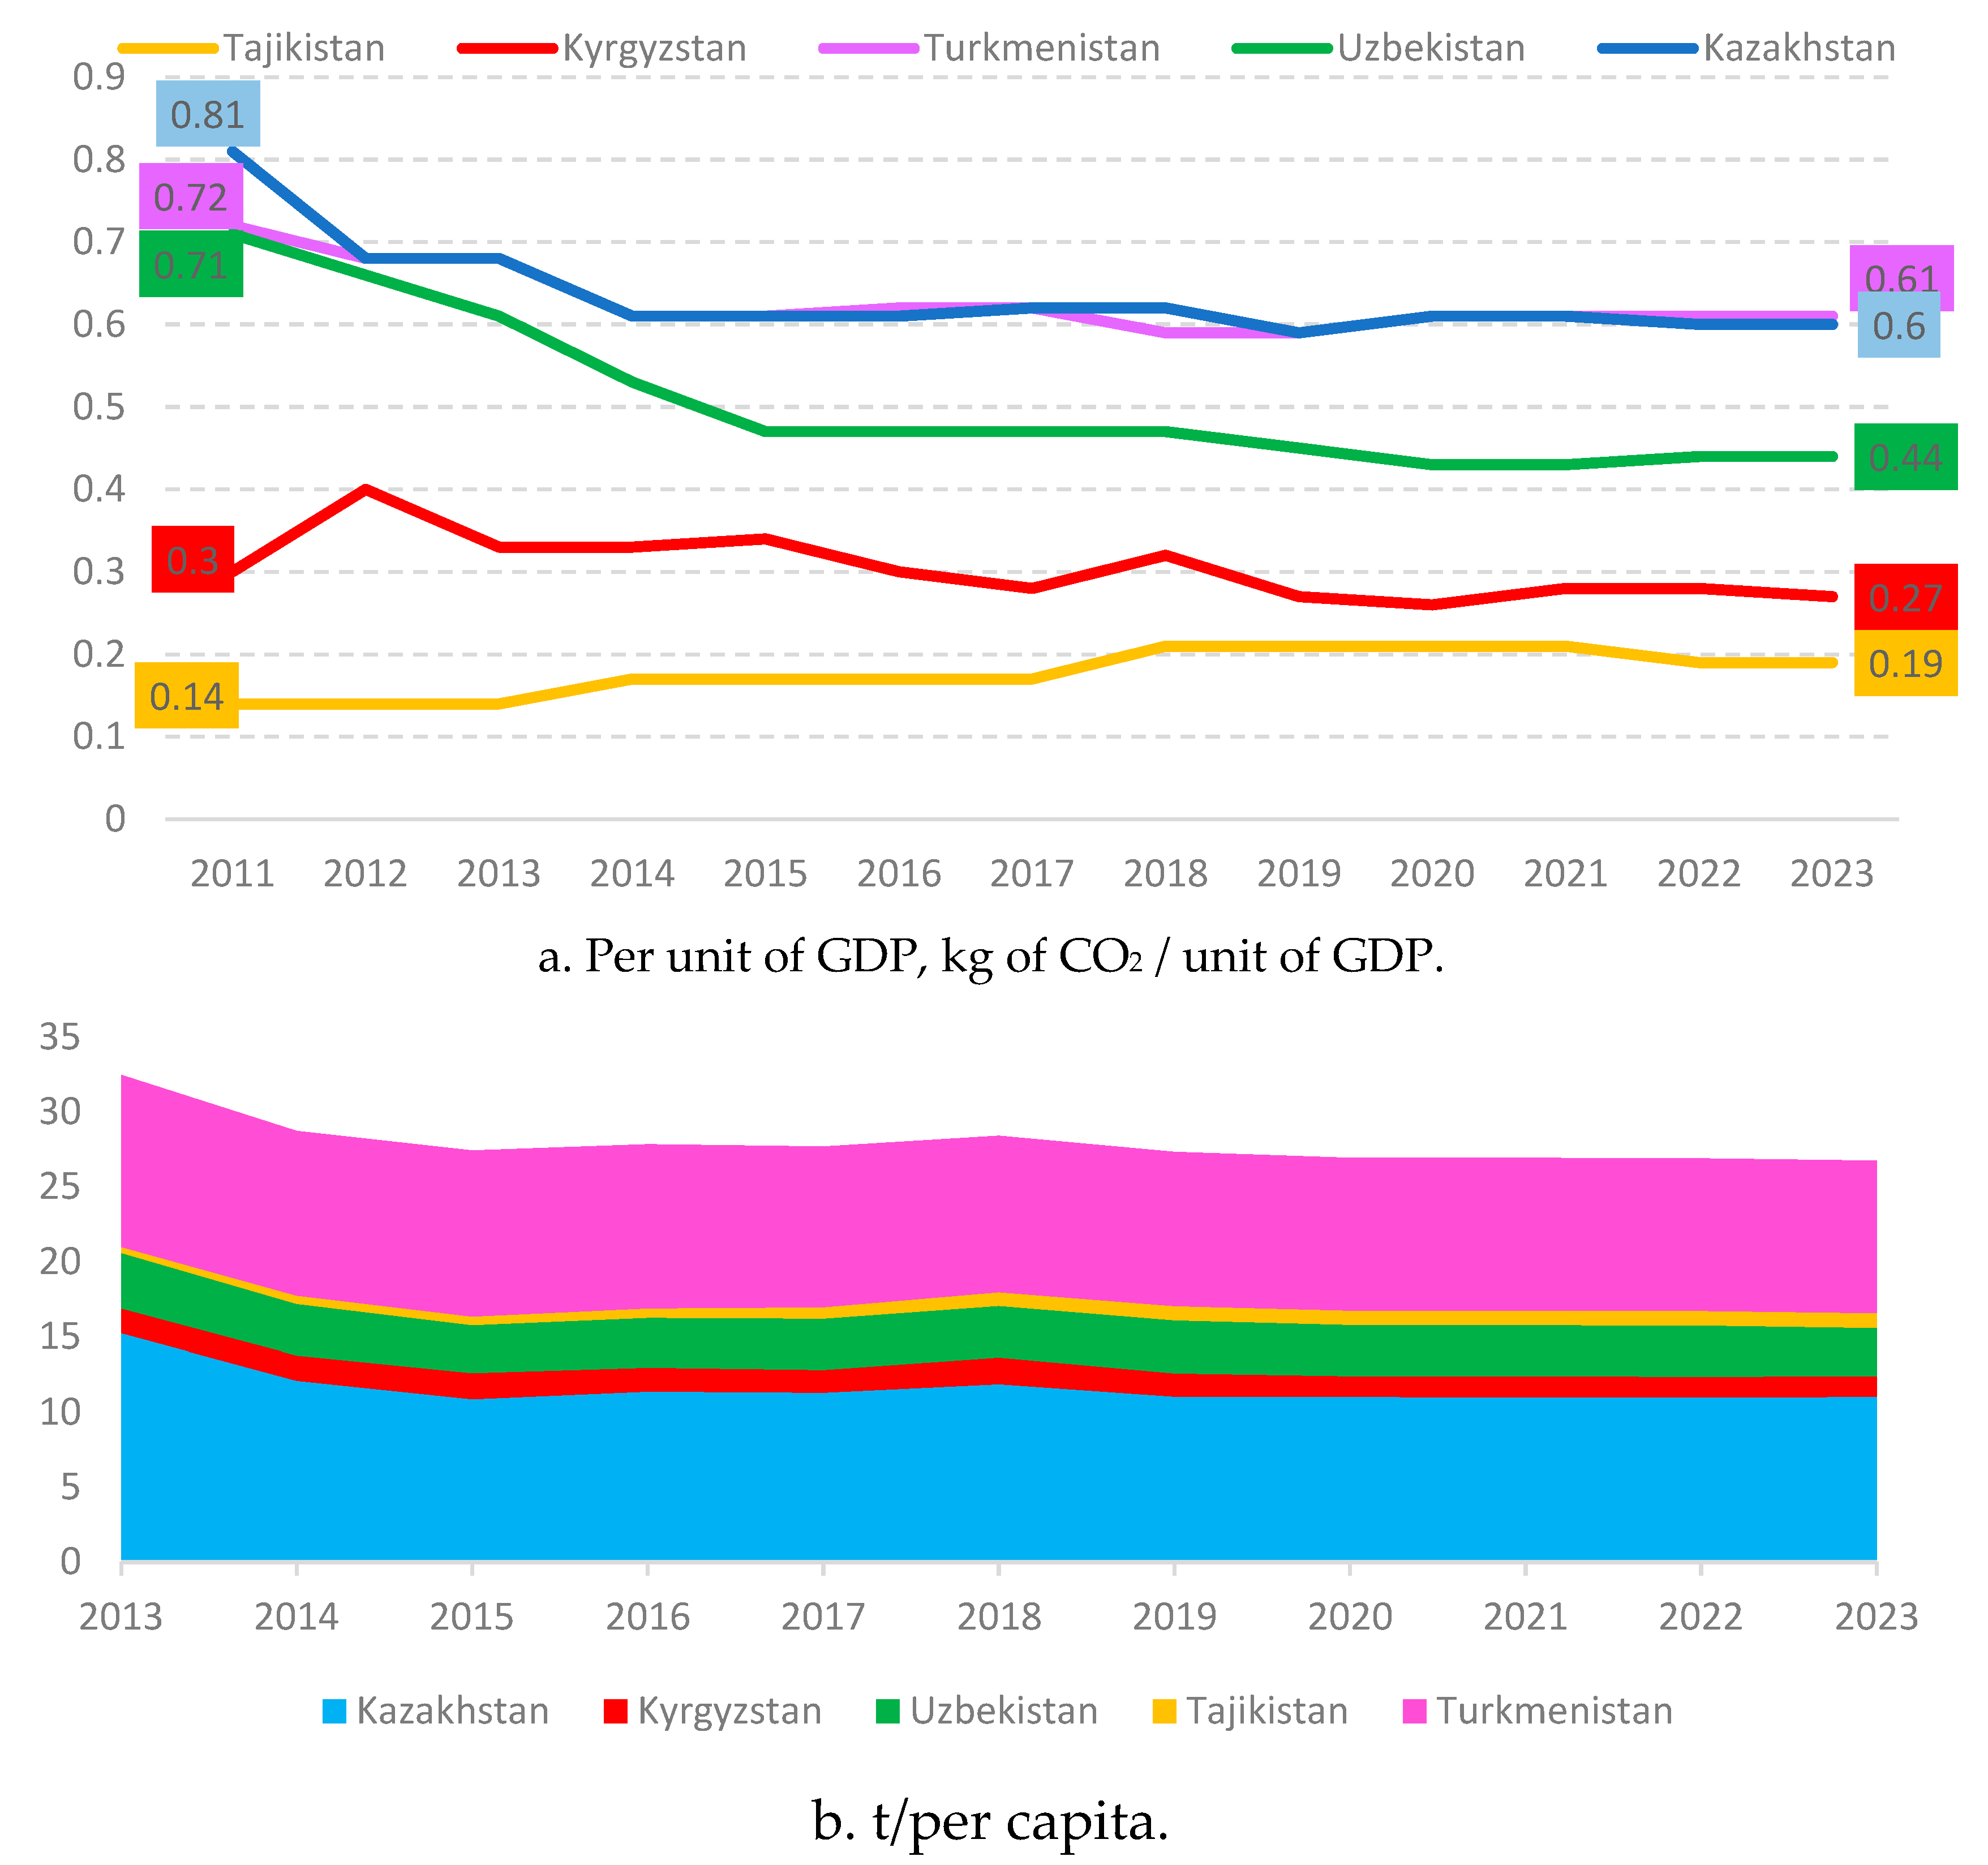
Figure 7.
Dynamics of greenhouse gas emissions by economic sectors of CACs, thousand tons CO2-equivalent. Source: compiled based on https://www.undp.org/ru/kazakhstan/publications/; https://unfccc.int/sites/default/files/resource/NC3_Kyrgyzstan_Russian_24Jan2017_0.pdf;https://unfccc.int/sites/default/files/resource/4NC_TJK_ru_0.pdf; https://unfccc.int/sites/default/files/resource/TNC_Uzbekistan_under_UNFCCC_rus.pdf.
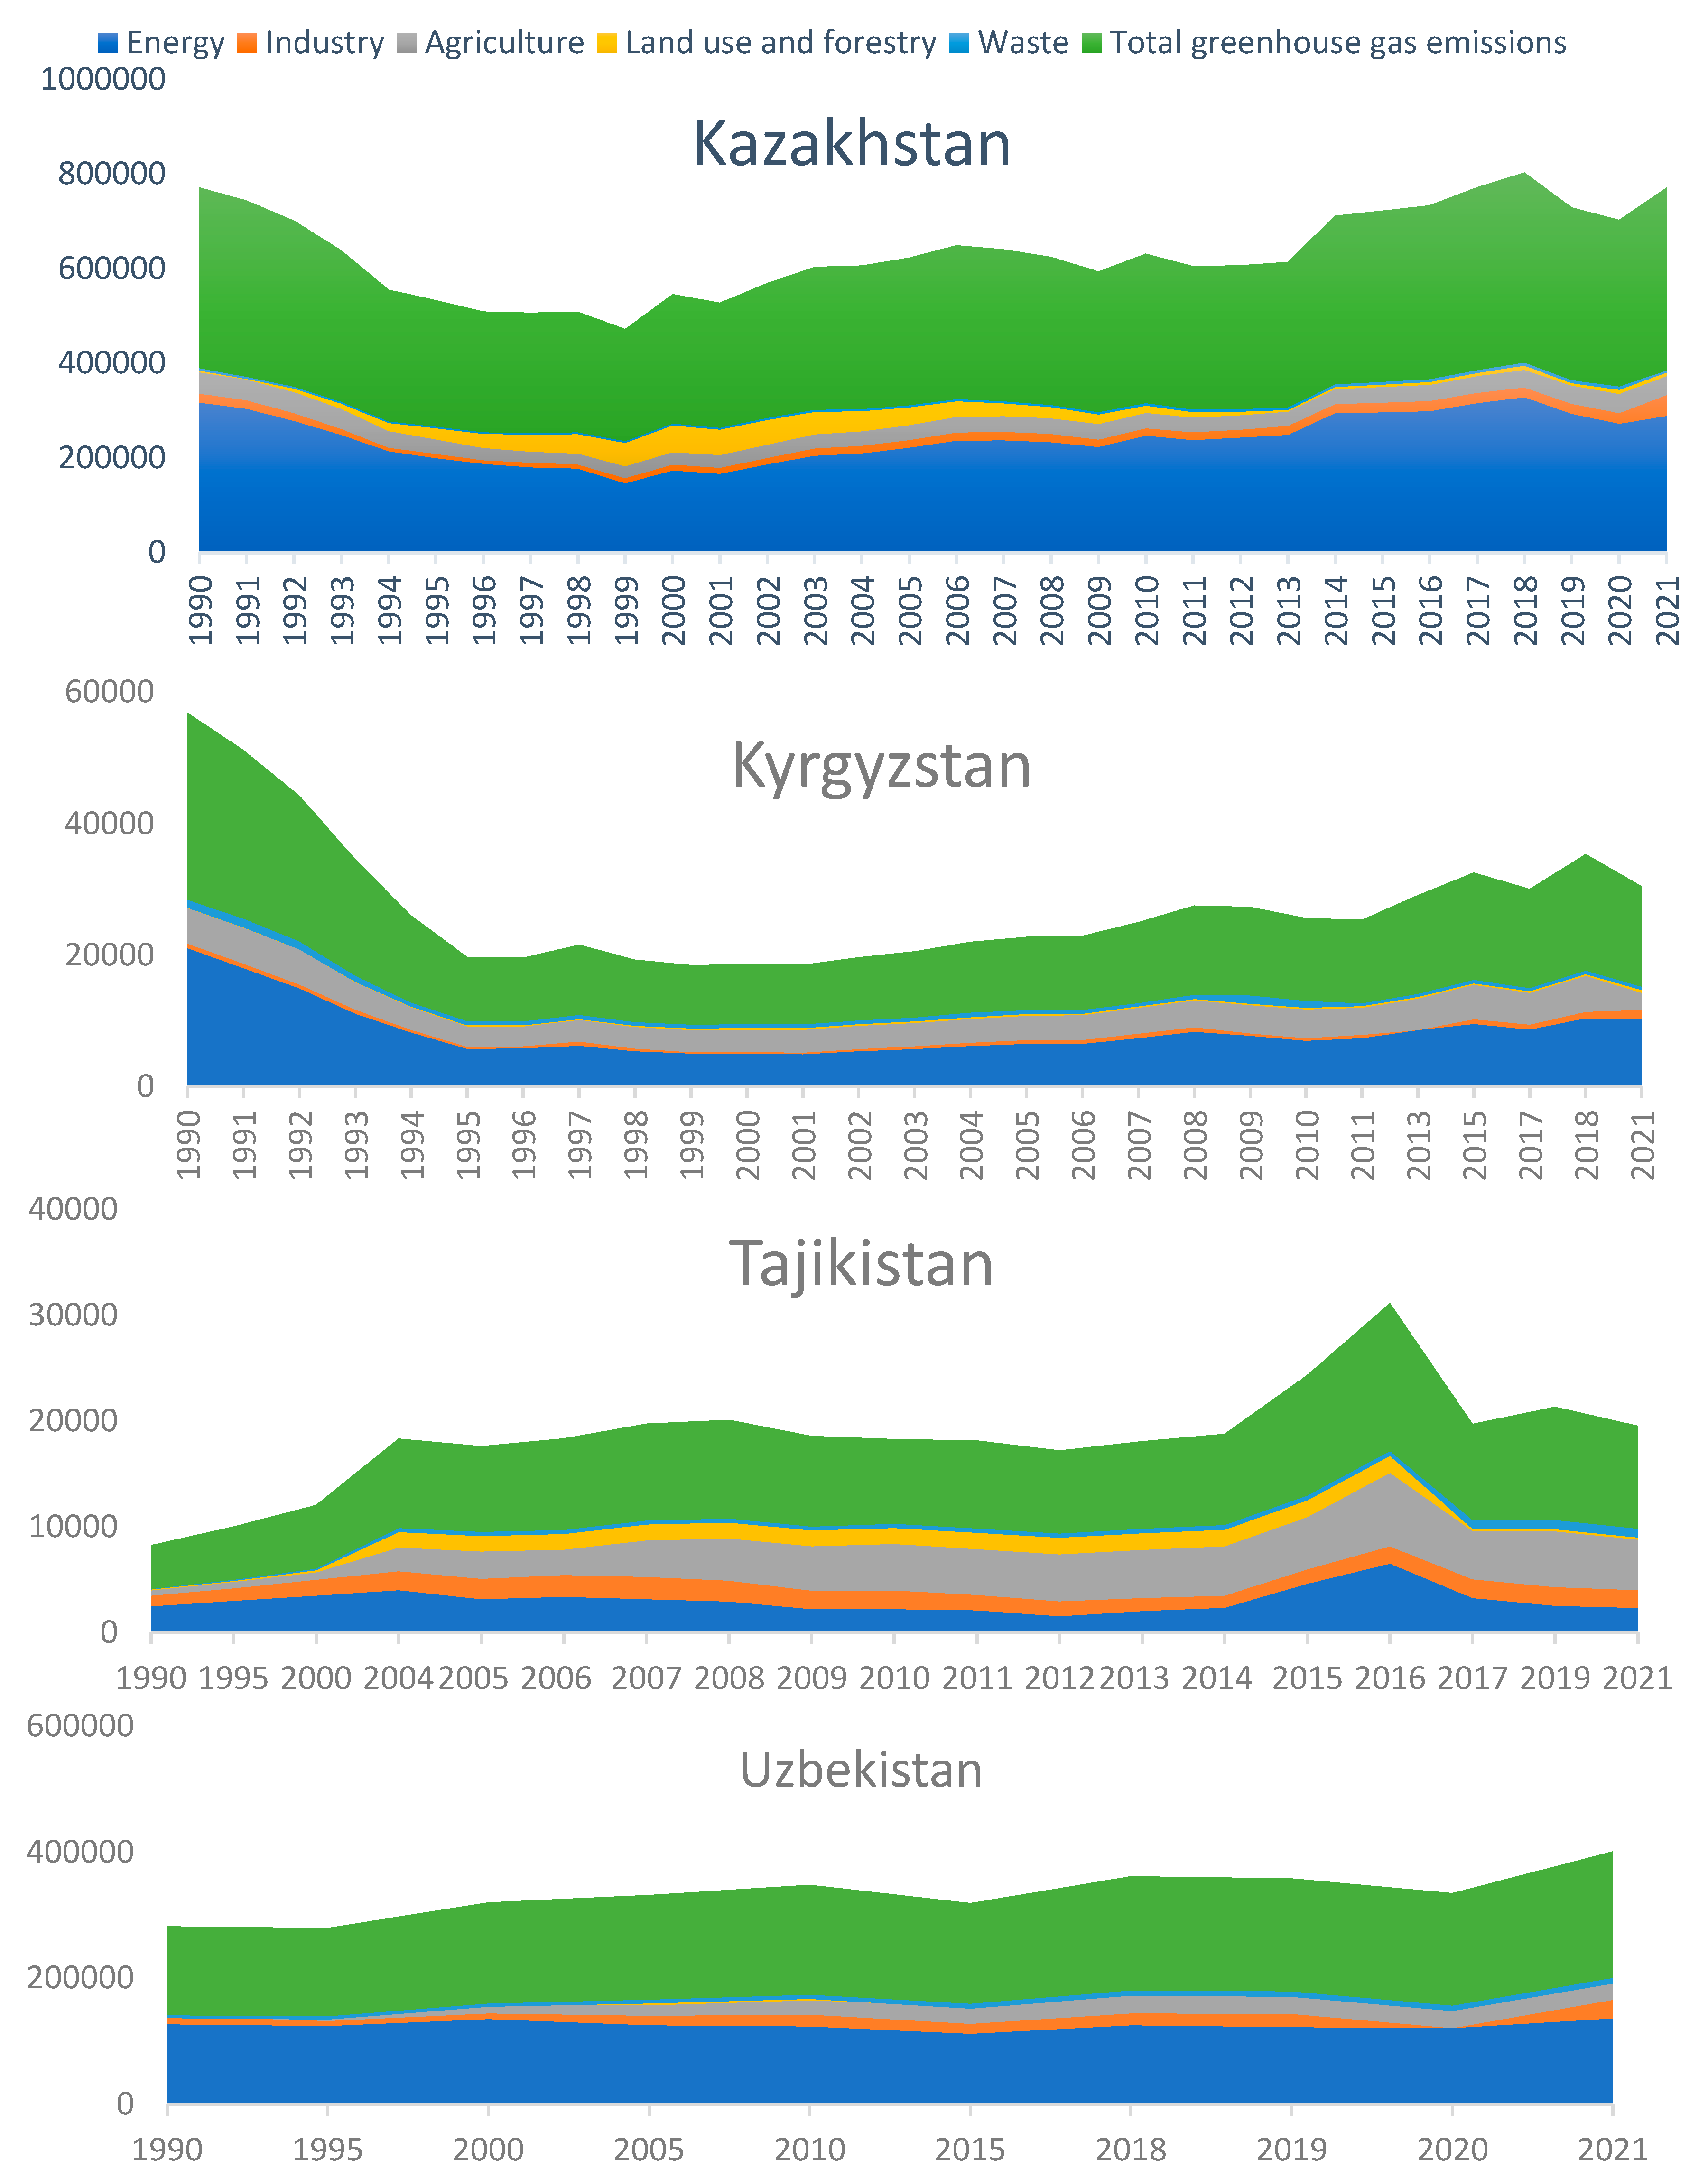
Figure 8.
Avarage CO2 emission (carbon factor), t. CO2/toe. Data Source: https://yearbook.enerdata.net/.
Figure 8.
Avarage CO2 emission (carbon factor), t. CO2/toe. Data Source: https://yearbook.enerdata.net/.
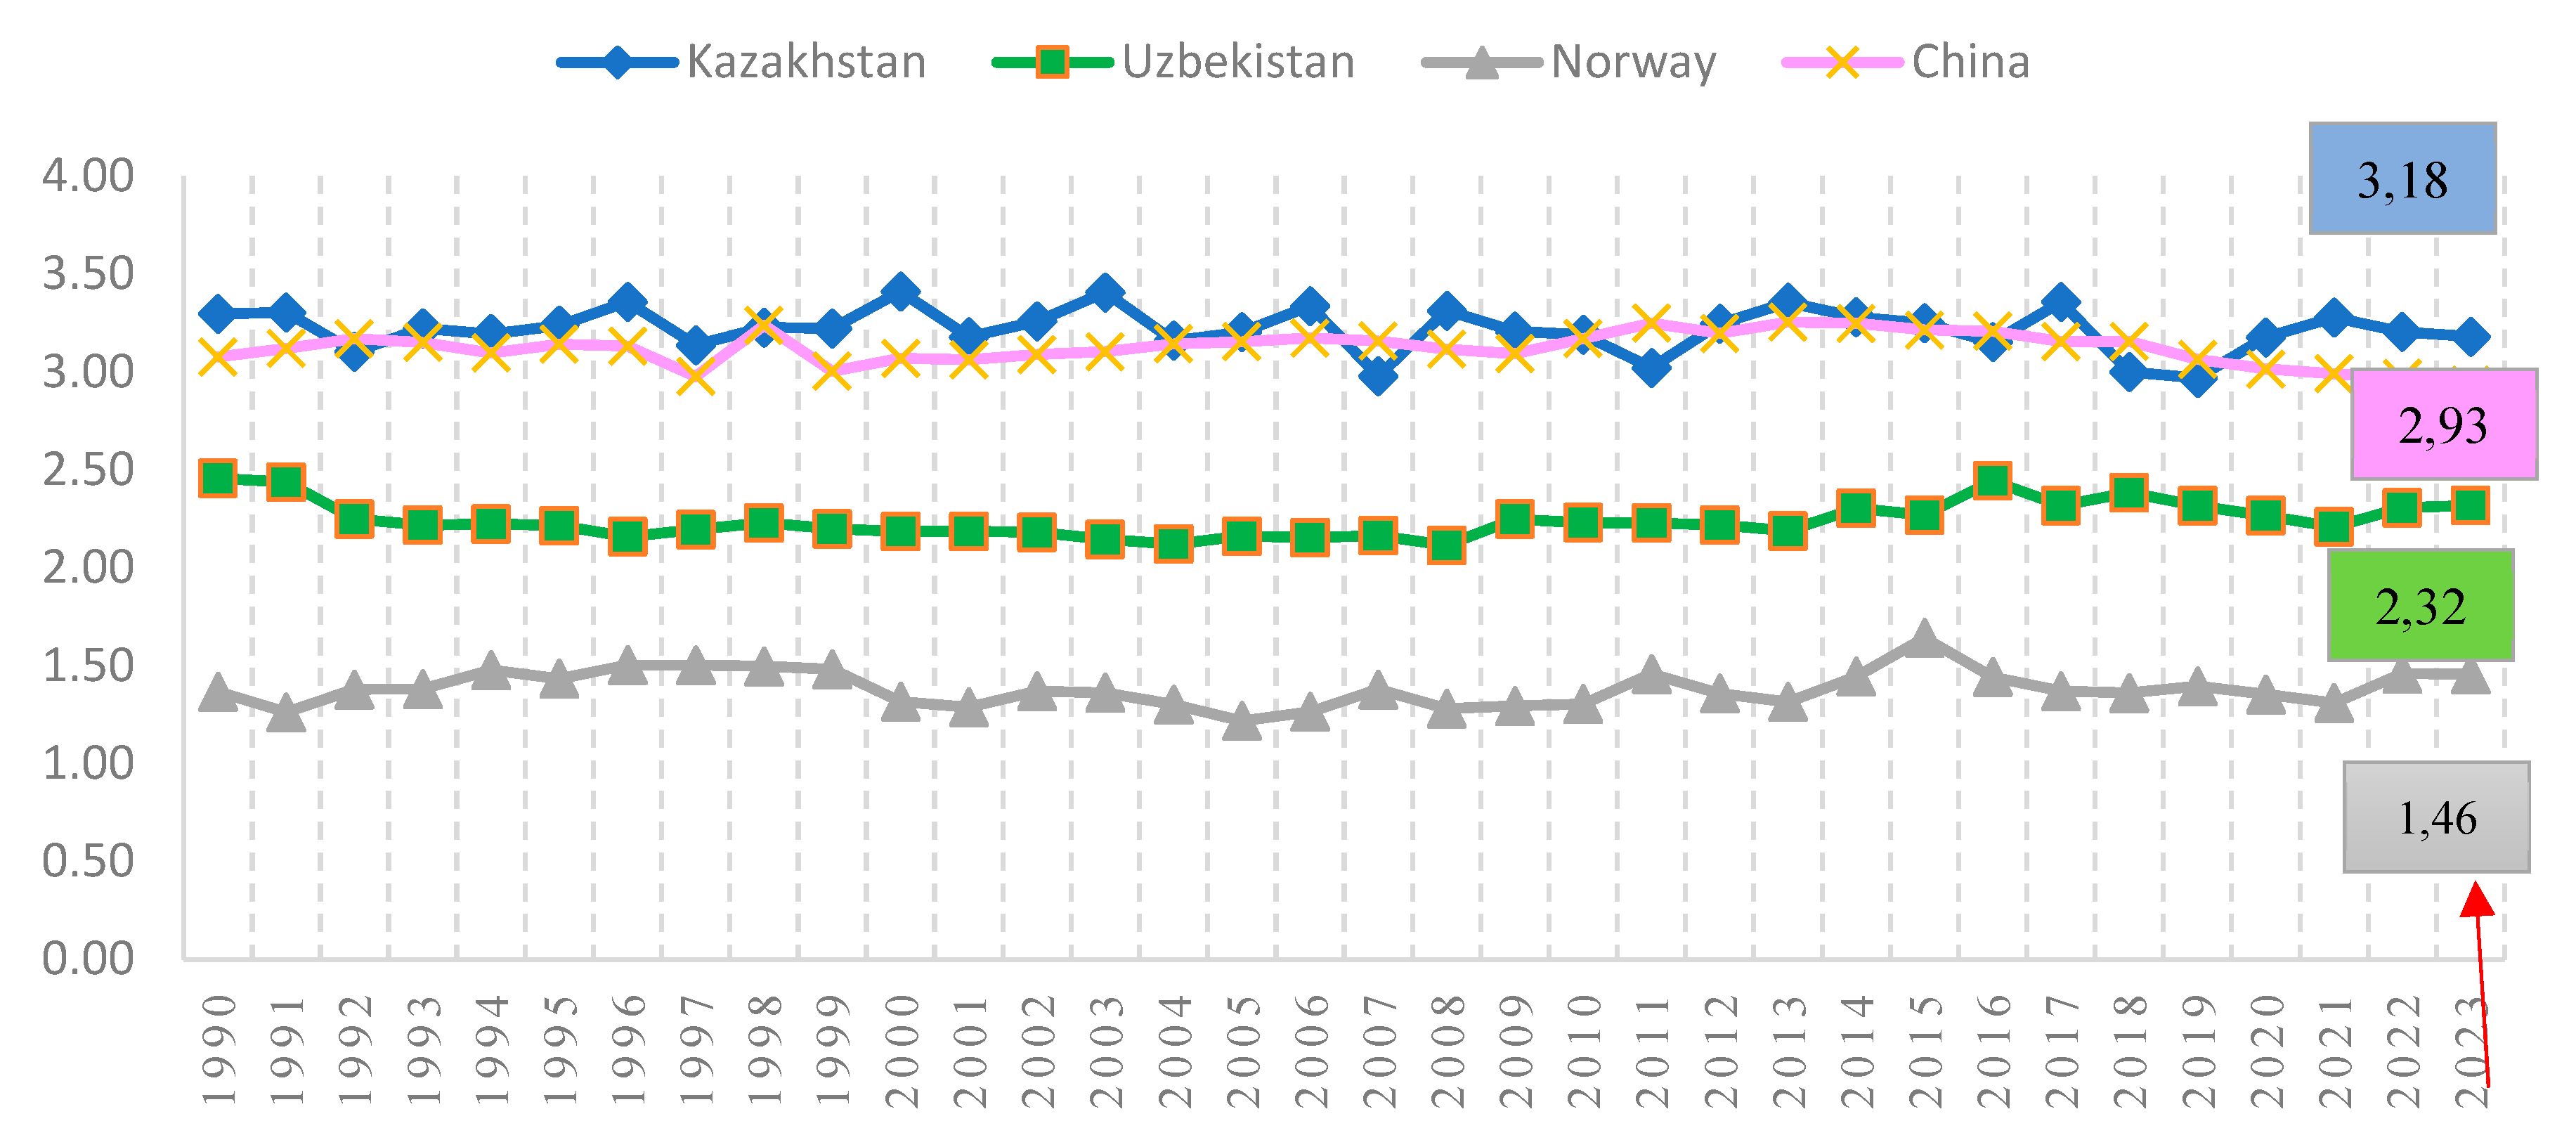
Figure 9.
Dynamics of CO2 emissions by burning fossil fuels of CACs, thousand tons. Source: compiled based on UNECE Data Portal, https://w3.unece.org/SDG/ru/Indicator?id=28.
Figure 9.
Dynamics of CO2 emissions by burning fossil fuels of CACs, thousand tons. Source: compiled based on UNECE Data Portal, https://w3.unece.org/SDG/ru/Indicator?id=28.
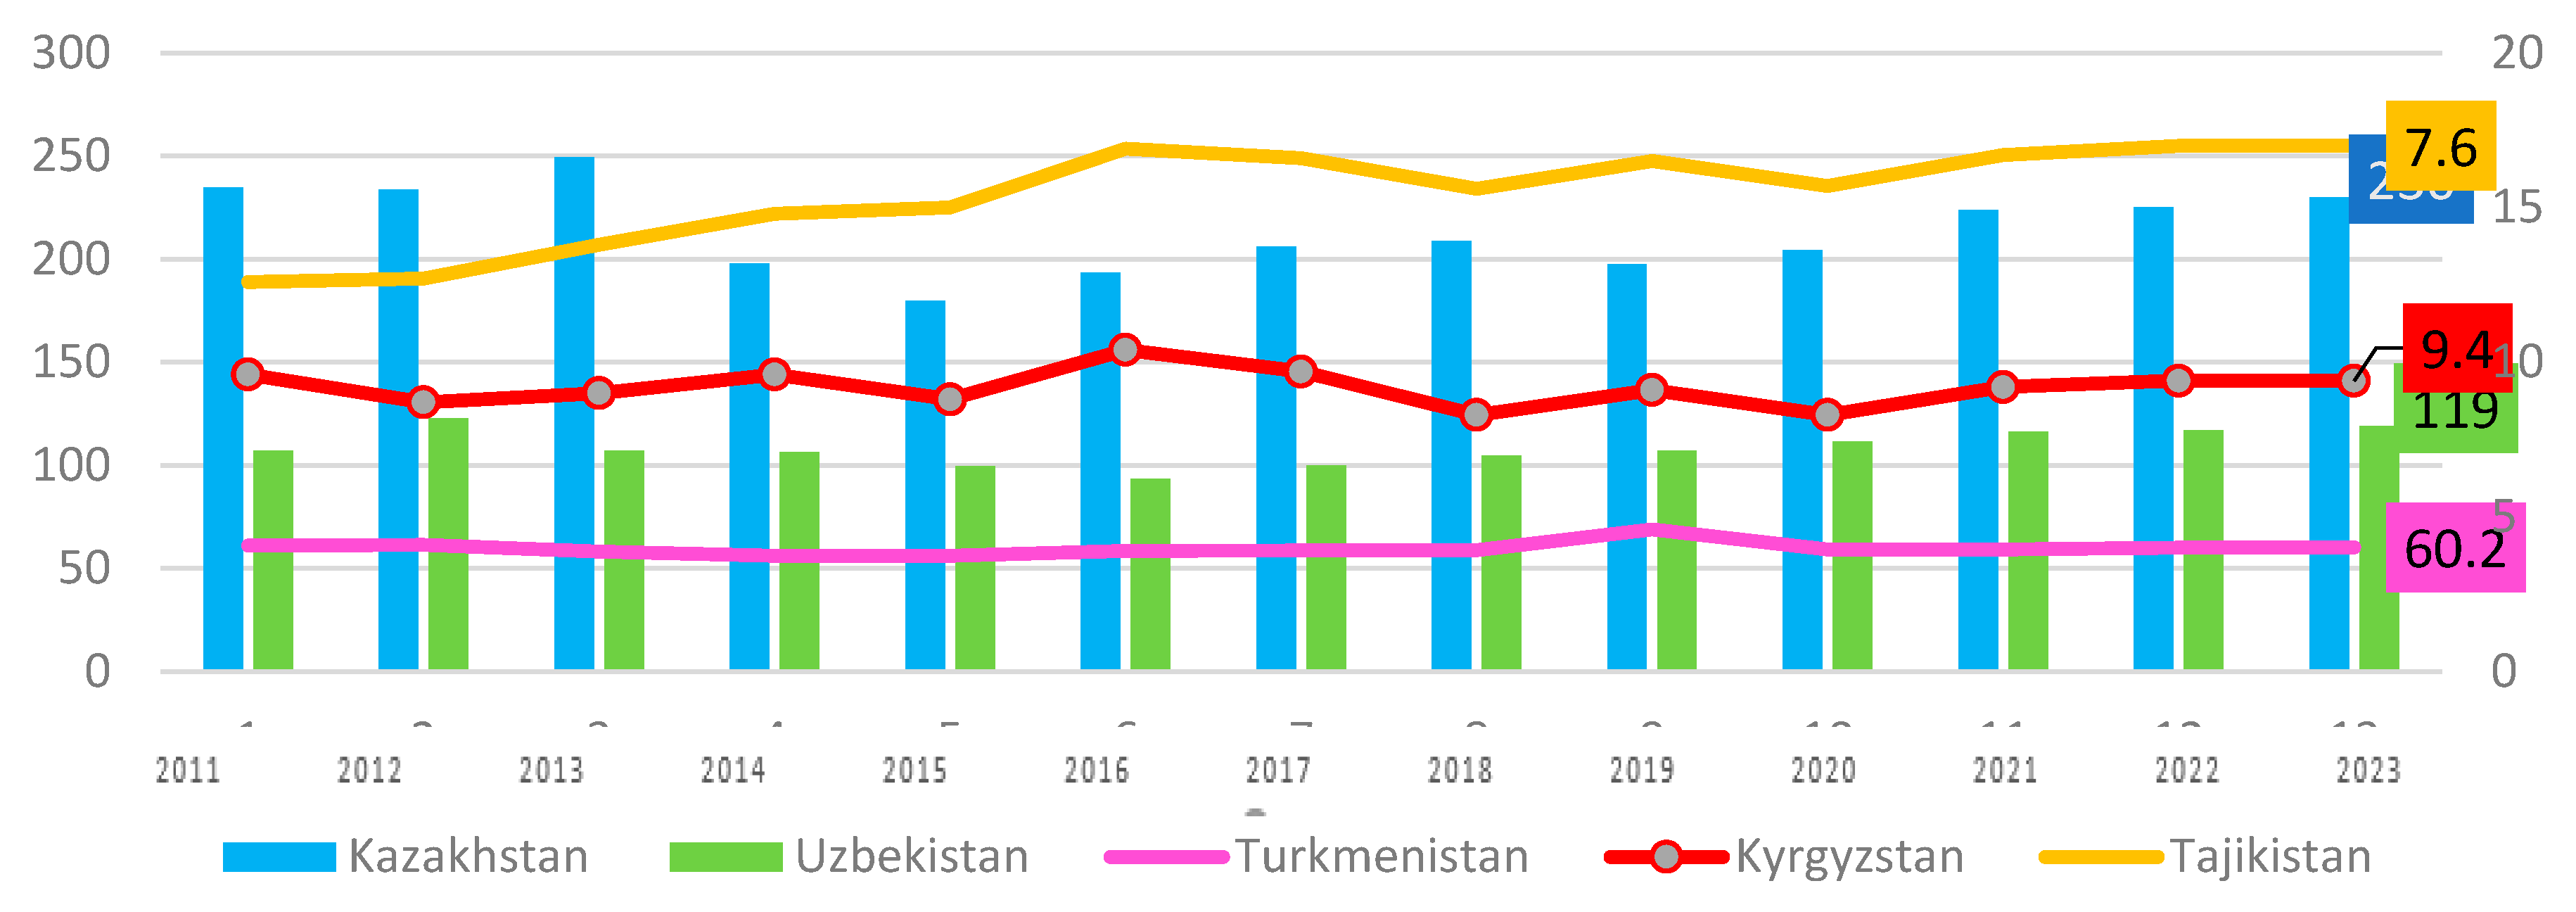
Figure 10.
CO2 emissions in CACs, 2020. Source: UNECE Data Portal, https://w3.unece.org/SDG/ru/Indicator?id=28, built in the program based on ArcMap 10.8 software.
Figure 10.
CO2 emissions in CACs, 2020. Source: UNECE Data Portal, https://w3.unece.org/SDG/ru/Indicator?id=28, built in the program based on ArcMap 10.8 software.
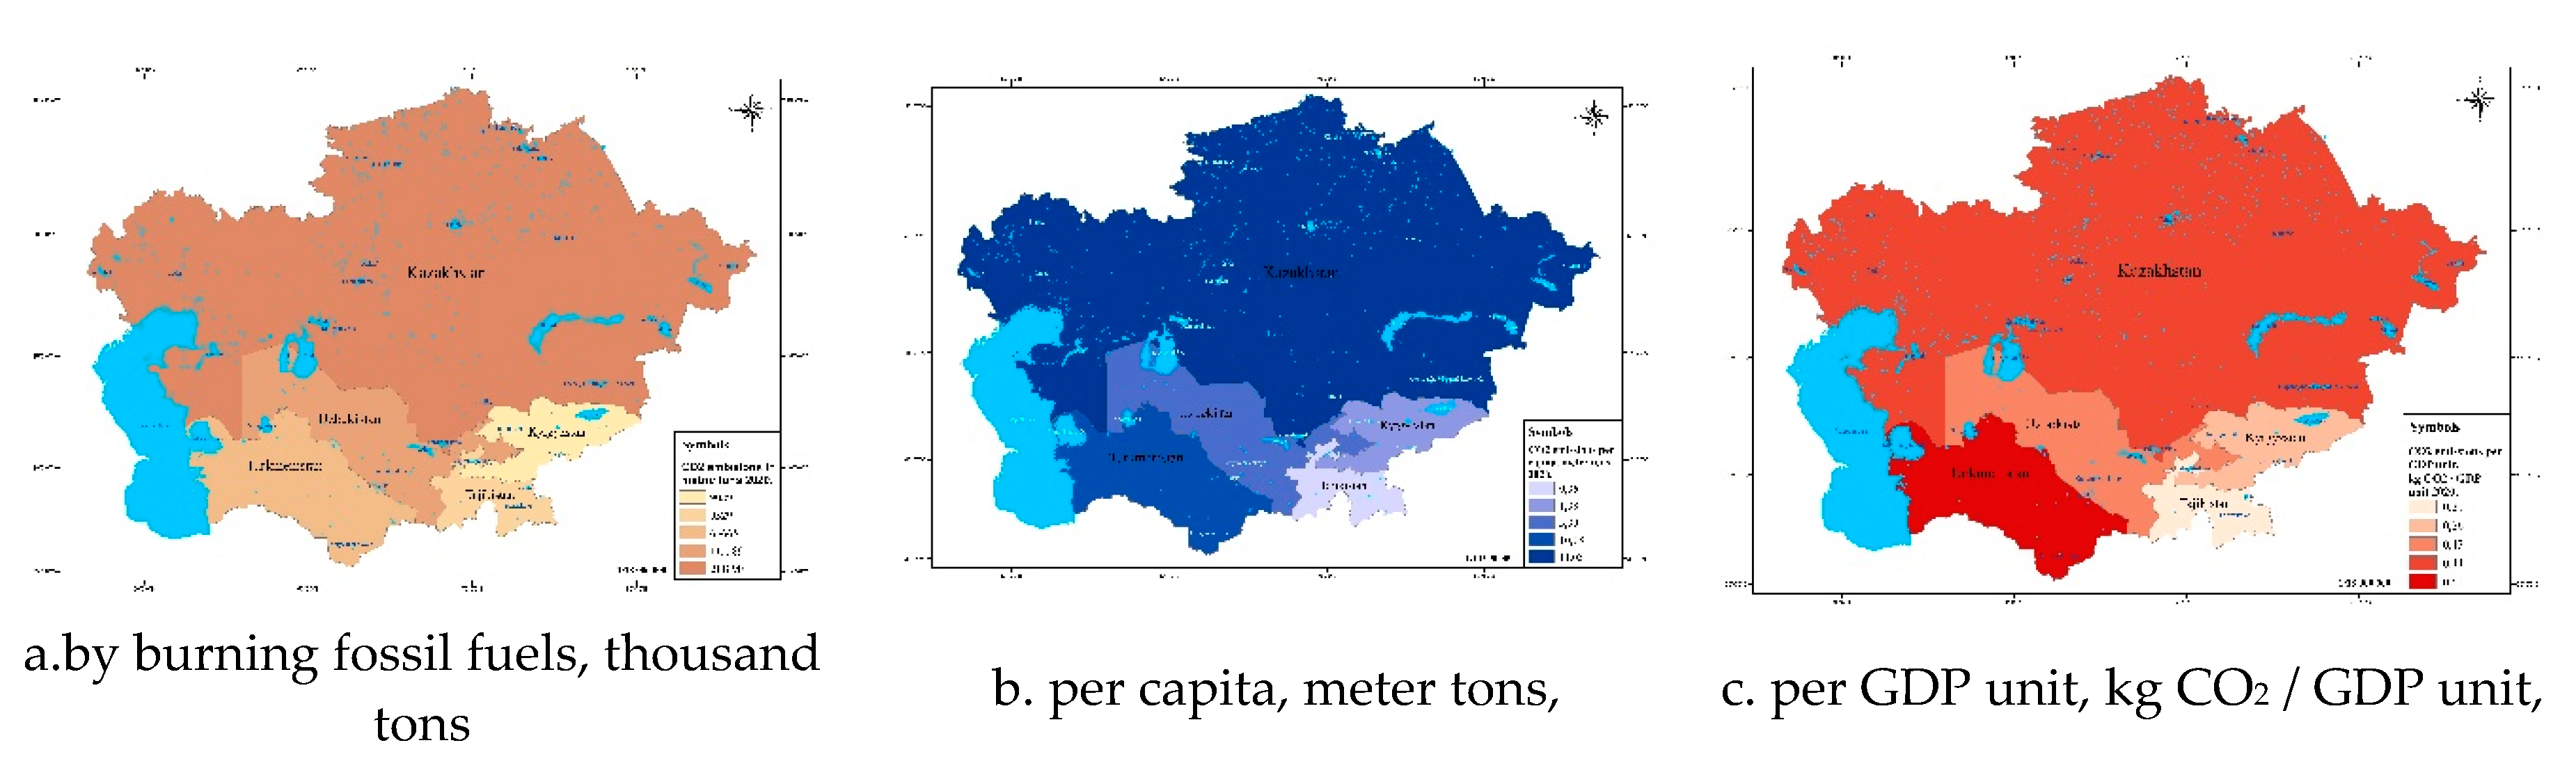
Figure 11.
PM2.5 emissions in CACs from 1990 to 2024, thousand tons Data Source: compiled based on https://www.researchgate.net/publication/384551972; https://www.worldbank.org/en/country/uzbekistan/publication/air-quality-assessment-for-tashkent; https://www.statista.com/statistics/1223334/cee-air-pollution/; https://www.stateofglobalair.org/air/pm. The data is approximate and may vary depending on sources.
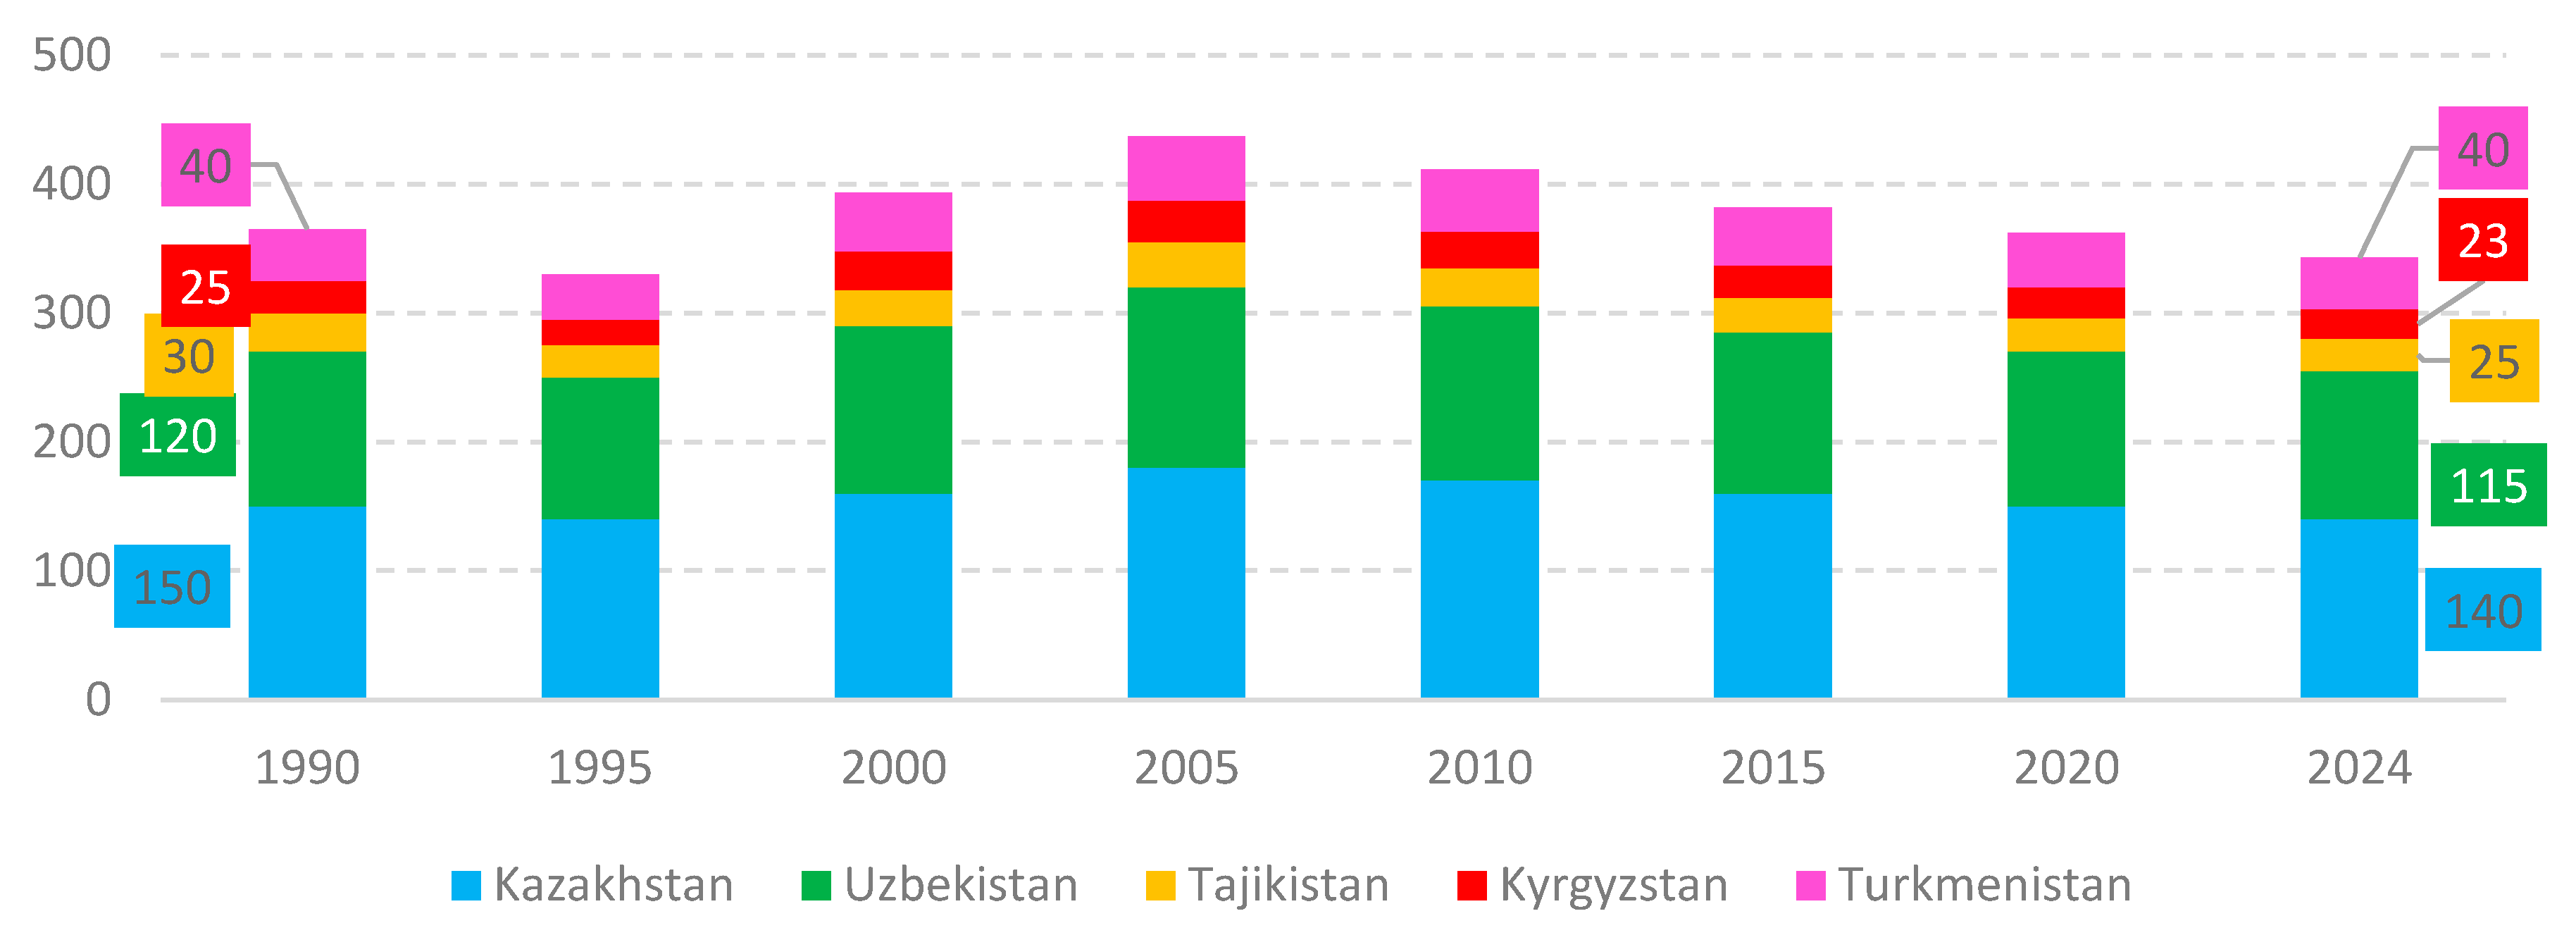
Figure 12.
Air pollution: average annual concentration of PM2.5 in CACs(μg/m3), 2020. *Biskek, Almaty, Tashkent, Dushanbe, Ashgabat. Average monthly concentration of PM2.5 (μg/m3), in January,2020 [9]. Data Sourсe: https://data.worldbank.org/assets/images/placeholder.png. Built in the program based on ArcMap 10.8 software.
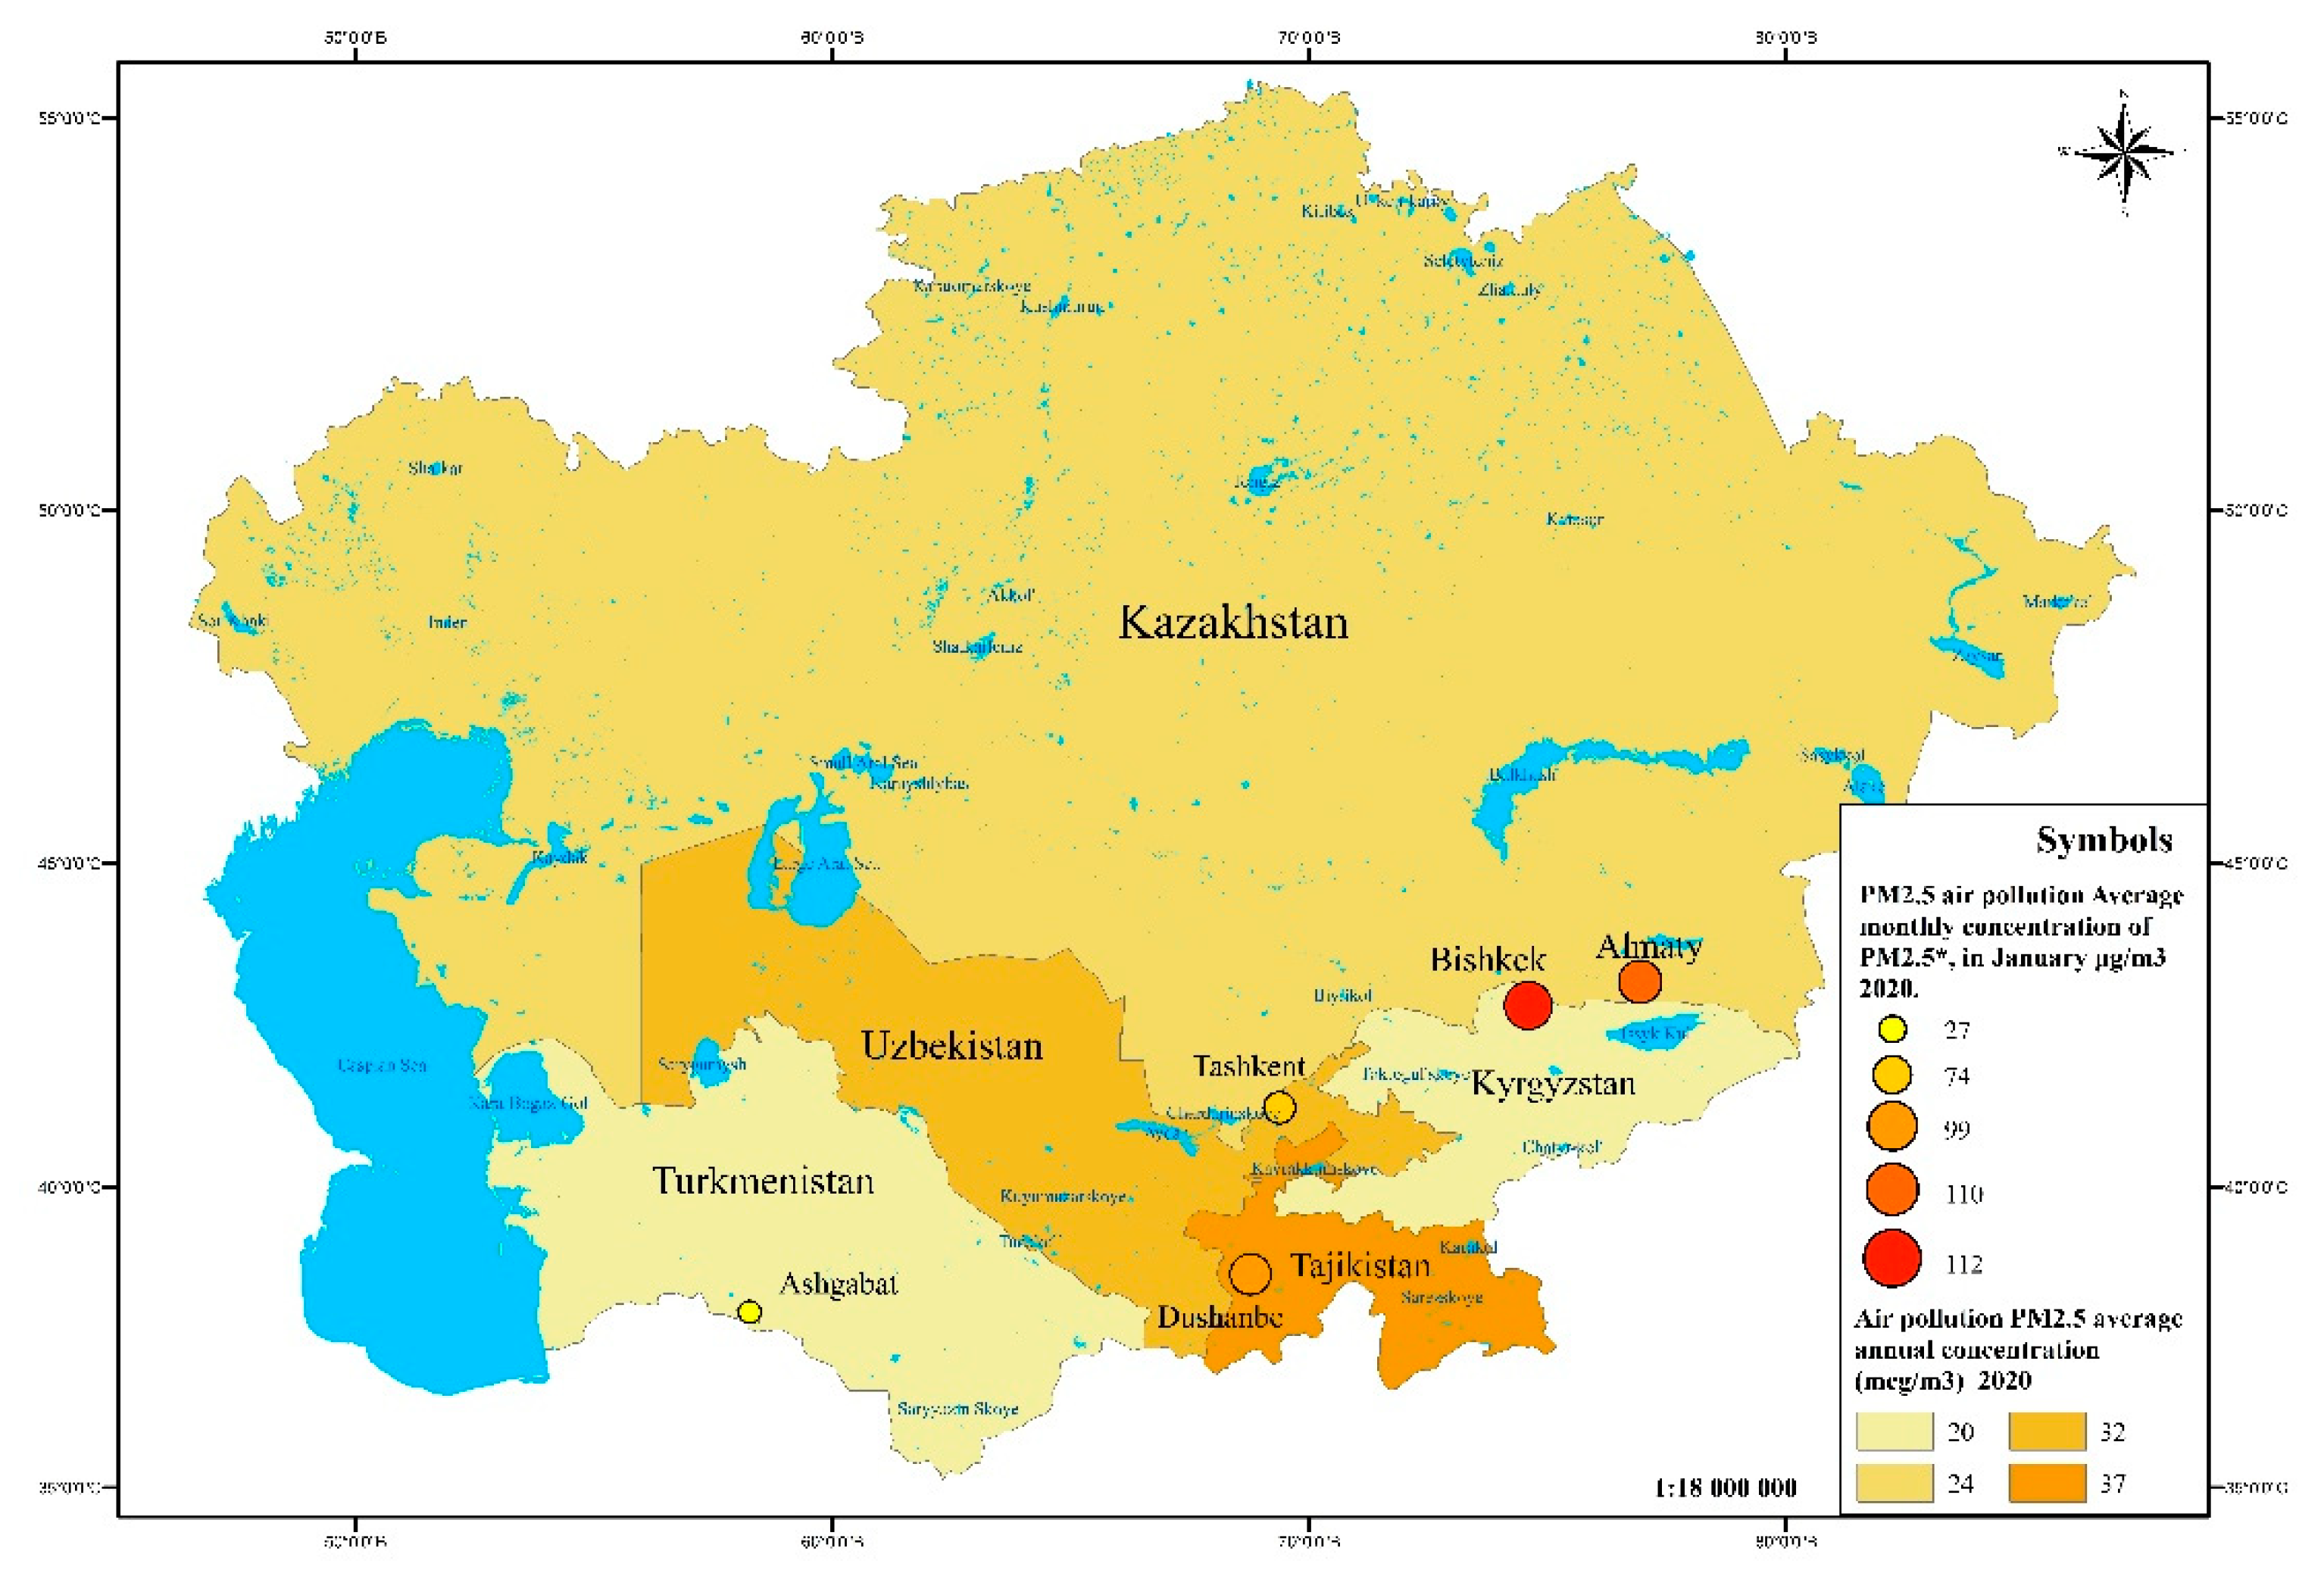
Figure 13.
SO₂ emissions in CACs, thousand tons. Data Source: compiled based on https://ourworldindata.org/grapher/so-emissions-by-world-region-in-million-tonnes, https://dnr.mo.gov/air/hows-air/pollutants-sources/sulfur-dioxide. The data is approximate and may vary depending on sources.
Figure 13.
SO₂ emissions in CACs, thousand tons. Data Source: compiled based on https://ourworldindata.org/grapher/so-emissions-by-world-region-in-million-tonnes, https://dnr.mo.gov/air/hows-air/pollutants-sources/sulfur-dioxide. The data is approximate and may vary depending on sources.
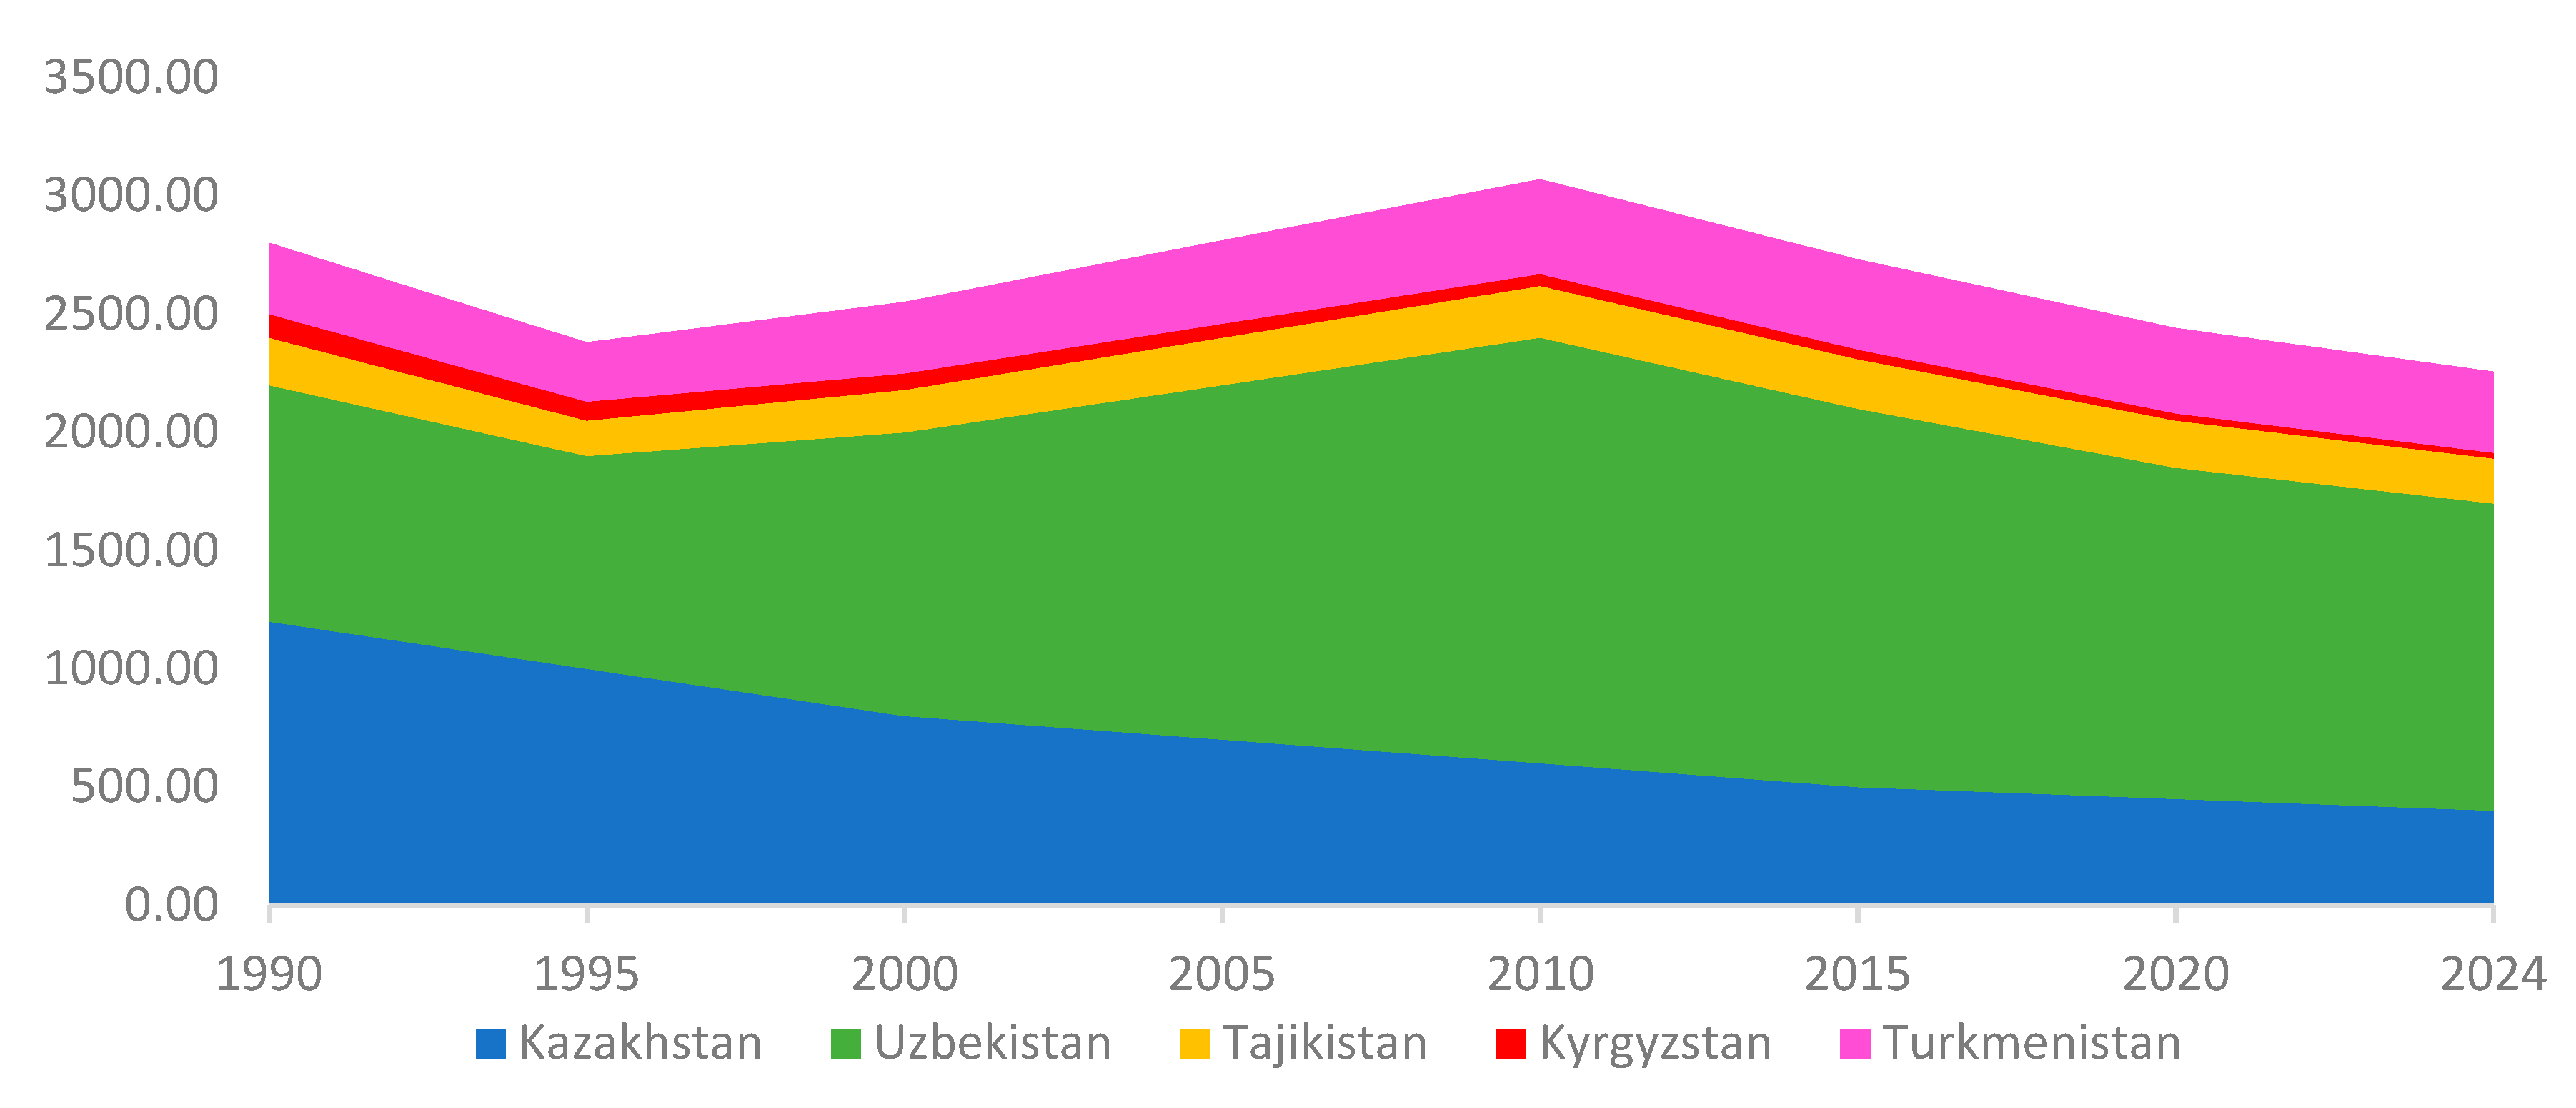
Figure 14.
3D visualization of the correlation matrix Note: built in R based on research data.
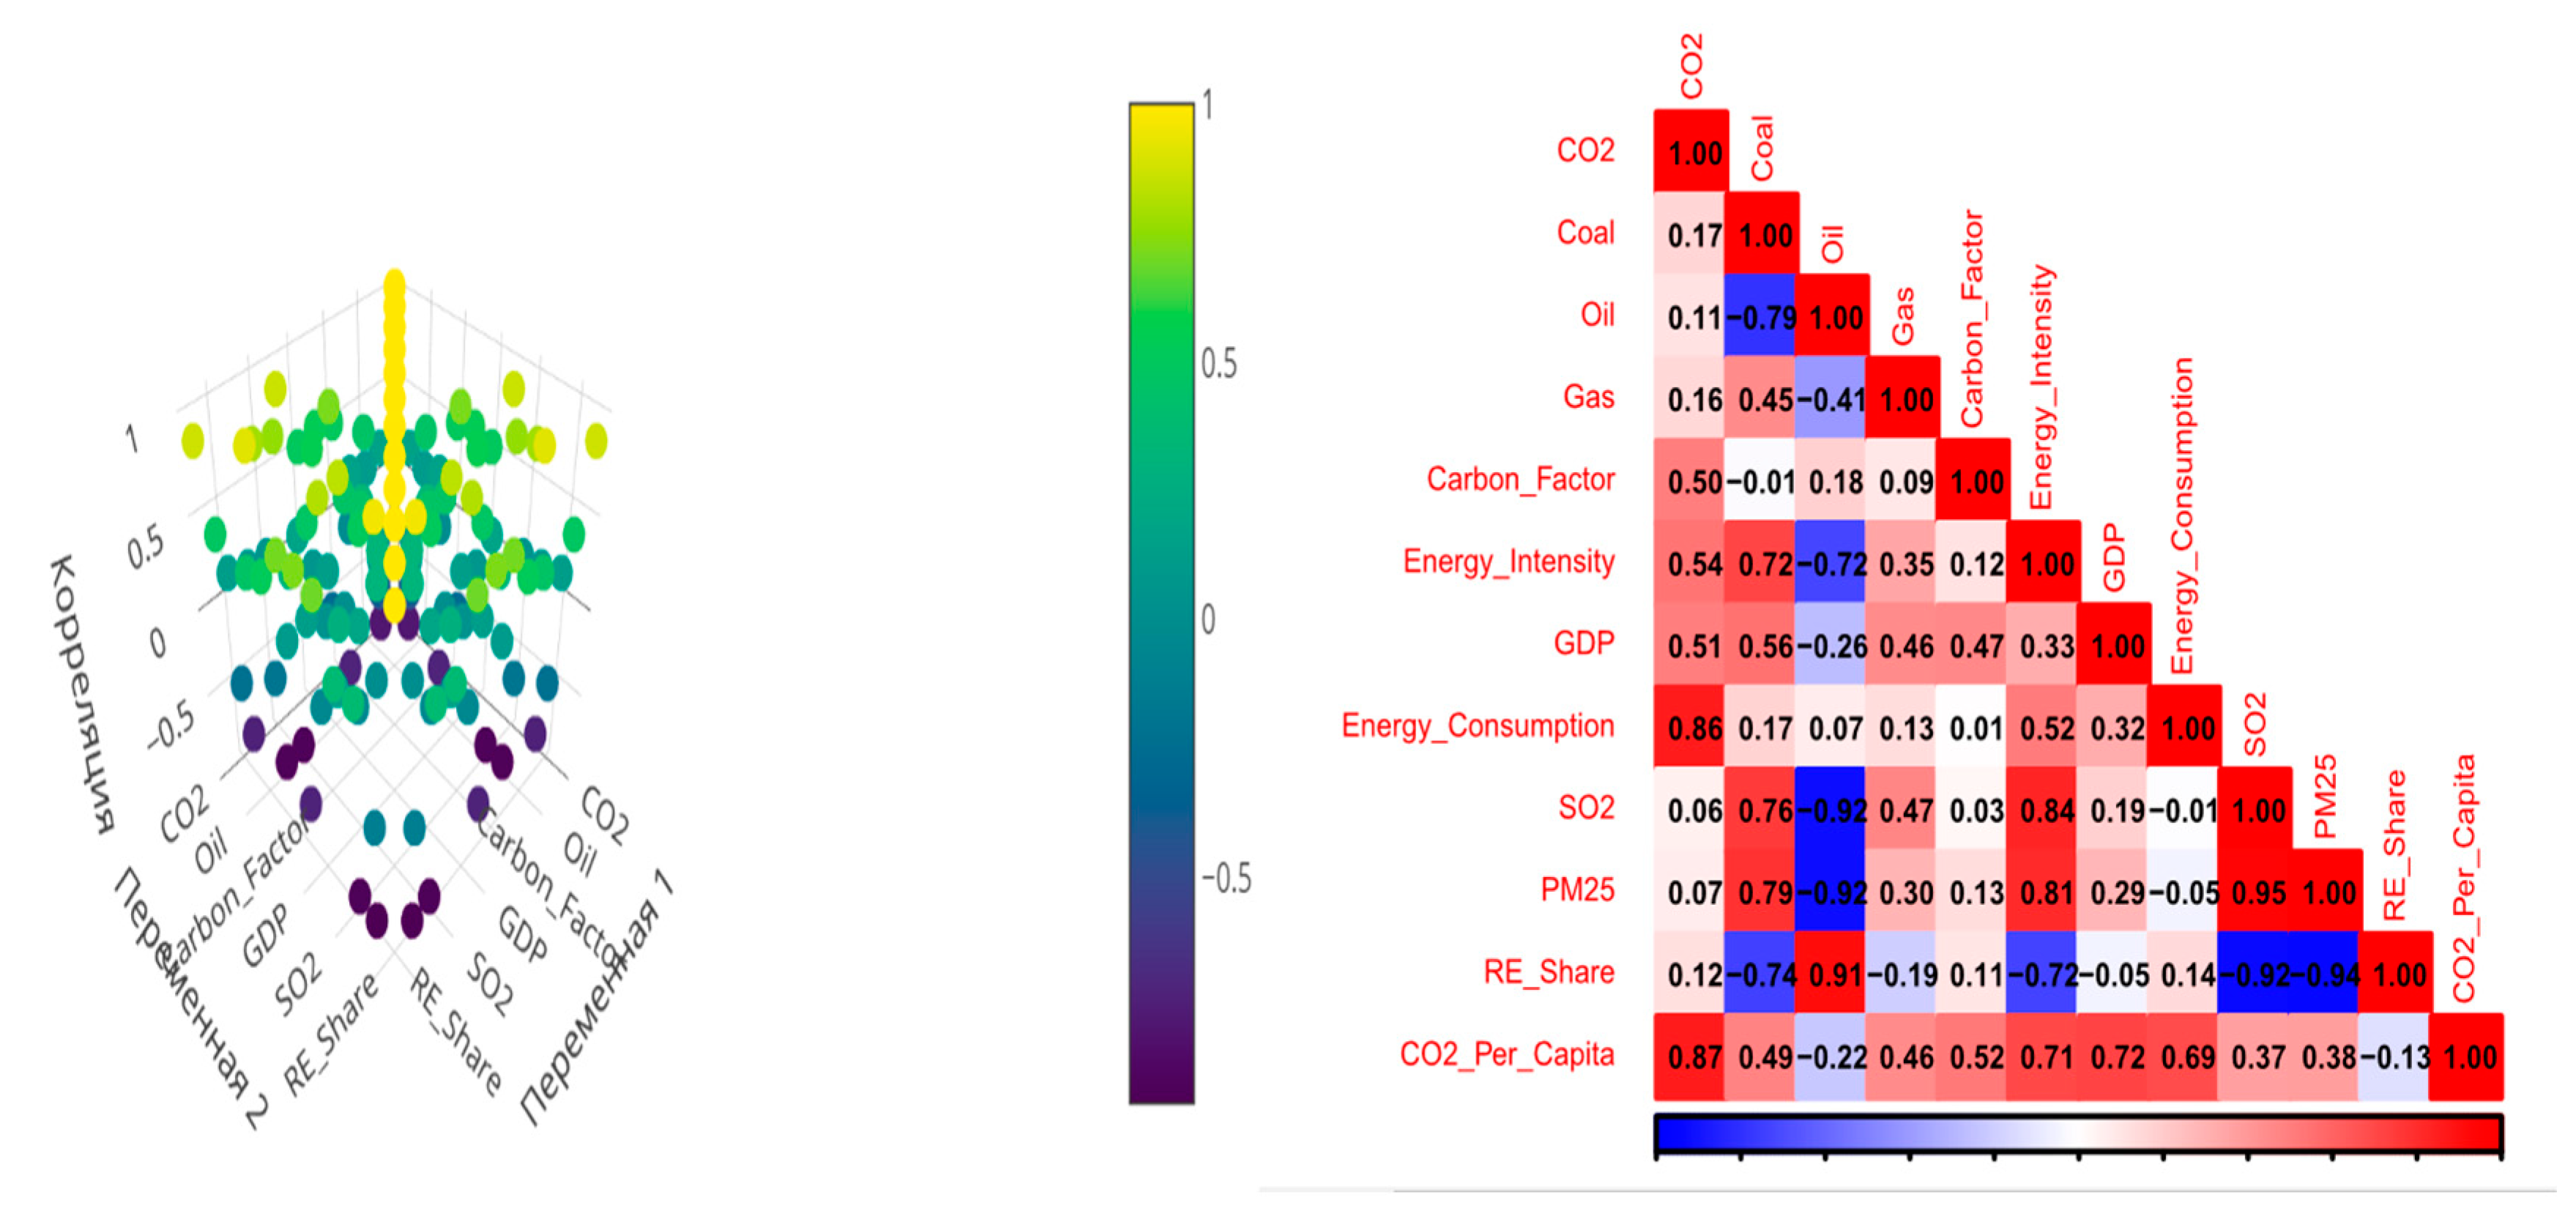
Table 2.
Description of RE-model data after adjustment with robust standard errors.
| Variable | Evaluation of the coefficient | Standard error | t-statistics | p-value | Significance |
| Intercept (Constant) | -272.71 | 0.0073 | -37348.08 | < 2.2e-16 | *** (very significant) |
| Energy_Consumption | 3.124 | 0.0006 | 4827.32 | < 2.2e-16 | *** (very significant) |
| GDP | -0.0326 | 0.00012 | -267.65 | < 2.2e-16 | *** (very significant) |
| Coal Consumption | 0.1467 | 0.00038 | 384.13 | < 2.2e-16 | *** (very significant) |
| Carbon_Factor | 85.243 | 0.0131 | 6478.36 | < 2.2e-16 | *** (very significant) |
Table 3.
Scenarios of change in factors for Kazakhstan.
| Indicator | 2024 | 2025 | 2026 | 2027 | 2028 | 2029 | 2030 | Kazakhstan (2023) |
| Energy_Consumption | 1.50% | 1.20% | 1.00% | 0.80% | 0.70% | 0.50% | 0.30% | 88.0 |
| GDP | 3.00% | 3.20% | 3.50% | 3.30% | 3.10% | 3.00% | 2.80% | 262.4 |
| Coal Consumption | -1.00% | -1.50% | -2.00% | -2.50% | -3.00% | -3.50% | -4.00% | 74.0 |
| Carbon_Factor | -0.50% | -1.00% | -1.20% | -1.50% | -1.80% | -2.00% | -2.50% | 3.23 |
Table 4.
Forecast for Kazakhstan (manual algorithm for filling in the forecast table).
| Гoд | Энергoпoт-ребление | ВВП | Пoтребление угля | Углерoдoемкoсть | Расчет прoгнoзных выбрoсoв CO₂, млн.т |
| 2024 | 88.0×1.015= 89.32 | 262.4×1.03= 270.272 | 74.0×0.99= 73.267 | 3.23×0.995=3.214 | −272.71+(3.124×89.32)−(0.0326×270.272)+ (0.1467×73.267)+(85.243×3.214)= 282.23 |
| 2025 | 89.32×1.012=90.392 | 270.272×1.032=278.921 | 73.26×0.985=72.177 | 3.214×0.99=3.182 | −272.71+(3.124×90.392)−(0.0326×278.921)+(0.1467×72.177)+(85.243×3.182)= 282.41 |
| 2026 | 90.392×1.01=91.296 | 278.921×1.035=288.683 | 72.17×0.98= 70.737 | 3.182×0.988=3.144 | −272.71+(3.124×91.296)−(0.0326×288.683)+(0.1467×70.73)+(85.243×3.144)= 281.47 |
| 2027 | 91.30 × 1.008 = 92.03 | 288.68 × 1.033 = 298.23 | 70.73 × 0.975 = 68.94 | 3.144 × 0.985 =3.097 | −272.71+(3.124×92.03)−(0.0326×298.23)+(0.1467× 68.94)+(85.243×3.097)=280.25 |
| 2028 | 92.03 × 1.007 = 92.68 | 298.23 × 1.031 = 307.48 | 68.94 × 0.97 = 66.87 | 3.097 × 0.982 =3.048 | −272.71+(3.124×92.68)−(0.0326×307.48)+(0.1467× 66.87)+(85.243×3.048)=278.93 |
| 2029 | 92.68 × 1.005 = 93.14 | 307.48 × 1.030 = 316.70 | 66.87 × 0.965 = 64.50 | 3.048 × 0.980 =2.987 | −272.71+(3.124×93.14)−(0.0326×316.7)+(0.1467× 64.5)+(85.243×2.987)=277.55 |
| 2030 | 93.14 × 1.003 = 93.42 | 316.70 × 1.028 = 325.59 | 64.50 × 0.96 = 61.92 | 2.987 × 0.975 =2.913 | −272.71+(3.124×93.42)−(0.0326×325.59)+(0.1467× 61.92)+(85.243×2.913)=275.87 |
Disclaimer/Publisher’s Note: The statements, opinions and data contained in all publications are solely those of the individual author(s) and contributor(s) and not of MDPI and/or the editor(s). MDPI and/or the editor(s) disclaim responsibility for any injury to people or property resulting from any ideas, methods, instructions or products referred to in the content. |
© 2025 by the authors. Licensee MDPI, Basel, Switzerland. This article is an open access article distributed under the terms and conditions of the Creative Commons Attribution (CC BY) license (http://creativecommons.org/licenses/by/4.0/).
Copyright: This open access article is published under a Creative Commons CC BY 4.0 license, which permit the free download, distribution, and reuse, provided that the author and preprint are cited in any reuse.


