Preprint
Article

This version is not peer-reviewed.

Refractive Index Measurement and Sensing Characteristics of Gold-Coated Three-Core Photonic Crystal Fiber

Submitted:

04 March 2025

Posted:

04 March 2025

You are already at the latest version

Abstract

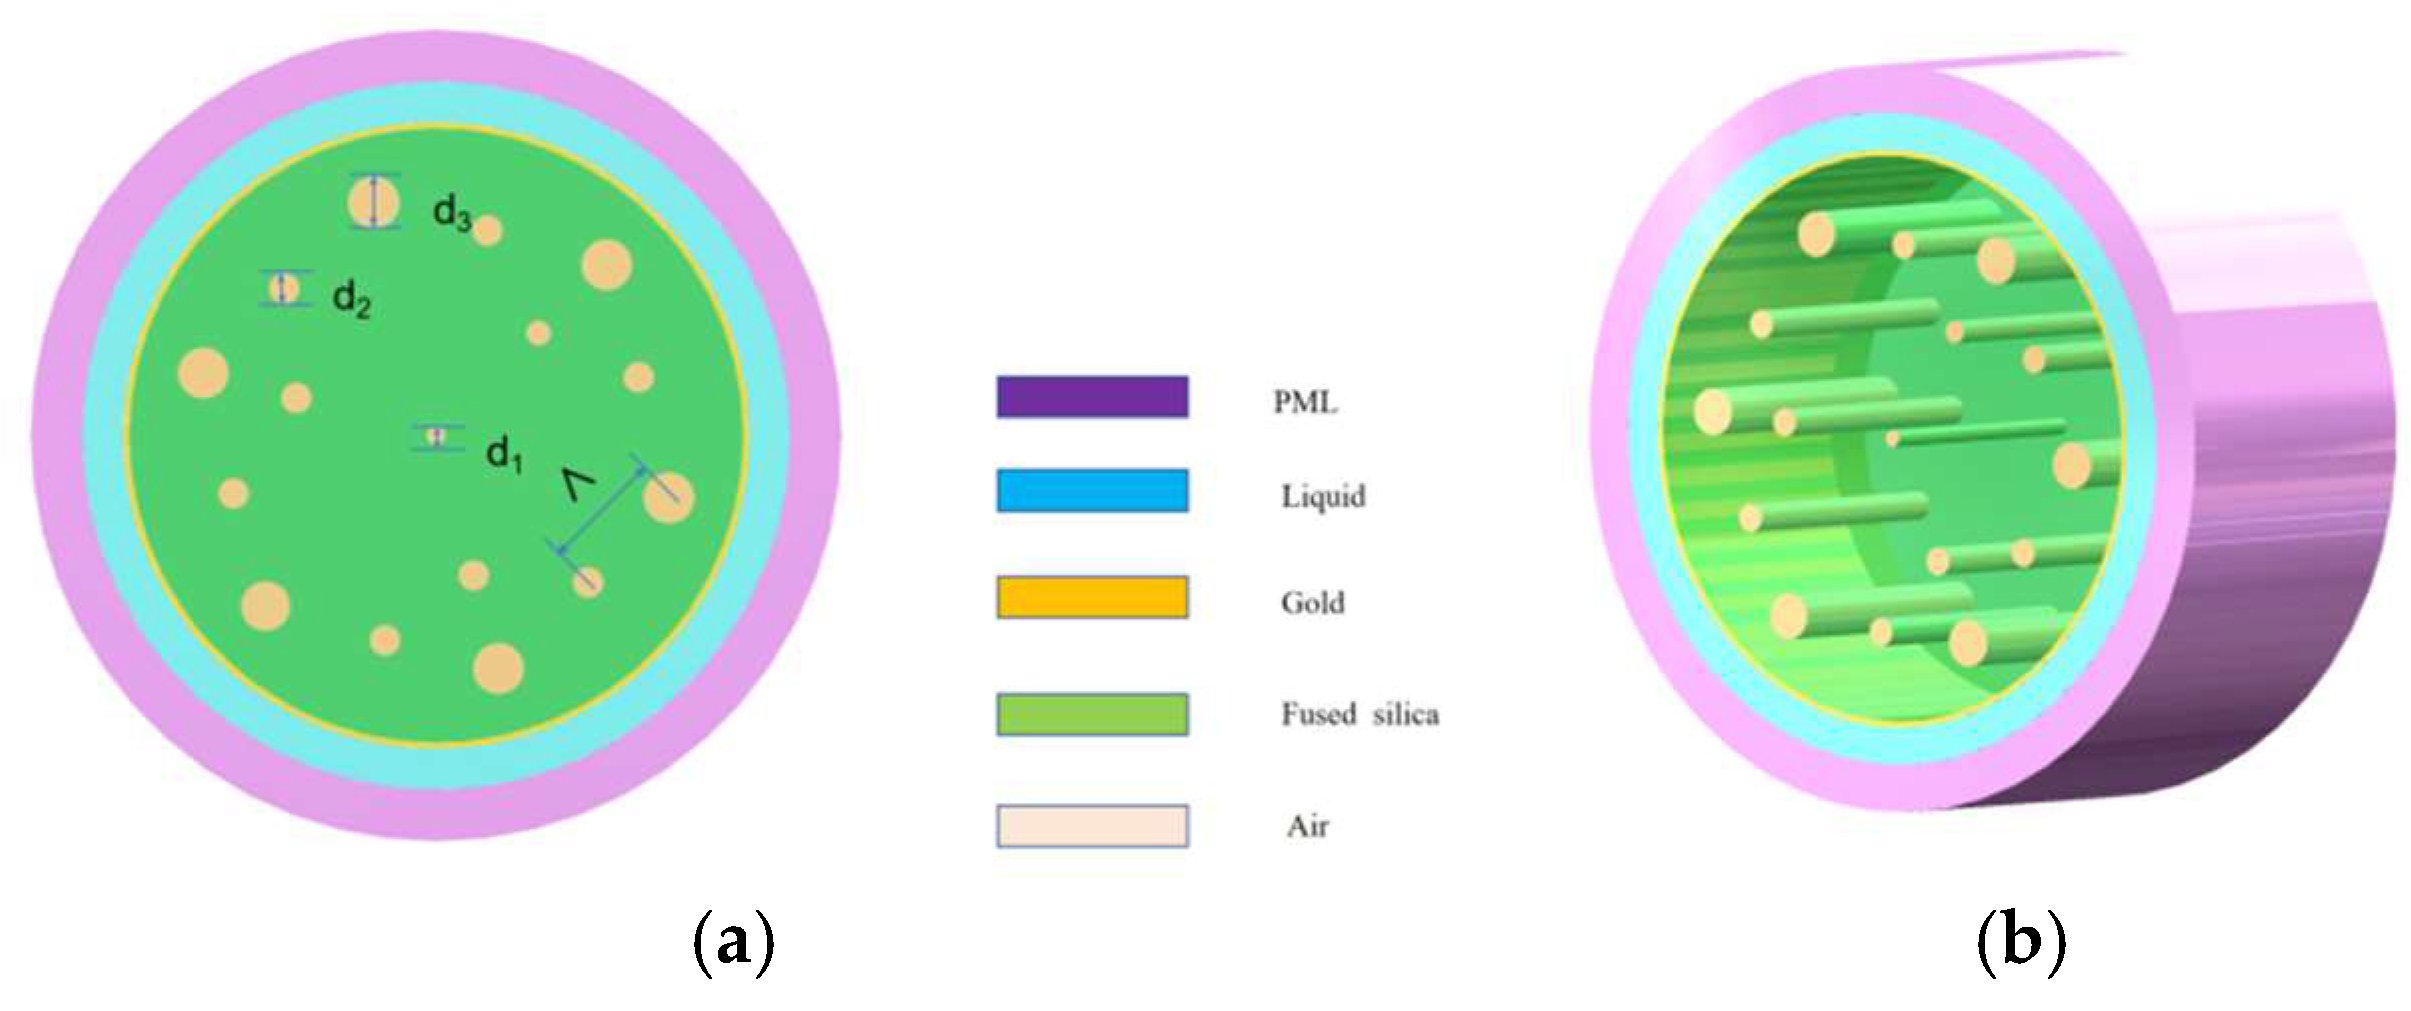
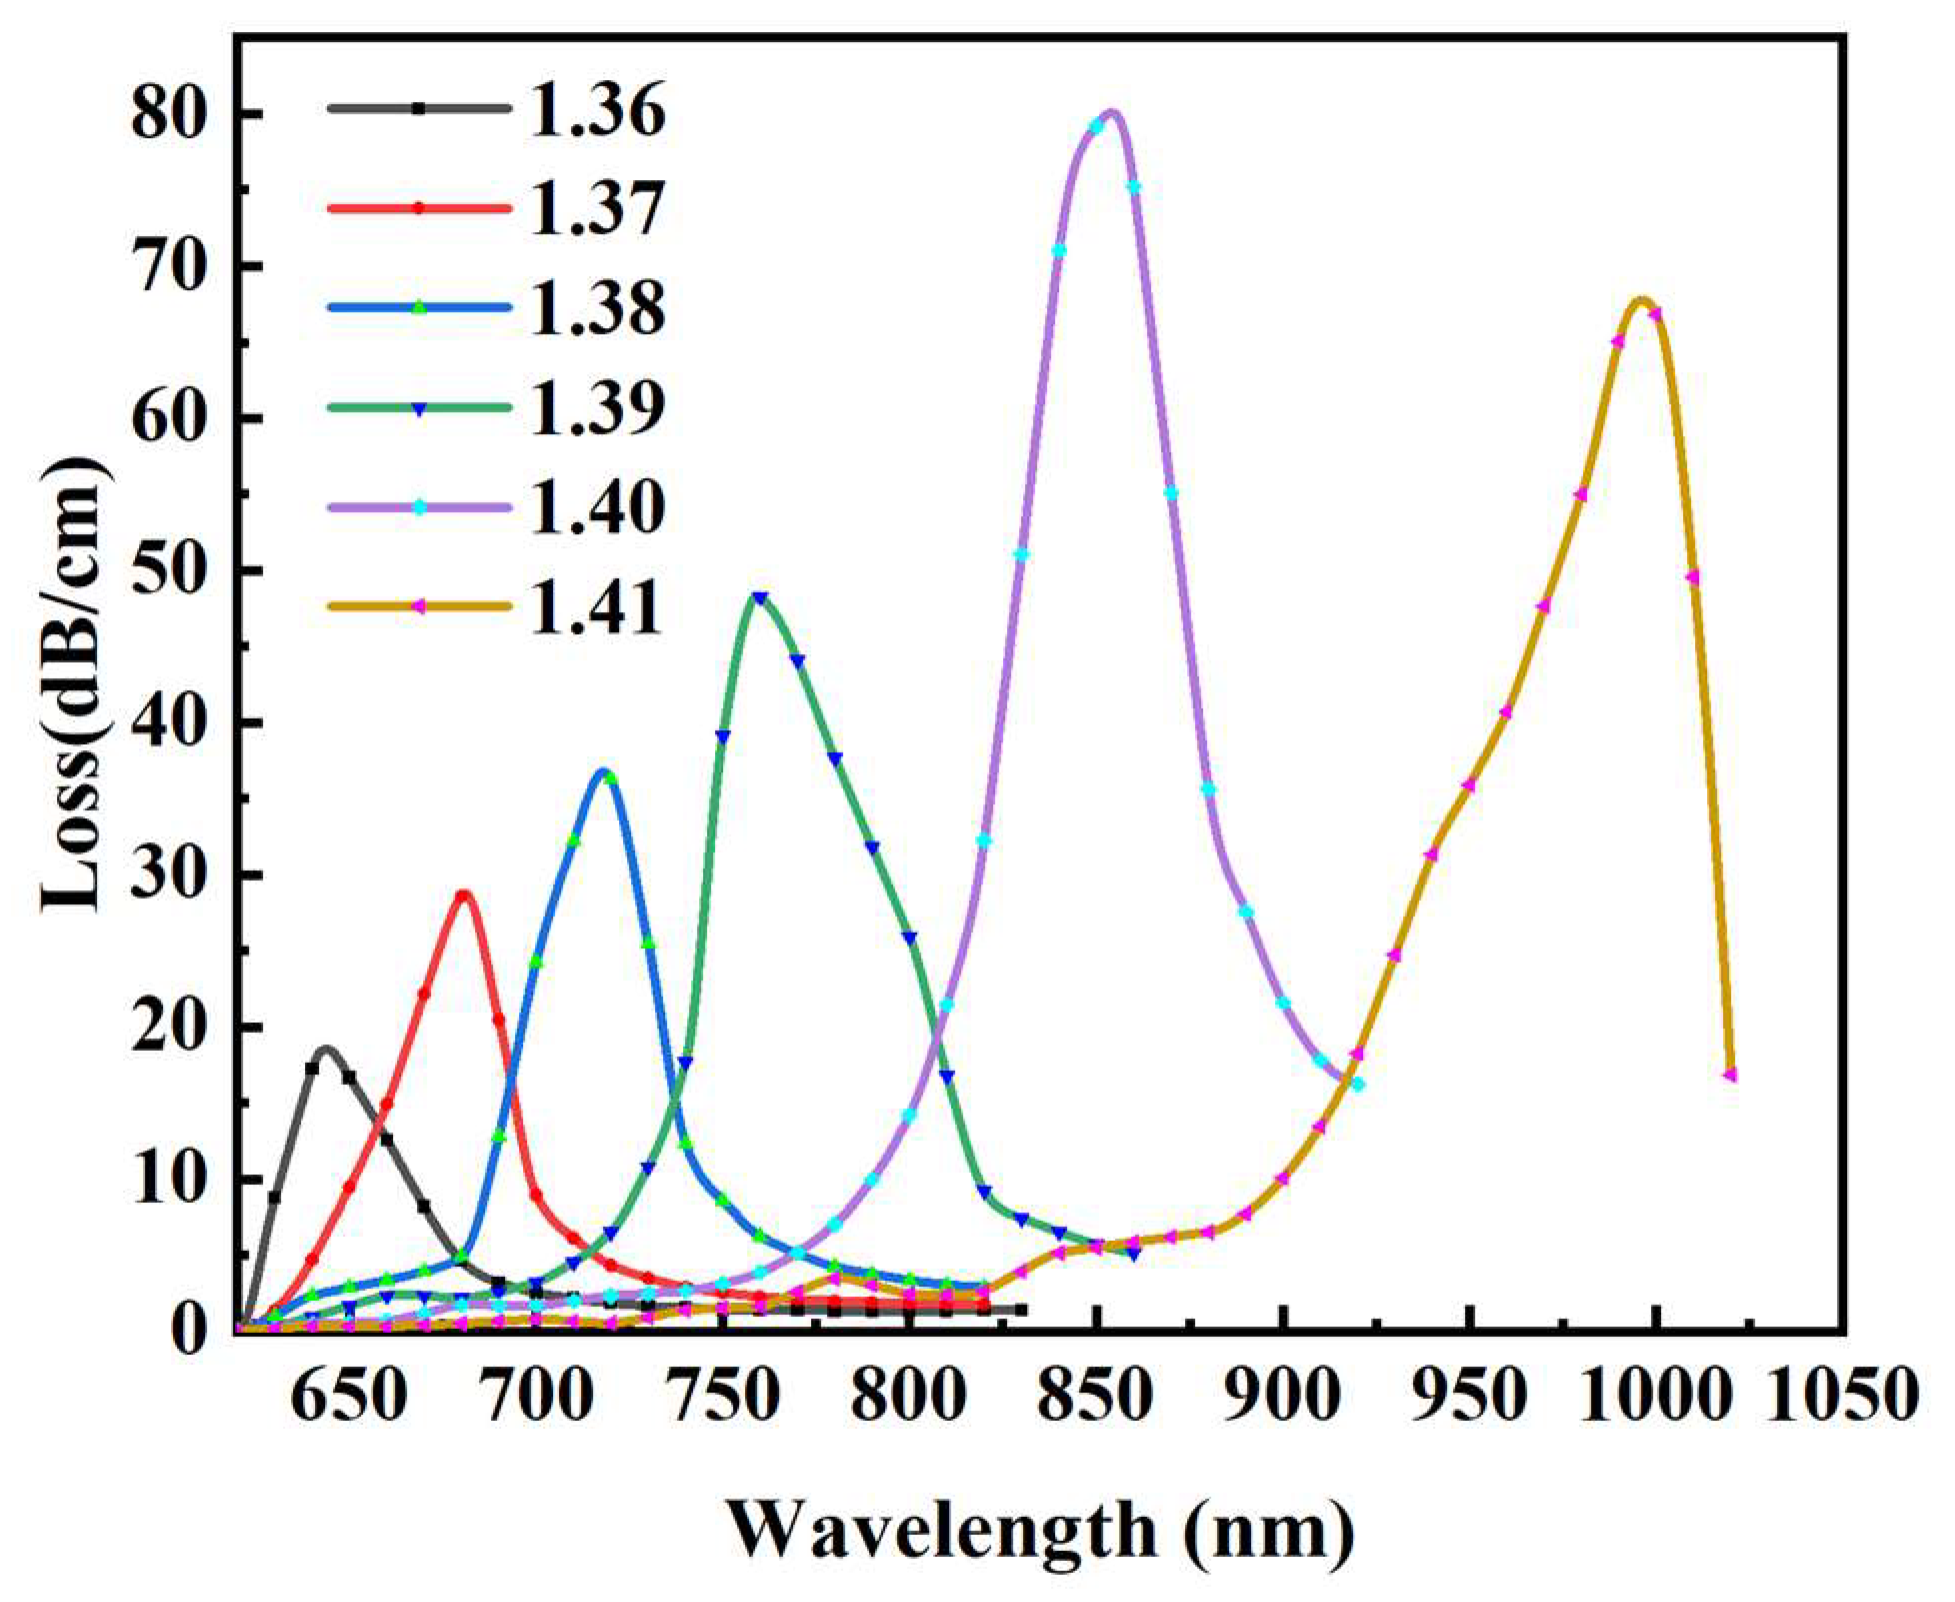
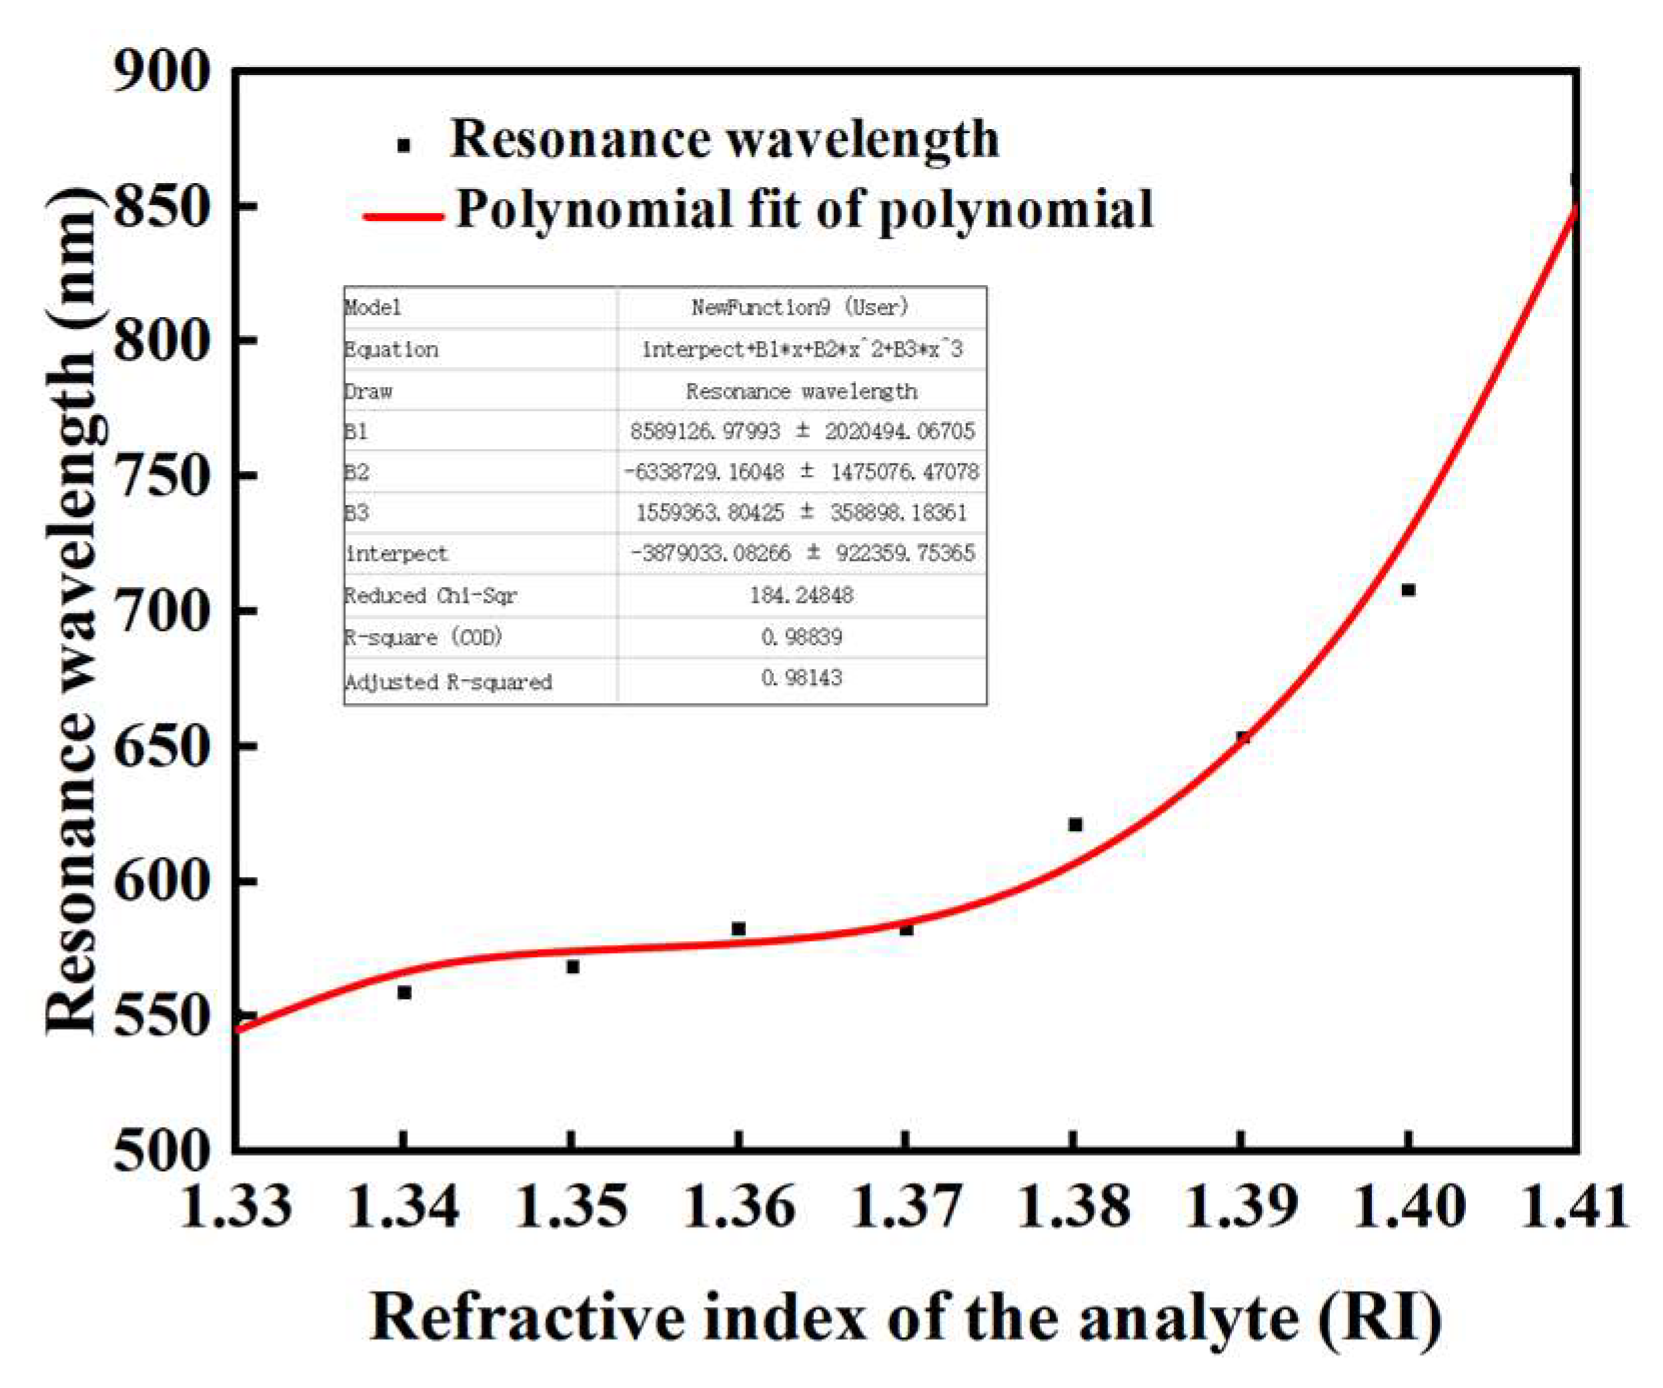
A symmetric three-core photonic crystal fiber optic sensor based on a gold film is presented, aiming to accurately measure the refractive index and evaluate its sensing characteristics. This sensor adopts the design of covering a gold film on a photonic crystal fiber, in which the fiber contains air holes of three different diameters. The performance of the sensor was analyzed by numerical simulation through the full vector finite element method. The results show that the sensor performance can be significantly affected by adjusting the diameter of the air holes and the thickness of the gold film. The sensor performs particularly well when the refractive index (RI) of the substance to be measured is in the range of 1.36 to 1.41, especially when the RI is 1.41. It has a maximum limiting loss value of 75 dB cm-1, a maximum amplitude sensitivity of 421 nm RIU-1, and a finest resolution of 6.67 × 10⁻⁶ RIU.These characteristics are essential for scientific research and industrial use where a high degree of accuracy is sought. This study not only provides a novel perspective on the design of three-core photonic crystal fibers, but also lays a solid foundation for the future development and optimization of fiber optic sensor technology. This innovation using gold films may inspire the development of more high-performance sensors and further expand the application areas of photonic crystal fiber technology. As the performance of sensors continues to improve, the prospects for commercialization of related technologies will become brighter. High-performance sensors are expected to be widely used in emerging industries such as smart manufacturing, automated monitoring systems and the Internet of Things, giving a strong boost to the development of these fields. The use of gold films demonstrates the possibility of applying new materials in fiber-optic sensors, and other types of metals or composites may be explored in the future to achieve even higher performance enhancements. With the advancement of sensor technology, they will be more widely used in a number of fields, contributing to the technological innovation and growth of related industries.

Keywords: 
;  ;  

1. Introduction

Since the 1960s, fiber optic technology has gradually matured along with advances in the communications industry. Initially, fiber optics was mainly used for data transmission, but its unique properties soon made researchers realize its great potential in the field of sensing. Fiber optic sensors have been widely used in many industries due to their excellent resistance to electromagnetic interference, good corrosion resistance, compact size, economical cost and easy integration with other systems.[1]Depending on the principle of operation, fiber optic sensors can be classified into several categories, such as fiber Bragg grating (FBG) sensors, fiber optic Fabry-Perot interferometers (FPIs), fiber optic Mach-Zönder interferometers (MZIs), and fiber optic surface plasmon resonance (SPR) sensors.[2]In recent years, the emergence of Photonic Crystal Fiber (PCF) marks a major leap in fiber optic technology, which not only overcomes some of the limitations of traditional optical fibers, but also opens up a new path for further enhancement of optical fiber performance through its unique microstructural design.The microstructural design of PCF allows for adjusting the geometry of the air holes inside the fiber, spacing, diameter, and arrangement of the air holes inside the fiber to customize the fiber device with specific optical properties, which greatly expands the functionality and application scope of the fiber device. In particular, the SPR effect, as a special optical phenomenon, occurs at the interface between a transparent medium and a metal. In this process, an incident electromagnetic wave can generate a swift field on the metal surface, and this swift field interacts with free or bound electrons on the metal surface, resulting in the transfer of electromagnetic wave energy of a specific wavelength to the electrons, which triggers the resonance of the electrons. Since the wavelength of the electromagnetic wave interacting with the electrons is affected by the optical properties of the external environment, highly sensitive detection of changes in the external environment can be realized by monitoring the changes in the transmission spectrum of the SPR sensor. This technology shows great application value in biomedical detection, environmental monitoring and other fields. In conclusion, fiber optic technology and its applications in the field of sensing are constantly moving forward, providing strong support for solving various scientific and engineering problems. With the continuous progress of technology, we have reason to believe that fiber optic sensors will play its unique advantages in more fields.[3]
In 2021, YAN et al. designed a high sensitivity SPR refractive index sensor based on PCF, with an average spectral sensitivity of up to 14771.4 nm/RlU and a maximum spectral sensitivity of 18000.5 nm/RIU in the refractive index range of 1.47-1.52. It is suitable for detecting environments with small changes in refractive indices, especially for high refractive index mediums (such as certain chemicals or biological fluids). However, it is only effective in the high refractive index range (1.47-1.52), limiting its application in low refractive index environments.2022, in the field of sensing, the JAIN team has innovatively constructed an SPR refractive index sensor, which has achieved a breakthrough of 10,000 nm/RIU in spectral sensitivity. Unlike conventional SPR sensors, the sensitivity was improved by the novel design, which pushed the refractive index sensing technology forward. Compared with the design of YAN et al. the sensitivity is slightly lower, limiting the application in ultrafine detection. Following closely, a new PCF sensor model corresponding to transverse magnetic and transverse electric waves with spectral sensitivities of 10,000 nm/RIU and 11,000 nm/RI, respectively, was also proposed by Shakya et al. The ability to detect TM and TE modes with sensitivity increases the applicability of the sensor in different wave modes. The overall sensitivity is slightly lower compared to the design of YAN et al.[4]In 2022, JA0 et al. designed a new PCF refractive index sensor. The average spectral sensitivity reached 5413.3 nm/RlU in the refractive index range of 1.330-1.370, and 11400 nm/RI in the refractive index range of 1.365-1.370. In the lower refractive index range (1.330-1.370), it exhibits moderate sensitivity, which is suitable for medium refractive index detection. However, compared with high sensitivity designs (e.g., YAN et al.), JA0 has low sensitivity and is not suitable for scenarios requiring ultra-high accuracy.2023 Wang et al. proposed a seven-core SPR-PCF sensor that combines the advantages of multi-core fiber and SPR, with a sensitivity of 1644 nm/RIU in an Rl range of 1.34-1.37. Its multi-core structure enhances the sensitivity Its multi-core structure enhances the sensitivity and stability, which is suitable for a wider range of scene applications. The seven-core structure enhances the robustness of signal transmission. Lower sensitivity compared to other designs may not be suitable for fine detection.[5]Each of these designs has its own strengths, with the design by YAN et al. excelling in high refractive index and high sensitivity applications, while the design by Wang et al. focuses more on robustness and multi-core structure applications; and the designs by JA0, JAIN, and SHAKYA showing varying degrees of innovation in the low to medium refractive index range.
This paper presents an innovative sensor design, a symmetric three-core photonic crystal fiber (PCF) sensor based on a gold film, aimed at improving the sensitivity and overall performance of the sensor. This design introduces a new structural configuration that provides a new direction for the development of photonic crystal fiber sensors. Through numerical simulations using the full vector finite element method, the study provides a solid theoretical basis for the analysis of the sensor performance. This method is able to solve complex optical problems efficiently and ensure the high reliability and accuracy of the simulation results.
Specifically, the optical characteristics of the sensor are effectively improved by coating the outer surface of the PCF with a gold film to stimulate surface plasmon resonance (SPR), which is combined with the optimized tuning of the air hole parameters and the thickness of the gold film. This design allows the sensor to exhibit higher sensitivity in different refractive index ranges, which can better meet the needs of specific applications and support the personalized development of sensors. The study not only examines the spectral sensitivity but also evaluates the amplitude sensitivity, which comprehensively demonstrates the performance of the sensor under multiple measurement conditions.[6]The results show that the sensor has excellent performance in both spectral sensitivity and amplitude sensitivity, and is not only suitable for refractive index measurement, but also expected to be extended to a variety of sensing applications, such as temperature, pressure and chemical composition detection, showing a wide range of application prospects. This achievement not only provides new ideas for the design of photonic crystal fiber sensors, but also lays the foundation for the development and application of high-performance sensors in the future.[7]The simulation results show that this sensor has high spectral sensitivity and amplitude sensitivity. The average spectral sensitivity of the sensor was 7100 nm RIU-1 in the range of analyte refractive index (RI) of 1.36-1.41, which corresponded to a spectral sensitivity and maximum resolution of 15000 nm RIU-1 and 3.34 × 10⁻⁶ RIU, respectively.

2. Structural Design and Theoretical Model

2.1. Internal Structure Overview

Figure 1(a) shows the schematic diagram of a three-core sensor with silica as the cladding material. Finite element analysis of the model parameters was performed using COMSOL Multiphysics software. The sensor has three fiber optic cores with an angle of 120 degrees between adjacent cores, which consists of three air holes with different diameters. The diameters of the air holes gradually increase from the center to the outside, the diameters of the outermost adjacent air holes are interlaced with each other, the four air holes in the middle are shared by the three fiber cores, and all the air holes are distributed in a regular hexagonal shape around the fiber cores. Among them, the air holes d3 have specific effects on the phase matching and coupling between the fundamental mode and the surface plasmon excitation (SPP) mode. The specific values of the parameters are d1 = 0.4 μm, d2 = 0.6 μm, and d3 = 1 μm. The lattice spacing of the internal air holes is Λ = 2.4 μm, and the diameter of the optical fiber is D1 = 12 μm. where small air holes located at the core position of d1 = 0.4 μm are used to reduce the effective refractive index of the core mode, which improves the sensor sensitivity. In addition, the thickness of the gold film is tg = 40 nm. by chemical and physical methods such as sputtering and high pressure chemical vapor deposition techniques, a metal film can be coated on the polished surface of the PCF and used as a plasma material. Figure 1(b) shows the 3D structure of the PCF-SPR sensor.

2.2. Material Selection and Theoretical Basis

The plasma material is the gold film in this model and the dielectric function of Au is represented by the Drude model:
ε ω = ε 1 + i ε 2 = ε ω p 2 ω ω + i ω c
where ε is the dielectric constant of Au and ε is the high-frequency dielectric constant with a value of 9.75. The plasma frequency of Au is ωp = 1.36 × 10¹⁶ Hz,ωc = 1.45 × 10¹⁴ Hz is the scattering frequency of electrons.
The substrate material of the photonic crystal fiber is pure silicon dioxide, and its material dispersion can be calculated by the Sellmeier equation[8] :
n = 1 + i = 1 N A i 2 λ 2 λ 2 l i 2
Where λ is the wavelength of incident light, N = 3, Ai and li are the dispersion coefficients,A1 = 0.6961663,A2 = 0.4079426,A3 =0.8974794,l1=0.0684043,l2= 0.1162414,l3 = 9.896161.The refractive indices of SiO2 have a nonlinear relationship with the wavelength of incident light. The refractive index of SiO2 was calculated by Sellmeier’s equation which is closer to its true refractive index value.
When the phase matching condition for excitation SPR is satisfied, most of the energy leaks from the fiber core to the metal surface, forming a sharp loss peak in the loss spectrum. Considering the function of the effective RI imaginary part of the mode, the constrained loss of the core mode is used to characterize the surface plasma mode, which can be calculated by the following equation[9] :
α loss = 8.686 × 2 π λ Im n eff × 10 4 d B cm 1
where neff = β/k0 is the modal effective RI of the core mode and k0 = 2π/λ is the vacuum wave number. The unit of the incident wavelength λ is in nanometers.
Figure 2 illustrates the operational setup of the PCF-SPR sensor. As can be seen, the sensor operates as incident light is generated by a broadband light source (BBS) and introduced into the sensor, and a spectrum analyzer (OSA) is utilized to be able to accurately monitor and resolve the final outgoing light. In order to compare the experimental data with the theoretical predictions, optical simulations were performed using the finite element method. Specifically, an ideal matching layer (PML) is introduced at the boundary of the computational region to achieve effective truncation.[10]

3. Simulation Results and Discussion

As shown in Figure 3, the SPP mode, the fundamental mode, and the SPP mode resonating with the fundamental mode, respectively, the electric field distribution of the supermode is schematically shown, and the arrows in the figure indicate the direction of the electric field. From Figure 3(a), it can be seen that the SPP mode is excited by a specific wavelength and the energy is distributed around the gold film. Figure 3(c) shows the coupling of the fundamental mode to the SPP mode at the resonance wavelength and the conversion of energy from the fundamental mode to the SPP mode. The resonance wavelength occurs when the real part of the fundamental mode and the real part of the SPP mode are equal. At a wavelength of 760 nm and a na of 1.38, the supermode state is shown in Figure 3(d), and the supermode does not excite the SPP mode because the energy is concentrated on the core. The corresponding effective refractive index real parts of the supermode and the fundamental mode are 1.4383, 1.4385, and 1.4494, respectively. it can be seen that there is a small difference between the effective refractive index real part of the supermode and the effective refractive index real part of the fundamental mode, but there is still a big difference between the SPR resonance modes, as well as the direction of the electric field of the fundamental mode and the supermode.
As shown in Figure 4, the results of the effective refractive index real part Re(neff) of the fundamental and surface plasma (SPP) modes as well as the loss in the y-polarization mode under different incident wavelength conditions are calculated using the COMSOL software and plotted as a function curve related to the incident wavelength. The figure not only reveals the dispersion relation between the fundamental mode, SPP mode and the loss spectrum with the electric field distribution, but also points out in particular that the black and green curves represent the trend of the real part of RI with wavelength for the fundamental and SPP modes, respectively, for a refractive index (RI) of 1.38, while the red curve demonstrates the variation of the fundamental mode confinement loss with wavelength. From the figure, it can be observed that the real part of the effective refractive index decreases with wavelength for both the fundamental and SPP modes, but the real part of the SPP mode decreases at a significantly faster rate than that of the fundamental mode. This indicates that the SPP modes are more susceptible with increasing wavelength, and their propagation characteristics are changed considerably. In particular, the confinement loss of the fundamental mode peaks at the resonant wavelength of 770 nm, a phenomenon that coincides with the fact that the real part of the fundamental mode and the SPP mode satisfy the phase-matching condition at this wavelength. This implies that effective phase matching and coupling between the fundamental and SPP modes occurs at 770 nm, which enables most of the energy to be transferred from the fundamental mode to the SPP mode, thus enhancing the surface plasmon resonance (SPR) effect. As a result, a significant confinement loss peak can be observed at this particular wavelength, which is the result of the efficient energy conversion between the fundamental and SPP modes. This finding has important implications for optimizing the design of sensors based on surface plasmon resonance technology.[11]

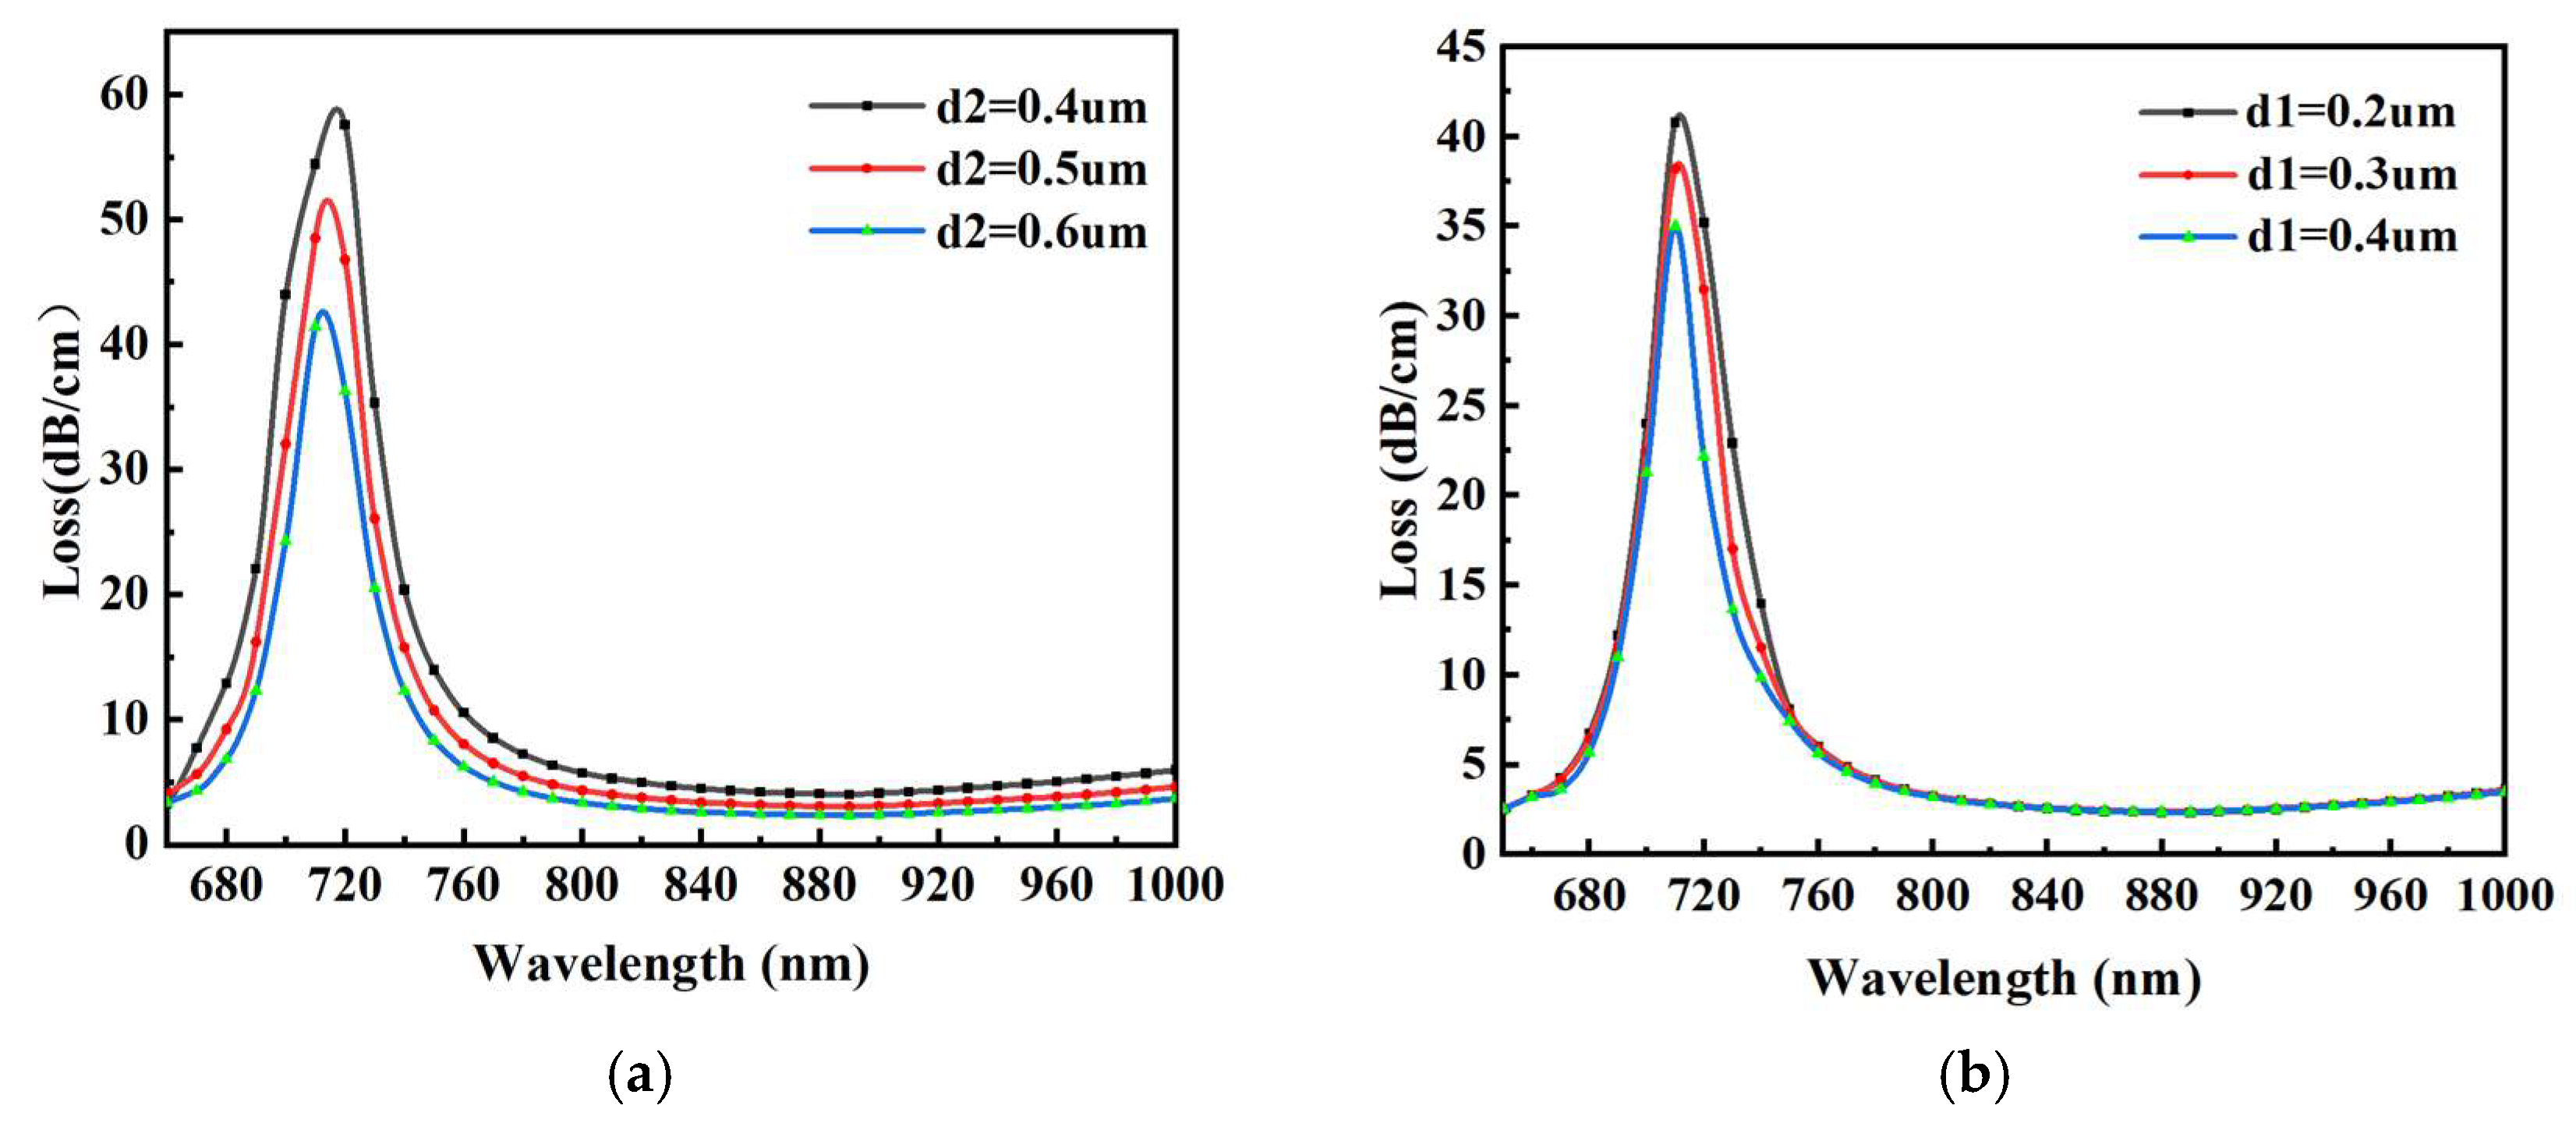
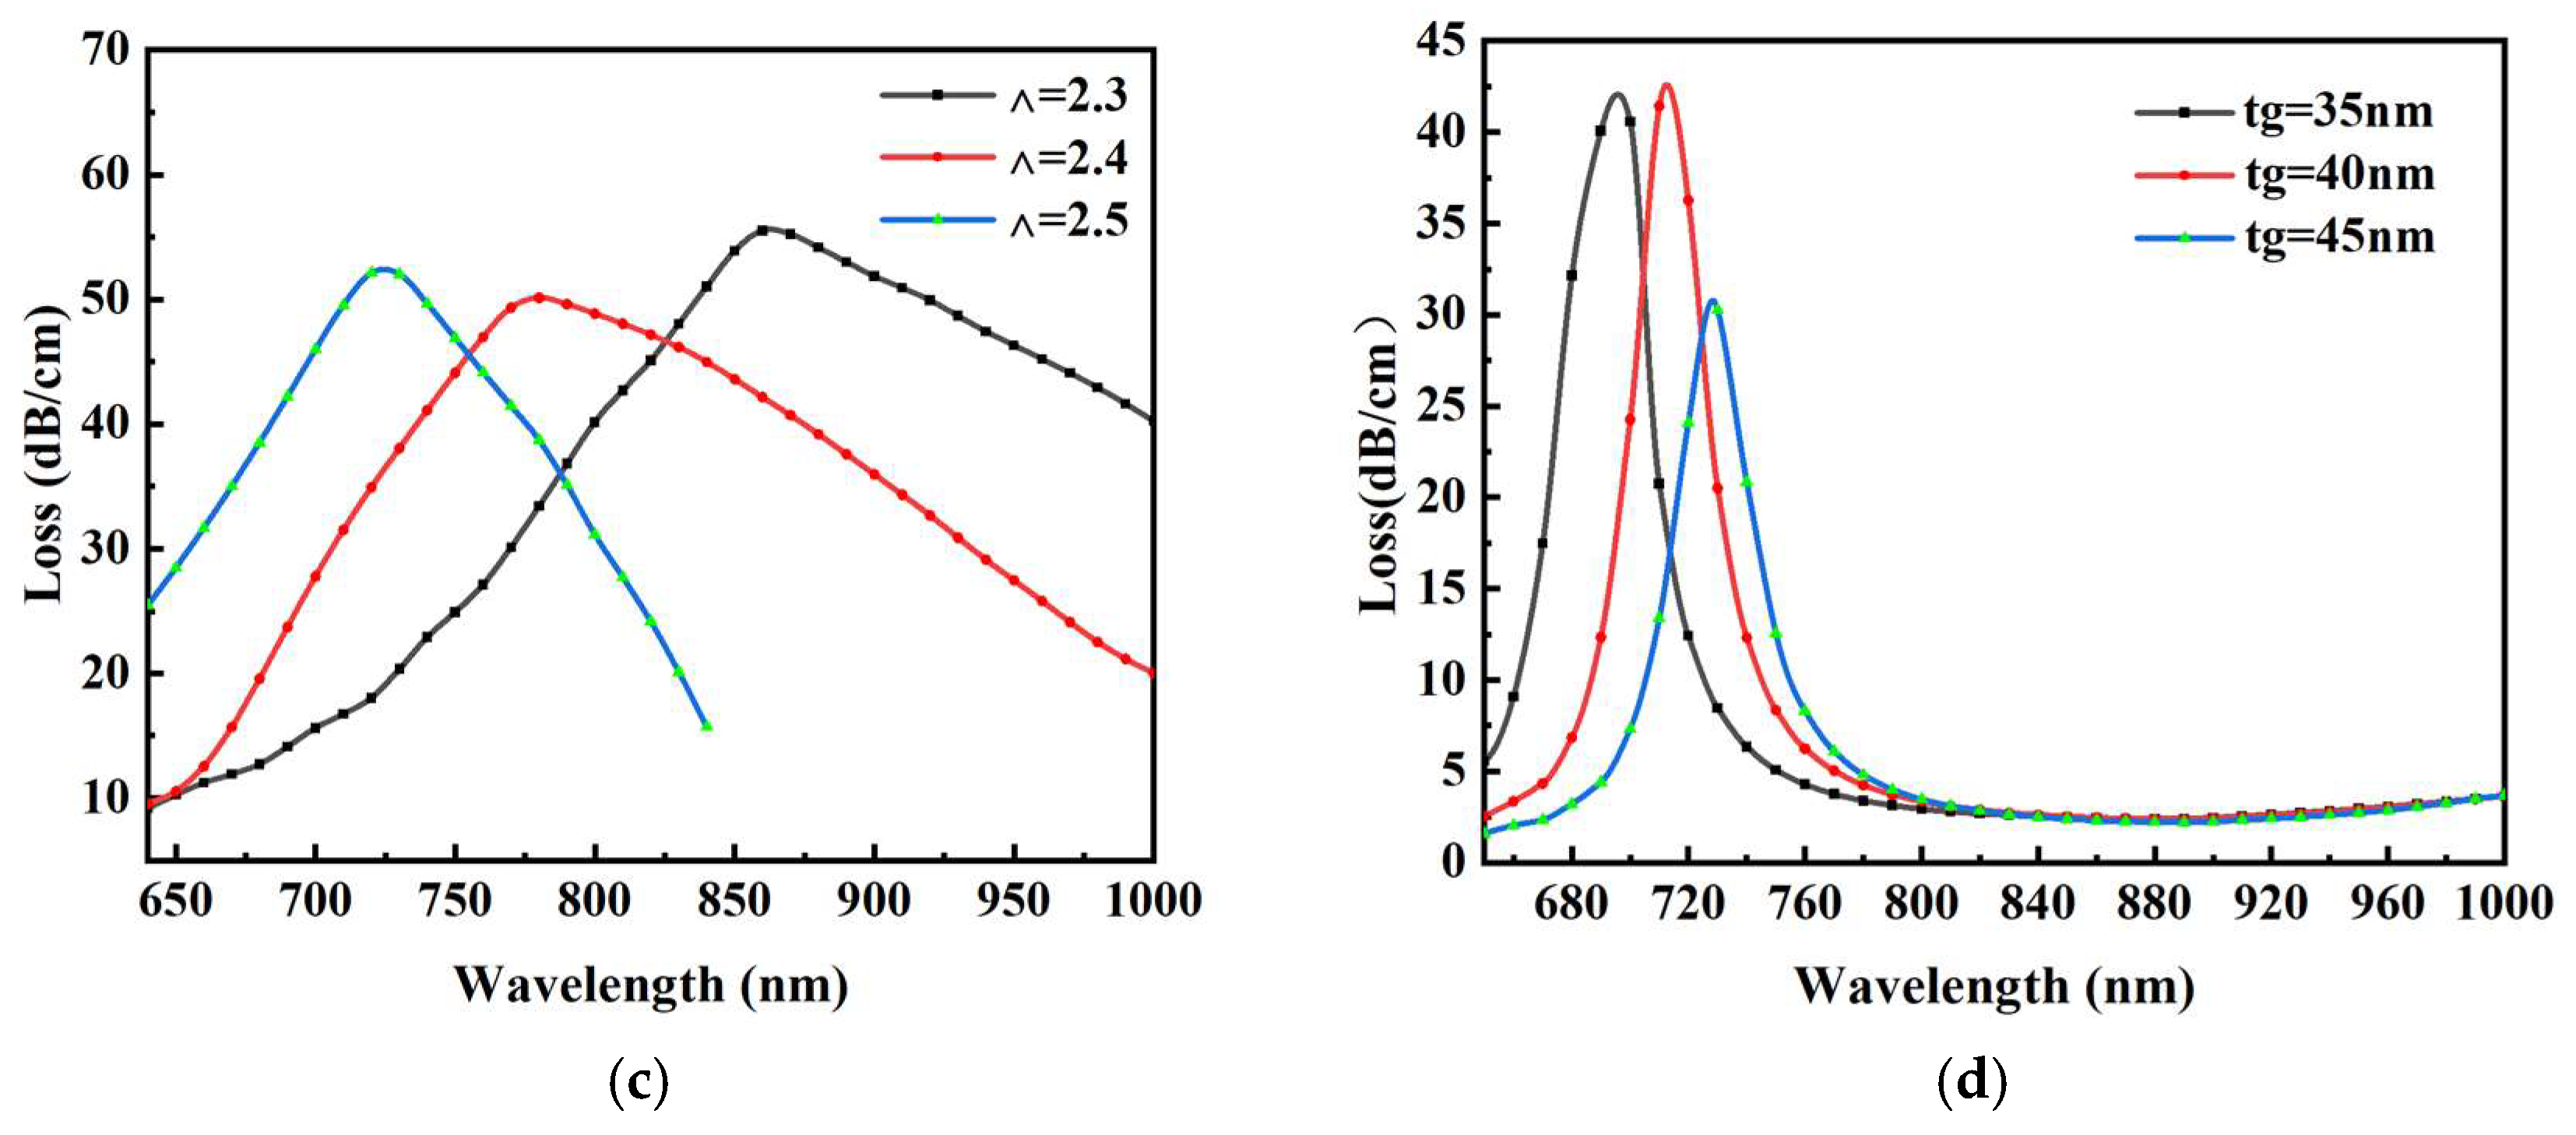
3.1. Structural Optimization

The performance of the sensor was improved by optimizing the values of air holes, lattice spacing and gold film at an RI of 1.40, and the calculated results are shown in Figure 5. The variation of the loss spectrum of the fundamental mode with different periods of the air hole diameter d2 is shown in Figure 5(a), and the resonance wavelength is shifted to shorter wavelengths when the value of d2 is increased from 0.4 μm to 0.6 μm. At the wavelength of 720 nm, the corresponding maximum confinement loss is 57 dB cm-1. At this time, the confinement loss gradually decreases, indicating that the coupling between the fundamental mode and the SPP mode is weakened. The performance of the sensor is optimized by adjusting the size of the air hole d2. In addition, d2 = 0.6 μm is considered to be the optimal size choice considering the actual fabrication process of the sensor.
The variation of the loss spectrum of the fundamental mode with different cycles of the center air hole diameter d1 is shown in Figure 5(b), where the resonance wavelength gradually decreases when the center hole diameter d1 increases from 0.2 μm to 0.4 μm. Meanwhile, the coupling strength decreases as d1 increases from 0.2 μm to 0.4 μm, which is due to the reduced energy transfer from the fundamental mode to the SPP mode. Therefore, d1 of 0.2 μm is selected as the optimal value by considering the fabrication difficulty of the sensor and the detection sensitivity. When d2 is set to 0.6 μm and d3 is set to 0.2 μm, the coupling between the base mode and the SPP mode reaches an optimal state. The sensitivity of the sensor can be improved to 421 nm RIU-1 at the analyte refractive index na = 1.41, which indicates that the dimensional variations of d2 and d3 significantly affect the performance of the sensor.
The loss spectrum of the fundamental mode with different periods of the lattice spacing Λ is shown in Figure 5(c), when the lattice spacing Λ is between 2.3 μm and 2.5 μm, the resonance wavelength is shifted to shorter wavelengths, and the confinement loss of the fundamental mode decreases slightly, and both the peak intensity and the resonance wavelength are decreased with the increase of Λ. This is due to the fact that the energy confined within the core is weakened when the value of Λ increases, and the resonance strength between the core mode and the SPP mode is weakened. This means that less energy is transferred from the core to the surface of the fiber. This is due to the suppression of the leakage path in the fiber core as the lattice spacing increases. Therefore, considering the sensitivity and the confinement loss, we chose Λ = 2.4 μm as the optimal spacing of the air holes.
In view of its chemical stability advantage, Au was chosen as the surface plasmon resonance excitation material. The thickness of the gold film is a key parameter that affects the performance of the sensor. As shown in Figure 5(d), the resonance peak is shifted to longer wavelengths with the increase of the Au film thickness. At the same time, the confinement loss of the fundamental mode decreases, and the energy transferred from the fundamental mode to the SPP mode decreases. When the gold film thickness is small, the plasma wave experiences a strong damping effect due to radiation damping, resulting in a significant decrease in the confinement loss peak. In order to achieve the best performance of the proposed sensor, we have chosen 40 nm as the optimum thickness of the gold film.[12]

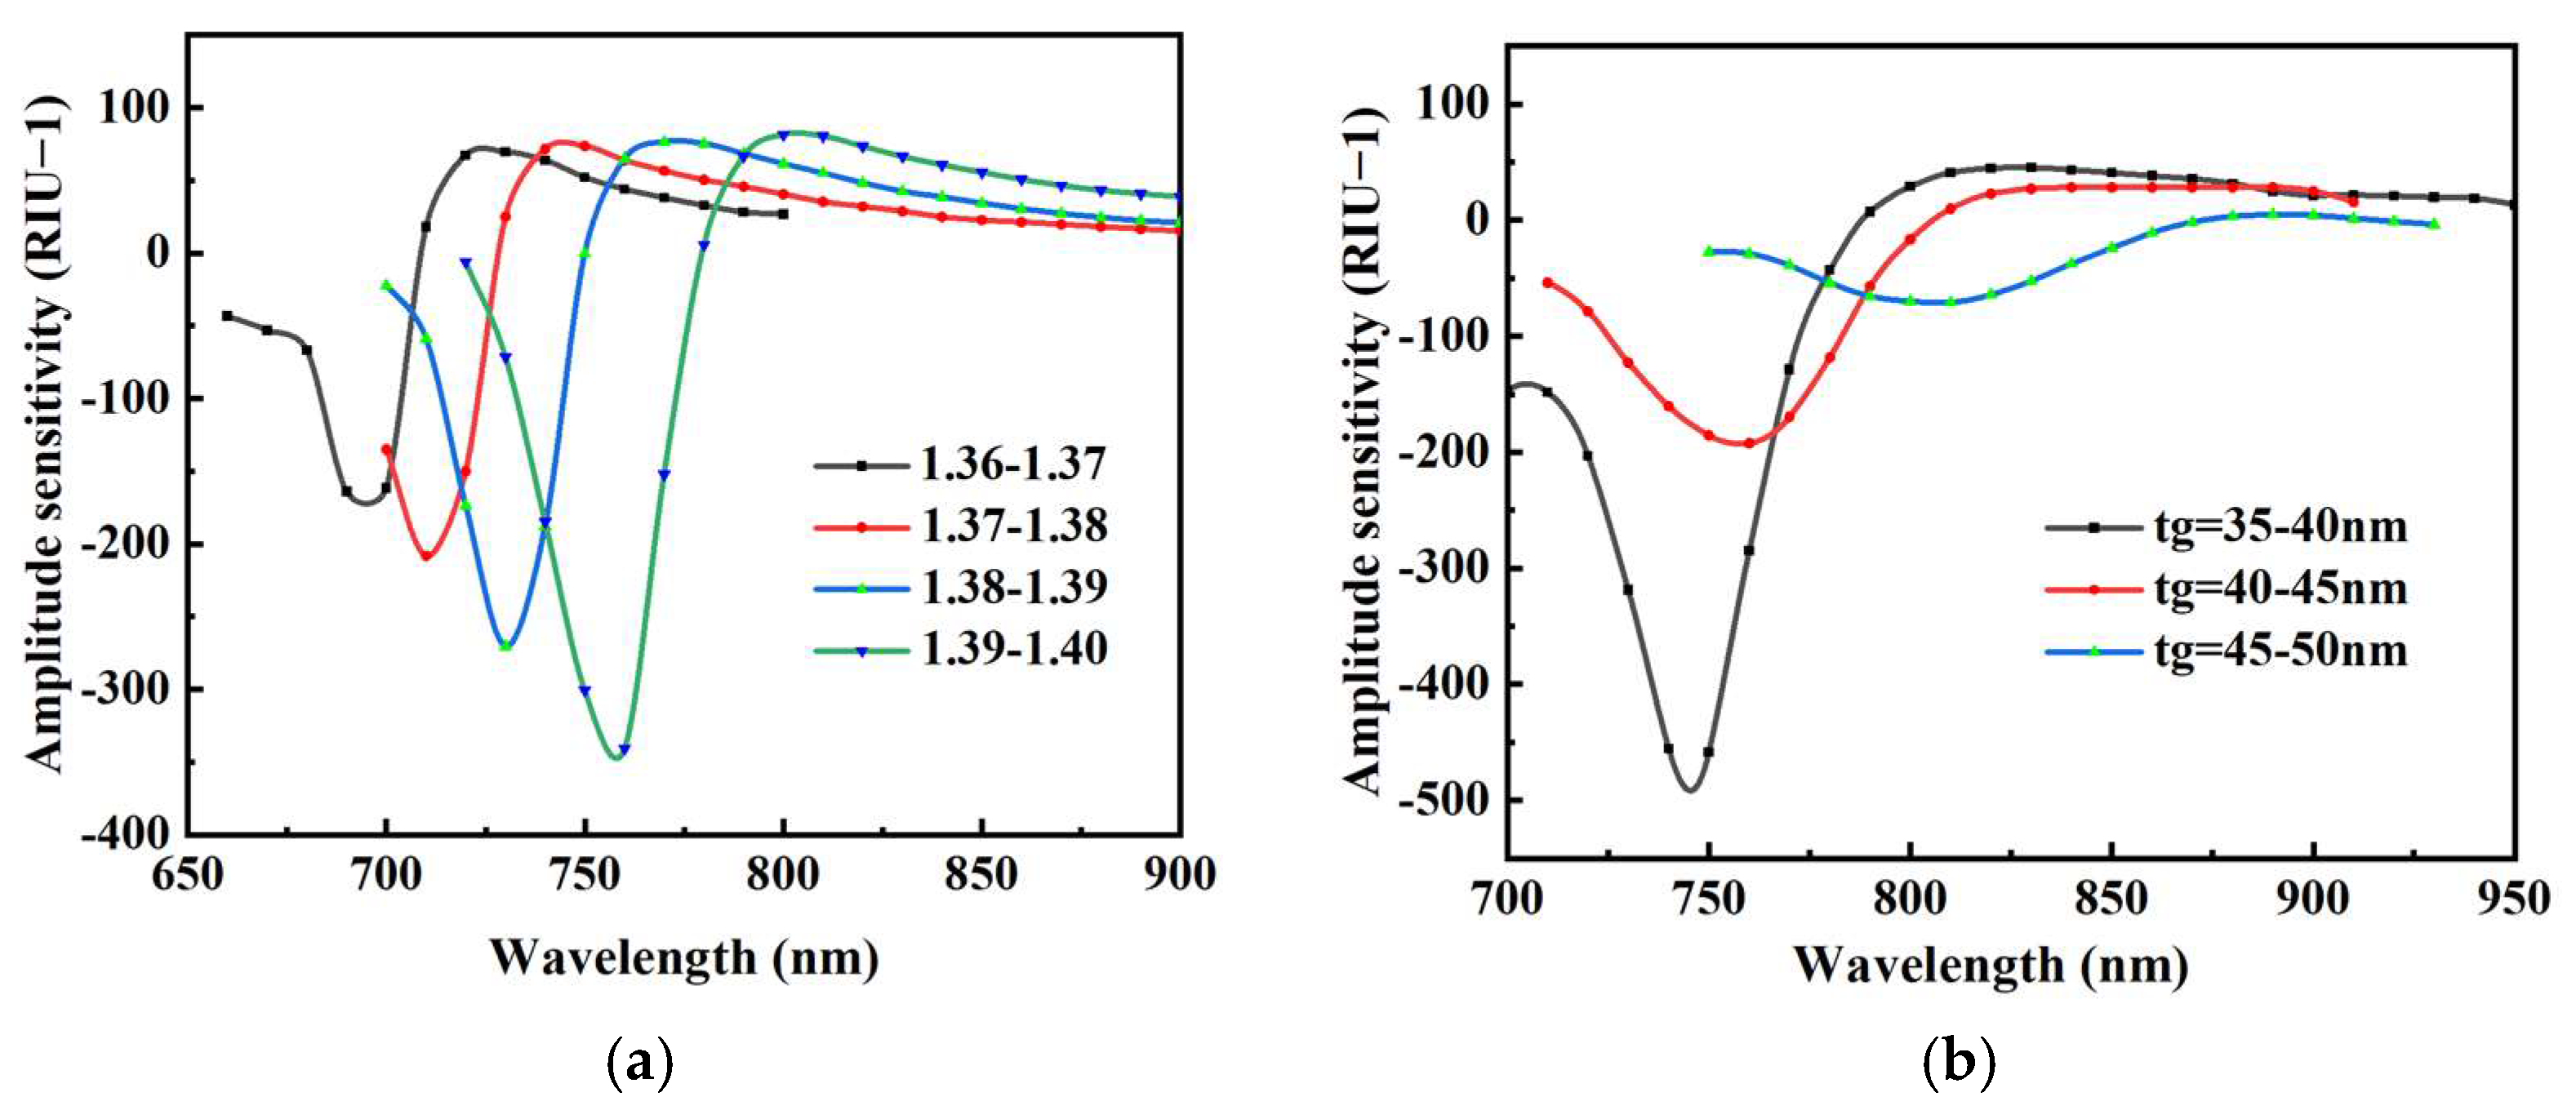
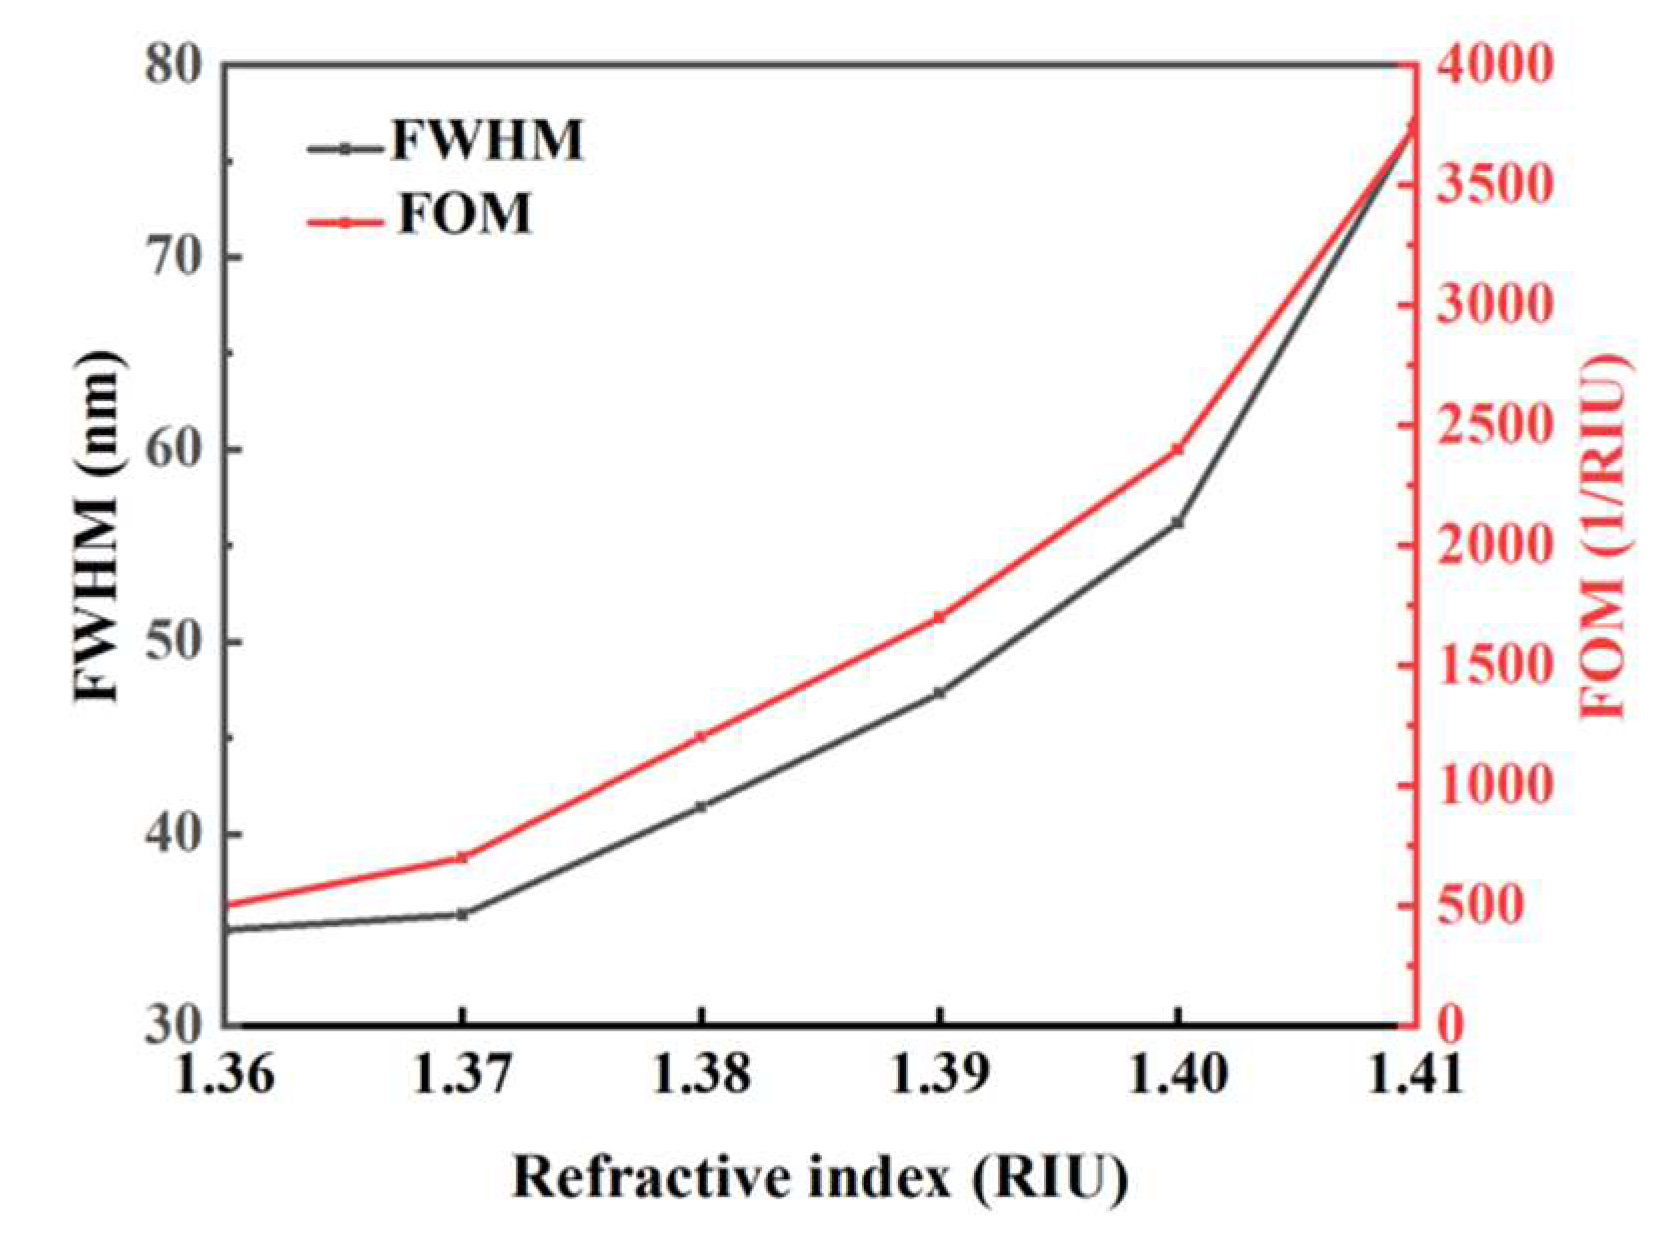
3.2. Device Performance Analysis

Based on the discussion of the effects of various structural parameters on the loss spectrum, the response characteristics and resonance strength of the plasma sensor were evaluated to determine the optimal structural parameters of the PCF-SPR sensor. [13]The optimized plasma sensor performance can be approximated computationally when the refractive index RI of the analyte is varied from 1.36 to 1.41 in steps of 10. As shown in Figure 6, when the refractive index of the external analyte increases from 1.36 to 1.41, the resonance peaks move to longer wavelengths, and the coupling strength between the fundamental mode and the SPP mode is gradually enhanced, leading to an increase in the confinement loss. As the refractive index of the analyte increases, the energy confined within the fiber core increases, strengthening the interaction between the core and SPP modes. This is because the effective refractive index of the SPP mode is mainly affected by the refractive index of the analyte. In addition, the spectral sensitivity can be calculated when na changes from 1.36 to 1.41, and the maximum change in resonance wavelength Δλpeak = 150 nm at when the RI is 1.40 to 1.41, which corresponds to a maximum spectral sensitivity of 421 nm RIU-1. In addition, the confinement loss decreases slightly when the refractive index of the analyte is 1.41, and there is a slight secondary peak, while in the refractive index range of 1.36 to 1.40, the constraint loss has only one main peak. Therefore, the proposed sensor is more suitable for stable detection of analytes. This is because the SPP mode is affected by the change in the refractive index of the analyte, and as the refractive index of the analyte increases, the ability of the fiber to bind to the core mode is weakened, resulting in more energy leakage from the fundamental mode to the SPP mode. At the same time, the coupling between the fundamental mode and the SPP mode is enhanced with the gradual increase of the analyte refractive index, which is due to the gradual increase of the peak loss intensity. Spectral sensitivity is an important parameter to measure the performance of the sensor and can be defined as:[14]
S λ = Δ λ p e a k Δ n a n m / R I U
where Δλpeak is the difference between the resonance wavelengths of the refractive indices of neighboring analytes, with the parameter Δna = 0.01. The RI value of the analyte was increased from 1.36 to 1.41, where the mean and maximum values of Δλpeak were 35 nm and 150 nm, respectively.Therefore, the mean and maximum spectral sensitivities were 96 nm RIU-1 and 421 nm, respectively RIU-1. In addition, the resolution of analyte RI is also an important parameter of the sensor and is expressed by the following equation[15] :
R = Δ n a Δ λ min Δ λ p e a k
where the wavelength resolution Δλmin is assumed to be 0.1 nm. When the na change step of the analyte RI is 0.01, the maximum sensing resolution of the PCF-SPR triple-core sensor at analyte RI na of 1.41 is 6.67 × 10 - 6 RIU, and the minimum sensing resolution at analyte RI na of 1.36 is 2.5 × 10 - 5 RIU.
The linear relationship between the fundamental mode resonance wavelength and the analyte refractive index (RI) is shown in Figure 7. As the refractive index of the analyte increases, the resonance wavelength gradually becomes longer and more energy is converted from the fundamental mode to the SPP mode. This is due to the fact that the increase of the analyte refractive index reduces the refractive index difference between the fundamental mode and the SPP mode, which promotes the strong coupling between them. In addition, a third-order fit is performed in the polynomial fitting method used to optimize the curve fitting. The slope of the fitted curve can be used to characterize the sensitivity of the sensor. The table in Figure 7 lists the quality metrics of the fits, i.e., r-squared (COD) and relative values, with r-squared values of 0.98839 and 0.98143, respectively. these r-squared values indicate that there is a good fit between the resonant wavelength of the sensor and the refractive index of the analyte, in particular, the sensor achieves a maximum spectral sensitivity of 421 nm RIU-1 when the refractive index of the analyte is 1.4. However, when the analyte refractive index varied in the range of 1.36 to 1.41, the sensitivity response of the PCF sensor showed a nonlinear characteristic. Nonetheless, this nonlinear fitting curve still allows for effective dynamic monitoring of the sensor, providing flexibility and accuracy for practical applications. This nonlinear relationship illustrates that the sensor responds differently to refractive index changes in different refractive index ranges, which is important for understanding and optimizing the design of the sensor and its application in real-world inspection.[16]
Amplitude sensitivity is another important parameter for estimating the performance of the sensor and is defined as follows[17] :
S λ = 1 λ , n a α λ , n a n a R I U 1
Where α λ , n a   is the previous loss, α λ , n a   is the difference between the loss of the desired refractive index and the loss of the previous refractive index, and   n a   is the difference between the desired refractive index and the previous refractive index.
The coupling between the fundamental and SPP modes is affected by the change in amplitude sensitivity. As shown in Figure 8(a), when the analyte refractive index (RI) is in the range of 1.36 to 1.40, the amplitude sensitivity increases and then decreases slightly, and the peak of the amplitude sensitivity moves toward longer wavelengths. The amplitude sensitivity varied from 231 RIU-1 to 420 RIU-1 with the maximum amplitude sensitivity of 420 RIU-1 occurring at analyte refractive indices between 1.39 and 1.40. This indicates that the sensor is most sensitive to changes in analyte refractive index in this refractive index range, enabling efficient detection. This trend in amplitude sensitivity reflects the change in the coupling strength between the fundamental mode and the SPP mode, which provides an important reference for optimizing the design of the sensor and improving its detection performance.[18]
In addition, the coupling between the base mode and the SPP mode is also affected by the variation of the gold film thickness. As shown in Figure 8(b), the amplitude sensitivity shows a decreasing trend when the gold film thickness increases from 35 nm to 45 nm. This is due to the fact that as the gold film thickness decreases, the confinement loss gradually increases and the interaction between the abrupt field and the analyte is enhanced, which leads to the decrease of the amplitude sensitivity. In particular, the amplitude sensitivity reaches a maximum when the gold film thickness is increased from 35 nm to 40 nm, and a significant peak appears, corresponding to a maximum amplitude sensitivity of 503 RIU-1. This finding suggests that the performance of the sensor can be significantly optimized by precisely controlling the thickness of the gold film to achieve higher sensitivity.[19]
The performance factor (FOM) plays a crucial role in evaluating the overall performance of a sensor. A higher FOM value means that the sensor has better performance, especially in terms of resolution and sensitivity.The FOM can be calculated using the following equation[20]:
F O M = S F W H M
where S and FWHM denote the slope of the polynomial fit curve and the full width of the resonance peak at half maximum, respectively. In order to achieve a high performance sensor, the quality factor (FOM) should be as high as possible, which can be achieved by increasing the slope S and decreasing the FWHM. As shown in Figure 9, when the analyte refractive index is varied from 1.36 to 1.41, both FOM and FWHM gradually increase with the analyte refractive index. In particular, the FOM reaches a maximum value of 3750.7 RIU-1 when the analyte refractive index is 1.4, which indicates that the sensor not only has high sensitivity in this refractive index range, but also performs excellently in terms of resolving ability and detection accuracy, which makes it suitable for high-precision sensing applications.This optimization result of the FOM is crucial for improving the overall performance of the sensor, which helps to achieve more accurate and reliable sensing in practical applications. This optimization of the FOM is essential for improving the overall performance of the sensor, which will help to achieve more accurate and reliable detection in practical applications.
Table 1 compares the performance of the sensors proposed in recent years and shows that our proposed sensor significantly improves the sensing performance and extends the range of analyte measurement. This illustrates the relevance and development prospects of the sensors proposed in this paper.

4. Conclusion

The designed three-core PCF-SPR sensor was numerically simulated with the help of COMSOL software to characterize the performance of the sensor. By optimizing the structural parameters of the sensor, the effects of the gold film thickness, air aperture size and lattice spacing on the sensor efficacy are explored in detail. Based on the optimized parameters, the loss curves were plotted to clearly demonstrate the resonance wavelength of the refractive index. The performance characteristics of the PCF-SPR sensor were characterized using the finite element method. The results show that the amplitude sensitivity of the sensor ranges from 231 to 421 RIU-1. The sensor exhibits excellent performance in the analyte refractive index (RI) interval from 1.36 to 1.40, and reaches the maximum factor of performance (FOM) especially at an RI of 1.4. This indicates that the sensor has a promising application in the field of biosensing. For SPR sensors with surface-coated metal films, the introduction of multi-core technology to enhance their performance opens up a new perspective and theoretical basis for the study of optical components. The proposed sensor scheme is more easily realized under the current state of the art.

Funding

This work was supported by National Natural Science Foundation of China (Grant No. 62273243) and Department of Education of Liaoning Province (Grant No. LJ212410153029). This work was performed in part at the Melbourne Center for Nanofabrication (MCN) of the Victorian Node of the Australian National Fabrication Facility (ANFF).

References

  1. Youpeng Y ,Yafei Q ,Xinyu L , et al.High-sensitivity three-core photonicic crystal fiber sensor based on surface plasmon resonance with gold film coatings[J].Japanese Journal of Applied Physics,2021,60(12). [CrossRef]
  2. Tong K ,Wang F ,Wang M , et al.Three-core photonicic crystal fiber surface plasmon resonance sensor[J].Optical Fiber Technology,2018,46306-310. [CrossRef]
  3. Zhao Z ,Caner C ,Chuanyang H , et al.Wide refractive index detection range sensors based on D-shape photonicic crystal fiber with a nanoscale gold wire[J].Optik,2023,292. [CrossRef]
  4. Jiao ,Shengxi,Li , et al.Research on three-core photonicic crystal fiber plasmonic sensor based on surface plasmon resonance with three V-groove microfluidic channel[J].Optical Review,2022,29(2):1-11. [CrossRef]
  5. Yuwei Q ,Jinhui Y ,Shi Q , et al.A novel photonicic crystal fiber refractive index sensor with ultra wide detection range based on surface plasmon resonance effect[J].Optik,2022,262. [CrossRef]
  6. Yanan W ,Guangyu J ,Zijian Y , et al.Trapezium-shaped groove photonicic crystal fiber plasmon sensor for low refractive index detection[J].Sensing and Bio-Sensing Research,2021,34. [CrossRef]
  7. Xin Y ,Taotao H ,Tonglei C , et al.Refractive index and temperature sensors of V-cut photonicic crystal fibers based on surface plasmon resonance[J].Optik,2022,269. [CrossRef]
  8. Jiao L ,Zhong N ,Zhao X , et al.Recent advances in fiber-optic evanescent wave sensors for monitoring organic and inorganic pollutants in water[J].Trends in Analytical Chemistry,2020,127(prepublish).
  9. Hemant K ,Raj K ,Umang R , et al.Al-doped ZnO based long range optical fibre sensor for efficient low refractive index detection[J].Optical and Quantum Electronics,2023,55(7). [CrossRef]
  10. Tian J ,Xu C ,Cui S , et al.A photonicic Crystal Fiber-Based Biosensor with Quasi-D-shaped Layout and ITO-Graphene Combination[J].Plasmonics,2021,16(5):1-10. [CrossRef]
  11. Yang X ,Yi Y ,Lu W , et al.D-shaped photonicic crystal fiber based on surface plasmon resonance for low refractive index applications[J].Optical Materials,2024,153115612-. [CrossRef]
  12. Ghahramani S ,Barvestani J ,Meshginqalam B .Design and analysis of surface plasmon resonance based photonicic crystal fiber sensor employing gold nanowires[J].Optik,2022,260. [CrossRef]
  13. Shafkat A ,Rashed Z N A ,El-Hageen M H , et al.The Effects of Adding Different Adhesive Layers with a Microstructure Fiber Sensor Based on Surface Plasmon Resonance: A Numerical Study[J].Plasmonics,2021,16(3):1-14. [CrossRef]
  14. Khan H M A ,Riazul S I ,Hriteshwar T , et al.A highly sensitive quadruple D-shaped open channel photonicic crystal fiber plasmonic sensor: A comparative study on materials effect[J].Results in Physics,2021,23. [CrossRef]
  15. Paul K A ,Habib S M ,Hai H N , et al.An air-core photonicic crystal fiber based plasmonic sensor for highre fractive index sensing[J].Optics Communications,2020,464125556-125556. [CrossRef]
  16. Hao C ,Zihao C ,Hua Y , et al.Multi-mode surface plasmon resonance absorber based on dart-type single-layer graphene.[J].RSC advances,2022,12(13):7821-7829. [CrossRef]
  17. Fu Y ,Liu M ,Shum P , et al.An ultrahighly sensitive photonicic crystal fiber based surface plasm resonance sensor[J].Optik,2020,212(prepublish):164649-164649.
  18. Samiha N ,Faiyaz M H B ,Sanjida S , et al.Hybrid lattice shaped dual polarized highly sensitive surface plasmon resonance based refractive index sensor[J].Optical and Quantum Electronics,2022,54(5). [CrossRef]
  19. Rakibul M I ,Islam M M K ,Rahbar R A , et al. Trigonal cluster-based ultra-sensitive surface plasmon resonance sensor for multipurpose sensing[J].Sensing and Bio-Sensing Research,2022,(prepublish):100477-.
  20. Honggang P ,Nan C ,Ailing Z , et al.High sensitivity photonicic crystal fiber surface plasmon resonance sensor based on indium tin oxide[J].Optical and Quantum Electronics,2023,55(8). [CrossRef]
  21. P. Bing et al., “Analysis of dual-channel simultaneous detection of photonic crystal fiber sensors,” Plasmonics, vol. 15, no. 4, pp. 1071–1076, Aug. 2020. [CrossRef]
  22. A. Ramola, A. Marwaha, and S. Singh, “Design and investigation of a dedicated PCF SPR biosensor for CANCER exposure employing external sensing,” Applied Physics A, vol. 127, no. 9, p. 643, Aug. 2021. [CrossRef]
  23. U. Ramani et al., “Study of highly sensitivity metal wires assisted photonic crystal fiber based refractive index sensor,” Optical and Quantum Electronics, vol. 52, no. 521, pp. 1-13, Nov. 2020. [CrossRef]
  24. Jing W ,Yongxiang H ,Lizao G , et al.Optofluidic refractive index sensor with microtube-coupled suspended core fiber[J/OL].Optoelectronics Letters,1-6[2024-12-30].http://122.51.45.239:8085/kcms/detail/12.1370.TN.20241203.1514.014.html.
Figure 1. Schematic diagram of the PCF-SPR sensor: (a) two-dimensional structure; (b) three-dimensional structure.
Preprints 151233 g001
Figure 2. Schematic diagram of PCF-SPR sensor operation.
Preprints 151233 g002
Figure 3. Mode electric field distributions of the sensor: (a) SPP mode electric field distribution, (b) fundamental mode electric field distribution, (c) SPP mode resonating with the fundamental mode electric field distribution, (d) supermode electric field distribution.
Preprints 151233 g003
Figure 4. Dispersion relation of fundamental mode, SPP mode and loss spectrum with electric field distribution.
Preprints 151233 g004
Figure 5. Sensor loss curves for (a) d2, (b) d1, (c) Λ, and (d) tg variations: (a) sensor loss curves with d2, (b) sensor loss curves with d1, (c) sensor loss curves with Λ, and (d) sensor loss curves with gold film thickness variation.
Preprints 151233 g005aPreprints 151233 g005b
Figure 6. Sensor bound loss with analyte variation from 1.36 to 1.41.
Preprints 151233 g006
Figure 7. Variation of resonance wavelength for analyte refractive indices from 1.35 to 1.41.
Preprints 151233 g007
Figure 8. Distribution of amplitude sensitivity with analyte RI and gold film thickness: (a) amplitude sensitivity with analyte RI, (b) amplitude sensitivity with gold film thickness.
Preprints 151233 g008
Figure 9. Variation of FOM with analyte RI.
Preprints 151233 g009
Table 1. Comparison of sensor performance with previously proposed sensors.
Ref RI range
(RIU)
Max. AS
(RIU-1)
Max. WS
(nm/RIU)
FOM
(RIU-1)
[4] 1.33-1.37 160 11400 250
[21] 1.33-1.40 371 11600
[22] 1.36-1.401 13,240 14285.71 21.61
[23] 1.31-1.36 597 7300
[24] 1.33-1.70 239.6 846.2 155.2
This work 1.36-1.41 421 15000 3750.7
Disclaimer/Publisher’s Note: The statements, opinions and data contained in all publications are solely those of the individual author(s) and contributor(s) and not of MDPI and/or the editor(s). MDPI and/or the editor(s) disclaim responsibility for any injury to people or property resulting from any ideas, methods, instructions or products referred to in the content.
Copyright: This open access article is published under a Creative Commons CC BY 4.0 license, which permit the free download, distribution, and reuse, provided that the author and preprint are cited in any reuse.
Prerpints.org logo

Preprints.org is a free preprint server supported by MDPI in Basel, Switzerland.

Subscribe

Disclaimer

Terms of Use

Privacy Policy

Privacy Settings

© 2025 MDPI (Basel, Switzerland) unless otherwise stated