Preprint
Article

This version is not peer-reviewed.

Data-Driven Spatial Analysis: A Multi-Stage Framework to Enhance Temporary Event Space Attractiveness

A peer-reviewed article of this preprint also exists.

Submitted:

28 February 2025

Posted:

28 February 2025

You are already at the latest version

Abstract

Revitalizing Japan’s remote areas has become an urgent challenge, particularly in regions with ageing populations. Despite their rich cultural and natural resources, these areas struggle to attract younger demographics, including young families and children. To address this, local governments have introduced temporary events to enhance urban vibrancy and create inclusive spaces. However, research on optimizing event design faces significant challenges due to the vast amount of data required for comprehensive analysis, making it difficult to gain deeper insights into user experience.On the other hand, recent advancements in natural language processing (NLP) and AI, particularly models like ChatGPT-4, have significantly enhanced data-driven decision-making. However, a major challenge in multi-person and multi-event analysis remains the need for structured user metadata, which is a critical gap. By integrating visual segmentation, spatial perception analysis, and NLP, this research introduces a novel, scalable approach to refining the design of temporary event spaces, using Matsue City as a case study.From an architectural perspective, this method enhances the visual attractiveness of temporary event spaces by optimizing spatial layout, product visibility, and user engagement, ensuring they remain appealing and inclusive despite demographic challenges.On the data-driven side, a specialized model has been developed to process multi-person interview data, addressing the complexities of analyzing multi-dimensional datasets. Furthermore, advancements in keyword extraction algorithms improve the identification of shared themes from interviews, enabling more accurate and insightful analysis of public event experiences. This integrated approach not only bridges spatial design and participant engagement but also establishes a replicable AI-assisted framework for systematically enhancing temporary event spaces, overcoming current limitations in large-scale data processing.

Keywords: 
;  ;  ;  ;  

1. Introduction

Revitalizing Japan’s remote regions has become a significant priority [1,2,3], and Matsue City serves as a key example of this effort, particularly through the creation of temporary event spaces that enhance urban vibrancy and foster interactions among residents and visitors. These events, which have received positive feedback from 70% of attendees, have paved the way for other small-scale community gatherings, further promoting the city’s potential and strengthening its local identity among both residents and tourists [4]. With a mix of organic foods, local goods, and family-friendly activities, the diverse range of stalls contributes to the visual appeal of these events, enhancing the overall participant experience [5]. However, concerns persist regarding the ability of temporary event spaces to maintain long-term engagement, as they often struggle to attract repeat visitors due to a lack of sufficient interaction [6]. This issue is frequently attributed to a misalignment between the expectations of visitors and the objectives of event organizers. Such misalignment highlights a cognitive and cultural divide, particularly between unmarried visitors and families, who show differing motivations for attending, such as exploring culture, seeking novelty, socializing, or fostering social connections  [7]. Additionally, cultural background plays a role in how attendees perceive event spaces—while individuals familiar with Japanese culture tend to interpret visual environments holistically, international visitors are more likely to focus on distinct objects, especially in settings where multiple visual stimuli compete for attention [8]. These observations raise important questions about the impact of spatial configurations on participants’ perceptions of temporary event spaces, leading to an exploration of how visual attractiveness is interpreted across different cultural and demographic groups. Besides, recent advancements in generative AI, such as ChatGPT-4, have demonstrated the ability of natural language models to analyze voice or text extracted from voice [9,10]. The application of natural language processing (NLP) has also been successful in evaluating and decoding user perceptions, offering valuable insights into participant feedback [11,12]. More than ever, the increasing integration of digital and AI-driven tools has introduced new challenges in adopting data-driven design methodologies to enhance user experiences (UX) [9]. By combining visual segmentation and spatial perception analysis with our innovations and support from NLP, this research aims to improve the quality of temporary event spaces while identifying design strategies to enhance their visual attractiveness. Ultimately, these findings will contribute to a replicable framework that can be applied to enhance temporary events in Matsue City and other remote regions across Japan.

1.1. Outline of the Study

The rest of the paper is organized as follows: Section 2 provides a comprehensive literature review on urban livability and Data-Driven AI applications in spatial analysis. Section 3 details the proposed multi-stage framework and its methodology employed in this study, including case study selection and data collection methods. In Section 4, we present data-driven insights into environmental dynamics affecting event spaces. The proposed algorithm, designed to mitigate the challenges of using NLP by leveraging interviewer text from different personnel, is also addressed in Section 4. Section 5 explores the impact of spatial arrangements and data-driven results on the visual attractiveness of temporary event spaces. Section 5 also explains the scaling impact of adding new participants to the existing pool and examines the correlation between spatial factors and user engagement metrics. Finally, in conclusion, Section 6 summarizes the key findings and discusses implications for urban planners and event organizers.

2. Literature Review

This literature review examines the intricate relationship between urban livability, event-based revitalization, and data-driven analysis, particularly in the context of ageing and remote cities like Matsue, Japan. These cities face multifaceted challenges, from demographic decline and economic shifts to the struggle to retain younger populations. Addressing these issues requires urban design strategies and a deeper understanding of social and cultural factors influencing migration and engagement. However, urban planning faces challenges, particularly in integrating community input effectively when dealing with the vast and complex data generated through traditional feedback mechanisms. This research explores how advancements in Artificial Intelligence (AI) and Natural Language Processing (NLP) can enhance data-driven approaches to urban revitalization by offering a more nuanced and efficient analysis of user perceptions and preferences. By leveraging these tools, urban planners can develop more responsive and sustainable strategies that align with community needs and aspirations.

2.1. Urban Livability in an Aging and Remote City

Japan faces significant demographic challenges due to low birth rates and an ageing population, particularly in regional areas [13]. This has led to an ongoing outflow of younger individuals to metropolitan cities, leaving behind ageing communities and struggling local economies [14]. In response, national and local governments have introduced various policies aimed at enhancing urban livability and attracting younger demographics to these regions [15]. Efforts include promoting reverse migration from metropolitan areas, attracting ICT professionals seeking a better work-life balance, and improving services and care facilities for the elderly [16]. Research also suggests that job opportunities, educational environments, and marriage are important determinants for migration to non-metropolitan areas, additionally, tourism experiences and emotional attachments to rural areas influence migration intentions [17]. To address these challenges, experts recommend restructuring regional governance systems and focusing economic and social investments on local cities. One major initiative is the Compact City strategy, led by the Ministry of Land, Infrastructure, Transport, and Tourism, which aims to create more accessible, high-density urban centres that improve residents’ quality of life [18,19]. This involves revitalizing underutilized spaces, enhancing public transportation networks, and ensuring convenient access to employment and essential services [20]. Matsue City, classified as a Multipolar Network Type Compact City, has been part of this initiative, benefiting from infrastructure improvements and urban restructuring. As of 2023, these efforts have evolved to include the development of regional public systems and the integration of digital technology [21]. The concept typically involves a high-density development of neighbourhood patterns and establishing linked urban areas through public transportation with convenient access to workplaces and local services. However, despite financial investments from national and local governments, the challenge remains many younger people continue to relocate to larger cities [22], and the expected increase in urban compactness has not fully materialized [23]. Like other regional cities, Matsue’s industrial landscape has also undergone transformations, with a decline in construction and manufacturing sectors and the expansion of medical and welfare industries. Such transformations present new economic and social challenges that affect the overall urban livability of these areas [24]. Recognizing that infrastructure alone is insufficient to attract and retain younger residents, recent urban policies have increasingly focused on cultural and social revitalization. This includes fostering creative industries, event organization, and digital place-making strategies [25].
Events, in particular, play a crucial role in urban revitalization by enhancing a city’s attractiveness, fostering a sense of community, and stimulating local economies [26,27]. Festivals, cultural gatherings, and sports competitions have long been leveraged to revitalize cities, and Matsue provides an example of how this approach has been implemented in a regional context. In the post-pandemic era, there has been a renewed emphasis on event-based placemaking as a means of strengthening urban identity and engagement [28]. The pandemic also highlighted the importance of public spaces and shared cultural experiences in urban planning [29]. In response, cities across the globe have been reinvesting in public gathering opportunities and hybrid event models that merge physical and digital experiences. These efforts aim to re-engage communities, attract visitors, and encourage younger generations to see these cities as vibrant and livable places to settle and work [30,31]. Studies on urban attractiveness indicate that environmental and cultural factors strongly influence perceptions of livability. Matsue, as one of 138 major Japanese cities assessed in the ’Japan Power Cities—Profiling Urban Attractiveness’ initiative by the Mori Memorial Foundation, ranks among the top cities for Cultural Interaction and Livability [32]. For instance, from 2018 to 2023, Matsue ranked among the top 40% cities with high ratings in terms of Cultural Interaction, Livability/Daily Life and among the top 10 cities in terms of Environment. The composition of the population also switches from a mix of family-senior-tourist toward more diverse with a high immigration of single employees. Also, Public Perception Surveys indicate that the city’s natural environment and historical landmarks remain its strongest assets, reinforcing its cultural and visual appeal [33]. By integrating event-driven urban strategies, cities with similar characteristics could redefine their roles as attractive and livable places for young professionals, students, and residents.
However, several challenges persist in organizing and sustaining events as a tool for urban revitalization. These include declining local participation due to demographic shifts, limited funding for community initiatives, and the need for more inclusive and adaptable event formats. To create a lasting impact, there is a growing need to prioritize community-based and locally initiated events that actively engage residents in planning, decision-making, and participation. Strengthening local involvement can help build a stronger sense of belonging and ensure events are relevant to the evolving needs of the community. However, the absence of structured user feedback mechanisms makes it difficult to assess public interest, refine event formats, and sustain engagement over time. To address these challenges, this study aims to develop a method for effectively renovating events based on user feedback. While Matsue provides a reference point for this research, the goal is to establish a broadly applicable approach that ensures urban revitalization efforts remain community-driven, responsive, and sustainable in the long term.

2.2. Obstacles to Enhancing Event Visual Appeal Through Community Input

Research on spatial cognition explores how individuals perceive and interpret complex visual stimuli in urban environments, examining the relationship between spatial arrangement and personal factors. Empirical studies on urban open spaces highlight the strong connection between the built environment and the aesthetic dimension of urban space. Lynch’s framework [34] identifies key urban form characteristics—paths, edges, nodes, districts, and landmarks—that shape the overall city image. However, temporary events can disrupt or augment these established elements, introducing new visual cues and way-finding strategies, as explored in recent studies on event signage and temporary installations [35,36]. Cullen’s concept of townscape [37] examines how the arrangement of urban settings enhances the visual experience, defining the physical form of a city through the observer’s emotional perception, which is influenced by personal experiences within a specific spatial boundary. This interpretation includes aspects such as color, texture, character, style, scale, and uniqueness. Cullen’s concept of serial vision, the unfolding of views as one moves through space, is particularly relevant to temporary events, where organizers often curate the visual experience. The strategic placement of product displays, activity zones, and stationary spaces can create a dynamic visual narrative, enhancing engagement and excitement [38]. Temporary events often introduce a sense of novelty and contrast to the urban fabric, drawing attention through vibrant colors, unique forms, and dynamic arrangements [39]. This disruption of the everyday visual landscape can further enhance engagement and create a sense of excitement [40], building upon the affective appraisal discussed by Nasar [41]. Urban designers like Russell [42] assess the cityscape based on identity, structure, and meaning, representing psychological constructs that reflect subjective environmental perceptions. In the context of temporary events, the visual organization of product displays, including their layout, materials, and branding, contributes significantly to the event’s identity and overall aesthetic, attracting attendees [43]. Well-designed stationary spaces, such as seating areas or information booths, offer visual respite and contribute to the overall organization and flow of the event [44], impacting how users perceive the "structure" of the event space. Furthermore, the inclusion of activities for all ages, from interactive installations to performance areas, creates visual focal points and adds dynamism to the event space [45], contributing to a richer sensory experience and enhancing the overall attractiveness of the event for a diverse audience [46].
The careful consideration of these visual elements is crucial for designing successful and visually appealing temporary events in urban spaces, especially when considering user feedback. While gathering user feedback, analyzing the sheer volume of data generated by attendees at urban events presents a significant challenge. Traditional methods, as highlighted by [47] and [5] (e.g., observation, surveys, interviews), often struggle to efficiently process and interpret the diverse range of opinions and experiences, particularly in dynamic urban environments. This data overload is further amplified by innovative research incorporating post-event evaluation feedback using virtual environment and other interactive platforms [48,49]. While these platforms offer valuable insights and richer data, they also contribute to the growing challenge of managing and analyzing massive datasets and challenges of constraint situations like Matsue city [50]. As explained in the above section Section 2.1, the absence of a structured user feedback mechanism in remote areas and aging society makes it difficult to identify key trends and actionable insights for temporary event improvement. Therefore, this research explores a novel approach, leveraging the power of Artificial Intelligence to analyze and categorize user feedback data, aiming to overcome these limitations and provide a more comprehensive and efficient understanding of user perceptions of visual attractiveness in temporary event spaces.

2.3. Data-Driven Approach

Understanding environmental dynamics through a data-driven approach has significantly enhanced event management and participant engagement. Recent advancements in semantic keyword extraction and natural language processing (NLP) have led to the development of powerful NLP models such as ChatGPT, Claude, Gemini, DeepSeek, and Copilot [51,52,53,54,55]. These models have significantly improved data-driven decision-making in urban planning, public engagement, and event management [56,57,58]. The integration of machine learning (ML) and artificial intelligence (AI)-assisted analytical techniques enables efficient extraction of keywords, themes, and contextual insights from interview data [59,60,61,62]. These techniques have been applied in cultural event evaluations [63,64], market analysis [65], and socioeconomic studies [66,67]. Prior studies emphasize the significance of sentiment analysis [68], network modelling [69], and keyword categorization [70] for interpreting user experiences in public event spaces. However, bias in qualitative data processing, particularly in interview-based studies, remains a challenge [71,72,73].
Recent advancements in keyword extraction have introduced various algorithms, each with unique approaches. YAKE! [58] employs a five-step process, including text pre-processing, feature extraction, and ranking, to identify keywords efficiently. Similarly, RAKE [74] focuses on co-occurrence-based scoring, while TextRank [75] uses graph-based centrality measures for keyword ranking. TF-IDF [76] remains a classic method, relying on term frequency and document rarity, whereas KeyBERT [57] leverages BERT embeddings for context-aware keyword extraction. However, these proposals do not address a critical need: they are not particularly designed for processing interview texts from many individuals on the same topic, nor do they focus on weighted keyword extraction tailored to such data. The proposed algorithm is specifically designed to target keyword extraction from multi-person interview data, emphasizing weighted keywords to capture shared themes and responses across participants better.
Although data-driven approaches, particularly those relying on interview-based keyword analysis, have advanced significantly, accurately capturing and interpreting human behaviour remains a difficult task [77,78]. Human interactions and expressions are diverse, context-dependent, and highly nuanced, making it challenging for NLP models to account for every behavioural detail. Moreover, variations in word choice, tone, and implicit meaning can introduce inconsistencies in the analysis [79]. Traditional NLP models often struggle to differentiate between factual statements, opinions, and implied sentiments within interview responses. To address these challenges, our proposed algorithm introduces a novel architecture that enhances keyword analysis by dynamically adjusting keyword weighting based on contextual relevance and occurrence patterns. This approach mitigates inconsistencies and bias in NLP-driven qualitative data analysis, ensuring a more accurate and representative interpretation of user input.

3. Methodology

This section details the research framework used to examine the spatial qualities of temporary event spaces, focusing on the relationship between visual attractiveness and user feedback. The methodology is structured into four interrelated components:
Multi-stage framework: The research is grounded in key urban design theories, integrating spatial analysis with user perception. It explores how event elements shape movement, atmosphere, and overall user experience. This approach incorporates an AI-assisted, data-driven method to address challenges in analyzing large qualitative datasets, refining keyword extraction and sentiment analysis for a more accurate interpretation of user feedback.
Case study selection: Three events—Imagine Coffee Morning Market, Yonagomachi Festival, and Matsue Farmer Market—serve as case studies, representing diverse community engagement and revitalization efforts. These events provide varied spatial and cultural contexts, allowing for a comprehensive investigation of temporary event design and attractiveness.
Data collection: Conducted across three phases, the process includes on-site observations and interviews, post-event interviews using video recordings, and post-evaluation interviews within virtual environments. This sequential approach ensures a deep understanding of spatial perception and user experience.
Adaptive keyword analysis: NLP-based keyword extraction is performed in three phases—initial categorization, AI-assisted refinement, and validation through virtual environments. This ensures the identification of meaningful patterns in user feedback while minimizing bias and inconsistencies.
Each component builds upon the previous, forming a cohesive methodology that integrates spatial analysis with advanced data processing techniques to better understand event attractiveness and its impact on urban revitalization.

3.1. Multi-Stage Framework
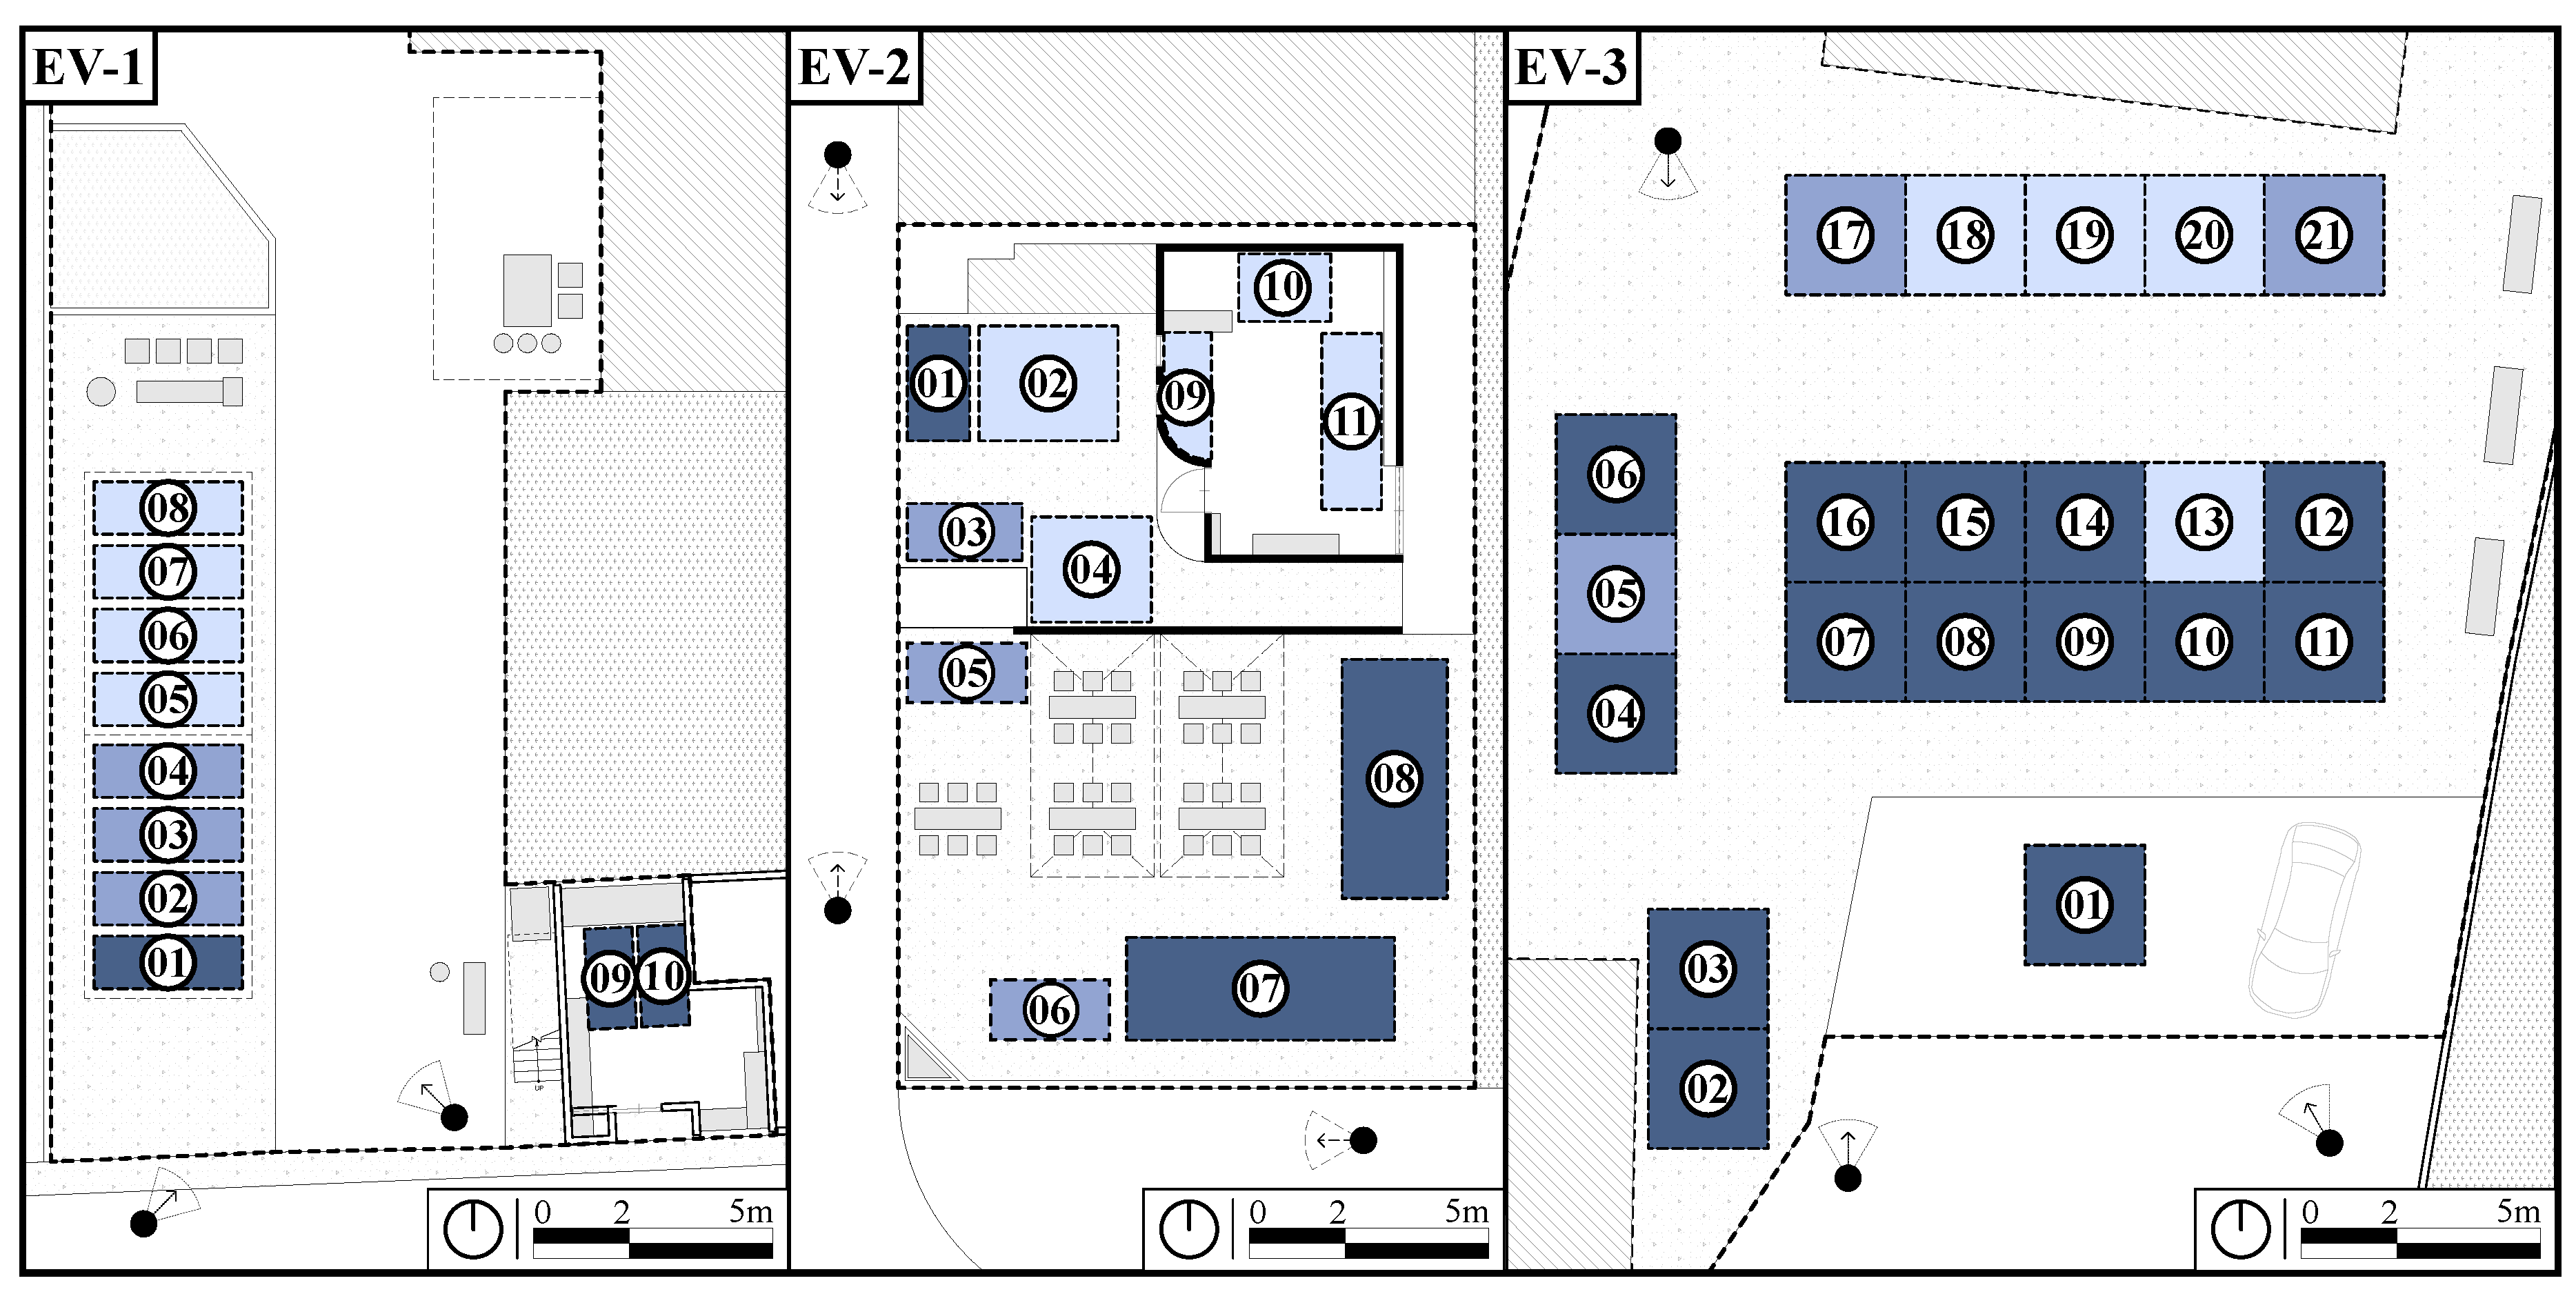
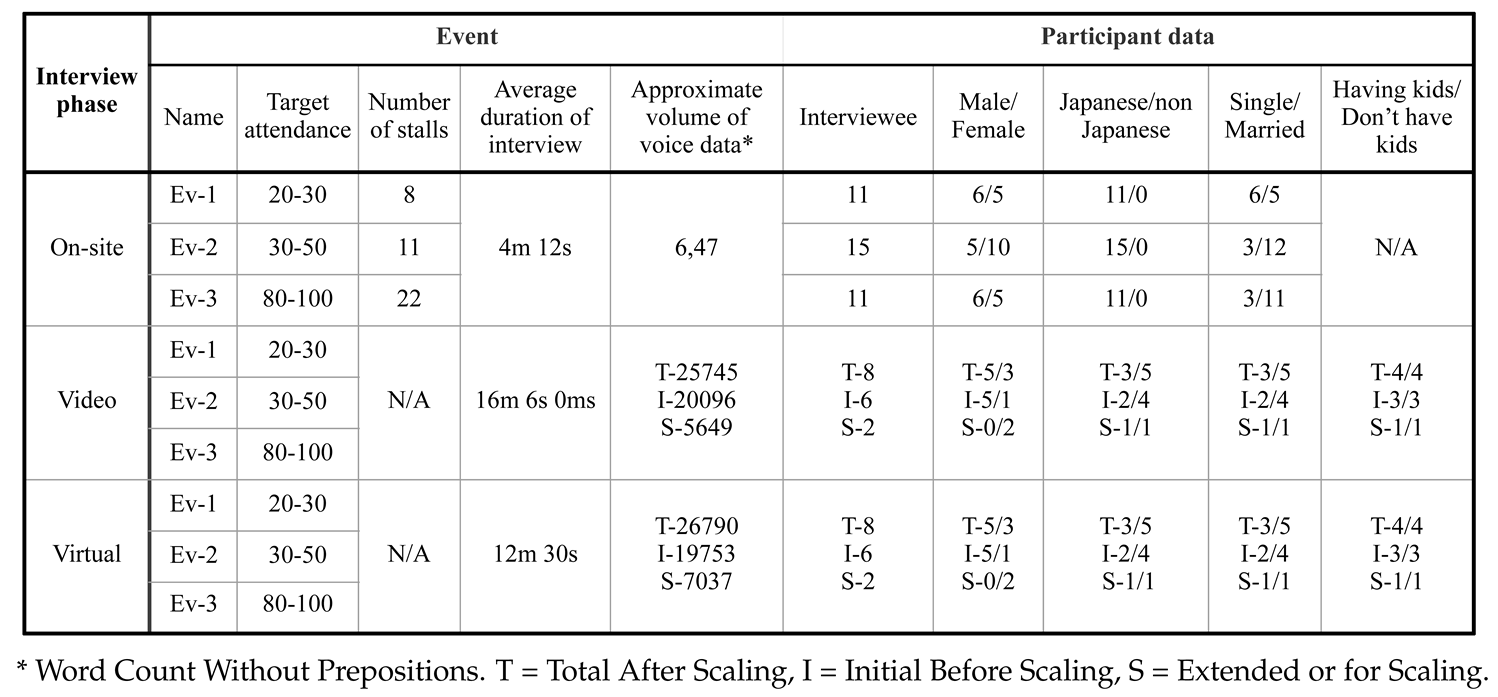
To investigate the spatial quality of temporary event spaces, focusing on the relationship between visual attractiveness and user feedback, the framework is built upon key urban design theories mentioned above (detailed in Section 2.2), such as how the placement of event elements influences visitor movement and understanding of the space, how the unfolding of views contributes to the overall atmosphere and perception of the event and how visual attractiveness is not simply aesthetic but also tied to user emotions and perceptions. The survey observation examines how temporary events, as discussed in [35], utilize visual elements like product displays [43], stationary spaces [44], and activity zones [45] to shape user experience. This spatial analysis is then integrated with user feedback data, recognizing that visual attractiveness is not only a design consideration but also a matter of user perception and experience. Traditional NLP models often struggle to differentiate between factual statements, opinions, and implied sentiments within interview responses without explicit contextual understanding. To address this challenge, and the broader difficulties of analyzing large and diverse datasets from dynamic urban environments [47,48], this research leverages a novel AI-assisted data-driven approach. As detailed in Section 4.1, the algorithm was designed for multi-person interview data and weighted keyword extraction. This method enhances keyword analysis by dynamically adjusting keyword weighting based on contextual relevance and occurrence patterns, mitigating inconsistencies and bias in NLP-driven qualitative data analysis, and allowing for a more accurate and representative interpretation of user input. This approach is particularly relevant in the context of regional cities like Matsue, where structured user feedback mechanisms may be limited due to its challenging social and urban context (see Section 2.1) and given the increasing use of data-rich platforms like virtual environment in event post-evaluation[49,50]. The detail of the framework is shown below.
Figure 1. Framework Data-Driven Spatial Analysis.
Preprints 150827 g001

3.2. Target Events

The three events, thriving during and after the pandemic, contribute to urban revitalization by fostering community engagement, promoting local businesses, and providing family-friendly spaces. Each event has a distinct character that ties into the fabric of the local community, supporting different aspects of Matsue’s cultural and economic life.
EV-1 as Imagine Coffee Morning Market, is a monthly morning market event aimed at young generations, combining coffee culture with a dynamic pop-up store atmosphere. Attracting 20-30 visitors per session encourages the creation of new habits by introducing a lively, coffee-centric morning routine. Local coffee vendors, along with a rotating selection of pop-up shops, provide a platform for small businesses, offering unique local products and experiences [80]. This initiative revitalizes the local neighbourhood by fostering a sense of community around a morning coffee culture that resonates with younger audiences, eager to connect, socialize, and explore new trends in a relaxed, vibrant setting.
EV-2 as Yonagomachi Festival, is held bi-annually in the historic district surrounding Matsue Castle and the nearby historical museum. With 30-50 visitors per session, the event takes place in the afternoon, offering families a chance to enjoy cultural activities before or after lunch. The district’s rich heritage and frequent nearby events, such as exhibitions and performances, provide a perfect backdrop for this celebration of local arts and history [81]. It promotes local artisans and businesses, while simultaneously encouraging families and children to learn about the region’s cultural history in an interactive, community-centered environment.
EV-3 as Matsue Farmer Market, takes place further from the city center, focusing on promoting the local products of farmers from the surrounding Matsue area. This city-led initiative, attracting around 100-150 visitors per month, emphasizes sustainable practices and supports regional agriculture [82]. With a broader reach, it offers a platform for local farmers to showcase their fresh produce and products, while providing an opportunity for residents and visitors to engage with the area’s agricultural community. By highlighting the efforts of local farmers and their contribution to sustainability, the market serves as a key part of Matsue’s urban revitalization efforts, teaching sustainable living practices and fostering connections between city residents and rural producers.
Each event brings something unique to the research. Imagine Coffee nurtures a young, coffee-driven culture with a focus on pop-up stores, Yonagomachi celebrates the region’s cultural heritage in the heart of a historic district, and Matsue Farmer Market bridges the gap between urban residents and rural farmers, supporting local agriculture and sustainability. Together, they contribute to a vibrant, interconnected community that values both tradition and innovation. These events were strategically chosen to provide diverse contexts for investigating the relationship between visual attractiveness, spatial design, and user feedback in temporary events within a regional city.

3.3. Data Collection

Data collection was conducted in three different periods:
On-site observation, mapping and interview (August-October 2024): During each event, on-site observations and video recordings were conducted to capture the dynamic interplay between visitors and the event space. Concurrently, event stall layouts, decorative elements, and store owners’ design intentions were mapped. This data, analyzed through the lens of Lynch’s framework [34] Cullen’s concept of serial vision [37], provides a basis for understanding the spatial organization and visual characteristics of each event. Initial on-site interviews were also conducted to gather preliminary impressions and inform the direction of subsequent interviews.
Post-event interviews (November 2024): Video recordings from the on-site events were used as stimuli for post-event interviews with six participants (three long-term residents and three short-term residents, balanced for gender, marital status, and family structure). These interviews, guided by the initial on-site observations and interviews, explored specific visual and spatial aspects of the events, based on the evaluation of Nasar on visual aesthetics [41] and Russell subjective perception [42] detailed feedback on user experiences and perceptions.
Post-evaluation interviews (December 2024-January 2025): Based on the analysis of the post-event interviews, virtual environments simulating the event spaces were created, incorporating design modifications aimed at enhancing user experience and wayfinding [83]. These virtual environments were presented to the same six participants, and their feedback on the proposed changes was collected. This data provides insights into the perceived effectiveness of the design modifications.

3.4. Adaptive Keyword from Interviews

This section focuses on the categorization and semantic analysis of keywords extracted from interviews of three environments, ensuring that they are systematically classified into distinct pre-determined categories.
The methodology for keyword extraction and analysis was developed to systematically extract, categorize, and analyze keywords from interview data related to all events, ensuring they align with predefined classification criteria. In this stage, the NLP model is supported with the actual interview data along with metadata about the event and participants. To maintain objectivity and prevent any bias from prior interactions, the analysis began with a fresh session, effectively resetting the context to avoid interference. This analysis is conducted in three phases. In all phases, the input data was organized in a structured Microsoft Excel format, including columns that detailed participant information with name, nationality, parental status, gender, age group, and their qualitative responses for each event as shown in Table 1. This structured approach facilitated consistency and traceability throughout the analysis process. Providing background information (metadata) about each event was essential to contextualize the data. Details about the event’s purpose, activities, and target audience helped ensure that the keyword extraction remained relevant and grounded in the specific context of each community event.
The event and person data table provides a summary of data collected from three phases corresponding to three types of environments (Onsite, Record, and Rendering) in Matsue City, focusing on participant demographics, stall distribution, and engagement patterns. Onsite interview phase collected data of most attendees, with a mix of families and individuals, highlighting the real-time impression of event spaces. Record environment interviews offered detailed qualitative opinions, and rendering environment interview helped simulate real-world interactions while collecting user feedbacks. Key findings show that family participation drives the need for kid-friendly areas, while stall visibility and event layout play a crucial role in attendee engagement. This analysis offers valuable insights for improving event design, and making spaces more accessible and engaging for diverse audiences.
Following the analysis of data collected from onsite interviews with visitors, the responses were professionally translated into English by human (native Japanese translators) for subsequent processing. At this stage, besides NLP keyword analysis the collected data was also manually analyzed for each event to identify key themes and formulate questions for the offsite interviews (Record, and Rendering), which were conducted while reviewing event video recordings. The details of the onsite data collection process are explained in section Section 3.2 and Section 3.3.
The remaining analysis was conducted in three major phases, as outlined below:

3.4.1. Phase-1

In Phase-1, keywords were categorized into three distinct classifications: Activities, which include actions performed or observed like eating, walking, and buying; Physical elements, referring to tangible objects or items such as sweets and farm products; and Atmosphere, capturing environmental or emotional impressions like lively, fun, and natural.
Clear definitions for each category were established to maintain semantic precision and ensure that the keywords accurately reflected the content and nuances of the interviews. Then, a keyword extraction matrix was employed, mapping the keywords into a six-column structure comprising the keyword and its definition for each of the three categories: Physical Elements, Activities, and Atmosphere.
Definitions were crafted to highlight the key purpose and contextual relevance of each keyword, focusing on their core meanings and referencing the original context from the interviews. This step was crucial in preserving the semantic integrity and ensuring that each keyword was directly traceable back to the source text. Figure 2 summarizes the Phase-1 total (bar) and unique keyword frequencies (inner bar) of three categories across events. The top list of unique keywords for each event is provided in Table 2. The table shows that some cases exactly match the keywords, while others are different.

3.4.2. Phase-2

In Phase-2, the data was analyzed without predefined classification, and NLP API self-generated identification was adjusted to identify potential correlations with the Phase-1 outputs. Through structured methodology, interview content was analyzed using keyword extraction, categorization, and thematic analysis. In both phases, keywords were systematically extracted per person based on predefined criteria to ensure accuracy and relevance.

3.4.3. Phase-3

In Phase-3, the analysis is extended through the use of a developed virtual environment, which is based on the outcomes of Phase-1 and Phase-2. This phase is essential as it facilitates an unbiased continuation of the four predetermined keywords identified in Phase-2, enabling a more comprehensive evaluation of their impacts. Similar to Phase-2, the analysis in Phase-3 is systematic and relies on structured methodologies to ensure consistency and reliability.Like the video interview, here, the proposed algorithm for custom weights is also applied to the keyword frequency counting. It ensures the human behaviour-related error during the counting of the keyword as discussed in Section 4. The ultimate goal is to validate the video interview sessions by assessing how these sectors impact or align with the thematic outcomes.

4. Data-Driven Insights for Analyzing Environmental Dynamics

Understanding environmental dynamics within the context of community events used in this study requires a structured approach to data collection, processing, and analysis across several stages. Such a multi-stage framework not only relies on visitor feedback but also incorporates surveys, on-site interviews, video interviews, and interview on virtual environment, along with the analysis of video content, images, and the developed virtual environment, as outlined in Section 3. This section presents a comprehensive analysis to extract meaningful insights from interview data by systematically analyzing keywords and themes across all three events described in Section 3.
The analysis is carried out in two major parts. Part-1, in Section 4.1, discussed details of our proposed algorithm for keywords analysis while in the Part-2 in Section 4.2, we detailed analysis of the key findings of our models outcomes.

4.1. Proposed Algorithm for Suitable Keyword Weighting in Text Analysis

In analyzing human behaviour, preliminary findings revealed that both the interviewer’s (participant) and interviewee’s words significantly influence the conversation. For example, participant P4’s conversation response to the interviewer is higher than self-interested talking. This category of participants responds to the interview by saying “No” or “Yes” to a particular keyword. Thus to ensure no potential keywords are missed, we include the interviewer’s keywords in the set of keywords attributed to the person being interviewed (participant). This approach eliminates the consideration of the interviewer as a participant while capturing all relevant keywords from the conversation.
However, there is a high chance of incorrect keyword counts in this approach when interviewer keywords are included. To prevent this, the combined keyword set undergoes the proposed weighting algorithm, ensuring that appropriately weighted keywords are used for analysis.
The proposed algorithm is illustrated in Figure 3. Two specialized modules, the top candidate module, and the final weighting module, are used to determine the actual keywords and their corresponding weights. This algorithm is partially designed to address two major challenges in working with NLP. Since NLP statistically calculates keyword frequency, human behaviour can introduce biases. This algorithm ensures that each person (Participant-1, Participant-2, ..., Participant-n) and their corresponding keywords (Keyword-1, Keyword-2, ..., Keyword-r) are correctly processed. The weights for each keyword are adjusted to mitigate these biases. Keywords are weighted based on their frequency and relevance within a defined range ( α max and α min ), as shown in Algorithm 1.
Algorithm 1: Proposed Keyword Weighting Algorithm
Require: 
Keyword frequencies f k , weight factor ω , range α m i n , α m a x
Ensure: 
Weighted keywords W k
  1:
for each keyword k do
  2:
   Compute t e m p 1 + ( f k × ω )
  3:
   if  t e m p > α m a x  then
  4:
       Set W k α m a x
  5:
   end if  t e m p < α m i n  then
  6:
       Set W k α m i n
  7:
   else
  8:
       Set W k t e m p
  9:
   end if
10:
end for
11:
return Weighted keywords { W k }
As the keyword frequency can be significantly biased due to human behaviour, disproportionately impacting certain keywords. For instance, in Figure 4, the keyword "see" in the activity category has a much larger influence compared to others. To address these biases, keywords are identified using the GPT-4 API, categorized based on relevance, and their frequencies are analyzed to determine occurrence. The proposed algorithm, illustrated in Figure 3, calculates weights for each keyword within a defined range ( α m a x and α m i n ), streamlining classification and prioritization. W k is calculated using the formula Equation 1, where f k represents the frequency of keyword k and ω is the calculated weight factor.
W k = α m a x , if 1 + ( f k × ω ) > α m a x α m i n , if 1 + ( f k × ω ) < α m i n 1 + ( f k × ω ) , otherwise
The proposed algorithm ensures fair weight distribution, assigning higher significance to frequently used keywords while maintaining proportionality. As shown in Figure 4, the top seven keywords and each person’s keyword frequency are adjusted based on the proposed algorithm illustrated in Figure 3 with the weight factor ω = 0 . 08 . From the figure, it is clear that although a particular keyword, such as "see," or a specific participant, such as "P3," had a high impact in terms of frequency count, after applying the adjustment, it was weighted within the defined range.

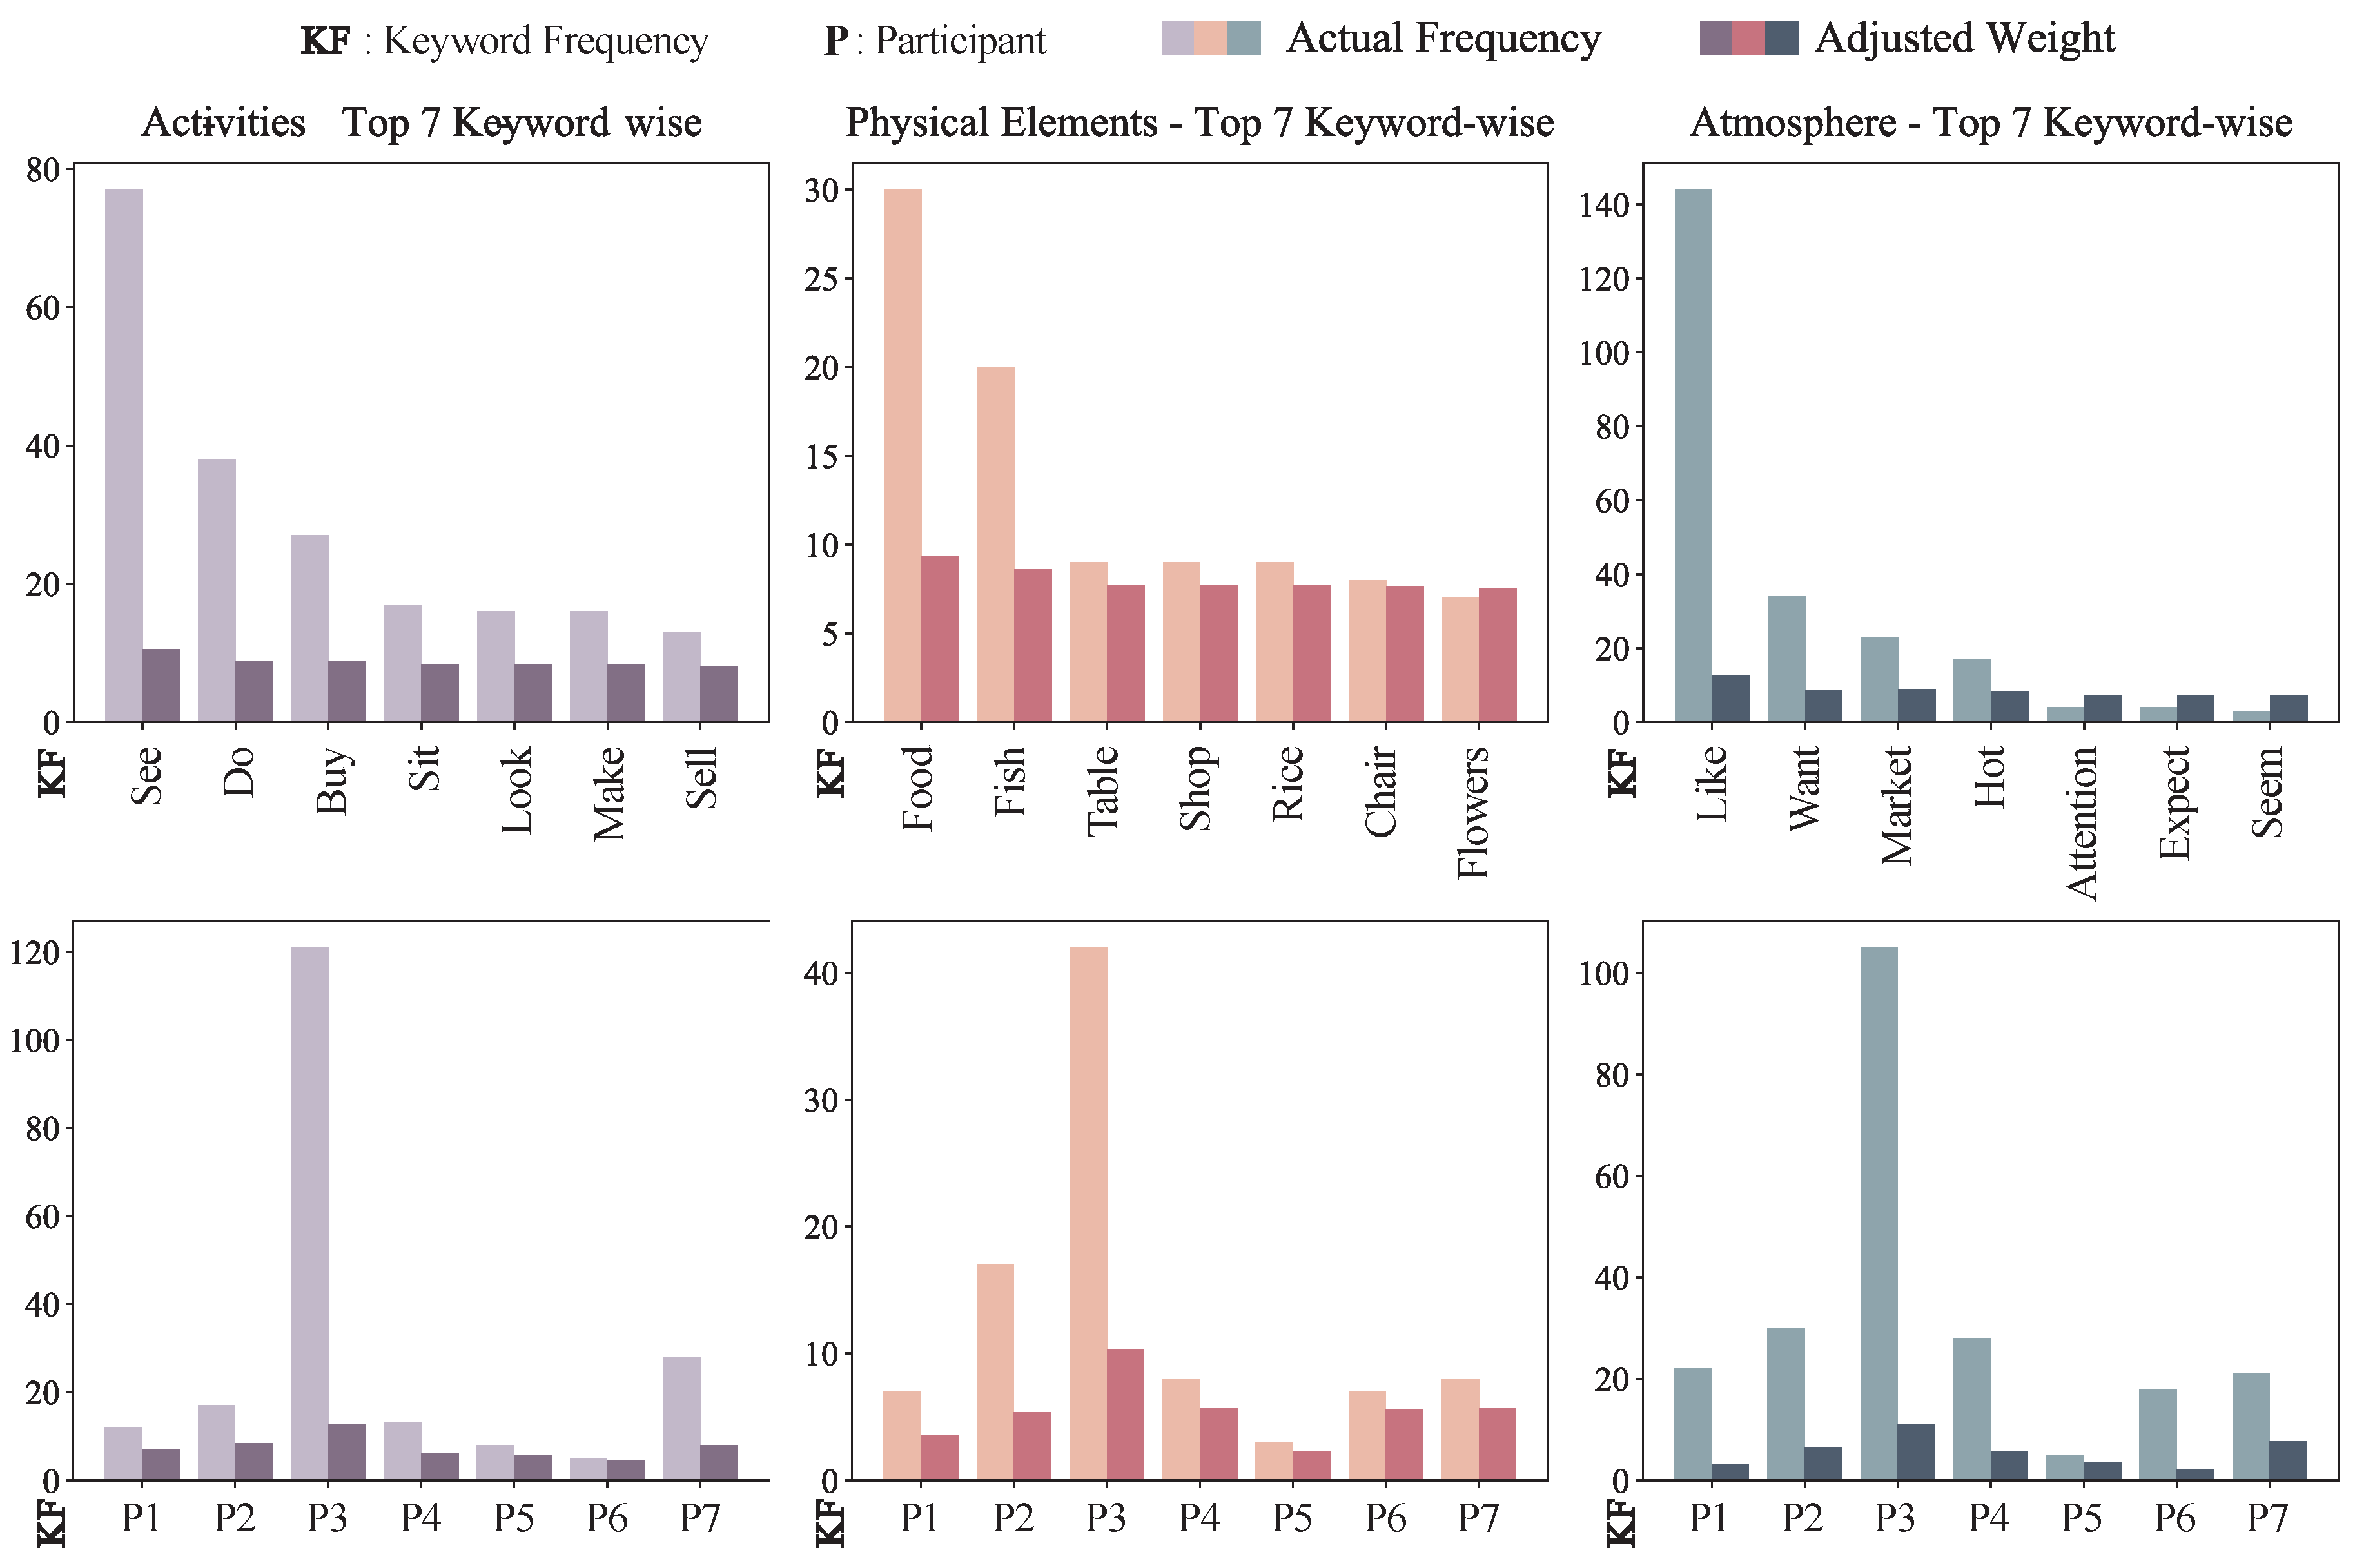
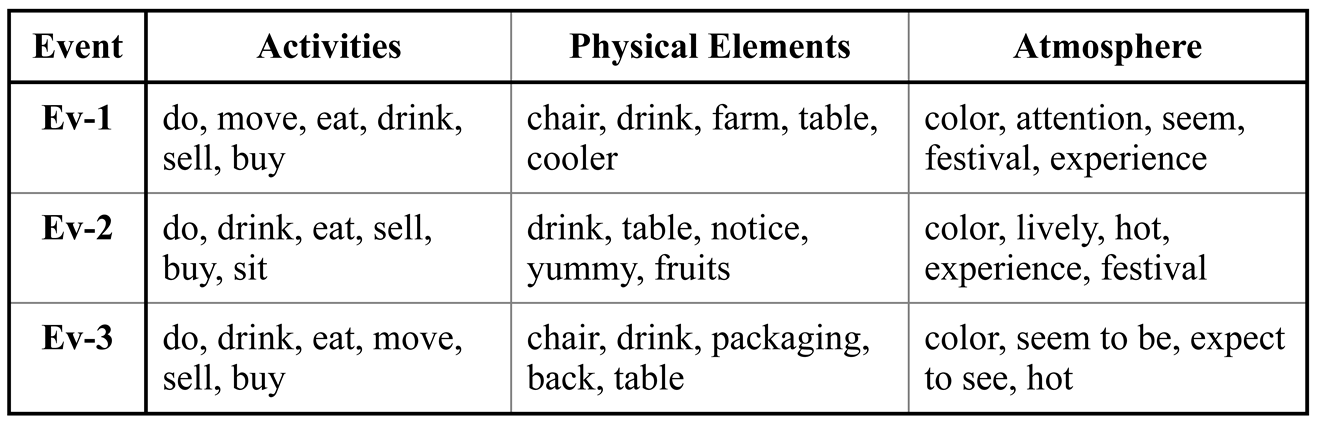
4.2. Analysis and Key Findings of Data-Driven Environment

Figure 5 illustrates the network graph depicting relationships among themes, events, and participants. The four themes are shown along with their connections to events and interviewees, highlighting their inter-dependencies.
In the graph, the size of each node (circle) represents its occurrence or frequency, with larger nodes indicating higher frequency. Different colors are used to distinguish the themes, as specified in the figure legend. Solid lines connect the events to the four themes, whereas dotted lines indicate connections between individuals and themes.
The figure reveals that some individuals, such as P5 and P2, exhibit higher engagement compared to others like P1 and P6. The themes Child-Friendly Space, Product Display, and Event Layout received more attention than Advertising. These insights are derived through our proposed algorithm, which ensures the actual weights as described before.
Figure 6 presents the network graph under virtual conditions, illustrating the evolving relationships between themes, events, and individuals.
In this representation, interview keywords remain connected to their respective interviewees, maintaining the same node sizing structure as before (video interview), where the circle size corresponds to the frequency of occurrence. However, in contrast to Figure 5, an increase in theme size is observed across all categories, suggesting that engagement levels have improved within the virtual environment.
Notably, EV-2 exhibits a significant rise in attention, as indicated by its strengthened connections and larger node size compared to other events. This suggests that the immersive nature of the virtual environment has amplified user interaction with particular themes.
While the core themes—Child-Friendly Space, Product Display, and Event Layout—continue to dominate in user engagement, their prominence is more pronounced than in the physical setting. Advertising remains a less dominant theme, but its increased connectivity suggests a heightened awareness among participants within the virtual setting. Overall, the results confirm that the virtual environment impacts keyword associations, leading to a more accurate reflection of participant opinions.
Following the network graph analysis from both the video interview (Figure 5) and the virtual environment interview (Figure 6), we extend our evaluation to a direct comparison of the event-theme relationships under these two conditions. Figure 7 illustrates the cumulative comparison between the two network representations, identifying areas where engagement increased in the virtual environment and those that remained unchanged.
The transition from a traditional interview while watching the video of the event to an interview while watching a virtual environment led to an overall increase in engagement with core themes, particularly Product Display, Event Layout, and Child-Friendly Space. In this particular network graph, the person impact is not shown and also the event circle is not scaled as the key objective is the determine the impact of the theme. This suggests that participants found the virtual setting to be more immersive, leading to deeper interactions. The virtual environment also refined the representation of participant sentiment, allowing attendees to express opinions in a more structured and thoughtful manner.
Event-specific engagement patterns indicate that EV-2 exhibited the most significant increase in attention, with a +2 impact on child-friendly space and a +1 impact on the product display. In terms of the most impactful event, EV-3 is considered the most influential as it shows a positive impact across all keywords (advertisement, child-friendly space, and product display). However, it has a negative impact on child-friendly spaces.
In terms of keyword analysis, as shown in Figure 7, product display has the highest impact across all three events, with a positive relationship. This indicates that architectural involvement is of high importance, as it is relevant to all the events. Child-friendly space, advertisement, and event layout also show significant impact, but not symmetrically across all events. For example, in EV-2, the impact of advertisement and event layout remains unchanged, whereas product display and child-friendly space exhibit the highest positive impact. This network difference graph, where individual participant opinions are not considered, highlights the impact of the virtual environment. Notably, there are no significant negative impacts, except in EV-3, which shows one negative impact on child-friendly space. All remaining keywords either show a positive increment or no change. The final weighted analysis, as shown in Figure 7, provides a consolidated view of these findings, marking areas of significant change and stability.

5. Impact on Visual Attractiveness of Temporary Event Space

This chapter shifts the focus from purely data-driven approaches to visual attractiveness to a correlation between data-driven and spatial analysis, examining how stall layouts, placement, and display strategies collectively shape the event’s visual appeal. Through this correlation, it uncovers that vendors often favour simpler stall layouts for ease of setup influenced by the pre-set placement of event organizers and tend to adopt more elaborate display strategies to compensate for their disadvantageous location. The chapter further explores the nuances of participant behaviour across key event themes, including child-friendly spaces, product displays, event layouts, and advertising, revealing how demographic factors like nationality, gender, age, and parental status distinctly influence thematic engagement and keyword distribution. Building on these findings, a data-driven model, integrating weighted keyword analysis, spatial perception, and participant feedback, is presented as a practical tool for optimizing event planning. Finally, the chapter validates the model’s scalability by expanding the participant pool, demonstrating its consistent effectiveness in predicting and enhancing event engagement across diverse user groups, and confirming the stability of the weighted keyword algorithm.

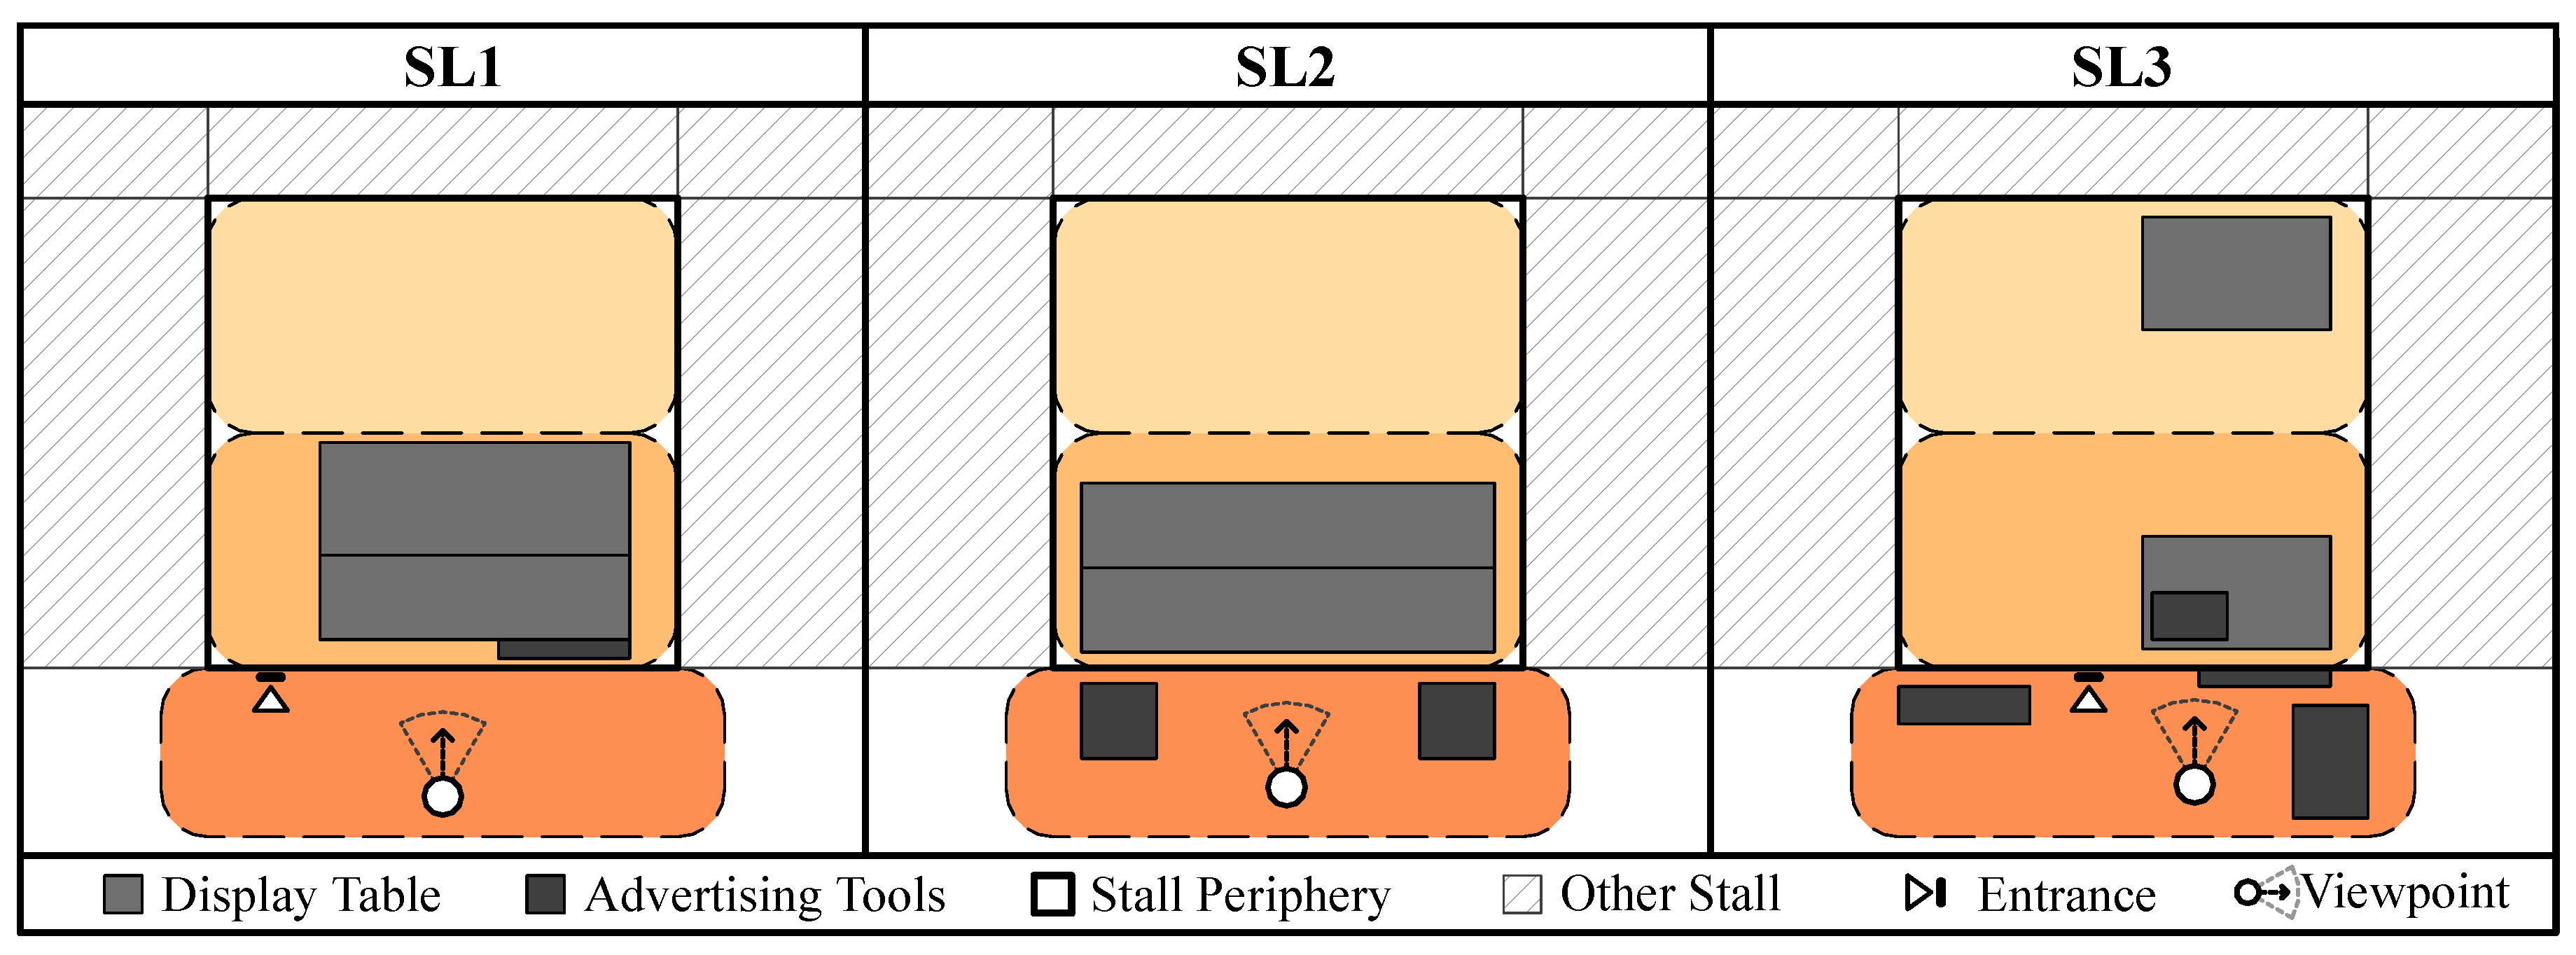
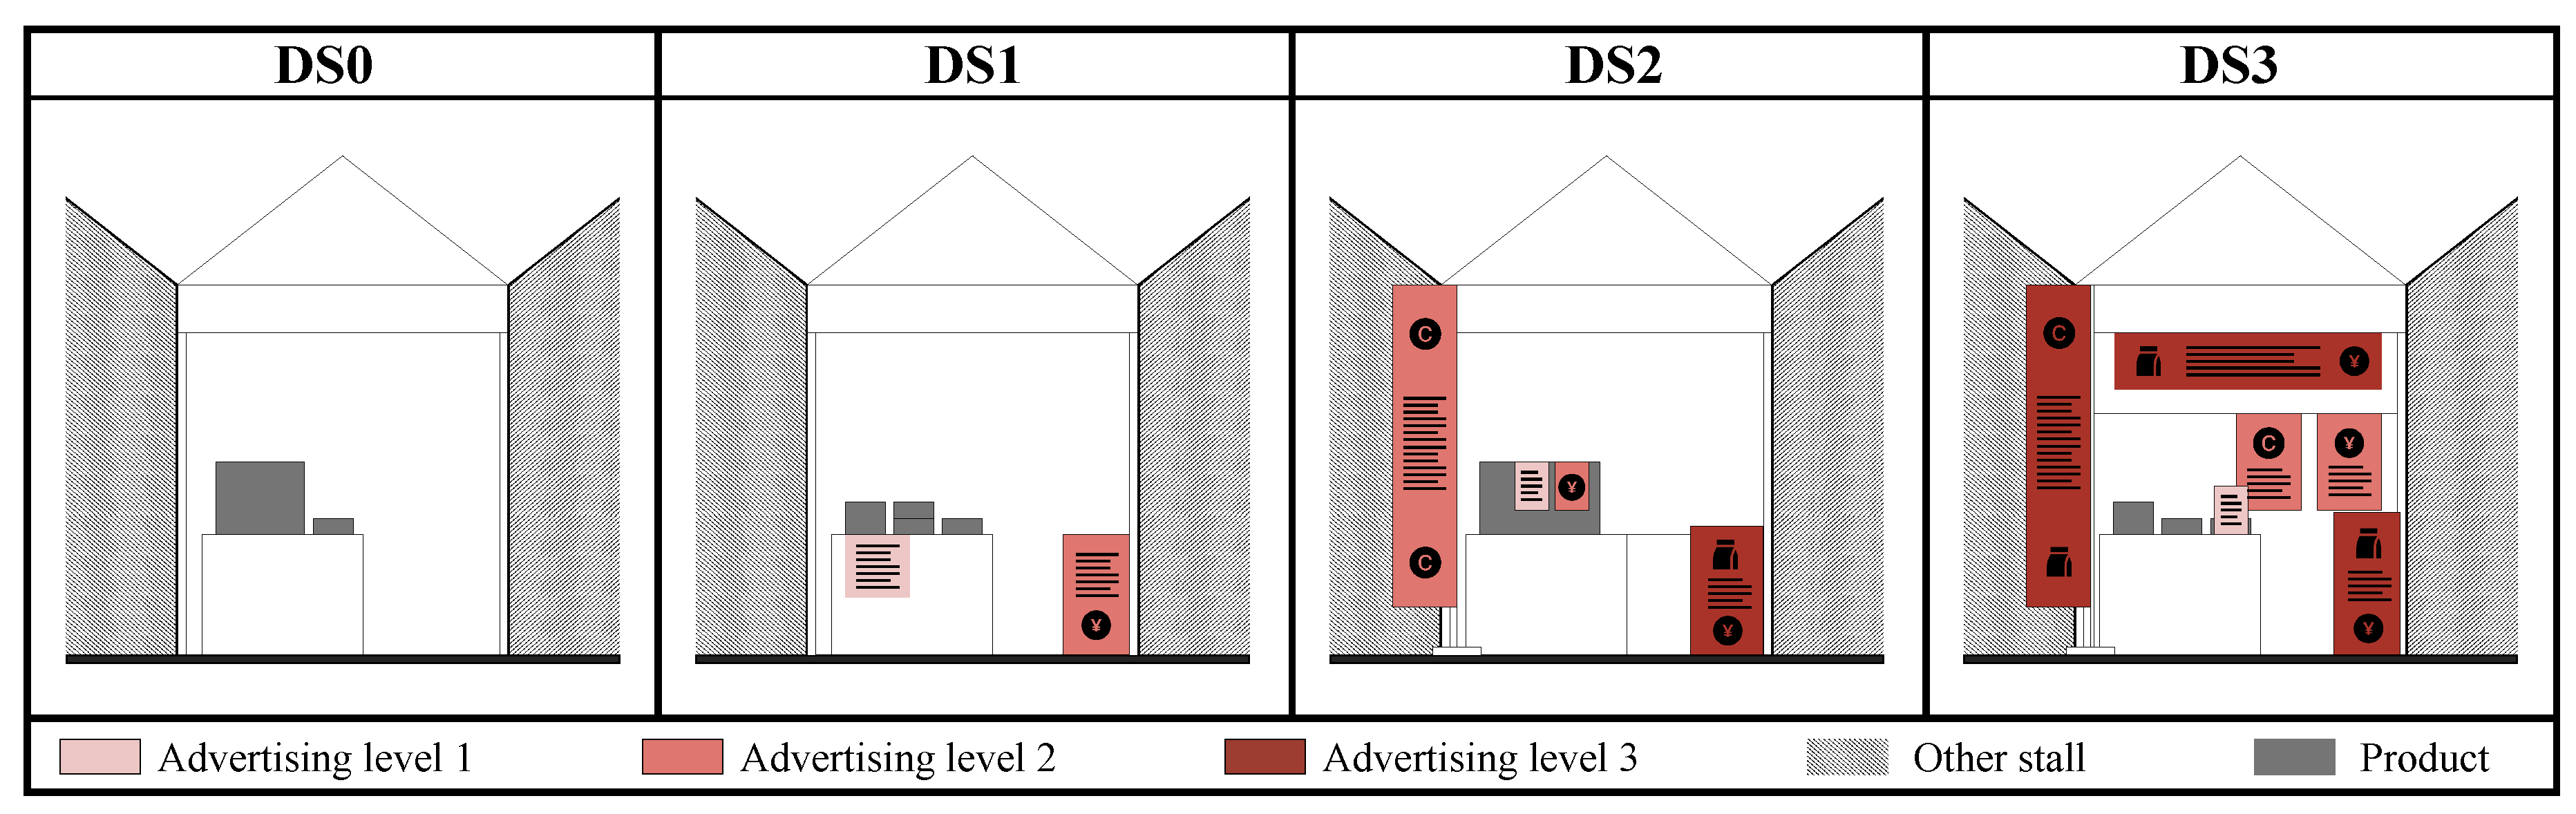
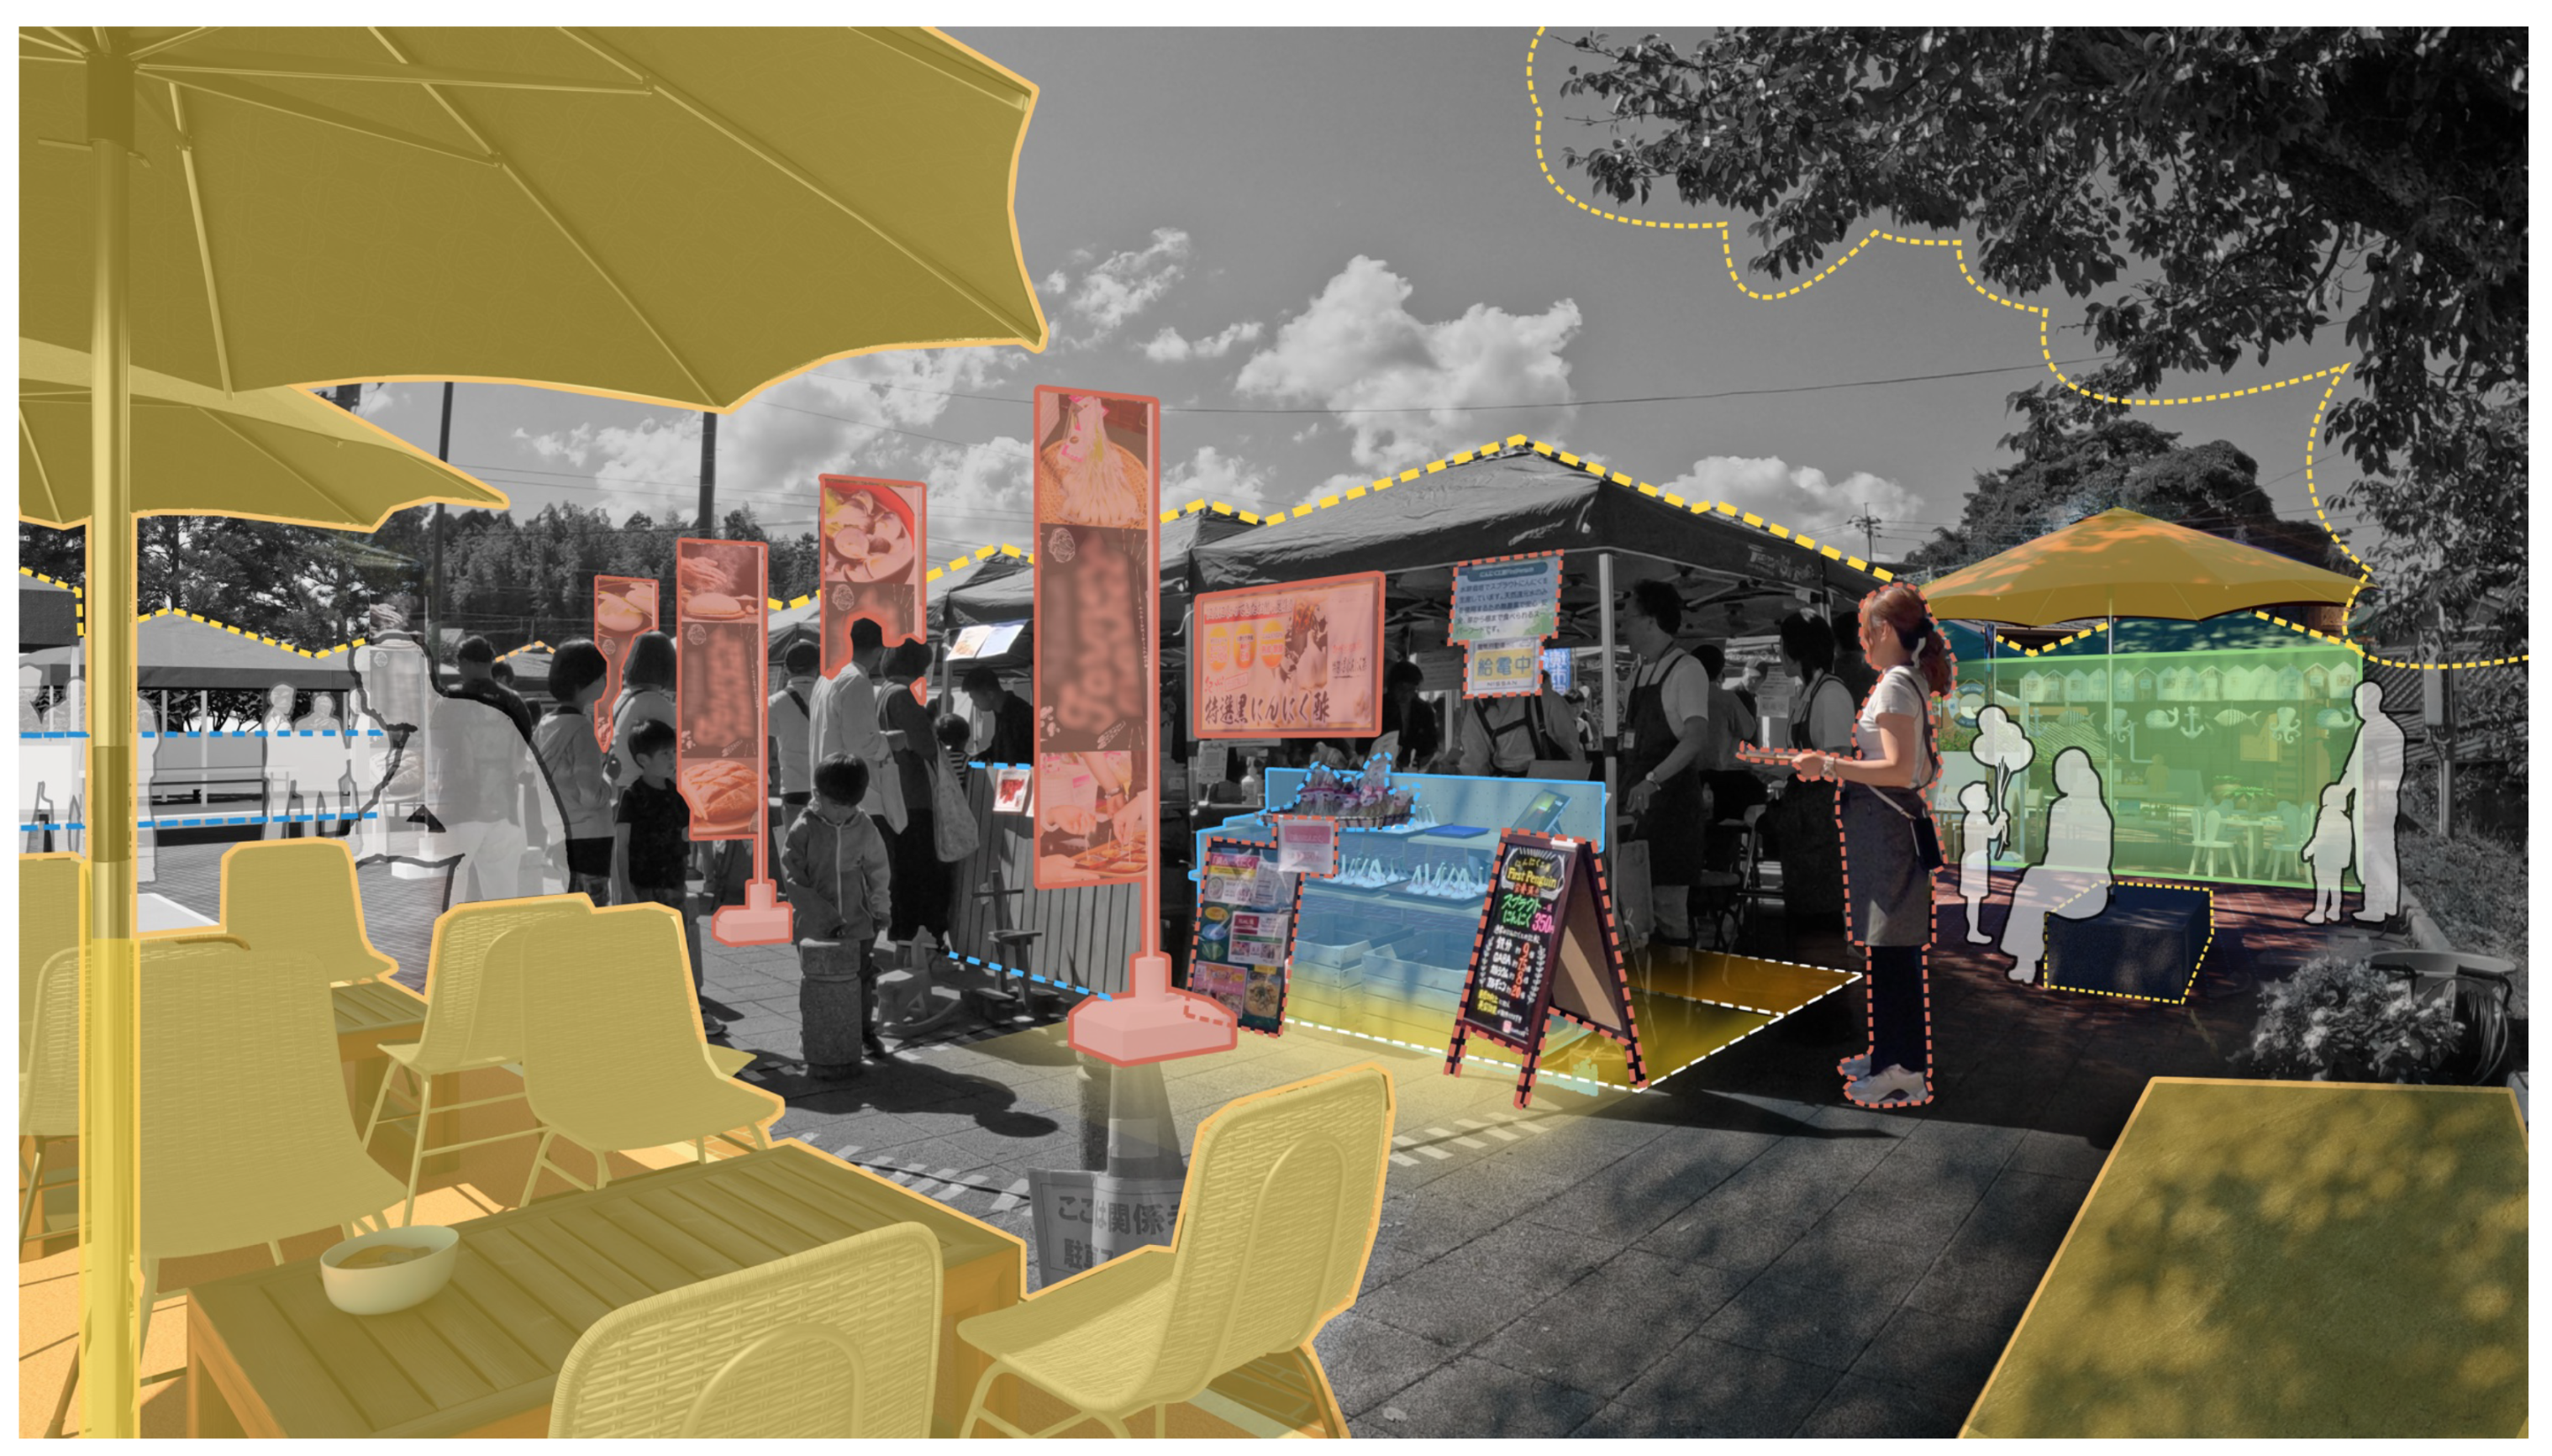
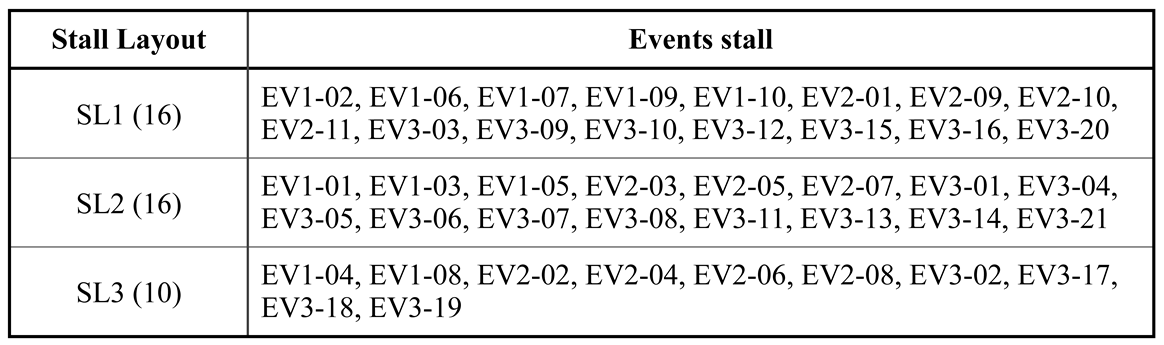
5.1. Spatial Analysis

In order to understand the impact of visual attractiveness in terms of spatial arrangement, this study begins by analyzing spatial perception through three key categories: Stall Layout, Placement and Visibility, and Display Strategy. Stall Layout examines the spatial composition of elements, such as tents, tables, and display shelves, provided by event organizers, while vendors position them within their designated spaces. Placement and Visibility focuses on how each stall is positioned within the event perimeter and its visibility from main access points, an aspect influenced by organizers. Display Strategy looks at how vendors arrange physical elements to effectively display their products and attract customer attention, which is primarily determined by the vendors themselves. By exploring these strategies, the study reveals how the decisions made by both organizers and vendors impact the event’s overall visual attractiveness.
Firstly, Stall Layout is classified into three types based on the layout within the designated area of the stall periphery under the tent (Table 3). SL1 places a display table at the front of the stall, within this designated area. SL2 adds more display elements in front of the stall, extending beyond the designated area. SL3 incorporates additional furniture and display elements at the back of the stall, within the designated area, for vendor preparation and storage. Among the 42 stalls analyzed, 16 use SL1, 16 use SL2, and 10 use SL3, with SL1 and SL2 showing the least effort in terms of layout complexity, as they are used more frequently by vendors compared to the more complex SL3 (see Figure 8).
Placement and Visibility are categorized into three levels: PV1 (least visible), PV2 (moderately visible), and PV3 (most visible), based on how easily each stall can be seen as visitors approach the event (Figure 9). In the EV-1 layout, outdoor stalls generally have PV2, except for the first stall located on the main street, which has PV3 due to its corner placement and prominent front position. The indoor zone has PV1, but despite this lower visibility, most gatherings occur indoors because the main coffee shop is located there, drawing the majority of visitors. In EV-2, stalls facing the street have PV3, while stalls positioned perpendicular to the street have PV2. Indoor shops, with PV1, attract fewer visitors, likely due to their less prominent location and unclear signage. The kids’ zone, located behind the street-facing stalls, also has lower visibility. The eating area, with PV3, is highly visible due to its open design. Despite being positioned away from the street and the eating area, one kitchen car still attracts customers because it faces the eating area. In EV-3, the food area, facing the station, has PV3 and attracts the most customers. The large square, which connects the station to the event, offers better visibility of the stalls in the front. Shops located further back, with lower visibility, are less frequently visited but offer a more relaxing experience. Customers use the benches in this quieter area to eat and enjoy the contrast to the crowded spaces. This event also attracts the most elderly visitors, who prefer a peaceful environment.
Finally, the Display Strategy analysis reveals how stores capture visitors’ attention through factors such as the positioning of elements relative to eye level, banner placement, size, and colour contrast. The strategies are categorized as follows: DS0 refers to the initial setup provided by the event organizer, without additional display elements added by the vendor; DS1 involves minimal advertising elements, such as banners attached to tablecloths or placed on tables, usually with text and price information; DS2 uses two banners placed in different positions on the store front, with a combination of text, photos, and pricing information; and DS3 utilizes larger banners with more colour contrast and multiple placements to catch attention from various angles. As shown in Figure 10, DS1, which involves minimal advertising, was the most common strategy, used by 17 stalls. The second most common strategy, DS2, was used by 14 stalls, while DS3, which uses larger banners and more contrast, was employed by just 7 stalls. DS0, which reflects the initial setup by the event organizers, was employed by only 4 stalls, indicating that most vendors made additional efforts to engage event visitors with their initial displays.

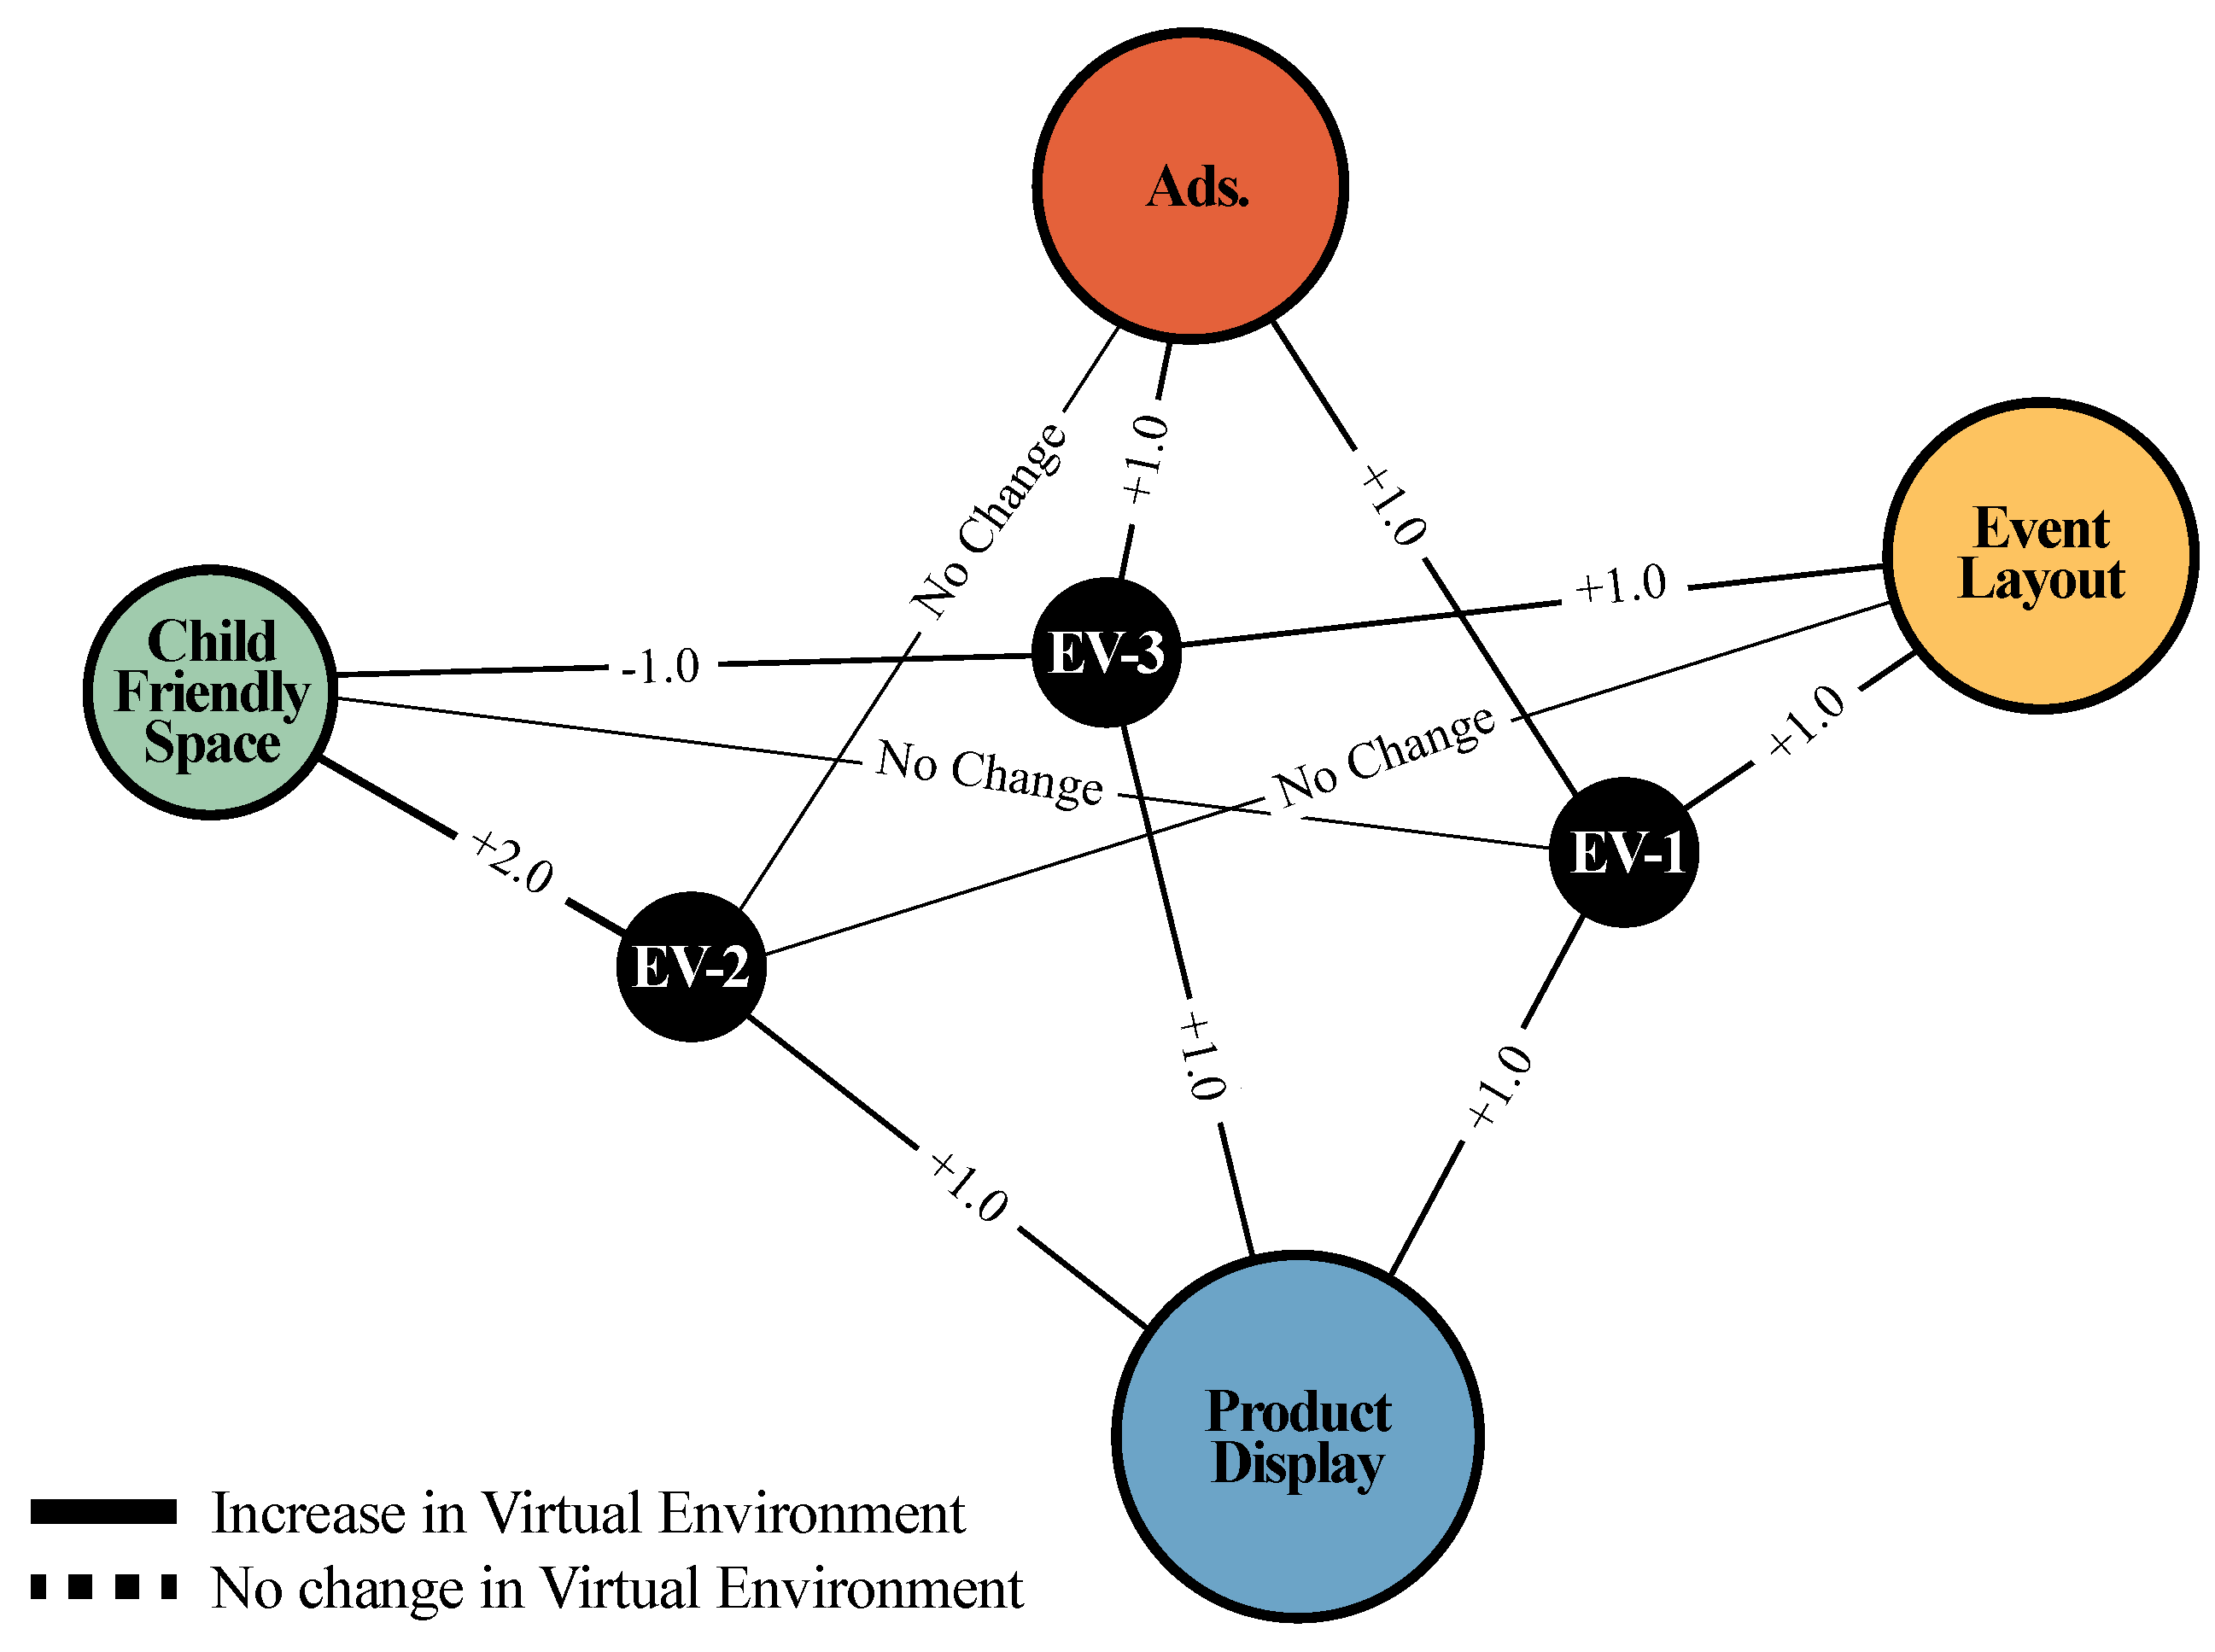
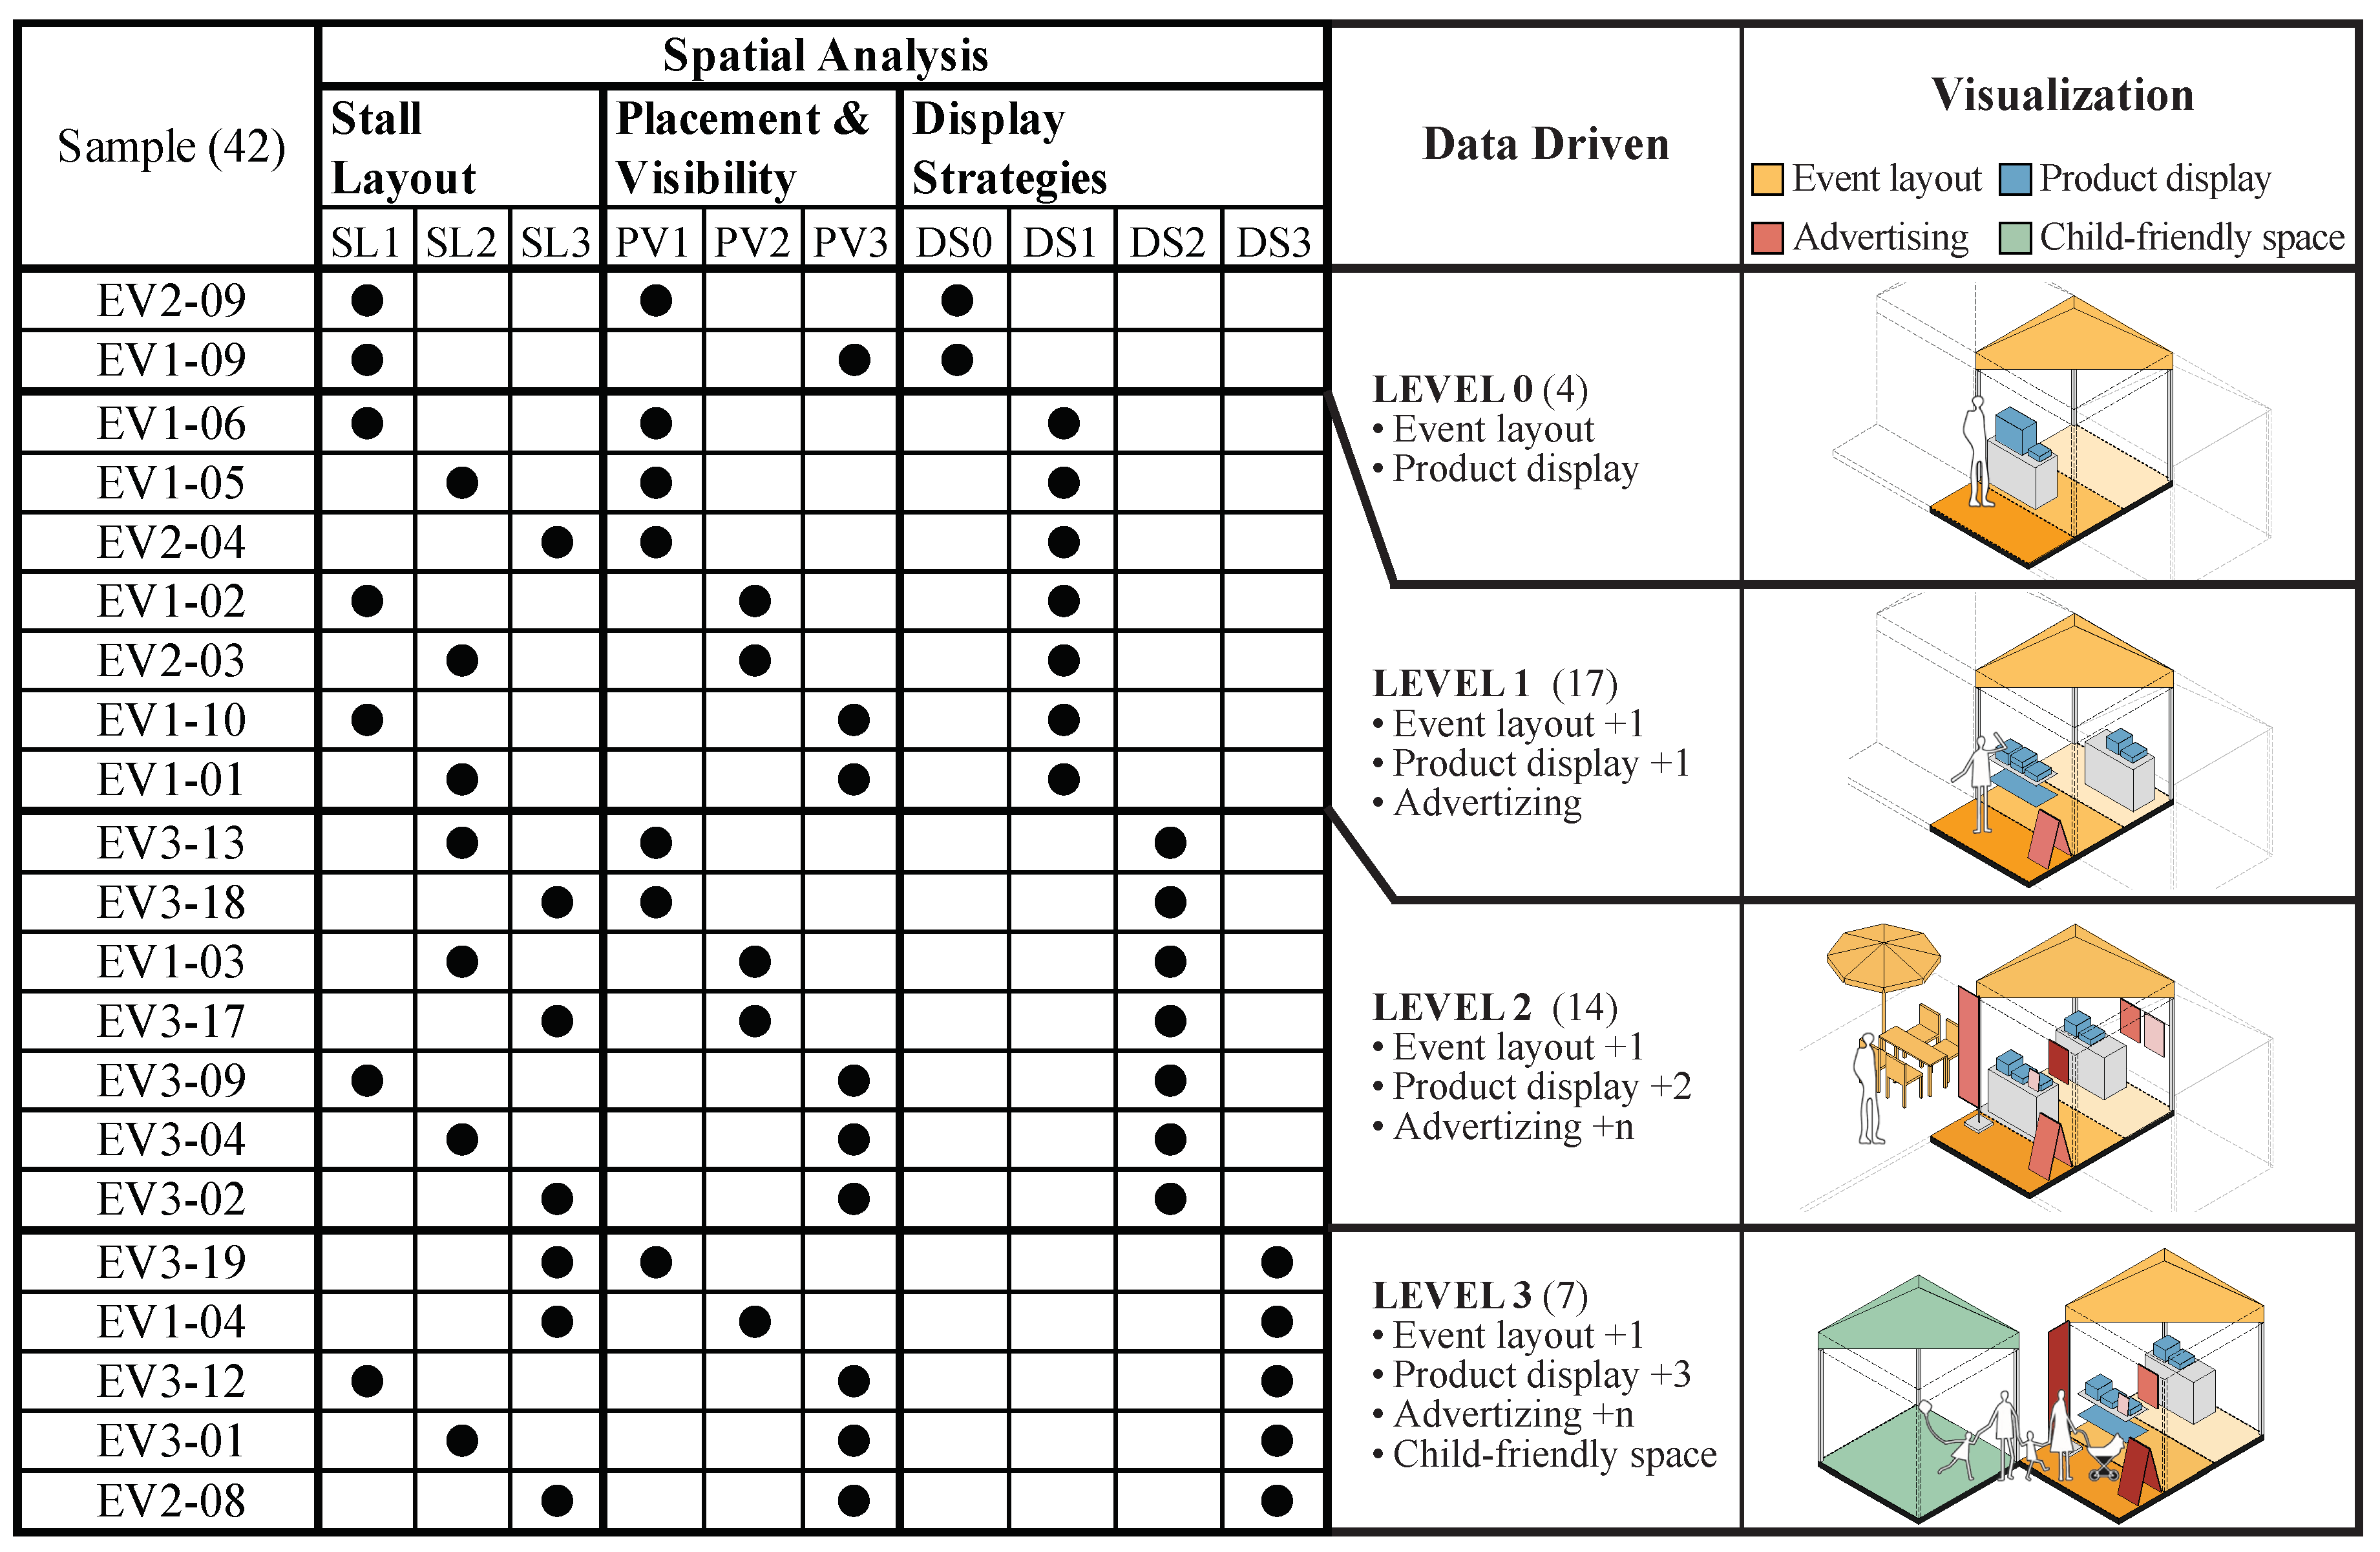
5.2. Visual Attractiveness from Data-Driven Spatial Analysis

The analysis of 42 stalls across three event spaces reveals a strong correlation between spatial analysis and visual attractiveness (Figure 11). Vendors predominantly utilized the simplest stall layouts (SL1 and SL2), likely due to ease of setup and cost-effectiveness. However, stall placement significantly impacted visibility and, consequently, the vendors’ display strategies. Corner and peripheral stalls, positioned along primary visitor pathways (PV3), consistently enjoyed higher visibility and natural foot traffic. Conversely, stalls located in less visible areas, such as those hidden from circulation or indoors (PV1, PV2), faced greater challenges in attracting attention. With the notable exception of the main store at EV-1, these less visible stalls often adopted more complex display strategies (DS2, DS3) to compensate for their less advantageous location. These strategies included bold colour contrasts (e.g., black text on traditional fabric), larger text and pricing displays, and interactive elements (e.g., free samples, verbal promotion) designed to engage passing visitors actively.
From a spatial design perspective, enhancing stall visual attractiveness requires careful consideration of layout principles, perceived visibility, and the vendors’ display efforts. In regional areas like Matsue, where event attendance may be smaller, optimizing event space quality to meet visitor expectations is crucial for boosting attendance and supporting stakeholder needs [84]. Although Matsue vendors and organizers often use social networks, brochures, and banners for promotion, the experience on-site, including route discovery and general event organization, can be inconsistent due to the limited resources and event management expertise of individual small stores [85]. This lack of structured event management, often exacerbated by limited communication between organizers and vendors, can negatively impact the visitor experience. Furthermore, the diverse goals of event organizers—ranging from community-based charity to profit-driven ventures [86], decisions regarding layout and vendor selection, add another layer of complexity to event design. Therefore, integrating qualitative and quantitative analysis of visual attractiveness, and understanding the correspondence between spatial design and user feedback, is essential for creating successful and engaging temporary event spaces.

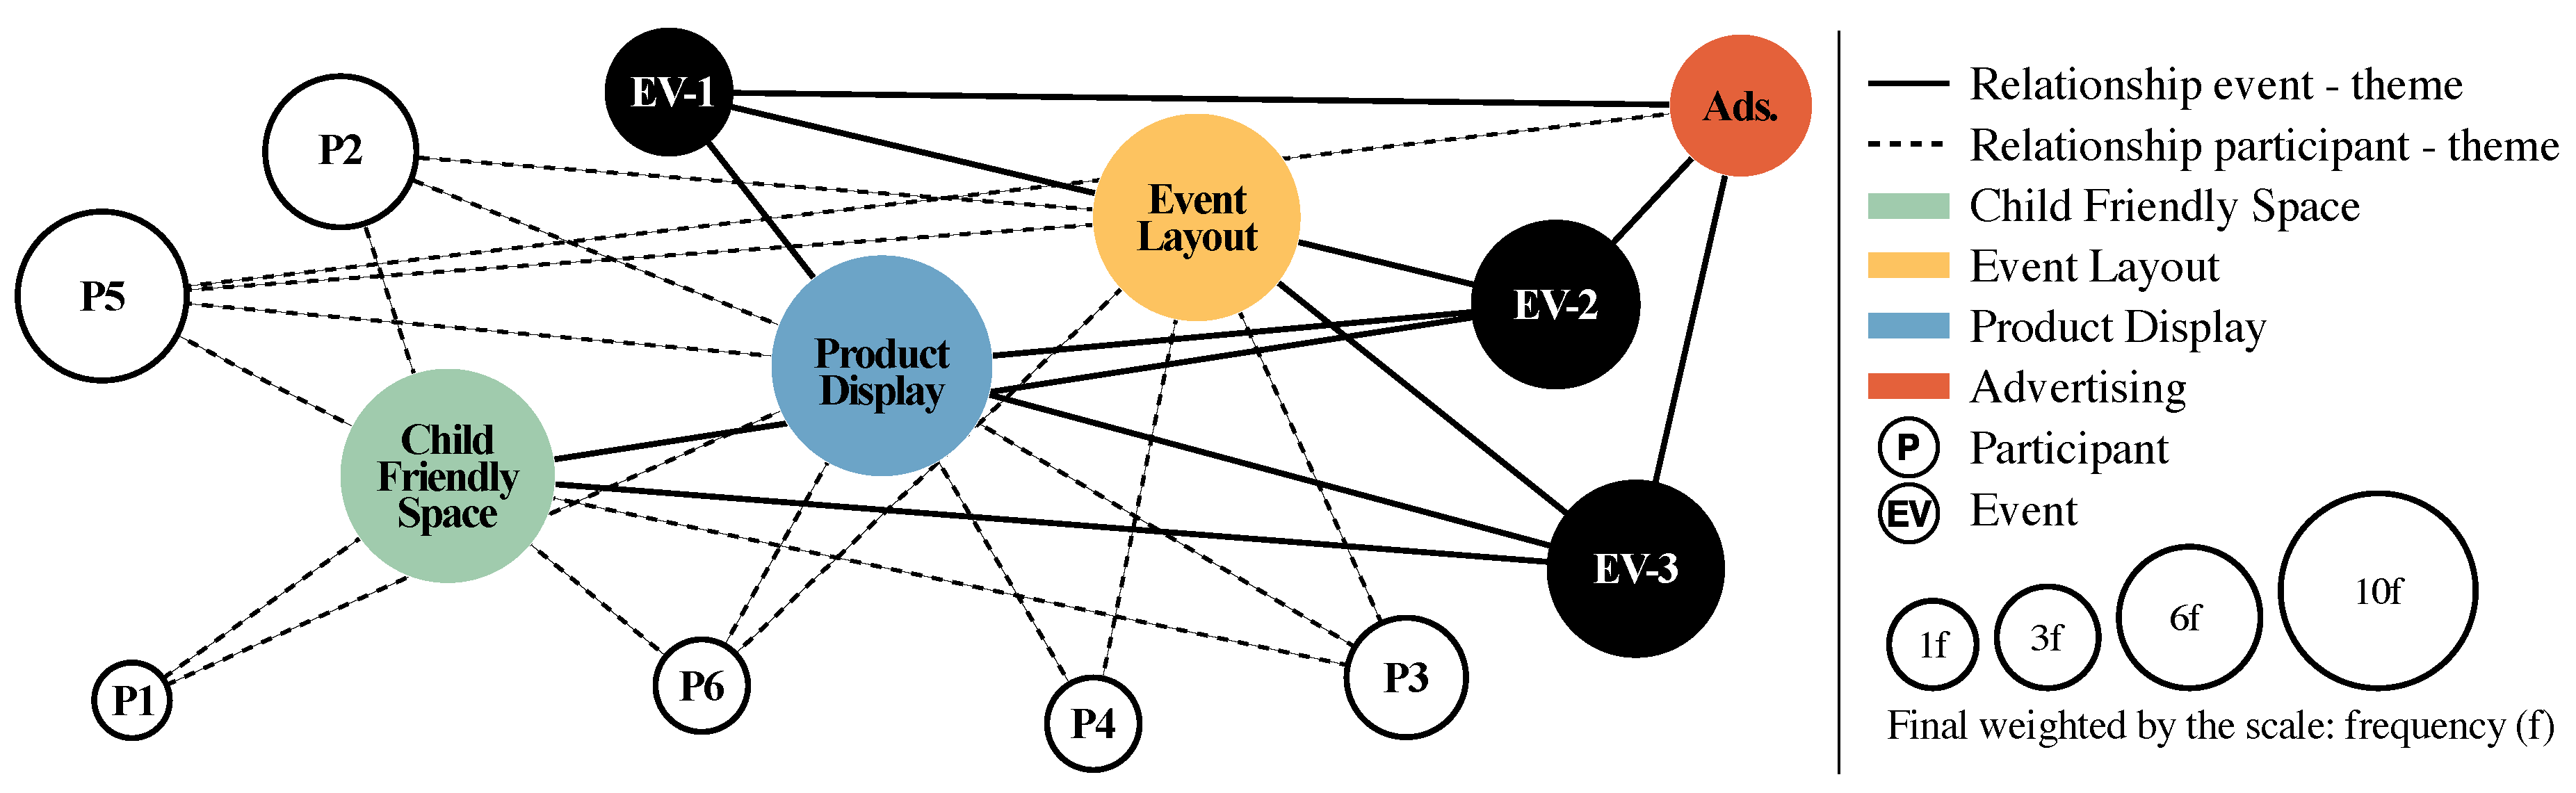
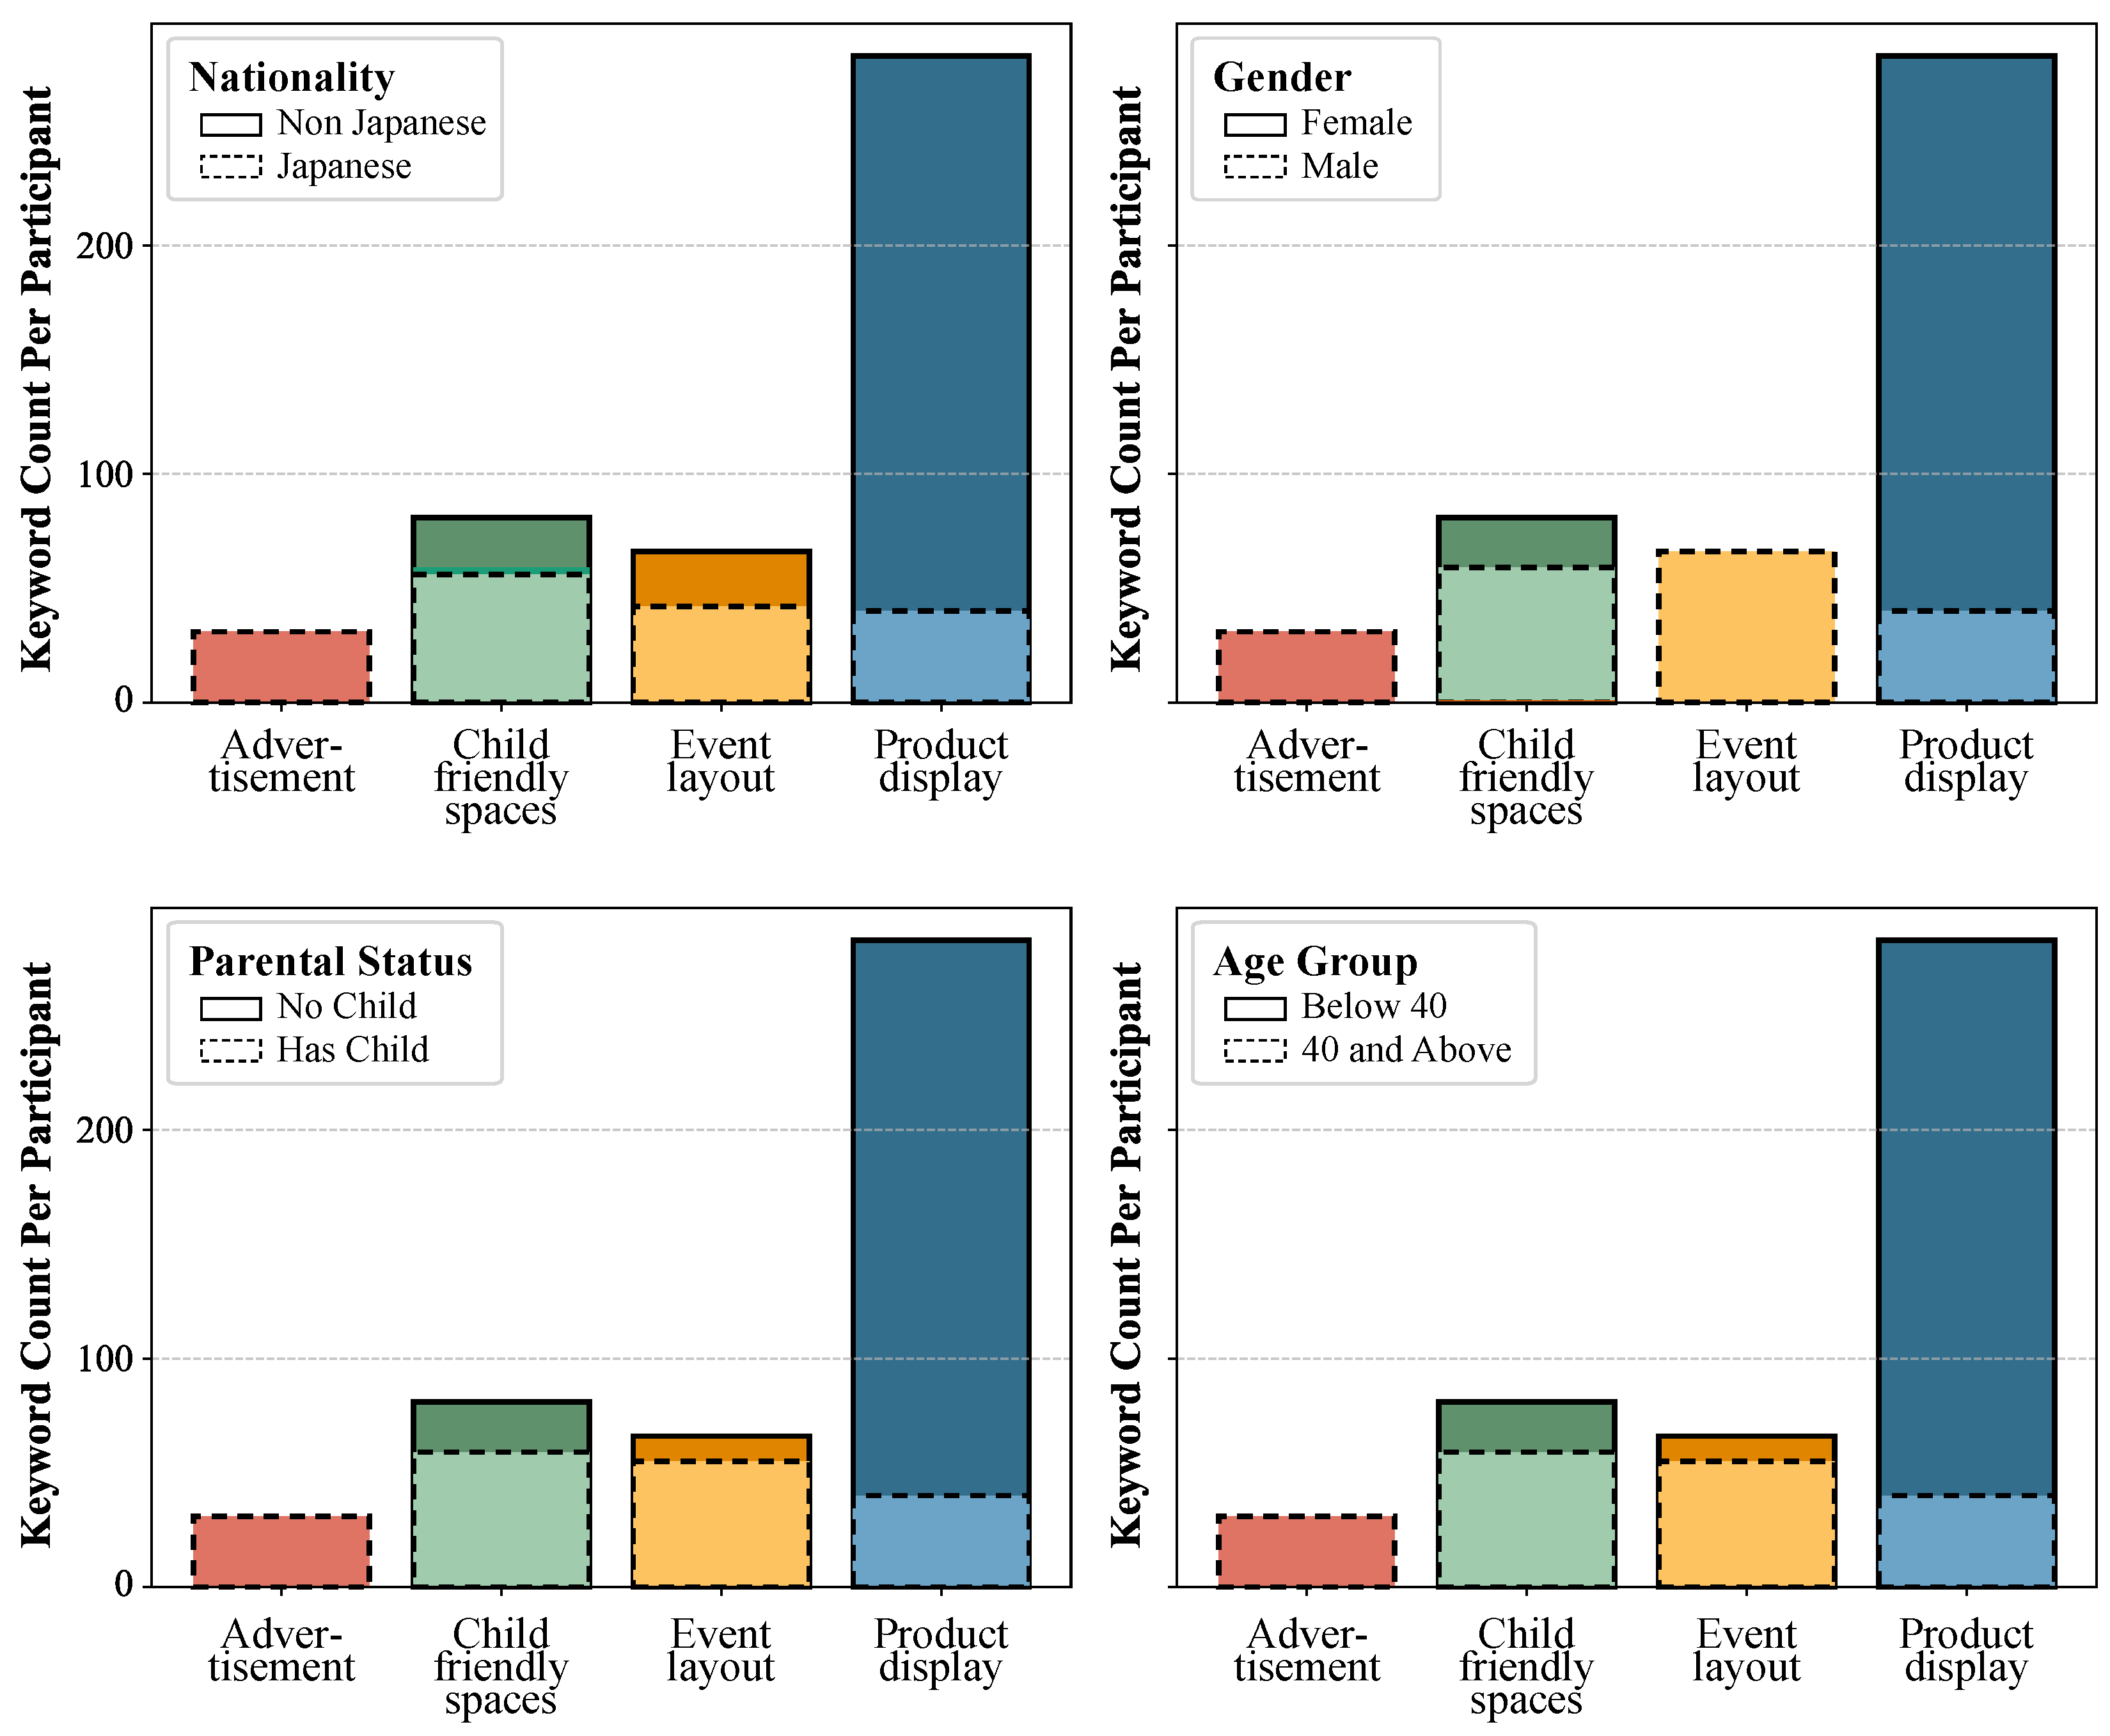
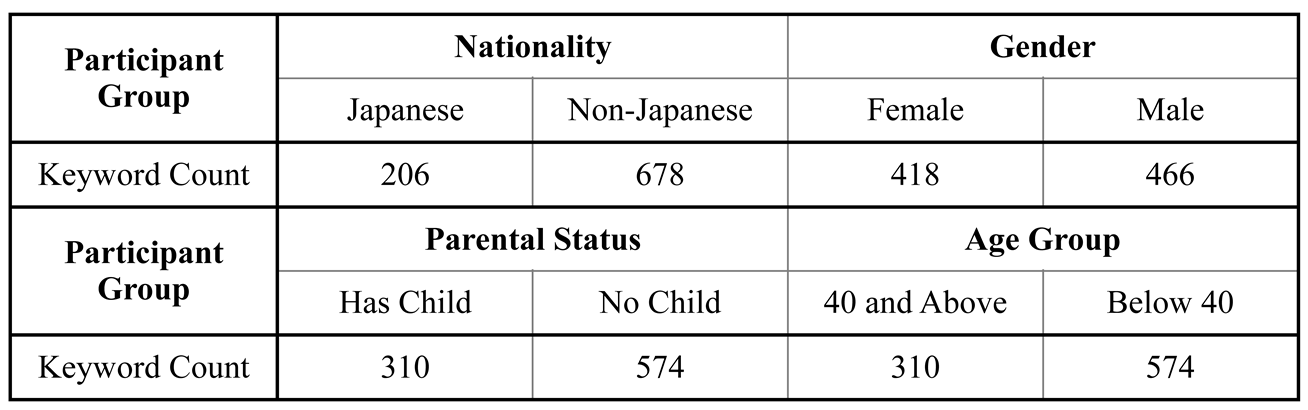
5.3. Participant Behavior Analysis with Different Themes

Having established the synergy of understanding visual attractiveness by correlating data-driven approaches and spatial analysis, and recognizing its impact on bridging designer intent and user experience, we now delve into a deeper understanding of user behaviour across various event themes to provide a more comprehensive picture of event engagement. We analyze the impact of participant behaviour across all themes. Since the actual participant groups are not equally balanced, for example, as mentioned in Table 4 the data set for the virtual and video interviews contains four Japanese and two non-Japanese participants. To overcome this issue, we normalized the data by averaging per person before comparison for all the themes. This approach allows us to obtain an actual picture of the influence of each participant group.
As illustrated in Figure 12, the aggregate keyword count for each of the four participant groups is presented. Here, the themes and events were not considered separately to realize the overall impact of the participant group. This breakdown highlights the strong influence of participant groups on thematic engagement, except for the parental status " Child vs. No Child" group. The other three participant groups’ differences in keyword distribution emphasize that user group characteristics significantly shape interaction with themes. The keyword count in the Male vs. Female group and Japanese vs. Non-Japanese group has a significant difference, necessitating further investigation into the impact on each theme. In the case of the age group, a large difference appeared in child-friendly spaces where the young age seem to be less concerned than the old age while the vice versa impact exhibits in the product display.
Figure 12 further examines the behaviour of the group of participants in all themes. The bar charts provide insights into how different groups interact with various themes. This detailed breakdown allows us to assess which user segments are more active in specific contexts. In the Nationality group, while the Japanese nationals are not too concerned about the product display compared to non-Japanese, the other two themes regarding child-friendliness and event layout show competitive reactions. However, in terms of advertising, while the Japanese nationals are deeply concerned about the advertising, non-Japanese are not as concerned.
Next is the Gender-based participants, where a big difference is observed in advertising, event layout, and product display. Males are more concerned about event layout and advertising, while females focus more on product display.
Finally, in the Parental Status group, it is observed that parents having no children are more concerned about the product display and most advertisements and child-friendly space, while parents without children or those not married are more concerned about the product display. Concerning the event layout, both participants expressed nearly equal impressions.
Based on a thorough analysis of user interactions across various event settings, the final data-driven model is shown in Figure 13. The figure illustrates the structured framework that integrates keyword weighting, spatial perception analysis, and participant feedback to improve event planning strategies.
The model highlights four core event themes: Child-Friendly Space (green), Product Display (blue), Event Layout (orange), and Advertising (red). The impact assessment methodology systematically evaluates participant engagement, weighting their responses based on frequency and contextual relevance.

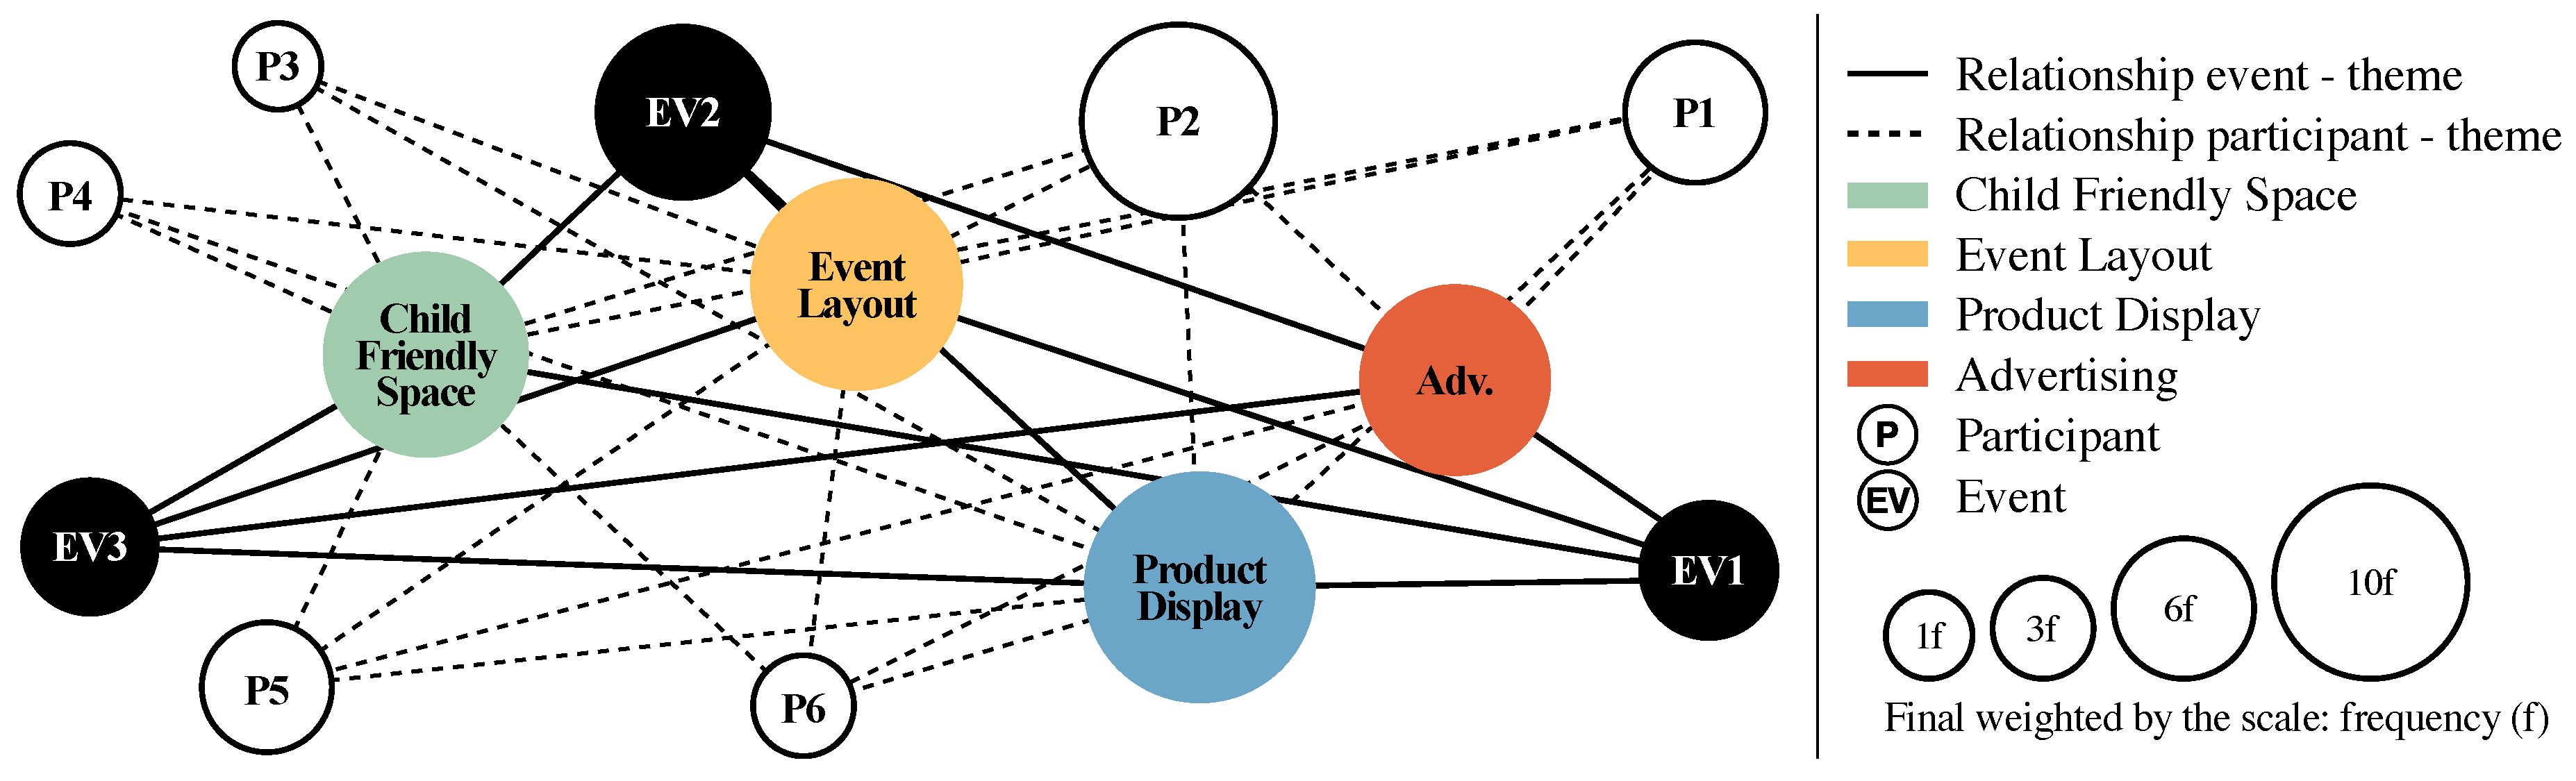
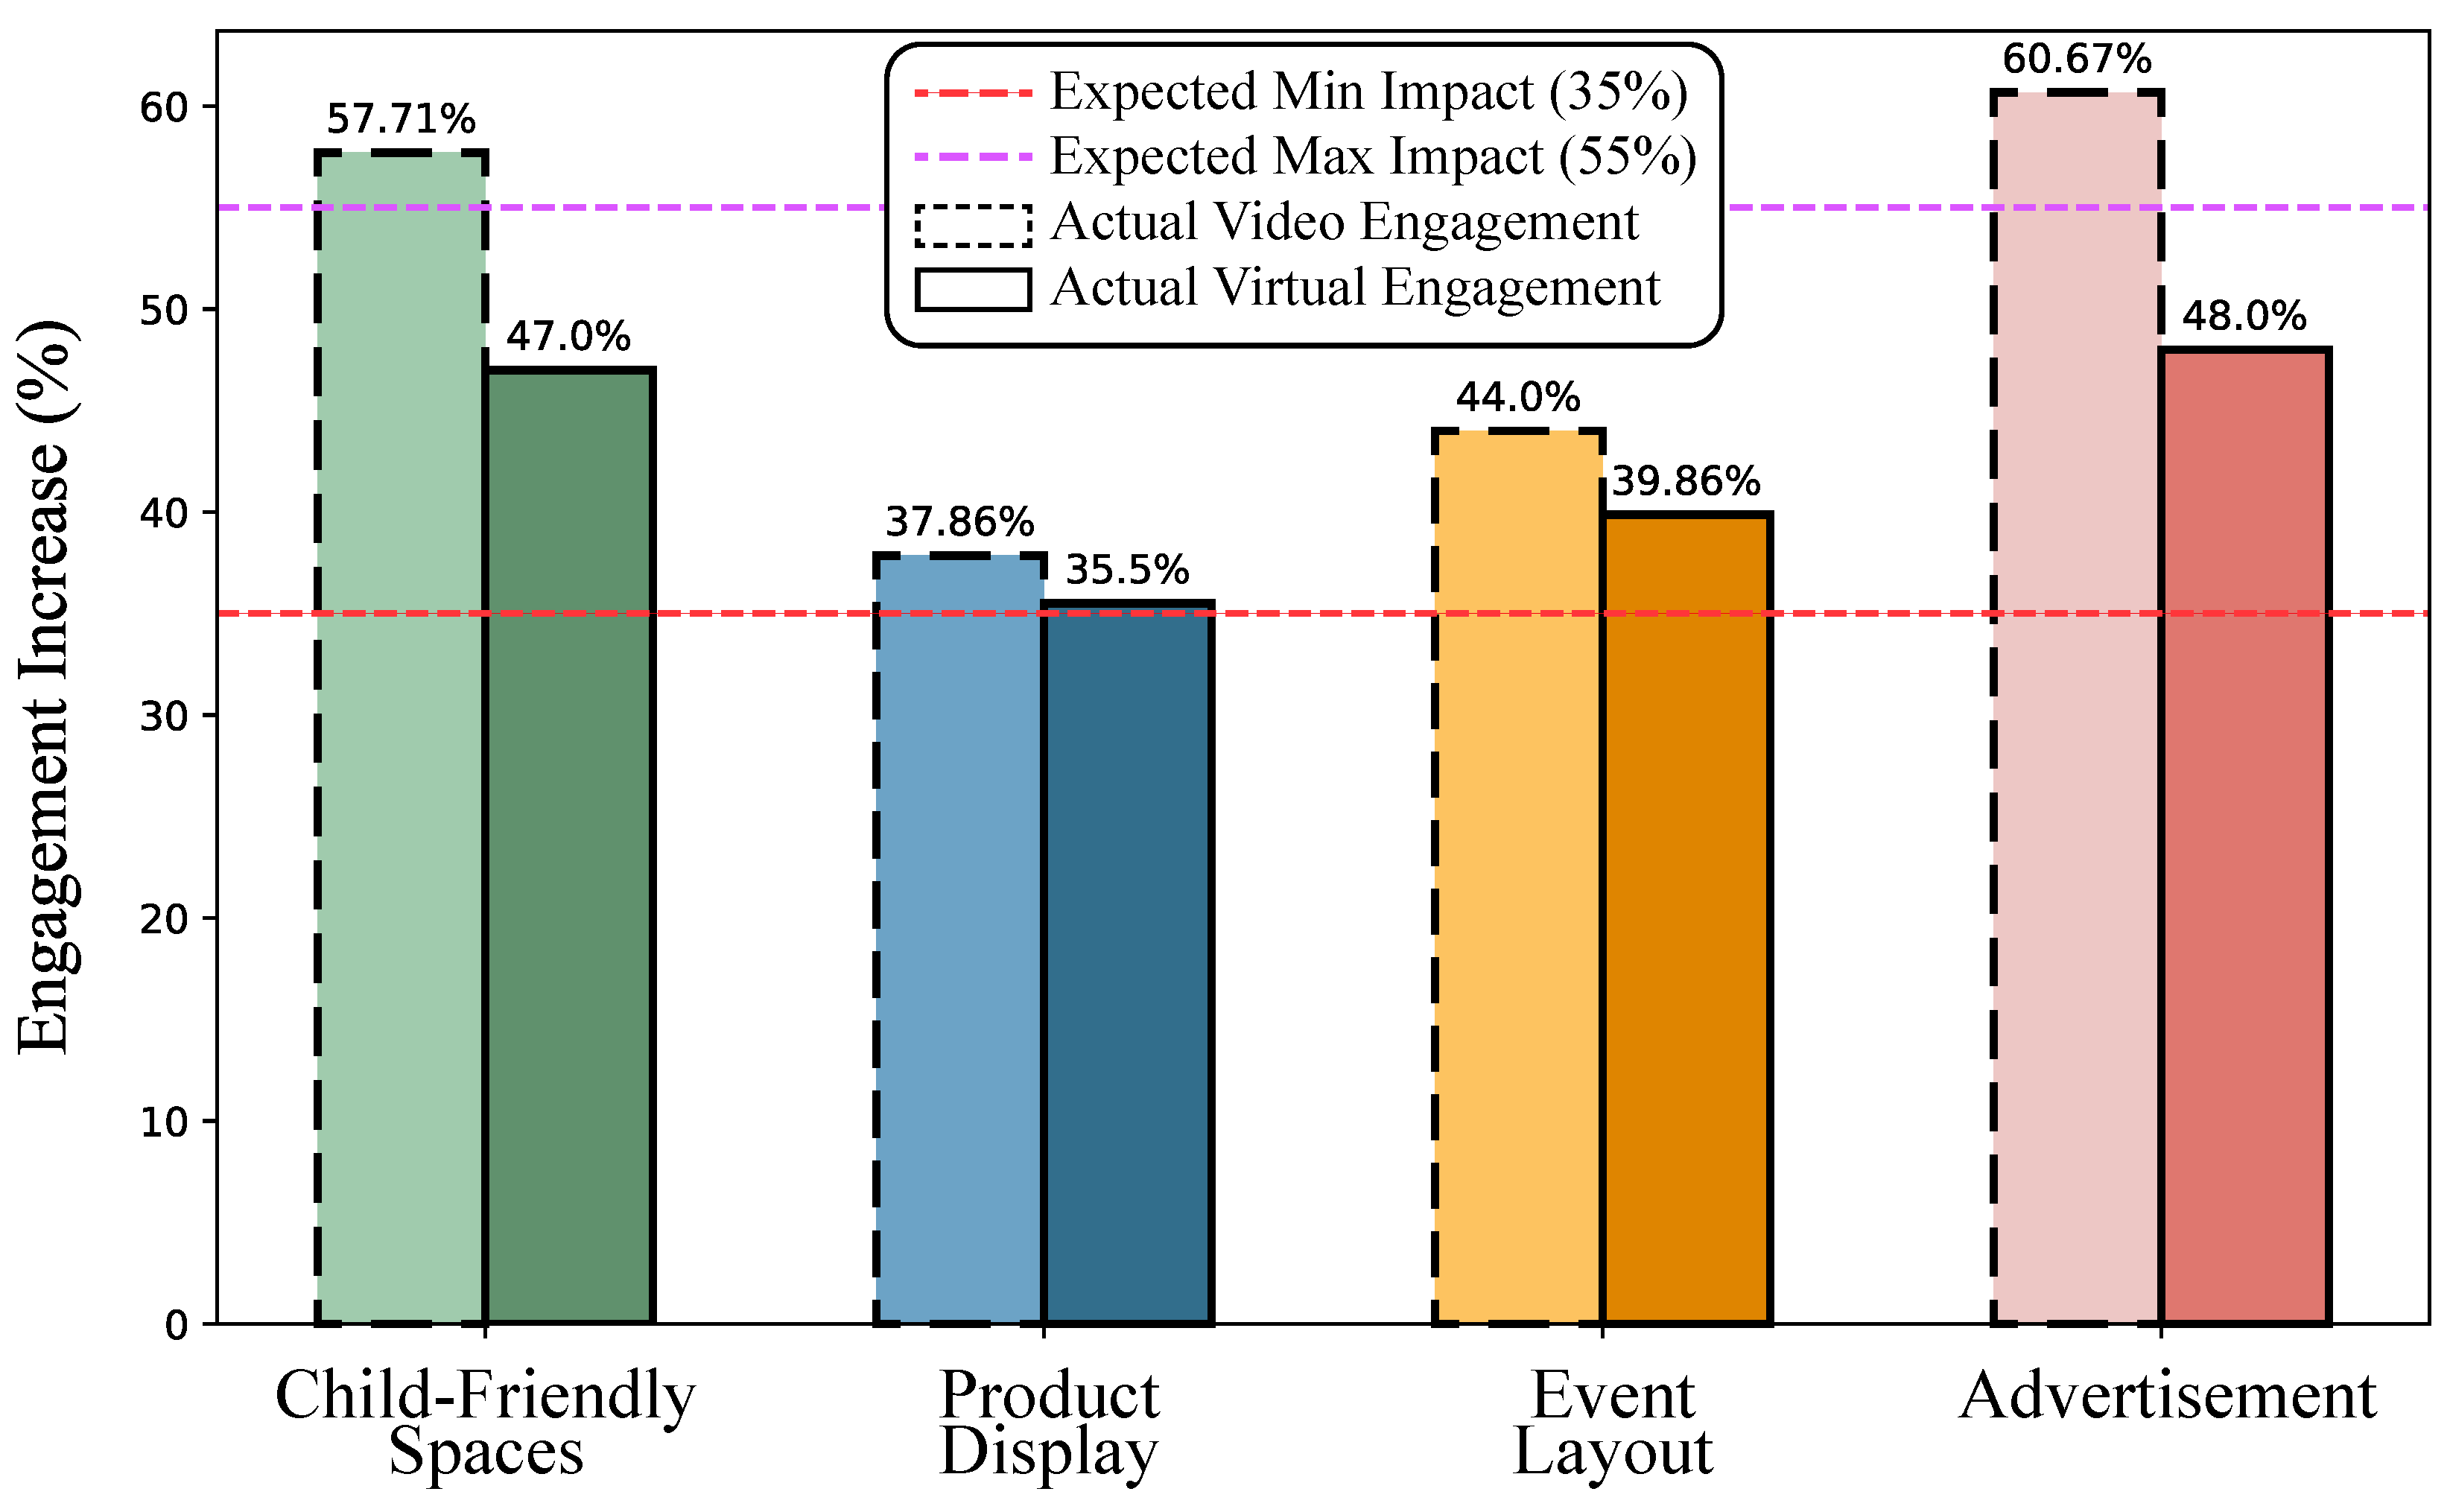
5.4. Scaling Impact of Interview Expansion

To further validate the proposed Framework’s scalability, an additional phase of interviews was conducted by expanding the participant pool. As in the early steps, the imbalance participant groups are averaged to ensure a balanced impact analysis. However, two new participants were newly included considering more balanced participant behavior statistically. The new participant data is explained in Section 3, where Table 1 separately shows the participant information before and after scaling. Initially, six participants were interviewed, and later, two more individuals were included to assess the adaptability of the framework. Figure 14 compares the actual increase in engagement for video and virtual interviews after scaling with the expected impact range (35%-55%), based on a 33% increase in participants and 35% increment of the keyword (see Table 1). The results show that most themes align with the expected impact, particularly in video interviews; all themes remain within the expected range. In the case of the virtual interview, the theme of child-friendly space and advertisement exceeded the expected boundary by only 2% and 5% which can considered as normal overflow. In this step, the proposed algorithm for the weighted keyword is applied to obtain the actual impact of the scaling, and the ω remains the same as before 0.08. This underscores the robustness and adaptability of the proposed framework for enhancing temporary event spaces.

6. Conclusions

This study explores the revitalization of regions facing demographic challenges through temporary events, emphasizing the enhancement of event environments by integrating architectural and spatial analysis with data-driven methodologies. The research highlights the significance of understanding and optimizing the spatial configuration of event spaces to improve user experience and engagement. By examining three distinct events, the study identifies key architectural and spatial factors that contribute to the success of temporary spaces: the strategic organization of layouts, the careful arrangement of product displays, and the creation of child-friendly spaces. These elements play crucial roles in making events more attractive and inclusive, demonstrating that thoughtful spatial design can significantly enhance the vibrancy and appeal of community gatherings.
Moreover, the study introduces a novel approach to data analysis by developing and validating an algorithm for keyword analysis in NLP, specifically tailored for processing multi-person interview data. This methodological advancement underscores the importance of incorporating user feedback and preferences in the design process, showcasing how data-driven insights can refine and improve event planning. The proposed algorithm’s effectiveness in extracting meaningful patterns from qualitative data not only aids in the design of event spaces but also offers a scalable approach to data analysis that can be applied in various urban planning and social research contexts.
The implications of this research extend beyond event planning, offering valuable insights for governance and strategic planning in regions similar to Matsue City. The challenges outlined in Section 2.1, such as the necessity for urban compactness and the revitalization of underutilized spaces, can be addressed through the strategic organization of temporary events. These events can serve as catalysts for broader urban revitalization efforts, testing and showcasing design and policy innovations in a temporary, low-risk format. For instance, the integration of digital technology in event planning, as explored in this study, can inform the development of regional public systems and enhance urban accessibility.
Furthermore, the study highlights the importance of community-driven initiatives. By prioritizing events that actively engage residents in planning and decision-making, cities can foster a stronger sense of belonging and ensure that revitalization efforts are aligned with the community’s evolving needs. The data-driven approach to understanding user experience, including the analysis of feedback and preferences, provides a model for how governments can incorporate community input into urban planning processes. This can lead to the development of more responsive and sustainable strategies that not only attract younger demographics but also improve the quality of life for existing residents.

Author Contributions

Conceptualization, Yen-Khang Nguyen-Tran and Riaz-Ul-Haque Mian; methodology, Yen-Khang Nguyen-Tran and Riaz-Ul-Haque Mian; software, all authors; validation, all authors; formal analysis, Yen-Khang Nguyen-Tran and Aliffi Majiid; investigation, all authors; resources, Yen-Khang Nguyen-Tran and Aliffi Majiid; data curation, Yen-Khang Nguyen-Tran and Riaz-Ul-Haque Mian; writing—original draft preparation, Yen-Khang Nguyen-Tran and Riaz-Ul-Haque Mian; writing—review and editing, Yen-Khang Nguyen-Tran and Riaz-Ul-Haque Mian; visualization, Yen-Khang Nguyen-Tran, Aliffi Majiid and Riaz-Ul-Haque Mian; supervision, Yen-Khang Nguyen-Tran; project administration, Yen-Khang Nguyen-Tran; funding acquisition, Yen-Khang Nguyen-Tran and Riaz-Ul-Haque Mian; intensive data analysis, Yen-Khang Nguyen-Tran and Aliffi Majiid; architectural thought and design, Riaz-Ul-Haque Mian and Yen-Khang Nguyen-Tran; NLP analysis and algorithm development Riaz-Ul-Haque Mian and Yen-Khang Nguyen-Tran, all authors. All authors have read and agreed to the published version of the manuscript.

Funding

This research was funded by OBAYASHI FOUNDATION grant number Research 2023-40-105. and The APC was funded by Shimane University, Matsue Japan.

Institutional Review Board Statement

Not applicable

Informed Consent Statement

The authors have obtained informed consent from all participants involved in the interviews and related data collection for this research. Participants who took part in on-site visitor interviews, video interviews, and virtual environment interviews have given their consent for their provided data to be used in this study.

Data Availability Statement

The interview data, including videos and images used in this study, can be made available upon request to the corresponding author for non-commercial academic research, verification, and validation purposes. Please contact the corresponding author directly via the provided email for access to the data.

Acknowledgments

The authors would like to express their sincere gratitude to all associated personnel, including event organizers, stall owners, interview participants, Ochiai Wooden workshop and the Matsue City public, for their valuable support and facilitation for the conduct of this research. The authors are also grateful to the OBAYASHI FOUNDATION and Shimane University for providing the funding and research facilities necessary to conduct this study. Additionally, special thanks go to the students of Khang’s Laboratory for their tremendous cooperation and assistance throughout the research process.

Conflicts of Interest

The authors declare no conflicts of interest.
AI Artificial Intelligence
NLP Natural Language Processing
EV Event
LH Layout Hierarchy
PV Product Visibility
VA Visual Attention
GPT Generative Pre-trained Transformer
P Participant
DS Display Strategies
SL Stall Layout

References

  1. Uwasu, M.; Fuchigami, Y.; Ohno, T.; Takeda, H.; Kurimoto, S. On the valuation of community resources: The case of a rural area in Japan. Environmental Development 2018, 26, 3–11. [CrossRef]
  2. Zollet, S.; Qu, M. Revitalising rural areas through counterurbanisation: Community-oriented policies for the settlement of urban newcomers. Habitat International 2024. [CrossRef]
  3. Ji, Y.; Imai, H. Creative Revitalization in Rural Japan: Lessons from Ishinomaki. Asian Studies 2022, 10, 211–240. [CrossRef]
  4. Office, M.C. Results of the Community Development Policy Implementation for Asahi-Yata District (FY2018-FY2019) - Matsue City. Technical report, Matsue City Office, 2018. Original title in Japanese: Results of the implementation of the Watashi-Yata district regional development measures (FY2018 and FY2019).
  5. Nguyen Tran, Y.; Marsatyasti, N.; Murata, R. Variations of Visual Impression in Corner Space of the Storefronts in Daikanyama, Tokyo. Journal of Architecture and Planning (Transactions of AIJ) 2022, 87, 1922–1932. [CrossRef]
  6. Office, M.C. Asaichi 2024 Report. Technical report, Matsue City Office, 2024.
  7. Rezaei, N.; Mirzaei, R.; Abbasi, R. A study on motivation differences among traditional festival visitors based on demographic characteristics, case study: Gol-Ghaltan festival, Iran. Journal of Convention & Event Tourism 2018, 19, 120–137. [CrossRef]
  8. Masuda, T.; Nisbett, R. Culture and Change Blindness. Cognitive Science 2006, 30, 381–399. [CrossRef] [PubMed]
  9. Bansal, G.; Chamola, V.; Hussain, A.; Guizani, M.; Niyato, D. Transforming Conversations with AI—A Comprehensive Study of ChatGPT. Cognitive Computation 2024, 16, 2487–2510. [CrossRef]
  10. OpenAI. ChatGPT-4, 2024. Accessed online.
  11. Chen, M.; Yuan, Q.; Yang, C.; Zhang, Y. Decoding Urban Mobility: Application of Natural Language Processing and Machine Learning to Activity Pattern Recognition, Prediction, and Temporal Transferability Examination. IEEE Transactions on Intelligent Transportation Systems 2024, 25, 7151–7173. [CrossRef]
  12. Cantamessa, M.; Montagna, F.; Altavilla, S.; Casagrande-Seretti, A. Data-driven design: the new challenges of digitalization on product design and development. Design Science 2020, 6, e27. [CrossRef]
  13. Kato, H. Declining Population and the Revitalization of Local Regions in Japan. Meiji Journal of Political Science and Economics 2014.
  14. Shinji, K. Background, current situation, and issues of policies to promote migration and settlement in rural areas. Geography Journal 2016, 125, 507–522. [CrossRef]
  15. Sorensen, A. Liveable Cities in Japan: Population Ageing and Decline as Vectors of Change. International Planning Studies 2006, 11, 225–242, [. [CrossRef]
  16. Studies, O.G.G. OECD 2012 Compact City Policies: A Comparative Assessment. Technical report, OECD, 2012.
  17. Taima, M.; Asami, Y. Determinants and policies of native metropolitan young workers’ migration toward non-metropolitan areas in Japan. Cities 2020, 102, 102733. [CrossRef]
  18. for Economic Co-Operation, O.O.; Development). Compact city policies: A comparative assessment, 2012.
  19. Lee, J.; Kurisu, K.; An, K.A.; Hanaki, K. Development of the compact city index and its application to Japanese cities. Urban Studies 2015, 52, 1054 – 1070. [CrossRef]
  20. Mizutani, F.; Nakayama, N.; Tanaka, T. An Analysis of the Effects of the Compact City on Economic Activities in Japan. In Proceedings of the ERSA conference papers ersa15p160, European Regional Science Association, 2015.
  21. Policy Bureau, Ministry of Land, I.T.; Tourism. White Paper on Land, Infrastructure, Transport and Tourism in Japan. Technical report, MLIT, 2023.
  22. Yoshida, Y.; Ikaruga, S.; Kobayashi, T.; Shiraishi, R. Supporting method of compact city planning in local metropolitan areas across prefectural borders. Japan Architectural Review 2024, 7, e12423. [CrossRef]
  23. Yu, O.; Atsushi, T.; Noboru, H. Research on the planning and current status of multi-core collaborative compact cities as seen in urban planning master plans. Collection of urban planning papers 2017, 52, 10–17. [CrossRef]
  24. Kajita, S. Can Prefectural Government Cities Play Roles as’ Dams for Preventing Population Outflows?’: A Case Study on Matsue. JOURNAL OF GEOGRAPHY-CHIGAKU ZASSHI 2016, 125, 627–645. [CrossRef]
  25. Takao, Y. Compact City and Mayoral Entrepreneurship: A Study of Success and Setbacks in Two Japanese Cities. Urban Affairs Review 2025, 61, 221–259. [CrossRef]
  26. Walters, T.; Insch, A. How community event narratives contribute to place branding. Journal of Place Management and Development 2018, 11, 130–144. [CrossRef]
  27. Hein, C. Toshikeikaku and Machizukuri in Japanese Urban Planning. Japanstudien 2002, 13, 221 – 252. [CrossRef]
  28. Fujita, M.; Hamaguchi, N.; Kameyama, Y. Local Community as a Device for Regional Innovation. Economics, Law, and Institutions in Asia Pacific 2021.
  29. Camerin, F.; et al. Open issues and opportunities to guarantee the “right to the ‘healthy’city” in the post-Covid-19 European city. Contesti 2021, pp. 149–162.
  30. Weekend Morning Market Promotion Project | Matsue City Homepage— city.matsue.lg.jp. https://www.city.matsue.lg.jp/soshikikarasagasu/sangyokeizaibu_shokokikakuka/sangyoshinko/1/14416.html. [Accessed 08-02-2025].
  31. Son, I.S.; Krolikowski, C. Developing a sense of place through attendance and involvement in local events: the social sustainability perspective. Tourism Recreation Research 2024, 0, 1–12, [. [CrossRef]
  32. for Urban Strategies, I. Profiling Urban Attractiveness 2023 report. Technical report, The Mori Memorial Foundation 2023 Japan Power Cities, 2023.
  33. for Urban Strategies, I. City Perception Survey Japan. The Mori Foundation.
  34. Lynch, K.M. The Image of the City; MA: MIT Press, 1960.
  35. Pernecky, T.; Rakić, T. Visual Methods in Event Studies. Event Management 2019. [CrossRef]
  36. MingTang. Analysis of Signage using Eye-Tracking Technology. In Proceedings of the Interdisciplinary Journal of Signage and Wayfinding, 2020.
  37. Cullen, G. The Concise Townscape; Architectural Press, 1995.
  38. Niehaus, K. The temporality of commodified landscapes at events & local constructions of identity in Salzburg. Linguistic Landscape. An international journal 2022.
  39. Singhal, K. Application of colour theory and visual merchandising principles in retail spaces. World Journal of Advanced Research and Reviews 2024.
  40. Kamarudin, A.M.; Wahab, N.A.A.; Zakariya, K. Discovering the Qualities of Ferringhi Night Market as an urban cultural space. In Proceedings of the UMRAN2015: A VISION OF ESTABLISHING GREEN BUILT ENVIRONMENT, 2015.
  41. Nasar, J.L. The evaluative image of the city. Journal of the American Planning Association 1990, 56, 41–53. [CrossRef]
  42. Russell, J.A. Core affect and the psychological construction of emotion. Psychological review 2003, 110, 145. [CrossRef]
  43. Sina, A.S.; young Kim, H. Enhancing consumer satisfaction and retail patronage through brand experience, cognitive pleasure, and shopping enjoyment: A comparison between lifestyle and product-centric displays. Journal of Global Fashion Marketing 2018, 10, 129 – 144. [CrossRef]
  44. Antchak, V.; Ramsbottom, O. Atmospherics and servicescapes. In Proceedings of the The Fundamentals of Event Design, 2019.
  45. R. Jagtap, D.P.S. Inclusive stimulating space planning for sustainable urban agglomeration. Brazilian Journal of Development 2024. [Accessed 09-02-2025].
  46. et al, T.R. Enhancing Music Events Using Physiological Sensor Data. In Proceedings of the MM ’17: Proceedings of the 25th ACM international conference on Multimedia, 2017.
  47. Xu, A.; Huang, S.W.; Bailey, B.P. Voyant: generating structured feedback on visual designs using a crowd of non-experts. Proceedings of the 17th ACM conference on Computer supported cooperative work & social computing 2014.
  48. Kanev, G.; Mladenova, T.; Valova, I. Leveraging User Experience for Enhancing Product Design: A Study of Data Collection and Evaluation. 2023 5th International Congress on Human-Computer Interaction, Optimization and Robotic Applications (HORA) 2023, pp. 01–06.
  49. Narahara, T. KURASHIKI VIEWER: Qualitative Evaluations of Architectural Spaces inside Virtual Reality. In Proceedings of the 27th International Conference of the Association for Computer-Aided Architectural Design Research in Asia, CAADRIA 2022. The Association for Computer-Aided Architectural Design Research in Asia, 2022, pp. 11–18.
  50. Nguyen Tran, Y.; Nguyen Tran, T.; Kouno, R.; Loh, J. Visual Impression of Urban Waterways in Shrinking Cities: Case Study of Matsue Canal Network around the Castle. IOP Conference Series: Earth and Environmental Science 2024, 1363, 012072. [CrossRef]
  51. OpenAI. ChatGPT: Optimizing Language Models for Dialogue. https://openai.com/chatgpt, 2023. Accessed: [2025-02-1=22].
  52. Anthropic. Claude: A Next-Generation AI Assistant. https://www.anthropic.com/claude, 2023. Accessed: [2025-02-1=22].
  53. Google. Gemini: Multimodal AI Model by Google. https://blog.google/technology/ai/google-gemini-ai/, 2023. Accessed: [2025-02-1=22].
  54. DeepSeek. DeepSeek: Advanced AI for Natural Language Processing. https://www.deepseek.com, 2023. Accessed: [2025-02-1=22].
  55. Microsoft. GitHub Copilot: Your AI Pair Programmer. https://github.com/features/copilot, 2023. Accessed: [2025-02-1=22].
  56. Hand, K. Building a Data-Driven Event Strategy. Circle Blog 2024. Accessed: 2025-02-03.
  57. Grootendorst, M. KeyBERT: Minimal keyword extraction with BERT. arXiv preprint arXiv:2010.11918 2020. Accessed: 2025-02-03.
  58. Campos, R.; Mangaravite, V.; Pasquali, A.; Jorge, A.M.; Nunes, C.; Jatowt, A. YAKE! Keyword extraction from single documents using multiple local features. Information Sciences 2020, 509, 257–289. Accessed: 2025-02-03. [CrossRef]
  59. Xia, L.; Jia, Q.S.; Cao, X.R. A tutorial on event-based optimization—a new optimization framework. Discrete event dynamic systems 2014, 24, 103–132. [CrossRef]
  60. Tai, R.H.; Bentley, L.R.; Xia, X.; Sitt, J.M.; Fankhauser, S.C.; Chicas-Mosier, A.M.; Monteith, B.G. An examination of the use of large language models to aid analysis of textual data. International Journal of Qualitative Methods 2024, 23, 16094069241231168. [CrossRef]
  61. Gallego, G.; Delbrück, T.; Orchard, G.; Bartolozzi, C.; Taba, B.; Censi, A.; Leutenegger, S.; Davison, A.J.; Conradt, J.; Daniilidis, K.; et al. Event-based vision: A survey. IEEE Transactions on Pattern Analysis and Machine Intelligence 2020, 44, 154–180. [CrossRef] [PubMed]
  62. Fridlin, S.L.; Pereira, L.D.; Perez, A.P. Relationship between data collected during the interview and auditory processing disorder. Revista CEFAC 2014, 16, 405–412. [CrossRef]
  63. Rodriguez, E.; Nakamura, S. Social Impact of Cultural Events Using Data Science. Social Science Research Journal 2020, 14, 410–425. [CrossRef]
  64. Fernandez, R.; Cohen, L. Sentiment Analysis in Public Event Engagement. Journal of Computational Social Science 2021, 9, 155–172. [CrossRef]
  65. Williams, S.; Kim, D. Market Analysis Using Keyword Extraction. Economic Data Review 2020, 8, 200–215. [CrossRef]
  66. Driscoll, B. Sentiment analysis and the literary festival audience. Continuum 2015, 29, 861–873. [CrossRef]
  67. Valdivia García, A.; et al. Sentiment analysis-based methods for cultural monuments. doctoral thesis 2019.
  68. Taylor, J.; Wong, C. Improving Event Analysis with AI-Driven Keyword Extraction. Journal of Computational Event Studies 2022, 16, 228–243. [CrossRef]
  69. Yamamoto, H.; Silva, L. Network Modeling for Public Event Interactions. Annual Conference on Social Data Science 2021, 11, 79–94. [CrossRef]
  70. Foster, D.; Rivera, C. Keyword Categorization for Thematic Event Analysis. Journal of Information Systems 2021, 15, 265–280. [CrossRef]
  71. Galdas, P. Revisiting bias in qualitative research: Reflections on its relationship with funding and impact, 2017.
  72. Mehrabi, N.; Morstatter, F.; Saxena, N.; Lerman, K.; Galstyan, A. A survey on bias and fairness in machine learning. ACM computing surveys (CSUR) 2021, 54, 1–35. [CrossRef]
  73. Crociani, L.; Lämmel, G.; Vizzari, G. Multi-scale simulation for crowd management: a case study in an urban scenario. In Proceedings of the Autonomous Agents and Multiagent Systems: AAMAS 2016 Workshops, Best Papers, Singapore, Singapore, May 9-10, 2016, Revised Selected Papers. Springer, 2016, pp. 147–162.
  74. Rose, S.; Engel, D.; Cramer, N.; Cowley, W. Automatic keyword extraction from individual documents. In Proceedings of the Text Mining: Applications and Theory. John Wiley & Sons, Ltd, 2010, pp. 1–20.
  75. Mihalcea, R.; Tarau, P. TextRank: Bringing order into text. Proceedings of the 2004 Conference on Empirical Methods in Natural Language Processing 2004, pp. 404–411.
  76. Spärck Jones, K. A statistical interpretation of term specificity and its application in retrieval. Journal of Documentation 1972, 28, 11–21. [CrossRef]
  77. Karlgren, J.; Li, R.; Meyersson Milgrom, E.M. Text Mining for Processing Interview Data in Computational Social Science. arXiv preprint 2020. arXiv:2011.14037 2020.
  78. Ushio, A.; Liberatore, F.; Camacho-Collados, J. Back to the Basics: A Quantitative Analysis of Statistical and Graph-Based Term Weighting Schemes for Keyword Extraction. arXiv preprint 2021. arXiv:2104.08028 2021.
  79. Wang, X.; Zhang, L.; Klabjan, D. Keyword-based Topic Modeling and Keyword Selection. arXiv preprint 2020. arXiv:2001.07866 2020.
  80. nana.media. [Imagine Coffee Morning Market] Held once a month! Handmade sweets and fresh vegetables lined up | Matsue City | na-na (Nana) | Tottori and Shimane gourmet, outing, and lifestyle magazine — na-na.media. https://na-na.media/imagine-coffee-morning/, 2023. [Accessed 09-02-2025].
  81. Shoji, U. Title of the Article or Report. Sanin Broadcasting Systems 2014.
  82. Market, M.F. Matsure Farmers Market homepage. https://matsue-junkan-fmkt.com/report. [Accessed 08-02-2025].
  83. Majiid, A.; Mian, R.U.H.; Kurohara, K.; Nguyen-Tran, Y.K. Approach to Visual Attractiveness of Event Space Through Data-Driven Environment and Spatial Perception. In Proceedings of the Proceedings of the 5th International Civil Engineering and Architecture Conference (CEAC 2025), Shimane University, Interdisciplinary Faculty of Science and Technology, Tokyo, Japan, March 2025.
  84. Jordan, T.; Gibson, F.W.; Stinnett, B.; Howard, D. Stakeholder Engagement in Event Planning: A Case Study of One Rural Community’s Process. Event Management 2019. [CrossRef]
  85. Bello, A.H. "Eventful": Revolutionizing Event Management through Technology Integration and User-Centered Design. Saudi Journal of Engineering and Technology 2024. [CrossRef]
  86. Ruperto, A.; Kerr, G.M. A Study of Community Events Held by Not-for-Profit Organizations in Australia. Journal of Nonprofit & Public Sector Marketing 2009, 21, 298 – 308.
Figure 2. Categorized Three Distinct Classifications of Keywords.
Preprints 150827 g002
Figure 3. Proposed Adaptive Keyword Analysis Model architecture.
Preprints 150827 g003
Figure 4. Actual and Adjusted Keyword Frequencies for EV1 Using the Proposed Algorithm. In This Adjustment the Weight Factor ω = 0 . 08 .
Preprints 150827 g004
Figure 5. Network Graph of the Video Interview Analysis Illustrating Relationships Between Themes, Events, and Participants.
Preprints 150827 g005
Figure 6. Network Graph Illustrating the Impact of the Virtual Environment on Themes, Events, and Individuals.
Preprints 150827 g006
Figure 7. Comparison of Event-theme Relationships Before and After Virtual Environment Engagement.
Preprints 150827 g007
Figure 8. Stall Layout.
Preprints 150827 g008
Figure 9. Placement and Visibility.
Preprints 150827 g009
Figure 10. Display Strategies.
Preprints 150827 g010
Figure 11. Level of Visual Attractiveness derived from Data-Driven Spatial Analysis.
Preprints 150827 g011
Figure 12. Average keyword count per person across themes, categorized by participant group Nationality (Japanese vs. Non-Japanese), Gender (Male vs. Female), Parental status (has Child vs. No Child), and Age Group (below and above 40 years).
Preprints 150827 g012
Figure 13. Proposed data-driven model incorporating video interview insights, virtual environments, and comparative evaluation.
Preprints 150827 g013
Figure 14. Actual vs Expected Engagement Impact After Scaling (35%-55% Range).
Preprints 150827 g014
Table 1. Event and Participant Data Summary
Preprints 150827 i001
Table 2. Top Unique Keyword Activities, Physical Elements, and Atmosphere by Event
Preprints 150827 i002
Table 3. Stall Layout in Each Event
Preprints 150827 i003
Table 4. Keyword Count Distribution with different themes
Preprints 150827 i004
Disclaimer/Publisher’s Note: The statements, opinions and data contained in all publications are solely those of the individual author(s) and contributor(s) and not of MDPI and/or the editor(s). MDPI and/or the editor(s) disclaim responsibility for any injury to people or property resulting from any ideas, methods, instructions or products referred to in the content.
Copyright: This open access article is published under a Creative Commons CC BY 4.0 license, which permit the free download, distribution, and reuse, provided that the author and preprint are cited in any reuse.
Prerpints.org logo

Preprints.org is a free preprint server supported by MDPI in Basel, Switzerland.

Subscribe

Disclaimer

Terms of Use

Privacy Policy

Privacy Settings

© 2025 MDPI (Basel, Switzerland) unless otherwise stated