Preprint
Review

This version is not peer-reviewed.

Decoding the Dynamics of Sustainable Finance: Spillover, Risk, and Connectivity Through a Bibliometric Lens

A peer-reviewed article of this preprint also exists.

Submitted:

27 February 2025

Posted:

28 February 2025

You are already at the latest version

Abstract

As global environmental and economic challenges intensify, the field of connectedness of sustainable finance has emerged as a critical area for research and policy development, yet its growth patterns and thematic focus remain underexplored. The present study contributes toward the achievement of sustainable growth by providing directions to align financial decision-making with different sustainability aspects. This paper presents a comprehensive bibliometric analysis of 1,261 peer-reviewed articles from the Web of Science Core Collection spanning from 1994 to 2024. We employ bibliographic coupling, co-citation, trend cartography and collaboration network in our analysis to visualize the intellectual structure and connectedness of sustainable finance. VOSviewer, Biblioshiny (an extension of the Bibliometrix package), and RStudio are used for data visualization and network analyses. Key findings underscore the field’s exponential growth post-2015, largely driven by climate policy initiatives like the Paris Agreement and increasing investor interest in ESG-aligned investments. This study provides a roadmap for future research and practical insights for policymakers, investors, and academics aiming to build a resilient, sustainable financial system aligned with global climate goals.

Keywords: 
;  ;  ;  ;  ;  

1. Introduction

The escalating challenges of climate change and the urgent need for sustainable economic growth have catalyzed interest in sustainable finance, which integrates environmental, social, and governance (ESG) criteria into investment decisions (Ayaz & Zahid, 2024; Barua & Chiesa, 2019; Ikevuje et al., 2024; Kumar et al., 2022a; Stern, 2013). Sustainable finance, particularly green finance, not only promotes investments that are environmentally responsible but also has a significant role in mitigating financial risks associated with environmental volatility and regulatory shifts (Ikevuje et al., 2024).
Recent studies highlight that the financial sector’s alignment with sustainable practices is critical to achieving international climate targets, particularly the goals set forth in the Paris Agreement (OECD/IEA, 2017)(Ding et al., 2019). Green financial instruments, such as green bonds and renewable energy investments, are at the forefront of this transition, offering pathways to support global decarbonization efforts (Barua & Chiesa, 2019; Bhutta et al., 2022b; Huang, 2024).
However, the interconnectedness and risk transmission mechanisms between green and traditional financial markets remain underexplored, particularly in terms of how systemic risk propagates through these channels under financial stress (Deng et al., 2022; Meng et al., 2024; Sachs et al., 2019; Sachs et al., 2020).
Bibliometric analysis, which systematically maps scholarly output to identify thematic trends and research gaps, is a powerful tool for structuring and synthesizing the fragmented literature in the connectedness of sustainable finance (Kevin W Boyack & Richard Klavans, 2010; Luo et al., 2022) Through quantitative citation analysis and bibliometric reviews, we can provide an objective approach to understanding research development over time, pinpointing influential publications, and visualizing relationships between key topics, institutions, and authors. (Aria & Cuccurullo, 2017; Barua & Chiesa, 2019; Kevin W. Boyack & Richard Klavans, 2010)
Despite the burgeoning literature on the connectedness of sustainable finance, there remain significant knowledge gaps in understanding its broader systemic impacts, particularly concerning risk transmission between green and conventional financial assets. Recent bibliometric studies underscore the need for a comprehensive evaluation of the connectedness of sustainable finance literature to guide both policy and investment (Ayaz & Zahid, 2024; Bahoo et al., 2020; Bhatnagar & Sharma, 2022; Bhutta et al., 2022a; Cunha et al., 2021; Ikevuje et al., 2024; Khan et al., 2022; Kumar et al., 2022a, 2022b; Luo et al., 2022; Mbarki et al., 2023; Mi’raj & Ulev, 2024; Rabbani et al., 2024).
In the context of sustainable finance, bibliometric analysis helps capture the evolving focus areas—from early discussions on green investment returns to contemporary inquiries into green risk contagion and policy impacts—thereby highlighting both the academic progression and practical challenges of green finance (Bhutta et al., 2022b; Bourcet, 2020; Elie et al., 2021; Losse & Geissdoerfer, 2021; Naeem et al., 2022; Trotta et al., 2024; Woon et al., 2023).
This study, therefore, addresses these gaps by conducting a comprehensive bibliometric review of the connectedness of sustainable finance research from 1994 to 2024, analyzing 1,261 peer-reviewed articles from the Web of Science Core Collection to identify key trends, influential sources, and underexplored topics. Specifically, this analysis maps the scholarly landscape of interconnected themes such as green bonds, renewable energy, and systemic risk, thereby providing a foundational understanding of how the connectedness of sustainable finance research has evolved in response to global environmental and policy challenges.
This study seeks to delineate the beginnings of sustainable finance research connectivity, examine prevailing trends, and ascertain future potential. To fulfill this objective, the study examined the subsequent research questions:
Research Question-1: How has the domain of sustainable financial interconnectedness progressed from 1994 to 2024, and what are the prevailing themes and tendencies within this field?
Research Question-2: Which authors, organizations, countries, and publications most significantly contribute to the interconnectedness of sustainable finance research?
Research Question-3: What are the aims of important studies regarding the interrelation of sustainable finance, and which key ideas are utilized in these investigations?
Research Question-4: What are the future projections for the interrelation of sustainable finance research?
By employing a rigorous bibliometric approach, this study aims to systematically map the field of connectedness in sustainable finance, identifying influential works, emerging themes, and persistent research gaps. This analysis not only provides a roadmap for future research directions but also informs stakeholders—policymakers, investors, and scholars—about key developments and underexplored areas in sustainable finance. By documenting the development of this field and identifying future research directions, this paper contributes to the broader strategic discourse on building resilient and sustainable financial systems.

2. Data and Methods

2.1. Data

2.1.1. Step 1: Sample Selection

A crucial component of any bibliometric analysis is the citation data. Given that its database recognizes prominent journals from 1985, we seek to collect citation data from the Web of Science Core Collection (WoS). Using appropriate keywords, we employ a two-step procedure to retrieve the data from the relevant literature(Chiaramonte et al., 2023; Mbarki et al., 2023). We use extremely general terms in the first stage, which explains how different green finance instruments are related to one another. For this purpose, we conducted a title search using the keywords “ESG” or “green stocks” and “connectedness” or “spillover” or “contagion,” resulting in a total of 198 articles. Next, we use the VOS viewer to analyze the keyword and identify the most relevant alternatives that can aid in understanding the literature on the interconnection of green finance instruments. For the second stage, we employ a more extensive range of the following keywords (“ESG” OR “Green finance” OR “Green stocks” OR “Green bonds” OR “Green energy” OR “Alternative energy” OR “Renewable energy” OR “Green innovations” OR “Green electricity” OR “Environmental social and governance” OR “Green technology” OR “Green transportation” OR “Socially responsible stocks” OR “Clean energy” OR “Sustainable investing” OR “Sustainable stocks” OR “Clean energy stock” OR “Sustainable finance” OR “Climate finance” OR “Environment-related stocks”) AND (“connectedness” OR “spillover” OR “Contagion” OR “co-movement” OR “comovement” OR “Interdependence” OR “Risk transmission”) and perform a search for the specified keywords in all fields. A total of 1891 articles (published through May 01, 2024) are produced by this experiment.

2.1.2. Step-2 Data Refining

The second phase involves eliminating the papers that are not relevant from an original search of 1891 papers, as indicated in Table 1. Three filters are primarily employed to select studies for inclusion: The studies should be published in the fields of business economics, environmental science and ecology, public environmental and occupational health, energy and fuels, engineering, public administration, operations research and management science, social sciences, government law, transportation, and sociology. and (2) All studies must be published in peer-reviewed journals (SSCI and SCI) in English, encompassing articles, reviews, and early access publications. Lastly, we choose studies that specifically address the goals of sustainable development.
Finally, we use the 1261 articles comprising the period of 1994 to May 01, 2024, for bibliometric analysis.

2.3. Methodology

This study employs quantitative citation analysis to provide a macroscopic overview of the connectedness of sustainable finance research trends and a microscopic examination of thematic content. The chosen methods—bibliographic coupling, co-citation analysis, and trend cartography—are widely recognized in bibliometric research for their robustness in identifying intellectual structures and research networks within scholarly fields (Aria & Cuccurullo, 2017; Bahoo et al., 2020; Kevin W Boyack & Richard Klavans, 2010; Naeem et al., 2022) .

2.3.1. Bibliographic Coupling Analysis

Bibliographic coupling identifies articles that cite common sources, offering insights into thematic connections and research clusters. This method reveals the evolution of subfields within sustainable finance by linking works that share references, thus identifying active research fronts and collaborative patterns (Kevin W Boyack & Richard Klavans, 2010; Khan et al., 2022; N. Van Eck & L. Waltman, 2010; N. J. van Eck & L. Waltman, 2010). For our analysis, a minimum threshold of five citations per document was applied, allowing us to capture well-established research areas while ensuring a representative sample.

2.3.2. Citation Analysis

To determine the most influential publications, authors, institutions, and countries, we conducted a citation analysis. This method calculates citation counts and other bibliometric indicators (such as h-index and g-index) to assess the academic impact of publications (Bar-Ilan, 2008; Borgohain et al., 2023; Egghe, 2008). High citation counts were used as proxies for impact, while h-index and g-index metrics were utilized to identify authors and journals that have made sustained contributions to sustainable finance literature (Ayaz & Zahid, 2024; Khan et al., 2022; Naeem et al., 2022). This analysis enables the identification of seminal works and key contributors to the field, helping outline the intellectual framework of the connectedness of sustainable finance research.

2.3.3. Co-Citation Analysis

Co-citation analysis examines the frequency of simultaneous citations of two articles. identifying intellectual relationships and thematic clusters within the literature (Kevin W Boyack & Richard Klavans, 2010) For our co-citation network, we applied a citation threshold of 50, allowing us to highlight the most frequently referenced authors and their relationships. This analysis reveals dominant theoretical perspectives and methodological approaches in sustainable finance, with clusters representing focused areas such as green investment risk assessment, ESG metrics, and regulatory impacts on sustainable finance.

2.3.4. Trend Cartography and Keyword Analysis

Trend cartography and keyword co-occurrence analysis were used to map the growth trajectories of specific topics and to identify emerging research areas. Using VOSviewer and the Biblioshiny package of the RStudio software, we visualized thematic clusters and tracked their temporal evolution, revealing shifts in research focus over time (Aria & Cuccurullo, 2017; N. Van Eck & L. Waltman, 2010). A keyword co-occurrence threshold of five was set, resulting in the identification of 178 key terms that characterize current research interests in sustainable finance, including “green bonds,” “renewable energy,” “connectedness,” and “systemic risk” (Aria & Cuccurullo, 2017; N. Van Eck & L. Waltman, 2010).

2.3.5. Collaboration Network Analysis

The collaboration network of authors in sustainable finance provides insight into the interconnectedness of researchers, institutions, and countries contributing to this field. The collaboration network of authors, institutions, and countries provides a comprehensive view of the structure and dynamics of sustainable finance research. The analysis of author collaborations highlights the importance of interdisciplinary efforts, with key researchers acting as central connectors between different research domains. Additionally, the study of institutional and country-level collaborations emphasizes the global and interconnected nature of sustainable finance, where research outcomes are shaped by contributions from diverse geographical and institutional actors. This network analysis is essential for identifying research gaps, opportunities for collaboration, and the key players driving the future direction of sustainable finance research. Understanding these connections can guide future policy, research, and investment strategies in a field that is increasingly pivotal in addressing global sustainability challenges.

2.4. Analytical Tools

The data visualization and network analyses were conducted using VOSviewer, Biblioshiny (an extension of the Bibliometrix package), and RStudio. VOSviewer was employed for bibliographic coupling and co-citation mapping due to its robust capabilities in visualizing large bibliometric datasets and its established use in scholarly network analysis (Bahoo et al., 2020; Chiaramonte et al., 2023; Khan et al., 2022; Mbarki et al., 2023; N. Van Eck & L. Waltman, 2010) Biblioshiny and Bibliometrix offer comprehensive tools for descriptive and inferential analysis, enabling us to conduct keyword analyses, trend cartography, and time-series visualizations of publication growth in sustainable finance (Aria & Cuccurullo, 2017). Together, these tools facilitated a multi-dimensional analysis, allowing for an in-depth exploration of the literature landscape.

3. Discussion of Results

3.1. Features of Data Sample

Table 2 displays the citation data features of 1261 publications, published between 1994 and May 01, 2024, with an annual growth rate of 16.14%. These articles were obtained from 228 different sources, with 1154 research articles and 25 paper reviews. The mean citations per document is 28.02, whereas the document mean age is 2.71. A total of 3540 authors have contributed to these publications, which have utilized 48,471 references and 3469 keywords. There are 75 documents with a single author, and an average of 3.59 co-authors per document, indicating an international co-authorship rate of 37.99%. This demonstrates the robust collaboration among scholars in the field of sustainable finance research.

3.2. Annual Scientific Output

Figure 1 displays the yearly scientific output in sustainable finance, revealing that the initial years did not prioritize ESG principles in investment until the early 1990s, which signifies the commencement of research in this area with just a small number of articles being published. The world has begun implementing sustainable strategies in various aspects of human life because of the growing curiosity of academicians, and scholars in sustainability and global warming issues, the depletion of natural resources, greenhouse gas emissions, clean energy and the environment, and the issuance of green bonds. Figure 1 illustrates the production trends from 1994 to 2024. During the period from 1990 to 2014, a total of 42 articles were published, which accounted for barely 3% of the whole production. Simultaneously, 97% (1219) of publications were published in the decade prior to 2015–2024. A total of 89 articles will be generated throughout the initial four months of 2024. The production trend for sustainable finance is seeing exponential growth, as depicted in the Figure 1.

3.3. Most Significant Sources

Sources are essential for the advancement of a research stream. Table 3 ranks the top 12 sources according to their total publication count. Journal quality can be assessed through metrics including citation counts and the h-index. The importance of a research article is assessed by the citations it garners from scholars. The h-index represents the highest quantity of scientific papers that have garnered the most citations (Egghe, 2008). The G-index quantifies the maximum number (n) of publications that have garnered a minimum of n^2 citations (Nalubega and Evans, 2015). The M-index serves as an alternative designation for the h-index. The text presents the h-index for each year, commencing from the initial year of publication (Egghe, 2008a, 2008b). Environmental Science and Pollution Research holds the top position with 130 publications and 1,849 citations. An intriguing observation is that it commenced publication in this domain in 2019 and has consistently maintained the top position. Energy Economics began publication in 2003 and has published a total of 111 pieces, currently ranking second. Despite this, Energy Economics maintains a significant h-index, having garnered 4886 citations and ranking first. Sustainability is the third-ranked journal with 70 publications and has been publishing in this domain since 2016, receiving 821 citations. The Journal of Cleaner Production has published a total of 56 pieces. Nevertheless, the h-index of this journal is significant and has gathered 2357 citations. Another well-regarded journal is Renewable Energy, having 53 publications and 1637 citations.
Figure 2. Most Relevant Sources.
Preprints 150769 g002
Figure 3 illustrates the increase in the sources, emphasizing that there was not much research conducted on the topic of sustainable financing in the 1990s. The stream gained prominence in early 2014 and experienced significant growth over time. Energy Economics has seen a remarkable increase, while Environmental Science and Pollution Research has consistently published more research papers on green finance. Likewise, the Journal of Cleaner Production and sustainability are experiencing consistent growth and are expected to continue increasing in the future.

Application of Bradford’s Law

A bibliometric principle, Bradford’s Law, is instrumental in identifying core journals that significantly contribute to a certain field of research. It suggests that a relatively slight number of journals will produce the mainstream of relevant research papers on a topic, while the rest will be dispersed across many less prolific sources. This paper applies Bradford’s Law to categorize the most influential journals in sustainable finance and their connectedness, as illustrated in Figure 4.
The paper identifies core journals such as Environmental Science and Pollution Research, Energy Economics, Sustainability, Journal of Cleaner Production, and Renewable Energy, which dominate the literature on sustainable finance connectedness. These journals align with Bradford’s core zone of prolific contributors, as indicated by their high output, citations, and h-index. Beyond this core, secondary and tertiary zones are established, consisting of journals with progressively fewer articles. This analysis underscores the concentration of knowledge in a few leading sources, which aligns with Bradford’s predictions and highlights where researchers should focus on accessing foundational and cutting-edge studies in this field.

3.4. Most Influential Authors

Table 4 displays the prolific authors who are the primary contributors to the field of connectedness in sustainable finance research, and this analysis provides a comprehensive understanding of their total work through factors such as the number of publications they have authored, co-authorship, and citations received. This analysis is derived from the aggregate number of articles authored by an individual. According to Table 4 and Figure 6, Naeem Muhammad Abubakr and Tiwari Aviral Kumar are the leading researchers in the connectedness of sustainable and green finance; they published an equal number of 23 documents, having 1399 and 1080 citations, respectively. Adebayo Tomiwa Sunday, Bouri Elie, and Karim Sitara are in second place with equal 10 academic contributions, while Abakah Emmanuel Joel Aikins and Umar Muhammad are rated third with nine publications. Figure 6 displays the writers who have published the highest number of works in the field of the connectedness of sustainable finance, indicating their level of activity. The majority of the most prolific authors began their publications in 2019.
Figure 5. Most Relevant Authors (No. of Documents in percentage).
Preprints 150769 g005
Figure 6. Most Relevant Authors (No. of Documents).
Preprints 150769 g006
Figure 7. Authors Local Impact by H index.
Preprints 150769 g007
Figure 8. Authors’ Production over time.
Preprints 150769 g008

3.4.1. Application of Lotka’s Law

Lotka’s Law is a bibliometric principle that describes the frequency of authorship in a particular scientific field. Specifically, it posits that the number of authors who publish a given number of articles in a field follows a power law distribution. According to Lotka’s Law, the number of authors who produce n articles is inversely proportional to n², meaning that a small number of authors produce a large number of publications, while a majority of authors contribute only a few works. In the context of this paper, Lotka’s law is applied to analyze the distribution of publications among the authors in the field of connectedness in sustainable finance. The study’s results, particularly the analysis presented in Table 5 and Figure 9, show how authorship in the connectedness of sustainable finance is distributed according to Lotka’s Law. The relevance of Lotka’s Law to this study is significant.

3.4.2. Uneven Distribution of Authorship

Lotka’s Law suggests that the number of authors producing a given number of articles follows a predictable pattern: a small number of authors publish a large percentage of the articles, and most authors publish only a few. This paper’s analysis of authorship (as shown in Table 5 and Figure 9: Lotka’s Law) demonstrates this very phenomenon. In the field of sustainable finance, a small group of authors, such as Naeem Muhammad Abubakr and Tiwari Aviral Kumar, each with 23 published articles, contribute significantly to the literature. These authors can be regarded as the “high productivity” researchers in the field, representing the “core” of the research community.

3.4.3. Publication Frequency Distribution

As Lotka’s Law predicts, the rest of the authors contribute a disproportionately smaller number of papers. According to the data in the study, many authors have published only a small number of papers (e.g., 1 to 5). This is a typical pattern in most academic fields, where a few prolific authors dominate while the majority have limited output.

3.4.4. Implication for Research Networks

Lotka’s law helps identify how research networks are structured. In this paper, the concentration of research output among a few authors suggests that these individuals are likely the primary contributors to shaping the research agenda in the connected field of sustainable finance. It also underscores the importance of collaborative networks where highly productive authors often influence the direction and growth of the field.

3.4.5. Quantitative Representation

This paper uses quantitative bibliometric data to support this analysis (e.g., citation counts, author counts, and publication numbers), which aligns perfectly with the mathematical model of Lotka’s Law. The distribution of authorship and the citations of their works are consistent with the expected pattern of high productivity among a small group of scholars. The application of Lotka’s Law in this study is appropriate and provides valuable insights into the authorship dynamics within the field of connectedness of sustainable finance. It underscores the concentration of contributions from a small group of highly productive authors and highlights the overall productivity patterns in the field. By acknowledging this law, this paper offers a clearer understanding of the research landscape and how knowledge dissemination is concentrated in a few hands, which can guide future research efforts and collaborations. This distribution offers valuable insights into research productivity and collaboration trends in the field, helping to identify key influencers and contributors who drive the development of the research agenda. In summary, Lotka’s Law highlights the uneven distribution of scholarly output in the field of connectedness in sustainable finance, with a few authors generating a large proportion of publications while the majority of authors produce fewer works. This helps in understanding the structure and dynamics of research activity in the area of connectedness of sustainable finance.

3.5. Most Influential Documents

Most influential documents are widely cited locally and globally. The influential documents demonstrate the continued research and expansion of a specific issue in the study. The top ten most important papers are displayed in Figure 10. The work “Hydrogen production for energy: An overview” by Dawood F, published in the International Journal of Hydrogen Energy in 2020, has received the most citations, demonstrating its fundamental role in the development of climate change. It is the most influential paper, having 1260 global citations. The research of Fischer, C., & Newell, R. G. (2008), titled “Environmental and technology policies for climate mitigation, published in the Journal of Environmental Economics and Management, has the 2nd highest global citations, which is 544. The third paper having the highest global citations (365) is “The way to induce private participation in green finance and investment,” written by Taghizadeh-Hesary, F., & Yoshino, N. (2019), published in Finance Research Letters.
The seminal work in the field of connectedness in sustainable finance by Ferrer, R., Shahzad, S. J. H., López, R., & Jareño, F. (2018). “Time and frequency dynamics of connectedness between renewable energy stocks and crude oil prices” has 354 global citations published in Energy Economics, a prestigious journal. The methodological work for the measurement of connectedness, titled “Better to give than to receive: predictive directional measurement of volatility spillovers, has the most local citations, 220, and “On the network topology of variance decompositions: Measuring the connectedness of financial firms” has local citations of 180, written by Diebold Fx, 2012; 2014, published in the International Journal of Forecasting and Journal of Econometrics, which are dominant papers to the methodology for the spillover and connectedness.
Figure 11. Most Local Cited References.
Preprints 150769 g011

3.6. Most Influential Affiliations

Figure 12 illustrates the ten most influential affiliations in the field of sustainable finance research. The Chinese Academy of Sciences is the most influential institution, with a total of 50 contributions. Ho Chi Minh City University Economics has published 42 research articles. Lebanese American University contributed 35 articles to the field of sustainable finance spillovers.
Table 6. Most Influential Affiliations.
Rank Institution Articles Share in total Articles (%)
1 Chinese Academy of Sciences 50 3.97
2 Ho Chi Minh City University Economics 42 3.33
3 Lebanese American University 35 2.78
4 Beijing Institute of Technology 30 2.38
5 Central South University 25 1.98
6 Central South University 23 1.82
7 University of Chinese Academy of Sciences, Cas 22 1.74
8 South Ural State University 20 1.59
9 Guizhou University of Finance and Economics 18 1.43
10 Shanghai Jiao Tong University 17 1.35

3.7. Most Influential Countries

This demonstrates the countries’ contributions to the overall scientific productivity. Table 7 displays the top 10 countries that have made significant contributions to sustainable finance and its connectedness. China is the primary contributor to the field of sustainable finance research, having published 673 articles, accounting for 53.37% of the sample. This indicates China’s strong commitment to addressing climate change concerns. The contributions from other countries comprise 46.37% of the sample, with the USA, UK, India, and France exerting the greatest influence.
Figure 13. Corresponding Author’s Countries.
Preprints 150769 g013

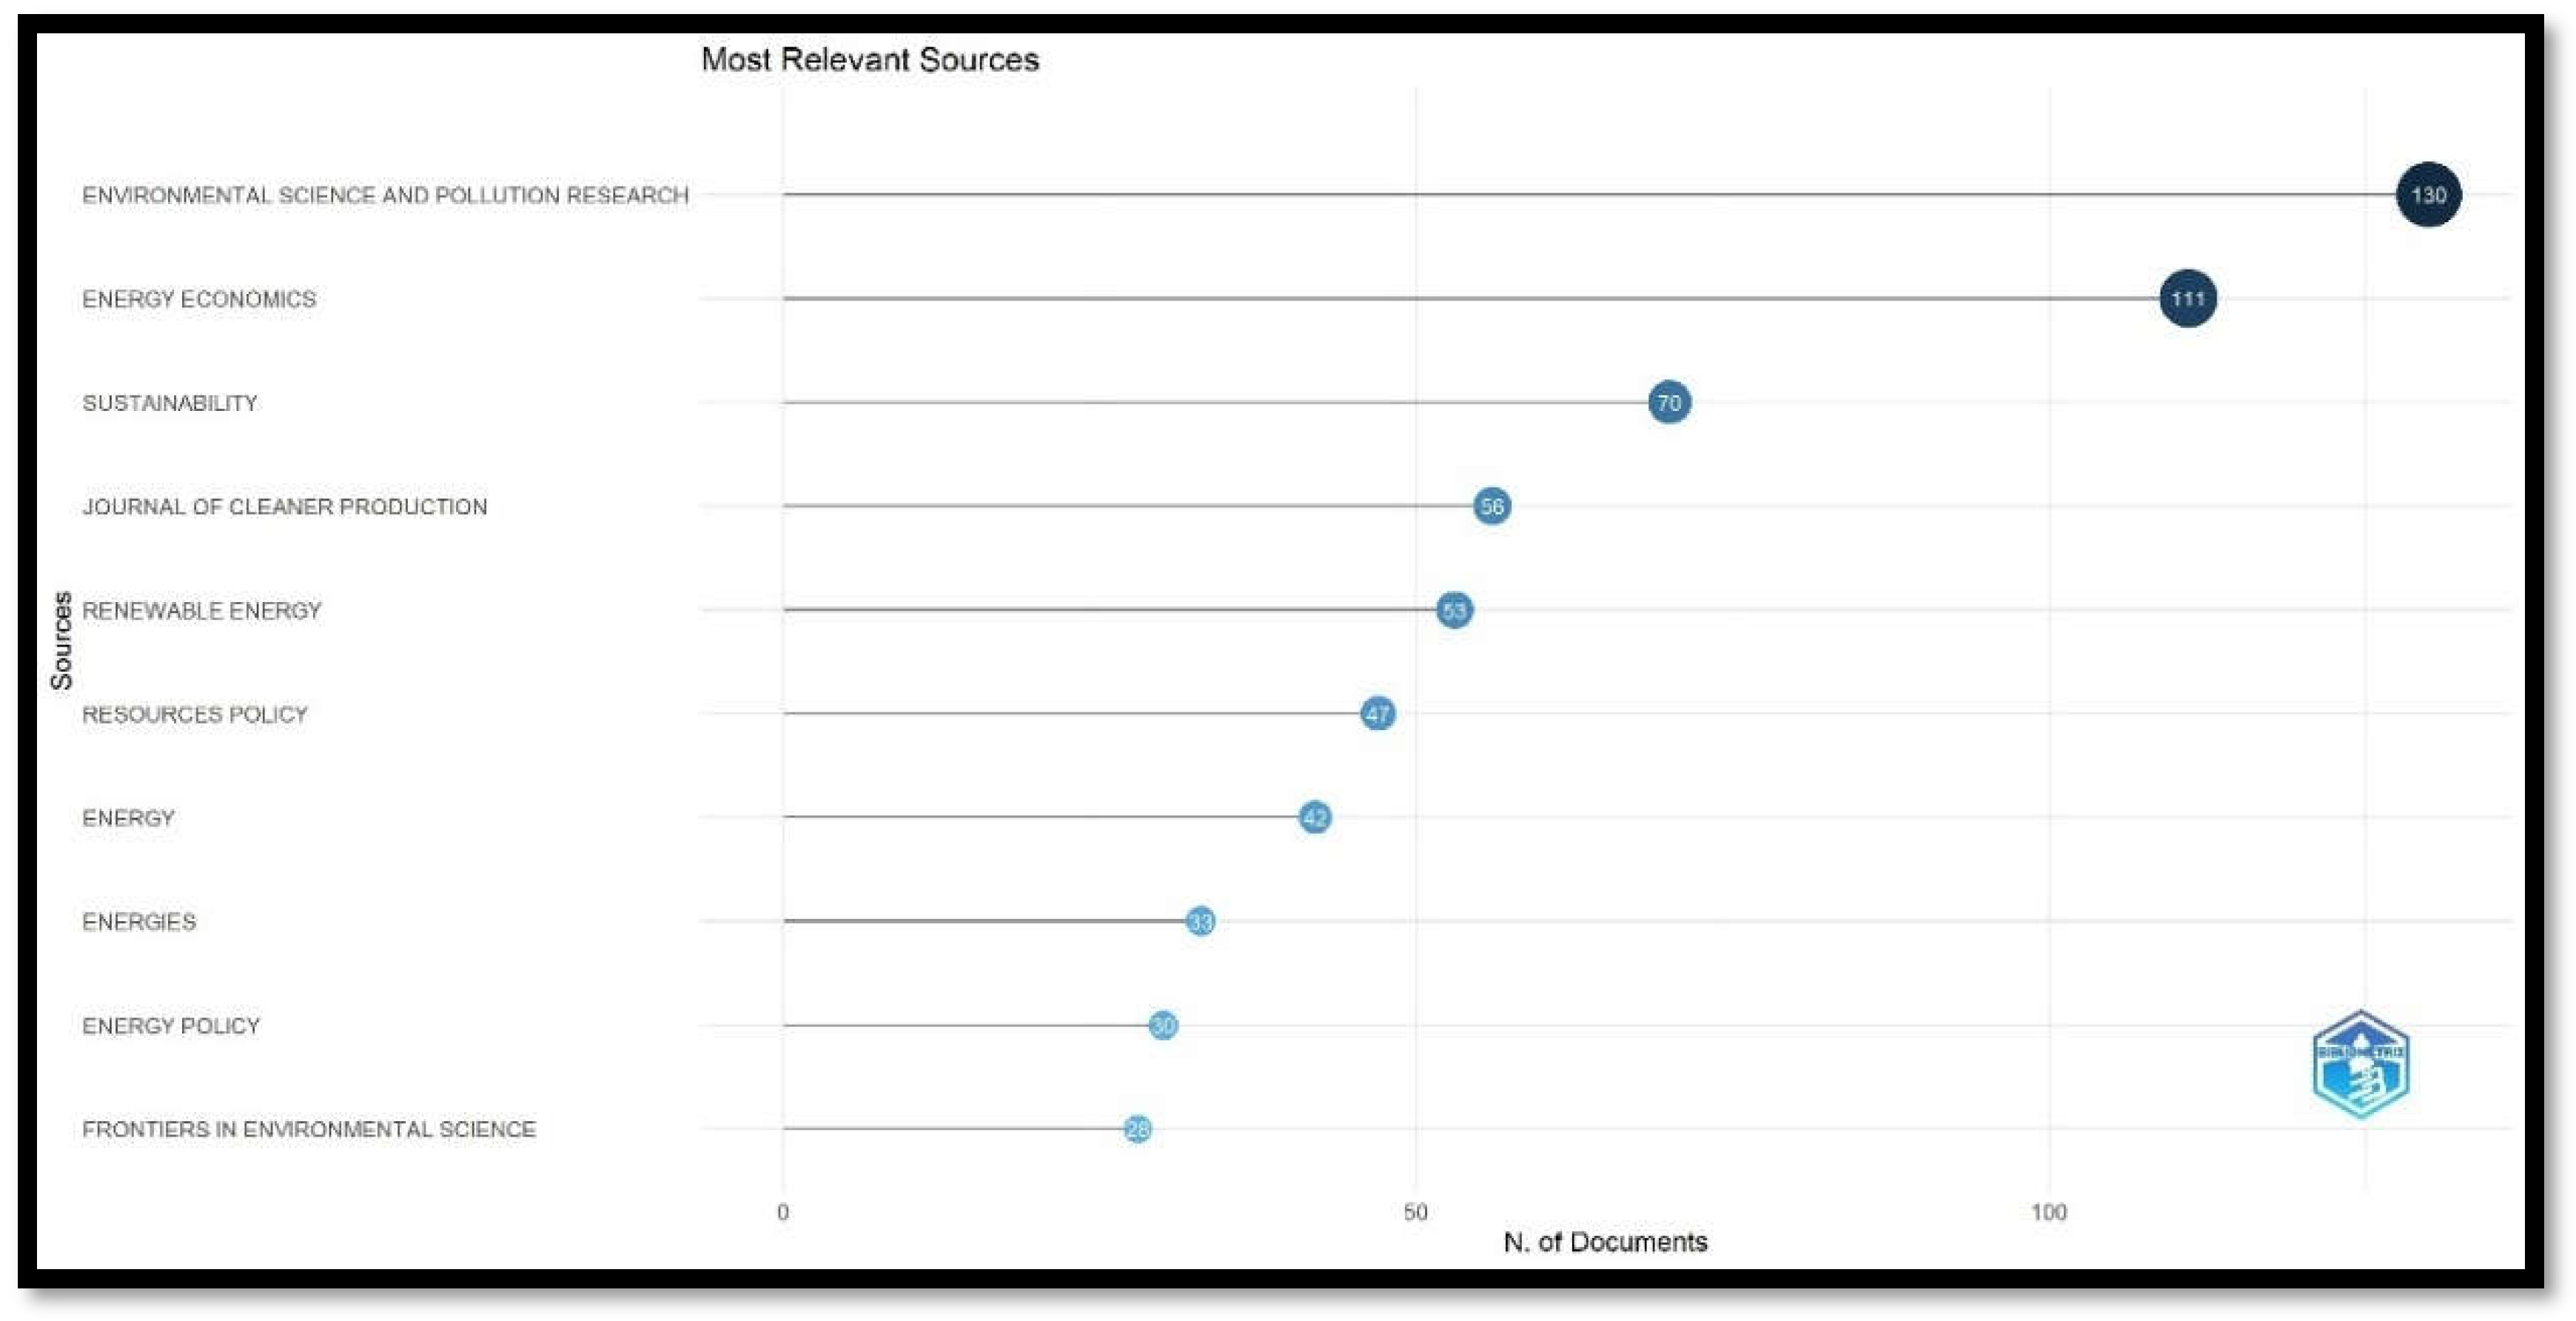
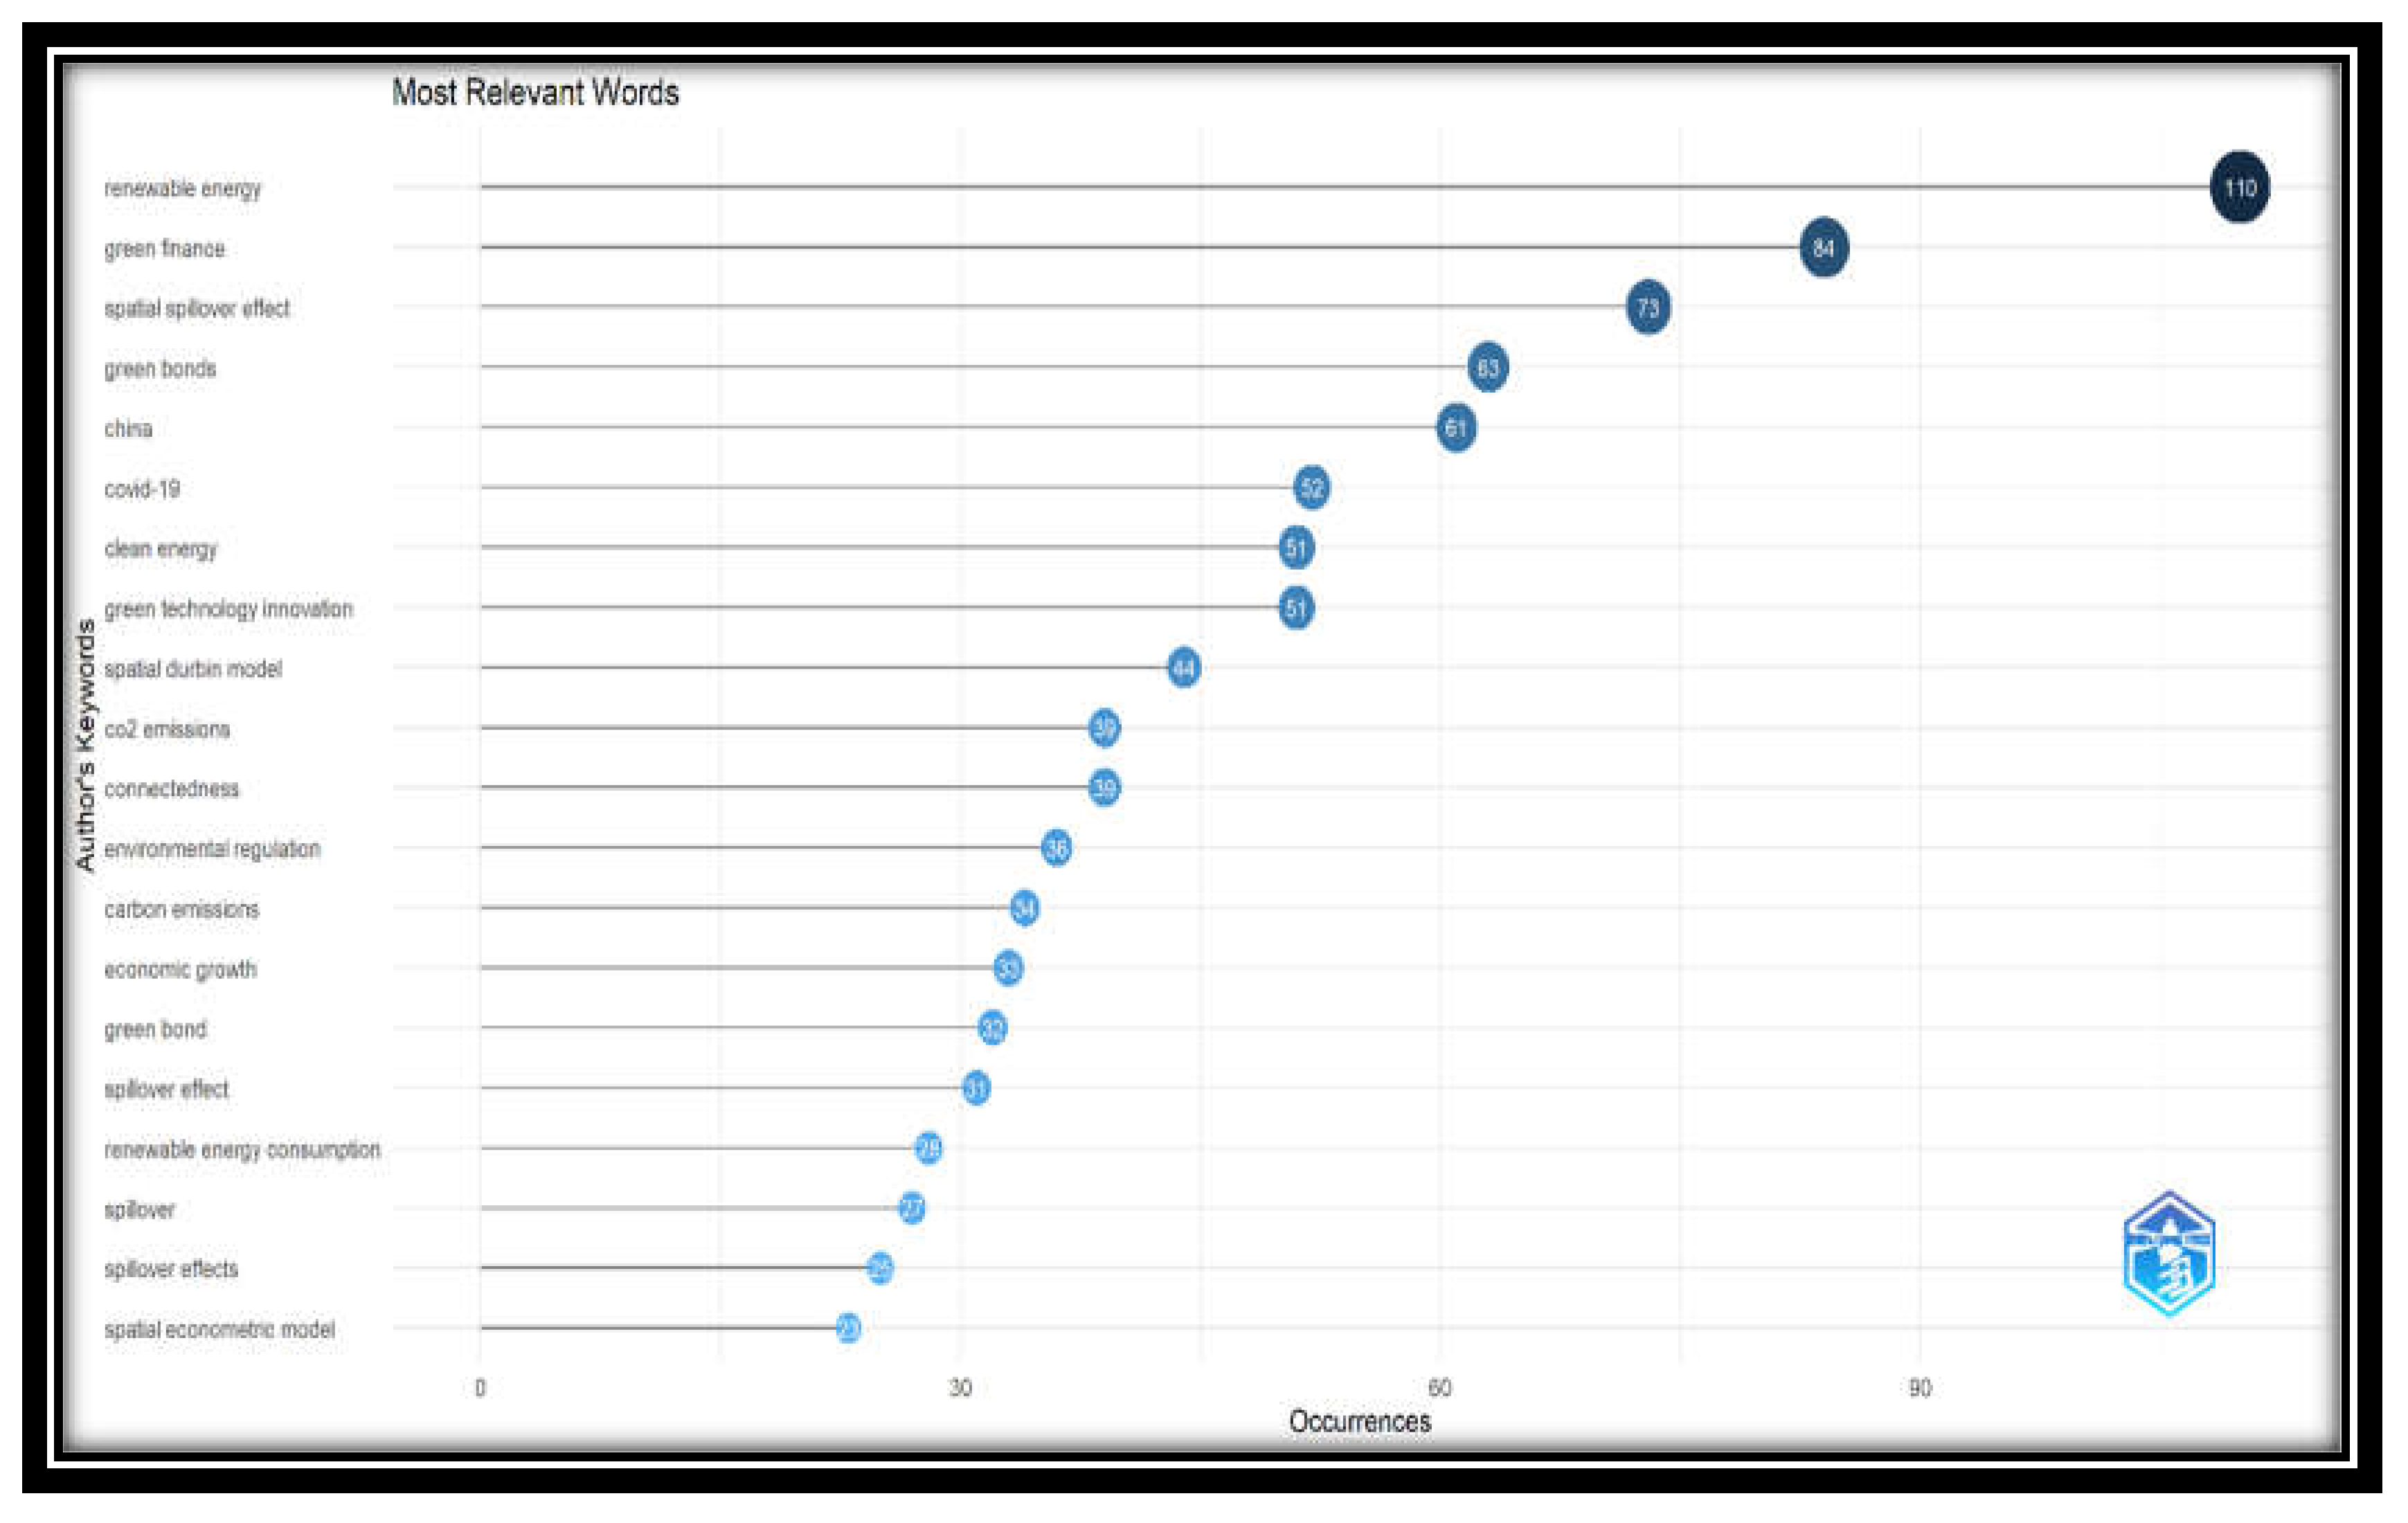
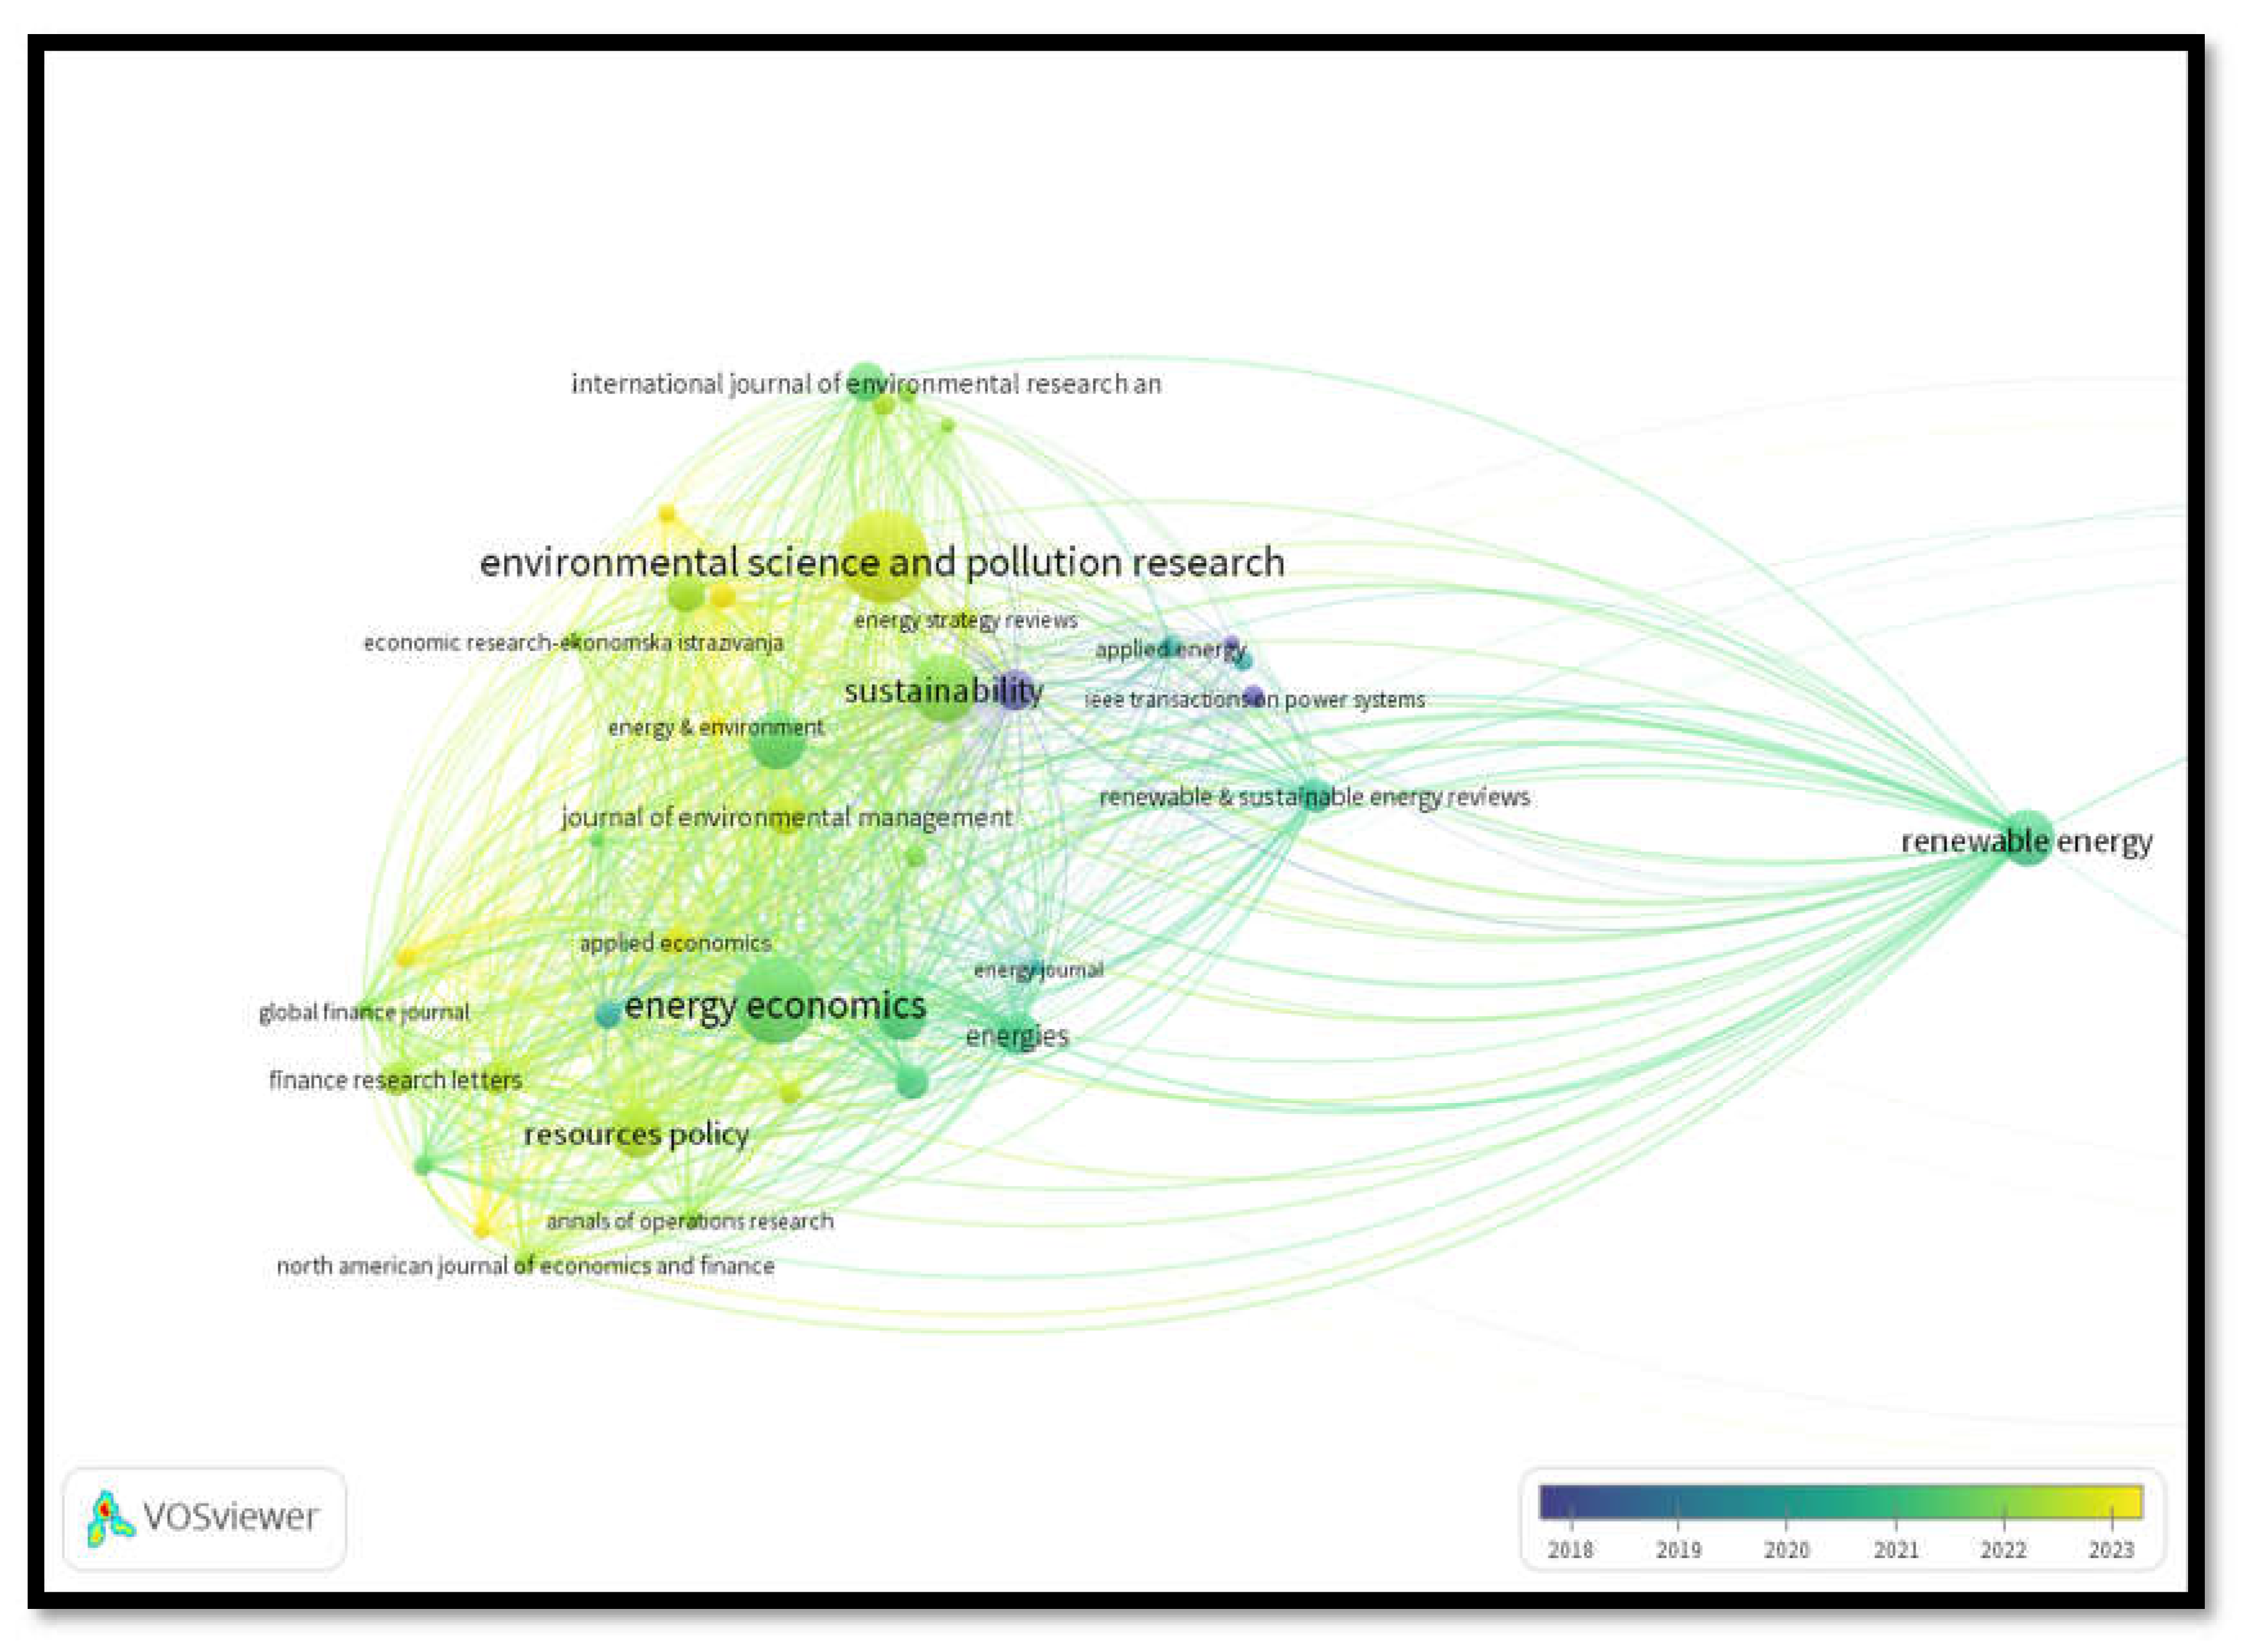
3.8. Most Important Words

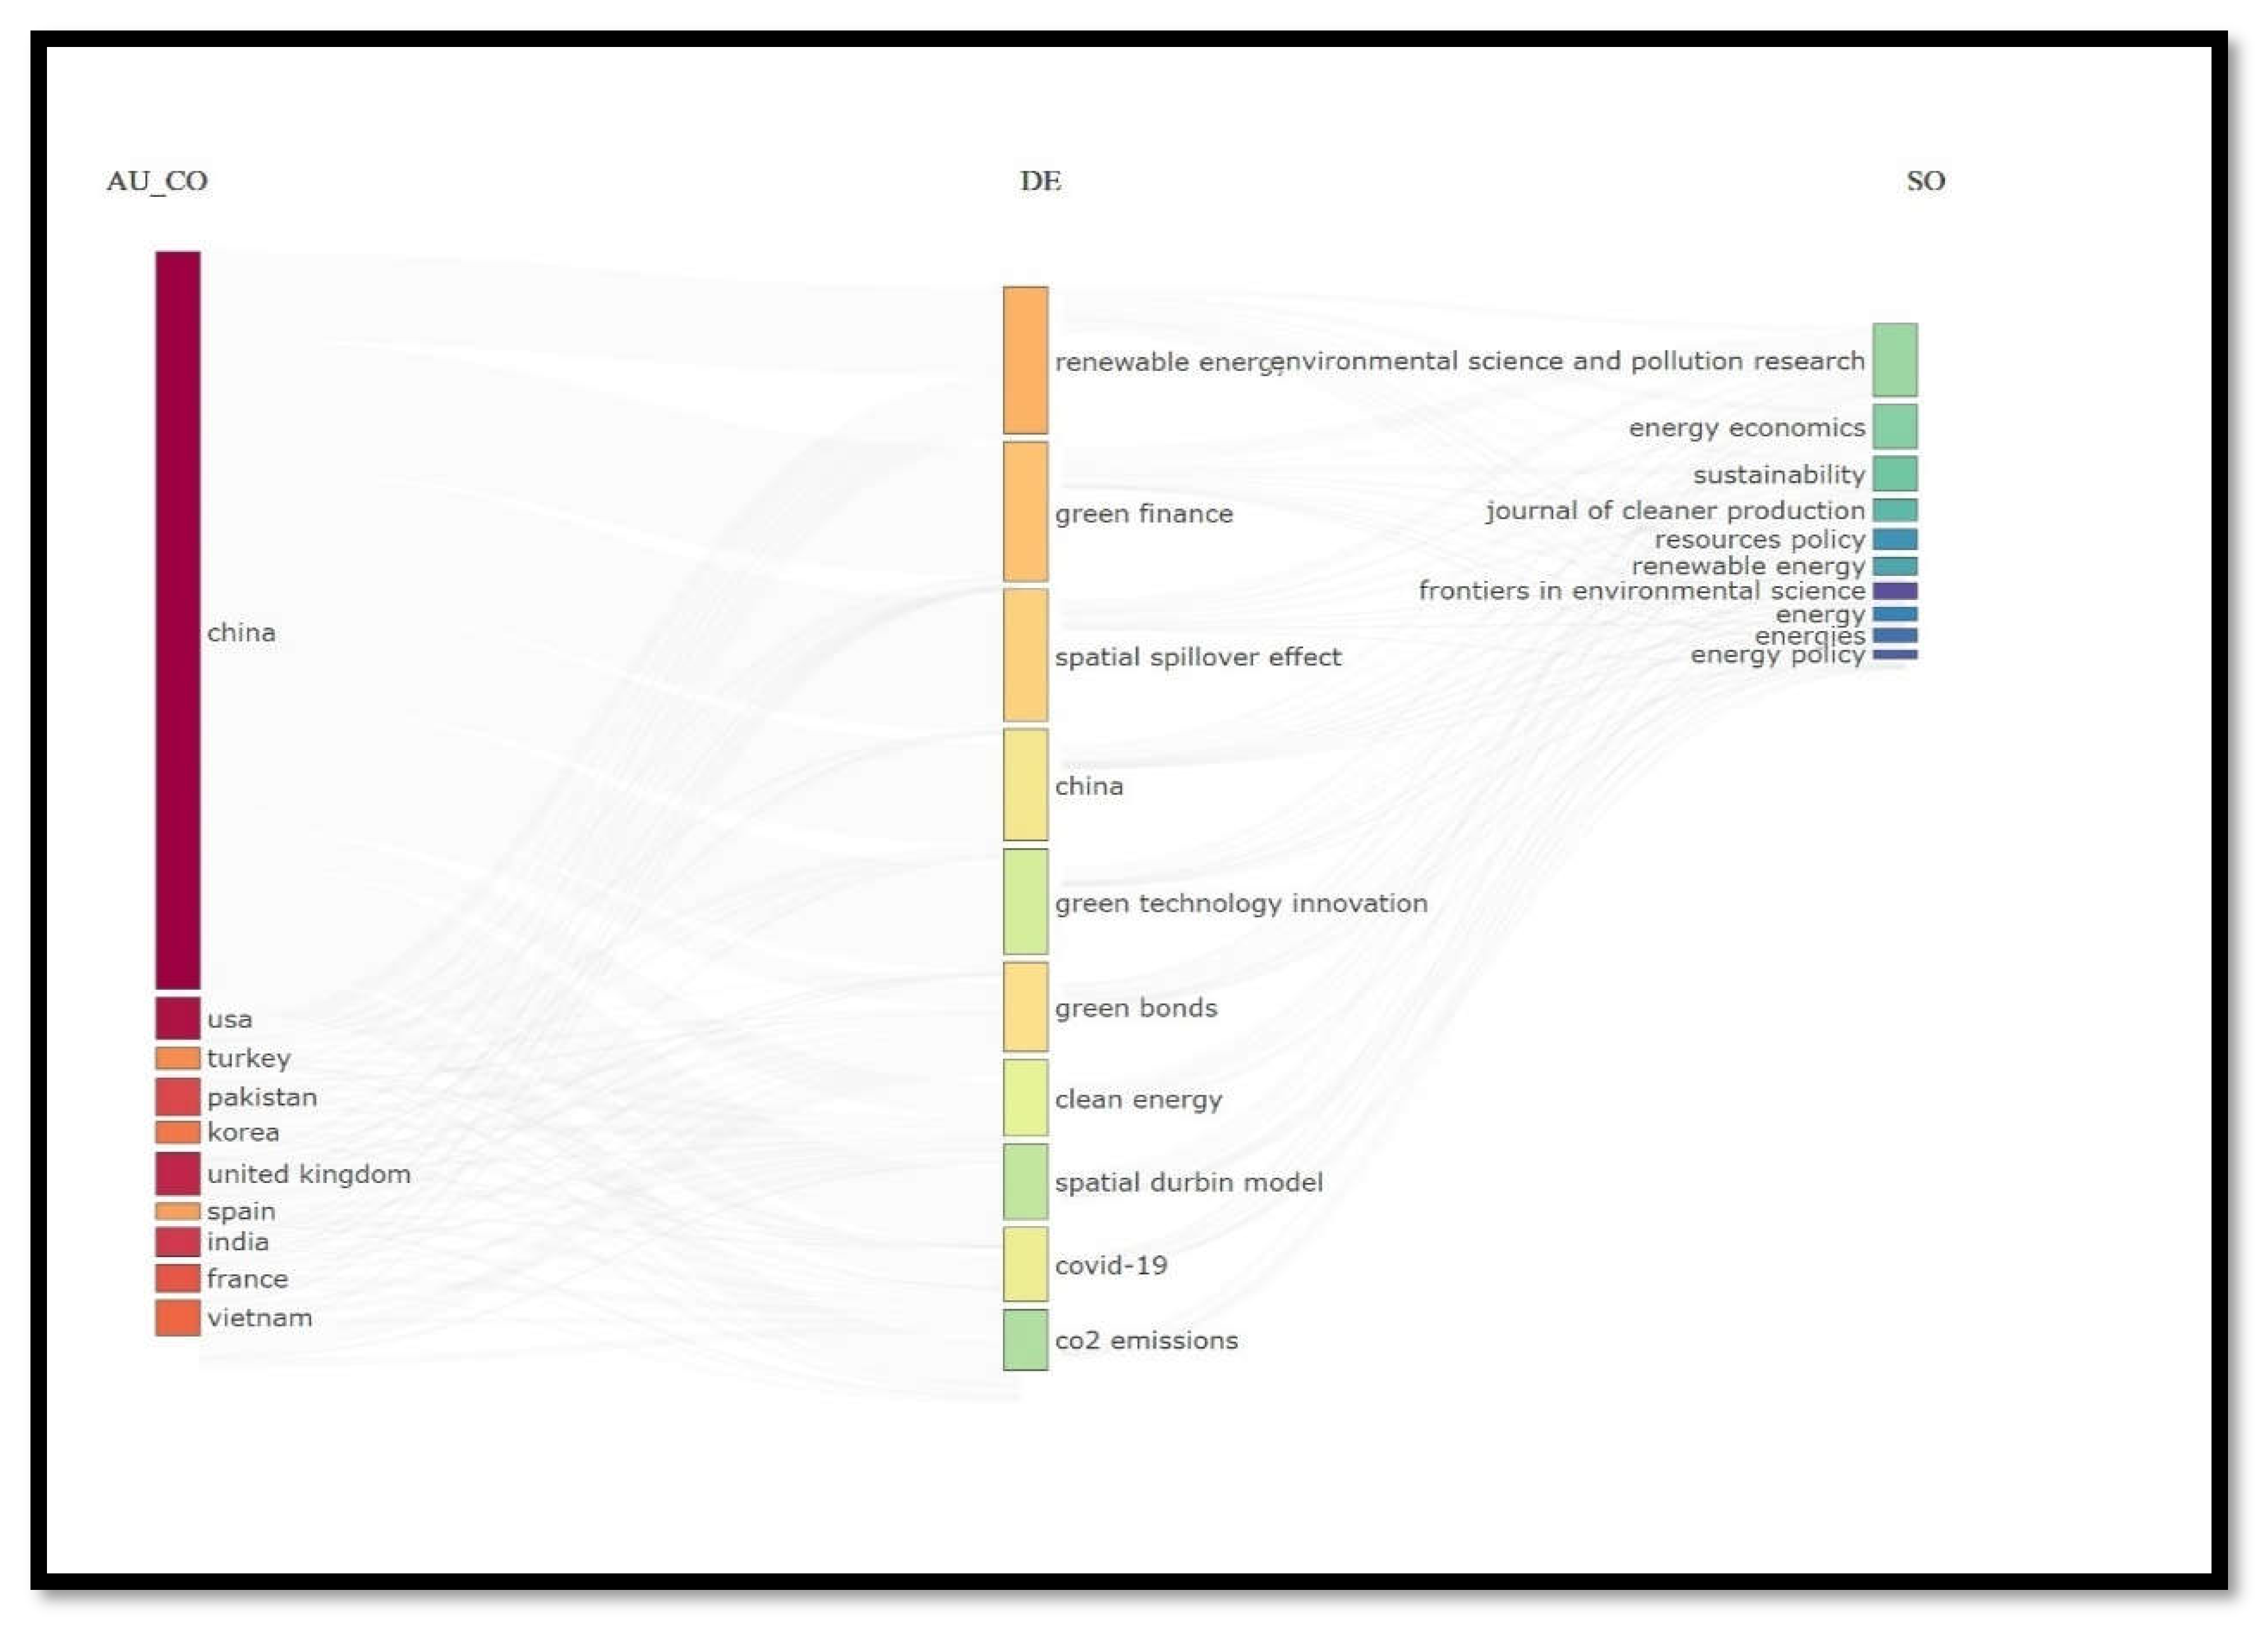
The occurrence of words serves as an indicator of the development and subject matter within a certain area of study (Kumar et al., 2021). This report provides valuable insights into the prevailing trends in research popularity. The top 20 most frequently used words by the authors, along with their frequencies, are shown in Figure 14.
The most commonly used terminology in the literature on the interconnectedness of sustainable finance is “renewable energy,” “green finance,” “spatial spillover effect,” “green bonds,” “clean energy,” “green technology innovation,” “connectedness,” “spillover effect,” “uncertainty,” “CO2 emissions,” “environmental regulations,” “renewable energy consumption,” and “economic growth.”

Co-occurrence Network of Author Keywords

Figure 14 and Figure 15 display a map that shows the frequency of keywords. Figure 14 presents the results of author keywords that meet the minimum occurrence criterion of 5. Out of a total of 3469 authors’ keywords, only 178 keywords matched the threshold criteria. 
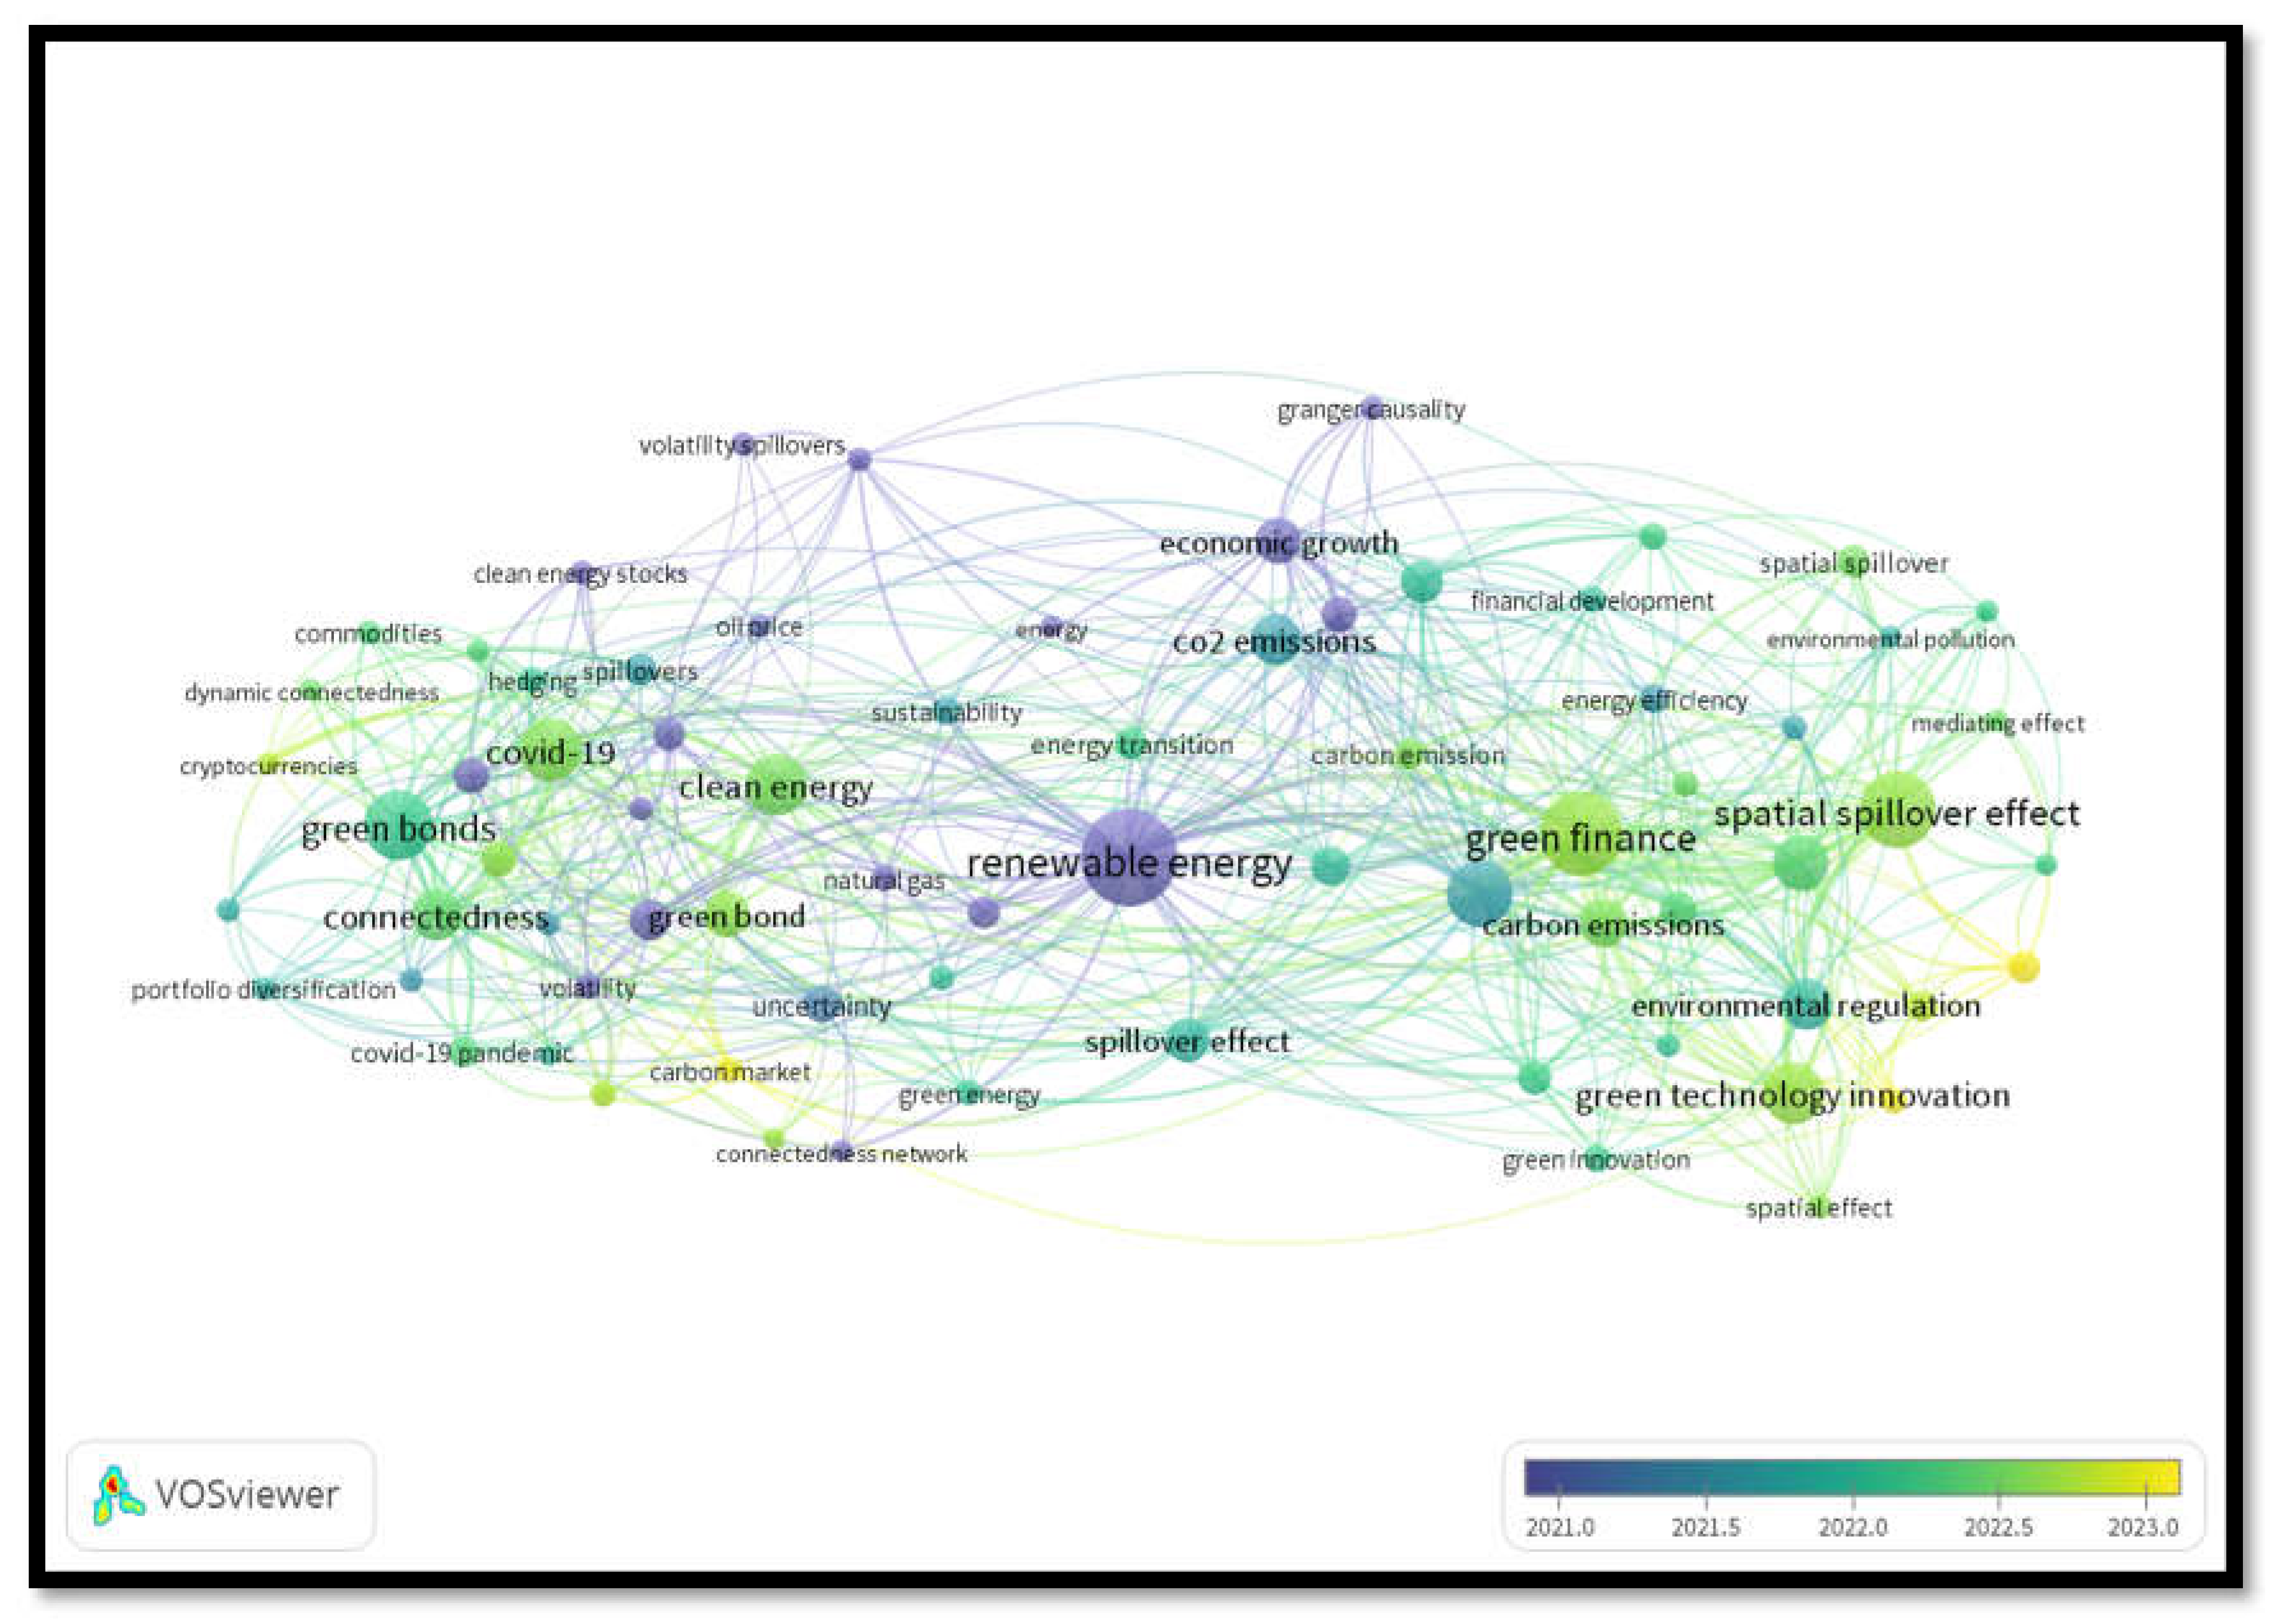
Figure 15 illustrates this trend in relation to time.
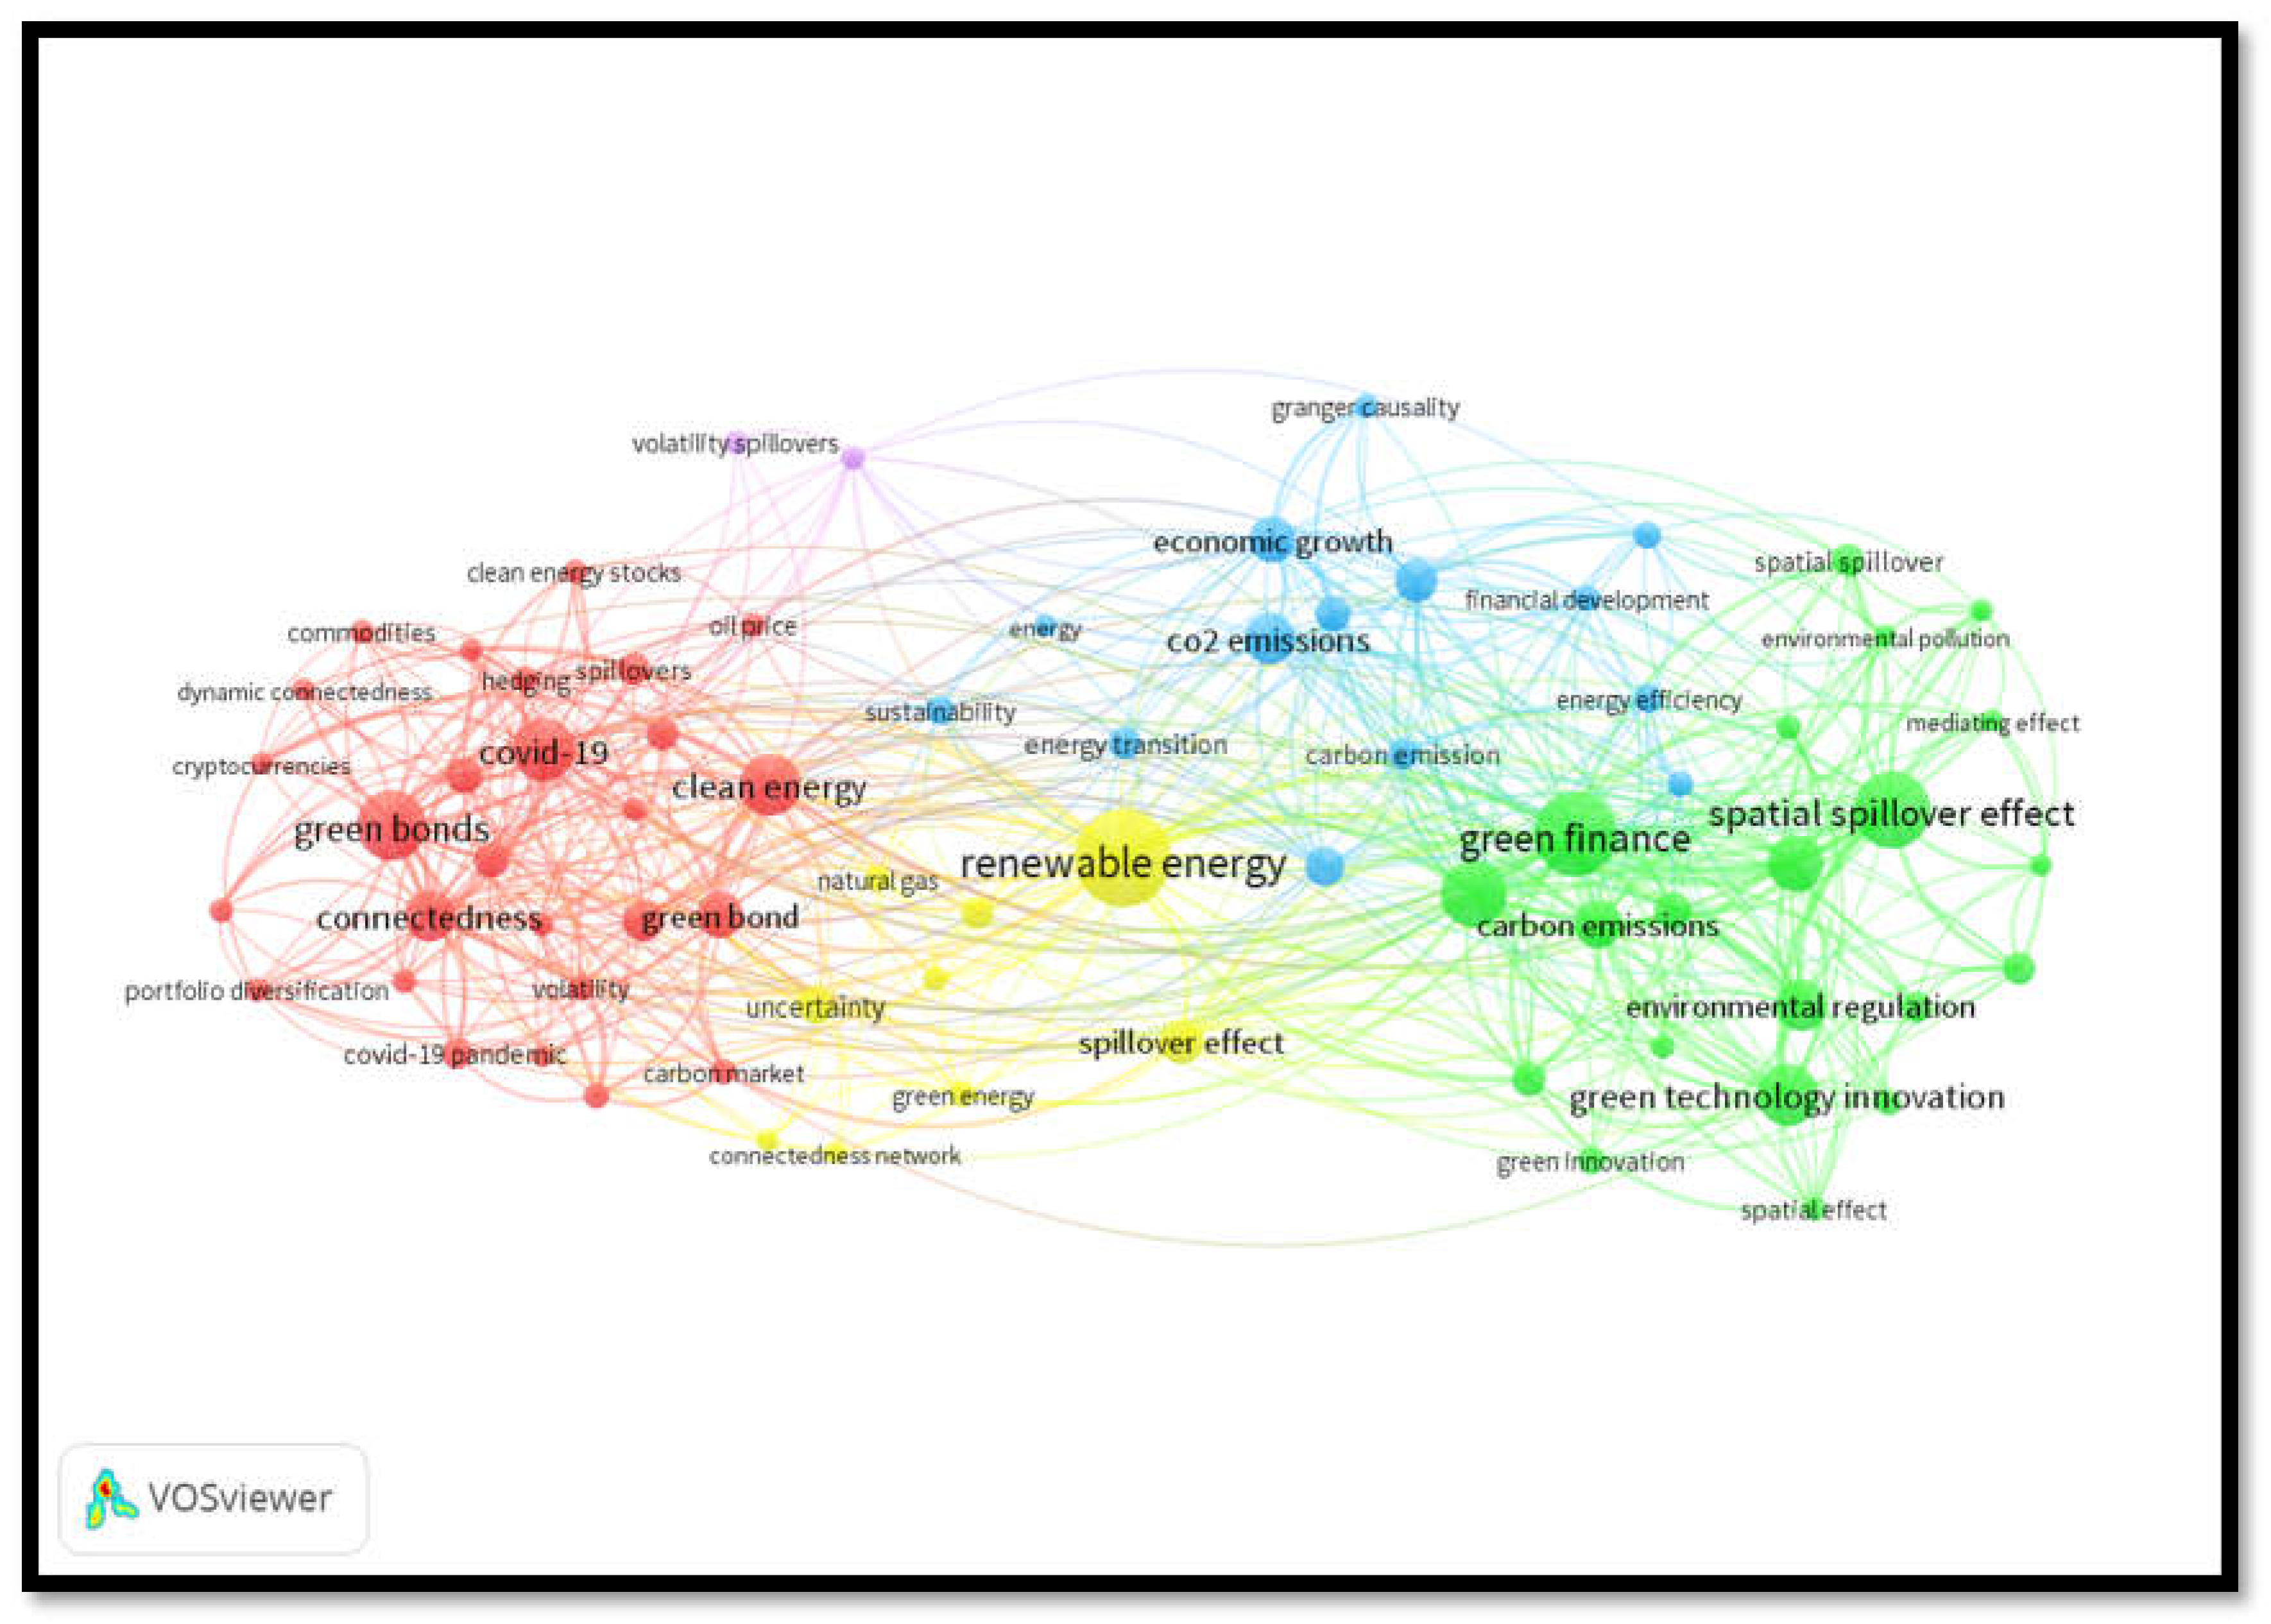
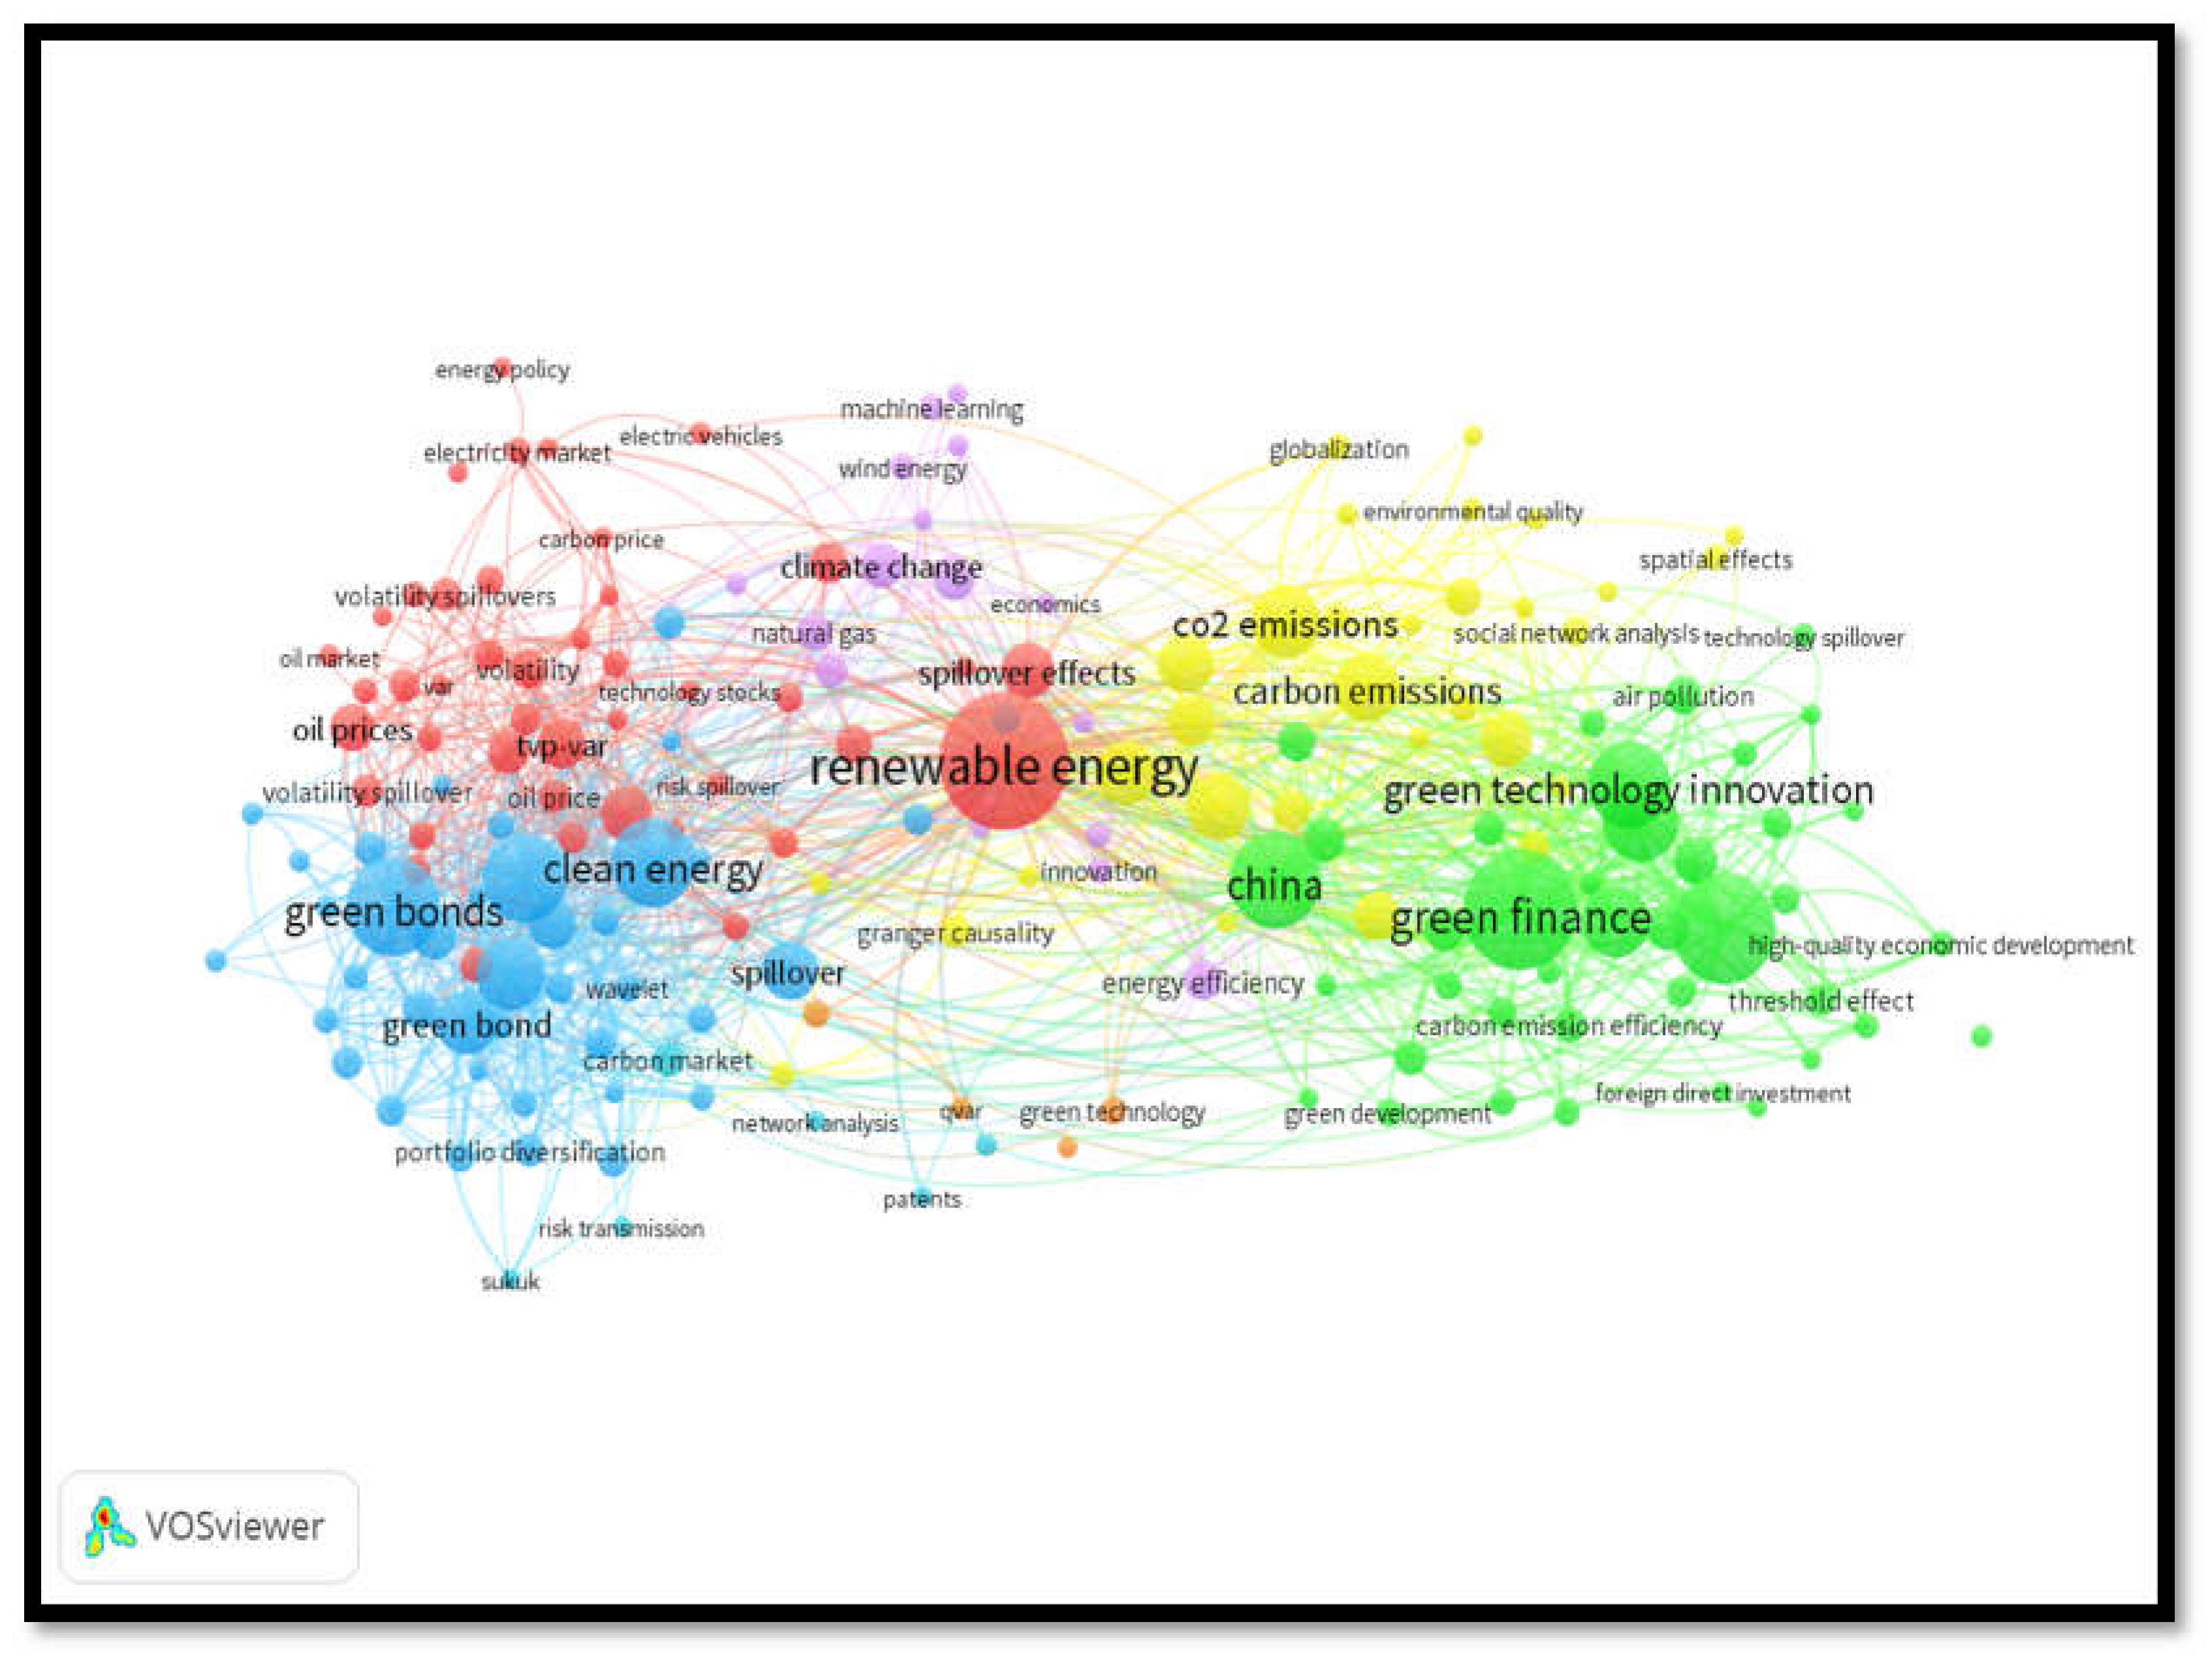
Figure 16 and Figure 17 show the network diagram of only the 73 most frequent words that meet the minimum occurrence threshold of 10.
Figure 16. Co-Occurrence Network-Min-5-178 Keywords over Time.
Preprints 150769 g016
Figure 17. Co-Occurrence Network-Min-10-73 Keywords.
Preprints 150769 g017
Figure 18. Co-Occurrence Network-Min-10-73 Keywords over Time.
Preprints 150769 g018
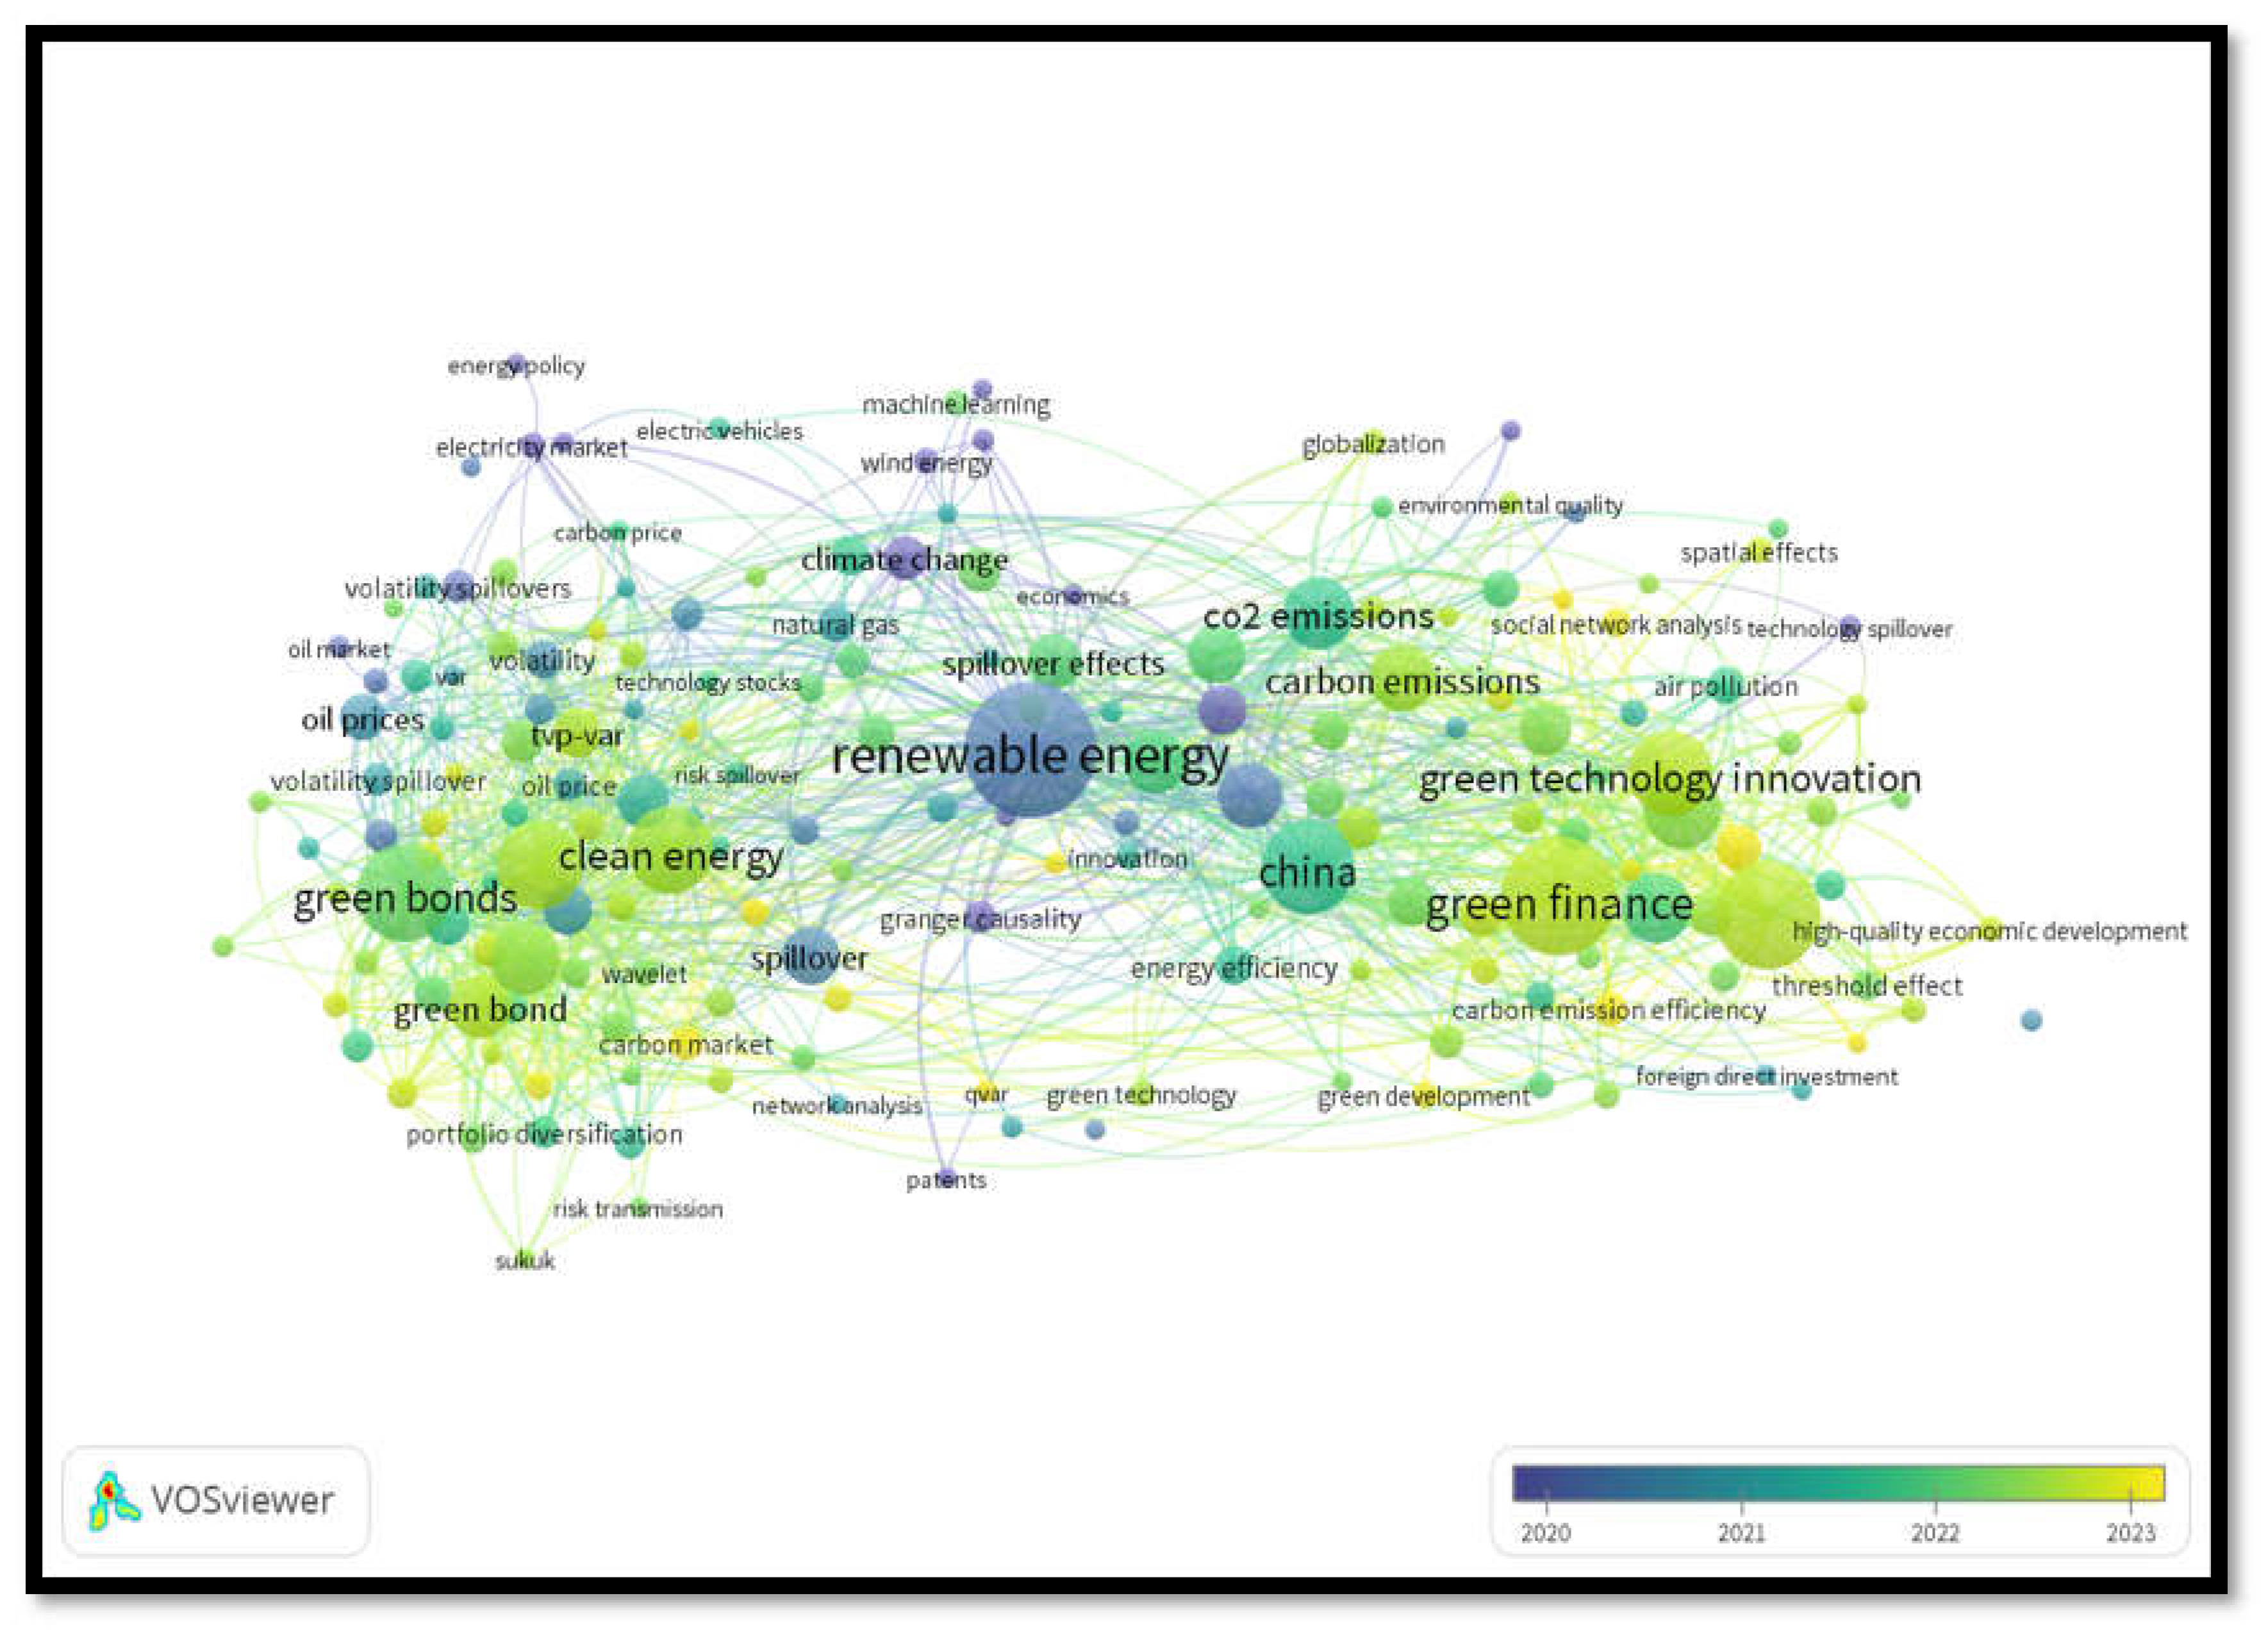
Figure 16 shows five distinct clusters of terms. Cluster 1 (red) has 27 keywords, Cluster 2 (green) contains 21 keywords, Cluster 3 (blue) comprises 14 keywords, and Cluster 4 (yellow) covers 9 keywords, and Cluster 5 (purple) has only two keywords. These clusters represent the prevailing pattern in the connectedness of sustainable financing. These clusters represent several research streams that focus on a specific dimension of connectedness in sustainable finance.
Cluster 1: Connectedness of Green Bond Market.
The dominant cluster, indicated by the red color, comprises 27 terms that encompass the studies related to the research on the risk transmission of the green bond market. The green bond market is the first green finance market where the greenest investment projects are financed, so scholars from several disciplines have been drawn to the topic of connectedness in sustainability finance; they choose the green bonds as a proxy for the green finance market. They examine and analyze related areas, including the connectedness of green finance, renewable energy, clean energy, CO2 emissions, and overall spillovers from green bonds to sustainable investment. This cluster primarily focuses on the significance of green investing using the funds generated through the bond market. The primary goal of the studies is to understand the advantages of diversifying into green markets. The scholars clearly identified the hedging benefits of green investing during the period of the Covid-19 pandemic. This cluster uses the following main keywords: dynamic connectedness, connectedness, volatility, connectedness, network hedging, portfolio diversification, spillovers, clean energy, green bonds, financial markets, and the COVID-19 pandemic. These issues of green finance study are closely interconnected and form the central focus of sustainability in finance. This group is also unified with other groups, indicating the incorporation of similar concepts throughout several facets of sustainable finance.
Cluster 2: Green Technology Innovation and Green Finance
The second green color cluster, known as the green innovation cluster, contains 21 keywords that are connected to green technology innovations and green finance tools utilized for sustainable financing. The cluster encompasses prominent concepts such as green finance, green technology innovation, green innovations, and the spatial spillover effect. This cluster encompasses the knowledge sphere of the sustainable economy. These clusters discuss the knowledge base of how sustainability can be achieved; only innovations of new energy sources can make possible the real transition to a sustainable future. This cluster includes additional studies on environmental regulation, environmental pollution, and air pollution, demonstrating that implementing clear regulations that prioritize green innovations is the only way to address the challenges posed by climate change. The correlation to other clusters is significant. The first cluster concentrates on the interconnectedness of green bonds, while this cluster investigates green finance as a source for green innovations and establishes the foundation for the digital economy, a crucial component of a sustainable economy. This cluster also identifies China as a hub for green innovations due to its effective environmental regulations, which support the green technological innovations.
Cluster 3: Sustainability, Energy Transition, and Economic Growth
The blue color cluster, having 14 keywords, is characterized by its focus on economic growth with sustainability. This cluster mostly includes terms related to the renewable energy transition aspects. This cluster concentrates on promoting economic growth while reducing carbon emissions and enhancing energy efficiency. The primary terms in this cluster are CO2 emissions, energy transition, sustainability, energy efficiency, technological innovations, economic growth, spillover effects, and Granger causality. This cluster illustrates ongoing research on the significance of sustainability. This group focuses on promoting economic growth to ensure the protection of the climate. All financial activities prioritize climate health. This cluster is closely interconnected with other clusters, particularly the second.
Cluster 4: Renewable Energy and Spillover Effect
The yellow color cluster on this network map is created exclusively using renewable energy and its spillover effects to the other sector of the economy. This cluster is central to all other clusters and has strong connections to other clusters’ energy sources. The cluster is mostly focused on the term’s renewable energy, renewable energy sources, green energy, spillover effect, uncertainty, connectedness network, and climate change. The finance and regulation of renewable energy are crucial for assuring the generation, distribution, and use of clean energy.
Cluster 5: Volatility Spillover during the Covid-19 Pandemic
The only two items in the purple color cluster identified a key volatility spillover effect of clean energy to oil prices during Covid-19.
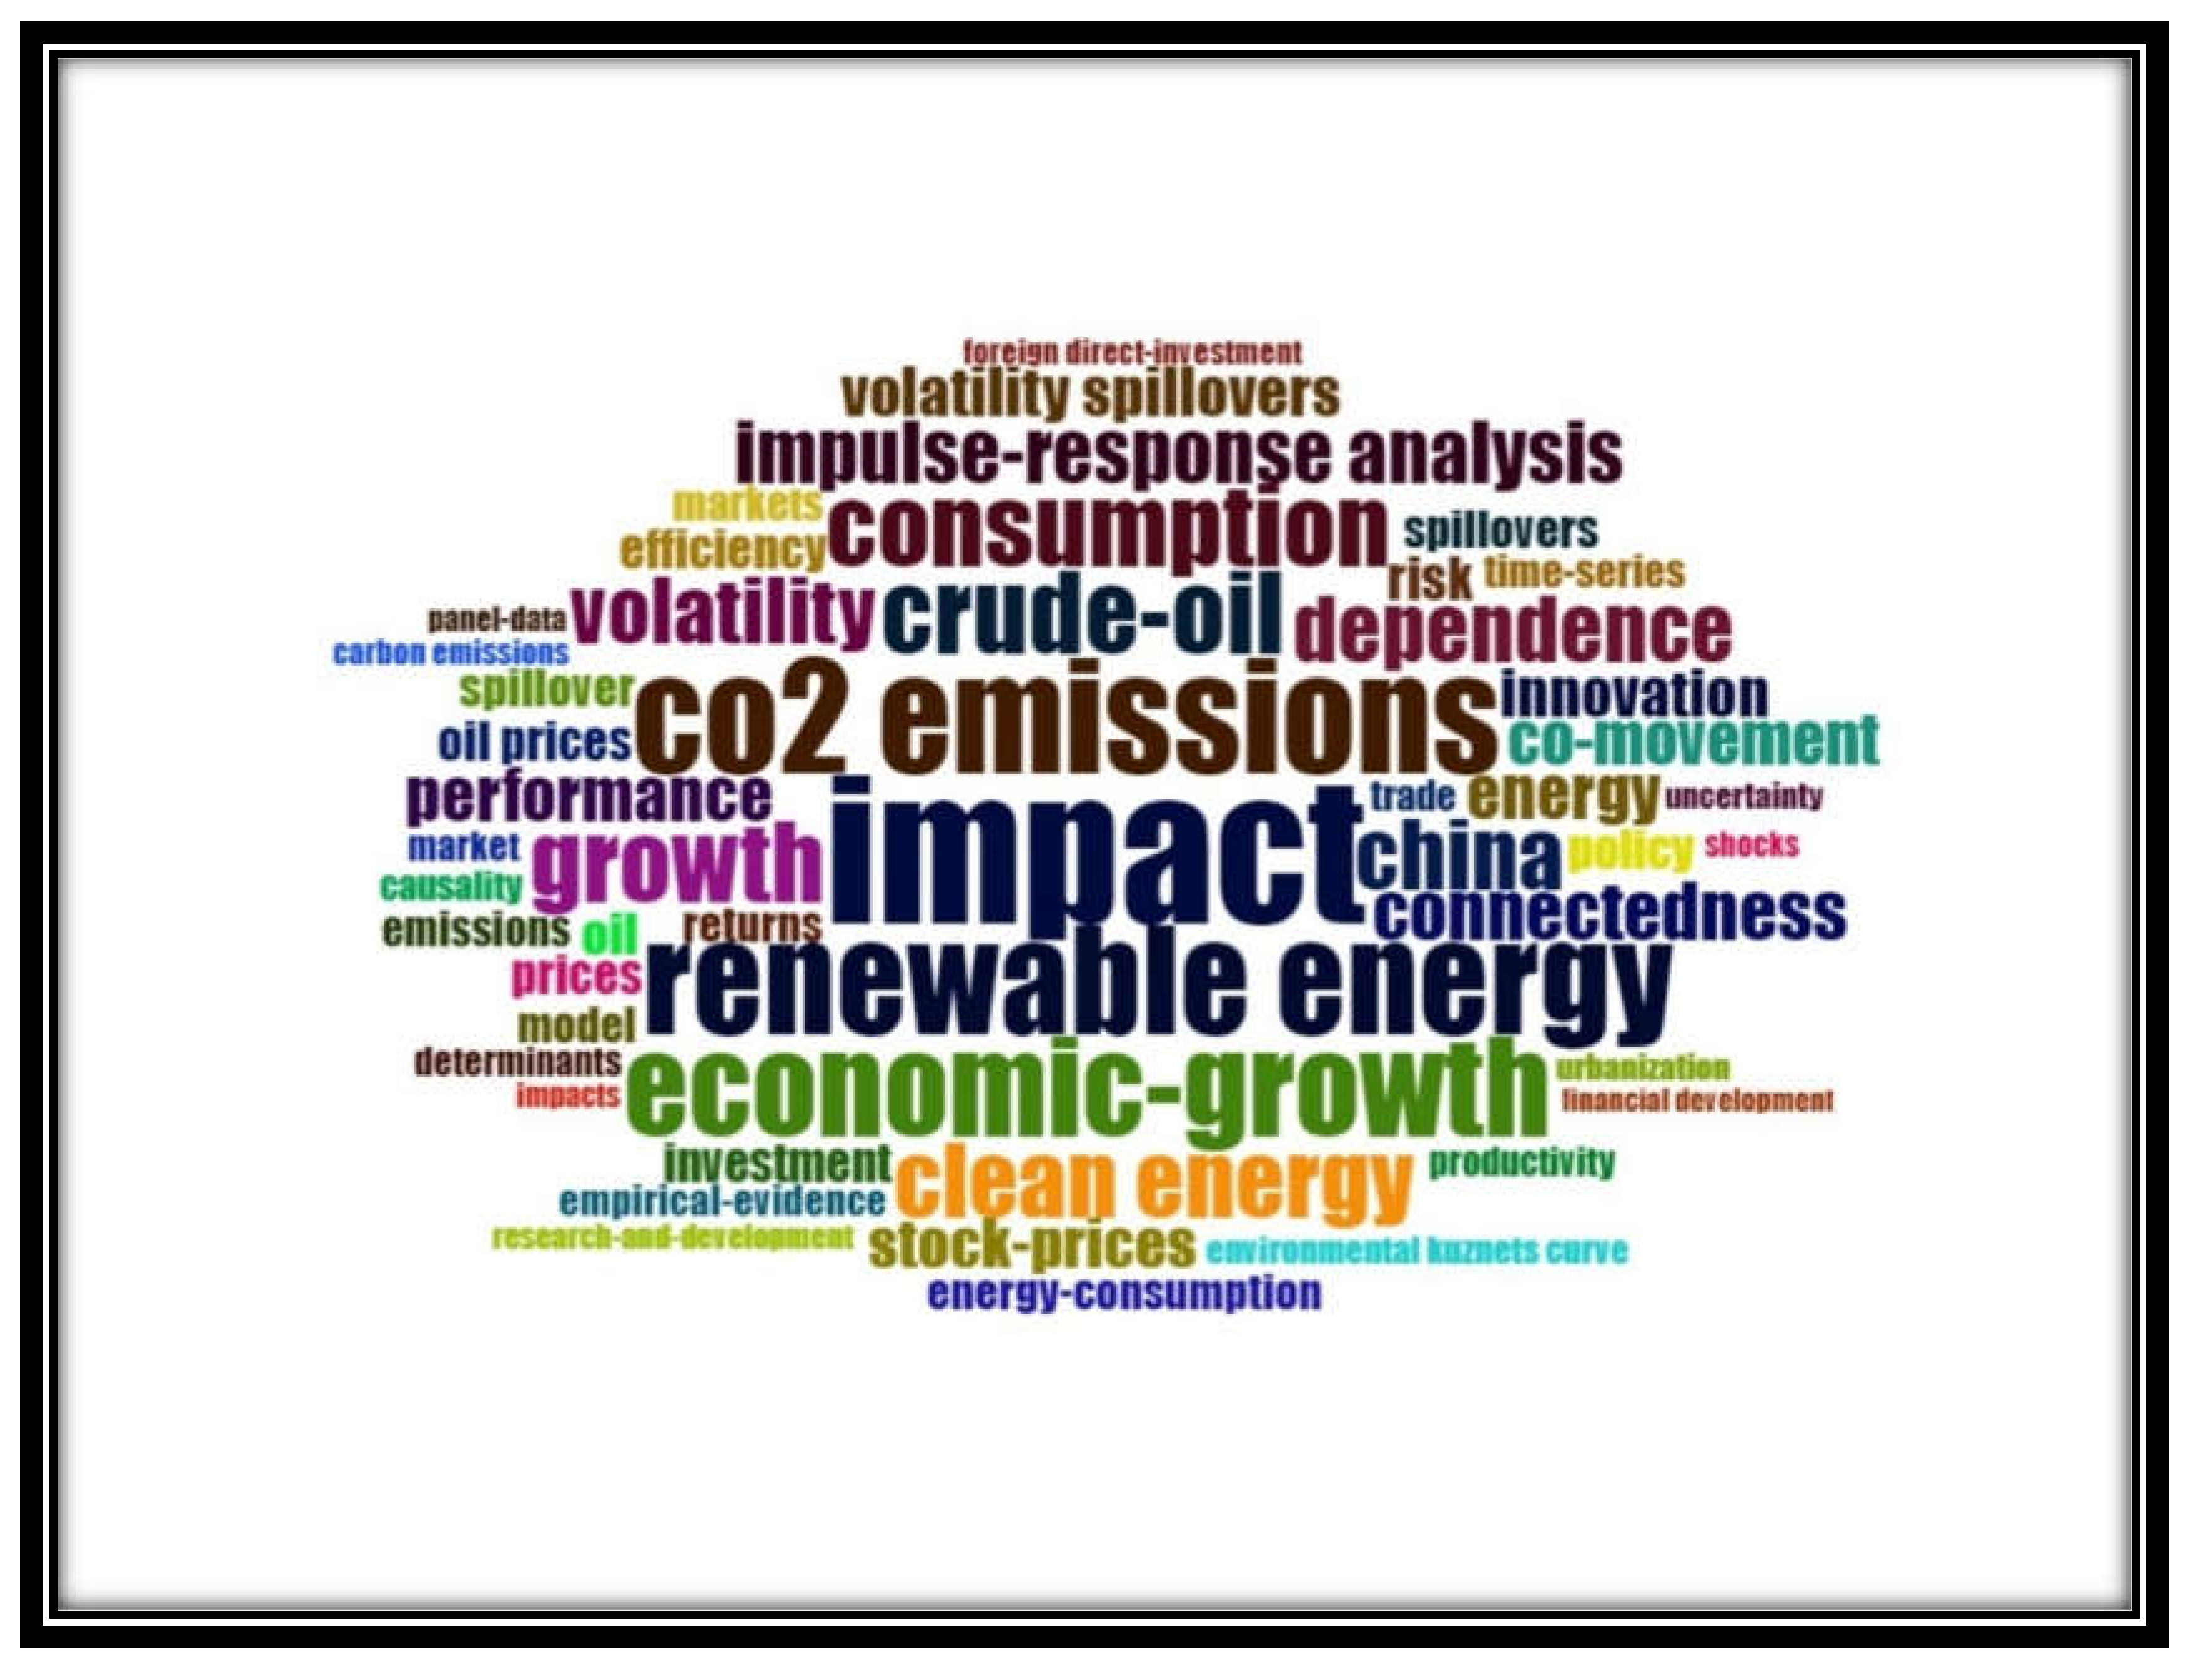
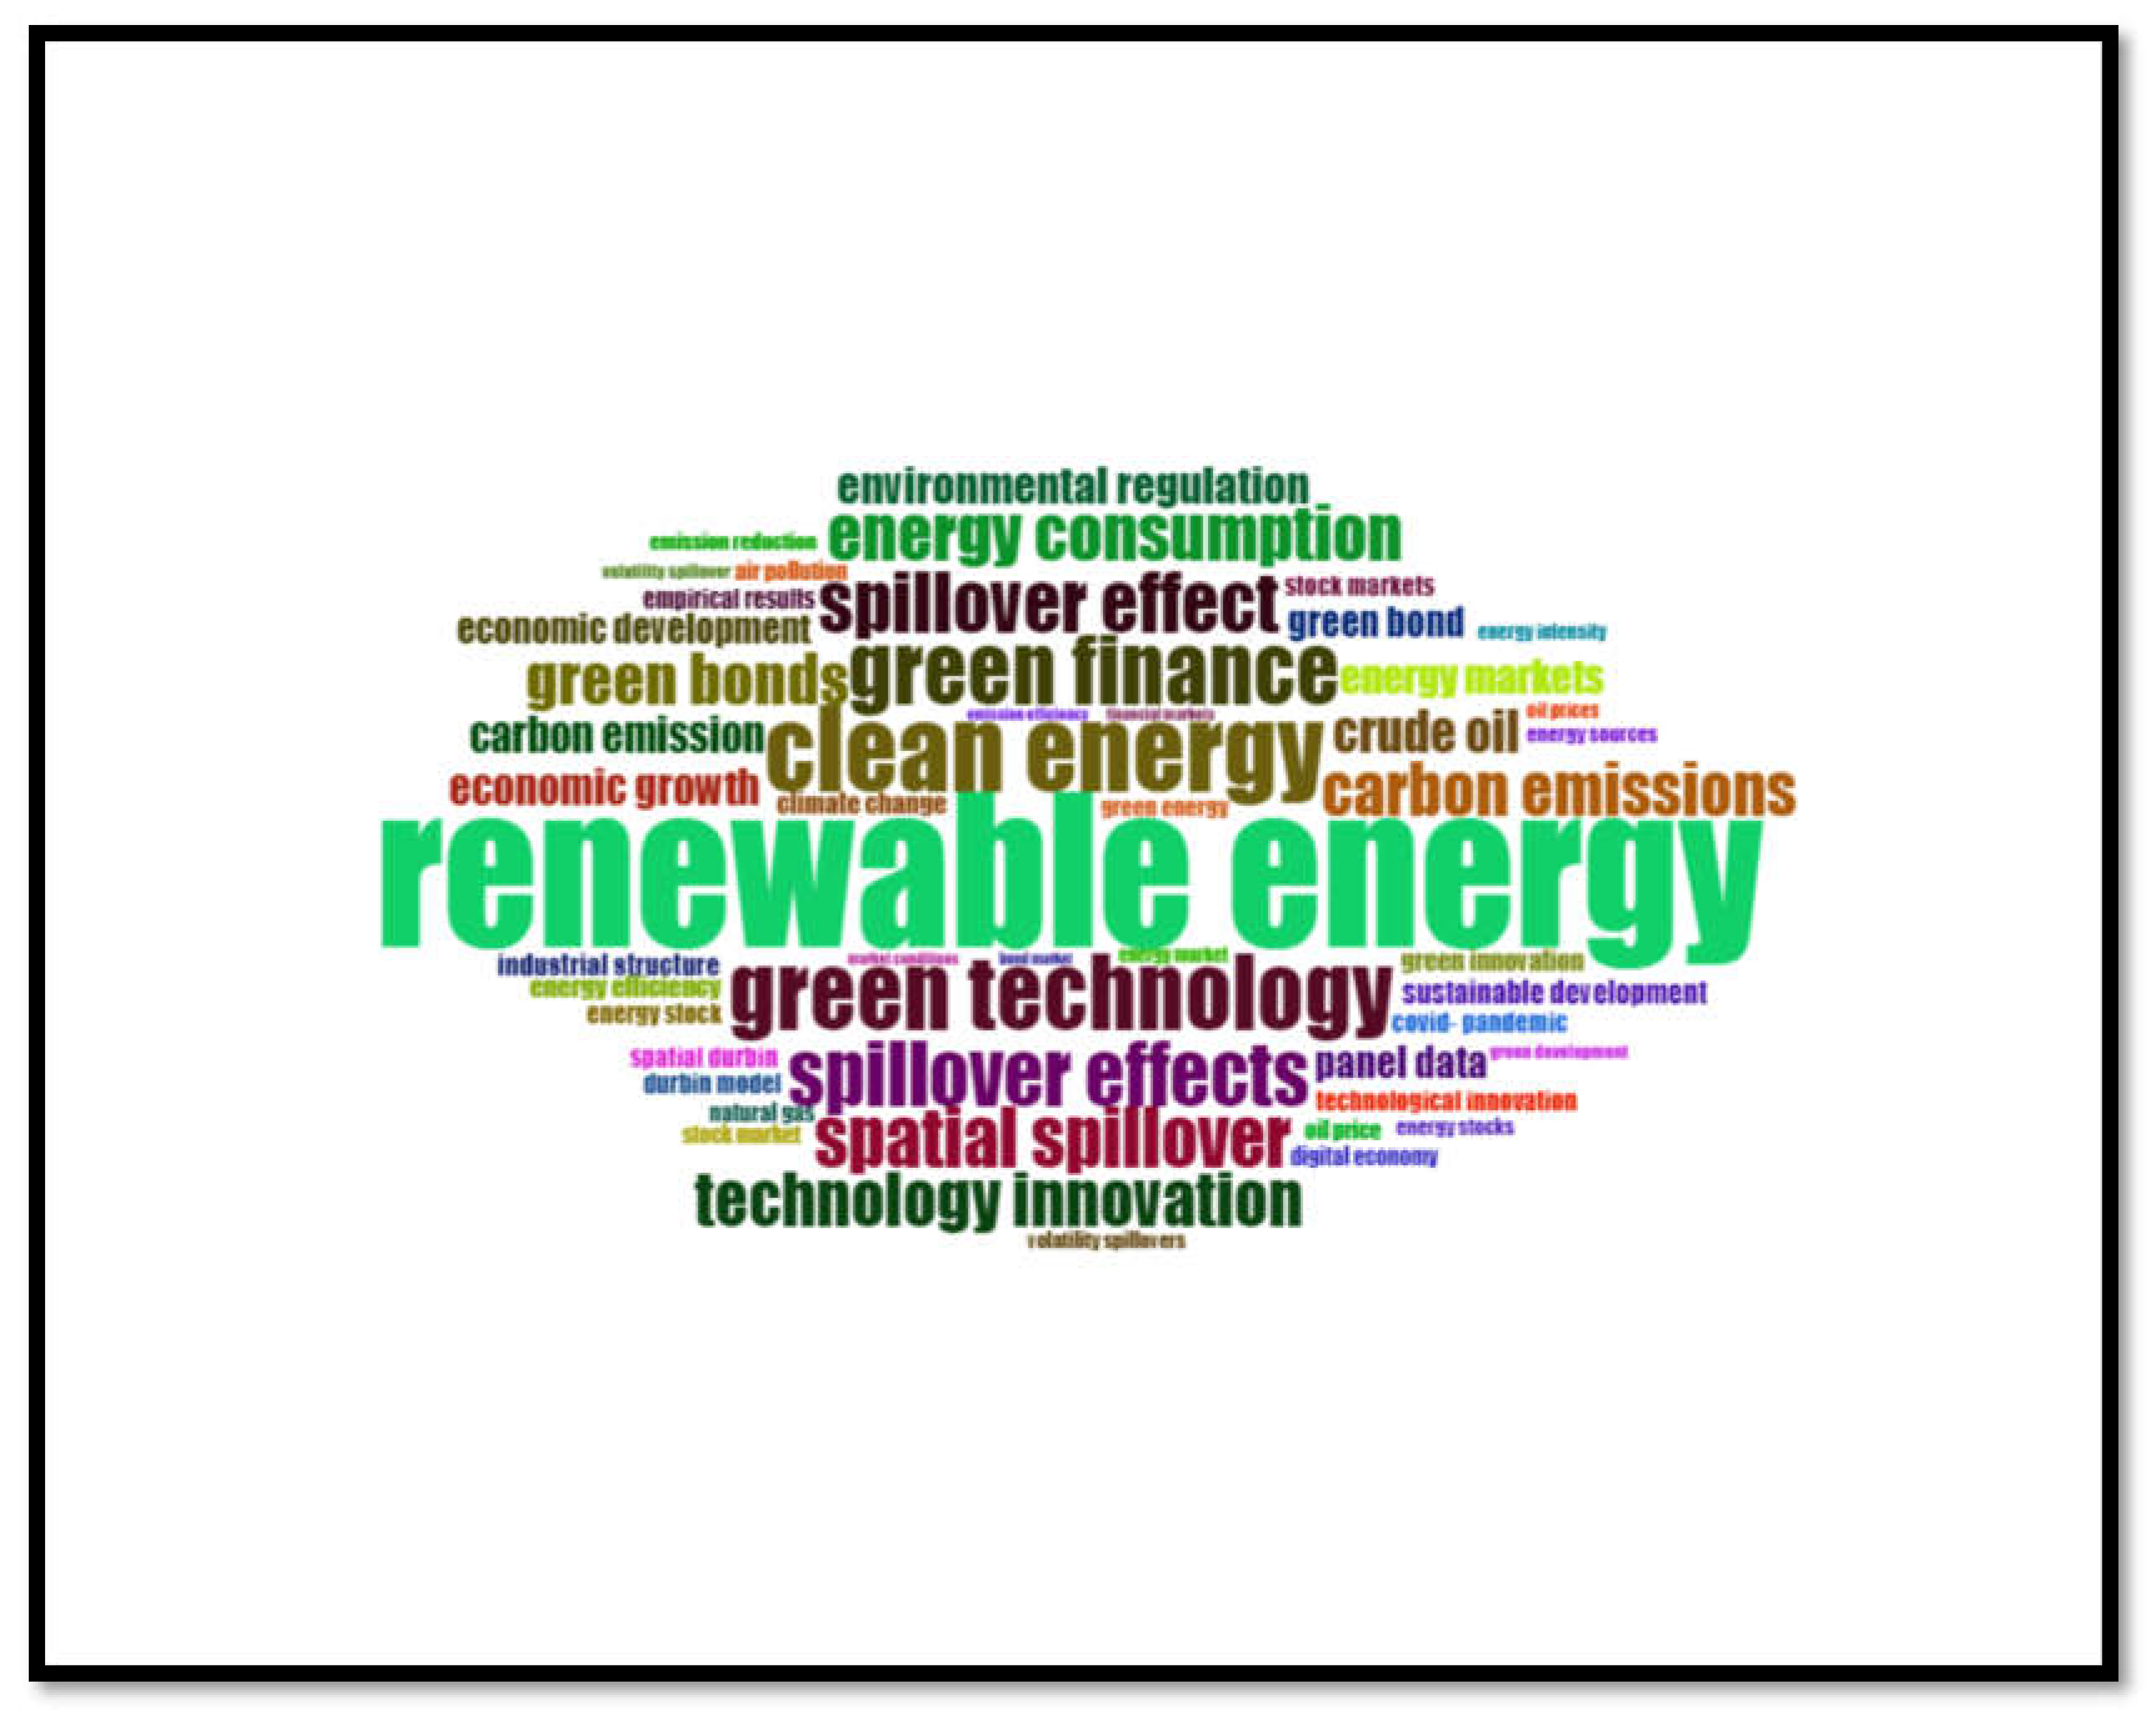
Figure 19. Word Cloud of author Key words.
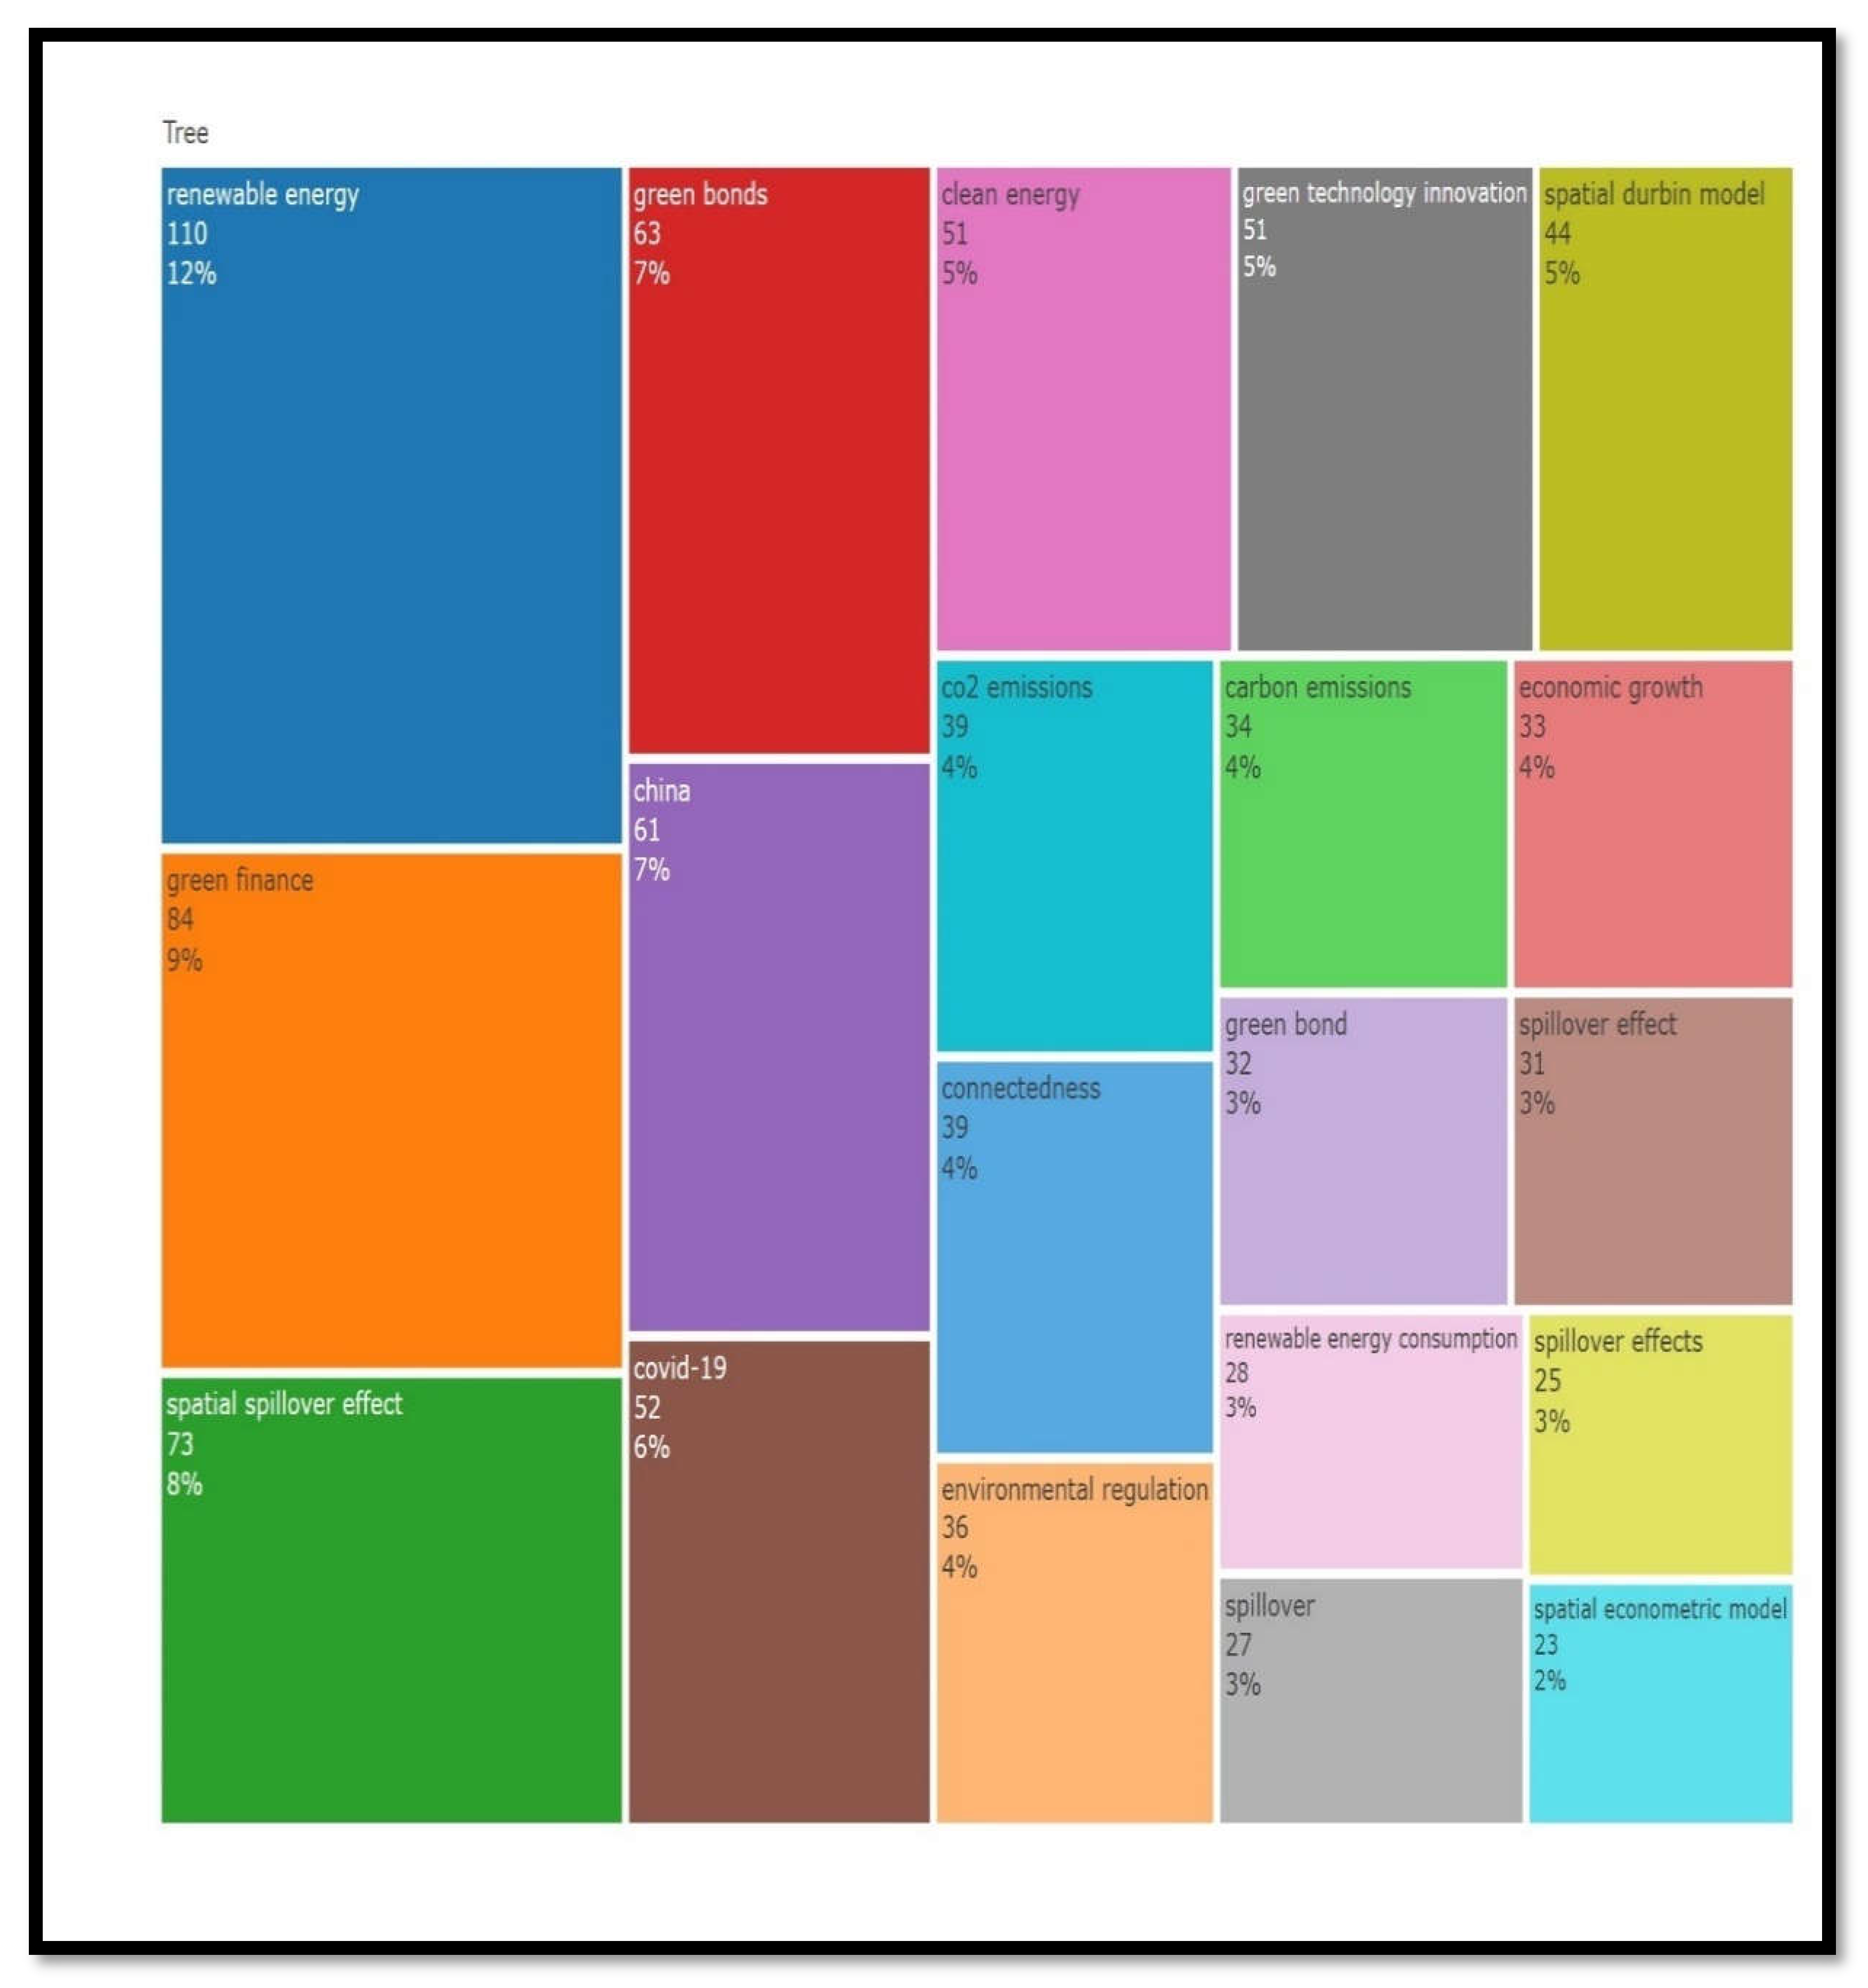
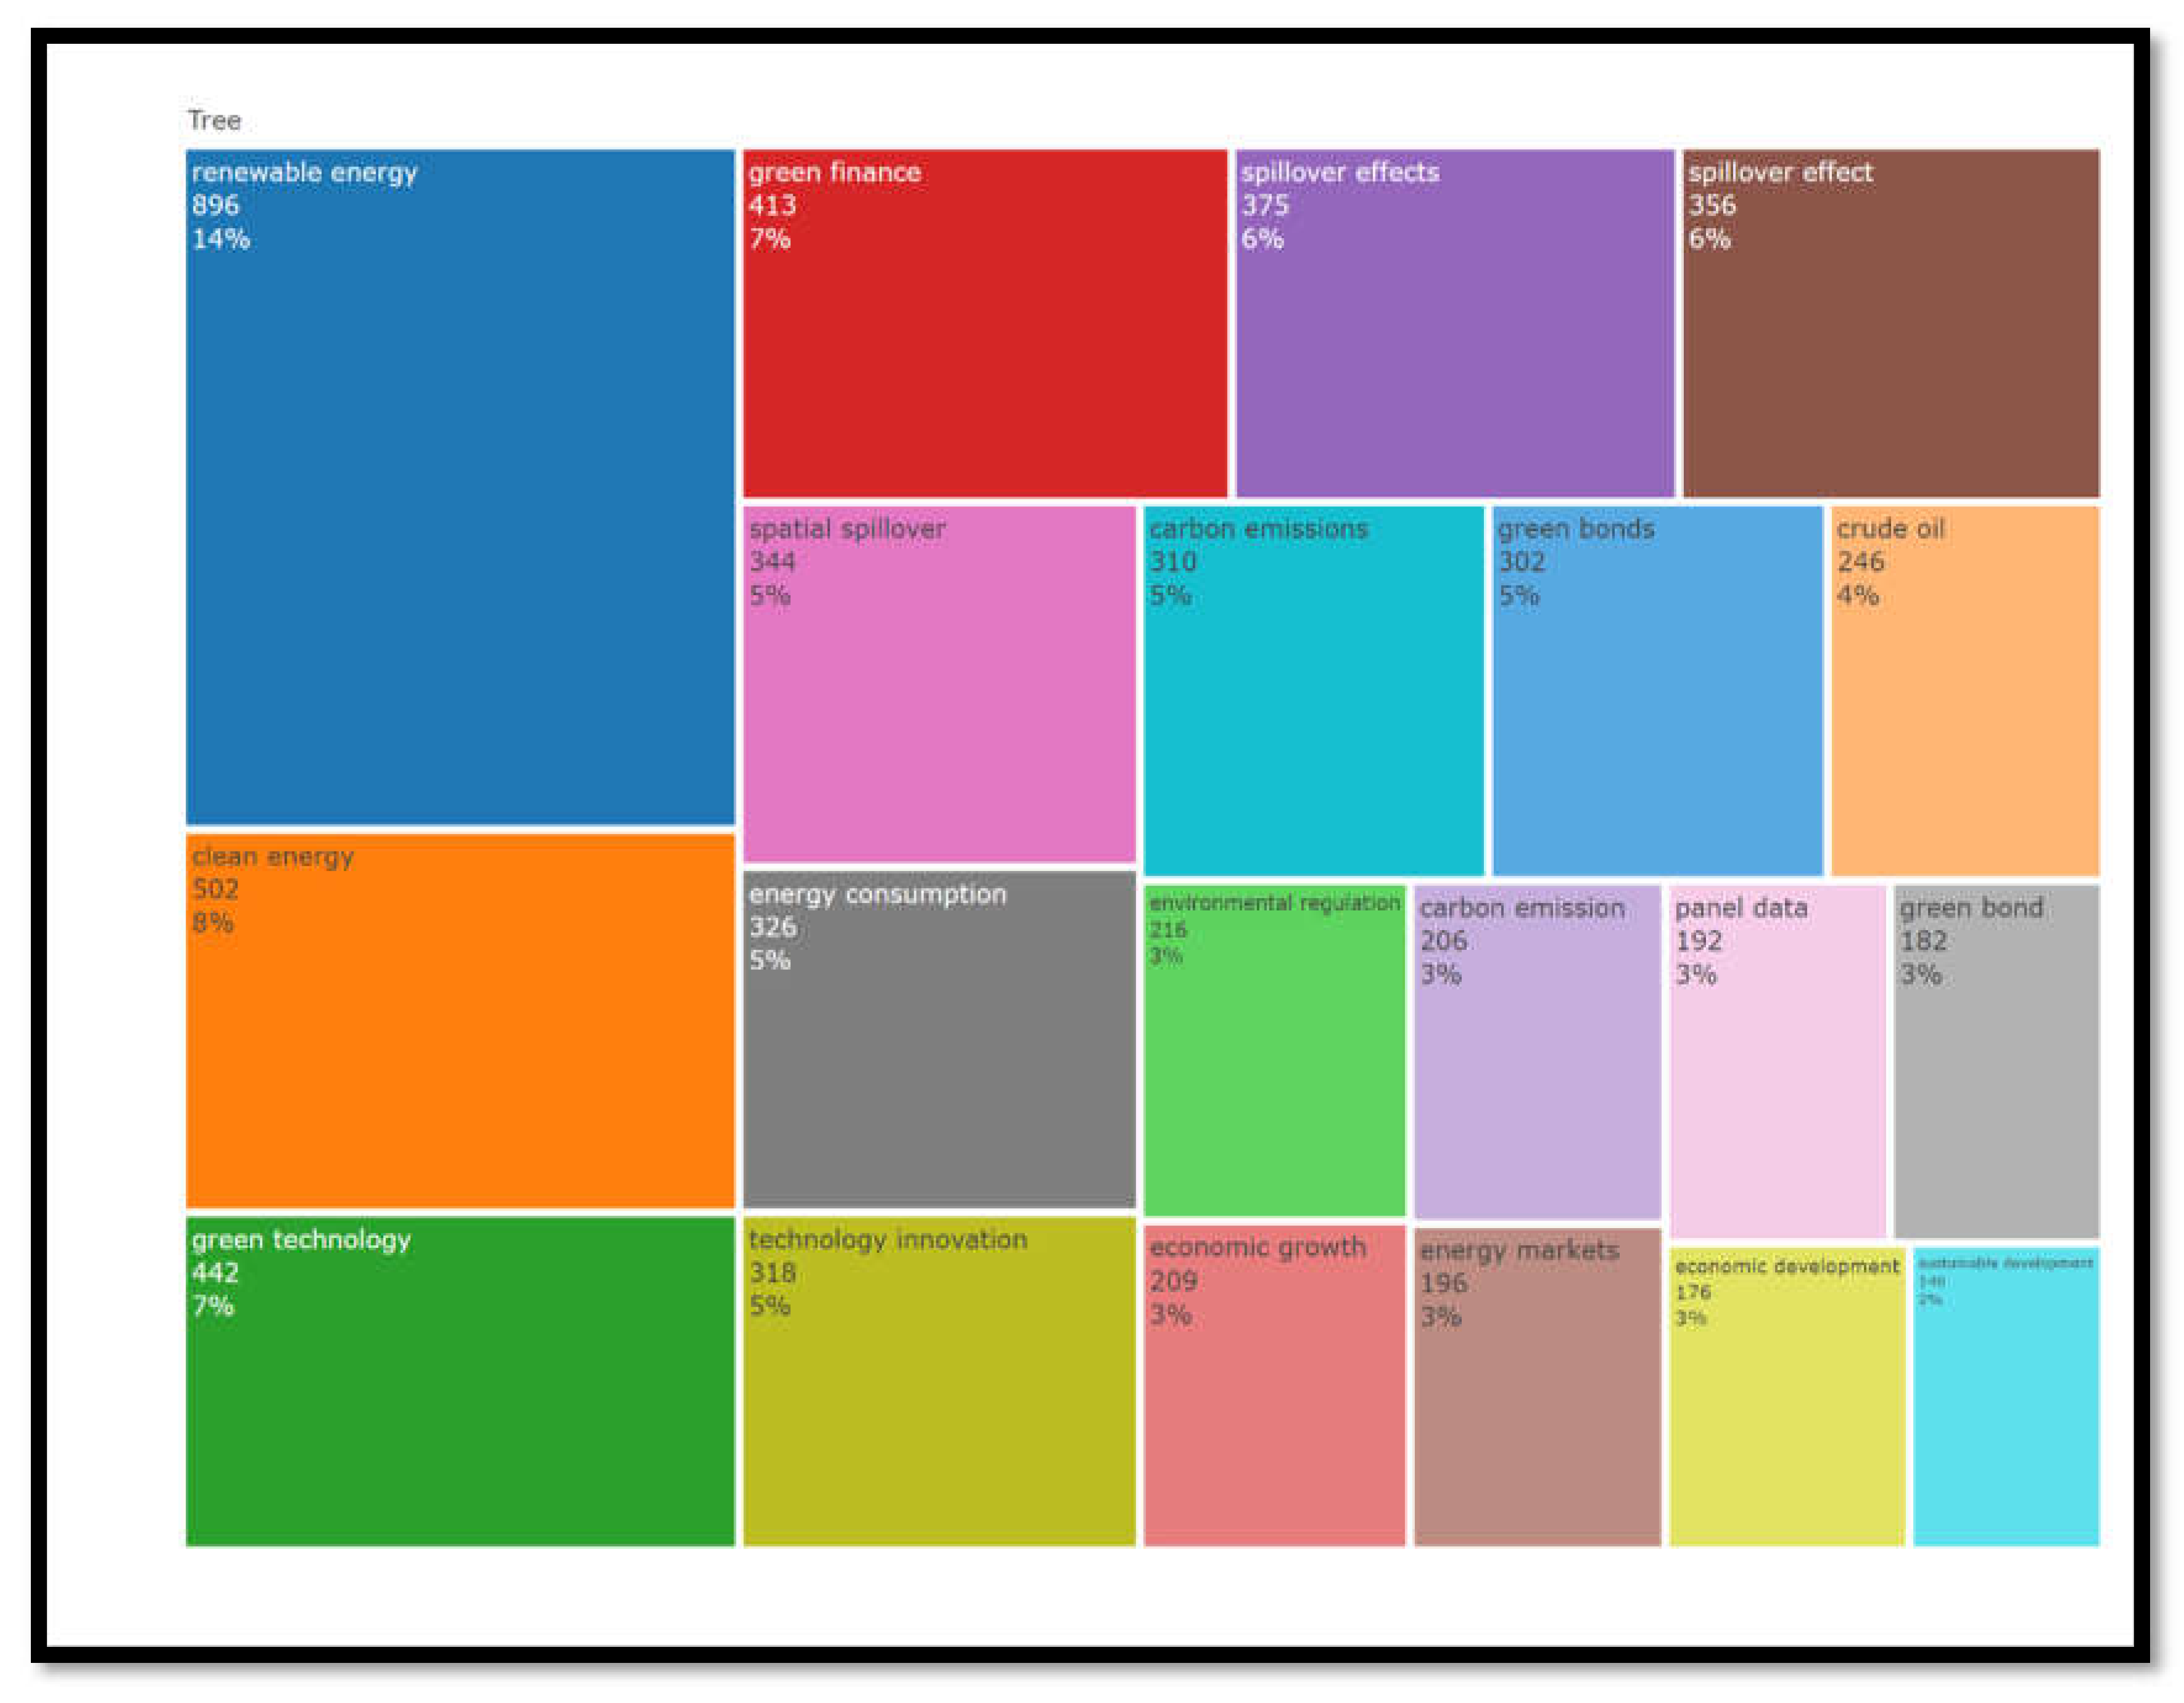
Preprints 150769 g019
Figure 20. Tree Map of Author Keywords.
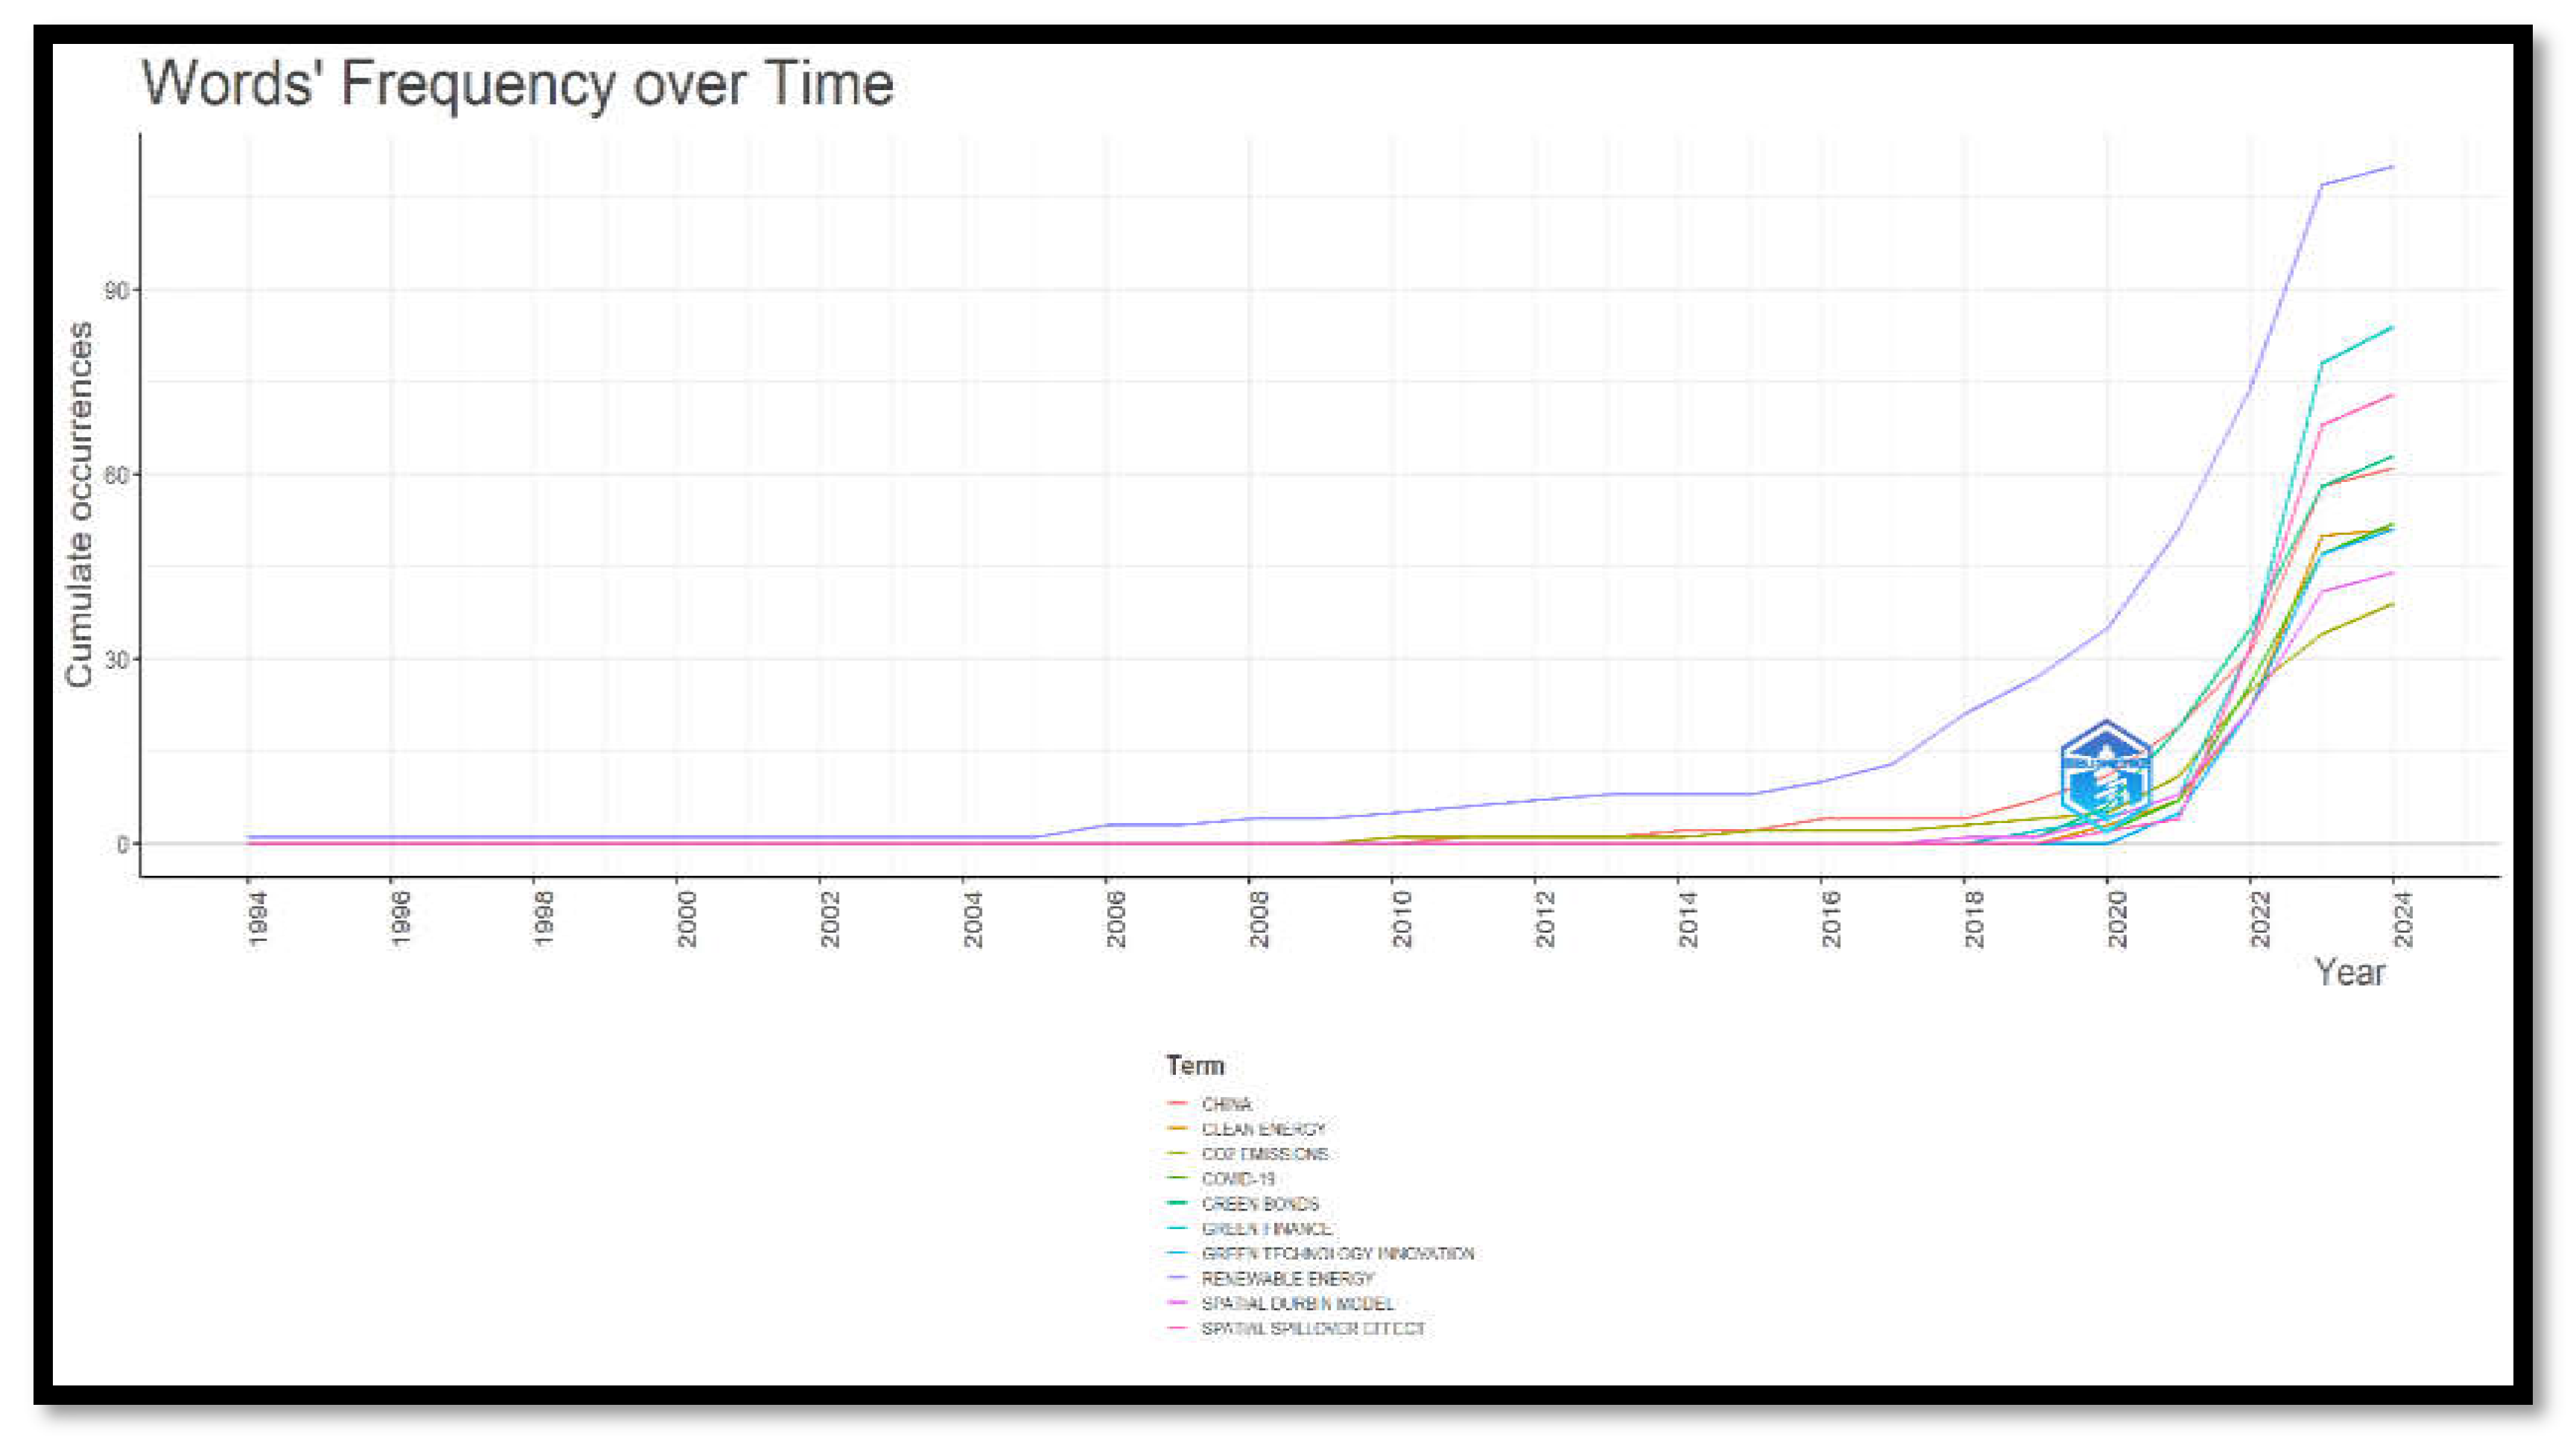
Preprints 150769 g020
Figure 21. Words’ Frequency over Time-author keywords.
Preprints 150769 g021
Figure 22. Trend Topics.
Preprints 150769 g022
Figure 23. Word Cloud-Abstract.
Preprints 150769 g023
Figure 24. Tree Map of Words-Abstract.
Preprints 150769 g024

3.9. Co-Citation Analysis

Co-citation analysis is a technique employed to assess the intellectual framework and similarity among authors’ works. The emphasis is exclusively on the number of citations, disregarding the substance of the citations themselves. Clusters form when authors with similar citation patterns reference one another. The clustering of two authors suggests the utilization of similar references by both parties. 
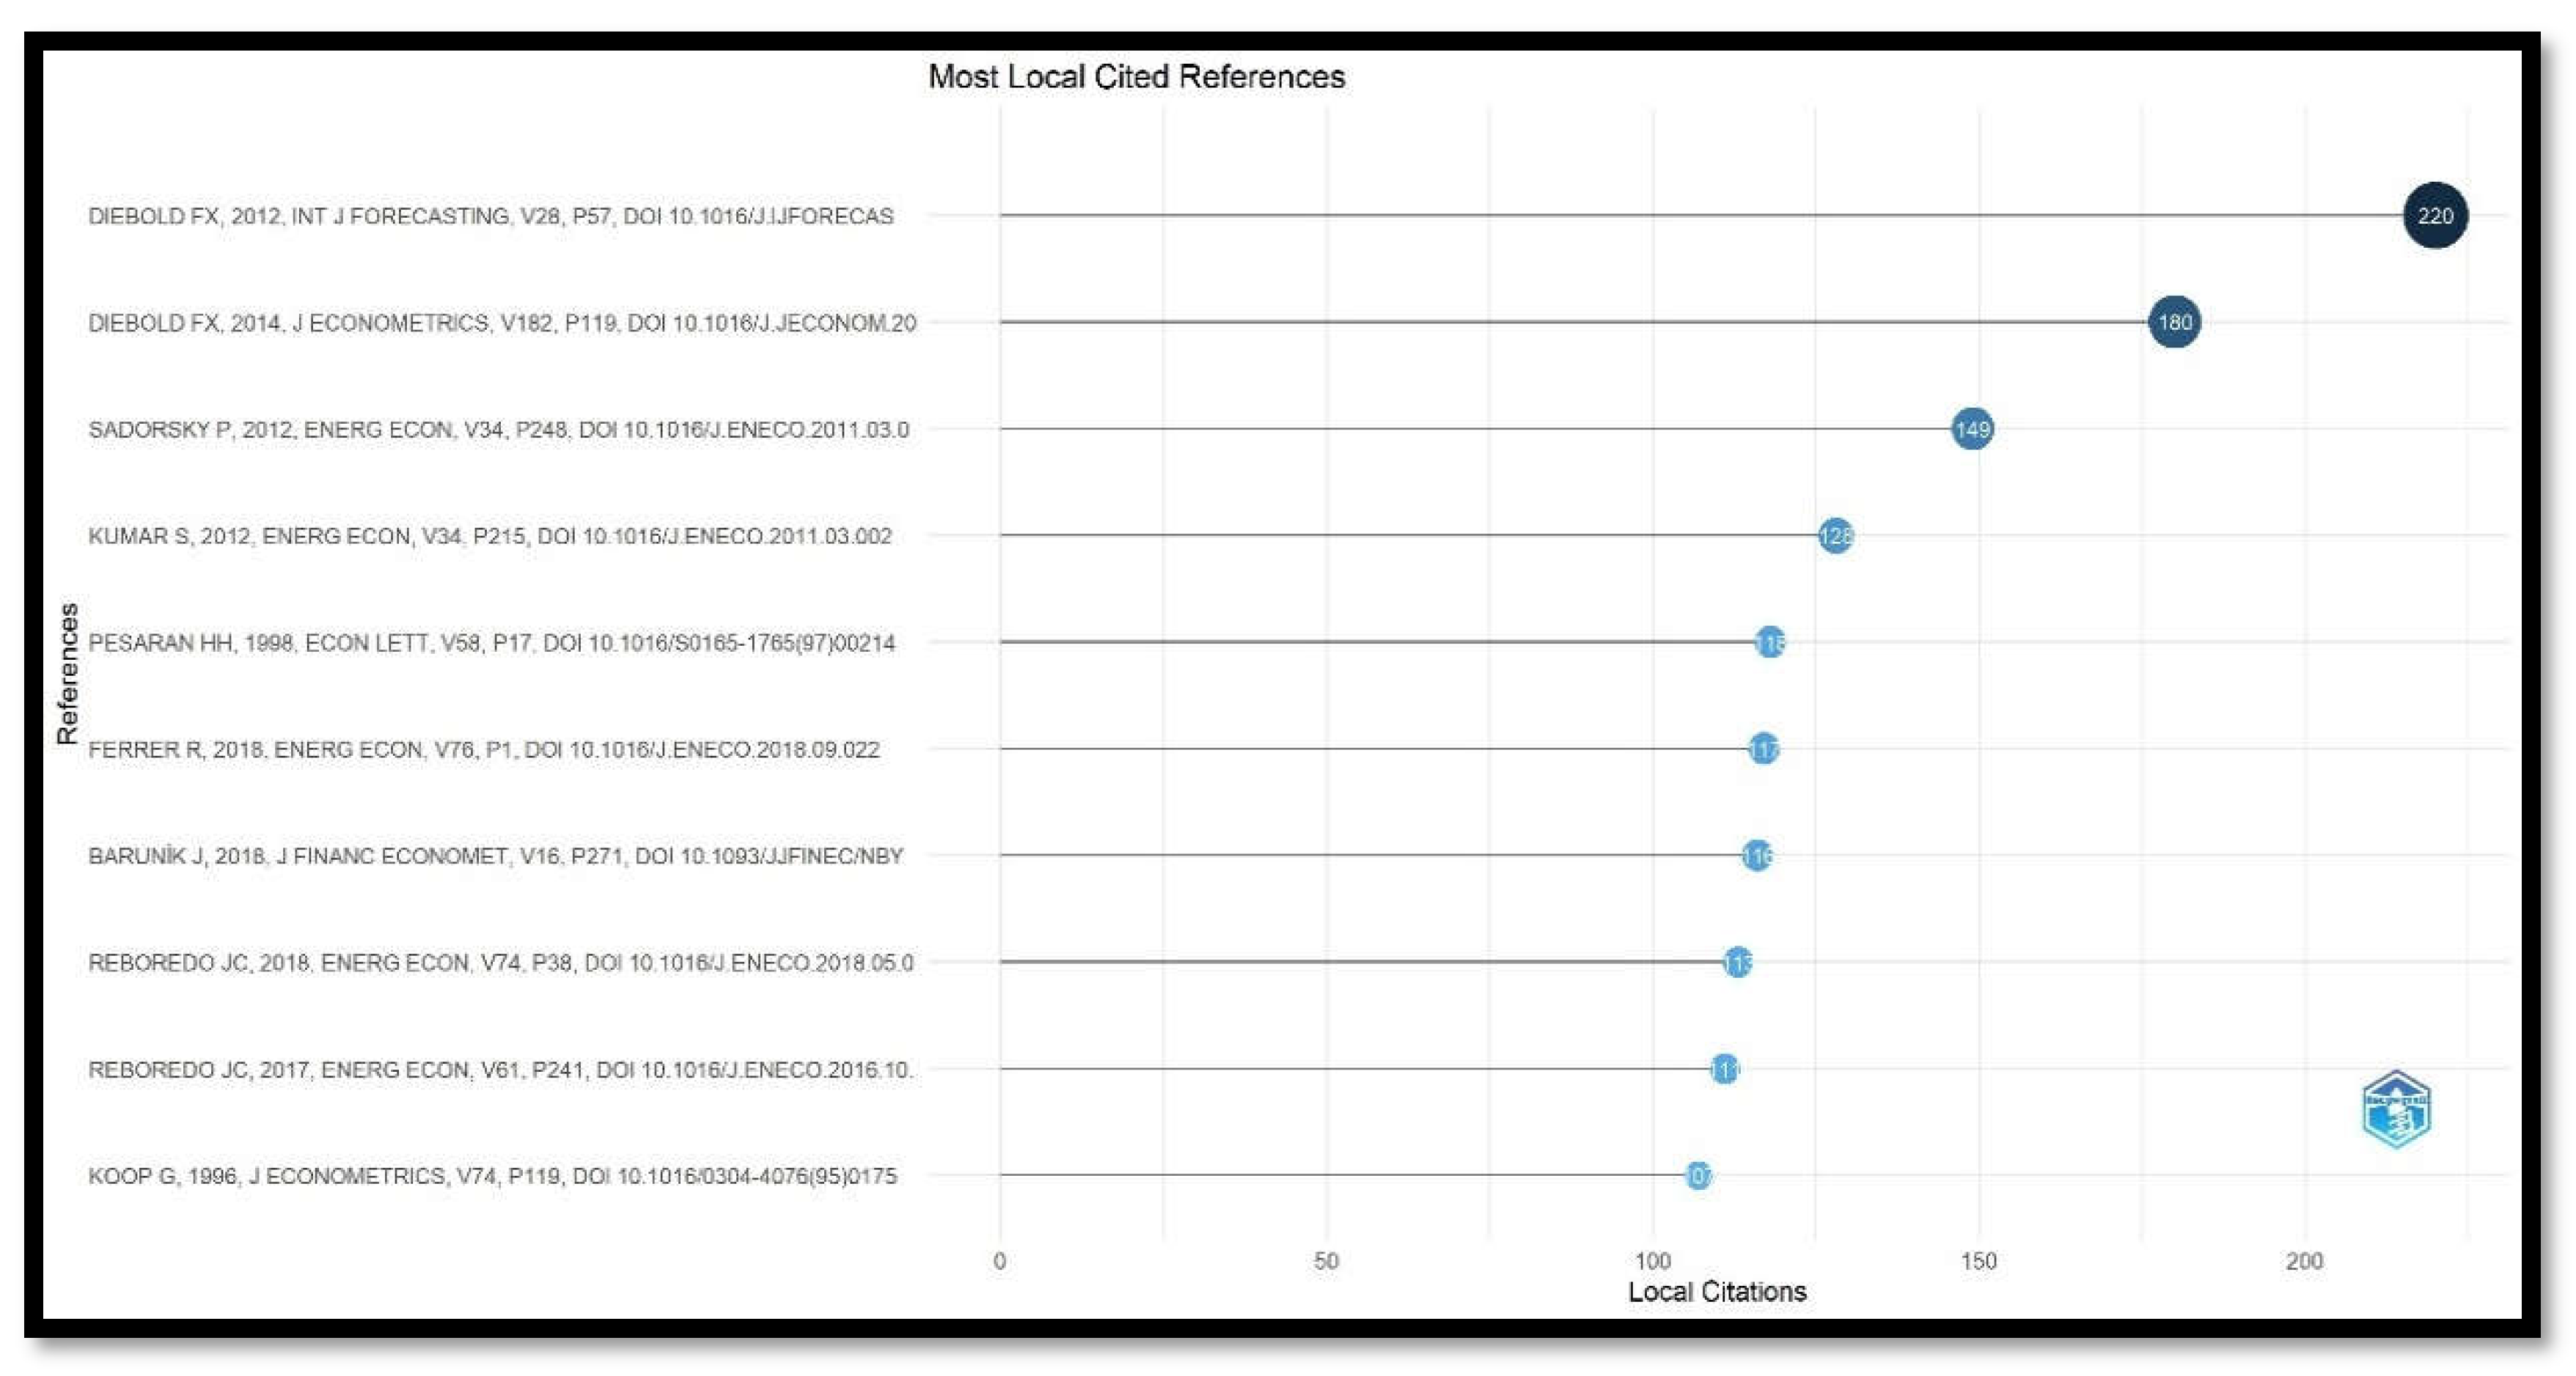
Figure 25 illustrates a co-citation map analysis, wherein the criterion for inclusion is that an author must possess at least 50 citations. Among 3540 writers, only 137 authors satisfy this criterion, categorized into three distinct clusters. Cluster one (red) comprises 60 authors. Cluster two contains 39 items, whereas cluster three comprises 38 items. The clusters represent the magnitude of the domain’s intensity and the concentration of its density. The authors reference the same work.
The red-colored Cluster 1, which is the most extensive cluster on the map, represents publications related to green investment. Green financial investment research has largely concentrated on socially responsible investment, according to the keyword map. Portfolio selection, risk and return, investor behavior, and institutional attitude are the main areas of focus in the study. This cluster has been significantly advanced by Leys et al. (2009), Palacio and García (2017), and Rossi et al. (2019), who are the principal authors. These writers have the highest level of connectivity inside the cluster and possess strong links in the network.
Cluster 2, green color, is dedicated to addressing inquiries on the appropriateness of financial instruments and their analysis. This cluster has conducted research on issues pertaining to green banking, green bonds, and Sukuk. Alonso-Conde and Rojo-Suarez (2020), Ngwenya and Simatele (2020), and Tuhkanen and Vulturius (2020) investigated various aspects of green banking and bonds in relation to sustainability... The writers exhibit a strong link within their cluster but have limited connections outside of it.
Cluster 3: blue shade Researchers (Cadman, 2014; Jakob et al., 2016; Zhu et al., 2013) have investigated the importance of carbon and climate finance. These studies focus on climate policy, modeling, and their impact on the long-term sustainability of the environment. Clearly, this cluster is currently expanding and lacks significant connections both internally and externally. The research on climate and carbon finance is still in its early stages, focusing on a crucial part of sustainability.

3.10. Bibliographic Coupling Analysis

The bibliographically coupled map of sources is displayed in Figure 26. Bibliographic coupling is an exhaustive method of evaluating the degree of commonality between the sources. Bibliographic coupling is the phenomenon where two researchers cite the same third study and make references in their bibliographies. Two documents are bibliographically coupled if they share references with one another (Garfield, 2004). According to Moral-Muñoz et al. (2020), VOSviewer is a valuable tool for producing bibliographic maps that aid in identifying cohesions across documents that reference the same work. The criteria for including sources in the map are a minimum of five documents and at least twenty citations per source. Figure 26 presents a map comprising 46 items organized into five clusters. Cluster 1 (red) comprises 14 sources, Cluster 2 (green) includes 13 sources, Cluster 3 (blue) contains 11 sources, Cluster 4 (yellow) aggregates six sources, and Cluster 5 (purple) consists of two sources. From the map, it is evident that Environmental Science and Pollution Research, Energy Economics, Sustainability, Journal of Cleaner Productions, and Renewable Energy are the prominent sources and are coupled strongly. The map results align with the findings presented in Table 3.

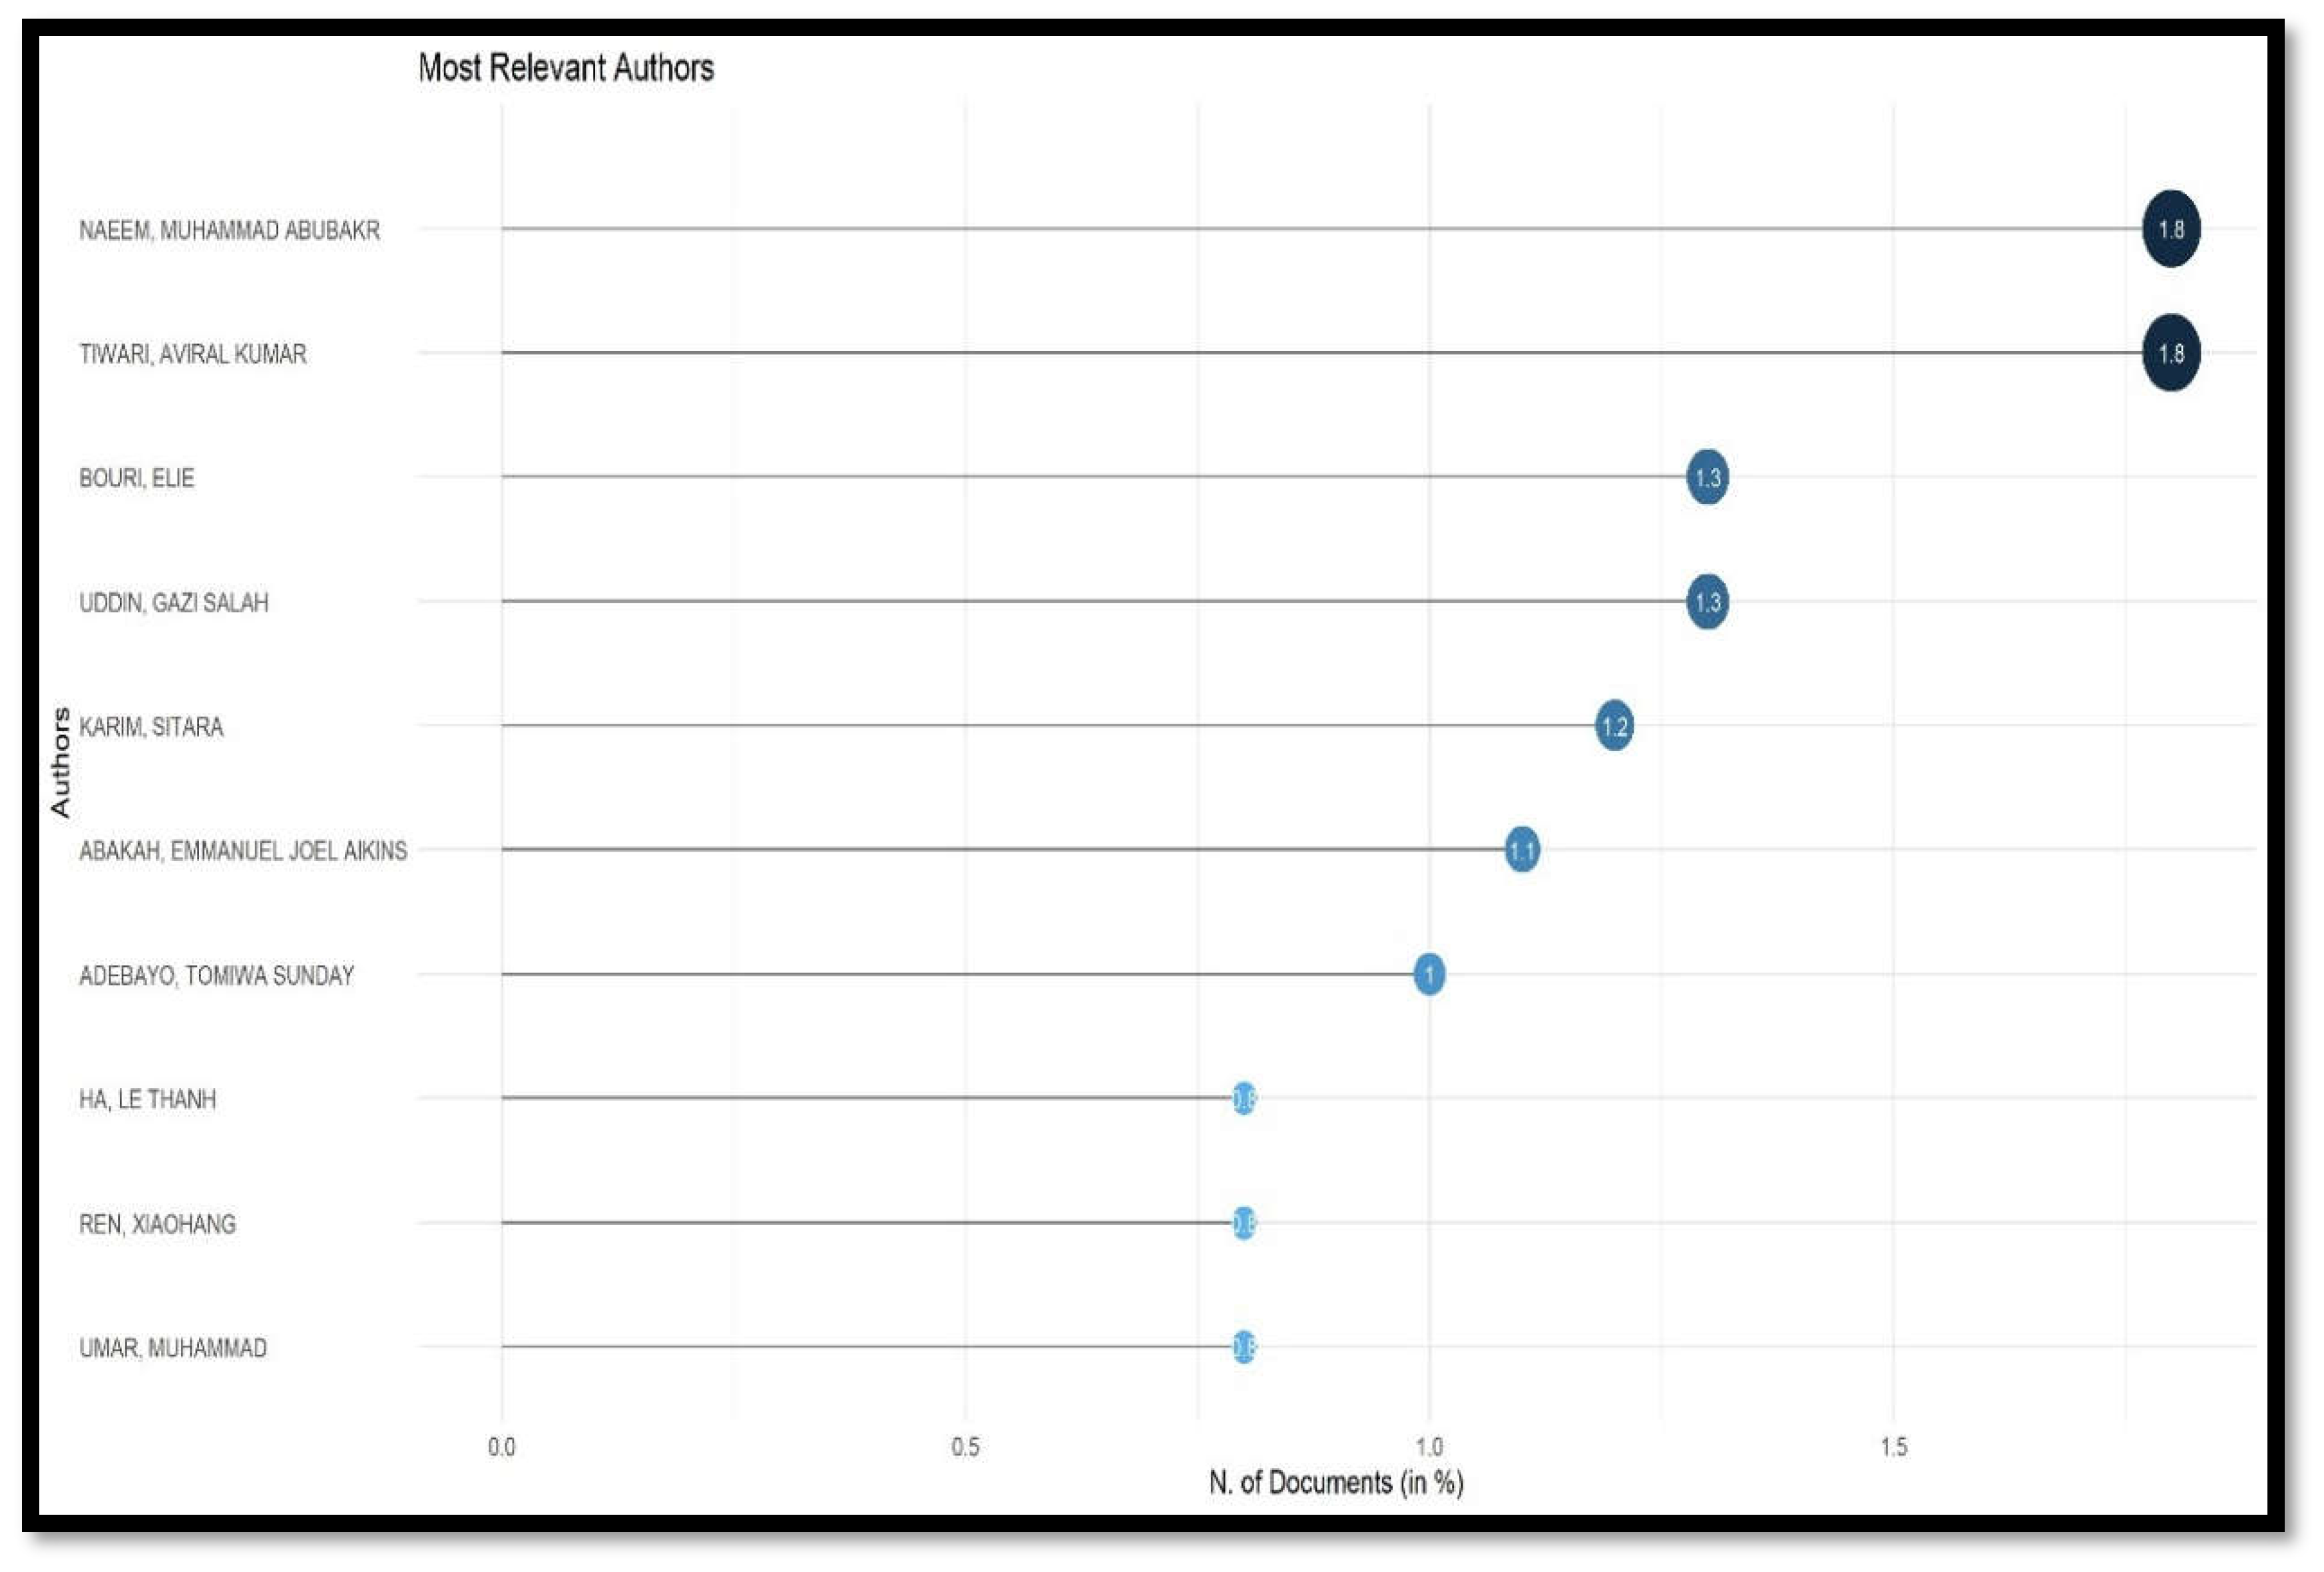
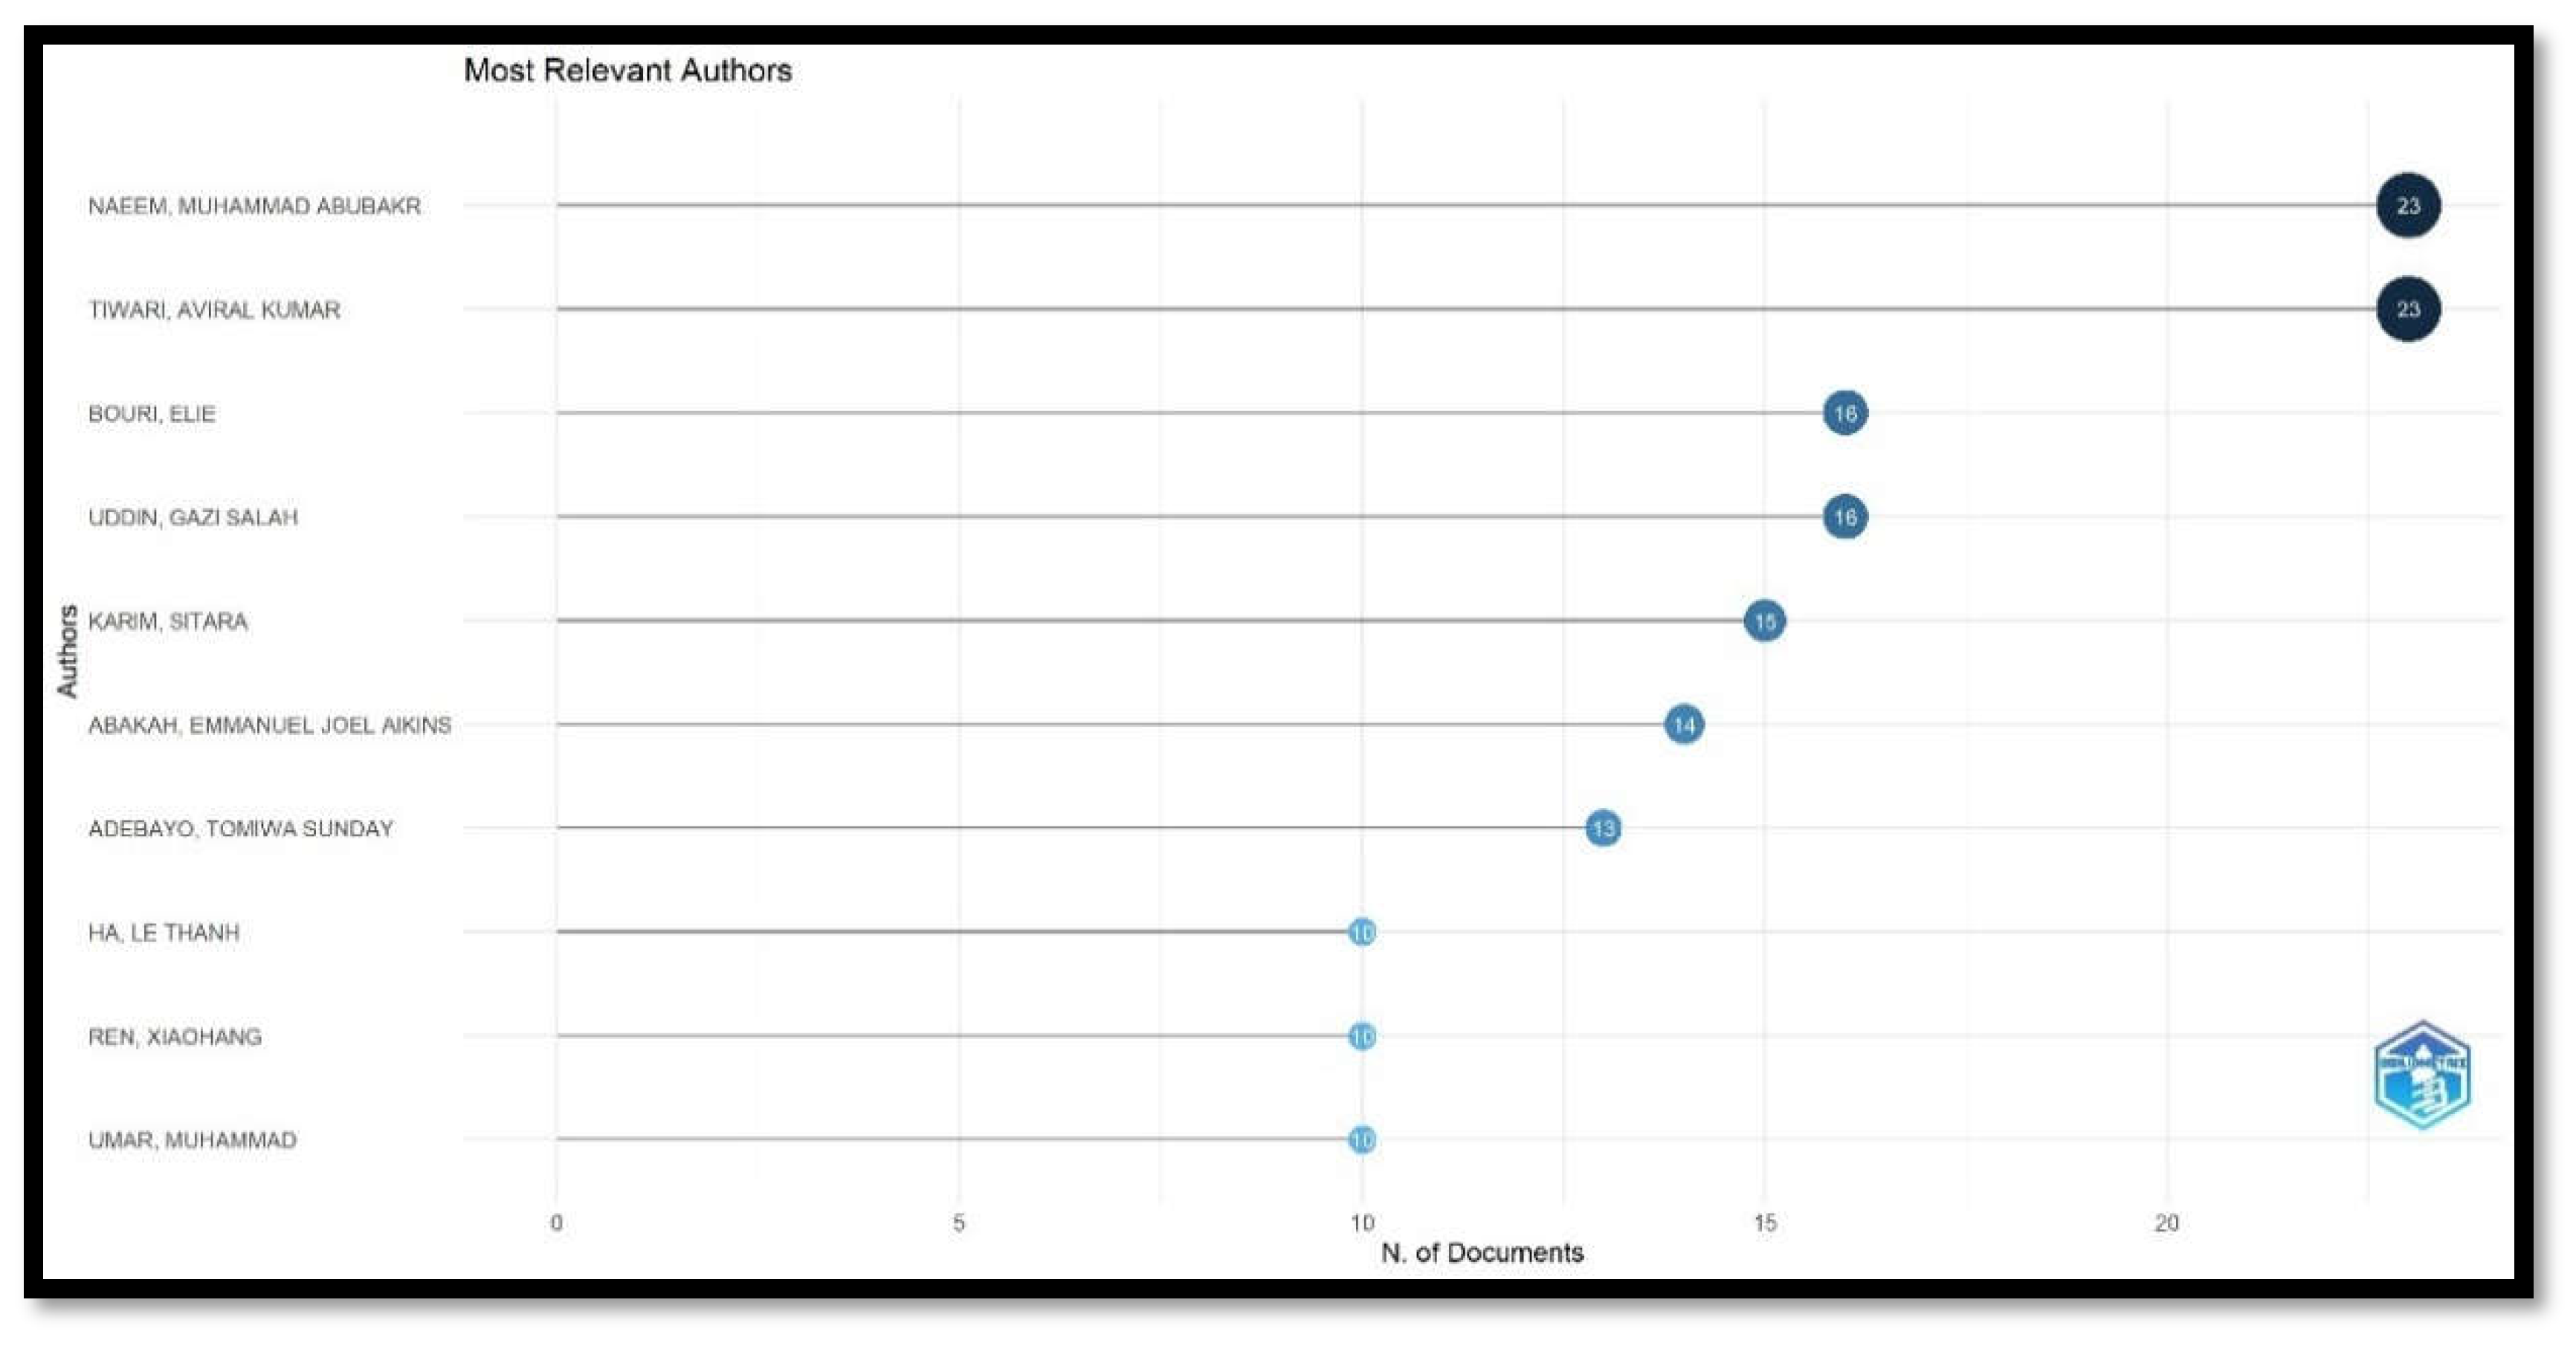
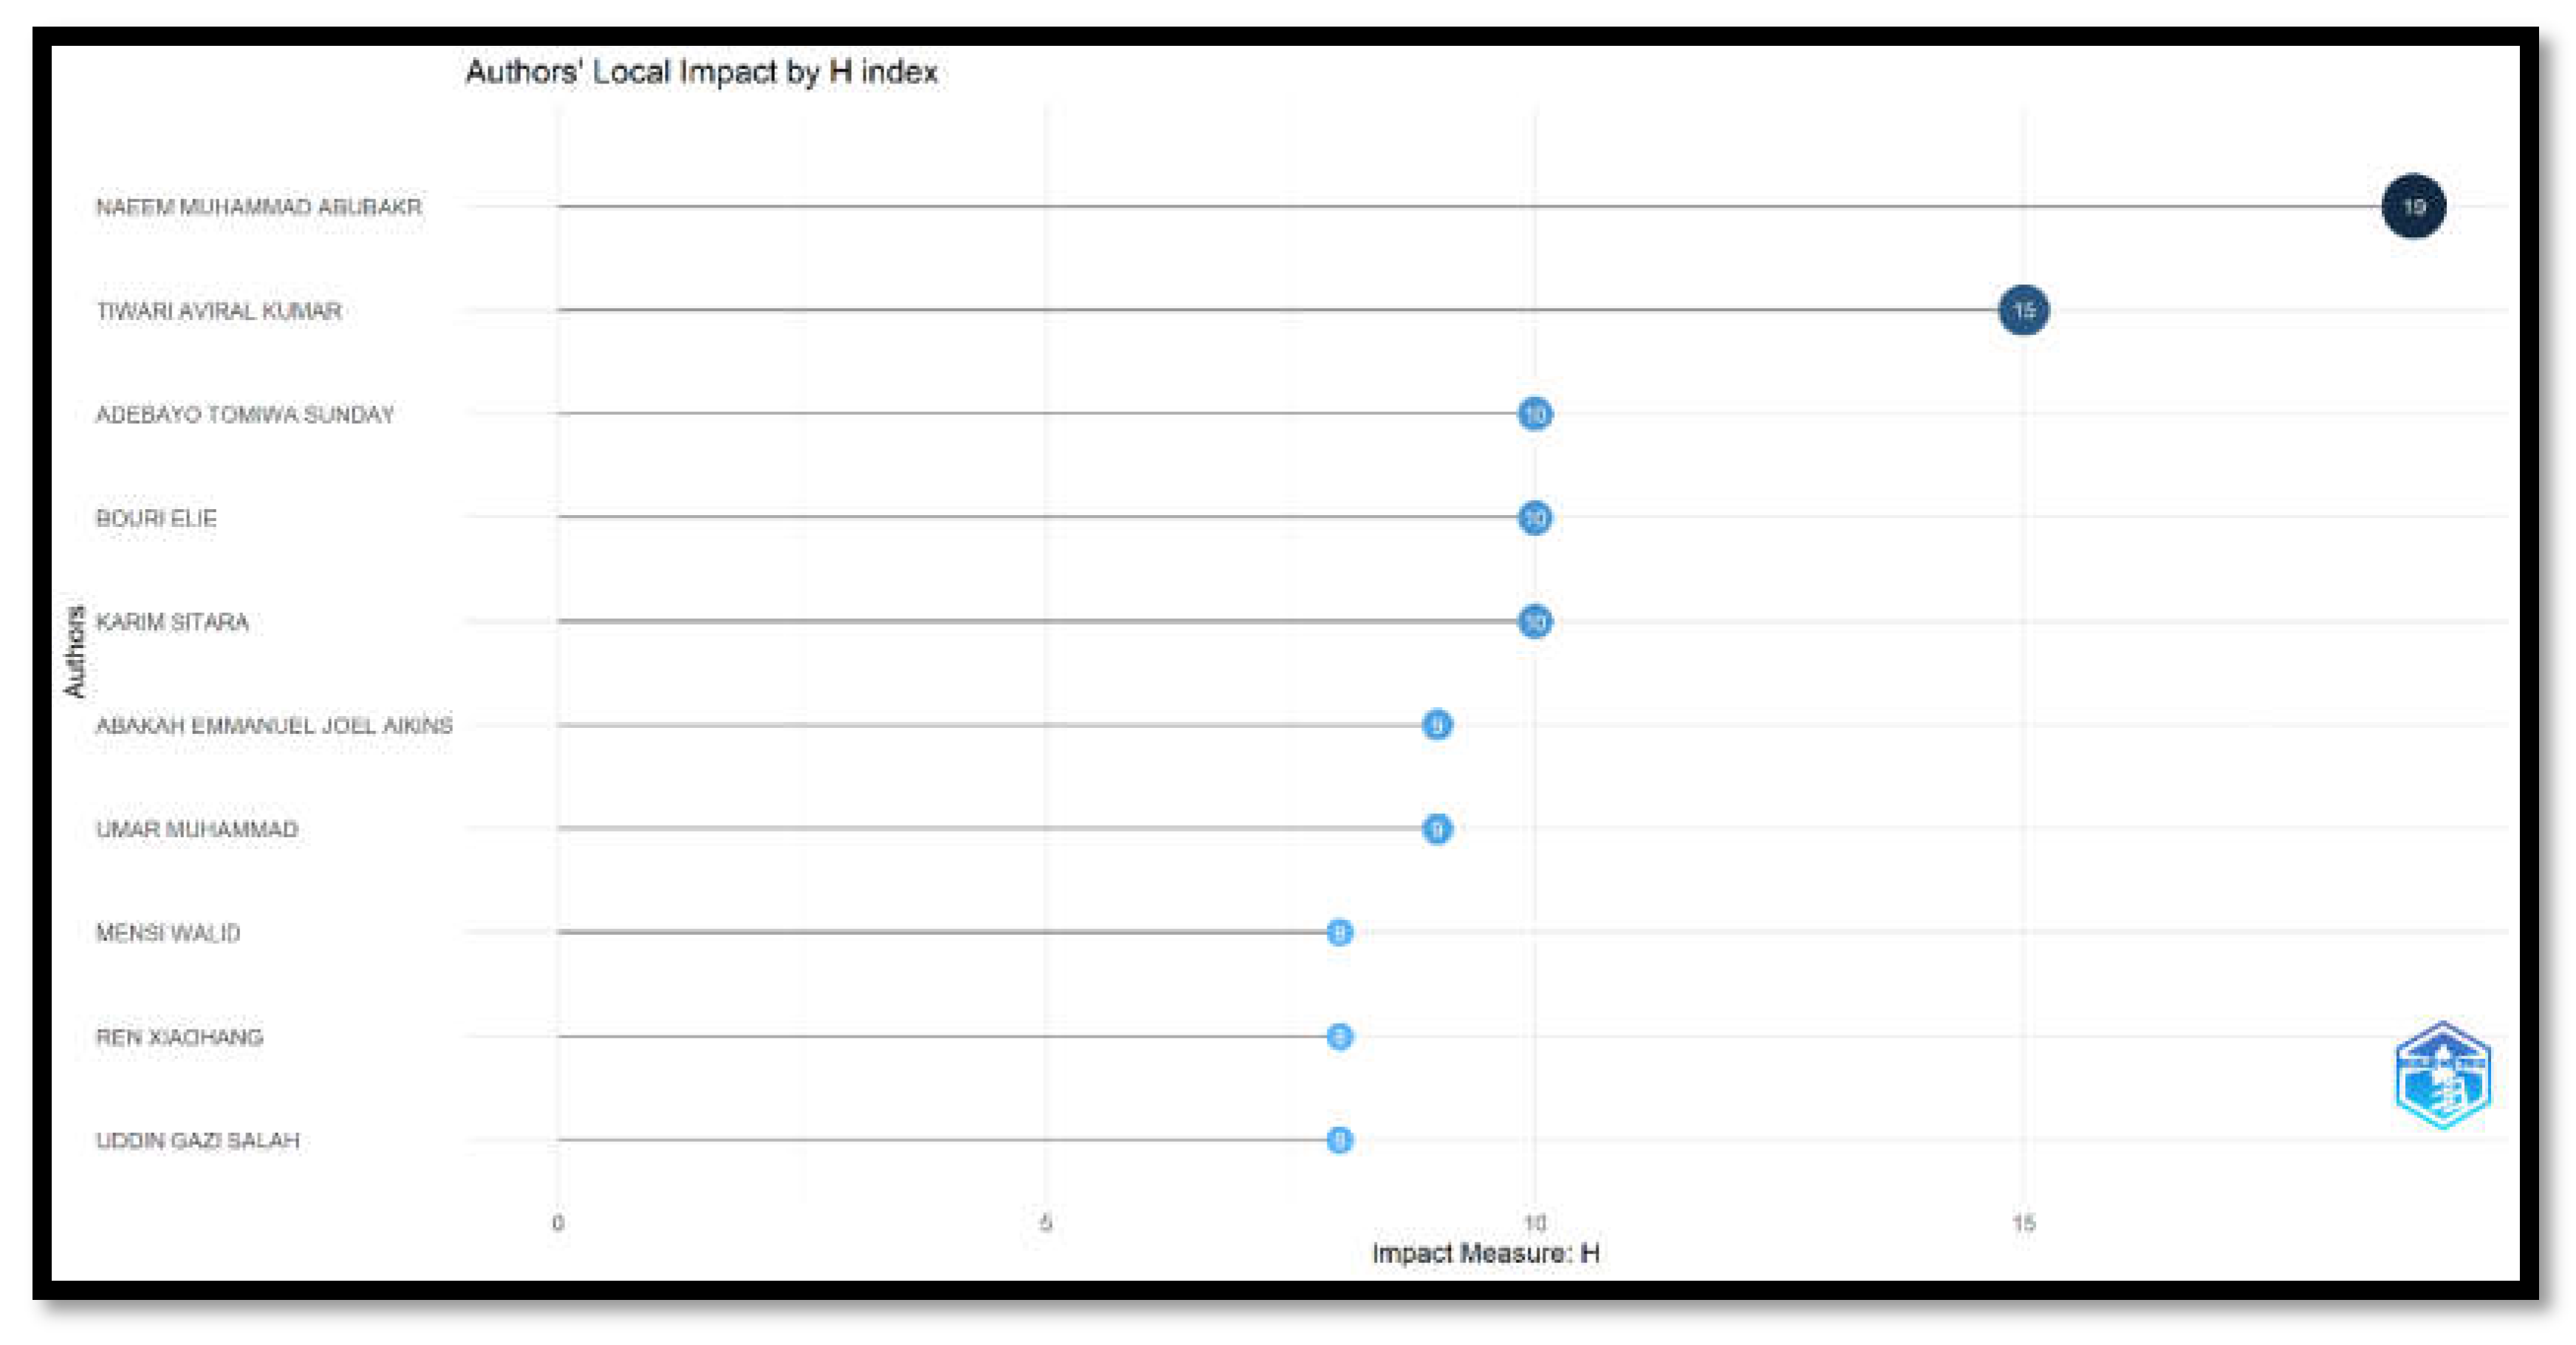
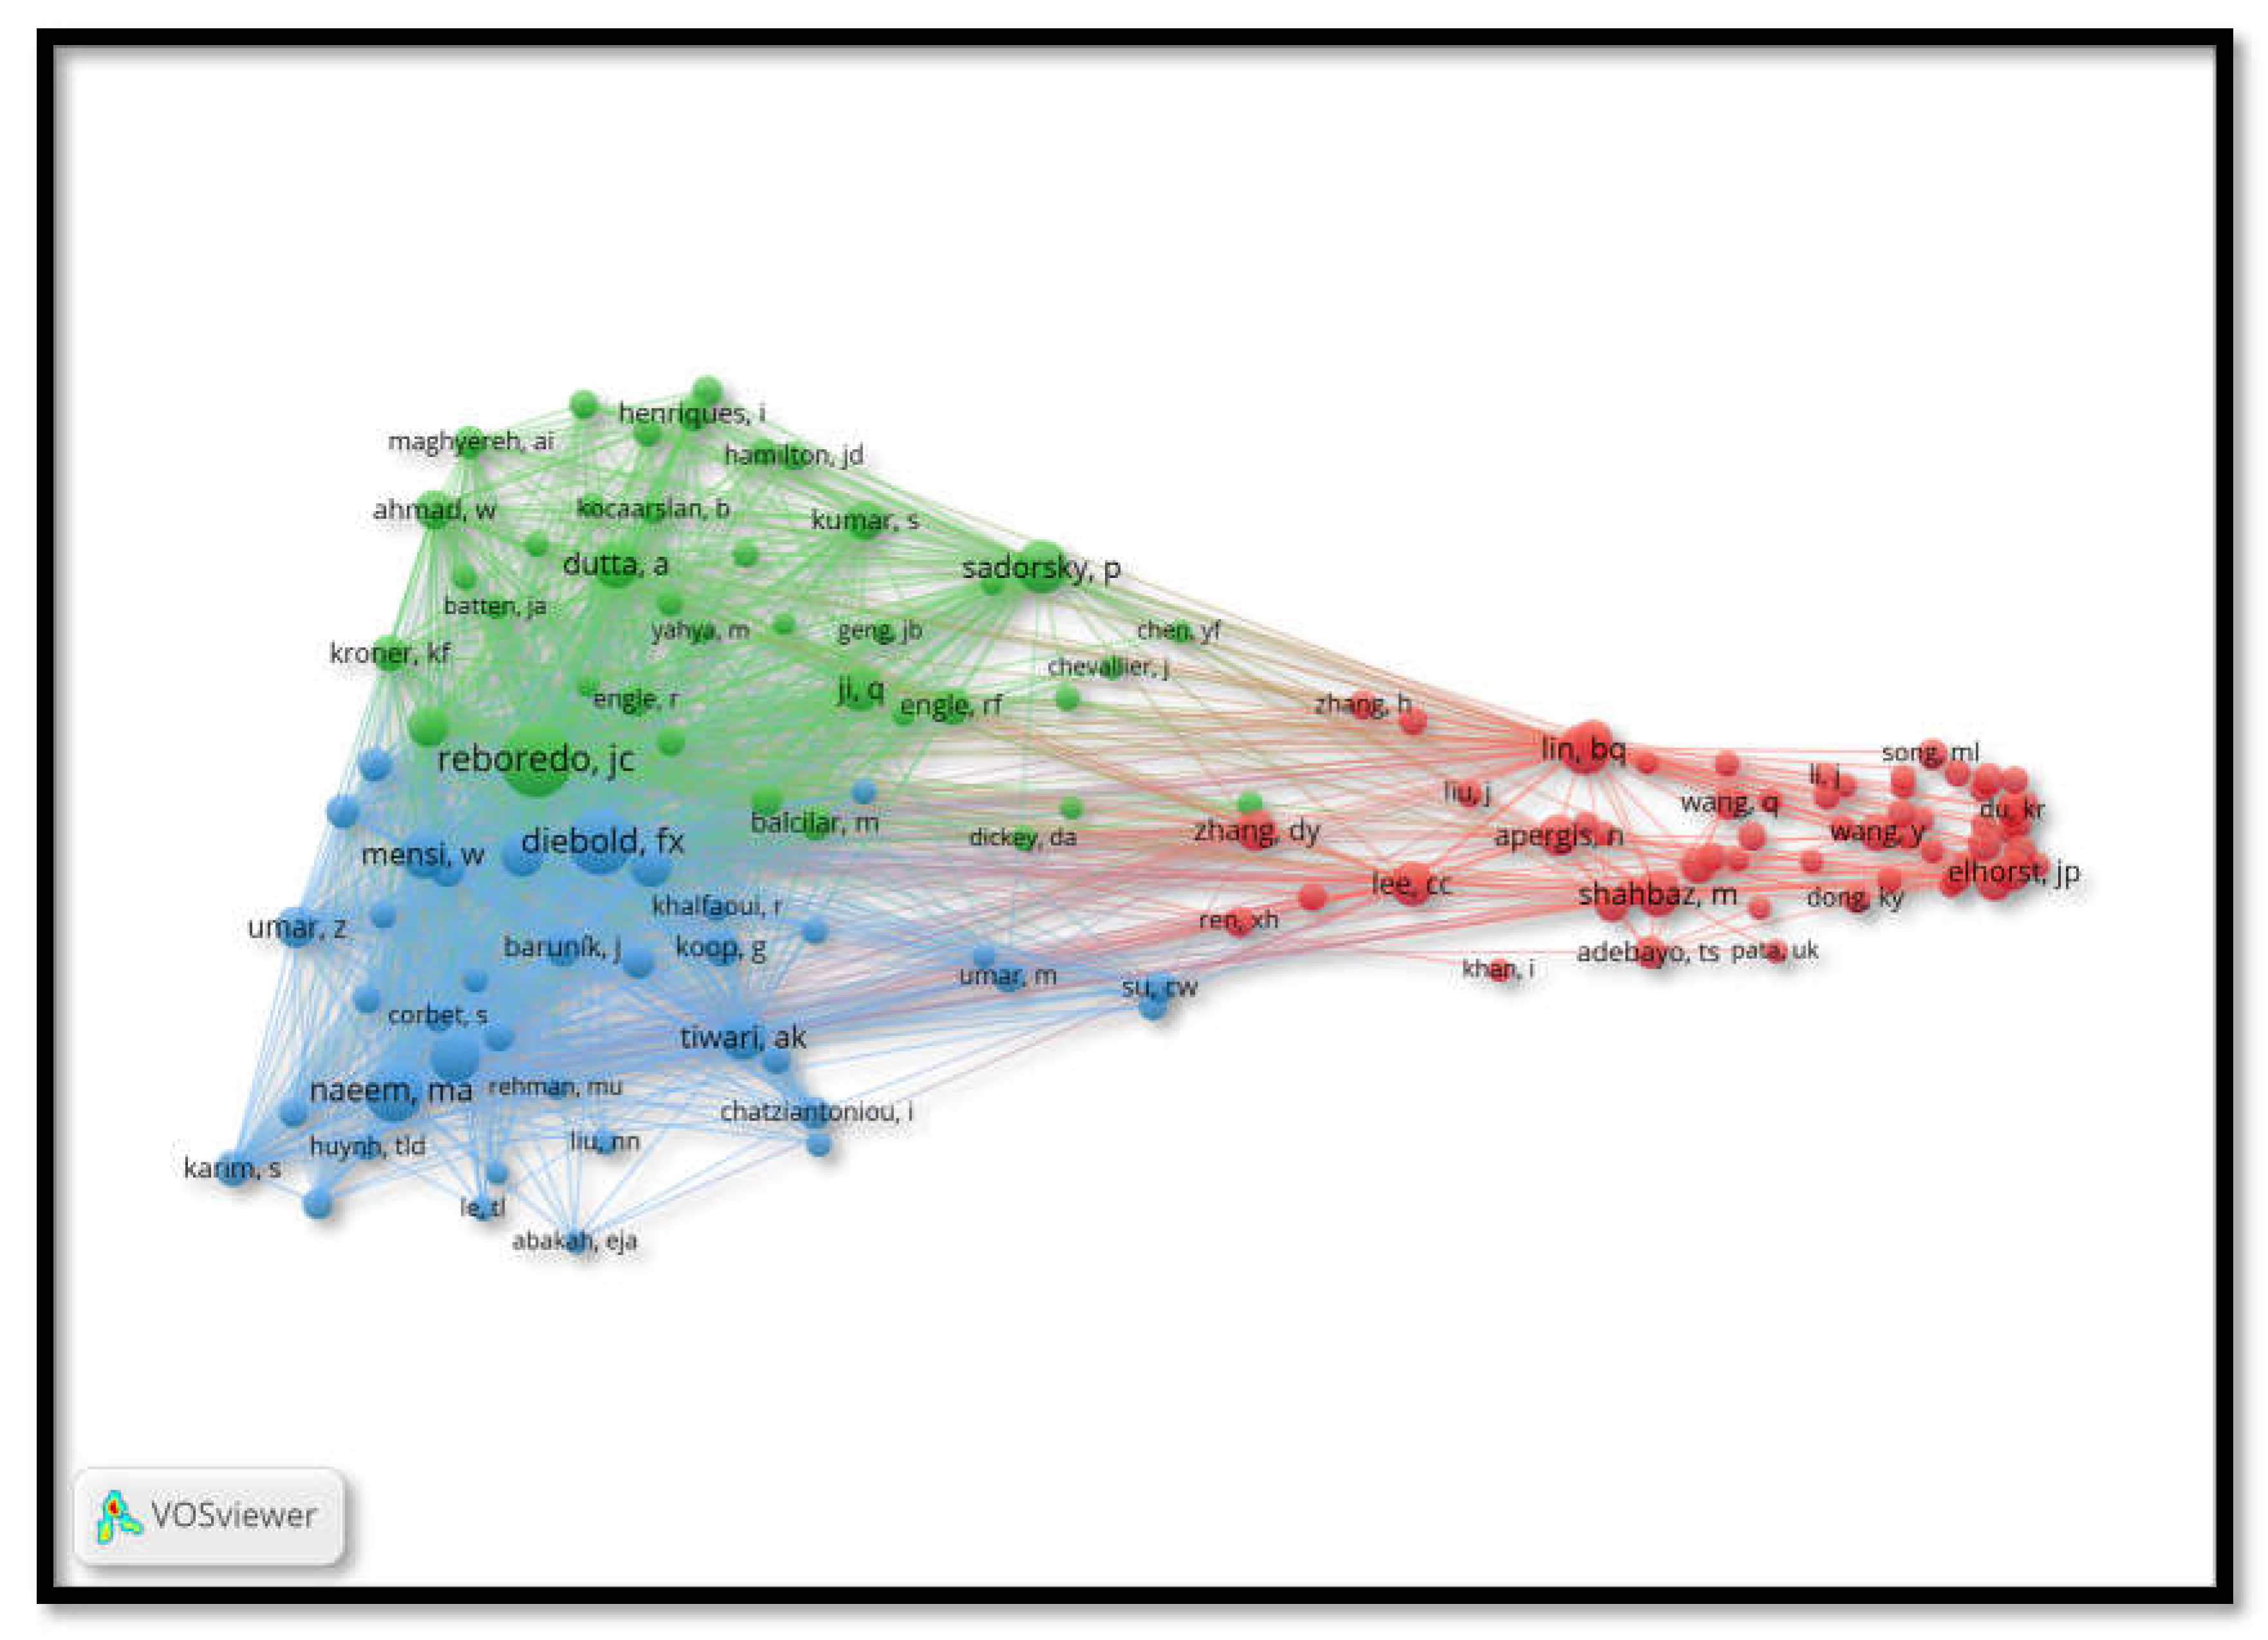
3.11. Collaboration Network Analysis

The collaboration network in sustainable finance, as represented by these ten clusters shown in Table 8 and Figure 28, highlights the diversity and complexity of research in this field. From foundational scholars in Cluster 1 to interdisciplinary bridge-builders in Cluster 2, and innovative fintech researchers in Cluster 10, each cluster contributes uniquely to the development of sustainable finance. Understanding the roles of key authors in these clusters helps identify the interdisciplinary nature of the field, the importance of regional and global contributions, and the emerging trends in sustainable finance research. As these clusters continue to evolve, they will drive both academic growth and policy advancements in addressing global sustainability challenges.
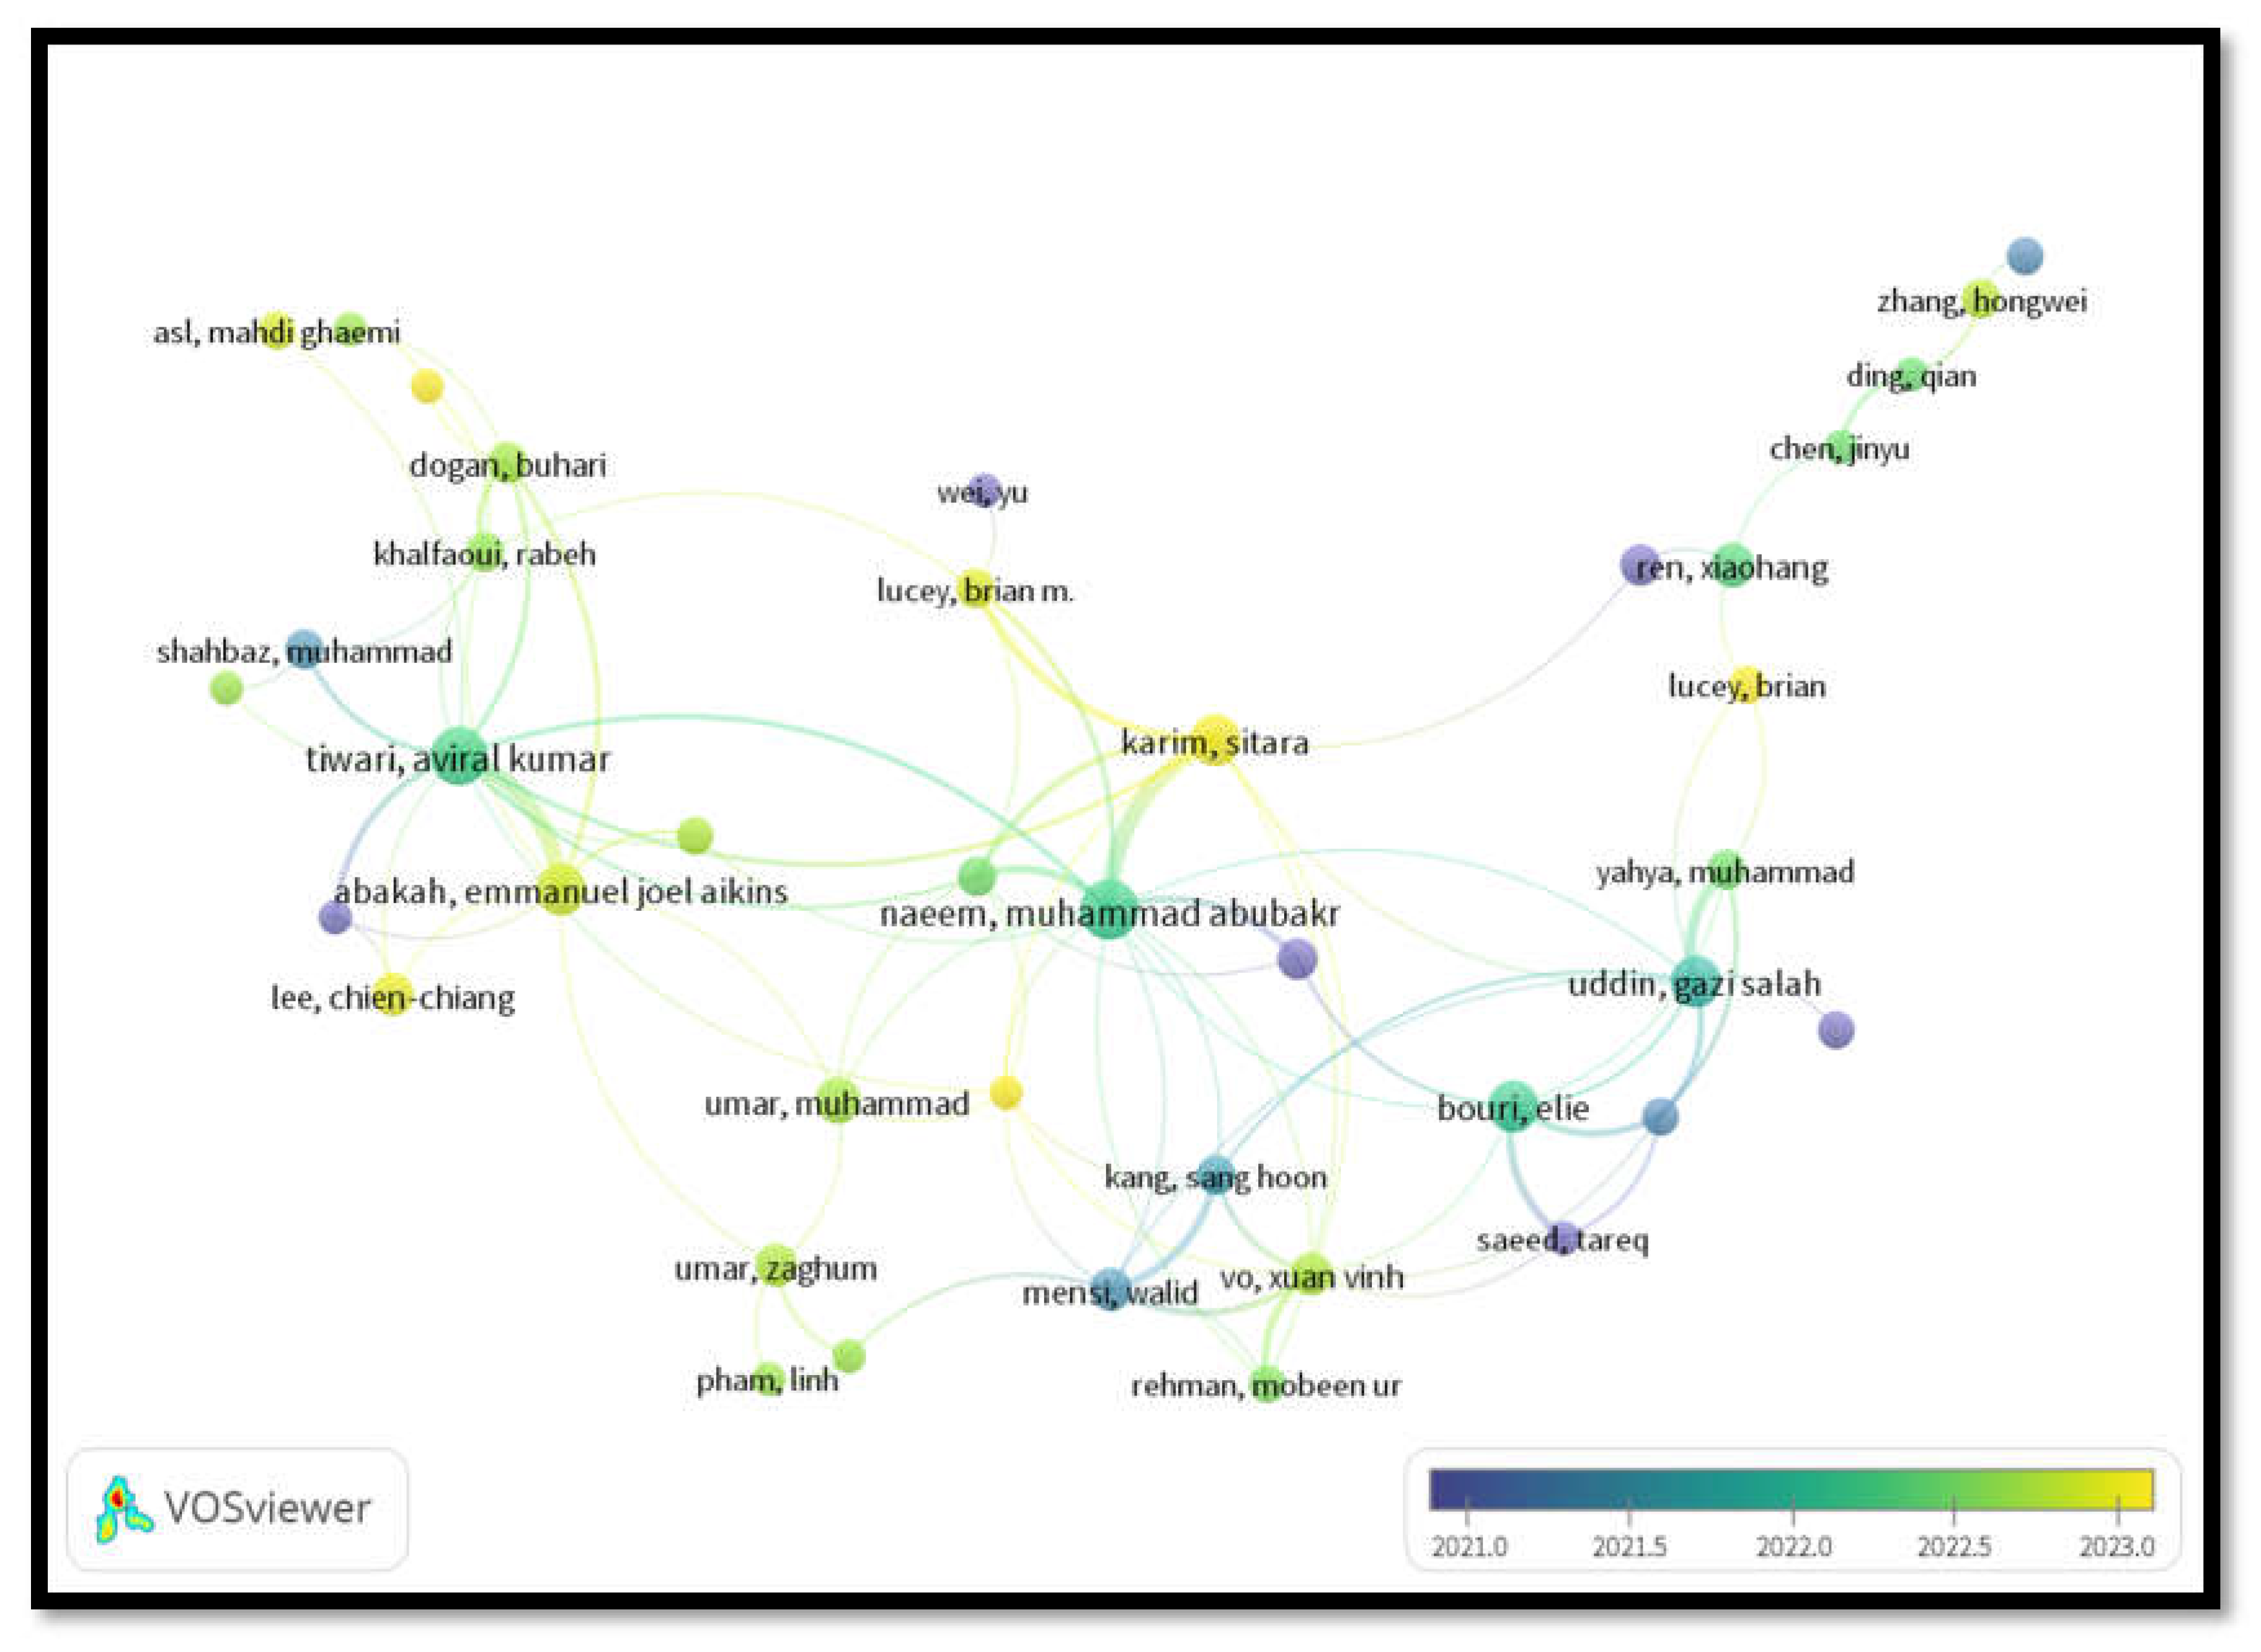
Cluster 1: Foundational Researchers and High Internal Collaboration
Key Authors: Juan C. Reboredo, Andrea Ugolini
Cluster 1 consists of foundational authors who have a high degree of internal collaboration within their research community. The low betweenness scores of authors like Juan C. Reboredo and Andrea Ugolini indicate that they are not key intermediaries between other clusters, but are central within their own group. These authors contribute to focused research topics in sustainable finance, collaborating extensively within their specialized areas. They likely work on specific issues such as climate finance or green bonds, maintaining close-knit relationships with other members of the cluster.
Cluster 2: Bridge-Building Authors with Cross-Cluster Influence
Key Authors: Xiaohang Ren, Farhad Taghizadeh-Hesary, lucey, brian
Cluster 2 includes authors with high betweenness scores, such as Xiaohang Ren and Farhad Taghizadeh-Hesary, indicating that they serve as bridge-builders between different research areas. These authors play a critical role in connecting various subfields of sustainable finance, such as green finance, renewable energy, and climate risk management. Their ability to collaborate across clusters makes them central to fostering interdisciplinary research and facilitating the flow of ideas between distinct research domains.
Cluster 3: Emerging Scholars and Specialized Research Areas
Key Authors: Bouri elie, Uddin gazi salah, Yahya Muhammad, Dutta Anupam, Ji, qiang, Saeed, tareq
Cluster 3 represents emerging scholars who focus on specialized or niche areas within sustainable finance. These authors might be early-career researchers contributing to innovative subfields such as impact investing, green fintech, or socially responsible investing. While their betweenness scores are moderate, indicating they are still establishing themselves as intermediaries, they bring new perspectives to the field. Over time, as their influence grows, they will likely expand their collaboration networks and become more integral to interdisciplinary efforts.
Cluster 4: Large Collaborative Teams and Multi-Institutional Research
Key Authors: Lin, boqiang, Zhang, Hongwei
Cluster 4 is composed of large, collaborative research teams that tackle complex and broad challenges within sustainable finance. These authors typically work across multiple institutions and countries, as indicated by their high betweenness scores. They facilitate collaboration among various academic and research communities, integrating diverse expertise from different parts of the world. The authors in this cluster contribute to large-scale research projects addressing global challenges such as energy transition, financial risk due to climate change, and green technology development.
Cluster 5: Influential Authors with Broad Global Impact
Key Authors: Chen, Jinyu, Ding, Qian
Cluster 5 is home to the most influential authors in the field of sustainable finance. These authors are recognized for their global impact in both academic research and policy development. With high PageRank and betweenness scores, authors in this cluster are at the center of the research network, connecting different clusters and shaping the future of sustainable finance research. They often lead large-scale research efforts, influencing the development of sustainable financial models and regulatory frameworks.
Cluster 6: Regional Leaders in Sustainable Finance
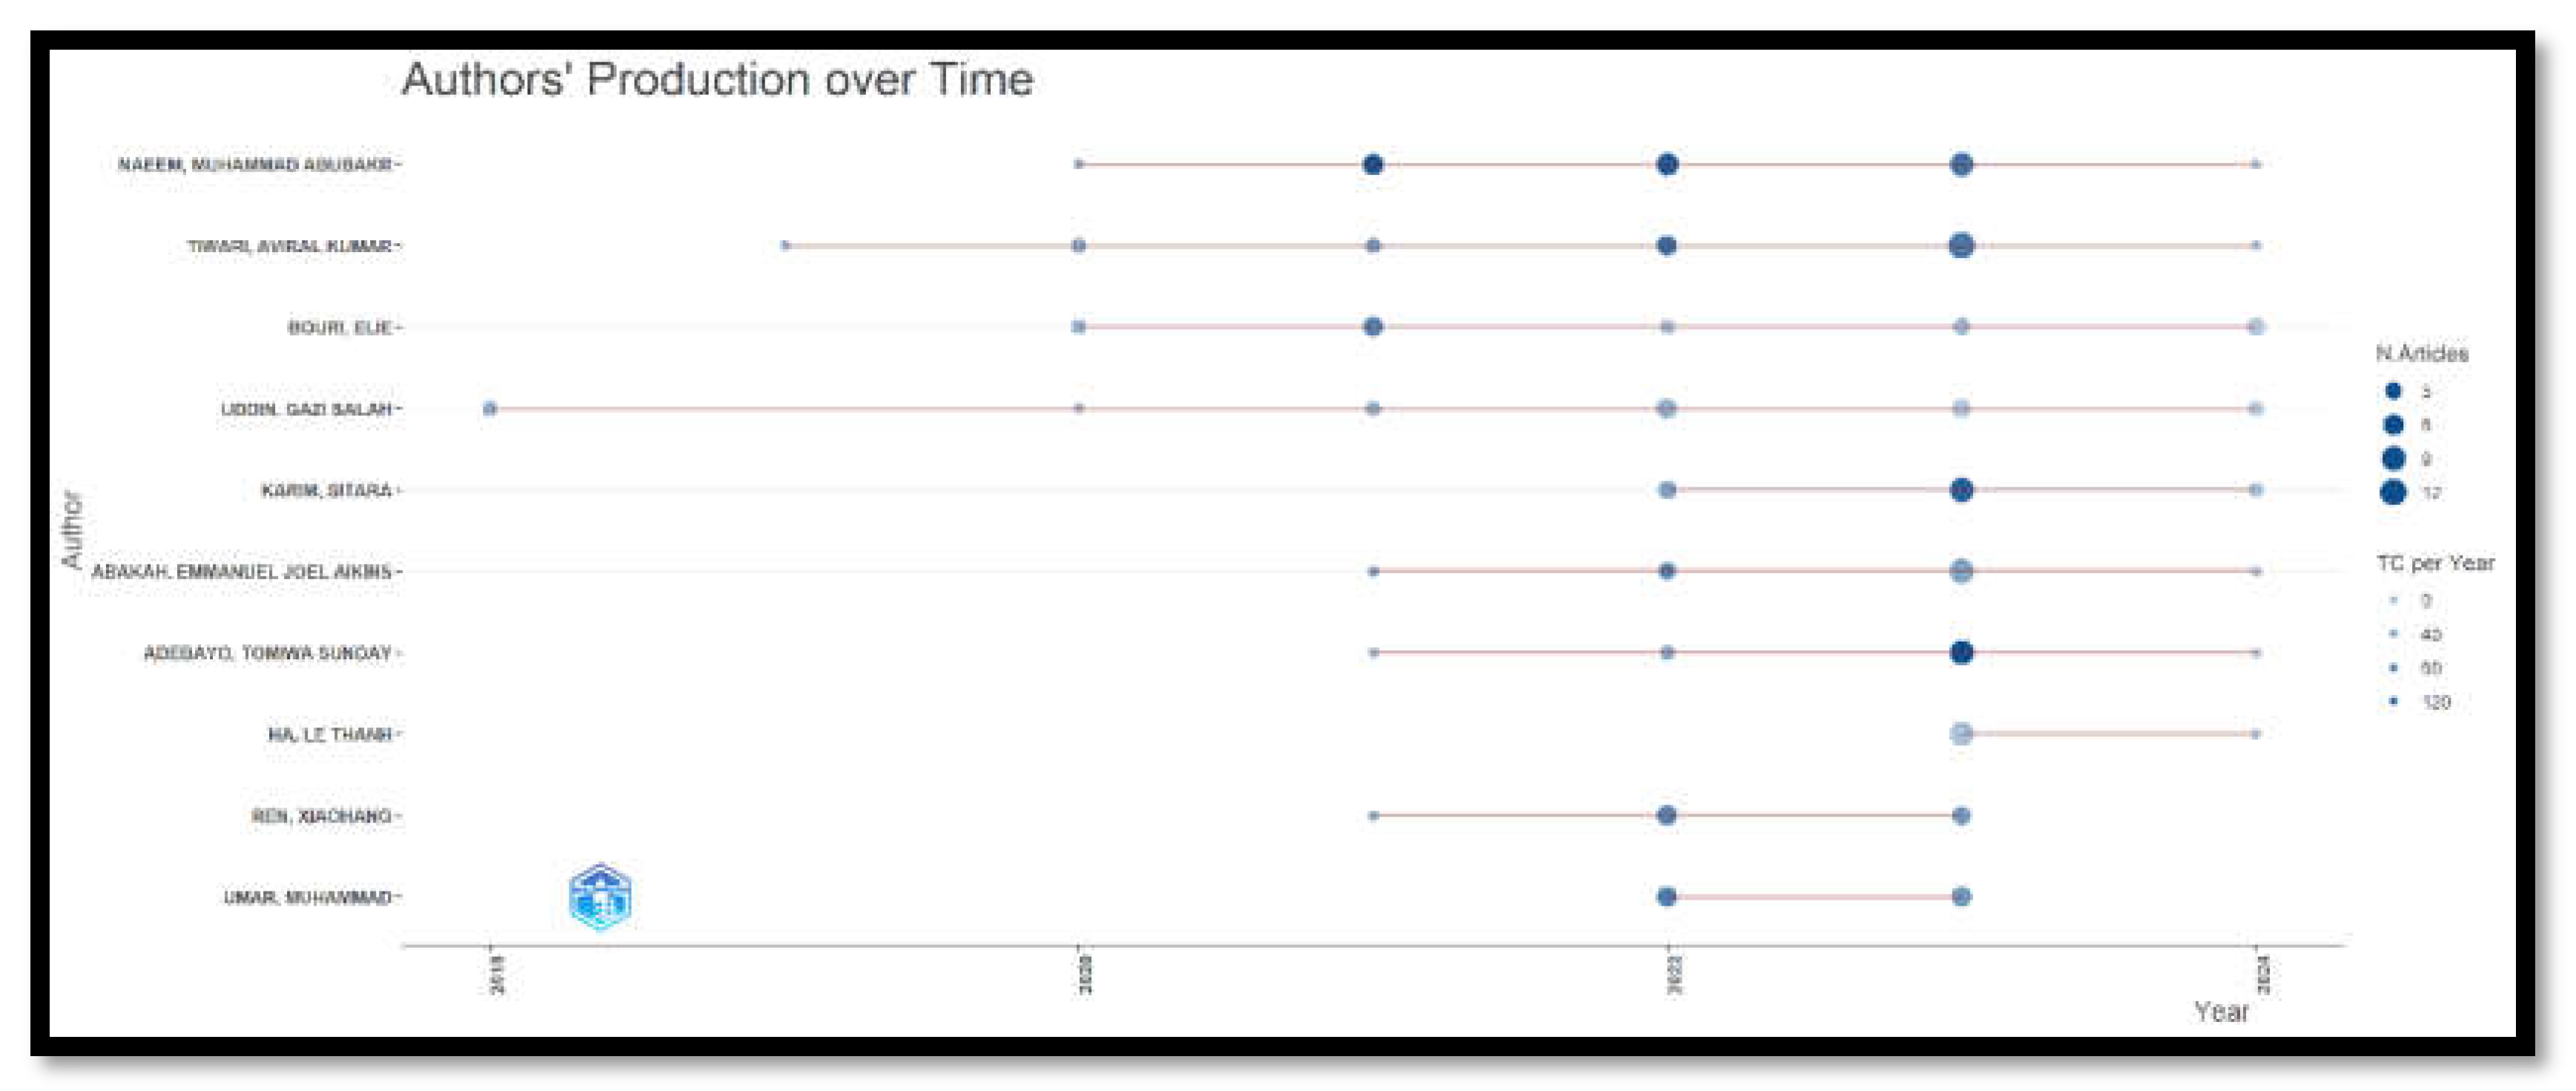
Key Authors: Tiwari, Aviral Kumar, Abakah Emmanuel Joel Aikins,
Lee, Chien-Chiang, Dogan Buhari, Khalfaoui Rabeh, Shahbaz Muhammad, Adekoya, Oluwasegun B., Nasreen Samia
Cluster 6 features regional leaders in sustainable finance, authors who contribute significantly to the field within specific geographic areas or economic contexts. These authors may focus on regional financial markets, economic policies, or climate finance challenges specific to certain countries or regions. Their research may be particularly relevant for policy makers and financial institutions operating in those regions. Though they may have lower betweenness than authors in other clusters, their contributions are essential for localized studies of sustainability.
Cluster 7: High-Impact Authors in Green and Social Finance
Key Authors: Umar, Zaghum, Pham, Linh, Teplova, Tamara
Authors in Cluster 7 focus on high-impact topics in green finance and socially responsible investing. These authors often work on studies that explore the intersections between finance and sustainability, especially in relation to corporate social responsibility (CSR), ESG investing, and social impact finance. Their collaboration networks are often cross-disciplinary, bringing together finance professionals, environmental scientists, and policy experts. With their high PageRank scores, these authors are often at the forefront of green bonds and climate-related financial innovations.
Cluster 8: Interdisciplinary Scholars with Diverse Contributions
Key Authors: Asl, Mahdi Ghaemi, Mohammed Kamel Si, Shahzad Umer
Cluster 8 includes interdisciplinary scholars whose work spans multiple domains, from finance and economics to environmental science and policy analysis. These authors contribute to bridging the gap between theoretical models in finance and practical applications in sustainability. Their betweenness scores suggest that they serve as intermediaries between different fields, allowing for a holistic approach to sustainable finance. Their work often integrates insights from socioeconomic factors, policy analysis, and market dynamics.
Cluster 9: Researchers in Policy and Regulatory Frameworks
Key Authors: Naeem, Muhammad Abubakr, Karim, Sitara, Umar Muhammad, Shahzad Syed Jawad Hussain, Farid Saqib, Lucey Brian M.
Cluster 9 is centered around authors who specialize in the policy and regulatory aspects of sustainable finance. These authors study the role of government regulations, financial policies, and international agreements in promoting sustainable finance. They work closely with governmental bodies, financial institutions, and NGOs to examine the effectiveness of regulations such as the Paris Agreement and climate risk disclosure frameworks. Their research directly impacts how sustainable finance can be integrated into national and international policy agendas.
Cluster 10: Innovative Researchers in Financial Technology and Sustainability
Key Authors: Mensi, Walid, Vo, Xuan Vinh, Kang, Sang Hoon, Rehman, Mobeen Ur
Cluster 10 focuses on the intersection of financial technology (fintech) and sustainability. Authors in this cluster are exploring how technology can be used to drive green finance innovations. This includes the development of blockchain for sustainable investment, AI-driven financial models, and digital platforms for sustainable finance. Their research is critical for pushing the boundaries of what is possible in sustainable finance through technological advancements. These authors are at the cutting edge of fintech solutions that facilitate green bonds, carbon trading, and sustainable management.
Figure 29. Collaboration Network-Authors-overtime.
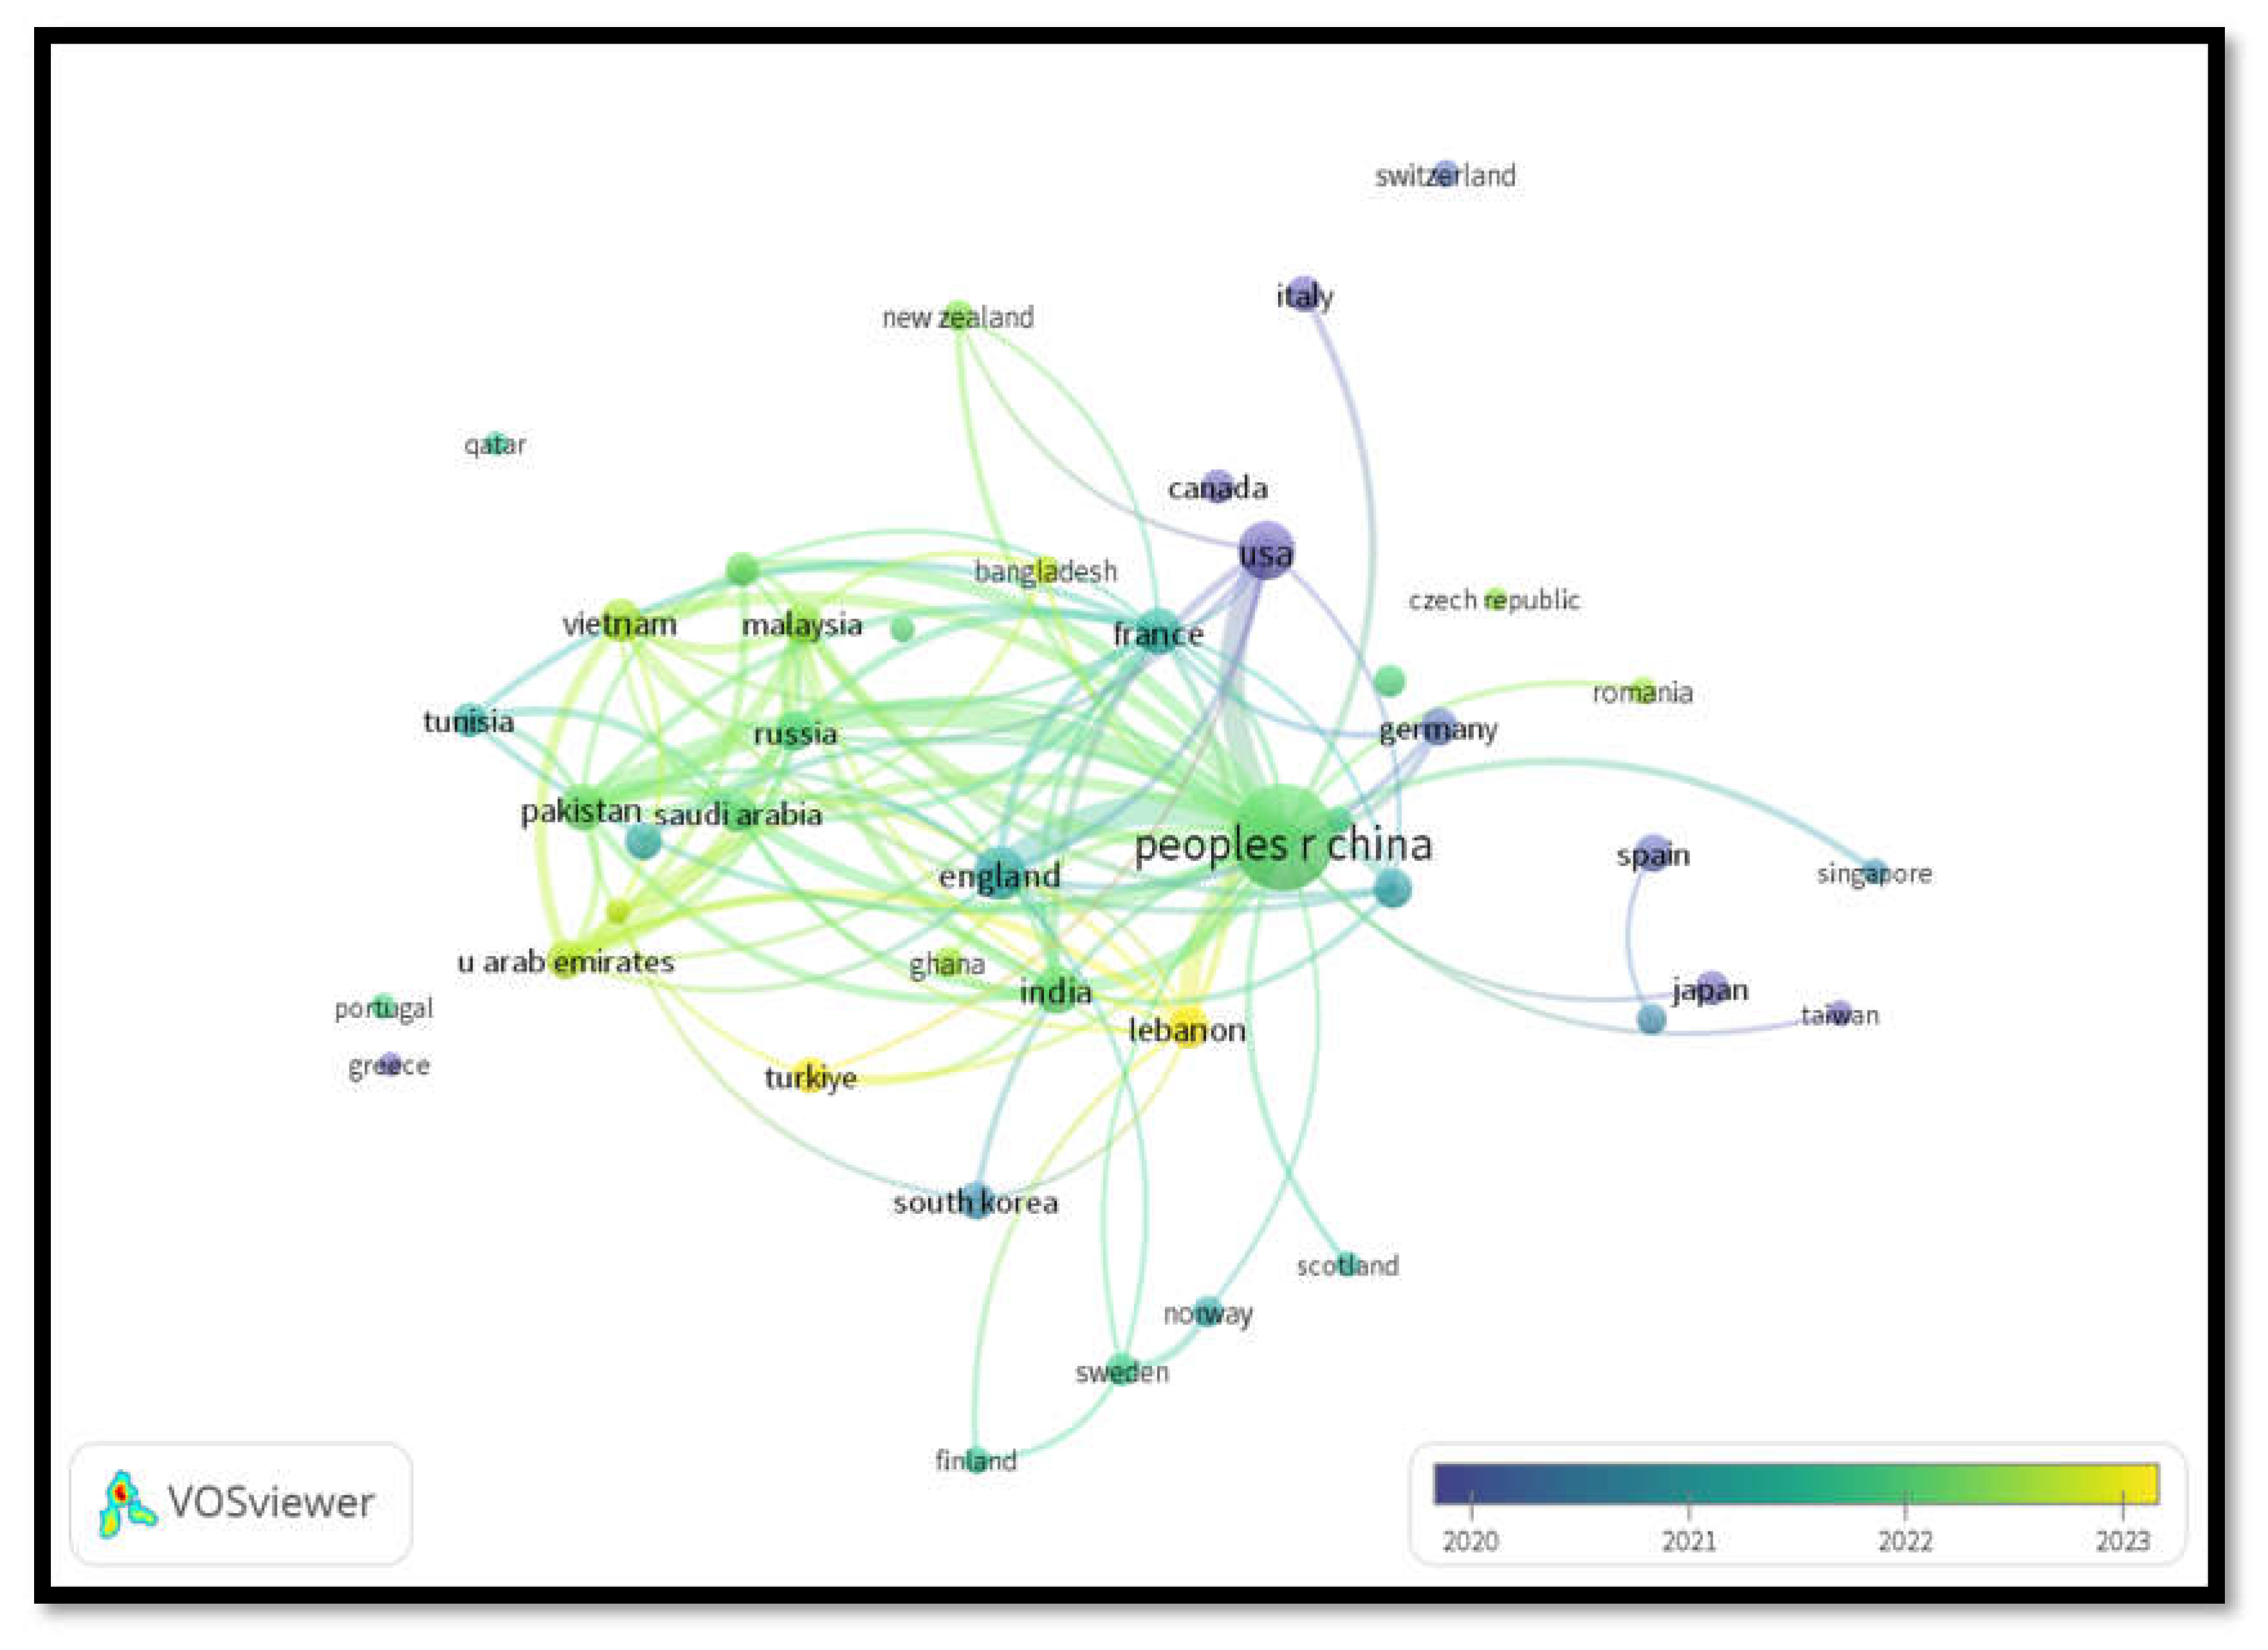
Preprints 150769 g029
Figure 30. Collaboration Network- Countries.
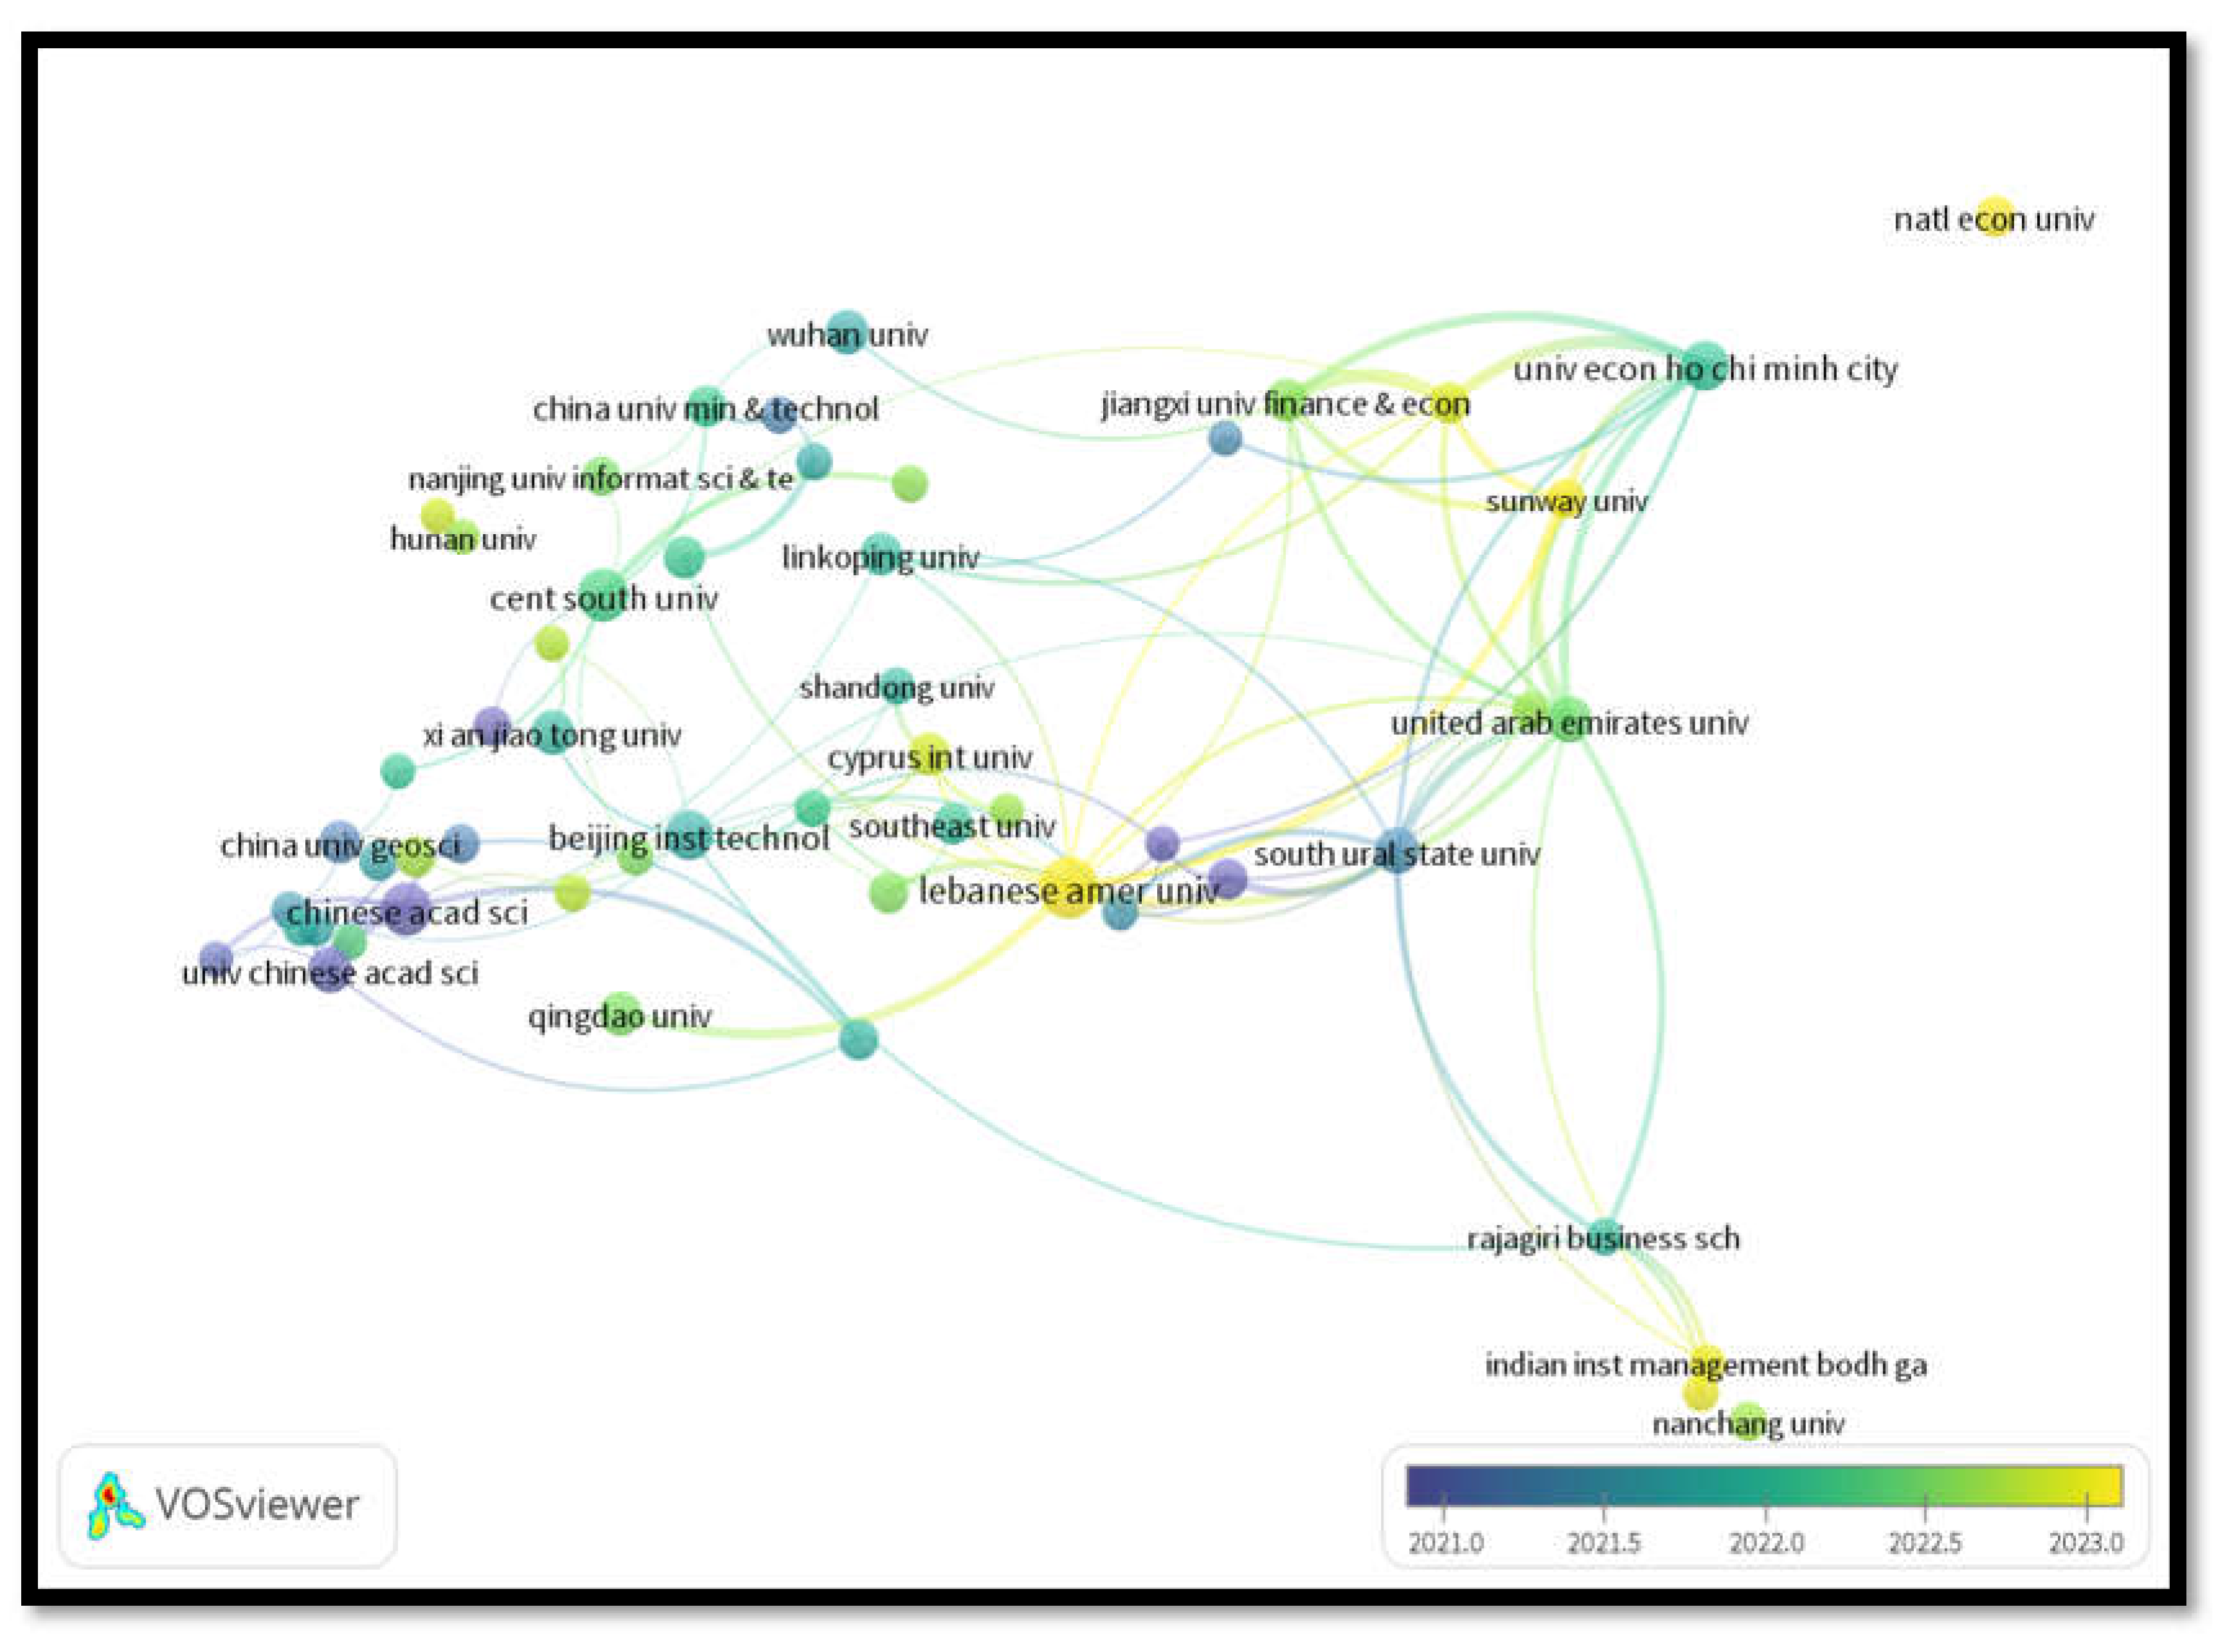
Preprints 150769 g030
Figure 31. Collaboration Network-Institutions.
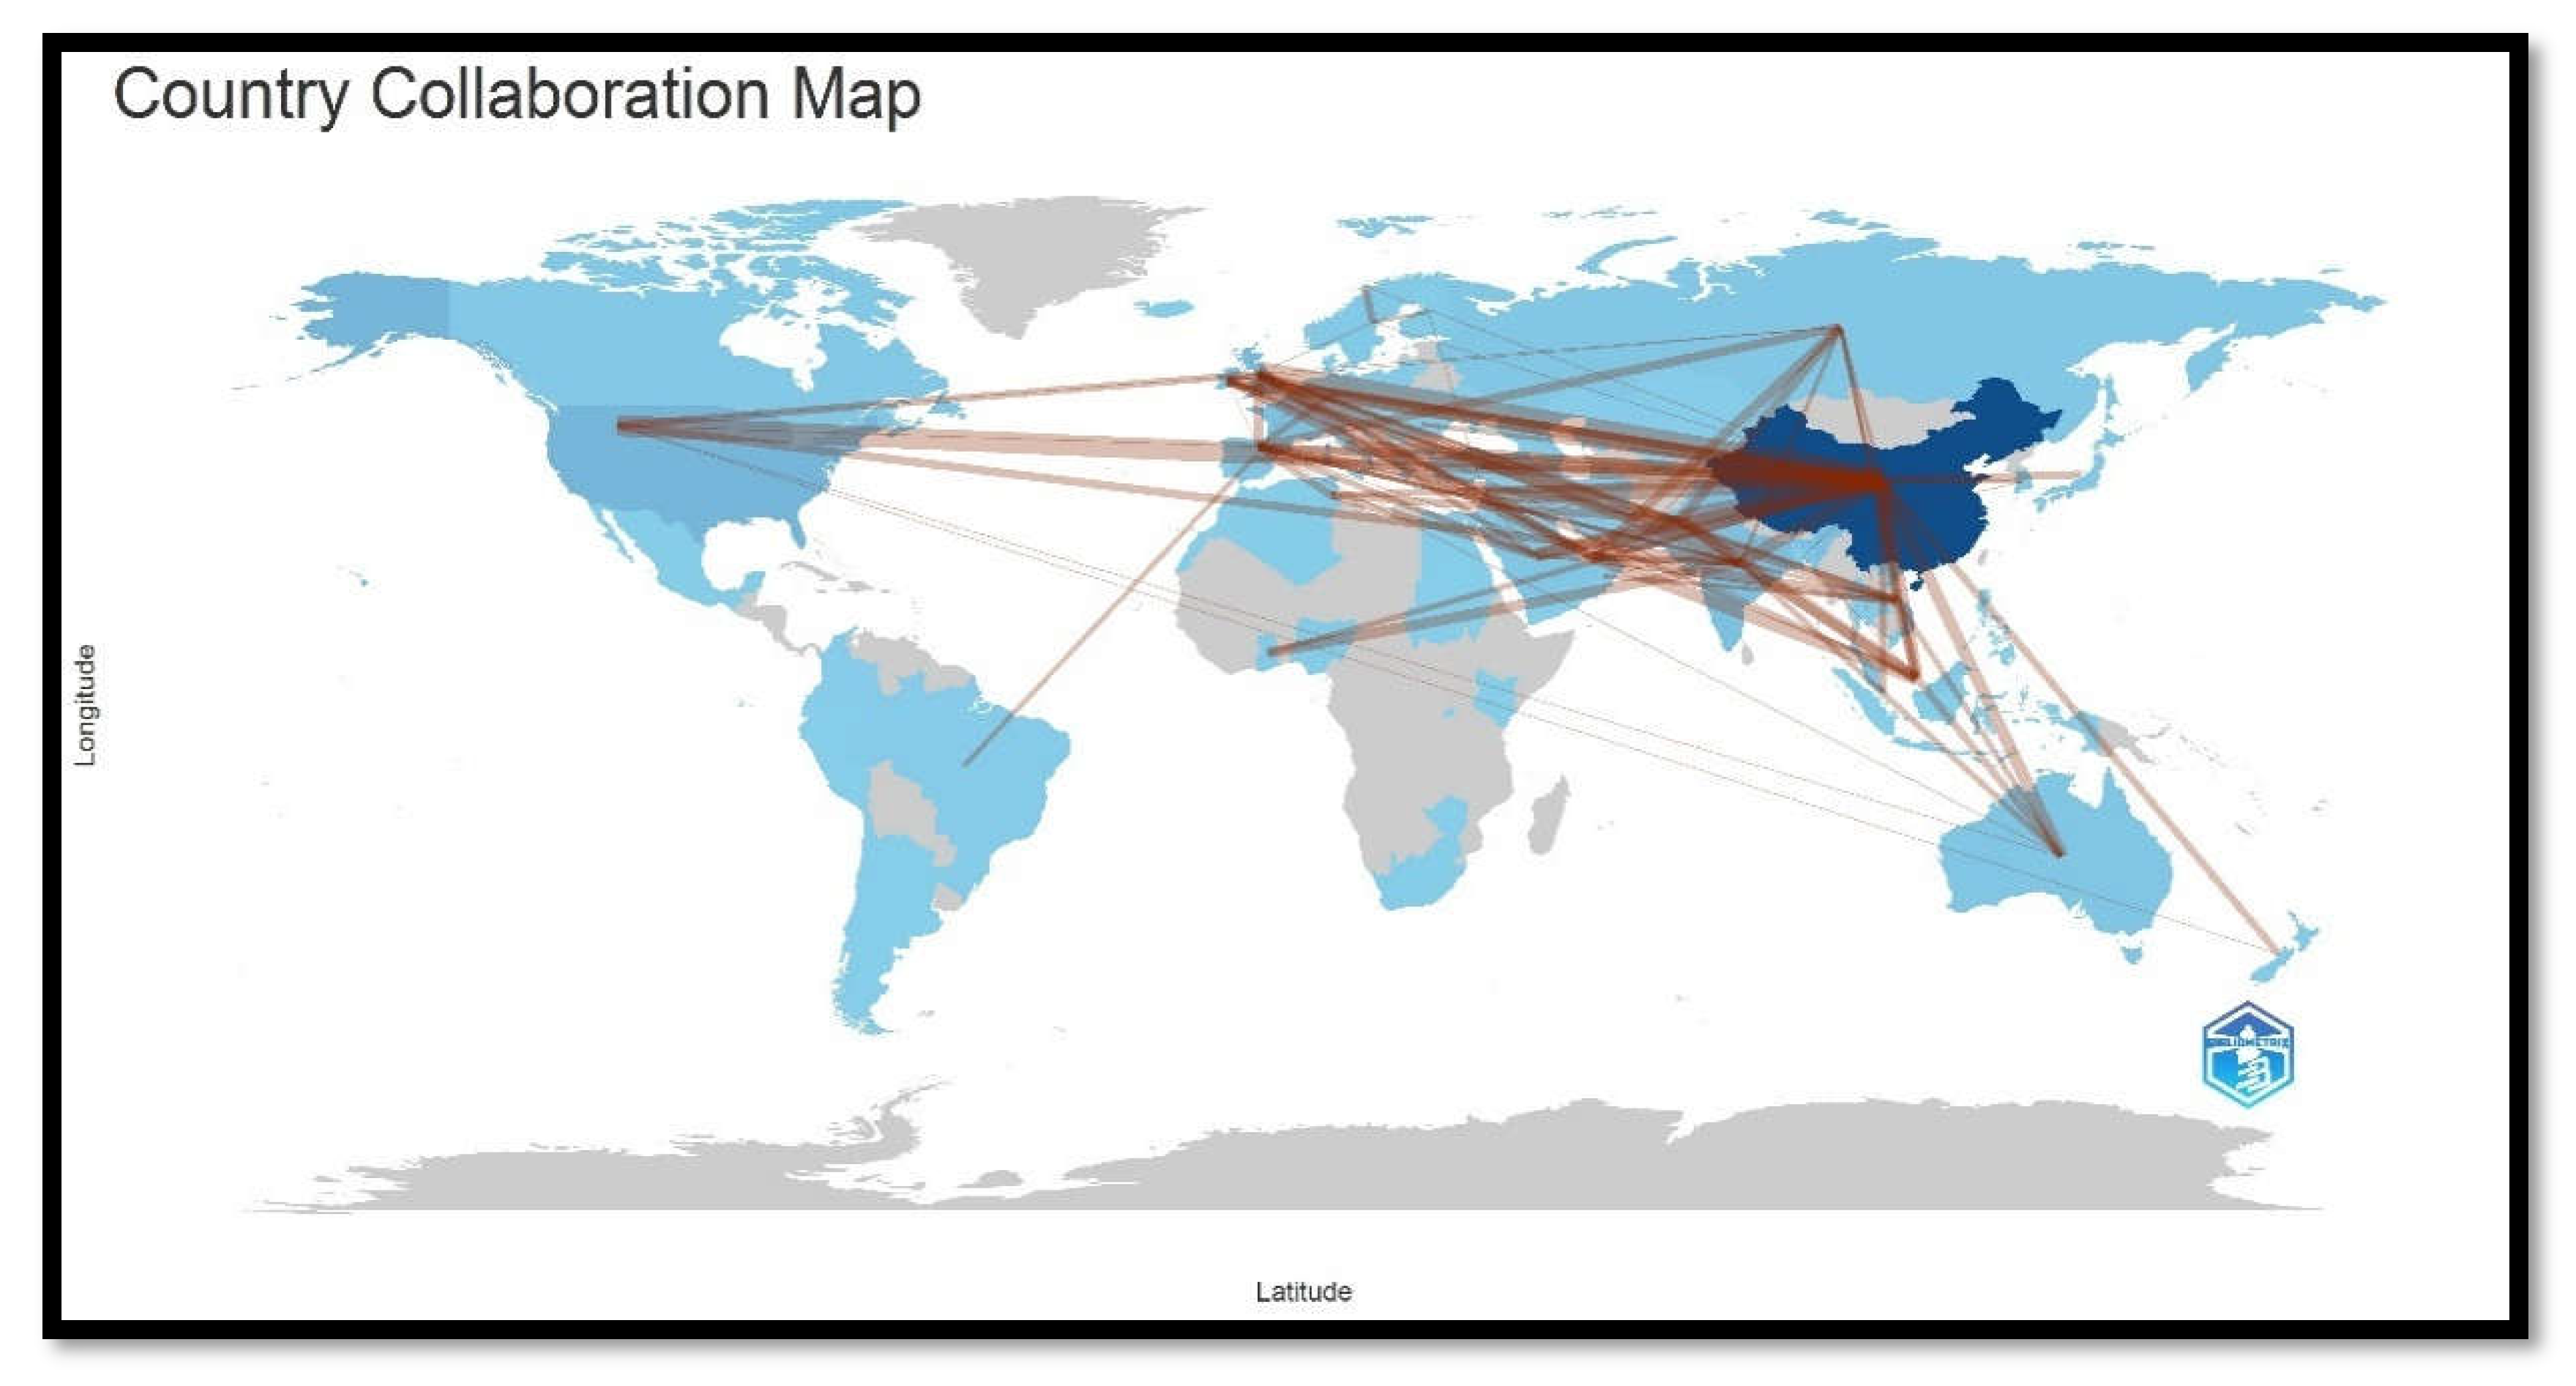
Preprints 150769 g031
Figure 32. Collaboration World Map.
Preprints 150769 g032

3.12. Three Field Plot (or Sankey Diagram) Associating Countries-Keywords-Sources

The Figure 33 displays three-field plot that visually maps the relationships between contributing countries (AU_CO), research themes or keywords (DE), and the prominent journals (SO) publishing research on sustainable finance and its connectedness. On the left, China is the most prolific contributor, dominating the global research output in this field, followed by other countries such as the USA, Turkey, Pakistan, and Korea. The middle column highlights the most frequently explored topics, including “renewable energy,” “green finance,” “spatial spillover effect,” “green technology innovation,” and “CO2 emissions,” showcasing the thematic focus of sustainable finance research. These themes align with pressing global challenges such as the energy transition, climate policy, and sustainability. The right column lists the most influential journals publishing in this domain. Journals such as Environmental Science and Pollution Research, Energy Economics, and Sustainability emerge as core contributors, reflecting Bradford’s Law of a concentration of research output in a few high-impact sources. The connections between countries, themes, and journals emphasize the collaborative and interdisciplinary nature of research in this field, with China playing a central role in addressing themes like renewable energy and green finance through high-impact journals. This visualization underscores the geographic and intellectual hubs of sustainable finance connectedness research, offering valuable insights for future studies and collaborations.

4. Conclusion

This study presents a comprehensive bibliometric analysis of the connectedness of sustainable finance, shedding light on the intellectual evolution of the field and identifying key themes, influential authors, and emerging trends. The findings reveal the exponential growth of sustainable finance research, particularly post-2015, driven by climate policy initiatives and the increasing integration of environmental, social, and governance (ESG) factors into financial decision-making. Through advanced bibliometric methods such as bibliographic coupling, co-citation analysis, and trend cartography, this paper maps the dynamic research landscape of connectedness in sustainable finance, identifying both well-established research clusters and underexplored areas that present opportunities for future inquiry.
The application of Bradford’s Law in this study highlights the concentration of research in a few core journals, such as Energy Economics, Environmental Science and Pollution Research, Sustainability, Journal of Cleaner Production, and Renewable Energy, which dominate the field’s scholarly output. According to Bradford’s principle, these journals represent the “core” of the sustainable finance literature, while the majority of publications are scattered across a larger number of less influential sources. This insight is crucial for researchers and policymakers, as it underscores the need to focus on these core journals for the most relevant and impactful studies while also acknowledging the importance of broader, interdisciplinary publications in advancing sustainable finance research.
Additionally, the application of Lotka’s Law reveals the uneven distribution of authorship within the field, with a small number of highly prolific authors contributing the majority of the publications. For example, Naeem Muhammad Abubakr and Tiwari Aviral Kumar, each with 23 publications, represent the “core” authors, while the majority of authors contribute only a few works. This pattern not only illustrates the concentration of academic influence but also emphasizes the potential for collaborative networks to further enrich the field. Recognizing the authors who have shaped the research agenda can help guide future research collaborations and identify opportunities for mentorship and academic exchange.
This paper’s bibliometric analysis has identified key research clusters and potential gaps, offering crucial insights for future inquiry. The findings suggest that there is ample opportunity for interdisciplinary research that bridges gaps between economics, finance, environmental science, and policy studies. From a practical perspective, these bibliometric insights offer several actionable implications for policymakers, investors, and academics. Policymakers’ understanding of the concentration of research in specific journals and topics can help them formulate strategies that promote deeper engagement with the most influential studies, ultimately facilitating more effective policy development in sustainable finance. For investors, the identification of key research clusters, such as those focusing on green bonds, renewable energy, and systemic risk, provides critical information for making informed investment decisions that align with sustainability goals. Lastly, for academics, the application of Bradford’s and Lotka’s Laws encourages a targeted approach to literature review and future research planning, emphasizing the importance of both high-impact journals and prolific authors in shaping the direction of the field.
In conclusion, this study not only provides a roadmap for future research in the connectedness of sustainable finance but also offers practical insights that can help stakeholders navigate the evolving landscape of sustainable finance research, policy, and practice. The application of Bradford’s and Lotka’s Laws highlights the need for a strategic focus on core journals and prolific authors, fostering a more efficient and impactful approach to advancing knowledge in this critical field. Furthermore, the growing prominence of sustainable finance presents opportunities for policymakers, financial institutions, and researchers to collaborate in developing frameworks that can guide the transition to a more sustainable and resilient global financial system.
In practical terms, our analysis emphasizes the importance of aligning financial practices with sustainability goals to ensure that investments contribute to positive environmental and social outcomes. Moving forward, we recommend that future research focus on understanding the spillover effects of sustainable finance, particularly in emerging markets, and examine the role of technological innovations, such as green fintech, in advancing sustainability in the financial sector. By addressing these gaps, sustainable finance can play a pivotal role in mitigating climate risks, enhancing financial stability, and achieving the broader objectives of sustainable development.

References

  1. Aria, M., & Cuccurullo, C. (2017, Nov). : An R-tool for comprehensive science mapping analysis. Journal of Informetrics, 11(4), 959-975. [CrossRef]
  2. Ayaz, G., & Zahid, M. (2024, Oct 30). Trends, shifts and future prospects of sustainable finance research: a bibliometric analysis. Sustainability Accounting Management and Policy Journal, 15(5), 1094-1117. [CrossRef]
  3. Bahoo, S., Alon, I., & Paltrinieri, A. (2020, Jan). Sovereign wealth funds: Past, present and future. International Review of Financial Analysis, 67, 101418. [CrossRef]
  4. Bar-Ilan, J. (2008, Jun). The-index of index and of other informetric topics. Scientometrics, 75(3), 591-605. [CrossRef]
  5. Barua, S., & Chiesa, M. (2019). Sustainable financing practices through green bonds: What affects the funding size? Business Strategy and the Environment, 28(6), 1131-1147. [CrossRef]
  6. Bhatnagar, S., & Sharma, D. (2022, Jul). Evolution of green finance and its enablers: A bibliometric analysis [Article]. Renewable & Sustainable Energy Reviews, 162, Article 112405. [CrossRef]
  7. Bhutta, U. S., Tariq, A., Farrukh, M., Raza, A., & Iqbal, M. K. (2022a). Green bonds for sustainable development: Review of literature on development and impact of green bonds. Technological Forecasting and Social Change, 175, 121378. [CrossRef]
  8. Bhutta, U. S., Tariq, A., Farrukh, M., Raza, A., & Iqbal, M. K. (2022b, Feb). Green bonds for sustainable development: Review of literature on development and impact of green bonds [Review]. Technological Forecasting and Social Change, 175, Article 121378. [CrossRef]
  9. Borgohain, D. J., Lund, B., & Verma, M. K. (2023, Jul 3). A mathematical analysis of the h-index and study of its correlation with some improved metrics: A conceptual approach. Journal of Information Science, 01655515231184832. [CrossRef]
  10. Bourcet, C. (2020, Jan). Empirical determinants of renewable energy deployment: A systematic literature review [Review]. Energy Economics, 85, Article 104563. [CrossRef]
  11. Boyack, K. W., & Klavans, R. (2010). Co-citation analysis, bibliographic coupling, and direct citation: Which citation approach represents the research front most accurately? Journal of the American Society for Information Science and Technology, 61(12), 2389-2404. [CrossRef]
  12. Boyack, K. W., & Klavans, R. (2010). Co-citation analysis, bibliographic coupling, and direct citation: Which citation approach represents the research front most accurately? Journal of the American Society for Information Science and Technology, 61(12), 2389-2404. [CrossRef]
  13. Chiaramonte, L., Dreassi, A., Piserà, S., & Khan, A. (2023, Jan). Mergers and acquisitions in the financial industry: A bibliometric review and future research directions [Review]. Research in International Business and Finance, 64, Article 101837. [CrossRef]
  14. Cunha, F. A. F. D., Meira, E., & Orsato, R. J. (2021, Dec). Sustainable finance and investment: Review and research agenda. Business Strategy and the Environment, 30(8), 3821-3838. [CrossRef]
  15. Deng, J., Guan, S. Y., Zheng, H. K., Xing, X. Y., & Liu, C. (2022, Nov 10). Dynamic spillovers and asymmetric connectedness between fossil energy and green financial markets: Evidence from China. Frontiers in Energy Research, 10, Article 986341. [CrossRef]
  16. Ding, Z. H., Wu, J. S., Shi, X. P., & Wang, Q. W. (2019, Jan). Energy economy system and risk management: a contribution toward China meeting its goals for the Paris climate accord. Natural Hazards, 95(1-2), 1-5. [CrossRef]
  17. Egghe, L. (2008, Aug). Mathematical theory of the h- and g-index in case of fractional counting of authorship. Journal of the American Society for Information Science and Technology, 59(10), 1608-1616. [CrossRef]
  18. Elie, L., Granier, C., & Rigot, S. (2021, Jan). The different types of renewable energy finance: A Bibliometric analysis [Article]. Energy Economics, 93, Article 104997. [CrossRef]
  19. Huang, L. (2024, Apr). Green bonds and ESG investments: Catalysts for sustainable finance and green economic growth in resource-abundant economies. Resources Policy, 91, 104806. [CrossRef]
  20. Ikevuje, A., Anaba, D., & Iheanyichukwu, U. (2024). Exploring sustainable finance mechanisms for green energy transition: A comprehensive review and analysis. Finance & Accounting Research Journal, 6(7), 1224-1247.
  21. Khan, A., Goodell, J. W., Hassan, M. K., & Paltrinieri, A. (2022, Jun). A bibliometric review of finance bibliometric papers [Review]. Finance Research Letters, 47, Article 102520. [CrossRef]
  22. Kumar, S., Sharma, D., Rao, S., Lim, W. M., & Mangla, S. K. (2022a). Past, present, and future of sustainable finance: insights from big data analytics through machine learning of scholarly research [Article; Early Access]. Annals of Operations Research. [CrossRef]
  23. Kumar, S., Sharma, D., Rao, S., Lim, W. M., & Mangla, S. K. (2022b). Past, present, and future of sustainable finance: insights from big data analytics through machine learning of scholarly research. Annals of Operations Research, 1-44. [CrossRef]
  24. Losse, M., & Geissdoerfer, M. (2021, May 10). Mapping socially responsible investing: A bibliometric and citation network analysis [Review]. Journal of Cleaner Production, 296, Article 126376. [CrossRef]
  25. Luo, W. B., Tian, Z. Y., Zhong, S. H., Lyu, Q. K., & Deng, M. J. (2022, Aug). Global Evolution of Research on Sustainable Finance from 2000 to 2021: A Bibliometric Analysis on WoS Database. Sustainability, 14(15), 9435. [CrossRef]
  26. Mbarki, I., Khan, M. A., Karim, S., Paltrinieri, A., & Lucey, B. M. (2023, Jun). Unveiling commodities-financial markets intersections from a bibliometric perspective [Article]. Resources Policy, 83, Article 103635. [CrossRef]
  27. Meng, J., Jiang, Y. H., Zhao, H. W., & Tanliang, A. (2024, Jul). Asymmetric Effects of Renewable Energy Markets on China’s Green Financial Markets: A Perspective of Time and Frequency Dynamic Connectedness [Article]. Mathematics, 12(13), Article 2038. [CrossRef]
  28. Mi’raj, D. A., & Ulev, S. (2024, Nov 18). A bibliometric review of Islamic economics and finance bibliometric papers: an overview of the future of Islamic economics and finance [Article]. Qualitative Research in Financial Markets, 16(5), 993-1035. [CrossRef]
  29. Naeem, M. A., Karim, S., Rabbani, M. R., Bashar, A., & Kumar, S. (2022). Current state and future directions of green and sustainable finance: a bibliometric analysis. Qualitative Research in Financial Markets, 15(4), 608-629. [CrossRef]
  30. Rabbani, M. R., Hassan, M. K., Dejan, A., Bashar, A., & Hasan, M. B. (2024, Jul). A bibliometric analysis of the review papers in finance: Evidence from the last two decades [Article]. Review of Financial Economics, 42(3), 241-257. [CrossRef]
  31. Sachs, J. D., Woo, W. T., Yoshino, N., & Taghizadeh-Hesary, F. (2019). Importance of green finance for achieving sustainable development goals and energy security. Handbook of green finance, 3, 1-10.
  32. Sachs, J. D., Woo, W. T., Yoshino, N., & Taghizadeh-Hesary, F. (2020). Importance of Green Finance for Achieving Sustainable Development Goals and Energy Security. In J. Sachs, W. T. Woo, N. Yoshino, & F. Taghizadeh-Hesary (Eds.), Handbook of Green Finance: Energy Security and Sustainable Development (pp. 1-10). Springer Singapore. [CrossRef]
  33. Stern, N. (2013, Sep). The Structure of Economic Modeling of the Potential Impacts of Climate Change: Grafting Gross Underestimation of Risk onto Already Narrow Science Models. Journal of Economic Literature, 51(3), 838-859. [CrossRef]
  34. Trotta, A., Rania, F., & Strano, E. (2024, Apr). Exploring the linkages between FinTech and ESG: A bibliometric perspective [Article]. Research in International Business and Finance, 69, Article 102200. [CrossRef]
  35. Van Eck, N., & Waltman, L. (2010). Software survey: VOSviewer, a computer program for bibliometric mapping. Scientometrics, 84(2), 523-538.
  36. van Eck, N. J., & Waltman, L. (2010, Aug). Software survey: VOSviewer, a computer program for bibliometric mapping [Article]. Scientometrics, 84(2), 523-538. [CrossRef]
  37. Woon, K. S., Phuang, Z. X., Taler, J., Varbanov, P. S., Chong, C. T., Klemes, J. J., & Lee, C. T. (2023, Mar 15). Recent advances in urban green energy development towards carbon emissions neutrality [Article]. Energy, 267, Article 126502. [CrossRef]
Figure 1. Annual Scientific Production.
Preprints 150769 g001
Figure 3. Sources Production Overtime.
Preprints 150769 g003
Figure 4. Core Sources by Bradford’s Law.
Preprints 150769 g004
Figure 9. Author Productivity through Lotka’s Law.
Preprints 150769 g009
Figure 10. Most Global Cited Documents.
Preprints 150769 g010
Figure 12. Most Relevant Affiliations.
Preprints 150769 g012
Figure 14. Most Relevant Words- Author Keywords.
Preprints 150769 g014
Figure 15. Co-Occurrence Network-Min-5-178 Keywords.
Preprints 150769 g015
Figure 25. Co-Citation Map-Min-50 Citations-137 Authors.
Preprints 150769 g025
Figure 26. Bibliographic coupling Map.
Preprints 150769 g026
Figure 27. Bibliographic coupling Map over Time.
Preprints 150769 g027
Figure 28. Collaboration Network-Authors.
Preprints 150769 g028
Figure 33. Three Field Plot (or Sankey diagram) associating Countries-Keywords-Sources.
Preprints 150769 g033
Table 1. Data Cleaning Process.
Description of Query
Class Description of Filter No. of documents after filters Documents eliminated
Enquiry results before search refine 1891
Document type Restricting the documents to articles, early access publications, and review articles. 1833 (58)
Research areas Limit the search to the following research areas: business economics, environmental science ecology, public environmental occupational health, energy fuels, engineering, public administration, operations research management science, social sciences other topics, government law, transportation, and sociology 1597 (236)
Web of Science Index Limit the search to SSCI and SCI-Expanded 1489 (108)
Language We eliminated all languages except English. 1488 (1)
Sustainable Development Goals We select only documents addressing the Sustainable development goals 1261 (227)
Time From 1994 to May01,2024 1261 (0)
Table 2. Sample Characteristics.
Description Results
MAIN INFORMATION ABOUT DATA
Timespan 1994:2024
Sources (Journals, Books, etc.) 228
Documents 1261
Annual Growth Rate % 16.14
Document Average Age 2.71
Average citations per doc 28.02
References 48471
DOCUMENT CONTENTS
Keywords Plus (ID) 2009
Author’s Keywords (DE) 3469
AUTHORS
Authors 3540
Authors of single-authored docs 67
AUTHORS COLLABORATION
Single-authored docs 75
Co-Authors per Doc 3.59
International co-authorships % 37.99
DOCUMENT TYPES
article 1154
article; early access 71
article; proceedings paper 10
article; retracted publication 1
review 25
Table 3. Most Influential sources.
Sr.No. Journal name Articles % Of Total sample h_index g_index m_index TC IF PY_start WOS Research Categories (JCR Quartile) Publisher
1 ENVIRONMENTAL SCIENCE AND POLLUTION RESEARCH 130 10.31 26 38 4.333 1849 5.8 2019 ENVIRONMENTAL SCIENCES-Q1 SPRINGER HEIDELBERG
2 ENERGY ECONOMICS 111 8.80 37 68 1.947 4886 12.8 2006 ECONOMICS - SSCI-Q1 ELSEVIER
3 SUSTAINABILITY 70 5.55 17 26 1.889 821 3.9 2016 ENVIRONMENTAL STUDIES - SSCI-Q2 GREEN & SUSTAINABLE SCIENCE & TECHNOLOGY - SSCI-Q2 MDPI
4 JOURNAL OF CLEANER PRODUCTION 56 4.44 27 48 2.25 2357 11.1 2013 GREEN & SUSTAINABLE SCIENCE & TECHNOLOGY - SCIE-Q1ENGINEERING, ENVIRONMENTAL - SCIE-Q1ENVIRONMENTAL SCIENCES - SCIE-Q1 ELSEVIER SCI LTD
5 RENEWABLE ENERGY 53 4.20 22 39 1.692 1637 8.7 2012 GREEN & SUSTAINABLE SCIENCE & TECHNOLOGY - SCIE-Q2 ENERGY & FUELS - SCIE-Q1 ELSEVIER SCI LTD
6 RESOURCES POLICY 47 3.73 19 31 2.375 1028 10.2 2017 ENVIRONMENTAL STUDIES - SSCI-Q1 ELSEVIER SCI LTD
7 ENERGY 42 3.33 19 36 1.267 1322 8.9 2010 ENERGY & FUELS - SCIE-Q1THERMODYNAMICS - SCIE-Q1 ELSEVIER SCI LTD
8 ENERGIES 33 2.62 12 23 1.5 565 3.2 2017 ENERGY & FUELS - SCIE-Q3 MDPI
9 ENERGY POLICY 30 2.38 18 30 0.72 1287 9 2000 ENVIRONMENTAL STUDIES - SSCI-Q1-ECONOMICS - SSCI-Q1 ELSEVIER SCI LTD
10 FRONTIERS IN ENVIRONMENTAL SCIENCE 28 2.22 10 17 2.5 318 4.6 2021 ENVIRONMENTAL SCIENCES - SCIE-Q2 FRONTIERS MEDIA SA
11 JOURNAL OF ENVIRONMENTAL MANAGEMENT 28 2.22 16 28 4 999 8.7 2021 ENVIRONMENTAL SCIENCES - SCIE-Q1 ACADEMIC PRESS LTD- ELSEVIER SCIENCE LTD
12 INTERNATIONAL JOURNAL OF ENVIRONMENTAL RESEARCH AND PUBLIC HEALTH 28 2.22 15 24 1.875 596 4.61 2017 PUBLIC, ENVIRONMENTAL & OCCUPATIONAL HEALTH - SSCI-Q2 MDPI
Table 4. Most Influential Authors.
Rank Element h_index g_index m_index TC NP PY_start
1 Naeem Muhammad Abubakr 19 23 3.8 1399 23 2020
2 Tiwari Aviral Kumar 15 23 2.5 1080 23 2019
3 Adebayo Tomiwa Sunday 10 13 2.5 502 13 2021
4 Bouri Elie 10 16 2 532 16 2020
5 Karim Sitara 10 15 3.333 419 15 2022
6 Abakah Emmanuel Joel Aikins 9 14 2.25 556 14 2021
7 Umar Muhammad 9 10 3 414 10 2022
8 Mensi Walid 8 9 0.667 567 9 2013
9 Ren Xiaohang 8 10 2 502 10 2021
10 Uddin Gazi Salah 8 16 1.143 491 16 2018
Table 5. Lotka’s Law.
Manuscripts written No. of Authors Proportion of Authors
1 3033 0.857
2 315 0.089
3 104 0.029
4 34 0.01
5 20 0.006
6 9 0.003
7 8 0.002
8 4 0.001
9 3 0.001
10 3 0.001
13 1 0
14 1 0
15 1 0
16 2 0.001
23 2 0.001
Table 7. Most Influential Countries.
Country Articles Share in total Articles (%) SCP MCP Freq MCP_Ratio
CHINA 673 53.37 499 174 0.534 0.259
USA 75 5.95 47 28 0.059 0.373
UNITED KINGDOM 40 3.17 15 25 0.032 0.625
INDIA 31 2.46 11 20 0.025 0.645
FRANCE 28 2.22 7 21 0.022 0.75
KOREA 27 2.14 18 9 0.021 0.333
VIETNAM 21 1.67 14 7 0.017 0.333
IRAN 20 1.59 11 9 0.016 0.45
ITALY 18 1.43 10 8 0.014 0.444
JAPAN 17 1.35 14 3 0.013 0.176
Table 8. Collaboration Network.
Node (Author Name) Cluster Betweenness Closeness PageRank
Reboredo, Juan C. 1 0 1 0.026
Ugolini, Andrea 1 0 1 0.026
Ren, Xiaohang 2 129.125 0.008 0.018
Taghizadeh-Hesary, Farhad 2 93.242 0.01 0.011
Lucey, Brian 2 56.883 0.009 0.013
Bouri, Elie 3 27.783 0.01 0.035
Uddin, Gazi Salah 3 132.776 0.012 0.048
Yahya, Muhammad 3 7.338 0.009 0.029
Dutta, Anupam 3 6.12 0.009 0.032
Ji, Qiang 3 0 0.008 0.006
Saeed, Tareq 3 0 0.008 0.019
Lin, Boqiang 4 0 0.004 0.011
Zhang, Hongwei 4 35 0.005 0.025
Chen, Jinyu 5 99 0.007 0.027
Ding, Qian 5 68 0.006 0.035
Tiwari, Aviral Kumar 6 229.336 0.012 0.076
Abakah, Emmanuel Joel Aikins 6 6.196 0.009 0.045
Lee, Chien-Chiang 6 0 0.008 0.01
Dogan, Buhari 6 39.165 0.009 0.031
Khalfaoui, Rabeh 6 18.681 0.009 0.024
Shahbaz, Muhammad 6 0 0.008 0.012
Adekoya, Oluwasegun B. 6 0.69 0.01 0.011
Nasreen, Samia 6 0 0.008 0.016
Umar, Zaghum 7 0 0.006 0.015
Pham, Linh 7 0 0.006 0.015
Teplova, Tamara 7 68 0.008 0.026
Asl, Mahdi Ghaemi 8 11.48 0.008 0.013
Mohammed, Kamel Si 8 0.45 0.007 0.012
Shahzad, Umer 8 1.4 0.007 0.017
Naeem, Muhammad Abubakr 9 210.049 0.013 0.069
Karim, Sitara 9 163.377 0.012 0.055
Umar, Muhammad 9 0 0.009 0.007
Shahzad, Syed Jawad Hussain 9 0.651 0.009 0.016
Farid, Saqib 9 8.388 0.011 0.03
Lucey, Brian M. 9 19.508 0.01 0.022
Mensi, Walid 10 101.031 0.011 0.034
Vo, Xuan Vinh 10 24.921 0.011 0.037
Kang, Sang Hoon 10 0.939 0.01 0.026
Rehman, Mobeen Ur 10 0.471 0.01 0.019
Disclaimer/Publisher’s Note: The statements, opinions and data contained in all publications are solely those of the individual author(s) and contributor(s) and not of MDPI and/or the editor(s). MDPI and/or the editor(s) disclaim responsibility for any injury to people or property resulting from any ideas, methods, instructions or products referred to in the content.
Copyright: This open access article is published under a Creative Commons CC BY 4.0 license, which permit the free download, distribution, and reuse, provided that the author and preprint are cited in any reuse.
Prerpints.org logo

Preprints.org is a free preprint server supported by MDPI in Basel, Switzerland.

Subscribe

Disclaimer

Terms of Use

Privacy Policy

Privacy Settings

© 2025 MDPI (Basel, Switzerland) unless otherwise stated